the effect of charter schools on school
TRANSCRIPT

The Effect of Charter Schools on School Segregation
We conduct a comprehensive examination of the causal effect of charter schools on school segregation, using a triple differences design that utilizes between-grade differences in charter expansion within school systems, and an instrumental variable approach that leverages charter school opening event variation. Charter schools increase school segregation for Black, Hispanic, White, and Asian students. The effect is of modest magnitude; segregation would fall 6 percent were charter schools eliminated from the average district. Analysis across varied geographies reveals countervailing forces. In metropolitan areas, charters improve integration between districts, especially in areas with intense school district fragmentation.
Suggested citation: Monarrez, Tomas, Brian Kisida, and Matthew M. Chingos. (2020). The Effect of Charter Schools on School Segregation. (EdWorkingPaper: 20-308). Retrieved from Annenberg Institute at Brown University: https://doi.org/10.26300/1z61-br35
VERSION: October 2020
EdWorkingPaper No. 20-308
Tomas MonarrezUrban Institute
Brian KisidaUniversity of Missouri
Matthew ChingosUrban Institute

The Effect of Charter Schools on School Segregation
Tomas Monarrez, Brian Kisida, and Matthew Chingos∗
October, 2020
Abstract
We conduct a comprehensive examination of the causal effect of charter schools on schoolsegregation, using a triple differences design that utilizes between-grade differences in char-ter expansion within school systems, and an instrumental variable approach that leveragescharter school opening event variation. Charter schools increase school segregation forBlack, Hispanic, White, and Asian students. The effect is of modest magnitude; segrega-tion would fall 6 percent were charter schools eliminated from the average district. Analy-sis across varied geographies reveals countervailing forces. In metropolitan areas, chartersimprove integration between districts, especially in areas with intense school district frag-mentation.
∗Tomas Monarrez, Urban Institute, Washington DC, [email protected]. Brian Kisida, The University of MissouriHarry S Truman School of Public Affairs, Columbia, MO, [email protected]. Matthew Chingos, Urban Institute,Washington DC, [email protected]. We are grateful to Martin West, David Card, Jesse Rothstein, Stephanie Cellini,and seminar and conference participants at the George Washington University Washington Area Labor Economics Sym-posium, the annual conference of the Association of Public Policy and Management, and the Urban Institute Brown Bagseries for helpful discussions and comments. We thank the Walton Family Foundation for financial support.
1
1 Introduction
The expansion of school choice programs in US public education has been constant over thelast two decades. Proponents of the charter model argue that school choice generates edu-cation improvements via competitive pressure that rewards school effectiveness and improvedmatches between students and schools (Friedman 1962, Coons and Sugarman 1977, Chubband Moe 1990, Hoxby 2003, Betts 2005). Indeed, multiple studies show that charter schools areeffective at improving student test scores in many settings (Dobbie and Fryer 2011, Angrist, Dy-narski, Kane, Pathak and Walters 2012, Angrist, Cohodes, Dynarski, Pathak and Walters 2016).But there is also evidence that parents don’t necessarily select schools on the basis of effective-ness, dampening competitive incentives and potentially increasing disparities in public schoolingthrough increased sorting on other dimensions (Rothstein 2006, Abdulkadiroğlu, Pathak, Schel-lenberg and Walters 2020, Walters 2018).
At the same time, one of the most pernicious and persistent issues in US education policyover the last century is racial segregation. More than sixty five years after the pivotal BrownSupreme Court decision, segregation by race is still pervasive and enduring across public schools(Figure 2). The negative impact of racial segregation on students has been documented ina large literature spanning across the social sciences (Welch 1987, Guryan 2004, Card andRothstein 2007, Clotfelter 2011, Billings, Deming and Rockoff 2014, Reardon and Owens 2014,Johnson 2015). Given the sorting patterns documented for charter schools, a key remainingquestion is the impact that charter school expansion has had on the racial stratification ofschool systems.
Because there are multiple potential mechanisms that may drive a causal link between thegrowth of charter schools and segregation, theory is ambiguous on what the net effect may be.On the one hand, choice entails decoupling school assignments from residential neighborhoods,many of which are already segregated, which by itself may generate changes in enrollmentthat impact stratification. On the other, greater choice may lead to segregation if parentshave strong peer preferences, lack equal access to resources that facilitate school choices, orif they confound school quality with school racial composition or other correlated observables(Abdulkadiroğlu et al. 2020). An additional complication is that many charters schools in urbanareas specifically target historically underserved students (Angrist, Pathak and Walters 2013).Therefore, estimating the causal effect of charter schools on school segregation is difficult becausesorting dynamics are endogenous to numerous underlying forces.
We address this gap by providing definitive evidence on the effect that charter schools havehad on school segregation by race and ethnicity. We construct a 1998-2018 panel on the universeof school systems by grade level based on an annual census of US public schools, and documentimpacts across the four largest racial groups using four common definitions of school systems.Our research design is based on a triple differences model, leveraging between-grade compar-isons in changes in charter penetration within system and year. We also exploit the arguablycleaner source of variation generated by charter school openings in an instrumental variablesframework, confirming the internal validity of our findings. The results show that the expansionof charter schools has led to increased levels of segregation for every major racial group across
2

school districts, cities, and counties, especially in urban school systems with large populationsof underserved minorities. For the largest geographies, metropolitan areas, we uncover counter-vailing forces - while charters worsen segregation between the schools in a metropolitan area,they improve integration between school districts, where much of the racial segregation exists.
Our data source is the Common Core of Data (CCD), the census of public schools conductedannually by the US Department of Education. We use all waves of the CCD data that featurea charter school indicator, 1998-2018. Apart from being comprehensive, the main advantage ofthe CCD data is that it reports school enrollment separately by grade and race, allowing us todistinguish racial stratification levels for individual grades. The key variation exploited in ourresearch design is extracted from this feature of the data. The causal effect of charter percent ofenrollment is identified by comparing the dynamics of segregation between grade levels that haveexperienced differing intensity in charter growth. We restrict comparisons within school systemsin a given year (system-year fixed effects) to eliminate the influence of system-wide time-varyingconfounding factors that are correlated with charter enrollment. School systems are definedusing four distinct geographies: school districts, municipalities, counties, and metropolitan areas.Furthermore, we flexibly control for fixed differences in segregation across the grade levels of eachsystem in our sample and for cohort effects (grade-system and state-grade-year fixed effects).
We demonstrate that these flexible controls are effective at eliminating confounding com-ponents of the correlation between charter school presence and racial stratification. Using adistributed lags model, we show that future charter growth is not predictive of current segre-gation levels, suggesting a lack of pre-trends in outcomes. We also implement an IV frameworkleveraging the arguably cleaner variation that is driven by charter school opening events. Weconstruct the instrumental variable using charter schools’ opening date and age. First, we esti-mate school level event studies that track the typical enrollment growth pattern of an averagecharter school, by grade. We use the estimates from the event studies to compute the predictedshare of charter enrollment in each school system, grade and year. We use these predictedshares as exogenous instruments in our triple difference models, generating 2SLS estimates ofthe impact of charters that rely on the assumption that charter opening events impact stratifi-cation only via the charter share margin (after partialing out the flexible controls of the baselinemodel).
Across multiple specifications, the OLS and IV estimates are remarkably similar, suggestingthat with the presence of flexible controls the OLS estimates are unbiased for the effect ofcharter schools on segregation. Additionally, we establish that, were charter school enrollmentdrawn randomly from the non-charter school population, charters would have a small integrativeeffect, instead of the segregative effect identified using actual charter enrollment data. Finally,we conduct a series of placebo tests asking whether changes in the charter share in one gradeare spuriously linked to segregation in other grades, finding encouraging patterns. Altogether,the evidence indicates that our estimates are reliable average treatment effects of the charterschool sector on school segregation.
We find that charter schools have countervailing effects on racial stratification, decreas-ing segregation across school district jurisdictions, but increasing segregation between schools.Increases in a public school system’s charter share of enrollment cause increased levels of seg-
3

regation for the four largest racial groups: Black, Hispanic, White, and Asian students. Themagnitude of the impact is modest for the average district, but more worrying for systems withlarge charter shares. Our estimates suggest that a one percentage point (p.p.) increase in thefraction of enrollment going to charter schools causes approximately a 0.10 p.p. increase in thesegregation of Black or Hispanic students, or an elasticity of 0.06 for the mean district. Impactsare larger for Black and White segregation than for Hispanic or Asian segregation. Moreover, wedocument substantial effect heterogeneity across states, with a potential mechanism related tostate differences in charter schools’ relative presence in urban districts and their target studentpopulation. Indeed, our findings indicate the segregation impact of charters is greater in urbandistricts whose student body is largely comprised of under-served minorities.
An exception to the general patterns in the data are metropolitan areas, which show moremarked differences between the OLS and IV models and show little to no impacts when testingfor pre-existing trends using distributed lags.1 To explore this mixed finding further, we decom-pose metropolitan area segregation into a component due to within-district segregation and acomponent due to between-district segregation (Clotfelter 1999). We demonstrate that chartersector growth leads to decreases in the between-district component of segregation, and simul-taneous increases in the within-district segregation component, suggesting that charter schoolshave led to diminished compositional imbalances across district boundaries that have not mani-fested into greater integration between schools. We provide additional evidence supporting thishypothesis by showing that the decrease in between-district racial imbalance caused by charterschools is concentrated in metropolitan areas with intense school district fragmentation. Wealso present models suggestive of a "reverse White flight" pattern between urban and suburbandistricts that is linked with charter growth.
In sum, our analysis constitutes a compelling case for the notion that charter schools havelead to higher average racial and ethnic segregation in US public schools. However, a clearnormative stance on the implications of these impacts is complicated by the voluntary nature ofschool choice. On the one hand, there is enormous evidence of the beneficial impacts of schoolintegration on the educational and socioeconomic outcomes of racial and ethnic minorities.2
Under this lens, charters leading to heightened segregation is particularly worrisome. On theother hand, the stated mission of charter schools is often to serve students from underservedpopulations, and many have been shown to improve student outcomes.3 Because they serve
1We conduct a Hausman-type test of equality between the OLS and IV estimates. We are able to rejectequality between OLS and IV coefficients on minority segregation in metropolitan areas, which show IV estimatesthat are considerably larger than OLS. In contrast, we fail to reject IV and OLS equality for districts and counties.In municipalities we also reject the null of exogeneity, but the point estimates for minority segregation are ofsimilar magnitude.
2See, for example, Johnson (2019). Evidence on both the harm of segregation and the benefit of integration ona multiplicity of student outcomes has been documented in decades of research (Crain and Mahard 1978, Crainand Strauss 1985, Clotfelter 2011, Guryan 2004, Ashenfelter, Collins and Yoon 2006, Jackson 2009, Reber 2010,Reardon and Owens 2014, Billings et al. 2014, Hanushek, Kain and Rivkin 2009, Card and Rothstein 2007).
3While evidence on the mean national impact of charter schools on student achievement is mixed, studiesusing school lotteries in urban settings find that charters are more effective than other public schools at raisingstudent test scores(Gleason, Clark, Tuttle and Dwoyer 2015, Abdulkadiroglu, Angrist, Dynarski, Kane andPathak 2011, Dobbie and Fryer 2011, Angrist et al. 2012, Angrist et al. 2016, Abdulkadiroğlu, Angrist, Naritaand Pathak 2017, Walters 2018). See Epple, Romano, and Zimmer (2015) for a summary of the existing evidence
4
homogeneous student bodies, specialized charter schools are likely to cause increased segregationwithin school systems. Segregation in the charter school sector is thus fundamentally differentfrom the de jure segregation of the pre–Brown era, which explicitly funneled fewer resources forthe education of the Black population (Card, Domnisoru and Taylor 2018). As such, we cautionthat school segregation caused by charter schools and segregation forced by government statuteshould not be interpreted with the same lens. More research is needed to understand whosechoices drive charters’ segregation effect, and the impact that choice-driven segregation has onthe outcomes of school systems.
The rest of the paper proceeds as follows. Section 2 provides additional background onthe history of school segregation and school choice, and the existing literature on these matters.Section 3 describes our data and estimation sample, and presents descriptive statistics. Section 4develops our empirical framework to estimate the causal effect of charter schools on segregation.Section 5 presents the main results of the paper. Section 6 conducts a range of robustnesschecks and provides our analysis of the components of metropolitan area segregation. Section 7concludes.
2 Background and Literature Review
2.1 History of School Segregation
The issue of segregation and school choice has particular significance in the United States, ashistorically it was used as a tool to maintain segregated schools in the south following the Brownv. Board decision (Reardon and Owens 2014). In 1968, fourteen years after Brown, U.S. publicschools were still intensely segregated, with an average within-district index of dissimilaritybetween black and white students of roughly 0.80 (Logan and Oakley 2004) and an averagewithin-district variance ratio index of 0.63 (Coleman et al. 1975, Reardon and Owens 2014).
As a result of court-ordered desegregation plans in the mid-1970s, these rates fell substan-tially, with the largest declines in the south (Clotfelter 2011, Reber 2005). At the same timethat within-district segregation was decreasing, however, between-district segregation increased,particularly in areas where school districts tended to be smaller and more numerous (Colemanet al. 1975). This form of de facto segregation, facilitated through white flight and racist hous-ing market practices, was more difficult to address after the Supreme Court’s 1974 Milliken v.Bradley decision ruled against court-ordered inter-district desegregation plans. Nevertheless,within-district segregation decreased substantially throughout the 1970s and continued to fallduring the 1980s, albeit more modestly. Additional examinations of trends during the 1990sand 2000s find that trends in segregation have been near flat or modestly decreased over thepast 20 years (Logan 2004, Stroub and Richards 2013). Between-district segregation is nowhigher than within-district segregation (Reardon and Owens 2014). Moreover, where districtstend to be larger, such as in the South and West, between district segregation tends to be lower(Clotfelter 1999).
on charter schools.
5

2.2 The Effects of School Segregation
From a political perspective that values equality and diversity, integrated schools are inherentlygood. Moreover, there is a rich literature supporting the notion that exposure to diversityhas positive political and sociological benefits for a pluralistic society. In terms of measurableeducational outcomes, an expanding body of research has documented the benefits of schoolintegration, yet the precise mechanisms are less clear (Reardon and Owens 2014). Analysis ofthe desegregation plans that followed the Brown ruling found reduced high school dropout ratesfor Black students (Guryan 2004, Reber 2010) as well as reductions in the probability of incar-ceration and increases in wages, employment, and health status (Johnson 2015). The eventualtermination of desegregation orders subsequently led to short-term resegregation that resulted inhigher dropout rates for Black and Hispanic students (Liebowitz 2017, Lutz 2011). Similarly, anexamination of the consequences of ending race-based bussing in Charlotte-Mecklenburg foundthat it increased racial inequality and led to negative effects on high school exams for whiteand minority students, lower graduation rates and college attendance for white students, andincreases in crime for minority males (Billings et al. 2014, Vigdor 2011). Experimental lotterydata show that a desegregation plan allowing minority students to transfer to higher-incomeschools with higher shares of white students increased college enrollment (Bergman 2018).Other research has documented the effect of both neighborhood and school segregation on theblack-white test score gap, which is systematically higher in more segregated cities (Card andRothstein 2007).
Reardon and Owens (2014) suggest that there are two primary mechanisms by which in-tegration might improve student outcomes: by ensuring educational resources are more equi-tably available to all students (e.g., school resources, teacher resources, peer resources, parentresources), and by increasing the total pool of available resources because, for example, the po-litical capital of parents in an integrated system may be more directed at acquiring higher totalresources for the school system rather than specific schools. Thus far, studies have tended tofocus on the availability of resources, which vary greatly as a function of segregation and seem tobe a driving mechanism of the benefits of integration (Bergman 2018, Johnson 2015, Reardonand Kalogrides 2019, Reber 2010).
2.3 Prior Research Findings on Charter Schools and Integration
A summary of the research on charter schools and segregation described it as “regrettably weak”and noted that little is known about how charter schools affect the distribution of studentsin school systems (Gill, Timpane, Ross, Brewer and Booker 2007). This gap in the researchhas been more glaring in recent years as Secretary of Education Betsy DeVos has made theexpansion of school choice a centerpiece of her tenure. In 2017, for example, the AssociatedPress (AP) conducted an analysis that compared charter schools to traditional public schoolsand found that charter schools were more likely to demonstrate high levels of racial isolation,which was widely interpreted as more segregated (Moreno 2017). The reaction to the storyexemplified the importance of measurement and the divisiveness of the issue. The president ofthe American Federation of Teachers, Randi Weingarten, called the data from the Associated
6

Press “damning,” and argued that “America’s children deserve better” (Fay 2017). The NationalEducation Association announced “Racial Isolation of Charter School Students ExacerbatingResegregation” (Walker 2018). Charter proponents pushed back, calling the Associated Pressanalysis “irresponsible” and arguing that charter schools merely reflected the neighborhoods inwhich they locate and the students they predominantly serve, which in both cases tend to bestudents of color (Fay 2017, Lake 2017). Charter schools, they argued, were being unfairlycriticized for doing exactly what they had set out to do—serve students who were most in needof better educational options.
Similar disagreements surfaced when UCLA’s Civil Rights Project issued a study establishingthat isolation of minority students is more severe in the charter school sector than in traditionalpublic schools (Frankenberg, Siegel-Hawley and Wang 2010). A reanalysis using similar meth-ods but limited to geographical areas where charters tended to locate—urban areas with highresidential concentrations—found that both charter schools and traditional public schools weresimilarly isolated (Ritter, Jensen, Kisida and Bowen 2014). Importantly, such relationships donot tell us the causal effect of charter schools on systemwide segregation, as they do not identifythe effect that charter growth has on the distribution of enrollment patterns in school systems.
Other studies dig deeper by following individual student transfers in choice systems and judg-ing if the transfers harm or improve exposure or isolation. Comparing students’ neighborhood-based school assignments to the actual schools students attended as a result of a public schoolchoice program in, Durham, N.C., Bifulco et al. (2009) found that White parents tended tomake moves that exacerbate isolation while Black parents made integrative moves. Also us-ing North Carolina data, Bifulco and Ladd (2007) and Ladd and Turaeva (2020) found similarresults when examining student transfers to charters. Similarly, Garcia (2008) used statewideArizona data across a four-year period to track students who exited traditional public schoolsto attend charter schools and found that reductions in exposure were largely driven by Whitestudents transferring to whiter charter schools.
In contrast, Ritter et al. (2014) found that student transfers to charters improved the overallracial balance in the school system of Little, Rock, Arkansas. Zimmer et al. (2009) examinedcharters in 7 areas and concluded that, on average, students tended to transfer between tradi-tional public and charter schools with similar racial compositions, though there was considerablevariation by region. In Denver, San Diego, Ohio, and Texas, black students transferred to char-ters with higher concentrations of Black students, whereas in Chicago and Milwaukee, bothBlack and Hispanic students transferred to charter schools with lower concentrations of theirown race/ethnicity. Similarly, in Denver, Texas, and Ohio, Hispanic students transferred tocharters with lower proportions of similar students. In Philadelphia, White, Hispanic, and to alesser extent Black students students transferred to charter schools with higher concentrationsof similar students.
Such studies are informative, as they allow us to directly observe the movement of students byrace/ethnicity and shed light on the mechanisms through which choice may impact segregation.At the same time, these studies are limited in scope and specific to local geographic conditions.Moreover, rather than looking at the net effect on the distribution of students in school systems,they rely on the amount of exposure or isolation experienced by students who transfer. We
7
address this gap with a comprehensive analysis of the effects of charter schools on the distributionof students in school systems using the universe of public school systems containing charterschools from 1998-2018.
3 Data
The main data source in our study is the National Center of Education Statistics’ (NCES)Common Core of Data (CCD), which includes school enrollment counts by grade level andrace/ethnicity, school type, and the latitude and longitude of schools’ geographic locations.4
The data are accessed via Urban Institute’s Education Data Portal. We use standard GISprocedures to match school locations to different geographical units: geographic school districts,municipalities, counties, and metropolitan areas. We treat each of these geographies as distinctdefinitions of school systems. This is particularly important as it allows us to geo-locate charterschools in the school systems that they affect. For school districts, we use the 2015 definitionof school district boundary maps from NCES’ Education and Geographic Estimates (EDGE).For metropolitan areas, we use U.S. Census Bureau TIGER/Line 2010 definitions of Core BasedStatistical Areas, focusing only on Metropolitan Statistical Areas. We also geo-locate schools toCensus Places, the census’ formal definition of all "municipalities" – incorporated cities, towns,and unincorporated concentrations of population in the U.S. Finally, we merge school locationdata with 2010 U.S. Census Bureau tracts and blocks. From these data we acquire residentialpopulation counts by age/race/ethnicity, adult educational attainment, and median householdincome.
We structure the data as a stacked panel of school systems over years and grade levels—foreach year in 1998-2018. We observe racial composition for each school grade level across gradesK-12 (1998 is the first year the charter flag is available). In terms of school level samplerestrictions, we drop closed or inactive schools, schools devoted to special programs, schoolsserving only kindergarten or lower, those providing only adult education, and schools not locatedin U.S. mainland states. We also drop schools with missing enrollment counts by race, an issuethat is prevalent in some states during the early years of the data. With regard to system levelsample restrictions, we drop system-grades that have only one school at any point during thesample period, since segregation is not well defined in these cases. In addition, we drop systemsthat are observed only for a single grade or year after these earlier sample restrictions.5
Our final analytic sample includes four distinct stacked panels of school districts (n = 5, 325),municipalities (n = 5, 610), counties (n = 2, 741), and metropolitan areas (n = 330), observedfor grades K-12 across 1998-2018. The total number of observations in these panels approx-
4To ensure the accuracy of the school location data, we conduct a geocoding procedure using school addressdata, which is more complete than location data in the CCD. This makes a difference especially for early years(approx. 1998-2009) in which location data is not available, missing, or otherwise low quality. The school locationdata we use is publicly available via the Urban Institute’s Education Data Portal.
5In our primary analysis, we treat virtual public schools like other public schools, since they account forstudent enrollments and from a practical perspective provide the fullest picture of how students are distributedin school systems. We have also run our results excluding virtual schools and our findings are consistent.
8

imately ranges between 85,000 and 800,000.6 It is also worth noting that the CCD charterindicator is often missing or otherwise of low quality during the early years of our estimationsample (about 1998–2003). Our main results are insensitive to the removal of these early yearsof data.
3.1 Descriptive Statistics
Nationally, charter schools have increased their share of total enrollment. Figure 1 shows that,between 1998-2018, the average K-12 student attended a district-grade in which the charterpercent of enrollment grew from 0.3% to 6.9%. This overall trend includes many districts thatnever have charter entry, so it understates the average charter share growth among districtsthat have seen charter entry, which rose from 0.49% to 11.6 % over the same period. It isimportant to keep in mind that these national trends mask considerable variation in chartergrowth between districts and across grade levels within districts.
Charter schools tend to serve a population that over represents Black and Hispanic students.Table 1 shows that, compared to traditional public schools, charters enroll higher proportionsof Black students than White students in elementary and middle schools. Charter schools alsotend to enroll higher proportions of Hispanic students in middle and high school. These studentenrollment characteristics are largely reflective of charter school locations. Charter elementaryand middle schools are more likely to be located in census tracts with higher proportions of Blackresidents, while charter middle and high schools are located in areas with higher proportions ofHispanic residents compared to White residents. This is consistent with research demonstratingthat schools tend to closely reflect neighborhood compositions (Monarrez 2020, Whitehurst,Reeves, Joo and Rodriguez 2017). Charter schools also tend to be located in tracts with relativelylower median income and adult educational attainment.
3.2 Measuring Segregation
Determining the effect of charter school growth on school system segregation has proved vexing.A notable takeaway from related literature is that different methods of measuring segregationcan lead to different conclusions (Reardon and Owens 2014) The two most common approachesto segregation measurement involve absolute measures and relative measures (Clotfelter, Hemelt,Ladd and Turaeva 2018). Absolute measures describe the extent to which students from onedemographic group are exposed to another group within individual schools. A common exposuremeasure is the isolation index, which measures the average school minority share experiencedby minority students. Other approaches quite simply define segregated schools as those withhigh proportions of Black or Hispanic students. Some researchers have adopted the term “hy-
6These stacked panels are highly unbalanced. For example, in the school district sample only 17% of districtshave an observation for every single year in 1998-2018 and grade in K-12. The main reason is that most schooldistricts have grade levels that don’t meet our baseline sample criteria: at least two schools need to serve a grade.For districts with a single high school, for instance, we drop high school grades but still keep their middle andelementary schools, if they meet the criteria.
9

persegregated” to describe schools whose enrollment is comprised of 90% or higher share of un-derrepresented minorities, showing that charter schools are more hypersegregated (Frankenberget al. 2010, Orfield, Jongyeon, Frankenberg and Siegel-Hawley 2016).
While descriptively useful, a drawback of absolute measures is that they reflect both racialstratification across schools and the underlying racial composition of the school system. Schoolsin high minority areas may be labeled hypersegregated simply for reflecting the underlying poolfrom which they draw students. Over time a school system may appear to be increasinglysegregated simply because of increases in the local minority population. Recent claims in themedia that schools have resegregated tend to rely on absolute measures, which do not accountfor the fact that White students make up an increasingly smaller share of all students in theUnited States (Fiel 2013, Caetano and Maheshri 2017, Harris and Curtis 2018). These issuescomplicate comparisons of absolute segregation across time and place.
Relative segregation measures focus on stratification by describing how evenly the populationof minority students is distributed across schools, adjusting for the racial composition of theschool system. This makes them comparable across different locations and over time. We usethe variance ratio index (also known as "eta-squared"), a relative measure that has been widelyused by economists to characterize sorting (Kremer and Maskin 1996, Graham 2018). Thevariance ratio builds from the isolation index but includes a simple adjustment for system-widecomposition, defined as:
V ariance Ratio =E[qsj |URM = 1]−Qj
1−Qj= E[qsj |URM = 1]− E[qsj |URM = 0], (1)
where qsj is the fraction of students in school s in school system j that are an underrepresentedminority (URM), i.e. Black or Hispanic.7 The isolation index, which is the average of qsj whenrestricting attention to the URM population, can be written as the conditional expectationE[qsj |URM = 1], where URM is an indicator for URM students. This term is adjusted by Qj ,the system-wide fraction of the URM population. The intuition of the adjustment is straight-forward. In a perfectly integrated system all schools would have a composition equal to Qj .On the other hand, in a perfectly segregated school system URM students are only exposed tothemselves, so the isolation index would equal one. Noting that the denominator is equal tothe maximum excess isolation level possible and the numerator is the level of excess isolationcurrently experienced in the school system, the variance ratio measures existing excess URMisolation, relative to a complete segregation benchmark.
It is a remarkable fact of algebra that the variance ratio also coincides with the secondequality in (1), which is the difference in average school exposure to URMs between URM andnon-URM students. Therefore, the variance ratio index can also be interpreted as a gap in URMexposure. It bears mentioning that this characterization of the variance ratio also coincides withthe OLS slope coefficient of a student level regression of qsj on the URM indicator. In otherwords, the variance ratio can also be interpreted as how predictive a student’s race is of the race
7the index includes charter schools and every other type of public school that reports enrollment counts tothe Common Core of Data. Our research question requires this, as we want to study impacts on imbalance acrossthe public schools of the entire public school system in a given locality.
10
of her school peers.
Several studies have shown that the variance ratio index arises naturally in the econometricanalysis of the racial achievement gap. In a linear model in which student outcomes are partlygenerated by school resources and school racial composition is correlated with school resources,the variance ratio is the natural metric linking inequity in schooling caused by segregation andmean racial gaps in outcomes (Card and Rothstein 2007, Reardon and Owens 2014, Graham2018). As such, our main results report charter schools’ impact on the variance ratio. But tobe sure that our results are not driven by our choice of segregation index, we conduct a parallelanalysis in the appendix using another common relative measure of segregation, the index ofdissimilarity (Table A4 in the appendix).
An additional important consideration when measuring segregation is the "segregation ofwhom?" question. In the past, much of the literature focused on the separation of Black andWhite students, for good reason (Johnson 2019). But in today’s diverse student populationthis would seem more arbitrary. The recent economics literature on segregation measures thesegregation of URM (Black and Hispanic) students from others (Card, Mas and Rothstein 2008,Caetano and Maheshri 2017).8 Recent work also uses multi-group indices of segregation (called"entropy") to account for the country’s growing diversity (Iceland 2004)9. We take a middle ofthe road approach, presenting results for the segregation of URM students for comparability tothe recent literature, and also looking at the segregation of Black, Hispanic, Asian, and Whitestudents separately.
A final relevant measurement issue is that segregation indices are mechanically sensitiveto the number of schools per capita in the school system. Holding constant school systemdemographics and assuming a random school sorting mechanism, a school system with moreschools has a wider scope for segregation than one with fewer schools simply because of samplingerror. In appendix figure A1 we carry out simulations to show the extent to which charter schoolexpansion could impact segregation simply due to the fact that the same student population issorting into a larger number of schools. The simulations demonstrate that the mechanical effectof number of schools on segregation is minimal in large districts but might be more worrisomein districts with smaller population. Thus, our models control for number of schools to pick upthese mechanical impacts, so the concern that our impact estimates may be mechanical worriesus little.10
8It should be noted that the segregation of URM students may be considerably different (usually higher)from the segregation of Black students and the segregation of Hispanic students. URM segregation is not a linearcombination of the segregation of these groups measured separately.
9For reference, we provide baseline impact estimates of charter school share of enrollment on Theil’s H indexof multi-group segregation in appendix Table A7.
10To be certain that mechanical effects do not drive our main estimates, we conducted falsification tests thatestimate charter impacts on segregation assuming that charter schools randomly draw their enrollment from non-charter schools (with replacement), but are otherwise equally numerous and populous as in the real data, seethe bottom of section 4.1 and Table A1 in the appendix. We also perform tests of treatment effect heterogeneityacross school districts with different population sizes, shown in Table A5 in the appendix. Our estimate ofthe impact of charters on segregation is remarkably similar across quartiles of the distribution of total districtenrollment.
11

3.3 National Trends in School Segregation
Figure 2 reports trends in average school segregation nationally, defined across four geographies:school districts, municipalities, counties, and metropolitan areas. Across geographies, the dy-namics of average school segregation tell a similar story. Regardless of which racial or ethnicgroup one focuses on, national trends in school segregation have been essentially flat over thelast twenty years. An exception is the segregation of Black and White students in metropoli-tan areas, which has declined considerably during this period. While in the early 2000’s Blackstudents were more segregated than Hispanic students in metropolitan areas, today segregationlevels for these groups have converged. White segregation in metropolitan areas declined in aparallel manner to that of Black students, but they continue to be the most segregated racialgroup. Asian students are the only group that has experienced increases in segregation. Therelatively flat trend in average segregation is consistent with similar analyses using measuresof unevenness which show flat to declining trends in segregation over the past two decades(Fiel 2013, Logan 2002, Logan 2004, Reardon and Owens 2014, Whitehurst et al. 2017).
While trends are similar, segregation levels across geographies are considerably different.When we measure it at the school district level, average school segregation is in the order of 20 inmost years of the data. School segregation levels for municipalities is similar to that of districts.In contrast, when measured at the metropolitan area level segregation jumps up to about 35.County level segregation is in the middle, about 28 throughout the sample. Schools are thereforemore severely segregated across metropolitan areas than they are within school districts, as hasbeen documented in the literature (Clotfelter 1999, Reardon and Owens 2014, Reardon andKalogrides 2019, Reardon, Yun and McNulty 2000, Stroub and Richards 2013). These differenceshave important implications for our evaluation of the role of charter schools in determining racialstratification patterns.
4 Empirical Framework
Theory suggests that the expansion of charter schools can impact school segregation via at leastthree distinct mechanisms, generating ambiguous predictions. First, they provide an outsideoption from traditional district schools, expanding families’ choice set and partly removing thedeterministic link between schools and neighborhoods (Monarrez 2020).11 Because US citiestypically have segregated neighborhoods, this mechanism raises the scope for school integration,
11Studies examining school commuters demonstrate that charter schools weaken the link between residenceand school assignment. Using data from Detroit, descriptive work has found that more than three quarters ofstudents who left the city to attend a school did so to attend a charter school, nearly double the rate of charterattendance for those who remained (Cowen, Edwards, Sattin-Bajaj and Cosby 2018). Moreover, Black andHispanic students tended to travel further because they lived further from high-quality school options, whereasWhite and Asian students were more likely to live in tracts that bordered suburbs. Nationally, while 22 percentof parents attending residentially assigned schools report moving to their neighborhood specifically to attendtheir school, only 11 percent of parents attending schools of choice report making similar moves. These dataalso reveal disparities along racial lines–though roughly a quarter of White or Asian parents reported moving toattend a residentially-assigned school, only 17 and 14 percent of Hispanic and Black parents did the same (U.S.Department of Education 2017).
12
but cannot by itself achieve it. The second mechanism, perhaps the most important, is parents’school selection behavior, which is determined by charter schools’ individual reputations (andmissions) relative to district schools, as well as preferences over peers, commuting burdensand other factors. If charters are considered "high quality", they may attract parents of highersocioeconomic status, placing downward pressure on school segregation. Finally, a third channelis linked to secondary impacts on the composition of district schools resulting from the sortingdynamics initiated by families that leave neighborhood schools for charters. These dynamicscould evolve further, perhaps triggering tipping point effects (Schelling 1972, Caetano andMaheshri 2017). In addition, there is evidence that charter school selection behavior variesconsiderably between urban and suburban areas. Studies of the Boston area charter sectorhave shown that, while urban charters enroll predominantly URM students, suburban charterenrollment demographics are similar to that of district schools (Angrist et al. 2013). Thissuggests that parental preferences over charters may vary by locality, by socioeconomic status,or both.
There is thus a multiplicity of countervailing mechanisms at play behind system-wide sort-ing dynamics driven by the expansion of the charter sector, making the effect of charter schoolson segregation ambiguous. This theoretical ambiguity motivates the following reduced formempirical analysis. We begin by defining the endogenous variable of interest. We parametrizetreatment dosage as the percent of total public school enrollment in a given geographic juris-diction that goes to the charter school sector, making the treatment variable continuous andbounded between 0 and 100. We parametrize treatment in this way because the charter shareof enrollment is a natural and commonly used metric for the relative importance of the char-ter school sector, which is amenable to comparisons across geographies of different populationdensity.
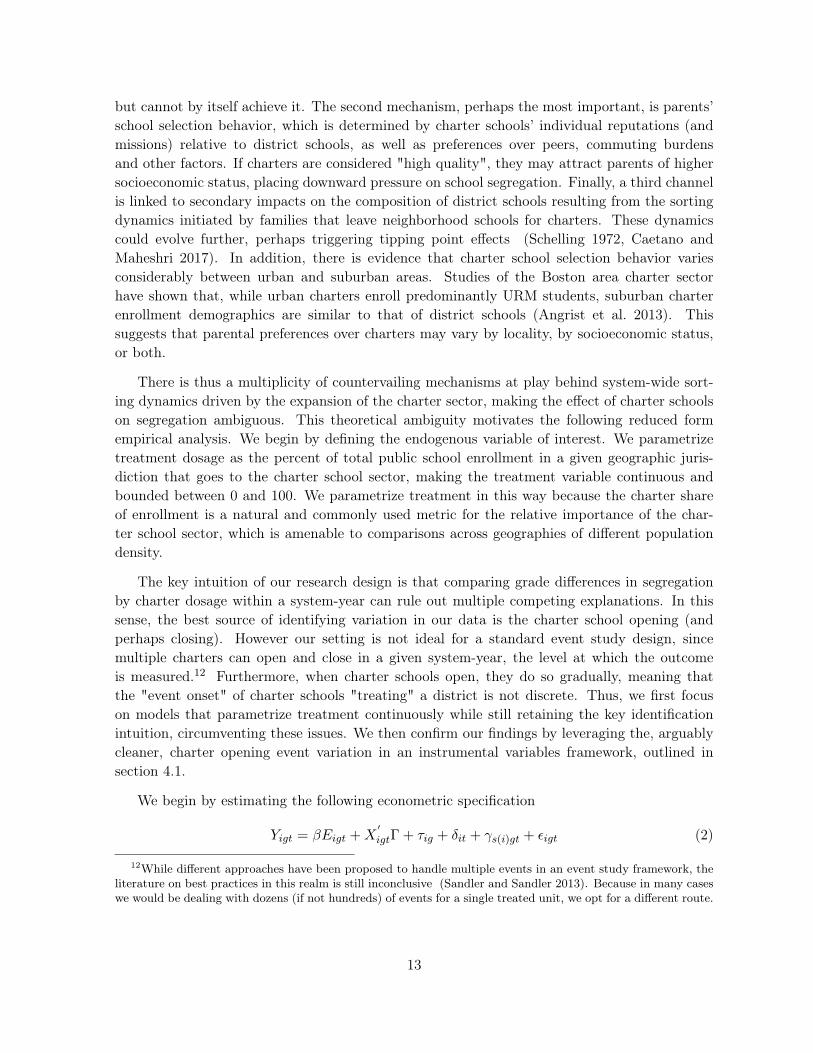
The key intuition of our research design is that comparing grade differences in segregationby charter dosage within a system-year can rule out multiple competing explanations. In thissense, the best source of identifying variation in our data is the charter school opening (andperhaps closing). However our setting is not ideal for a standard event study design, sincemultiple charters can open and close in a given system-year, the level at which the outcomeis measured.12 Furthermore, when charter schools open, they do so gradually, meaning thatthe "event onset" of charter schools "treating" a district is not discrete. Thus, we first focuson models that parametrize treatment continuously while still retaining the key identificationintuition, circumventing these issues. We then confirm our findings by leveraging the, arguablycleaner, charter opening event variation in an instrumental variables framework, outlined insection 4.1.
We begin by estimating the following econometric specification
Yigt = βEigt +X′igtΓ + τig + δit + γs(i)gt + εigt (2)
12While different approaches have been proposed to handle multiple events in an event study framework, theliterature on best practices in this realm is still inconclusive (Sandler and Sandler 2013). Because in many caseswe would be dealing with dozens (if not hundreds) of events for a single treated unit, we opt for a different route.
13

where Yigt is the segregation of school system i in grade g for school year t; Eigt is the percentof school system enrollment going to charter schools in that grade and year; and Xigt is a vectorof characteristics that vary at the system-grade-year level, including log of total enrollment,the fraction of students from a given racial group, and the number of schools serving a givensystem-grade-year. The model also includes system-by-grade fixed effects τig, system-by-yearfixed effects δit, and state-by-grade-by-year fixed effects γs(i)gt. Finally, εigt is an idiosyncraticerror component that varies at the system-grade-year level and, if correlated with Eigt , maythreaten the validity of the assumptions necessary to interpret β causally.
This specification can be interpreted as a triple differences strategy, with identification re-lying primarily on the inclusion of school system-year fixed effects, but also accounting forstate-year-grade and system-grade variation.13 The system-year effects δit serve an importantrole because they account for unobserved time-varying shocks at the school system level thathave equal impact on segregation across all grade levels. For instance, we can rule out that ourestimates are driven by districts enacting a policy that applies to all grade levels and impactssegregation, and whose timing coincides with the rise of the charter school sector in this locality.Additionally, system-year effects flexibly absorb the impact that urban change and gentrification- which has happened sporadically across certain urban localities - may have on stratificationpatterns. Nonetheless, by themselves the system-year fixed effects cannot account for importantbetween-grade grade differences in the determinants of school segregation.
The inclusion of system-grade fixed effects τig restricts comparisons to the same grade levelwithin a single school system, which has a twofold use in the case for causal identification.First, it gets rid of time-fixed confounding variation in segregation across the geography of thecountry. For instance, school segregation is higher in southern school systems than in westernones. Charter penetration also happens to be higher in the West than in the South, but wewouldn’t want to attribute this correlation to the causal effect of the charter sector. Second,system-grade effects difference out time-fixed variation in segregation across school grade levels,which have been documented empirically (Greenberg and Monarrez 2019). In addition, thestate-grade-year effects γs(i)gt ensure that we also flexibly account for differences in segregationby grade that vary by year and state, which could be driven by state-specific cohort effects, suchas the secular growth of Hispanic enrollment during the last two decades in certain areas of thecountry.
Intuitively, our empirical strategy is to identify causal effects using variation in charterenrollment dynamics across grade levels within each school system. For example, if in 2010the share of 9th grade charter school enrollment in Washington, D.C. grew more than in othergrades and there was a corresponding increase in 2010 9th grade segregation changes, relative toother grade levels, our model would attribute this to charters having a causal association withincreased segregation. Our national estimate β of this effect can be interpreted as a weightedaverage of these types of adjusted comparisons within system-years, across all school systemsfitting our analysis requirements over the period 1998-2018.14
13The analytic sample drops school districts that administer a single school and those that are singletons withrespect to the fixed effect structure of equation (2).
14Since our strategy relies on the structure of the grade, year, and district effects, we present estimates of
14

4.1 Robustness
The triple differences framework described above helps rule out a large number of confoundingfactors in our efforts to estimate the causal effect of charter schools on segregation. But it doesnot rule all of them out. One may worry that there could be unobserved factors driving bothchanges in charter school enrollment and in segregation at the system-grade-year level. Anotherpotential confounder could arise if segregation dynamics themselves cause student flows in andout of existing charter schools, impacting the charter share of enrollment. This could happen iffamilies’ decision on charter schools is driven in part by within-grade segregation dynamics inthe school system.
We carry out a series of tests to ensure that these potential explanations do not drive ourmain findings. First we conduct pre-trend tests using the following distributed lag specification:
Yigt =
3∑l=0
βlEig,t+l +X′igtΓ + τig + δit + γs(i)gt + εigt. (3)
Here, βl captures the effect of l leads of charter percent of enrollment Eig,t+l, on current segrega-tion levels. In other words, this model tests whether future increases in the fraction of studentsenrolled at charters are predictive of current levels of district segregation, which would threatenour identification assumption.
We also carry out a two-stage estimation procedure that leverages variation generated bycharter school opening events as the source of identification. The first step is to estimatethe change in the charter share of enrollment that is attributable to the opening of charterschools, and not to the churn of student flows between existing schools in the district. Weconstruct a school-by-year panel of charter schools and estimate standard event study models oftotal enrollment on years since school opening (Jacobson, LaLonde and Sullivan 1993, Cohen,Coughlin, Crews and Ross 2019).15 These models produce precise event study estimates of theaverage growth in enrollment associated with the opening of a charter, measured in number ofstudents, presented in Figure 3. For the mean charter school, annual growth in enrollment issteep in the early years, then it quickly levels off. Enrollment growth dynamics vary by grade ina predictable manner that is consistent with schools "rolling up" their enrollment with a gradualopening.16
We compute the charter school fitted values esgt from the grade-specific school level eventstudies shown in Figure 3 (where k indexes schools). Next, we aggregate these fitted values to
models that vary fixed effect structure in Table A6, showing that our main conclusions do not rely heavily onthe specific fixed effect structure of equation (2).
15We estimate grade-specific models of the following specification: esgt =∑10
k=1 αkgDksg + φsg + ψtg + νsgt,
where est is the total enrollment of charter school s in year t; Dksg are event study indicators for the number of
years that have passed since the school’s opening year, and φsg and ψtg are school and year effects.16Figure A2 shows distributions summarizing the variation in opening and closure events that underlie the
enrollment growth event study estimates. Charter openings range around 500 per year nationally, closures aregrowing over time from fewer than 100 to more than 400 annually.
15
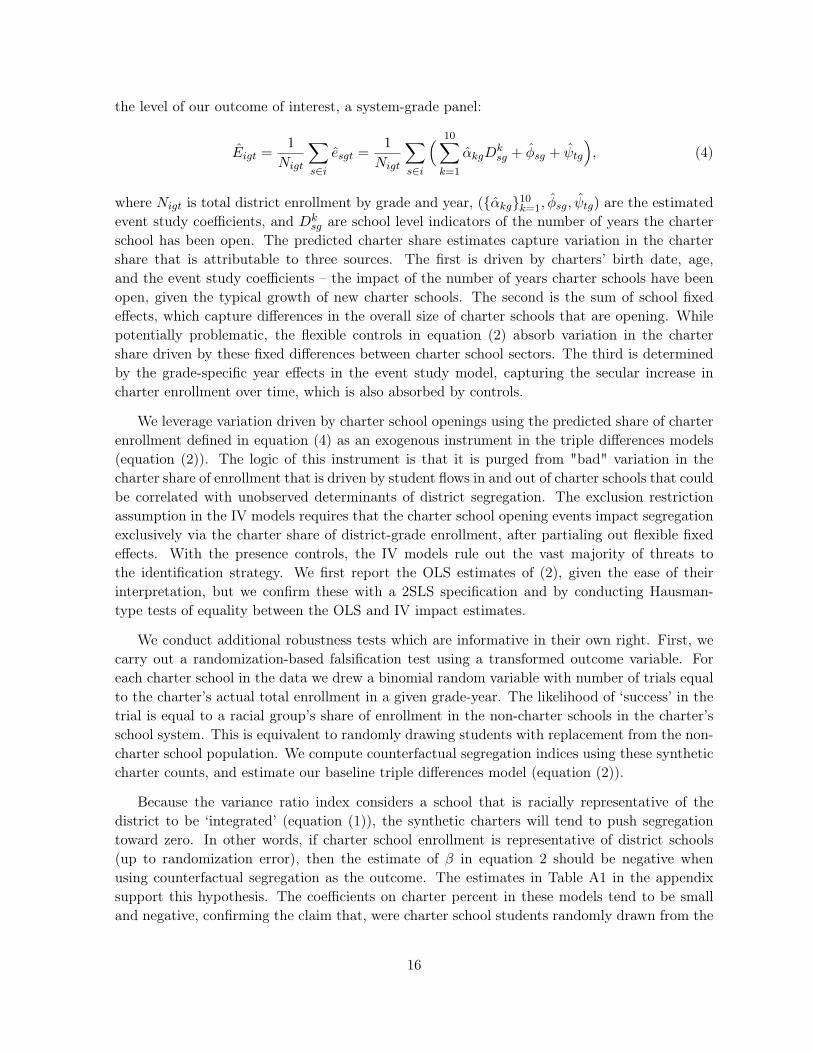
the level of our outcome of interest, a system-grade panel:
Eigt =1
Nigt
∑s∈i
esgt =1
Nigt
∑s∈i
( 10∑k=1
αkgDksg + φsg + ψtg
), (4)
where Nigt is total district enrollment by grade and year, ({αkg}10k=1, φsg, ψtg) are the estimatedevent study coefficients, and Dk
sg are school level indicators of the number of years the charterschool has been open. The predicted charter share estimates capture variation in the chartershare that is attributable to three sources. The first is driven by charters’ birth date, age,and the event study coefficients – the impact of the number of years charter schools have beenopen, given the typical growth of new charter schools. The second is the sum of school fixedeffects, which capture differences in the overall size of charter schools that are opening. Whilepotentially problematic, the flexible controls in equation (2) absorb variation in the chartershare driven by these fixed differences between charter school sectors. The third is determinedby the grade-specific year effects in the event study model, capturing the secular increase incharter enrollment over time, which is also absorbed by controls.
We leverage variation driven by charter school openings using the predicted share of charterenrollment defined in equation (4) as an exogenous instrument in the triple differences models(equation (2)). The logic of this instrument is that it is purged from "bad" variation in thecharter share of enrollment that is driven by student flows in and out of charter schools that couldbe correlated with unobserved determinants of district segregation. The exclusion restrictionassumption in the IV models requires that the charter school opening events impact segregationexclusively via the charter share of district-grade enrollment, after partialing out flexible fixedeffects. With the presence controls, the IV models rule out the vast majority of threats tothe identification strategy. We first report the OLS estimates of (2), given the ease of theirinterpretation, but we confirm these with a 2SLS specification and by conducting Hausman-type tests of equality between the OLS and IV impact estimates.
We conduct additional robustness tests which are informative in their own right. First, wecarry out a randomization-based falsification test using a transformed outcome variable. Foreach charter school in the data we drew a binomial random variable with number of trials equalto the charter’s actual total enrollment in a given grade-year. The likelihood of ‘success’ in thetrial is equal to a racial group’s share of enrollment in the non-charter schools in the charter’sschool system. This is equivalent to randomly drawing students with replacement from the non-charter school population. We compute counterfactual segregation indices using these syntheticcharter counts, and estimate our baseline triple differences model (equation (2)).
Because the variance ratio index considers a school that is racially representative of thedistrict to be ‘integrated’ (equation (1)), the synthetic charters will tend to push segregationtoward zero. In other words, if charter school enrollment is representative of district schools(up to randomization error), then the estimate of β in equation 2 should be negative whenusing counterfactual segregation as the outcome. The estimates in Table A1 in the appendixsupport this hypothesis. The coefficients on charter percent in these models tend to be smalland negative, confirming the claim that, were charter school students randomly drawn from the
16

district school population, they would have the impact of lowering segregation. We show insection 5 that this is not the case when using the real data on charter enrollment breakdowns.17
As a final robustness test, we estimate a battery of placebo tests, presented in detail inthe appendix. Intuitively, the placebo tests ask whether charter growth in elementary schoolgrades is predictive of contemporaneous changes in middle or high school segregation, and viceversa. Observing such a relationship in the data may be indicative of unobserved confoundersthat vary at the district-year-grade level and could threaten the causal interpretation of ourmain estimates. In practice, we test the cross-grade link hypothesis across all 13 school gradelevels. The direction of the potential cross-grade link is interesting by its own right. Onecould imagine that off-diagonal coefficients with g < g (the lower triangle in Table A.2) couldcapture preemptive behavior on the part of households. This could happen if student sortingin early grades reacts to the growth of charter schools in higher grades, as families choosethe educational trajectory of their children. Under this view, significant patterns in the upper-triangle of the placebo test matrix are more worrisome in terms of threats to our research design,as they cannot be explained by preemptive behavior and are more likely to be an indication ofendogeneity problems. See appendix A for details.
5 Results
Table 2 summarizes our estimation samples (defined at the system-grade level), showing the2018 mean of key analysis variables across four geographic levels, weighted by total enrollment.The first four columns show that school districts and municipalities are of similar size andhold similar attributes, although they aren’t identical. Students attend schools in districts andmunicipalities controlling 99 and 92 schools on average. Of these, about 10 to 11% are charterschools, although they tend to have lower enrollment than other public schools, enrolling about8% of the student population. Our charter enrollment growth models (Figure 3), predict thatthe average charter share is slightly lower, about 7%.
Students attend districts and municipalities in which almost half (48%) of the student body isBlack or Hispanic, and about 40% White. School segregation is similar whether it is measured atthe district or municipality level. White students are the most isolated individual group, secondin isolation only to Black and Hispanic students grouped together. These patterns highlight theimportance of the "segregated from whom?" question when measuring segregation, and serve asa preview of our analysis, which is conducted separately across racial and ethnic groups. Ourmain estimates focus on the grouping of Black and Hispanic student as an "underrepresentedminority" (URM) group. This choice makes our work more comparable to the existing literature.
Patterns for larger geographies – counties and metropolitan areas – highlight that schoolsegregation is more severe as one zooms out from school district and municipal boundaries.18
17As discussed in section 3.2, this falsification test also ensures that our estimates of β are not positive simplydue to the mechanical impact of adding more schools on the segregation index.
18In some instances, county and school district geographies coincide. This is common, but not ubiquitous, inthe Southern US. For instance, counties and districts coincide in Florida, but not in Louisiana or Kentucky. But
17
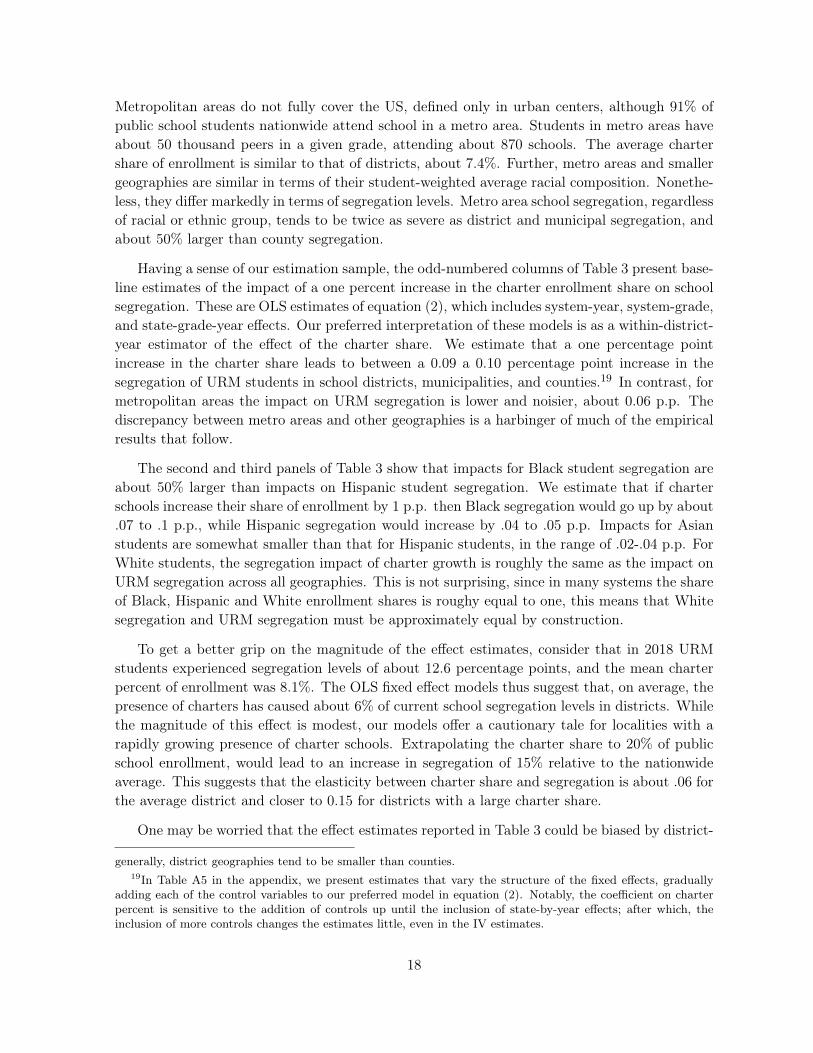
Metropolitan areas do not fully cover the US, defined only in urban centers, although 91% ofpublic school students nationwide attend school in a metro area. Students in metro areas haveabout 50 thousand peers in a given grade, attending about 870 schools. The average chartershare of enrollment is similar to that of districts, about 7.4%. Further, metro areas and smallergeographies are similar in terms of their student-weighted average racial composition. Nonethe-less, they differ markedly in terms of segregation levels. Metro area school segregation, regardlessof racial or ethnic group, tends to be twice as severe as district and municipal segregation, andabout 50% larger than county segregation.
Having a sense of our estimation sample, the odd-numbered columns of Table 3 present base-line estimates of the impact of a one percent increase in the charter enrollment share on schoolsegregation. These are OLS estimates of equation (2), which includes system-year, system-grade,and state-grade-year effects. Our preferred interpretation of these models is as a within-district-year estimator of the effect of the charter share. We estimate that a one percentage pointincrease in the charter share leads to between a 0.09 a 0.10 percentage point increase in thesegregation of URM students in school districts, municipalities, and counties.19 In contrast, formetropolitan areas the impact on URM segregation is lower and noisier, about 0.06 p.p. Thediscrepancy between metro areas and other geographies is a harbinger of much of the empiricalresults that follow.
The second and third panels of Table 3 show that impacts for Black student segregation areabout 50% larger than impacts on Hispanic student segregation. We estimate that if charterschools increase their share of enrollment by 1 p.p. then Black segregation would go up by about.07 to .1 p.p., while Hispanic segregation would increase by .04 to .05 p.p. Impacts for Asianstudents are somewhat smaller than that for Hispanic students, in the range of .02-.04 p.p. ForWhite students, the segregation impact of charter growth is roughly the same as the impact onURM segregation across all geographies. This is not surprising, since in many systems the shareof Black, Hispanic and White enrollment shares is roughy equal to one, this means that Whitesegregation and URM segregation must be approximately equal by construction.
To get a better grip on the magnitude of the effect estimates, consider that in 2018 URMstudents experienced segregation levels of about 12.6 percentage points, and the mean charterpercent of enrollment was 8.1%. The OLS fixed effect models thus suggest that, on average, thepresence of charters has caused about 6% of current school segregation levels in districts. Whilethe magnitude of this effect is modest, our models offer a cautionary tale for localities with arapidly growing presence of charter schools. Extrapolating the charter share to 20% of publicschool enrollment, would lead to an increase in segregation of 15% relative to the nationwideaverage. This suggests that the elasticity between charter share and segregation is about .06 forthe average district and closer to 0.15 for districts with a large charter share.
One may be worried that the effect estimates reported in Table 3 could be biased by district-
generally, district geographies tend to be smaller than counties.19In Table A5 in the appendix, we present estimates that vary the structure of the fixed effects, gradually
adding each of the control variables to our preferred model in equation (2). Notably, the coefficient on charterpercent is sensitive to the addition of controls up until the inclusion of state-by-year effects; after which, theinclusion of more controls changes the estimates little, even in the IV estimates.
18
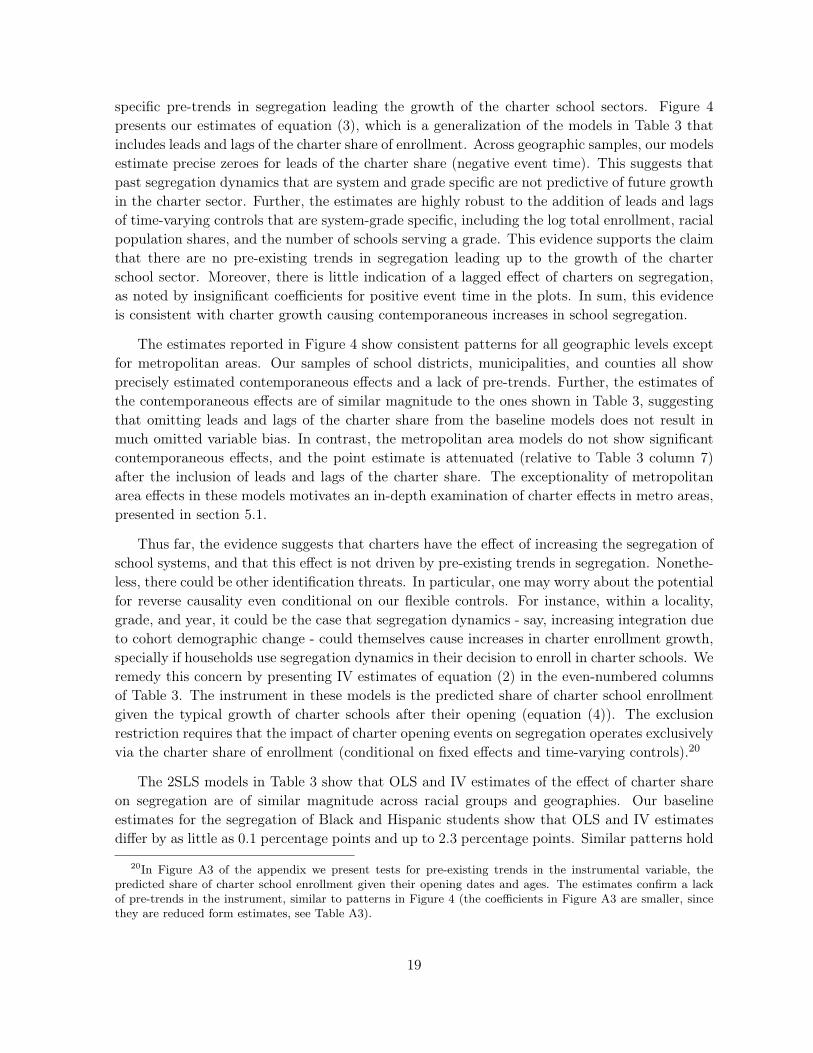
specific pre-trends in segregation leading the growth of the charter school sectors. Figure 4presents our estimates of equation (3), which is a generalization of the models in Table 3 thatincludes leads and lags of the charter share of enrollment. Across geographic samples, our modelsestimate precise zeroes for leads of the charter share (negative event time). This suggests thatpast segregation dynamics that are system and grade specific are not predictive of future growthin the charter sector. Further, the estimates are highly robust to the addition of leads and lagsof time-varying controls that are system-grade specific, including the log total enrollment, racialpopulation shares, and the number of schools serving a grade. This evidence supports the claimthat there are no pre-existing trends in segregation leading up to the growth of the charterschool sector. Moreover, there is little indication of a lagged effect of charters on segregation,as noted by insignificant coefficients for positive event time in the plots. In sum, this evidenceis consistent with charter growth causing contemporaneous increases in school segregation.
The estimates reported in Figure 4 show consistent patterns for all geographic levels exceptfor metropolitan areas. Our samples of school districts, municipalities, and counties all showprecisely estimated contemporaneous effects and a lack of pre-trends. Further, the estimates ofthe contemporaneous effects are of similar magnitude to the ones shown in Table 3, suggestingthat omitting leads and lags of the charter share from the baseline models does not result inmuch omitted variable bias. In contrast, the metropolitan area models do not show significantcontemporaneous effects, and the point estimate is attenuated (relative to Table 3 column 7)after the inclusion of leads and lags of the charter share. The exceptionality of metropolitanarea effects in these models motivates an in-depth examination of charter effects in metro areas,presented in section 5.1.
Thus far, the evidence suggests that charters have the effect of increasing the segregation ofschool systems, and that this effect is not driven by pre-existing trends in segregation. Nonethe-less, there could be other identification threats. In particular, one may worry about the potentialfor reverse causality even conditional on our flexible controls. For instance, within a locality,grade, and year, it could be the case that segregation dynamics - say, increasing integration dueto cohort demographic change - could themselves cause increases in charter enrollment growth,specially if households use segregation dynamics in their decision to enroll in charter schools. Weremedy this concern by presenting IV estimates of equation (2) in the even-numbered columnsof Table 3. The instrument in these models is the predicted share of charter school enrollmentgiven the typical growth of charter schools after their opening (equation (4)). The exclusionrestriction requires that the impact of charter opening events on segregation operates exclusivelyvia the charter share of enrollment (conditional on fixed effects and time-varying controls).20
The 2SLS models in Table 3 show that OLS and IV estimates of the effect of charter shareon segregation are of similar magnitude across racial groups and geographies. Our baselineestimates for the segregation of Black and Hispanic students show that OLS and IV estimatesdiffer by as little as 0.1 percentage points and up to 2.3 percentage points. Similar patterns hold
20In Figure A3 of the appendix we present tests for pre-existing trends in the instrumental variable, thepredicted share of charter school enrollment given their opening dates and ages. The estimates confirm a lackof pre-trends in the instrument, similar to patterns in Figure 4 (the coefficients in Figure A3 are smaller, sincethey are reduced form estimates, see Table A3).
19

for the OLS and IV impacts on the segregation of individual racial groups. Taken as a whole,the evidence in Table 3 suggests that there is little difference between the OLS and IV estimatesfor URM segregation across most geographies. We conduct Durbin-Wu-Hausman (DWH) testsof equality between the IV and OLS coefficients on URM segregation, presenting the p-valuesfor these at the bottom of Table 3. Assuming the validity of the IV coefficients, we fail toreject the assumption that charter percent is exogenous (after partialing controls out) for schooldistrict and county level segregation. However, the DWH test rejects equality between IV andOLS for segregation of municipalities and metropolitan areas. The IV coefficient is consistentlylarger than OLS in these models, with this difference being considerably more pronounced formetropolitan areas. For municipalities, the difference between OLS and IV is never larger thanabout 1 p.p. (12%), but for metro areas the IV is consistently about 2-3 p.p. (about 33%)larger than OLS. Our interpretation of these patterns is that the rejection of the DWH test inmetropolitan areas is more economically meaningful than for municipalities, motivating a morein-depth analysis of stratification dynamics at the metro area level (section 5.1).
The IV results establish that there should be little worry of endogeneity in our OLS within-system-year estimates of the impact of the charter share on racial segregation. We thus retainthe OLS estimates of the triple differences model in equation (2) as our preferred estimates,since they have a more straightforward interpretation. Nonetheless, we report the IV estimatesas a useful check on the credibility of our claim to causality.21
As a final robustness check, we show in Table A2 of the appendix that the placebo testsare largely consistent with a causal interpretation for our main estimates. Charters are mostpredictive of the segregation of the grade they serve, and their impact of segregation by gradeis of similar magnitude to our main estimates, with a few exceptions. The placebo tests showlittle indication of the existence of unobserved confounders or preemptive household behavior.With the exception of small between-grade correlations across high school grades, charter schoolgrowth in grade k is not predictive of segregation in grade k′ 6= k. We direct readers to appendixA for a detailed description of the placebo tests.
Together, the absence of segregation pre-trends, the similarity of the OLS and IV pointestimates, and the consistency of both the placebo tests and the randomization-based falsifi-cation tests (Table A1), provide convincing evidence that our models identify the causal effectof the charter share of enrollment on the racial segregation of public school systems. Whilethe magnitude of this effect is modest, we can confidently reject the null that charters do notracially segregate schools, for any of the four largest racial and ethnic groups in the country.However, results for segregation at the metropolitan area level show more odd patterns. Whileour baseline models still indicate that charters lead to increases in metropolitan segregation,the distributed lag models are inconsistent with meaningful effects, and the IV estimates areconsiderably larger than OLS. Therefore, we now turn to a decomposition of the metropolitanarea effects and dig deeper into the underlying mechanisms (section 5.1); we then turn to an
21Table A3 in the appendix presents first stage and reduced form model estimates corresponding to the IVmodels in Table 3. These models help establish why our OLS and IV estimated effects are so similar. Forinstance, they show that for school districts the reduced form effect is slightly more than half of the OLS impact,but the first stage effect is itself about 0.60, translating into IV impact estimates of a similar magnitude to OLS.
20

analysis of effect heterogeneity (section 5.2).
5.1 Between-District Segregation in Metropolitan Areas
An additional consideration for the effect of school choice on segregation is its potential abilityto diminish the role that the jurisdictional boundaries of school districts have in determiningschool segregation at the metropolitan area level. It is a known fact that racial compositiondifferences between school districts drive about two thirds of metropolitan school segregation(Clotfelter 1999). But charter school enrollment normally takes place with little regard todistrict jurisdictional divisions.22 Indeed, we are only able to measure charters’ impact onschool districts by linking them geographically to district boundaries and implicitly assumingthat any school sorting takes place within the population encased within district jurisdictions.Due to the potential importance of this mechanism, we now develop a framework to test theimpact of charters on racial stratification patterns across school district boundaries.
The introduction of school choice could have different simultaneous and counteracting effectson school segregation at the metropolitan level. On the one hand, we know from the analysisabove that the presence of charter schools leads to increased racial stratification within schooldistricts. On the other, if charters lead to increased between-district sorting patterns, this couldpotentially have an integrative effect. Such an effect would be especially likely if charters causeincreased non-minority enrollment in high minority districts, or vice versa.
Using our grade-specific panel datasets on school segregation by metro and year, we de-compose metropolitan area segregation into within- and between-district components followingthe methodology introduced by Clotfelter (1999). We compute between-district segregationby assuming a counterfactual scenario in which school districts are perfectly integrated, suchthat every school in their jurisdiction has a racial composition equal to district-wide compo-sition. Computing metropolitan segregation under this counterfactual focuses on differencesin the composition of entire districts, giving us a measure of the extent of racial stratificationbetween school districts in a metropolitan area. We measure the within-district component ofmetropolitan segregation by taking a population weighted average of the variance ratio index ofthe metropolitan area’s school districts.23
Table 4 presents our estimates of the effect of charter percent of enrollment on each com-
22Given the complexity of various state laws governing charter schools, it is difficult to summarily categorizestate enrollment policies. Roughly a third require prioritization of students living in the district where thecharters are located, with additional spots filled through open-enrollment. South Carolina’s policy, for example,is arguably one of the strictest, limiting out-of-district enrollment to 20 percent of total enrollment unless both thesending and receiving school boards approve. Colorado requires that a majority of students come from the districtwhere the charter resides or from contiguous districts, which likely covers anyone within a reasonable commutingdistance. At the other end of the spectrum, some states require that charters be open to all students, regardlessof district. For example, Indiana has no geographic constraints, but like most states it allows preferences forsiblings, children of employees, and socioeconomically disadvantaged students (Education Commission of theStates 2018).
23The difference between total metropolitan segregation and between-district segregation has also been usedas a measure of within-district segregation. Our estimates are similar when using this measure.
21

ponent of metropolitan school segregation. Columns (1) and (2) replicate the OLS and IVresults on total metro segregation in Table 3, which showed that the effect on metropolitanarea segregation is lower than it is on smaller geographies like school districts, municipalities,and counties. Columns (3) and (4) report the impact of the metro charter share on the within-district component of metro segregation. The estimate magnitudes here are remarkably similarto the estimates for the school district panel in Table 3 (1) and (2), even though Table 4 uses ametropolitan level dataset. We interpret this as added evidence of the robustness of our resultsof the effect on school district segregation.
Columns (5) and (6) report OLS and IV estimates of the impact of charters on segregationbetween school districts, where we find negative point estimates. Interestingly, our estimatesindicate growth in the charter share leads to lower levels of between-district segregation. Whileour point estimates are negative across all the major racial groups, we can reject that theseimpacts are zero for URM, Black and White stratification in the OLS models, and only forURM (and marginally for Black) segregation in the IV specifications. These findings suggestthat charters cause decreases in the between-district component of metropolitan segregation forcertain groups. For the mean metropolitan area, the estimates suggest that, were charter schoolsabolished, between-district segregation would fall by about 1%. Noticeably, in the majority ofspecifications the sum of the within- and between-district effect estimates is approximately equalto the total effect on metropolitan segregation. We interpret this as another encouraging pattern,suggesting that our empirical strategy is effective at disentangling effects component-wise.
Taken together, the results in Table 4 establish that charter schools have counteractingeffects on school segregation at the metropolitan area level. As we had shown before, chartersincrease the segregation taking place inside school districts. But they also tend to diminishcompositional imbalances between districts in the same metropolitan area. The effect on within-district segregation is larger, thus our estimate on total metro segregation is still positive. Oneinterpretation of these results is that charter schools echo the role of magnet schools duringthe court desegregation order era(Welch 1987). Magnet schools were introduced as a way ofattracting white families to urban school districts in the hope of limiting white flight to suburbanschool districts. Magnets were thus meant to sacrifice the within-district integration objective inorder to limit the more severe problem of growing segregation between districts. Charter schoolstoday appear to have this type of dual effect: they alleviate certain compositional imbalancesacross district lines, but this has not resulted in greater school integration.
The evidence of counteracting effects of charters on the segregation of metropolitan areasmotivates additional analyses investigating potential mechanisms. Prior research has foundthat white flight during the era of court-ordered desegregation was higher in areas that arefragmented into a large number of school districts (Reber 2005). If charters have the effect offacilitating and enhancing between-district enrollment flows, such dynamics are likely to playout to a greater degree in cities with intense school district fragmentation. To examine this, webreak our sample into three quantiles based on the total number of districts in a metro area.24
24Using these categorizations, low fragmentation metropolitan areas have an average of 4.3 districts, midfragmentation areas have 11.8, and high fragmentation areas have 53.9 school districts. Highly fragmentedmetropolitan areas encompass the most populous in the country, including New York, Los Angeles, Chicago,
22

The first panel on the top left of Figure 5 shows that point estimates for total metropolitansegregation effects are positive in cities with fewer districts, and close to zero in cities withmedium to high school district fragmentation. In contrast, effects for the within-district com-ponent of segregation (reported in in the top right panel) are positive and at least marginallysignificant across the board, suggesting that the within-district segregative effect of charters isnot particularly sensitive to school district fragmentation. On the other hand, the bottom leftpanel reports effects on the between-district component of metropolitan segregation, showingthat the between-district integration effect of charters, while imprecise, is increasingly morepronounced in areas that are fragmented into more local school districts.
One possible explanation for these findings is that metropolitan areas that are fragmentedare those in which white animosity toward school integration was historically more intense. Thiswould be consistent with higher white flight to suburban districts and more district secessions(Reber 2005). If charter schools are bringing white students back to urban districts, but intowhite-isolated charter schools, this would lead to higher within-district segregation but lowerbetween-district segregation. We can shed some light on these implications using our currentempirical framework.
To do so, we first restrict our sample to school districts located in metropolitan areas andsplit it into large urban districts and other urban or suburban districts. We define large urbandistricts as those at or above the 75th percentile of total enrollment, in the distribution ofdistricts within the metro. We then estimate the following econometric specification, aimed atcapturing the effect of the presence of charter schools in large urban districts on the compositionof smaller nearby school districts (and vice versa):
Yigt = βEigt + ψE∗M(i)gt +X′igtΓ + τig + δit + γs(i)gt + εigt. (5)
All variables are defined as in equation (2) and E∗M(i)gt is the charter percent of enrollment incertain other districts in the same metro area M as i.
We present the results in Table 5. The first three columns use the sample of large urbanschool districts, regressing their segregation level on their own charter percent of enrollmentas well as the charter percent of enrollment at smaller districts in the same metropolitan area.For large urban districts, an increase in charter percent is associated with increases in theWhite share of total enrollment, and also higher White isolation and White segregation in thesedistricts. Similar effects hold for the segregation of Black and Hispanic students, although wedetect no effects on the total share of enrollment of these groups. The charter share of nearbysuburban school districts is not associated with compositional or sorting dynamics in large urbandistricts.
Conversely, columns (4)-(6) of Table 5 present estimates for smaller school districts, modelingoutcomes as a function of their own charter share and that of nearby large districts. Charterpresence in large urban districts nearby is associated with a decrease in the overall Whiteand Black enrollment shares of smaller districts. For the case of Whites, the sign of this effect
Dallas, and Houston.
23
corresponds symmetrically with the evidence of the increased large urban White share in column(1). Additionally, charter growth in urban districts is associated with increases in the Hispanicshare of the smaller districts.
Altogether, Table 5 provides evidence indicative that charter school growth causes enrollmentflows between districts, although our data precludes us from studying flows directly. Further, theevidence suggests one explanation: White students moving from smaller districts to large urbanones, a "reverse white flight" effect. Patterns for other groups are less consistent, althoughwe also detect evidence of between district dynamics for them. Nonetheless, since smallerdistricts tend to have higher White enrollment shares than large urban districts, this evidence issuggestive that one of the mechanisms leading to higher between-district integration followingcharter growth is an increase in White student flows from suburban to urban districts. Theevidence also indicates potential flows of Black families to urban schools, which may be resultingin a rising share of Hispanic students in suburban districts.
At the same time, there is little indication that between-district integration flows translateto lower within-district segregation. The estimates show that increases in the White share ofenrollment are juxtaposed with more white-isolated schools in large urban school districts. Thismay explain why the charter effect of higher between-district integration does not lead to higherschool integration on net. Further assessing the mechanisms of these compositional dynamicsin school enrollment is of great policy interest, but beyond the scope of this study. Our resultsinstead provide a first look into the complexity of stratification dynamics caused by the growthof the charter school sector.
5.2 Treatment Effect Heterogeneity
The evidence presented thus far establishes that charter schools increase the racial and eth-nic segregation of school districts. The average national effect is small in magnitude, which islikely both a function of charters’ relatively small share of total enrollment and of treatmenteffect heterogeneity. One potential mediator in effect heterogeneity for school districts is ur-ban/suburban difference in charter sorting. There is evidence of differences in student selectionacross between urban and suburban charter schools. For the case of Boston, for example, ur-ban charter schools tend to enroll disproportionately high shares of Black students (relative totraditional district schools), unlike nonurban charters whose Black shares are more representa-tive (Angrist et al. 2013). This difference is partly driven by charter philosophies; urban chartersoften feature the "No Excuses" teaching model, which is targeted for at-risk students and hasshown to be effective at raising student outcomes (Angrist et al. 2013, pp. 4). Such variabilitybetween urban and nonurban charter school sorting suggest that the effect of charter schools onsegregation would be larger in urban than in suburban districts.
We test this hypothesis in Table 6, which shows that charter sorting heterogeneity by ur-banicity is complex, as it interacts with baseline district demographic composition. Column 1tests this using our preferred triple differences models of segregation, interacting the charter
24

percent variable with indicators for district urbanicity.25 In column 2, we test whether impactsvary significantly by baseline district composition (2010 URM share of total enrollment), de-fined using three quantiles of the nationwide district distribution.26 Columns 3 through 4 looka the interaction of urbanicity and baseline composition by estimating models akin to column2, separately for urban, suburban, and rural districts.
We do not find meaningful heterogeneity in charter’s impact on segregation by urban andsuburban status alone. Column 1 shows that the coefficients on urbanicity interactions tend tobe small in magnitude and in most cases indistinguishable from zero (the omitted category areurban districts). Estimates in column 2 show that charter school’s impact on segregation, whilepositive and significant across the board, is larger in districts with a high URM share of totalenrollment. We split the sample to show that the patterns in columns 1 and 2 mask importantinteraction effects, most prominently for White stratification. Notably, charters don’t have amain effect on the segregation of Whites in urban districts; the impact is present only in urbandistricts with a relatively high URM share. For Hispanic and Black students the main effect inurban districts is there, but it is attenuated relative to the pooled models, and the interactionwith the high URM indicators is positive, relatively large, and precisely estimated.
Heterogeneity patterns in suburban districts are considerably different and appear morecomplex across racial groups. Charters have a large main effect on the segregation of Whitestudents in suburbs. Further, the sign of the interaction with high URM shares is negative(albeit imprecise), suggesting that charters cause more White segregation in a low minoritysuburban district than in a high minority one, exactly the opposite pattern than we saw forurban school districts. For Black students, the suburban main effect is similar to the pooledmodels, and the interaction with higher URM is positive, albeit noisy and indistinguishablefrom zero. Similarly, Hispanic students attending suburban districts see a charter segregationmain effect of about .07 percentage points, and imprecisely estimated negative point estimatesin districts in which minorities are a larger share of the population.
We hypothesize that these heterogeneity patterns may be due to differences in sorting akin tothe urban/nonurban differences discussed by (Angrist et al. 2013) for the case of Massachusetts.The results are consistent with the urban charter hypothesis: charters in high-minority urbandistricts cause a relatively large segregation impact because they are more likely to have missionstargeted at helping disadvantaged students. For Black and Hispanic students, charters lead toa larger rise in segregation in higher minority urban districts than in higher minority suburbanones. However, suburban charters located in low minority districts have a large impact on thestratification of White students, which is telling of the complexity of the sorting patterns causedby the charter sector. Also telling of complexity is the fact that charters have small to nosegregation impacts in low minority urban districts.
Our results show that effect heterogeneity varies by location and district demographics. Onepolicy implication of these findings is that policymakers concerned about segregation should
25We define urbanicity based on the "locale" variable in the CCD, using 2010 definitions. WE combined the"town" and "rural" categories into one, "Town/Rural".
26The average URM share in the Low quantile was 7.4%, for Mid it was 25.4%, and for High it was 65%.
25

be more wary of a growing charter sector in high-minority urban districts and low minoritysuburban districts, than in low minority urban districts and high minority suburban districts.
5.2.1 State Heterogeneity
A number of previous studies that have analyzed the effects of charters on school segregationin particular cities or states have found mixed results (Ritter et al. 2014, Clotfelter et al.2018). We hypothesize that the discrepancy in the evidence is likely due to charter schoolsimpacting segregation differently in different parts of the country. This could happen becauseof several reasons. First, there could be variability in the target student population of charterschools’ missions by state. For instance, in Texas charter schools tend to serve economicallydisadvantaged Hispanic and Black students in urban settings, while in North Carolina charterschools are more likely to open near white suburban communities. Second, states vary in theirchartering procedures, which could affect the composition of their charter sector. For example,some states require local school districts to approve charters, which could allow local authoritiesto determine whether and how charters open. Finally, it could also be the case that parentalpreferences over school racial composition vary by state.
We provide a comprehensive test of the extent of heterogeneity in the segregation effect ofcharters by state. To do so, we estimate models akin to the main econometric model in equation(2), with the addition of interactions of state indicators with the charter enrollment share:
Yigt =∑s
βsDs(i) × Eigt +X′igtΓ + τig + δit + γgt + εigt. (6)
where all variables are defined as in equation (2), i indexes school districts, and Ds(i) is anindicator of the state the district is located in, with state-specific average treatment effects βsindexed by s. Because they are interacted with the continuous treatment variable Eigt, stateeffects are interpreted directly, not relative to an omitted state. Our estimates of the stateeffects in this equation (and their confidence intervals) are reported in Figure 5, separately byracial grouping. These models use a restricted sample of states that have at least a 1% charterschool share total public school enrollment at some point during the time period 1998-2018.
In 32 of the 37 states with sizable presence of charters, our point estimate of the effect ofthe charter share on Black or Hispanic segregation is positive, and a majority of these (19)are positive and statistically different from zero. States in which the effect of charters onsegregation is above 0.25 (i.e. more than double the national average) include: Louisiana,Minnesota, Missouri, North Carolina, Oklahoma, Rhode Island and South Carolina. For thesestates, a 1 percentage point increase in segregation leads to a 0.25 percentage point increase inthe segregation of Black and Hispanic students. In 2018, school districts in our sample for thesestates had average segregation levels of about 20 percentage points (and a mean charter shareof 14%). Our estimates thus suggest that on average at least 18% of current school segregationlevels in these states was caused by the charter school sector.
The results in Figure 5 also demonstrate substantial heterogeneity in state impacts across
26

groups. As in the baseline estimates in Table 3, coefficients tend to be larger for Black andWhite students than for Hispanic students, in some cases alarmingly so.27 But, while thereis variability in the state interaction point estimates, they also vary considerably in precision.Some states for which we cannot reject that charters have no effect on URM segregation include:Arizona, Florida, Illinois, Oregon, and Pennsylvania. Finally, for a couple states our pointestimates suggest that charter schools led to increases in integration. Although none of theseare statistically significant, charters seem to have led to greater school district integration forURM students in Connecticut. However, we strongly advise against the over-interpretation ofthe outlier patterns in these estimates.
We hypothesize that state heterogeneity in the effect of charter schools is likely mediatedby state variation in the composition of charter schools’ target student population and mission.While we cannot observe charter school type in our data, we present suggestive evidence of thischannel in Figure 7.28 The plots in the top panels show that the impact of charter schools ina given state is positively correlated with the urban share of charter enrollment, echoing theinteraction estimates shown in Table 6 above. They also highlight some of the differences instate-specific impacts by race. Charter schools have quite a large impact on the segregationof Black students in Louisiana, Illinois and Minnesota, all states in which the urban share ofcharter enrollment is close to 100%. The positive relationship between urban share of the chartersectore is also present for White students, and to a lesser extent for Hispanic students.
Another potential, correlated, mediator of state heterogeneity in charter segregation impactsis the relative charter share of minorities, defined as the ratio of the minority share of charterenrollment over the minority share of total public school enrollment. The plots in the bottompanels of Figure 7 show that states in which charters are more likely to educate minority studentsthan other public schools tend to see higher increases in segregation as the charter school sectorgrows. This evidence is consistent with a theory in which states with more charter schoolsthat are geared toward serving underrepresented minority students seeing a larger impact ofthe charter sector on school segregation, echoing some of the takeaways of the district effectheterogeneity estimates reported above.
6 Conclusion
Employing a triple differences identification strategy that controls for a wide range of observableand unobservable school system characteristics, we demonstrate that charter school growth overa period of 20 years has led to increased racial and ethnic segregation in US public schools. Ourmain estimates suggest that this effect is of modest magnitude. We present evidence that thiseffect is highly heterogenous across different types of school systems and by state, highlightingthe importance of nuance in interpreting our main estimates. Moreover, we provide evidence that
27For succinctness, we omit results for Asian students here. There is limited state heterogeneity on Asiansegregation impacts, and as in Table 3, the coefficients are relatively small.
28In recent releases, the Common Core of Data has added a variable capturing information on the agenciesin charge of certain charter school groups (e.g. KIPP). Unfortunately, we do not have this information for muchof the panel, which limits our ability to use this variable to investigate effect heterogeneity.
27

charters sometimes help improve compositional imbalances between school districts in the samemetropolitan area. However, the slight rebalancing of district demographics has not translatedinto gains in the integration of schools. These takeaways are robust to a battery of robustnesstests and measurement choices.
But it is worth noting that the normative implications of this result are complicated by thevoluntary nature of charter school enrollment. If a family chooses a charter school because itfocuses on students of special needs, and this leads to higher segregation levels, it is difficult tosay whether such an increase in segregation is detrimental to social welfare. Our examinationof the heterogeneity of impacts suggests that charters in high-minority districts may cause arelatively large impact on segregation, which may be explained by the fact they are more likelyto have missions targeted at underserved students.
Simply put, segregation that takes place under a choice environment is fundamentally dif-ferent to the type of school segregation that took place during the pre-Brown era of de juresegregation. Moreover, while segregation by race is a highly salient and important topic inU.S. public education, it is not the only type of segregation that is important. Policymakersand stakeholders are also rightly concerned about other forms of segregation, including segre-gation by income, disability, or English-language learner status. Recent work suggests charterschools may increase socioeconomic segregation at levels comparable to our findings (Marcotteand Dalane 2019). Future work should continue to explore the effects of charter schools on thedistribution of historically underserved students in school systems.
The findings suggest that policymakers should be attentive to the potential problems intro-duced when families are able to compete for a public good and how relative advantages acrossfamilies may manifest in increased stratification. Our simulations suggest that charter schoolshave the potential to generate integrative effects, amounting to as much as a 2 percent reductionin the segregation of minority students for the average district (Table A1). Though this effectis small, the potential is greater in areas with significantly larger charter shares. Such effortsseem worth considering given the political barriers that tend to thwart integration efforts intraditional public school districts.
One promising strategy comes from controlled choice policies that centralize school choiceoptions into common enrollment systems. Research suggests that areas that adopt commonenrollment systems reduce the burden of choosing a school and increase the proportion of dis-advantaged students entering charter schools (Winters 2015). To the extent that the effect ofcharters on segregation is related to differential abilities of parents to navigate charter schooloptions, common enrollment systems may ameliorate the problem. Related strategies includeincorporating weights in common enrollment systems that increase diversity (Hawkins 2018b,Hawkins 2018a).
Other potential solutions involve so-called diverse-by-design charter schools. Though cur-rently only a small fraction of charters fall into this category, they represent a growing trend (Potterand Quick 2018). Because charter schools have broad freedom to target their recruitment strate-gies from broader geographical areas, such designs have the promise of using charters as agentsfor integration. While little research has yet to evaluate the effectiveness of such policies, strate-
28

gies to encourage diversity, such as weighted admission lotteries and targeted recruitment efforts,show promise. In some areas, such as San Antonio, a holistic approach that includes charterschools and traditional public schools is being pursued that not only incorporates common en-rollment systems and weighted admission lotteries, but strategically locating new schools ofchoice and increased funding for transportation (Hawkins, 2018a, 2018b). With the right designfeatures, it is possible that school choice could become an agent of integration.
References
Abdulkadiroglu, Atila, Joshua D. Angrist, Susan M. Dynarski, Thomas J. Kane, and Parag A.Pathak (2011) “Accountability and Flexibility in Public Schools: Evidence from Boston’sCharters And Pilots,” The Quarterly Journal of Economics, Vol. 126, No. 2, pp. 699–748.
Abdulkadiroğlu, Atila, Joshua D. Angrist, Yusuke Narita, and Parag A. Pathak (2017) “ResearchDesign Meets Market Design: Using Centralized Assignment for Impact Evaluation,”Econometrica, Vol. 85, pp. 1373–1432.
Abdulkadiroğlu, Atila, Parag A. Pathak, Jonathan Schellenberg, and Christopher R. Walters(2020) “Do Parents Value School Effectiveness?,” American Economic Review, Vol. 110,No. 5, pp. 1502–1539, DOI: 10.3886/E112266V1.
Angrist, Joshua D., Sarah R. Cohodes, Susan M. Dynarski, Parag A. Pathak, and Christopher R.Walters (2016) “Stand and Deliver: Effects of Boston’s Charter High Schools on CollegePreparation, Entry, and Choice,” Journal of Labor Economics, Vol. 34, No. 2, pp. 275–318,DOI: 10.1086/683665.
Angrist, Joshua D., Susan M. Dynarski, Thomas J. Kane, Parag A. Pathak, and Christopher R.Walters (2012) “Who Benefits from KIPP?,” Journal of Policy Analysis and Management,Vol. 31, No. 4, pp. 837–860.
Angrist, Joshua D., Parag A. Pathak, and Christopher R. Walters (2013) “Explaining CharterSchool Effectiveness,” American Economic Journal: Applied Economics, Vol. 5, No. 4, pp.1–27.
Ashenfelter, Orley, William J Collins, and Albert Yoon (2006) “Evaluating the role of Brownv. Board of Education in school equalization, desegregation, and the income of AfricanAmericans,” American Law and Economics Review, Vol. 8, No. 2, pp. 213–248.
Bergman, Paul (2018) “The Risks and Benefits of School Integration for Participating Students:Evidence from a Randomized Desegregation Program,” Institute for the Study of Labor(IZA).
Betts, JR (2005) Getting Choice Right: Ensuring Equity and Efficiency in Education Policy,Chap. The economic theory of school choice: Brookings Institution Press.
29

Bifulco, Robert and Helen Ladd (2007) “School Choice, Racial Segregation, and Test-Score Gaps:Evidence from North Carolina’s Charter School Program,” Journal of Policy Analysis andManagement, No. 26, pp. 31–56.
Bifulco, Robert, Helen Ladd, and S Ross (2009) “Public school choice and integration evidencefrom Durham, North Carolina,” Social Science Research, No. 38, pp. 71–85.
Billings, Stephen, David Deming, and Jonah Rockoff (2014) “School segregation, educationalattainment, and crime: Evidence from the end of busing in Chartlotte-Mecklenburg,” TheQuarterly Journal of Economics, Vol. 129, No. 1, pp. 435–476.
Caetano, Gregorio and Vikram Maheshri (2017) “School segregation and the identification oftipping behavior,” Journal of Public Economics, Vol. 148, No. C, pp. 115–135, DOI:10.1016/j.jpubeco.2017.02.
Card, David, Ciprian Domnisoru, and Lowell Taylor (2018) “The Intergenerational Transmissionof Human Capital: Evidence from the Golden Age of Upward Mobility,” NBER WorkingPapers 25000, National Bureau of Economic Research, Inc.
Card, David, Alexandre Mas, and Jesse Rothstein (2008) “Tipping and the Dynamics of Segre-gation,” The Quarterly Journal of Economics, Vol. 123, No. 1, pp. 177–218.
Card, David and Jesse Rothstein (2007) “Racial segregation and the black-white test score gap,”Journal of Public Economics,, No. 91, pp. 2158–2184.
Chubb, J.E. and T.M. Moe (1990) Politics, Markets, and America’s Schools, The Americanstudies collection: Brookings Institution, URL: https://books.google.com/books?id=mplqg6qzOGwC.
Clotfelter, Charles (1999) “Public school segregation in metropolitan areas,”Technical Report6779, NBER Working Paper.
Clotfelter, Charles, S Hemelt, H Ladd, and M Turaeva (2018) “School segregation in the era ofimmigration and school choice: North Carolina,”Technical report, APPAM.
Clotfelter, Charles T (2011) After Brown: The rise and retreat of school desegregation: PrincetonUniversity Press.
Cohen, Jeffrey, Cletus C Coughlin, Jonas Crews, and Stephen L Ross (2019) “Negative Exter-nalities and Real Asset Prices: Closing of Stapleton Airport and Effect on Nearby HousingMarkets,” FRB St. Louis Working Paper, No. 2019-27.
Coleman, James S et al. (1975) “Trends in School Segregation, 1968-73..”
Coons, J and S Sugarman (1977) Education by Choice: University of California Press, Berkeley.
Cowen, Joshua, Danielle Sanderson Edwards, Carolyn Sattin-Bajaj, and Missy Cosby (2018)“Motor city miles: Student travel to schools in and around Detroit,” Urban Institute.
30
Crain, Robert L and Rita E Mahard (1978) “Desegregation and black achievement: A review ofthe research,” Law & Contemp. Probs., Vol. 42, p. 17.
Crain, Robert L and Jack Strauss (1985) “School Desegregation and Black Occupational At-tainments: Results from a Long-Term Experiment..”
Dobbie, Will and Roland G. Fryer (2011) “Are High-Quality Schools Enough to Increase Achieve-ment among the Poor? Evidence from the Harlem Children’s Zone,” American EconomicJournal: Applied Economics, Vol. 3, No. 3, pp. 158–187.
Fay, L (2017) “Education Reform Groups Decry Associated Press Analysis of Charter SchoolSegregation.”
Fiel, J (2013) “Decomposing School Resegregation: Social Closure, Racial Imbalance, and RacialIsolation,” American Sociological Review, Vol. 5, No. 78, pp. 828–848.
Frankenberg, E, G Siegel-Hawley, and J Wang (2010) “Choice without equity: Charter schoolsegregation and the need for civil rights standards,”Technical report, The Civil RightsProject/Proyecto Derechos Civiles at UCLA.
Friedman, Milton (1962) Capitalism and Freedom: Cambridge University Press.
Garcia, David (2008) “The Impact of School Choice on Racial Segregation in Charter Schools,”Educational Policy, Vol. 22, No. 805-829.
Gill, Brian, P Mike Timpane, Karen E Ross, Dominic J Brewer, and Kevin Booker (2007)“Rhetoric versus reality: What we know and what we need to know about vouchers andcharter schools,” Rand Corporation.
Gleason, Philip, Melissa Clark, Christina Clark Tuttle, and Emily Dwoyer (2015) “The Evalua-tion of Charter Impacts: Final Report,” national center for education evaluation, Instituteof Educational Sciences, US Department of Education.
Graham, Bryan S. (2018) “Identifying and Estimating Neighborhood Effects,” Journal of Eco-nomic Literature, Vol. 56, No. 2, pp. 450–500.
Greenberg, Erica and Tomas Monarrez (2019) “Segregated from the Start: Comparing Seg-regation in Early Childhood and K-12 Education,”Technical report, Urban Institute,https://www.urban.org/features/segregated-start.
Guryan, Jonathan (2004) “Desegregation and Black Dropout Rates,” American Economic Re-view, Vol. 94, No. 4, pp. 919–943.
Hanushek, Eric A, John F Kain, and Steven G Rivkin (2009) “New evidence about Brown v.Board of Education: The complex effects of school racial composition on achievement,”Journal of labor economics, Vol. 27, No. 3, pp. 349–383.
Harris, F and A Curtis (2018) “The Unmet Promise of Equality.”
31

Hawkins, B (2018a) “The architect: How one Texas innovation officer Is rethinking school inte-gration.”
(2018b) “Texas, 78207: America’s most radical school integration experiment.”
Hoxby, Caroline Minter (2003) “School Choice and School Productivity. Could School ChoiceBe a Tide that Lifts All Boats?,” in The Economics of School Choice: National Bureau ofEconomic Research, Inc, pp. 287–342, URL: https://ideas.repec.org/h/nbr/nberch/10091.html.
Iceland, John (2004) “The multigroup entropy index (also known as Theil’s H or the informationtheory index),” US Census Bureau. Retrieved July, Vol. 31, p. 2006.
Jackson, C. Kirabo (2009) “Student Demographics, Teacher Sorting, and Teacher Quality: Ev-idence from the End of School Desegregation,” Journal of Labor Economics, Vol. 27, No.2, pp. 213–256, DOI: 10.1086/599334.
Jacobson, Louis S, Robert J LaLonde, and Daniel G Sullivan (1993) “Earnings losses of displacedworkers,” The American economic review, pp. 685–709.
Johnson, Rucker C. (2015) “Long-run Impacts of School Desegregation & School Quality onAdult Attainments,” NBER Working Papers 16664, National Bureau of Economic Re-search, Inc, URL: https://ideas.repec.org/p/nbr/nberwo/16664.html.
Johnson, Rucker C (2019) Children of the dream: Why school integration works: Hachette UK.
Kremer, Michael and Eric Maskin (1996) “Wage Inequality and Segregation by Skill,” NBERWorking Papers 5718, National Bureau of Economic Research, Inc.
Ladd, Helen F. and Mavzuna Turaeva (2020) “Parental preferences for charter schools in NorthCarolina: Implications for racial segregation and isolation,” Working Paper 195, Annen-berg Institute at Brown University, URL: http://www.edworkingpapers.com/ai20-195.
Lake, R (2017) “Associated Press Blames Public Charter Schools for America’s SegregatedCities.”
Liebowitz, D (2017) “Ending to what end? The impact of the termination of court-desegregationorders on residential segregation and school dropout rates,” Educational Evaluation andPolicy Analysis, Vol. 40, No. 1, pp. 103–128.
Logan, John (2002) “Choosing Segregation: Racial Imbalance in American Public Schools, 1990-2000,”Technical report, Lewis Mumford Center for Comparative Urban and Regional Re-search, SUNY Albany.
(2004) “Resegregation in American public schools? Not in the 1990s,”Technical report,Lewis Mumford Center for Comparative Urban and Regional Research, SUNY Albany.
Logan, John and D Oakley (2004) “The continuing legacy of the Brown decision: court action andschool segregation 1960-2000,”Technical report, Lewis Mumford Center for ComparativeUrban and Regional Research, SUNY Albany.
32

Lutz, B (2011) “The end of court-ordered desegregation,” American Economic Journal Policy,Vol. 3, No. 2, pp. 130–68.
Marcotte, Dave E and Kari Dalane (2019) “Socioeconomic segregation and school choice inAmerican public schools,” Educational Researcher, Vol. 48, No. 8, pp. 493–503.
Monarrez, Tomas (2020) “School Attendance Boundaries and the Segregation of Public Schoolsin the US,” Working Paper.
Moreno, I (2017) “US charter schools put growing numbers in racial isolation.”
Orfield, Gary, E Jongyeon, E Frankenberg, and G Siegel-Hawley (2016) “Brown at 62:School Segregation by Race, Poverty and State.,”Technical report, The Civil RightsProject/Proyecto Derechos Civiles at UCLA.
Potter, H and K Quick (2018) “Diverse-by-design charter schools,”Technical report, The CenturyFoundation.
Reardon, Sean and Demetra Kalogrides (2019) “The geography of racial/ethnic test score gaps,”American Journal of Sociology, Vol. 124, No. 2, pp. 1164–1221.
Reardon, Sean and Ann Owens (2014) “60 Years After Brown: Trends and Consequences ofSchool Segregation,” Annual Review of Sociology, No. 40, pp. 199–218.
Reardon, Sean, John Yun, and Tamela McNulty (2000) “The Changing Structure of SchoolSegregation: Measurement and Evidence of Multi-racial Metropolitan Area School Segre-gation, 1989–1995,” Demography.
Reber, Sarah (2005) “Court-Ordered Desegregation Successes and Failures Integrating AmericanSchools since Brown versus Board of Education,” Journal of Human Resources, Vol. 40,No. 3, pp. 559–590.
Reber, Sarah J (2010) “School desegregation and educational attainment for blacks,” Journal ofHuman resources, Vol. 45, No. 4, pp. 893–914.
Ritter, G, N Jensen, Brian Kisida, and D Bowen (2014) “Urban school choice and integration:The effect of charter schools in Little Rock,” Education and Urban Society, Vol. 48, No.6, pp. 535–555.
Rothstein, Jesse M. (2006) “Good Principals or Good Peers? Parental Valuation of SchoolCharacteristics, Tiebout Equilibrium, and the Incentive Effects of Competition amongJurisdictions,” American Economic Review, Vol. 96, No. 4, pp. 1333–1350.
Sandler, Danielle and Ryan Sandler (2013) “Multiple Event Studies in Public Finance and LaborEconomics: A Simulation Study with Applications,” SSRN.
Schelling, Thomas C (1972) “A process of residential segregation: neighborhood tipping,” Racialdiscrimination in economic life, Vol. 157, p. 174.
33
Stroub, J and Meredith Richards (2013) “From resegregation to reintegration: Trends in theracial/ethnic segregation of metropolitan public schools, 1993-2009,” American Educa-tional Research Journal, Vol. 50, No. 3, pp. 497–531.
U.S. Department of Education (2017) “Digest of Education Statistics,” Table 206.40, NationalCenter for Education Statistics, URL: https://nces.ed.gov/programs/digest/d17/tables/dt17_206.40.asp?referer=schoolchoice.
Vigdor, J (2011) School desegregation and the black-white test score gap, pp. 443–64, WhitherOpportunity: Rising Inequality, Schools, and Children’s Life Chances: Russell Sage Foun-dation.
Walker, T (2018) “Racial Isolation of Charter School Students Exacerbating Resegregation.”
Walters, Christopher R. (2018) “The Demand for Effective Charter Schools,” Journal of PoliticalEconomy, Vol. 126, No. 6, pp. 2179–2223, DOI: 10.1086/699980.
Welch, Finis (1987) New evidence on school desegregation, Vol. 92: Prepared for the UnitedStates Commission on Civil Rights [by] Unicon . . . .
Whitehurst, G, Richard Reeves, Nathan Joo, and Edward Rodriguez (2017) “Balancing act:Schools, Neighborhoods, and racial imbalance.,”Technical report, The Brookings Institu-tion.
Winters, M (2015) “Narrowing the charter-enrollment gap: Denver’s common-enrollment sys-tem,” Civic Report 106, Manhattan Institute.
Zimmer, R, B Gill, K Booker, S Lavertu, T Sass, and Witte (2009) “Charter schools in eightstates: Effects on achievement, attainment, integration, and competition,”Technical re-port, RAND Corporation.
34

Figure 1: Mean Charter Share of Total Public School Enrollment 1998-2018
0
5
10
15
Ave
rage
Ch
arte
r Sh
are
(%)
2000 2005 2010 2015 2020
National Districts with charters
Note: Observations are weighted by enrollment. Districts with charters are those that have nonzero enrollmentin a charter school during the entire sample period.
35

Figure 2: Trend in School Segregation Across Geographies and Racial Groups
01
02
03
04
0A
vera
ge S
egre
gati
on
2000 2005 2010 2015 2020
School Districts
01
02
03
04
0A
vera
ge S
egre
gati
on
2000 2005 2010 2015 2020
Municipalities
01
02
03
04
0A
vera
ge S
egre
gati
on
2000 2005 2010 2015 2020
Counties
01
02
03
04
0A
vera
ge S
egre
gati
on
2000 2005 2010 2015 2020
Metropolitan Areas
Black or Hispanic Black Hispanic White Asian
Note: Observations are weighted by enrollment. Segregation is defined with the variance ratio index (equation(1) in the text). See notes in Table 2 for geographic definitions.
36
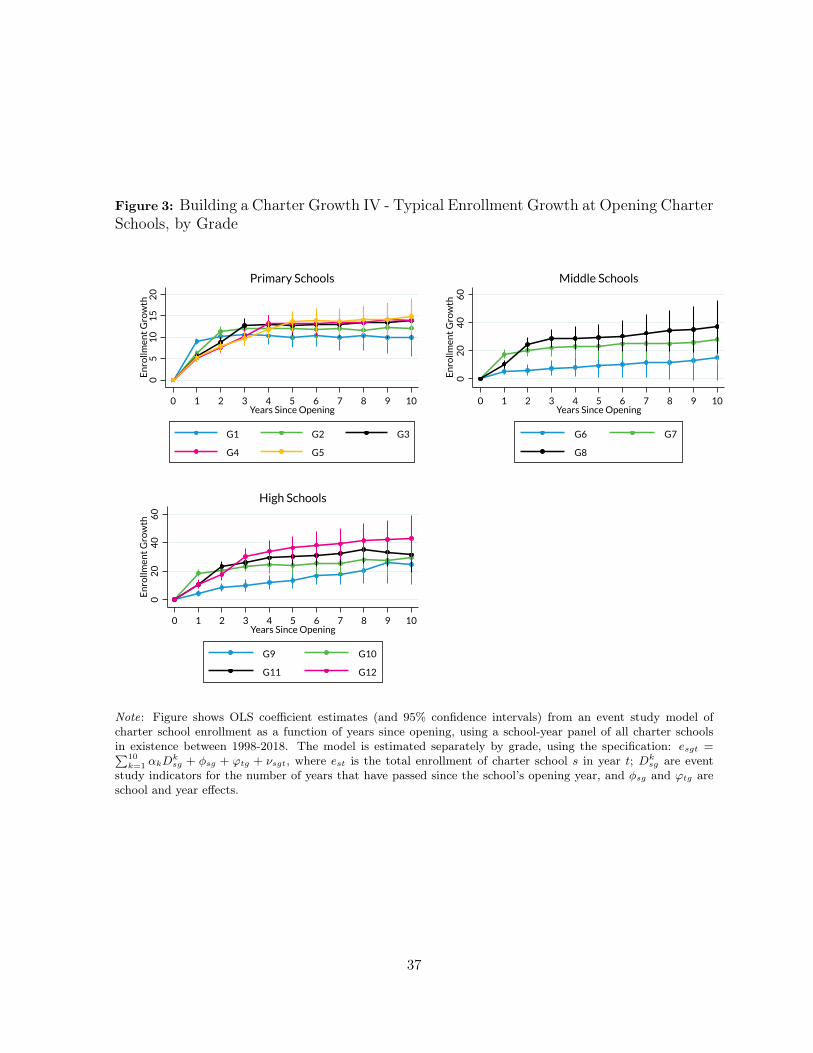
Figure 3: Building a Charter Growth IV - Typical Enrollment Growth at Opening CharterSchools, by Grade
05
10
15
20
En
rollm
ent
Gro
wth
0 1 2 3 4 5 6 7 8 9 10Years Since Opening
G1 G2 G3
G4 G5
Primary Schools
02
04
06
0E
nro
llmen
t G
row
th
0 1 2 3 4 5 6 7 8 9 10Years Since Opening
G6 G7
G8
Middle Schools
02
04
06
0E
nro
llmen
t G
row
th
0 1 2 3 4 5 6 7 8 9 10Years Since Opening
G9 G10
G11 G12
High Schools
Note: Figure shows OLS coefficient estimates (and 95% confidence intervals) from an event study model ofcharter school enrollment as a function of years since opening, using a school-year panel of all charter schoolsin existence between 1998-2018. The model is estimated separately by grade, using the specification: esgt =∑10
k=1 αkDksg + φsg + ϕtg + νsgt, where est is the total enrollment of charter school s in year t; Dk
sg are eventstudy indicators for the number of years that have passed since the school’s opening year, and φsg and ϕtg areschool and year effects.
37

Figure 4: Distributed Lag Models of Segregation
-.05
0.0
5.1
.15
Co
effi
cien
t E
stim
ate
-5 -4 -3 -2 -1 0 1 2 3 4 5Leads of Charter Percent Lags of Charter Percent
School Districts
-.05
0.0
5.1
Co
effi
cien
t E
stim
ate
-5 -4 -3 -2 -1 0 1 2 3 4 5Leads of Charter Percent Lags of Charter Percent
Municipalities
-.05
0.0
5.1
.15
Co
effi
cien
t E
stim
ate
-5 -4 -3 -2 -1 0 1 2 3 4 5Leads of Charter Percent Lags of Charter Percent
Counties
-.1-.0
50
.05
.1C
oef
fici
ent
Est
imat
e
-5 -4 -3 -2 -1 0 1 2 3 4 5Leads of Charter Percent Lags of Charter Percent
Metropolitan Areas
No Time-Varying Controls Leads and Lags of Time-Varying Controls
Note: Figure shows coefficient estimates from the distributed lag model defined in equation (3). 95% confidenceintervals are based on standard errors clustered at the school system level. Panels show estimates for differentgeographic samples, see Table 2 for detailed definitions and sample restrictions. Covariates that vary at thesystem-grade-year level include: log total enrollment, group’s share of total enrollment, and total number ofschools serving grade.
38
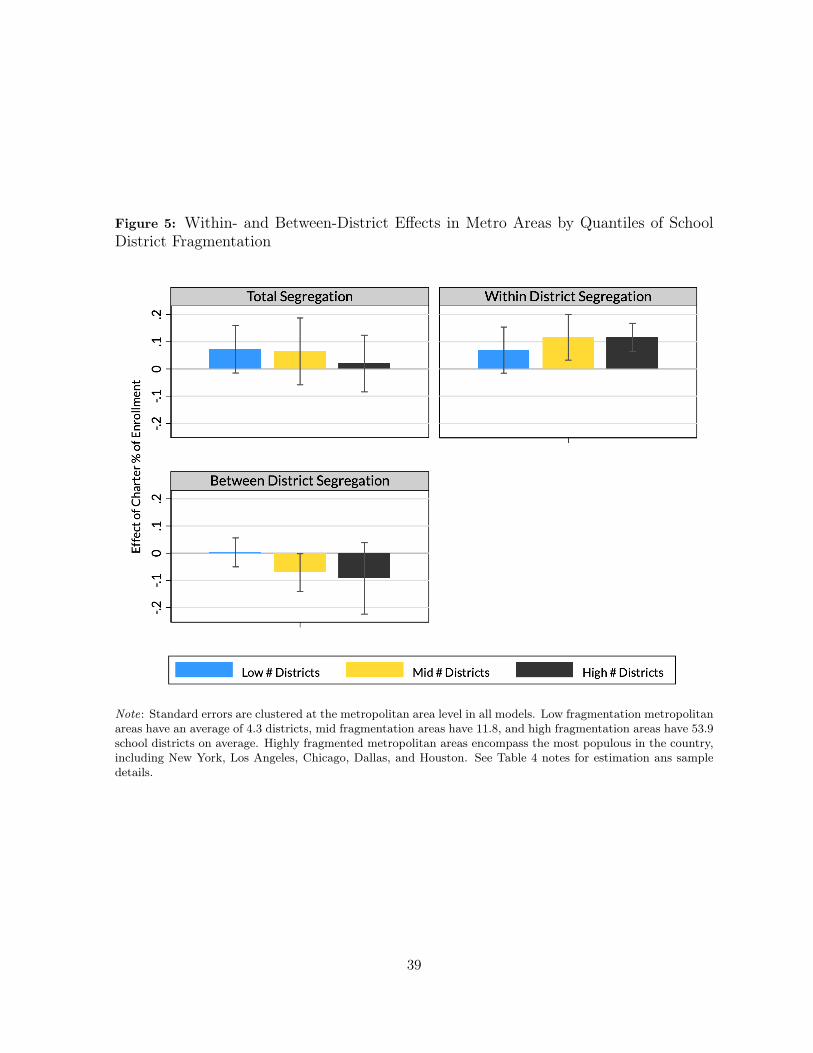
Figure 5: Within- and Between-District Effects in Metro Areas by Quantiles of SchoolDistrict Fragmentation
Note: Standard errors are clustered at the metropolitan area level in all models. Low fragmentation metropolitanareas have an average of 4.3 districts, mid fragmentation areas have 11.8, and high fragmentation areas have 53.9school districts on average. Highly fragmented metropolitan areas encompass the most populous in the country,including New York, Los Angeles, Chicago, Dallas, and Houston. See Table 4 notes for estimation ans sampledetails.
39

Figure 6: The Effect of Charter Schools on Segregation, District Heterogeneity by State
AKARAZCACOCTDEFL
GAIDIL
INKSLA
MAMDMEMI
MNMONCNHNJ
NMNVNYOHOKORPARI
SCTNTXUTWI
-1 -.75 -.5 -.25 0 .25 .5 .75 1Coefficient on Charter Percent Interaction
Black or HispanicAKARAZCACOCTDEFL
GAIDIL
INKSLA
MAMDMEMI
MNMONCNHNJ
NMNVNYOHOKORPARI
SCTNTXUTWI
-1 -.75 -.5 -.25 0 .25 .5 .75 1Coefficient on Charter Percent Interaction
Black
AKARAZCACOCTDEFL
GAIDIL
INKSLA
MAMDMEMI
MNMONCNHNJ
NMNVNYOHOKORPARI
SCTNTXUTWI
-1 -.75 -.5 -.25 0 .25 .5 .75 1Coefficient on Charter Percent Interaction
HispanicAKARAZCACOCTDEFL
GAIDIL
INKSLA
MAMDMEMI
MNMONCNHNJ
NMNVNYOHOKORPARI
SCTNTXUTWI
-1 -.75 -.5 -.25 0 .25 .5 .75 1Coefficient on Charter Percent Interaction
White
Note: Standard errors are clustered at the school district level. Estimation sample is restricted to states thathave at least 1% of total enrollment at charter schools at some point during the period 1998-2015. All modelscontrol for system-year, system-grade, and grade-year fixed effects, as well as log enrollment, group share ofenrollment and number of schools.
40

Figure 7: Potential Mediators of Effect Heterogeneity by State
AKAR
AZCACO
CT
DEFL
GA ID
IL
IN
KS
LA
MA
MD
MI
MN
MO
NC
NHNJ
NMNV
NY
OH
OK
ORPA
RI
SC
TNTX
UTWI
b = .25 (.08)
-.20
.2.4
.6B
eta
0 .2 .4 .6 .8 1Urban Share of Charter Enrollment
Black
AK ARAZ
CA
CO
CT
DEFL GA
IDIL
IN
KS
LA
MA
MD
MI
MN
MO
NC
NH
NJ
NM
NV
NY
OH
OK
ORPA
RI
SC
TN
TXUT
WI
b = .14 (.07)
-.20
.2.4
.6B
eta
0 .2 .4 .6 .8 1Urban Share of Charter Enrollment
White
AKARAZ
CACO
CTDEFL
GA
ID
IL
INKS
LAMA
MD
MIMN
MONC
NHNJ
NM
NV
NY
OH
OK
OR PA
RI
SC
TN
TXUT WI
b = .08 (.06)
-.20
.2.4
.6B
eta
0 .2 .4 .6 .8 1Urban Share of Charter Enrollment
Hispanic
AKAR
AZ CACO
CT
DEFL
GAID
IL
IN
KS
LA
MA
MD
MI
MN
MO
NC
NHNJ
NM NV
NY
OH
OK
ORPA
RI
SC
TNTX
UTWI
b = .05 (.03)
-.20
.2.4
.6B
eta
0 1 2 3 4Relative Share of Charter Enrollment
Black
AKARAZ
CA
CO
CT
DEFLGA
IDIL
IN
KS
LA
MA
MD
MI
MN
MO
NC
NH
NJ
NM
NV
NY
OH
OK
ORPA
RI
SC
TN
TXUT
WI
b = -.04 (.06)
-.20
.2.4
.6B
eta
0 .5 1 1.5Relative Share of Charter Enrollment
White
AKAR AZ
CACO
CTDEFL
GA
ID
IL
INKS
LAMA
MD
MIMN
MONC
NHNJ
NM
NV
NY
OH
OK
OR PA
RI
SC
TN
TXUT WI
b = .05 (.04)
-.20
.2.4
.6B
eta
0 .5 1 1.5 2 2.5Relative Share of Charter Enrollment
Hispanic
Note: The vertical axis shows the state-specific estimate of the effect of charters on the segregation of a givengroup. The horizontal axis plots the group’s relative share of charter enrollment, defined as the ratio of the groupshare of total charter enrollment to their share of total public school population.
41

Table 1: 2010 Census Tract Characteristics for Charter Schools and Traditional PublicSchools (TPS)
Primary Middle High
Charter TPS Charter TPS Charter TPS
School CharacteristicsTotal enrollment 353.94 552.00 262.16 769.58 312.02 1356.25% black 0.35 0.23 0.36 0.23 0.26 0.28% hispanic 0.25 0.32 0.34 0.30 0.31 0.26% white 0.32 0.35 0.24 0.39 0.34 0.37
Census Tract Characteristics% black 0.25 0.19 0.28 0.17 0.18 0.20% hispanic 0.24 0.24 0.28 0.23 0.27 0.21% white 0.44 0.50 0.36 0.53 0.46 0.51% adults with college 0.25 0.27 0.24 0.28 0.25 0.28Median income 47558.17 55602.07 45053.10 56633.42 46319.76 54053.52
Observations 1958 19750 512 5174 809 4266
Note: SY 2010-11 NCES Common Core of Data geomatched to 2010 US census tract tabulations.
42

Table 2: 2018 Summary Statistics of System-Grade Estimation Samples
School Districts Municipalities Counties Metro Areas
Mean SD Mean SD Mean SD Mean SD
PopulationNumber of schools 97.8 (182.9) 92.2 (176.3) 252.1 (403.1) 878.3 (860.2)Enrollment (1000’s) 6.3 (13.8) 5.9 (13.9) 13.8 (21.9) 50.0 (54.0)
Charter SchoolsNumber of charters 18.0 (46.6) 17.5 (43.4) 36.9 (78.5) 93.3 (104.5)
% of system 10.4 (12.1) 10.7 (12.8) 8.9 (9.4) 10.0 (7.4)Enrollment (thousands) 0.9 (2.3) 0.8 (2.2) 1.5 (3.3) 4.1 (5.0)
% of system 8.1 (11.6) 8.3 (12.4) 6.7 (8.2) 7.4 (5.9)predicted % 6.3 (10.1) 6.5 (10.8) 5.3 (7.4) 5.7 (5.4)
Racial Composition (%)Black 17.3 (18.2) 17.1 (18.8) 15.0 (15.2) 15.9 (11.6)Hispanic 30.4 (24.4) 30.9 (24.5) 27.5 (21.7) 29.5 (20.6)Asian 6.0 (8.3) 6.4 (8.6) 5.5 (6.2) 6.1 (5.1)White 41.1 (26.0) 40.4 (26.3) 46.7 (24.4) 43.5 (18.8)
SegregationBlack or Hispanic (URM)
Variance ratio 13.3 (12.5) 13.7 (13.6) 22.0 (14.7) 31.4 (12.7)Dissimilarity 31.6 (17.0) 31.7 (18.3) 42.5 (14.9) 50.8 (10.8)Isolation 53.3 (27.2) 53.8 (27.6) 53.6 (24.7) 62.2 (16.9)
BlackVariance ratio 10.3 (13.8) 9.6 (13.6) 14.5 (15.2) 23.3 (16.0)Dissimilarity 34.0 (18.3) 33.1 (18.9) 43.7 (15.3) 50.6 (11.7)Isolation 24.3 (23.0) 23.7 (23.0) 25.8 (21.9) 34.3 (20.3)
HispanicVariance ratio 10.2 (11.6) 10.3 (12.1) 15.0 (12.2) 19.8 (11.2)Dissimilarity 28.8 (15.7) 28.3 (16.4) 36.8 (13.1) 41.8 (9.8)Isolation 36.5 (25.8) 37.0 (26.3) 36.9 (24.4) 42.4 (22.0)
AsianVariance ratio 5.5 (7.5) 5.9 (8.1) 8.0 (8.5) 11.6 (8.8)Dissimilarity 38.5 (19.3) 37.7 (19.7) 45.4 (14.6) 49.1 (10.1)Isolation 11.1 (12.2) 11.8 (12.6) 12.8 (12.1) 16.7 (11.7)
WhiteVariance ratio 11.7 (10.8) 11.9 (11.5) 19.5 (12.2) 27.8 (10.5)Dissimilarity 31.3 (18.0) 31.6 (19.1) 40.7 (15.0) 48.5 (10.0)Isolation 49.0 (22.7) 48.5 (23.0) 58.3 (19.4) 59.3 (15.8)
Unique Systems 5,325 5,610 2,741 330Total Obs. 42,921 44,576 28,599 4,290
Note: Observations are weighted by total enrollment. School district identifiers correspond to NCES geo-graphic local education agencies. Charter schools are geo-matched to agency jurisdiction GIS data usingtheir geo-located street address. Municipalities are defined using 2010 U.S. Census Place geographies, whichinclude all incorporated cities and townships, as well as unincorporated populated areas. Both school dis-tricts and counties generate a full cover of the country’s geography and schools, but Census Places andmetropolitan are not. Metropolitan areas are defined according to 2010 U.S. Census CBSA definitions; theydo not include micropolitan areas, and are not a full cover of the US. School systems with a single schoolserving a given grade are not included in the sample. School systems that are singleton in terms of the fixedeffects in the regression model defined in equation (2) are also not included in this sample.
43

Table 3: The Effect of Charter Schools on Segregation by Geography and Racial Group
Black or Hispanic School Districts Municipalities Counties Metro Areas
(1) (2) (3) (4) (5) (6) (7) (8)OLS IV OLS IV OLS IV OLS IV
Charter percent 0.094*** 0.093*** 0.078*** 0.089*** 0.103*** 0.113*** 0.059** 0.082***(0.009) (0.012) (0.010) (0.012) (0.019) (0.024) (0.026) (0.031)
Black School Districts Municipalities Counties Metro Areas
(1) (2) (3) (4) (5) (6) (7) (8)OLS IV OLS IV OLS IV OLS IV
Charter percent 0.073*** 0.088*** 0.059*** 0.070*** 0.088*** 0.107*** 0.045* 0.064**(0.009) (0.012) (0.007) (0.009) (0.021) (0.027) (0.026) (0.032)
Hispanic School Districts Municipalities Counties Metro Areas
(1) (2) (3) (4) (5) (6) (7) (8)OLS IV OLS IV OLS IV OLS IV
Charter percent 0.044*** 0.036*** 0.041*** 0.049*** 0.045*** 0.048*** 0.041** 0.049**(0.005) (0.007) (0.007) (0.009) (0.013) (0.016) (0.019) (0.023)
Asian School Districts Municipalities Counties Metro Areas
(1) (2) (3) (4) (5) (6) (7) (8)OLS IV OLS IV OLS IV OLS IV
Charter percent 0.034*** 0.038*** 0.023*** 0.023*** 0.023*** 0.015* 0.032** 0.030*(0.006) (0.007) (0.005) (0.005) (0.007) (0.008) (0.014) (0.017)
White School Districts Municipalities Counties Metro Areas
(1) (2) (3) (4) (5) (6) (7) (8)OLS IV OLS IV OLS IV OLS IV
Charter percent 0.085*** 0.085*** 0.071*** 0.083*** 0.099*** 0.108*** 0.062** 0.092***(0.009) (0.012) (0.009) (0.012) (0.020) (0.023) (0.026) (0.034)
Dep. Var. Mean 12.64 12.97 21.61 32.68DWH Endog. Test (p-val) .973 .027 .247 .027System-Year FE X X X X X X X XSystem-Grade FE X X X X X X X XState-Grade-Year FE X X X X X X X XCovariates X X X X X X X XN 831,042 831,042 847,078 847,078 554,162 554,162 86,212 86,212
Note: Standard errors are clustered at the school system level in all models. Dependent variable means corre-spond to White segregation levels (approximately equal to mean Black or Hispanic segregation). Covariatesthat vary at the system-grade-year level include: log total enrollment, group’s share of total enrollment, andtotal number of schools serving grade. See notes in Table 2 for the geographic definition of estimation sam-ples. IV models use the predicted charter share of enrollment as the instrument, defined using the typicalgrowth estimates shown in Figure 3. See equation (4) in the main text. The p-value of the Durbin-Wu-Hausman (DWH) test of endogeneity (equality between OLS and IV coefficients) for the URM (Black orHispanic) segregation specifications is reported.
44

Table 4: Decomposition of Charter Schools’ Effect on Metropolitan Area Segregation
Black or Hispanic Total MA Segregation Within District Segregation Between District Segregation
(1) (2) (3) (4) (5) (6)OLS IV OLS IV OLS IV
Charter percent 0.059** 0.082*** 0.108*** 0.113*** -0.053*** -0.042**(0.026) (0.031) (0.023) (0.027) (0.019) (0.018)
Black Total MA Segregation Within District Segregation Between District Segregation
(1) (2) (3) (4) (5) (6)OLS IV OLS IV OLS IV
Charter percent 0.045* 0.064** 0.067*** 0.070*** -0.037** -0.025*(0.026) (0.032) (0.018) (0.021) (0.017) (0.015)
Hispanic Total MA Segregation Within District Segregation Between District Segregation
(1) (2) (3) (4) (5) (6)OLS IV OLS IV OLS IV
Charter percent 0.041** 0.049** 0.061*** 0.065*** -0.015 -0.012(0.019) (0.023) (0.019) (0.024) (0.011) (0.013)
Asian Total MA Segregation Within District Segregation Between District Segregation
(1) (2) (3) (4) (5) (6)OLS IV OLS IV OLS IV
Charter percent 0.032** 0.030* 0.032*** 0.033** -0.004 -0.008(0.014) (0.017) (0.010) (0.014) (0.008) (0.008)
White Total MA Segregation Within District Segregation Between District Segregation
(1) (2) (3) (4) (5) (6)OLS IV OLS IV OLS IV
Charter percent 0.062** 0.092*** 0.104*** 0.117*** -0.040** -0.025(0.026) (0.034) (0.026) (0.031) (0.018) (0.020)
Dep. Var. Mean 32.68 10.65 24.15District-Year FE X X X X X XDistrict-Grade FE X X X X X XState-Grade-Year FE X X X X X XCovariates X X X X X XN 86,212 86,212 86,212 86,212 86,212 86,212
Note: Standard errors are clustered at the metropolitan area level in all models. Dependent variable meanscorrespond to White segregation levels (approximately equal to mean Black or Hispanic segregation). Withindistrict segregation is defined as average school district segregation within the metropolitan area. Betweendistrict segregation is defined by assuming schools are perfectly representative of school district composition,but not necessarily metro composition. Covariates that vary at the system-grade-year level include: log totalenrollment, group’s share of total enrollment, and total number of schools serving grade. See notes in Table2 for the geographic definition of estimation samples. IV models use the predicted charter share of enroll-ment as the instrument, defined using the typical growth estimates shown in Figure 3. See equation (4) inthe main text.
45

Table 5: Mechanisms of Between-District Metropolitan Area Effects
White Large Urban Districts Other Urban/Suburban Districts
(1) (2) (3) (4) (5) (6)Share Isolation Var. Ratio Share Isolation Var. Ratio
Own charter percent 0.063*** 0.063** 0.094*** -0.017 0.044*** 0.082***(0.020) (0.025) (0.030) (0.018) (0.007) (0.012)
Other urban/suburban charter percent 0.024 -0.001 0.003(0.016) (0.019) (0.024)
Large urban charter percent -0.013** 0.001 0.005(0.006) (0.004) (0.008)
Total obs. 71,746 71,746 71,746 479,529 479,529 479,529
Black Large Urban Districts Other Urban/Suburban Districts
(1) (2) (3) (4) (5) (6)Share Isolation Var. Ratio Share Isolation Var. Ratio
Own charter percent -0.026 0.045*** 0.071*** 0.050*** 0.048*** 0.073***(0.017) (0.012) (0.027) (0.016) (0.008) (0.012)
Other urban/suburban charter percent 0.016 0.004 0.007(0.011) (0.011) (0.018)
Large urban charter percent -0.014*** 0.001 0.001(0.005) (0.006) (0.009)
Total obs. 71,746 71,746 71,746 479,529 479,529 479,529
Hispanic Large Urban Districts Other Urban/Suburban Districts
(1) (2) (3) (4) (5) (6)Share Isolation Var. Ratio Share Isolation Var. Ratio
Own charter percent -0.005 0.028** 0.044*** -0.023** 0.031*** 0.047***(0.013) (0.012) (0.015) (0.009) (0.004) (0.007)
Other urban/suburban charter percent -0.021 -0.001 0.005(0.013) (0.012) (0.018)
Large urban charter percent 0.016*** 0.006* 0.008*(0.005) (0.003) (0.005)
Total obs. 71,746 71,746 71,746 479,529 479,529 479,529
Note: All models control for district-year, district-grade, and grade-year fixed effects, as well as log total en-rollment, group’s share of enrollment, and total number of schools serving the grade. Estimation sample incolumns (1) through (3) is a panel of district-grade-years in metropolitan areas, restricted to districts thatare large and urban, which is defined as being in the 75th percentile of the within-metro distribution of totaldistrict enrollment in 2010. Estimation panel samples in columns (4) through (6) include all suburban dis-trict in metropolitan areas, as well as the complement of large urban districts (’non-large’ urban districts).Standard errors are clustered at the school district level in all models.
46

Table 6: Effect Heterogeneity by Baseline District Characteristics
White (1) (2) (3) (4) (5)All All Urban Suburb Town/Rural
Charter % 0.096*** 0.055*** 0.003 0.144*** 0.038***(0.019) (0.013) (0.017) (0.042) (0.012)
Charter % × Suburb -0.002(0.025)
Charter % × Town/Rural -0.027(0.022)
Charter % × Mid URM Share 0.023 0.124*** -0.050 0.002(0.018) (0.032) (0.048) (0.017)
Charter % × High URM Share 0.047** 0.098*** -0.061 0.084***(0.021) (0.035) (0.049) (0.029)
Black (1) (2) (3) (4) (5)All All Urban Suburb Town/Rural
Charter % 0.066*** 0.041*** 0.017 0.051* 0.043**(0.015) (0.014) (0.011) (0.028) (0.021)
Charter % × Suburb 0.029(0.024)
Charter % × Town/Rural -0.010(0.018)
Charter % × Mid URM Share 0.036 0.062** 0.083* -0.030(0.022) (0.027) (0.047) (0.023)
Charter % × High URM Share 0.042** 0.052** 0.021 0.066**(0.020) (0.023) (0.038) (0.032)
Hispanic (1) (2) (3) (4) (5)All All Urban Suburb Town/Rural
Charter % 0.053*** 0.028*** 0.015 0.070** 0.011(0.009) (0.009) (0.010) (0.030) (0.008)
Charter % × Suburb -0.001(0.013)
Charter % × Town/Rural -0.025**(0.011)
Charter % × Mid URM Share 0.007 0.046** -0.049 0.020*(0.011) (0.018) (0.032) (0.012)
Charter % × High URM Share 0.029** 0.039** 0.002 0.019(0.012) (0.017) (0.034) (0.013)
District-Year FE X X X X XDistrict-Grade FE X X X X XState-Grade-Year FE X X X X XCovariates X X X X XR2 0.911 0.911 0.951 0.906 0.830N 831,042 831,042 154,980 310,922 363,309
Note: Standard errors are clustered at the school district level in all models. Covariates include log total en-rollment, number of schools, and group’s share of grade enrollment. Baseline URM total enrollment sharecategories are based on three quantiles of the 2010 distribution of total district enrollment.
47

A Placebo Test
Our main identification strategy relies on a generalized differences-in-differences design linkingchanges in charter share of district-grade enrollment to changes in district-grade segregation.This method identifies the effect of charters using between-grade comparisons within districtsthat see differing levels of charter penetration at different grade levels over time. However, itis possible that unobserved factors are simultaneously associated with charter school growth inparticular grade levels and with corresponding increases in segregation. Though our methodinherently addresses many potential confounding explanations, we test the validity of theseassumptions with an informative robustness check.
We conduct a placebo test exploiting the structure of our district-by-grade-by-year leveldataset. The placebo test is based on the notion that increases in charter percent of enrollmentin, say, primary schools should not have a direct contemporaneous impact on the racial segre-gation of high schools. We conduct this test by restructuring our data wide by grade, resultingin a district-year panel with segregation and charter enrollment measured for different gradelevels. We then estimate the following class of models:
Y git =
12∑g=0
βgEgit +X
′itΓ + τi + δs(i)t + εit (7)
where Egit is charter percent of enrollment for groups of school grades g = 0, 1, 2, ..., 12, and grade
0 corresponds to kindergarten (KG). The models control for district fixed effects, state-by-yeareffects, and separately for each grade: number of schools, log total enrollment, and share Blackor Hispanic.
When estimating models of segregation in grade g, the test requires estimates of βg similarto our main estimates (assuming between-grade effect heterogeneity is minimal) and null effectsfor any βg′ with g 6= g′. However, one could also imagine that off-diagonal coefficients withg′ < g (the lower triangle in table A2) could capture "preemptive effects", where student sortingpatterns react to the growth of charter schools in higher grades as families choose the educationaltrajectory of their children. Under this view, significant patterns in the upper-triangle of theplacebo test matrix are more worrisome in terms of threats to our research design, as they cannotbe explained by preemptive behavior and are more likely to be an indication of endogeneity ofthe treatment variable.
The results of the placebo test in Table A2 provide strong evidence that the relationships wehave identified in our main models are well-identified causal relationships. Across 169 coefficientsin 13 separate models, the results are generally significant where one would expect them to beif the effect was strictly contemporaneous, unbiased, and under minimal preemptive effects.For grades 4 through 12, the estimated effect of the own-grade (the diagonal of the matrix) arepositive, of similar magnitude to our main estimates, and statistically significant. This is not thecase for earlier grades, suggesting that there are smaller effects at the earliest elementary schoolgrades. In contrast, the off-diagonal elements are of smaller magnitude and not statisticallydifferent from zero in the vast majority of cases. In the lower-triangle, only 3 coefficients are
48

significant at the 5% level; In the upper-triangle, 4 coefficients are.
We formalize the placebo test by computing an F-statistic for the joint significance of theupper- and lower-triangle coefficients, separately. We report the p-values for these tests at thebottom of Table A2. Encouragingly, a large majority of these tests come back insignificant atconventional levels of statistical confidence. For about 3 or 4 of these models, we find that thelower triangle is jointly significant, depending on the level of confidence. These are concentratedat the high school level, consistent with preemptive sorting effects for charter high schools. Onthe other hand, none of the F-tests are significant for the upper triangle.
Altogether, the breadth of the evidence suggests that our models "pass the placebo" test,providing further evidence and confidence that our estimates can be interpreted causally withoutmajor reservations.
49

Figure A.1: Mechanical Effect of School Additions on Segregation Index
b = .064
01
23
4V
aria
nce
Rat
io In
dex
10 20 30 40 50Number of Schools
Very Small School System, N = 1,000
b = .017
01
23
4V
aria
nce
Rat
io In
dex
40 60 80 100 120 140Number of Schools
Small School System, N = 6,000
b = .007
01
23
4V
aria
nce
Rat
io In
dex
150 200 250 300 350Number of Schools
Midsize School System, N = 15,000
b = .002
01
23
4V
aria
nce
Rat
io In
dex
500 600 700 800 900 1000Number of Schools
Large School System, N = 50,000
Note: Figure shows simulations of school segregation with random school assignment, for hypothetical schoolsystems of different total population. It is assumed 50% of the population is from the "minority" group. Sim-ulations gradually increase the number of schools in the system. Every time a school is added, random schoolassignment is conducted.
50

Figure A.2: Distribution of Charter School Opening and Closing Events
05
00
10
00
15
00
Nu
m. S
cho
ols
1995 2000 2005 2010 2015 2020Year
School Opening Years
05
00
10
00
15
00
Nu
m. S
cho
ols
1995 2000 2005 2010 2015Year
School Closing Years0
50
01
00
01
50
0N
um
. Sch
oo
ls
0 5 10 15 20Number of Years
Age of Non-Closing Schools
05
00
10
00
15
00
Nu
m. S
cho
ols
0 5 10 15 20Number of Years
Age of Closing Schools
Note: School-level histograms of the cross-section of all charter schools in operation between 1998-2018. The topleft panel shows the distribtuion of charter opening years, the first year they report enrollment to the CommonCore of Data. The bottom left panel shows the distribution of current age of charter school that have not ceasedoperations. The right top panel shows the distribution of charter closure years. The bottom right panel showsthe age of charter schools that close prior to 2018.
51

Figure A.3: Reduced Form Pre-Trend Test – Distributed Lag Models of Segregation andPredicted Charter Percent
0.0
2.0
4.0
6.0
8C
oef
fici
ent
Est
imat
e
-5 -4 -3 -2 -1 0 1 2 3 4 5Leads of Predicted Charter % Lags of Predicted Charter %
School Districts
-.02
0.0
2.0
4.0
6.0
8C
oef
fici
ent
Est
imat
e
-5 -4 -3 -2 -1 0 1 2 3 4 5Leads of Predicted Charter % Lags of Predicted Charter %
Municipalities
-.05
0.0
5.1
.15
Co
effi
cien
t E
stim
ate
-5 -4 -3 -2 -1 0 1 2 3 4 5Leads of Predicted Charter % Lags of Predicted Charter %
Counties
-.1-.0
50
.05
.1C
oef
fici
ent
Est
imat
e
-5 -4 -3 -2 -1 0 1 2 3 4 5Leads of Predicted Charter % Lags of Predicted Charter %
Metropolitan Areas
No Time-Varying Controls Leads and Lags of Time-Varying Controls
Note: Distributed lag models. The independent variables are leads and lags of school systems’ predicted charterpercent of enrollment, which is computed using the fitted values from the enrollment growth models shown inFigure 3. Standard errors are clustered at the system level in all specifications.
52
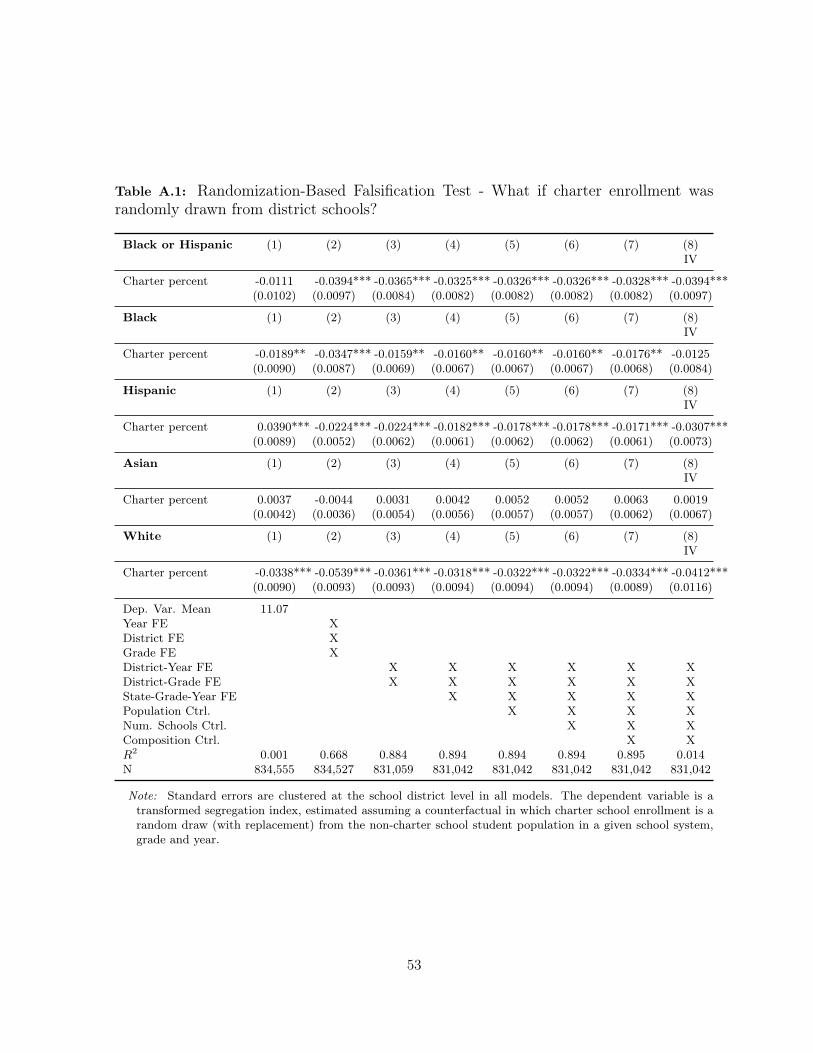
Table A.1: Randomization-Based Falsification Test - What if charter enrollment wasrandomly drawn from district schools?
Black or Hispanic (1) (2) (3) (4) (5) (6) (7) (8)IV
Charter percent -0.0111 -0.0394*** -0.0365*** -0.0325*** -0.0326*** -0.0326*** -0.0328*** -0.0394***(0.0102) (0.0097) (0.0084) (0.0082) (0.0082) (0.0082) (0.0082) (0.0097)
Black (1) (2) (3) (4) (5) (6) (7) (8)IV
Charter percent -0.0189** -0.0347*** -0.0159** -0.0160** -0.0160** -0.0160** -0.0176** -0.0125(0.0090) (0.0087) (0.0069) (0.0067) (0.0067) (0.0067) (0.0068) (0.0084)
Hispanic (1) (2) (3) (4) (5) (6) (7) (8)IV
Charter percent 0.0390*** -0.0224*** -0.0224*** -0.0182*** -0.0178*** -0.0178*** -0.0171*** -0.0307***(0.0089) (0.0052) (0.0062) (0.0061) (0.0062) (0.0062) (0.0061) (0.0073)
Asian (1) (2) (3) (4) (5) (6) (7) (8)IV
Charter percent 0.0037 -0.0044 0.0031 0.0042 0.0052 0.0052 0.0063 0.0019(0.0042) (0.0036) (0.0054) (0.0056) (0.0057) (0.0057) (0.0062) (0.0067)
White (1) (2) (3) (4) (5) (6) (7) (8)IV
Charter percent -0.0338*** -0.0539*** -0.0361*** -0.0318*** -0.0322*** -0.0322*** -0.0334*** -0.0412***(0.0090) (0.0093) (0.0093) (0.0094) (0.0094) (0.0094) (0.0089) (0.0116)
Dep. Var. Mean 11.07Year FE XDistrict FE XGrade FE XDistrict-Year FE X X X X X XDistrict-Grade FE X X X X X XState-Grade-Year FE X X X X XPopulation Ctrl. X X X XNum. Schools Ctrl. X X XComposition Ctrl. X XR2 0.001 0.668 0.884 0.894 0.894 0.894 0.895 0.014N 834,555 834,527 831,059 831,042 831,042 831,042 831,042 831,042
Note: Standard errors are clustered at the school district level in all models. The dependent variable is atransformed segregation index, estimated assuming a counterfactual in which charter school enrollment is arandom draw (with replacement) from the non-charter school student population in a given school system,grade and year.
53

Tab
leA
.2:Placebo
Test
–Effe
ctof
Cha
rterson
SegregationAcrossDifferentScho
olGrade
Levels
(1)
(2)
(3)
(4)
(5)
(6)
(7)
(8)
(9)
(10)
(11)
(12)
(13)
KG
G1
G2
G3
G4
G5
G6
G7
G8
G9
G10
G11
G12
Cha
rter
%KG
-0.05
-0.01
-0.01
-0.01
-0.02
0.01
0.01
-0.01
-0.01
-0.01
-0.04**
-0.03
-0.03*
(0.05)
(0.02)
(0.02)
(0.02)
(0.02)
(0.03)
(0.02)
(0.02)
(0.02)
(0.02)
(0.02)
(0.02)
(0.02)
Cha
rter
%G1
0.02
0.05
-0.04
-0.03
-0.04
-0.04
-0.06*
-0.03
0.01
-0.01
0.04
-0.02
0.01
(0.04)
(0.03)
(0.03)
(0.03)
(0.03)
(0.04)
(0.03)
(0.02)
(0.03)
(0.03)
(0.05)
(0.03)
(0.03)
Cha
rter
%G2
0.13***
0.06*
0.14***
0.01
-0.01
-0.03
0.01
-0.01
-0.04
0.03
0.00
0.04
0.03
(0.04)
(0.03)
(0.03)
(0.03)
(0.03)
(0.03)
(0.03)
(0.03)
(0.03)
(0.03)
(0.04)
(0.03)
(0.04)
Cha
rter
%G3
0.02
0.02
0.02
0.06
0.05
0.03
0.01
0.02
0.01
-0.00
-0.04
-0.01
-0.02
(0.03)
(0.03)
(0.03)
(0.05)
(0.04)
(0.04)
(0.03)
(0.03)
(0.04)
(0.04)
(0.04)
(0.04)
(0.04)
Cha
rter
%G4
-0.02
-0.02
-0.00
0.06**
0.08***
0.03
0.02
0.03
0.02
-0.00
0.06*
0.01
0.03
(0.03)
(0.03)
(0.02)
(0.03)
(0.02)
(0.03)
(0.03)
(0.03)
(0.03)
(0.03)
(0.03)
(0.02)
(0.02)
Cha
rter
%G5
-0.04
-0.02
-0.04
-0.04
-0.01
0.08**
0.01
-0.00
0.01
-0.03
-0.04
-0.01
-0.03
(0.03)
(0.03)
(0.03)
(0.03)
(0.02)
(0.04)
(0.03)
(0.02)
(0.03)
(0.02)
(0.03)
(0.02)
(0.02)
Cha
rter
%G6
0.04
0.01
0.02
0.01
0.01
-0.03
0.07***
-0.02
-0.04
0.00
-0.02
-0.03
-0.02
(0.02)
(0.02)
(0.02)
(0.02)
(0.02)
(0.02)
(0.03)
(0.03)
(0.03)
(0.03)
(0.03)
(0.03)
(0.02)
Cha
rter
%G7
-0.01
0.00
0.03
0.01
0.03
0.03
0.04
0.13***
0.03
-0.02
-0.00
-0.01
0.01
(0.02)
(0.03)
(0.02)
(0.02)
(0.02)
(0.03)
(0.03)
(0.03)
(0.03)
(0.03)
(0.03)
(0.03)
(0.03)
Cha
rter
%G8
-0.02
-0.02
-0.04*
-0.03
-0.03
-0.01
0.01
0.02
0.13***
0.06**
0.05*
0.06**
0.03
(0.02)
(0.03)
(0.02)
(0.02)
(0.02)
(0.02)
(0.03)
(0.03)
(0.03)
(0.03)
(0.03)
(0.03)
(0.03)
Cha
rter
%G9
0.00
-0.00
0.01
0.00
0.01
0.01
0.02
-0.01
0.01
0.13***
0.03*
0.04**
0.05**
(0.02)
(0.02)
(0.02)
(0.02)
(0.02)
(0.02)
(0.02)
(0.02)
(0.02)
(0.02)
(0.02)
(0.02)
(0.02)
Cha
rter
%G10
-0.01
0.01
-0.00
0.01
0.00
0.01
0.01
0.02
0.01
-0.02
0.13***
-0.01
-0.00
(0.02)
(0.02)
(0.02)
(0.02)
(0.02)
(0.02)
(0.02)
(0.02)
(0.02)
(0.03)
(0.03)
(0.03)
(0.03)
Cha
rter
%G11
-0.02
-0.02
-0.01
-0.01
-0.00
0.00
-0.02
0.03
0.03
0.04*
-0.02
0.13***
-0.01
(0.02)
(0.02)
(0.02)
(0.02)
(0.02)
(0.02)
(0.02)
(0.03)
(0.02)
(0.02)
(0.03)
(0.03)
(0.03)
Cha
rter
%G12
0.02
0.03*
0.01
0.01
0.00
-0.00
0.01
-0.01
-0.01
-0.03**
-0.03
-0.05**
0.07***
(0.01)
(0.01)
(0.02)
(0.02)
(0.02)
(0.02)
(0.02)
(0.02)
(0.02)
(0.01)
(0.02)
(0.02)
(0.03)
State-by
-YearFE
XX
XX
XX
XX
XX
XX
XDistrictFE
XX
XX
XX
XX
XX
XX
XCovariates
XX
XX
XX
XX
XX
XX
XLow
er-Trian
gleF(p-value
).028
.599
.694
.354
.882
.824
.235
.372
.212
.1.042
.015
Upp
er-Trian
gleF(p-value
).385
.218
.713
.512
.733
.732
.796
.784
.597
.112
.355
.314
R2
0.86
0.88
0.88
0.86
0.88
0.87
0.85
0.84
0.84
0.82
0.83
0.83
0.81
Total
Obs.
35,301
35,450
35,400
35,394
35,405
35,419
35,351
35,347
35,299
35,257
35,182
35,099
34,944
Not
e:Stan
dard
errors
areclusteredat
thedistrict
level.
54
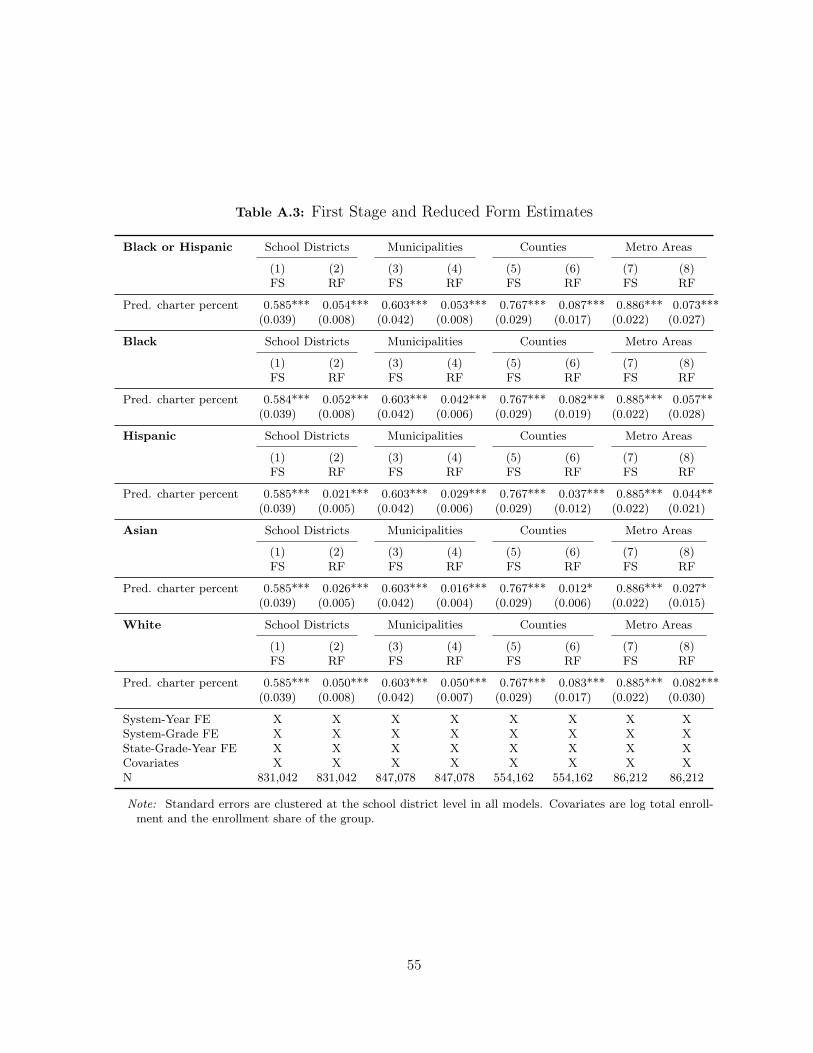
Table A.3: First Stage and Reduced Form Estimates
Black or Hispanic School Districts Municipalities Counties Metro Areas
(1) (2) (3) (4) (5) (6) (7) (8)FS RF FS RF FS RF FS RF
Pred. charter percent 0.585*** 0.054*** 0.603*** 0.053*** 0.767*** 0.087*** 0.886*** 0.073***(0.039) (0.008) (0.042) (0.008) (0.029) (0.017) (0.022) (0.027)
Black School Districts Municipalities Counties Metro Areas
(1) (2) (3) (4) (5) (6) (7) (8)FS RF FS RF FS RF FS RF
Pred. charter percent 0.584*** 0.052*** 0.603*** 0.042*** 0.767*** 0.082*** 0.885*** 0.057**(0.039) (0.008) (0.042) (0.006) (0.029) (0.019) (0.022) (0.028)
Hispanic School Districts Municipalities Counties Metro Areas
(1) (2) (3) (4) (5) (6) (7) (8)FS RF FS RF FS RF FS RF
Pred. charter percent 0.585*** 0.021*** 0.603*** 0.029*** 0.767*** 0.037*** 0.885*** 0.044**(0.039) (0.005) (0.042) (0.006) (0.029) (0.012) (0.022) (0.021)
Asian School Districts Municipalities Counties Metro Areas
(1) (2) (3) (4) (5) (6) (7) (8)FS RF FS RF FS RF FS RF
Pred. charter percent 0.585*** 0.026*** 0.603*** 0.016*** 0.767*** 0.012* 0.886*** 0.027*(0.039) (0.005) (0.042) (0.004) (0.029) (0.006) (0.022) (0.015)
White School Districts Municipalities Counties Metro Areas
(1) (2) (3) (4) (5) (6) (7) (8)FS RF FS RF FS RF FS RF
Pred. charter percent 0.585*** 0.050*** 0.603*** 0.050*** 0.767*** 0.083*** 0.885*** 0.082***(0.039) (0.008) (0.042) (0.007) (0.029) (0.017) (0.022) (0.030)
System-Year FE X X X X X X X XSystem-Grade FE X X X X X X X XState-Grade-Year FE X X X X X X X XCovariates X X X X X X X XN 831,042 831,042 847,078 847,078 554,162 554,162 86,212 86,212
Note: Standard errors are clustered at the school district level in all models. Covariates are log total enroll-ment and the enrollment share of the group.
55

Table A.4: Effects on the Dissimilarity Index of Segregation
Black or Hispanic School Districts Municipalities Counties Metro Areas
(1) (2) (3) (4) (5) (6) (7) (8)OLS IV OLS IV OLS IV OLS IV
Charter percent 0.197*** 0.200*** 0.173*** 0.187*** 0.139*** 0.158*** -0.011 0.017(0.015) (0.020) (0.015) (0.018) (0.026) (0.031) (0.034) (0.038)
Black School Districts Municipalities Counties Metro Areas
(1) (2) (3) (4) (5) (6) (7) (8)OLS IV OLS IV OLS IV OLS IV
Charter percent 0.235*** 0.261*** 0.185*** 0.201*** 0.163*** 0.182*** 0.118** 0.150***(0.019) (0.026) (0.016) (0.019) (0.034) (0.044) (0.050) (0.055)
Hispanic School Districts Municipalities Counties Metro Areas
(1) (2) (3) (4) (5) (6) (7) (8)OLS IV OLS IV OLS IV OLS IV
Charter percent 0.157*** 0.147*** 0.141*** 0.146*** 0.103*** 0.111*** 0.016 0.018(0.013) (0.019) (0.014) (0.016) (0.024) (0.030) (0.034) (0.040)
Asian School Districts Municipalities Counties Metro Areas
(1) (2) (3) (4) (5) (6) (7) (8)OLS IV OLS IV OLS IV OLS IV
Charter percent 0.230*** 0.240*** 0.191*** 0.213*** 0.161*** 0.198*** 0.119** 0.114*(0.018) (0.026) (0.018) (0.024) (0.034) (0.042) (0.052) (0.061)
White School Districts Municipalities Counties Metro Areas
(1) (2) (3) (4) (5) (6) (7) (8)OLS IV OLS IV OLS IV OLS IV
Charter percent 0.190*** 0.197*** 0.169*** 0.185*** 0.110*** 0.129*** -0.006 0.042(0.015) (0.019) (0.015) (0.018) (0.026) (0.030) (0.039) (0.047)
Dep. Var. Mean 32.69 32.97 43.02 52.35System-Year FE X X X X X X X XSystem-Grade FE X X X X X X X XState-Grade-Year FE X X X X X X X XCovariates X X X X X X X XN 831,042 831,042 847,078 847,078 554,162 554,162 86,212 86,212
Note: Standard errors are clustered at the school system level in all models. Covariates are log total enrollment,number of schools, and the enrollment share of the group. Dissimilarity is defined as D =
∑k
pk|qk−Q|2PQ(1−Q)
,where k indexes schools, pk is total school enrollment, qk is the group share of enrollment at the school, Qis the group share of school system enrollment, and P is total school system population.
56

Table A.5: Effects by Quartiles of District Total Enrollment
Black or Hispanic Q1 Q2 Q3 Q4
(1) (2) (3) (4) (5) (6) (7) (8)OLS IV OLS IV OLS IV OLS IV
Charter percent 0.053*** 0.073*** 0.120*** 0.123*** 0.098*** 0.083*** 0.106*** 0.096***(0.010) (0.021) (0.022) (0.026) (0.018) (0.026) (0.018) (0.019)
Black Q1 Q2 Q3 Q4
(1) (2) (3) (4) (5) (6) (7) (8)OLS IV OLS IV OLS IV OLS IV
Charter percent 0.034*** 0.086*** 0.114*** 0.131*** 0.073*** 0.062*** 0.067*** 0.072***(0.009) (0.022) (0.026) (0.030) (0.016) (0.022) (0.014) (0.018)
Hispanic Q1 Q2 Q3 Q4
(1) (2) (3) (4) (5) (6) (7) (8)OLS IV OLS IV OLS IV OLS IV
Charter percent 0.023*** 0.010 0.053*** 0.051*** 0.040*** 0.031** 0.055*** 0.049***(0.006) (0.013) (0.012) (0.014) (0.008) (0.015) (0.011) (0.012)
Asian Q1 Q2 Q3 Q4
(1) (2) (3) (4) (5) (6) (7) (8)OLS IV OLS IV OLS IV OLS IV
Charter percent 0.015** 0.034*** 0.023*** 0.021*** 0.040** 0.039* 0.054*** 0.058***(0.008) (0.011) (0.006) (0.008) (0.019) (0.020) (0.009) (0.011)
White Q1 Q2 Q3 Q4
(1) (2) (3) (4) (5) (6) (7) (8)OLS IV OLS IV OLS IV OLS IV
Charter percent 0.058*** 0.081*** 0.107*** 0.112*** 0.088*** 0.072*** 0.087*** 0.082***(0.011) (0.018) (0.020) (0.024) (0.017) (0.025) (0.021) (0.022)
Mean LEA Population 2975.38 3953.84 17505.1 119275District-Year FE X X X X X X X XDistrict-Grade FE X X X X X X X XState-Grade-Year FE X X X X X X X XCovariates X X X X X X X XR2 0.866 0.018 0.864 0.021 0.879 0.013 0.944 0.010N 204,245 204,245 207,615 207,615 208,240 208,240 208,223 208,223
Note: Standard errors are clustered at the school system level in all models. Covariates are log total enroll-ment, number of schools, and the enrollment share of the group.
57

Table A.6: Gradual Addition of Fixed Effects and other Control Variables
Black or Hispanic (1) (2) (3) (4) (5) (6) (7) (8)IV
Charter percent 0.1467*** 0.1012*** 0.0915*** 0.0953*** 0.0950*** 0.0949*** 0.0942*** 0.0925***(0.0160) (0.0090) (0.0093) (0.0093) (0.0092) (0.0092) (0.0091) (0.0121)
Black (1) (2) (3) (4) (5) (6) (7) (8)IV
Charter percent 0.1202*** 0.0715*** 0.0753*** 0.0768*** 0.0766*** 0.0766*** 0.0733*** 0.0882***(0.0167) (0.0078) (0.0094) (0.0095) (0.0094) (0.0094) (0.0092) (0.0122)
Hispanic (1) (2) (3) (4) (5) (6) (7) (8)IV
Charter percent 0.1076*** 0.0499*** 0.0393*** 0.0427*** 0.0430*** 0.0430*** 0.0439*** 0.0356***(0.0132) (0.0060) (0.0049) (0.0048) (0.0049) (0.0049) (0.0048) (0.0070)
Asian (1) (2) (3) (4) (5) (6) (7) (8)IV
Charter percent 0.0460*** 0.0344*** 0.0340*** 0.0319*** 0.0329*** 0.0329*** 0.0343*** 0.0384***(0.0062) (0.0044) (0.0058) (0.0058) (0.0059) (0.0059) (0.0064) (0.0072)
White (1) (2) (3) (4) (5) (6) (7) (8)IV
Charter percent 0.1348*** 0.0932*** 0.0817*** 0.0868*** 0.0864*** 0.0863*** 0.0853*** 0.0851***(0.0157) (0.0087) (0.0091) (0.0090) (0.0090) (0.0090) (0.0089) (0.0116)
Dep. Var. Mean 12.64Year FE XDistrict FE XGrade FE XDistrict-Year FE X X X X X XDistrict-Grade FE X X X X X XState-Grade-Year FE X X X X XPopulation Ctrl. X X X XNum. Schools Ctrl. X X XComposition Ctrl. X XR2 0.017 0.693 0.892 0.901 0.901 0.901 0.902 0.016N 834,555 834,527 831,059 831,042 831,042 831,042 831,042 831,042
Note: Standard errors are clustered at the school district level in all models.
58
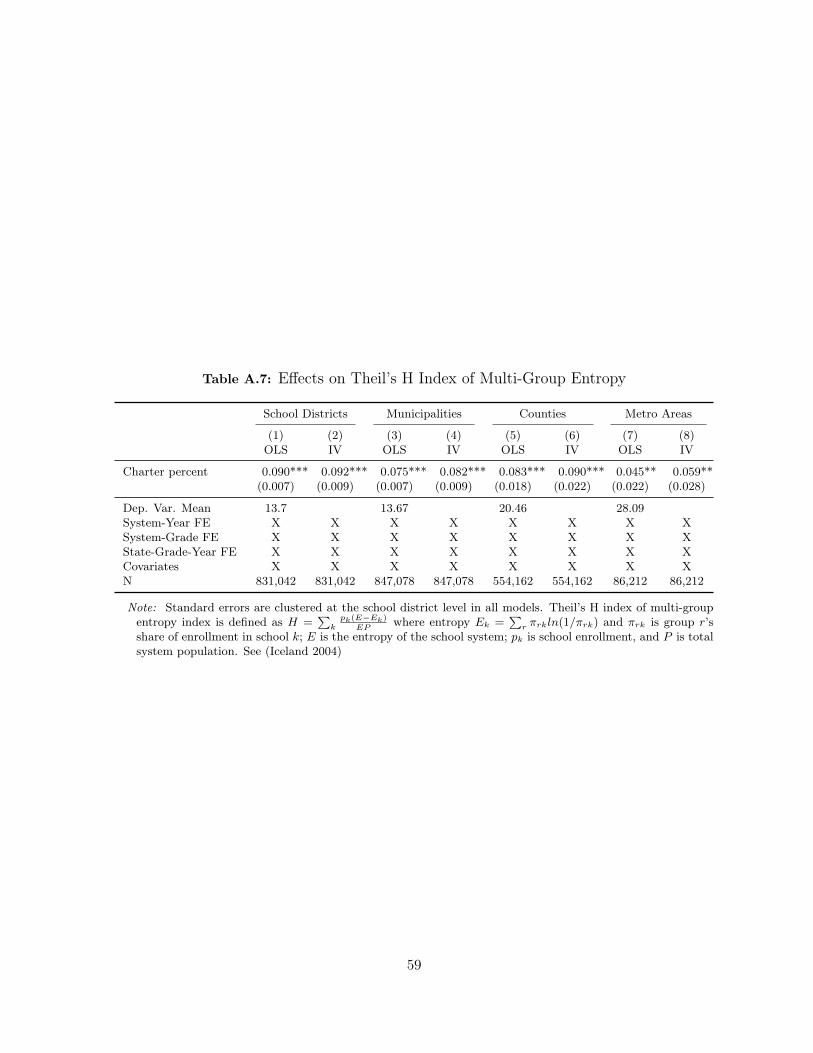
Table A.7: Effects on Theil’s H Index of Multi-Group Entropy
School Districts Municipalities Counties Metro Areas
(1) (2) (3) (4) (5) (6) (7) (8)OLS IV OLS IV OLS IV OLS IV
Charter percent 0.090*** 0.092*** 0.075*** 0.082*** 0.083*** 0.090*** 0.045** 0.059**(0.007) (0.009) (0.007) (0.009) (0.018) (0.022) (0.022) (0.028)
Dep. Var. Mean 13.7 13.67 20.46 28.09System-Year FE X X X X X X X XSystem-Grade FE X X X X X X X XState-Grade-Year FE X X X X X X X XCovariates X X X X X X X XN 831,042 831,042 847,078 847,078 554,162 554,162 86,212 86,212
Note: Standard errors are clustered at the school district level in all models. Theil’s H index of multi-groupentropy index is defined as H =
∑k
pk(E−Ek)EP
where entropy Ek =∑
r πrkln(1/πrk) and πrk is group r’sshare of enrollment in school k; E is the entropy of the school system; pk is school enrollment, and P is totalsystem population. See (Iceland 2004)
59