the effect of cyclic bending loads on crack growth in
TRANSCRIPT

Journal of Engineering Volume 23 June 2017 Number 6
39
The Effect of Cyclic Bending Loads on Crack Growth in Pipes for Inclined
and Transverse Cracks with or Without Internal Pulsing Pressure
Shwan Abdulmuhsin Zainalaabdeen
Senior Engineer In State Company For Oil Projects
(SCOP) - Ministry Of Oil
[email protected] : -E
Dr.Fathi Alshamma
Assistant Professor
College Of Engineering-University Of Baghdad
[email protected] : -E
ABSTRACT
In the present research a new test rig has been proposed to be suitable for different cyclic loads
such as cyclic bending, cyclic torsion, proportional and non proportional loads. In this work the
efforts were concentrated on the cyclic bending loads concerning cracked pipes with or without
internal pulsing pressure to study crack propagation in small bore pipes (up to 1'') for transverse
or inclined cracks. The rig simulates the real service conditions under different stresses by means
the least dangerous case will be suggested, so the experiments were considered for copper pipe,
and the results have been tabulated and drawn to demonstrate the crack growth behavior as well
as to justify the outcomes practically, consequently the durability of this new rig has been
confirmed with new concluded facts.
Key words: cyclic bending load, copper pipe, crack growth
العرضية بىجىد او عذم تأثير احمال الحىي الذورية على ومى الشق في الاوابيب التي فيها شقىق مائلة او
وجىد الضغط الىبضي الذاخلي
الذكتىر : فتحي الشماع
أسخار يساعذ
جايعت بفذاد -كهيت انهذست
الطالب : شىان عبذ المحسه زيه العابذيه
يهذط ألذو في ششكت انشاسيع انفطيت
وصاسة انفط
الخلاصة
عذيذة يزم ادال انذي انذوسيت وادال انهي انذوسيت كى يلائى نخسهيط اىاع دم يهز انذساست حمخشح جهاص يسخذذد بذيذ
الادال انخاسبيت وانغيش حاسبيت انذوسيت , نك في هز انذساست حى انخشكيض عهى ادال انذي انذوسيت نعياث ي الاابيب فيها و
( 1ياساث انصغيشة )انى لياط)ك في الاابيب راث انمشك بذائي بىجىد او عذو وجىد ضغط بضي داخهي نذساست ى انش
( نهشمىق انعشضيت اوانشمىق انائهت وانخي حذاكي والع انذال لاىاع يخخهفت ي الاجهاداث بذيذ يخى الخشاح انذانت الأكزش بىصت
حصشف هزا انشك نخىضيخ أابيب انذاط وي رى جذونت وسسى انخائج انخاصت بى انشكعهى أياا. نزا حج انخجشبت
وحبشيشهز انخائج بصىسة عهيت لارباث يخات هزا انجهاص انسخذذد وانذصىل عهى دمائك واسخخاجاث جذيذة .

Journal of Engineering Volume 23 June 2017 Number 6
39
1. INTRODUCTION:
There are many mechanical components that are subjected to cyclic loads that lead to damage
such as crack that may propagate till final rupture. Pipes are one of the such components that are
used in several industrial units like oil field, plumbing, air conditioning and refrigeration…..etc.,
and for this reason a new test rig has been designed and manufactured to investigate a crack
growth for different stress ratio (R). This new rig is suitable to test the pipe under proportional
cyclic loads , non proportional cyclic loads, bending cyclic loads and torsion cyclic loads with a
little bit changes in some simple parts according to each case but in this study the efforts have
been concentrated on the cyclic bending loads, a little consideration will show that the pipes that
are used in real service conditions might be defected already due to shipment or sharp tool marks
that cause transverse or inclined crack which may not be observed, so the dangerous state of pipe
behavior will be estimated under different loads before rupture , in other words , diagnosis of the
metal state seriousness as soon as possible , taking into account that the crack growth direction
( ) might be examined for each state, adding to this that the test rig designed to simulate the real
service of pipes and the used specimens have the same dimensions in actual practice to monitor
the behavior of crack growth in pipes, so the main goal of this research is to verify the results of
this new rig to be reliable as a useful device .
Pavlou D.G. 2000 focused on the direction of mixed mode crack propagation for inclined crack
in plate (which was included already in the specimen before test commencement), so the main
conclusion demonstrates the clockwise direction of crack initiation angle as well as mode that had
been considered only for crack growth prediction. Robertson S.W. and et al, 2006 investigated
crack growth properties of the super elastic alloys and a sample which cut from Nitinol tube with
different orientation as a compact tension specimen (new test samples) that is used under cyclic
uniaxial load as well as different orientation had been discussed. Boljanovic Slobodanka and
Maksimovic Stevan, 2014 sstudied mixed mode crack propagation in plate specimen with two
holes regarding crack path and life estimation, so good agreement was observed between
experiments and finite elements work.
1Generally there is no standard rig for cyclic load experiments, therefore, researchers build a rig
that meets their requirements, noting that the results of two different test rigs are hard to compare,
Pauw J.De, et al, 2011. In this study an increasing of crack length due to cyclic loads has been
observed against number of cycles and the transverse crack and its inclination effect has been
considered also for copper pipes as a type of multiaxial cyclic stress case due to force analyzing
that caused mixed mode case, and the state of art concept had been studied for another specimen
that gathers an applied remote stresses and internal pulsing pressure as an overload state. Cyclic
load test rig is based on two main issues, the first is the configuration of a test specimen and the
second is an increasing the functionalities, Pauw J.De, et al, 2011. So in this study the specimen
configuration has been illustrated accordingly.
Carful tests for several material were studied via previous works regarding crack growth data that
ranged within the regime (from about 10-4
to 10-2
mm/cycles), Ragab, A. and Bayoumi, S.,
1998. Other opinions were ranged between (10-6
and 10-3
mm/cycles), Vethe, S. 2012, and these
results for the specimens under cyclic tension loads, so it is obvious that the results near 10-4
refers to the slow crack growth as well as a very good toughness of the material and any crack
growth data within same range represent a bonus of the rig outcomes.
Journal of Engineering Volume 23 June 2017 Number 6
39
A little consideration will show that the crack growth were non uniform at both sides and the
phenomena had been observed by Rozumek Dariusz and et al. 2008. As well as the change of
growth is a property of the material microstructure itself and this change might be observed in the
same specimen at both sides as stated also by Hos Y. and Vormwald M. 2015.
2. EXPERIMENT WORK:
The new manufactured rig consists of rig base (0.6x60x105)cm , electrical motor (1.5 HP ) and
the power transmitted via pulleys and belts to the crank shaft that transmitted this power to the
specimen via action shaft where the oscillation of the specimen was equal to around 1800 rpm, so
the process was governed by control system . Pumping system equipped also to introduce an
internal pulsing pressure with 1800 rpm as in Fig.1. It is worth mentioning that the procedure
includes several steps and as indicated here under:
1. The crack had been introduced in pipes and the crack was partly through toward an inside
portion, as in Fig.2. In other word the crack already was existent and after test commencement
the crack grew due to cyclic load.
2. The specimen settled in the rig and the limitation pads arranged in such away the displacement
was equal to (3.25 mm) that checked and measured again during the test by mechanical and
digital caliper.
3. After several minutes of a test commencement the crack grew toward inside a pipe (i.e.
through the thickness ), thereafter a crack initiation was observed on the specimen surface such
that the crack lengths have been recorded as the following tables, to be investigated and clarified
by drawing (a) against (N). It is worth mentioning also that the rig was turned off each period
according to crack growth rate to be possible an observation of crack lengths increment.
4. The displacement substituted in the following formulas, Hearn , E. J. , 1981. to find out the
load and the direct stress .
(1)
(2)
5. In case of internal pulsing pressure the air media entered via specimen upper hold and the
pump turned on that synchronized with turning on the electrical motor, so the pressure was equal
to (1 Mpa) which represents small value comparing with applied remote stress to demonstrate the
clear difference of crack growth behavior due to internal pressure, so the hoop stress was
estimated to be equaled to (8 Mpa ) by using the following formula, Hearn, E. J., 1981.
(3)
Noting that the dimension of all specimens were 180 mm (gauge length), 12.6mm (outside
diameter) and 0.7mm (wall thickness), so all specimens were classified as thin pipe, and the

Journal of Engineering Volume 23 June 2017 Number 6
39
copper pipe was tested in laboratory to find out mechanical and chemical properties that
indicated in Table 1.
For displacement (x) = 3.25 mm the applied remote stress was equal to( 219.77 Mpa), i.e.
around 91% of to accelerate the test as much as possible in such away the crack monitored
carefully.
Three cases of specimens have been considered, the first was pre cracked specimen (i.e. the
crack introduced before test commencement) with transverse crack length (2a) equal to 6.48 mm,
the second was similar to the first specimen with hoop stress equal to 8 Mpa, and the third was
pre cracked specimen where the crack (2a) was inclined by to get clear reading regarding( )
and crack length was equal to 6.48 mm also, so these three different specimens were considered
to demonstrate the less dangerous state.
2.1. Specimen (1)
After (around 32.5) minutes of the test commencement, the crack completely grew through the
thickness and after around 0.5 minutes the crack initiation has been observed on the specimen
surface such that the crack lengths have been recorded as indicated in Table 2.
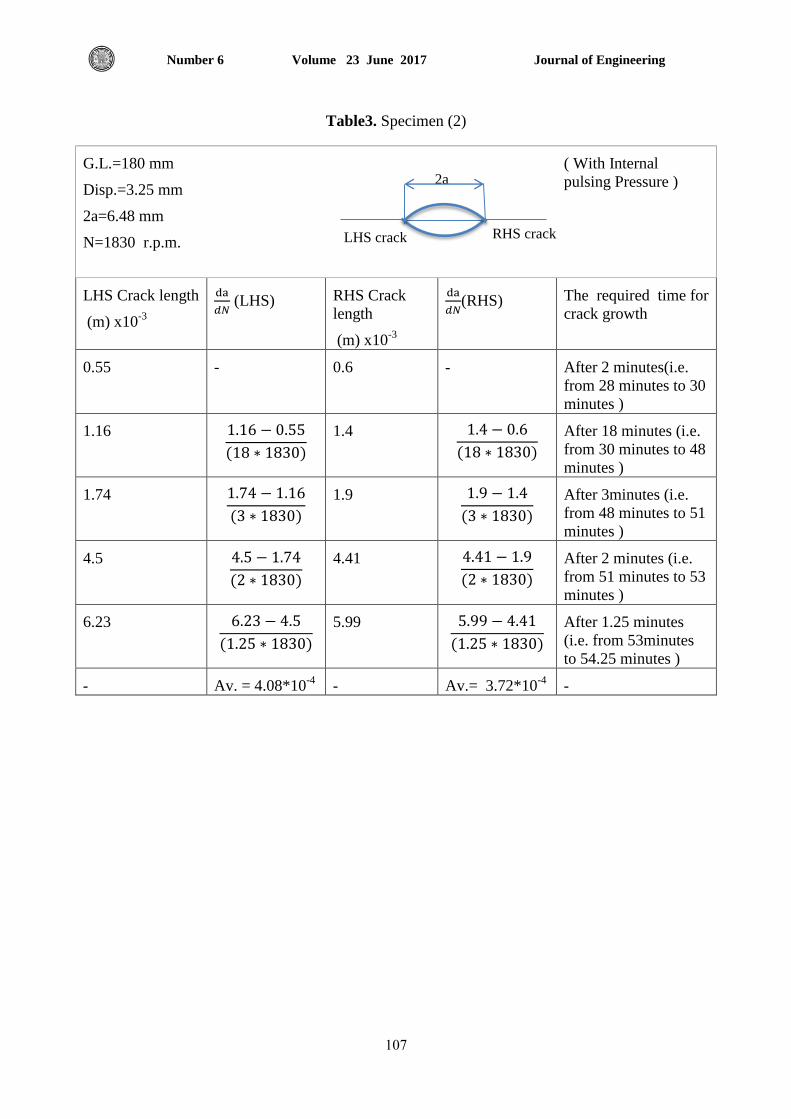
2.2. Specimen (2)
After (around 27.5) minutes of the test commencement , the crack completely grew through the
thickness and after around 0.5 minutes the crack initiation has been observed on the specimen
surface such that the crack lengths have been recorded as indicated in Table 3.
2.3. Specimen (3)
After (around 18.5) minutes of the test commencement, the crack completely grew through the
thickness and after around 0.5 minutes the crack initiation has been observed on the specimen
surface such that the crack lengths have been recorded as indicated in Table 4.
The experiments were analyzed to verify the durability of the new test rig to illustrate new facts
about a damage models and as indicated here under:
1. Regarding the above mentioned crack growth data for specimen (1) under cyclic bending
loads that affect the element by the same way of the cyclic tension loads the outcomes
was equaled to around 10-4
(i.e. within the same acceptable regime), adding to this that the
crack path was approximately perpendicular to the applied remote tensile stress in this
case, Qian , J. and Fatemi A. , 1996, as seen in Fig.3.
2. Regarding the specimen (2), hoop stress equal to 8 Mpa that was implemented to
accelerate crack growth as overload case that was considered besides to the external
cyclic bending load which was equal to 219.77 Mpa, noting that the existence of the
internal pulsing pressure must be more dangerous because the overload increment even
though the hoop stress tend to close the crack for a particular period.
Journal of Engineering Volume 23 June 2017 Number 6
39
3. Regarding specimen (3) the crack initiated in the clockwise direction and at angle was
equal to 580
due to mixed mode existent, however, the direction of crack growth for this
specimen under cyclic load and monotonic load is approximately the same, Pavlou D.G.
2000, and according to special curves that proposed by H.V. Lakshminarayana and
M.V.V. Murthy, 1976, and regarding to the specified constant the following formulas
had been considered to find out stress intensity factor (SIF) of (mode I) and (mode II)
from the special curves which is suitable with studied case .
[ ] (4)
√ =1.2 (5)
√ =0.35 (6)
√ = - 0.12 (7)
√ =1.25 (8)
=
= (9)
=
(10)
Via two main formulas the direction of crack growth regarding the line of crack that were
defined with positive value in counter clockwise direction and the reverse is also true,so
were estimated either by the following formula that used by, Blazic, M. et al, 2014.
(
√(
)
) for (11)
Or by using this hereunder formula that used by, Vethe, S. June 2012.
(
√
) (12)
Where the durability of this new rig has been verified again via the result of specimen with
inclined crack .

Journal of Engineering Volume 23 June 2017 Number 6
39
4. RESULTS AND DISCUSSION:
Based on the received data that monitored from experiments for different scenarios that are
indicated in Table 5, several important figures have been established to be discussed accordingly.
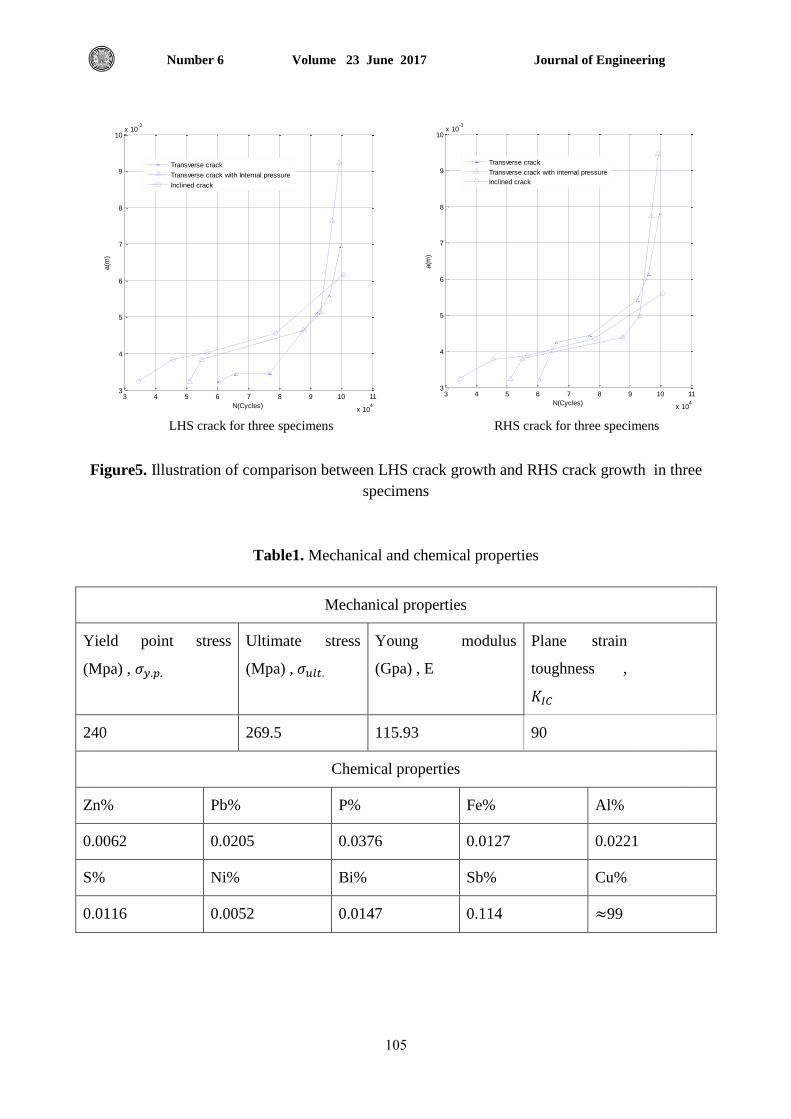
Regarding Fig.4 the differences between two cracks at left hand side (LHS) and right hand side
(RHS) was less with respect to specimen (2) for overall curves, in the other hand the difference
was more regarding specimen (1), so the internal pulsing pressure made a convergence between
LHS and RHS curves due to the fact that the hoop stress try to close the crack from 30 minutes
to 48 minutes and this action led to crack growth deceleration up to a point for this period and the
cracks at both sides of specimens has enough time to grow closely, while the more divergence
had been observed for the case of transvers crack without internal pulsing pressure among these
three specimens where the change of growth is a property of the material microstructure itself and
this change might be observed in the same specimen at both sides as demonstrated by HosY. and
Vormwald M. 2015, so it is normal phenomena, a little consideration will show that the first
reading of initial crack increment (which is very short compared with other reading) was not clear
and classified as threshold stage and this is common problem.
Regarding Fig.5 the cracks at LHS and RHS, the initiation of crack propagation observed clearly
and earlier for specimen (3) compared with other specimens due to shear existence beside direct
stress which resulted from crack inclination. In the same context the crack initiated for the case of
transverse crack with internal pulsing pressure earlier than the case of the transverse crack
without internal pulsing pressure, but the crack lengths increment due to cyclic load was more in
the case of the pressure existence compared with other specimens despite the crack deceleration
for particular period (from 30 to 48 minutes) thereafter the crack grew dramatically. In the other
hand the increment of crack lengths in the case of inclined crack was less among these three
specimens where the effect of opening mode decreased where this mode represent the most
effective mode for crack growth comparing with other well-known modes (shearing mode and
tearing mode).
The direction of the crack angle that grew in the specimen (1) and (2) to be approximately
perpendicular to the applied tensile load due to bending, and the direction of crack initiation of
specimen (3) was estimated according to eq.11 and eq.12 to be verified. A little consideration
will show that will be observed due to crack inclination thereafter the crack grew in the
direction to be approximately perpendicular to the applied bending load and this is normal
phenomena that is observed in previous similar cases. This I shown in Table6.
5. CONCLUSIONS
1. In spite of implementation 91% of concerning specimen (1), the crack grew slowly to
be equal to about 10-4
mm/cycles due to the fact of the high toughness for this type of copper
pipe.
Journal of Engineering Volume 23 June 2017 Number 6
33
2. Despite crack initiation of specimen (3) earlier than other specimens, this case of inclined
crack represents the least dangerous state, and the case of transverse crack with internal
pulsing pressure represents the most dangerous state among other specimens.
3. Concerning the case of inclined crack, it will be more sensible to use the equation (12) to
guess the crack direction because the error between experimental and analytical part was
around 0. 97 %.
4. The durability of the new test rig has been confirmed according to above mentioned outcomes
to illustrate the compatibly between previous opinions and actual practice.
REFERENCES:
- Blazic , M. et al , 2014, Determination Of Fatigue Crack Growth Trajectory And Residual Life
Under Mixed Modes , Journal of Mechanical Engineering, 250-254.
-Boljanovic Slobodanka and Maksimovic Stevan , 2014, Mixed mode crack growth simulation
with / without overloads , International Journal of Fatigue 67 (2014) 183-190.
- Lakshminarayana , H.V. and Murthy , M.V.V, august 1976 On Stresses Around An Arbitrarily
Oriented Crack In Cylindrical Shell , international journal of fracture, Vol. 12 , No. 4.
- Hearn , E. J. , 1981, An Introduction To The Mechanics Of Elastic And Plastic Deformation
Of Solids And Structural Components ; Mechanics Of Materials UK .
-HosY. and Vormwald M. 2015 , Measurement And Simulation Of Crack Growth Rate And
Direction Under Non Proportional Loadings , IGF- ESIS 34.14 .
- Pavlou D.G. 2000 , Approximate Prediction Of Mixed Mode Fatigue Crack Growth
Technological institute of Halkidas , Greece .
- Pauw J.De, et al , 2011 , Review And Classification Of Fretting Fatigue Test Rigs ,
sustainable construction and design , Belgium .
- Qian , J. and Fatemi A. , 1996 , Mixed Mode Fatigue Crack Growth : A Literature Review ,
Engineering Fracture Mechanics , Vol. 55, No. 6, pp. 969-990.
- Ragab , A. and Bayoumi, S. , 1998 , Engineering Solid Mechanics , CRC
- Robertson S.W.2004 , et al , 2006 , Cyclic Fatigue Of Nitinol , ASM international.
- Rozumek Dariusz and et al , 2008 ,Fatigue Crack Growth Rate In Non Proportional Bending
With Torsion Loading , 17th
European conference ,Czech Republic .
- Vethe , S. June 2012 , Numerical Simulation Of Fatigue Crack Growth , M.Sc. dissertation .

Journal of Engineering Volume 23 June 2017 Number 6
111
NOMENCLATURE :
a=crack length (mm)
= specified constant from which the stress intensity factor will be found according to each mode
=direct stress (Mpa)
=hoop stress (Mpa)
D=Inside diameter(m)
E=young modulus (Gpa)
I=moment of inertia (m4)
= membrane stress intensity factor for mode I (Mpa√
= membrane stress intensity factor for mode II (Mpa√
= bending stress intensity factor for mode I (Mpa√
= bending stress intensity factor for mode II (Mpa√
= = effective stress intensity factor for mode I (Mpa√
= = effective stress intensity factor for mode II (Mpa√
l=gauge length(m)
M=bending moment (N.m)
N=number of cycles (r.p.m.)
P=Internal pulsing pressure (Mpa)
r=mean radius (
R= stress ratio (
)
SIF= stress intensity factor (Mpa√
t=Wall thickness (m)
angle of crack growth according to crack line(degree)
w=required load to cause a displacement (N)
= poisons ratio =0.33
x=linear displacement (m)
y=
(m)

Journal of Engineering Volume 23 June 2017 Number 6
111
Figure 1. New test rig with its simulation form.
Pipe support
Pipe1(specimen) Simulation
𝑑𝑖𝑠𝑝𝑙𝑎𝑐𝑒𝑚𝑒𝑛𝑡 𝑥 𝑒𝑐𝑐𝑒𝑛𝑡𝑟𝑖𝑐𝑖𝑡𝑦 𝑑𝑖𝑠𝑡𝑎𝑛𝑐𝑒 𝑜𝑓 𝑐𝑟𝑎𝑛𝑘 𝑆

Journal of Engineering Volume 23 June 2017 Number 6
111
Figure 2. Specimen shape.

Journal of Engineering Volume 23 June 2017 Number 6
119
Figure3. Illustration of crack growth
Taking into account that the crack
path does not differs a lot
comparing with the case of
Internal pulsing pressure
existence, in the other hand a
crack growth rate was different

Journal of Engineering Volume 23 June 2017 Number 6
119
Figure4. Illustration of LHS crack and RHS crack growth in specimen (1), specimen (2) and
specimen (3)
6 6.5 7 7.5 8 8.5 9 9.5 10
x 104
3
3.5
4
4.5
5
5.5
6
6.5
7
7.5
8x 10
-3
N(Cycles)
a(m
)
LHS crack
RHS crack
5 5.5 6 6.5 7 7.5 8 8.5 9 9.5 10
x 104
3
4
5
6
7
8
9
10x 10
-3
N(Cycles)
a(m
)
RHS crack
LHS crack
3 4 5 6 7 8 9 10 11
x 104
3
3.5
4
4.5
5
5.5
6
6.5
7x 10
-3
N(Cycles)
a(m
)
LHS crack
RHS crack
Specimen (1) Specimen (2)
Specimen (3)
Journal of Engineering Volume 23 June 2017 Number 6
119
Figure5. Illustration of comparison between LHS crack growth and RHS crack growth in three
specimens
Table1. Mechanical and chemical properties
Mechanical properties
Yield point stress
(Mpa) ,
Ultimate stress
(Mpa) ,
Young modulus
(Gpa) , E
Plane strain
toughness ,
240 269.5 115.93 90
Chemical properties
Zn% Pb% P% Fe% Al%
0.0062 0.0205 0.0376 0.0127 0.0221
S% Ni% Bi% Sb% Cu%
0.0116 0.0052 0.0147 0.114 99
3 4 5 6 7 8 9 10 11
x 104
3
4
5
6
7
8
9
10x 10
-3
N(Cycles)
a(m
)
Transverse crack
Transverse crack with Internal pressure
Inclined crack
3 4 5 6 7 8 9 10 11
x 104
3
4
5
6
7
8
9
10x 10
-3
N(Cycles)
a(m
)
Transverse crack
Transverse crack with internal pressure
Inclined crack
LHS crack for three specimens RHS crack for three specimens

Journal of Engineering Volume 23 June 2017 Number 6
119
Table2. Specimen (1)
G.L.=180 mm
Disp.=3.25 mm
2a=6.48 mm
N=1830 r.p.m.
The required time for
crack growth
(RHS) RHS Crack
length
(m) x10-3
(LHS) LHS Crack length
(m) x10-3
After 3 minutes(i.e.
from 33 minutes to 36
minutes )
- 0.2 - 1
After 6 minutes (i.e.
from 36 minutes to 42
minutes )
0.22
1.19
After 8.5 minutes (i.e.
from 42 minutes to
50.5 minutes )
1.88
2.19
After 2 minutes (i.e.
from 50.5 minutes to
52.5 minutes )
2.35
2.9
After 2 minutes (i.e.
from 52.5 minutes to
54.5 minutes )
3.71
4.58
- Av.=1.52*10-4
- Av.=1.83 *10-4
-
RHS crack LHS crack
2a
Journal of Engineering Volume 23 June 2017 Number 6
119
Table3. Specimen (2)
( With Internal
pulsing Pressure )
G.L.=180 mm
Disp.=3.25 mm
2a=6.48 mm
N=1830 r.p.m.
The required time for
crack growth
(RHS) RHS Crack
length
(m) x10-3
(LHS) LHS Crack length
(m) x10-3
After 2 minutes(i.e.
from 28 minutes to 30
minutes )
- 0.6 - 0.55
After 18 minutes (i.e.
from 30 minutes to 48
minutes )
1.4
1.16
After 3minutes (i.e.
from 48 minutes to 51
minutes )
1.9
1.74
After 2 minutes (i.e.
from 51 minutes to 53
minutes )
4.41
4.5
After 1.25 minutes
(i.e. from 53minutes
to 54.25 minutes )
5.99
6.23
- Av.= 3.72*10-4
- Av. = 4.08*10-4
-
RHS crack LHS crack
2a

Journal of Engineering Volume 23 June 2017 Number 6
119
Table4. Specimen (3)
G.L.=180 mm
Disp.=3.25 mm
2a=6.48 mm
N=1830 r.p.m
The required time
for crack growth
(RHS) RHS Crack length
(m) x10-3
(LHS) LHS Crack length
(m) x10-3
After 6 minutes(i.e.
from 19 minutes to
25 minutes )
- 0.6 - 0.54
After 6 minutes (i.e.
from 25 minutes to
31 minutes )
0.8
0.66
After 12 minutes (i.e.
from 31 minutes to
43 minutes )
1.32
1.13
After 12 minutes (i.e.
from 43 minutes to
55 minutes )
2.93
2.36
- Av. =3.83*10-5
- Av. =2.94*10-5 -
𝜃𝑐
RHS crack
LHS crack
300

Journal of Engineering Volume 23 June 2017 Number 6
113
Table5. Proposed scenarios
No. Remote applied load Crack inclination Internal pulsing pressure effect
(1) cyclic bending load transvers crack(00) without Internal pulsing pressure
(2) cyclic bending load transvers crack(00) with Internal pulsing pressure
(3) cyclic bending load inclined crack(300) without Internal pulsing pressure
Table6. Comparison between experimental and analytical
Equations experimental analytical Error %
Eq. (11) -58 -50.610 14.6
Eq. (12) -58 -57.440 0. 97