the effect of employee cultural diversity on
TRANSCRIPT

THE EFFECT OF EMPLOYEE CULTURAL DIVERSITY ON ORGANIZATIONAL
PERFORMANCE: A CASE STUDY OF OILYBIA-KENYA
BY
KEMUNTO NEEMA MECHEO
UNITED STATES INTERNATIONAL UNIVERSITY
SUMMER, 2016

i
THE EFFECT OF EMPLOYEE CULTURAL DIVERSITY ON ORGANIZATIONAL
PERFORMANCE: A CASE STUDY OF OILYBIA-KENYA
BY
KEMUNTO NEEMA MECHEO
A Project Report Submitted to Chandaria School of Business in Partial Fulfillment of
the Requirement for the Degree of Masters in Business Administration (MBA)
UNITED STATES INTERNATIONAL UNIVERSITY-AFRICA
SUMMER 2016

ii
STUDENT’S DECLARATION
I, the undersigned, declare that this is my original work and has not been submitted to any
other college, institution or university other than United States International University-
Africa.
Signed: Date:
Kemunto Neema Mecheo (ID: 625357)
This research project has been presented for examination with our approval as the appointed
supervisors.
Signed: Date:
Dr. Juliana M. Namada
Signed: Date:
Dean Chandaria School of Business.

iii
COPYRIGHT
Copyright © Kemunto Neema Mecheo, 2016
All Rights Reserved.
iv
ABSTRACT
The purpose of this study was to find out the effects of employee cultural diversity on
organizational performance. The study was guided by the following objectives; to determine
the effect of employee religion on organizational performance, to establish the effect of
employee value system on organizational performance and to find out the effect of employee
language on organizational performance.
A descriptive quantitative research method was used. Primary data was collected using a five
scale likert questionnaire. The questionnaire was distributed to oil Libya petrol stations
employees who are situated in Nairobi. Data submitted through questionnaire was entered
into SPSS 20.0 statistical software and analyzed for descriptive statistics. Sampling technique
was used to select a population sample from the entire employee population. Descriptive
statistics was used to analyze data. Regression analysis was used to establish the relationship
between employee cultural diversity and organizational performance.
The research found out that that employee religion had an effect on organization
performance. Seven religion variables did not have a significant effect on organizational
performance with only three significantly affecting organizational performance in a positive
way. Religious beliefs had a negative effect on employee work performance however, they
positively influenced work commitment. The study also established that cultural values
affected organization performance positively. Five employee value system variables did not
have a significant effect on organizational performance with only five which were; company
values, customer, business outcomes and team work significantly affecting performance in a
positive way. The variable job had a negative effect on organizational performance while
cultural values emphasized on team work. The findings revealed that the company
emphasized on positive cultural values and discouraged negative cultural values, actions that
positively influenced its performance.
Lastly the findings revealed that, all the employee language variables did not have a
significant effect on organizational performance with only ethnicity and negative working
practices having a positive significant effect on organizational performance. The findings
showed that differences in language generated conflict because of the lack of skill of being
able to identify with other cultural groups. The findings also indicated that differences in

v
language raised communication barriers that hindered effective transfer of knowledge and
that having official language use policies negatively affected performance.
In conclusion, it is evident that cultural diversity has an effect on organizational performance.
Religion, value system and language attributes have an effect on organizational performance
both in a positive and negative way. Majority of the attributes positively affected
performance with a few having a negative effect on the same. The study therefore
recommends that employees be given an opportunity to practice their religion. The company
also needs to have a system that fairly allows all the employees to practice their religion and
engage in religious activities that both contribute positively to the individual and
organization. The study further recommends that the company aligns its values with the
employees’ cultural values to avoid conflict. Training needs to be done on the different
dimensions of cultural values to reduce on any conflict that arises because of differences in
value system, as well as to enhance unity and cohesion at the work place. It is recommended
that the company conducts a training on how on how to minimize communication barriers as
well as have a seminar on cultural diversity to curb the conflict that arises from diversity in
ethnicity. Lastly, having language use policies will also minimize cases of employees feeling
outcast when working with colleagues who speak the same language.

vi
ACKNOWLEDGEMENT
First, I would like to thank my Almighty God for continuously blessing me with the presence
of mind, health, and faith to complete my Master’s Degree. May all the Praise, Glory and
Honor be unto Him.
I would like to thank my parents; Mr. Robert Onsarigo and Mrs. Peris Onsarigo, who have
always encouraged my siblings’ and I to reach for our dreams. They have made enormous
sacrifices in their lives to ensure we get the best education. Their love and support has
inspired me to accomplish things I never imagined. I thank them for being great parents and
excellent role models. I love you, and no matter how high I go in life, I will always look up
to you.
I would like to thank my parents’ in-law, Mr and Mrs Omundi for their generous support and
encouraging words throughout the program. Your support indeed went a long way in pushing
for this achievement. May God bless you abundantly.
Additionally, I would especially like to thank my Supervisor, Dr. Namada for her continued
friendship, guidance and mentoring through the thesis process and my studies. This would
indeed not have been achieved without her. Prof, you are a first class lady and when I grow
up, I want to be like you.
To my family and Friends: I would like to thank you for your prayers, encouragement, and
support.
May God bless you All.

vii
DEDICATION
I would like to dedicate this thesis to my husband Peter Mokaya and our two children (Ethan
and Evannah Mokaya) for being my cheerleaders throughout this process. I am truly grateful
to you my husband for your assistance, support, encouragement and understanding. It is
amazing what a simple statement like “you are doing a good job” does for one’s morale as a
master’s student especially when you are a mother, wife, employee and student all at the
same time. A big thank you to my two little angels; Ethan and Evannah for being
understanding every time I spent time away from you as I undertook my studies. You have
been my motivation throughout my master’s program and because of you my babies, the sky
is my limit.

viii
TABLE OF CONTENTS
STUDENT’S DECLARATION ................................................................................................... ii
COPYRIGHT ............................................................................................................................... iii
ABSTRACT .................................................................................................................................. iv
ACKNOWLEDGEMENT ........................................................................................................... vi
DEDICATION............................................................................................................................. vii
LIST OF TABLES ........................................................................................................................ x
LIST OF FIGURES .................................................................................................................... xi
LIST OF ABBREVIATIONS .................................................................................................... xii
CHAPTER ONE ........................................................................................................................... 1
1.0.INTRODUCTION................................................................................................................... 1
1.1. Background of the Problem ..................................................................................................... 1
1.2. Statement of the Problem ......................................................................................................... 5
1.3. General Objective .................................................................................................................... 6
1.4. Research Questions .................................................................................................................. 6
1.5. Significance of the Study ......................................................................................................... 6
1.6. Scope of the Study ................................................................................................................... 7
1.7. Definition of Terms.................................................................................................................. 7
1.8. Chapter Summary .................................................................................................................... 8
CHAPTER TWO .......................................................................................................................... 9
2.0. LITERATURE REVIEW ..................................................................................................... 9
2.1. Employee Religion and Organization Performance. ............................................................... 9
2.2. Employee Value System and Organizational Performance ................................................... 12
2.3. Employee Language and Performance .................................................................................. 17
2.4. Chapter Summary. ................................................................................................................. 22
CHAPTER THREE .................................................................................................................... 23
3.0. RESEARCH METHODOLOGY ....................................................................................... 23

ix
3.1. Introduction ............................................................................................................................ 23
3.2. Research Design..................................................................................................................... 23
3.3. Population and Sampling Design ........................................................................................... 24
3.4 Data Collection Methods ........................................................................................................ 26
3.5 Research Procedures. .............................................................................................................. 26
3.6 Data Analysis Methods ........................................................................................................... 26
3.7. Chapter Summary .................................................................................................................. 26
CHAPTER FOUR ....................................................................................................................... 27
4.0 RESULTS AND FINDINGS ................................................................................................ 27
4.1 Introduction ........................................................................................................................... 27
4.2. General Information ............................................................................................................... 27
4.3 Employee Religion and Organization Performance ............................................................... 31
4.4. Employee Value system and Organization Performance ....................................................... 34
4.5. Employee Language and Organization Performance. ........................................................... 37
4.6. Chapter Summary .................................................................................................................. 40
CHAPTER FIVE ........................................................................................................................ 41
5.0 SUMMARY, DISCUSSION, CONCLUSIONS AND RECOMMENDATIONS ............ 41
5.1 Introduction ............................................................................................................................. 41
5.2 Summary ................................................................................................................................. 41
5.3 Discussion ............................................................................................................................... 42
5.5 Recommendation .................................................................................................................... 49
REFERENCES ............................................................................................................................ 51
APPENDICES ............................................................................................................................. 56
Appendix A: Cover Letter ............................................................................................................. 56
Appendix B: Questionnaire ........................................................................................................... 57

x
LIST OF TABLES
Table4.1: Response Rate ............................................................................................................. 27
Table 4.2: Designation of the Employees .................................................................................... 30
Table 4.3: Descriptive on the Variables of Influence of Religion ............................................... 31
Table 4.4: Model Summary of Religion and Organizational Performance ................................ 32
Table 4.5: ANOVA of Employee Religion and Organizational Performance. ........................... 32
Table 4.6: Coefficient of Religion and Organizational Performance ........................................... 33
Table 4.7: Descriptive on Employee Values ................................................................................ 34
Table 4.8: Model Summary of Employee Value System and Performance ................................ 35
Table 4.9: ANOVA of Employee Value System and Organizational Performance. .................. 35
Table 4.10: Coefficients of Employee Value System and Organization Performance. ............... 36
Table 4.11: Descriptive on the Variables of Employee Language ............................................... 37
Table 4.12: Model Summary of Employee Language and Organizational Performance ............ 38
Table 4.13: ANOVA of Employee Language and Organizational Performance. ....................... 39
Table 4.14: Coefficients of Employee Language and Organization Performance ....................... 39

xi
LIST OF FIGURES
Figure 4.1: Age of Respondents ............................................................................................ 28
Figure 4.2: Gender of the Respondents .................................................................................. 28
Figure 4.3: Level of Education .............................................................................................. 29
Figure 4.4: Experience in the Industry ................................................................................... 30

xii
LIST OF ABBREVIATIONS
ANOVA: Analysis of Variance
KPC: Kenya Pipeline Company
LOBP: Lubes Oil Blending Plant
LOKL: Libya Oil Kenya Limited.
SD: Standard Deviation
SPSS: Statistical Package for Social Science.

1
CHAPTER ONE
1.0 INTRODUCTION
1.1 Background of the Problem
Organizations and their employees do not exist in a vacuum, separated from their cultural
surroundings, but in a specific culture or socio-cultural environment (Hofstede, 1991). For an
organization to remain relevant in a competitive environment, it’s necessary for the
management to hire employees who represent its demographics (Jehn & Bezrukova, 2004).
This could include people who represent a particular ethnic community, who understand and
know the needs of their culture. It could also mean having a representative from a particular
religion, who may be able to give insight on the acceptable and non offensive traditions that
could be used by the organization, for example during a marketing campaign (Worman,
2006). Worman (2006) further explains that understanding the effect of culture on human
behavior is crucial to the business success of any organization.
Farrer (2006) believes that, organizations aiming to expand their market and increase their
performance need to give greater attention to relating to a multi-cultural workforce. Jehn &
Bezrukova (2004) state that the trend of having different work functions and departments in
an organization that have different cultures, adds a strong element of cultural diversity to
today’s workgroups in many organizations. For an organization to succeed and have a
competitive edge over the rest in the industry, it has to greatly embrace diversity to be able to
realize its benefits, Farrer (2006). Being able to successfully handle workplace diversity
issues as well as develop and implement diversity plans gives an organization several
benefits (Stahl, Maznevsk, Voigt & Jonsen, 2010).
Cultural diversity is the representation, in one social system, of people with distinctly
different group affiliations of cultural significance (Ang,Van, Koh, Templer, Tay &
Chandrasekar, 2007). Tayeb (2003), describes culture as the shared norms and values of
a social system which characterize a society, and lie beneath its art and architecture,
clothes, food, ways of greeting, working together and ultimately ways of communicating. On
the other hand, Hofstede (2010) defines culture as the collective programming of the mind
based on values that distinguishes one group or category from another. To Tayeb (2003)
2
cultures are different from one another in the degree to which they generally hold certain
values and attitudes, and not in the kind of those values and attitudes.
According to Aluko (2003), culture is a wide and multidimensional concept that one cannot
hope to deal with in its entirety in a single study. This is because culture is divided into two
major aspects which are (i) material and (ii) non-material cultures. Aluko (2003) goes further
to describe material culture as the physical pieces that are clear and noticeable, such as
clothing, tools, technology and art. The non-material aspects of culture are described as the
abstract ideas and ways of thinking, morals, languages, attitudes, values, and norms
shared and transmitted in a society. They cannot be seen or touched but can be revealed
through the psychological state and behavior of individuals.
To Ely and Thomas (2001), the main objective of organizations trying to provide and
enhance cultural diversity is to dominate pluralism for single culture and ethno relativity for
ethno centralism. Daft (2003) explains Pluralism as embracing various subcultures of an
organization; while, ethno relativity is accepting the fact that members of subcultures and the
dominant culture are equal. As a consequence of these two perspectives, the ones who feel
themselves ignored and excluded because they come from different cultures in organizations
are able to be involved into the organization thoroughly (Ely & Thomas, 2001). According to
the defenders of diversity, cultural diversity is received as a necessary, useful, natural and
cheery fact enabling an organization to feel really happy about pluralism and utilizing
different human resource superiorities (Seymen, 2006).There are both advantages and
disadvantages of cultural diversity in regard to organizations, and each of the facts on both
poles should be taken into consideration separately (Peppas, 2001).
Cultural diversity is now being widely accepted by organizations as a way of creating
competitive advantage. This is mainly because they have the opportunity to utilize a vast
array of knowledge, skills and abilities found in a diverse cultural workforce (Stahl,
Maznevsk, Voigt & Jonsen, 2010). Blunt and Jones (1992), George and Jones (1996)
and Zakaria (1997) argued that all organizations everywhere function within a specific
culture. It is becoming more widely recognized in contemporary discussions of
organizational performance that managers and other organizational practitioners have to
3
develop an understanding of their cultural settings if their organizations are to perform
effectively (Kochan et.al, 2004).
Every organization aims to sustain its existence and meet the needs of highly competitive
markets by continuously improving its performance (Arslan & Staub 2013). According to
Chen (2002), organizational performance means the transformation of inputs into outputs for
achieving certain outcomes. Ely & Thomas (2001) describe performance as the execution or
accomplishment of work, tasks or goals to a certain level of desired satisfaction. There are
several ways to understand organization performance but for the purposes of this thesis, we
will look at it as the ability of an organization to satisfy the desired expectations of two main
stakeholders comprising of owners and customers. This is measured in terms of the following
parameters; Owners’ satisfaction with financial returns or profits from organizational
operations and customers’ expressed satisfaction with the quality of products and services of
the organization.
Financial growth of the organization will be measured through its sales performance. Sales
performance can be explained as all the economic activities or investment carried out in the
organization in a given period of time. It can be measured by the total amount of
revenue collected for the goods sold. In many organizations, employee morale and
satisfaction are related to identity groups or cultural affiliations (Cox, 1994). The amount of
diversity in both formal and informal structures of organizations will impact factors such as
creativity, problem solving and intra-organizational communications (Ang et.al, 2007). How
people feel and think about their jobs and their employers is greatly influenced by their
cultural beliefs, norms and value system (Peppas, 2001). Seymen (2006) further states that
this is indeed crucial because behavior is driven by perceptions of reality. What people
believe about their opportunities in the work environment is of vital importance regardless of
whether or not these beliefs are consistent with the facts (Kochan et.al, 2003). Cox (1994)
goes ahead to say that cultural differences to a great extent shape a person’s beliefs and
relationship to other employees as well as customers.
There seems to be a general agreement that if cultural diversity is managed well, it can be an
asset to performance, and if it is overlooked or mismanaged, it may diminish the performance
of an organization (Browaeys & prince, 2011). Managing cultural diversity is the whole

4
action of planning and implementing organizational systems and practices to manage people
so that the potential advantages of diversity are maximized while minimizing its drawbacks
(Stahl, Maznevski, Voigt & Jonsen, 2010). Jehn & Bezrukova (2004) believe that the goal of
managing cultural diversity is to maximize the ability of all employees to contribute to
organizational goals, and to achieve their full potential unhindered by cultural identities such
as religion, norms, values and language.
OiLibya has now been in existence in Kenya since 2006, having taken over Exxon Mobil’s
business in Kenya. The retail business continues to present vast opportunities for growth and
expansion in the Kenyan market. Since 2006, they have seen the brand achieve major
milestones. The company has been awarded the ISO 9001:2008 certification for continued
implementation of Quality Management System at their Lubes Oil Blending Plant
(LOBP), Mombasa. They have also achieved the 2009 - 2010 ‘Superbrand’ Status. Libya Oil
Kenya Limited (LOKL) is the local subsidiary of the Libya Oil Group with affiliates in
over 15 African countries including Morocco, Niger, Senegal, Cote d’Ivoire, Mali, Gabon,
Cameroon, Egypt, Morocco and Tunisia. In Eastern Africa, Oil Libya is in Kenya,
Djibouti, Sudan, Ethiopia, Eritrea and Uganda where they continue to look for investment
opportunities. The Group’s reporting office is in Casablanca, Morocco.
Oil Libya Kenya’s vision is ‘To be Africa’s leading and most respected partner in shaping
African energy and empowering African born prosperity’. Its mission is ‘To energize the
local people and delight their partners by providing responsible energy solutions’. Oil Libya
Kenya operates under the values of Pursuing excellence, Encouraging collaboration,
Fostering innovation and Nurturing leadership under the brand name ‘OiLibya’, LOKL
operates 67stations country wide through a dealer network. It operates a lubricant blending
plant in Mombasa, terminals in Nairobi, Mombasa and Eldoret and has a presence at the
Kenya Pipeline Company (KPC) depots in Western Kenya. It also operates its aviation
business through the two main airports in Kenya.
The business covers the sale and marketing of a range of quality Lubricants, Fuel to retail
and commercial customers, L P Gas, Chemicals and Special products. LOKL also provides
services such as ATMs and Chemist outlets at select retail outlets. LOKL has also partnered
with Innscor (K) Limited to provide a comprehensive back-court offering that includes

5
quality food brands and convenience retailing stores. Due to its broad market focus, Oil
Libya has a cultural diverse workforce in all of its areas of operation.
1.2. Statement of the Problem
Organizations with strong cultures perform better than those without (Ang et al., 2007). A
strong culture is an organizational culture with a consensus on the values that drive the
company and with an intensity that is recognizable even to outsiders (Kochan et.al, 2003). A
strong culture is deeply held and widely shared and is also highly resistant to change (Daft,
2003).Canella et. al, (2008) says that despite the large number of studies on diversity, most
of these studies have so far yielded inconsistent results, thus leading to a question of whether
really diversity in diversity is advantageous for companies. Ang et al., (2007) acknowledges
that diversity can have both positive and negative impacts on organizations, but the nature of
the impact depends on the type of diversity climate that exists rather than the fact of diversity
itself. Differences in culture makes the general management and technical know how
difficult to exploit, when differences in cultural context make activity sharing and synergy
formation among business units less efficient (Stahl et.al, 2010).
Studies undertaken in the Kenyan context by Irungu (2007), Awino (2007) and Sifa (2009)
have all treated corporate performance as a dependent variable. The findings of each of these
studies indicate that performance is a function of a combination of factors. Irungu’s (2007)
study revealed that there is a relationship between employee characteristics and various
indicators of organizational performance. Awino’s (2007) study focused on the effect of top
management team diversity on corporate performance while Sifa’s (2009) study focused on
the influence of top management team characteristics and performance. Both of these studies
indicated that organizational practitioners continue to be faced by a lot of management
problems that have their roots in the top management team, which ultimately impede
progress towards achieving high performance. Ahiauzu (2000) states that, most of the
literature on cultural influences on organizational performance and behavior is of poor
quality consisting of anecdotes and prescriptions based on western experience and
imagination.

6
Thus there exists the problem of several of research focusing exclusively on the effect of
culture on organizational performance in the western setup. And as such, little is known
about the nature and uniqueness of the Kenyan’ culture and its impact on organizational
performance. While much attention has been devoted to the impact of cultural diversity in
the workforce, less attention has been given to issues associated to multicultural diversity in
the oil industry. More especially, no studies have been carried out on the effect of employee
cultural diversity on Oil Libya’s performance in Kenya. This study is therefore to fill the
knowledge gap by investigating how employee cultural diversity affects performance of an
organization and to relate oil companies more closely with their employee cultural
background in order to enhance optimal performance.
1.3. General Objective
The general objective of this study is to investigate how employee cultural diversity affects
organization performance
1.4. Research Questions
1.4.1 How does employee religion affect organization performance?
1.4.2 How does employee value system affect organization performance?
1.4.3 How does employee language affect performance?
1.5. Significance of the study
This research reveals to various stakeholders how employee cultural diversity affects
organizational performance.
1.5.1. Researchers & Academicians
Researchers benefit from the findings of this study as it contributes to the package of
knowledge and skills on enhancing performance in a diverse cultural organization The
research also opens up new areas for future research by interested academicians, scholars and
researchers.

7
1.5.2. Oil Libya Kenya-Management
The management benefits by obtaining information on the significance of employee cultural
diversity on its organizational performance. The findings of the study are an opportunity for
strategy formulation and implementation for not only Oil Libya but Oil companies in Kenya.
1.5.3. Government
Policy makers obtain data that guides them in regards to recruitment of employees with
diverse cultural orientations in its different sectors. This in return makes our government
competitive economically since the success of a government globally, is becoming
increasingly dependent on its ability to deal with the challenges of cultural diversity.
1.6. Scope of the Study
This study is limited in scope by focusing mainly on OiLibya Kenya employees. A cross
sectional study was carried out, with the research being carried out between May 2016 and
June 2016. The study was therefore limited to the events that occurred during this study
period. The findings of this research are subject to the values, ethics and competences of the
respondents.
1.7. Definition of terms
1.7.1 Diversity
Diversity is defined as the differences in race, gender, culture, class, ethnicity, physical
ability, sexual orientation, religion and educational level of individuals (Grobber, 2002).
1.7.2 Religion
An organized system of beliefs, ceremonies and rules used to worship a god (Day, 2005).
1.7.3. Culture
Culture is a man’s medium that forms the human life of an individual (Tayeb, 2003)

8
1.7.4. Performance
Performance is the execution or accomplishment of work, tasks or goals to a certain level of
desired satisfaction (Ely & Thomas, 2001)
1.7.5. Value System
A coherent set of values adopted and/or evolved by a person, organization, or society as a
standard to guide its behavior in preferences in all situations (Davis, 2003).
1.7.6. Religiosity
Religiosity is the strength of one’s connection to, or conviction for, their religion. The
importance of one’s faith (Noland, 2003).
1.7.7. Cultural Diversity
Cultural diversity is the existence of diverse individuals from different cultures or societies
whose differences arise from language, religion, race, sexual orientation, gender, age and
ethnicity (Grobber, 2002).
1.8. Chapter summary
This chapter has presented a background of the research, the problem statement and
objectives of the research, significance of the study and its scope as well as definition of
terms used in the research. Chapter two presents a review of the literature with regards to the
study objectives. Chapter three describes the methodology used in the research while chapter
four presents the results and findings of the study. Finally chapter five provides the summary,
conclusion and recommendations from the findings of the research.

9
CHAPTER TWO
2.0. LITERATURE REVIEW
This chapter presents literature, which is relevant to the research questions stated in chapter
one. First, how employee religion affects organization performance. Secondly, studies
dealing with employee value system effect on organization performance. Thirdly, the
employee language effect on organization performance. Finally, the chapter ends with a
conclusion.
2.1. Employee Religion and Organization performance
Religion is the high levels of traditional religious belief, frequent involvement in religious
institutions such as churches, synagogues, mosques, and temples, and engagement in
religious practices such as reading scripture, worship, and prayer (McCullough &
Willoughby, 2009). Religion comprises of both religious belief and religious behavior.
Religious belief, which is also referred to as internal religiosity, or faith, is defined as belief
in God and a trusting acceptance of God’s will (Steiner,et al.,2010). Religious behavior, or
external religiosity, on the other hand, includes all observable activities, which are
undertaken in a religious context, in particular going to church (Steiner,et al., 2010 ).
Religion has been identified as one of the critical elements that influence an individual’s
value system and hence in shaping the cultural environment of an organization (Kutcher, et
al., 2010). As mentioned by Abdel-Khalek, (2010) religion affects the way in which people
behave through an individual’s value system. Cash & Gray, (2000) examined that religion
and spirituality strongly influence many American managers’ behaviors’ at work. Religion
too was found to contribute to healthy organizations (Noland, 2003).
For a long time the relationship between religion and work had been described as that, that
cannot and should not be mixed (Noland, 2003). However, that has drastically changed.
Individuals’ are now increasing desiring to incorporate their religious perspective into their
work and to express their religious and spiritual beliefs at work, (Barro, & McCleary 2003).
There is a wealth of information that suggests a positive relationship between religiosity and
subjective well-being (Abdel-Khalek, 2010). The positive consequences that studies show
accompany religious belief and practices have made the Americans to increasingly want their
10
religion integrated into all the areas of their lives (Kutcher, et al., 2010). The many benefits
religious beliefs has been found to have on physical and mental health and ethical decision
making, has pushed some organizations to support and encourage expressions of religion and
faith in the workplace says Kutcher, et al., (2010).
Employees who are allowed to express their faith, religion, or spirituality improve the quality
of work life, certainly for themselves, if not for others (Miller 2007). As Elm (2003) states,
there is growing evidence that the line between workplace and religious beliefs is growing
thin by the day. People differ in their religious motivation. Some people hold religious beliefs
and engage in religious practices because they find their primary motivation in religion; their
religious belief is driven by intrinsic factors. Others, however, see religious belief as a means
to their own ends, such as a satisfying social need, a sense of security, and status (Allport &
Ross, 1967). Their religious belief is driven by extrinsic factors. Weaver & Agle (2002)
found that individuals with intrinsic religious orientation are high in determination and self-
esteem thus encouraged and anticipated actual entrepreneurial activity. On the other hand,
individuals with extrinsic religious orientations appear to discourage entrepreneurship.
Morgan (2005) in his research has found that the traditional wall between faith and
work is crumbling at an accelerated rate and that religion can longer seem to be “a hat
that can be removed and forgotten as soon as an employee enters the doorway of an
office.” Further, Cash and Gray (2000) found that during the decade spanning 1994
to 2000 the percent of workers who felt they needed to experience spiritual growth in their
work increased from 30% to 78%. Because of these dramatic changes, organizational
researchers have begun to examine the influence of religion and spirituality on work
outcomes.
Recent researchers have examined the relationship between religious belief and job
satisfaction, job performance, organization-based self-esteem, and organizational frustration.
However, researchers have failed to examine the direct influence of individuals’ religious
and spiritual beliefs on their commitment to their work as well as their performance
which influences the organization performance. Religious involvement can be defined as, the
extent to which an individual attends religious services and takes part in worship activities,
groups, committees, and worship-related organizations (Day,2005). Researchers have
11
examined the relationship between religiosity and civic involvement and found out that the
more religious individuals easily took part in civic volunteer activities in the society
(Weaver, & Agle, 2002).
Day, (2005) says that individuals with higher levels of religious involvement have lower
rates of alcohol and drug abuse and addiction which have negative impacts on an employee’s
productivity. Noland, (2003) adds that the relationship between religious practices and the
avoidance or moderate use of alcohol is well documented, whether or not denominational
groups specifically prohibit the use of alcohol. Barro and McCleary (2005) indicate that
religion significantly affects the level of an individual's happiness and overall sense of well-
being. Happy people tend to be productive and law-abiding and also tend to learn well, thus
having a positive impact on an organization’s performance (Elm, 2003). Weaver, & Agle,
(2002) state that employees who frequently attend religious services are less stressed, and
have a greater sense of control which is correlated with decreased distress hence are more
productive at work. They further add that the employees who have a strong religious
commitment have an increased self-esteem and social support, as well as enhanced coping
skills which positively contribute to their work performance.
An earlier review of 250 epidemiological health research studies found a reduced risk of
colitis, different types of cancer, and untimely death among people with higher levels of
religious commitment. Conversely, at any age, those who did not attend religious services
had higher risks of dying from cirrhosis of the liver, emphysema, arteriosclerosis, and other
cardiovascular diseases and were more likely to commit suicide, according to an even earlier
review by faculty of the John Hopkins University School of Public Health. Weaver, & Agle,
(2002) add that the most significant pathway by which religious practice delivers these
longevity benefits is a lifestyle that reduces the risk of mortality from infectious diseases and
diabetes, by encouraging a support network among family and friends that helps to maintain
a pattern of regimented care. King, & Williamson, (2005) agree that healthy employees are
more productive at work and they contribute tremendously to an organization’s success.
Conscientiousness, agreeableness, and satisfaction were all found to be positively associated
with religion (Kutcher, et al., 2010; McCullough & Willoughby, 2009). Studies also found
that Christian university students and adults during their important religious experience,

12
perceived themselves as high in agreeableness and conscientiousness (McCullough &
Willoughby, 2009). However, later studies have revealed that the relationship between
individuals’ religiousness and their involvement in civic organizations is more complicated
than first believed (Day,2005). Barro and McCleary ( 2005) have shown that, on
average, it is true that the religious are more involved in civic organizations than the
non-religious up to a certain level; but, as religiousness increases, religious involvement also
increases leading to individuals spending less time engaged in secular, civic organizations.
Individuals who are highly religious often devote a significant amount of their time and
resources to their religious activities leaving little time for secular and civic activities. This
then affects the organization’s commitments and performance (Elm, 2003). Day (2005) states
that as an individual’s religiosity increases, they become more devoted to their religious
social networks which then weaken ties to other civic activities and organizations as well as
coworkers. Garcia‐Zamor (2003) explains that as religiosity in an individual increases, they
begin to place more emphasis on their spiritual world and less emphasis on the material,
secular world. The need to engage more in religious good works surpasses the desire to
volunteer in civic activities (King, & Williamson, 2005). Noland, (2003) adds that
individuals who possess high levels of religiosity are more likely to place significant
value on spiritual rewards than material rewards. This then may result to less attachment to
financial or otherwise results offered by ones job. When this is the case, an organization
faces a high employee turnover from the highly religious employees than from the non-
religious ones (Cash & Gray, 2000).
2.2. Employee Value System and Organizational Performance
Individuals are part of societies and culture manifests itself through individuals, (Brette &
Weast 2012). Knippenberg (2000) states that human beings have different goals and
expectations about their work depending on the culture they live in. Hofstede (1980) asserts
that the values and beliefs held by members of cultures influence the degree to which the
behaviors of individuals, groups, and institution within cultures are enacted and the degree to
which they are viewed as legitimate, acceptable, and effective. All individuals possess a
moral compass, defined via values, which direct how they treat others and conduct
themselves (Merrit 2000). Soares, et.al (2007) adds that People who lack strong or ethical

13
values may participate in negative behavior that can hurt the organization. While a company
cannot do anything about the influences that shape a person's values and behavior before
hiring, the organization can try to influence employee behavior in the workplace (Li, Lam, &
Qian, 2001).
Knippenberg (2000) states that a system of punishments and rewards can help foster the type
of values the company wants to see in its employees, essentially filtering behavior through
conditioning. If people see that certain behaviors are rewarded, then they may decide to alter
their behavior and in turn alter their values. In addition, Soares, et.al (2007) adds that a gap
sometimes exists between a person's values and behavior. This gap can stem from a
conscious decision not to follow a specific value with a corresponding action. This decision
can be influenced by how deeply this value affects the person's character and by the
surrounding environment.
Barret (2005) acknowledges that an employee can deal with a situation in three different
ways. They can use their beliefs to formulate a response, they can use their values to
formulate a response, or they can use their intuition to formulate a response. Barrett
continues to explain that if you use beliefs to make decisions; those decisions will reflect
your past history in dealing with similar situations. Past history is always experienced and
context-based, and beliefs are not equipped to handle complex new situations that have not
been experienced previously. Beliefs are steeped in our past histories, habits and traditions,
and are thus constrained by individual experiences and not as adaptable to new situations.
Alternatively, if you use values to make decisions, those decisions will align with the future
you want to experience. Values transcend both contexts and experiences. Therefore, they can
be used for making tough decisions in complex situations that have not yet been experienced.
As a result, values provide a more flexible mode of decision-making than beliefs.
Knippenberg (2000) indicates that when an individual discovers genuine and meaningful
alignment between his or her own personal values with those of his or her employer, a
powerful connection is created. This connection creates numerous possibilities for both
individual growth and company productivity, manifested in several ways. Ringov et.al
(2007) explains that when an organization and its team members unite around a shared set of
values, they become more flexible, less hierarchical, less bureaucratic, and they develop an

14
enhanced capacity for collective action. When employees not only share similar values – but
also a similar vision – the performance of a company is enhanced. Soares, et.al (2007) adds
that shared values build trust. Trust is the foundation on which relationships are established,
both with team members and customers alike. Value-based leadership is a way of making
authentic decisions that build the trust and commitment of employees and customers (Barret,
2005).
Sociologically speaking, Kenya does not have a ‘national culture’ similar to what
obtains in the Western world. This is because Kenya is made up of forty three ethnic
groups. From all indications, one cannot expect a multicultural, multiethnic,
multi-religious and pluralistic nation like Kenya to have a homogeneous culture. In
recognition of this diversity, for this study, we will not focus on individual ethnic groups but
by dimensions of culture using Hofstede’s (1980, 1991) typology of culture as equivalent to
individual’s respondents’ values. This simply means that the value of an individual will be
identified in terms of the selected dimension of culture. Hofstede (2012) explains that
Cultural values influences individual’s thinking and behavior which then impacts on their
performance. Hofstede describes value theory to includes five dimensions of cultural values
and beliefs which are Individualism versus Collectivism, Masculinity versus Femininity,
Tolerance versus Intolerance of Uncertainty, Power Distance (Stratification) versus Power
Equalization and long term versus short term orientation, (Hofstede 1980).
Power Distance is the extent to which people in a society accept the often unequal
distribution of power, (Merrit 2000). Triandis (2004) describes power distance as the extent
to which power differences are expected and accepted by a society. A high score on power
distance indicates the belief that there should be a well-defined order in which every
individual has a rightful place; a low score indicates the belief that everyone should have
equal rights and the opportunity to change their position in society, (Merritt 2000). Hofstede
(2001) believes that employees are better judges of power than their superiors. Employees of
high power distance prefer the paternalistic style of leadership whereby they accept and
expect to be told what to do. Low power distance employees prefer a consultative leadership
style because they like to be consulted, (Soares, Farhangmehr, & Shoham, 2007).
15
Triandis (2004) describes Individualism as a culture attribute that explains a loose-knit social
framework in which people emphasize only the care of themselves and their immediate
family. In cultures that uphold individualism, people are expected to take care of themselves
and their immediate family, and remain emotionally independent from the group, (Merritt
2000). According to Hofstede (2001) individualistic employees prefer self-sufficiency. The
individuals decide and take actions by themselves instead of with others. Independence,
creativity, self-reliance, solitude, and self-actualization are valued in individualistic cultures
(Triandis, 2004).
Triandis 2004 goes further to explain that individualistic employees prefer to have
management done at the individual level than as a group. For these employees, self interest is
the dominant motivation (Soares, et.al 2007). Individualistic employees find it important to
advance more than others and to succeed in different kind of ways (Knippenberg 2000).
Knippenberg (2000) further explains that to them tasks prevail over relationships.
Individualistic employees are more likely than collectivistic employees to run the risk of
opposing invention when they have not contributed (Soares et.al 20070. This is because they
put less value on knowledge and ideas that are developed in a different context and put more
emphasis on individual initiative and personal achievement (Chrisman, Chu, & Steier, 2002).
Collectivism is a national culture attribute that describes a tight social framework in which
people expect others in groups of which they are a part to look after them and protect them
(Triandis, 2004). People in collectivist cultures are less likely than individualists to
emphasize the significance of information that is written and codified and are more likely
than individualists to disregard such information (Chrisman et.al 2002). Collectivistic
cultures need face-to-face contact because people depend on context more than do
individualists who are quite satisfied with written communications (Hofstede, 2001).
Employees with a collective culture tend to be more emotionally dependant on their
colleagues and organization than individualistic employees (Ringov, & Zollo, 2007). Ringov
& Zollo (2007) believe that an organization has an obligation of taking care of collectivistic
employees’ failure to leads to dissonance in social order and peoples values. A collectivistic
employee expects a relationship of trust and loyalty from the employer (Merritt 2000).
Knippenberg (2000) says that these employees don’t expect to be fired for a mistake but
16
rather to be corrected and given more chances. On the other hand as Hofstede (2001) puts it,
an individualistic employee does not expect a personal relationship with the employer but
rather a more calculative one.
Li, Lam, & Qian, (2001) state that collectivist employees find it natural to treat people closer
to them in a better manner because they expect a relationship of trust to be built before
business can take place. Individualistic employees on the other hand treat their clients
equally. According to Ringov et.al (2007) individualistic employees expect performance
appraisals that will enable them to improve on their weak areas while collective employees
see it as demining to discuss ones performance. Ringov et.al (2007) further explains that
employees with collective cultures believe it’s important for them to fully use their abilities
and learn new skills on a job than those of individualistic cultures. Li et.al (2001) says that
individualistic employees think it’s more valuable to have an exciting work than to earn more
money hence their work performance greatly improves when they are happy with what they
do.
Merritt (2000) describes uncertainty avoidance as a culture attribute describing the extent to
which a society feels threatened by uncertain and ambiguous situations and tries to avoid
them. Hofstede (1980) refers to it as the extent to which the society willingly accommodates
risk and ambiguity. Employees who are risk averse are characterized with high scores of
uncertainty avoidance. They prefer certainty and security. In contrast, employees
characterized by low scores are motivated by risk taking and searching for novel solutions
(Li et.al, 2001). Li et.al, (2001) also stated that when employees are characterized by strong
uncertainty avoidance, the introduction of new leadership styles or strategies raises their
anxiety level which leads to resistance of abandonment of the systems and structures that
they are acquainted with. Employees in strong uncertainty avoidance cultures, tend to stay
with their organizations for a long time. In contrast, those from weak uncertainty avoidance
cultures are much more mobile, (Ringov et.al 2007)Employees with strong uncertainty
avoidance cultures are likely to be more resistant to change which makes transfer of change
difficult to administer (Brette & weast 2012). Employees with low uncertainty avoidance
feel less in control of external forces than those of a high tolerance. Company loyalty is a
virtue for them. However they expect to have flexible working hours (Li et.al, 2001)

17
Long-term orientation is a culture attribute that emphasizes the future, thrift, and persistence
while Short-term Orientation is a culture attribute that emphasizes the past and present,
respect for tradition (Triandis, 2004). Hofstede (2001) explains long term-orientation as the
extent to which a society exhibits a pragmatic future oriented perspective rather than a
conventional historic or short term point of view. Employees scoring low tend to be
conventional and traditional, and pursue instant benefits and satisfaction in work related
aspects. On the other hand, employees scoring high have thrift for investment and a long-
term orientation both financially and psychologically. They also value long-term
commitment towards organizations and career, (Li et.al, 2001)
Chrisman et.al (2002) describes masculinity as the way in which people are motivated
towards different types of goal, either concerned with the quality of life (feminine) or money
and recognition (masculinity). Ringov & Zollo (2007) describe the dimension of
masculinity/femininity as a reflection to the degree to which the social gender roles are
clearly distinct. In masculine cultures, males are expected to be assertive, tough and focused
on material success, and females are expected to be tender and focused on quality of life (Li,
et.al 2001). Traditional masculine goals include: earnings, recognition, and advancement,
valuing material possessions, assertiveness and money. Traditional feminine goals include:
good relations with supervisors, peers, and subordinated; good living and working
conditions; and employment security (Hofstede, 1980).
2.3. Employee Language and Performance
Language is the key to a person’s self-identity. Language allows us to relate and understand
each other (Imberti, 2007). Language is defined as a system of conceptual symbols that
allows individuals to communicate (Imberti, 2007). It is an artifact of how thoughts are
formulated as well as how they are communicated and discussed (Bartel, 2001). Language
affects almost every aspect of life. It not only aids in communication but is also a link to an
individual’s identity (Lauring, 2008). It enables the person to express emotions, share
feelings, tell stories, and convey complex messages and knowledge (Imberti, 2007; Lauring,
2008).

18
The interplay between corporate language and natural or cultural languages is a critical
challenge to business practice (Welch, Welch, & Piekkari, 2005). The language used by
decision makers in a company both shapes and bounds what the company focuses on and
how it articulates its strategic options (Brannen & Doz, 2012). In this regard, language can
facilitate and significantly limit strategic growth and performance of companies. Language
barriers can be key factors that prevent information about the target market from reaching
organizational decision makers (Brannen & Doz, 2012).Language barriers can arise between
individuals from diverse cultural backgrounds. These barriers then influence various aspects
of the service experience and become a critical issue during intercultural service encounters
(Imberti, 2007). When one is unable to identify with other cultural groups, they may have
negative attitudes towards such groups (Bartel, 2001). Being ignorant of such differences can
prevent customers who cannot speak the language being used by an employee, from
interacting with them (Baker & Haretl, 2004).
Mambert (2001) observes that a big problem, which is faced by many employees today, is
the language issue. Mambert (2001) illustrates language barrier through an example that in
some cultures saying ‘no’ is considered discourteous. Instead they give signal of ‘yes’ and in
this specific situation they generally mean ‘I hear you, I understand what you are saying’. A
native of American culture would conceive this as a strong response of understanding.
Mostly foreign-born employees say yes even though they don’t understand completely the
other’s meanings to avoid an embarrassing situation.
Communication between people who speak different languages can be difficult (Worman,
2006). Katz & Pesetsky (2011) state that employees who are not fluent in the primary
language used in the workplace may have difficulty expressing their needs or responding to
requests from colleagues and customers. This can lead to providing incorrect or misleading
information. A customer who is unable to clearly understand the worker due to a heavy
accent or lack of command of the language may become frustrated and take his business
elsewhere (Levinson et.al., 2002). Common language barriers can in the end contribute to a
work environment in which employees generally lack knowledge about the company, its
products and their jobs (Worman, 2006). Levinson et.al, (2002) adds that this can contribute
to poor production, creativity and results within the organization. It can also lead to poor

19
communication and ineffective results during interactions with clients or customers. Verbal
and non-verbal language is very important in business. For example, transferring the
linguistic signals alone across cultures does not ensure that the meaning is transferred as
intended. On the contrary, more often than not shifts in meaning occur as the linguistic codes
are given sense in a new cultural context, from the perspective of local interpretive frames
and communicative norms (Brannen, 2004).
The significant role of language is knowledge sharing as described by Baker & Haretl,
(2004). Imberti (2007) says that the importance of language becomes even more vital when
difference in native languages of the partner or employees increases the ambiguity
substantially. The lack of fluency in the corporate language may create a possible big
obstacle which reduces the limits of understanding of each other’s behaviors (Lauring, 2008).
This leads to misunderstandings and communication problems in multicultural settings and
affects the knowledge sharing, transfer and learning processes heavily (Mambert
2001).According to Riege (2005) many researchers have noted that the ability of individuals
to share their knowledge depends heavily on their communication skills. For effective
knowledge sharing, effective verbal and written communications are necessary (Bartel,
2001). Verbal communication is the most common carrier of sharing of tacit knowledge
(Riege, 2005). Cross-cultural communication problems may come in different forms and
sizes but all these results in the fact that the message did not get across. Sometimes in such
situations the recipient did not understand the meaning of message but the worst situation is
that when the recipients have understood the meanings of message totally different from the
actual ones (Laroche, 2003).
Effective communication strengthens the connections between a company and all of its
stakeholders (Levinson, Kita, Haun, & Rasch, 2002). Bartel (2001) explains that with
increase in complexity of organization’s structure and technology, effective communication
is critical to the success of any organization. Cultural and language differences can hinder
effective communication. Language barriers can directly negatively impact on work
productivity costing organizations due to slower information dissemination (Levinson, et.al,
2002). Levinson et.al, (2002) further states that employees of similar cultural backgrounds or
who speak the same primary language tend to bond together. Individuals may have little
20
social interaction with those outside of their clique, engaging them only out of business
necessity (Kochan et.al, 2004). In culturally integrated work groups, some employees may
choose to speak their primary language with each other instead of the primary workplace
language, leaving others to feel excluded from the conversation (Levinson, et.al, 2002). This
de-motivates employees who feel excluded.
Language which is the vehicle by which strategic thoughts are formulated, communicated
and discussed plays an essential role in the functioning of teams (Brannen, 2004). Employees
who face daily challenges due to language barriers may experience frustration and dread
when they go to work and interact with non-native employees, which can lead to morale
problems (Katz & Pesetsky, 2011). This is particularly true if they have already been
negative consequences, such as missed deadlines, creating blame, mistrust and ill will
(Worman, 2006). Frustration can lead to additional barriers, such as the native speaker
communicating in a louder voice in an attempt to be understood and thus creating more
friction throughout the organization (Levinson, et.al, 2002).
Language aids in knowledge sharing. Knowledge is a vital organizational resource due to
which organizations gain a sustainable competitive advantage (Katz & Pesetsky, 2011). If
knowledge sharing is not particularly observed, then the available well-known resources will
remain underutilized (Argote, Cabrera as cited in Lauring & Selmer, 2011). Also the
presence of language differences has negative effects on knowledge sharing (Welch &
Welch, 2008). Most often it is challenging in multicultural organizations to cope with
linguistic and cultural barriers (Lauring & Selmer, 2011).
Al-Alawi et.al, (2007) have stated that communication among employees of an organization
plays an important role for knowledge sharing which depends on the opportunities and
frequencies of face-to-face meetings. The communication within an organization may flow
horizontally or vertically and encourage the employees to share information and knowledge,
depending on the structure of an organization (Katz & Pesetsky, 2011). In a hierarchical
structure, there are impaired flows of communication and knowledge is being shared on the
basis of need to know (Riege, 2005). On the other hand, in organizations having flat
structure, there is much collaboration and cooperation among the employees. It develops a
conductive environment to knowledge sharing. A less hierarchical company has tendency of

21
positive influence on flow of knowledge sharing as there are less reasons to withheld
knowledge and information with them from their colleagues (Wang & Noe 2010). According
to Riege (2005) many researchers have noted that the ability of individuals to share their
knowledge depends heavily on their communication skills. For effective knowledge sharing,
effective verbal and written communications are necessary. Verbal communication is the
most common carrier of sharing of tacit knowledge. In knowledge management process the
communication plays a fundamental role. If organization wants to manage knowledge then it
needs to improve understanding of communications, process of learning and knowledge
sharing within the organization (Quintas, 2002).
Employees from different cultures display emotions differently. What is considered an
appropriate display of emotions differs from culture to culture (Jehn & Bezrukova, 2004).
Some cultures encourage open displaying of anger, fear or frustration in the workplace while
others deem it as being inappropriate and only discuss the factual aspects of the situation
(Ang, et.al 2007). When a workplace becomes overly affected by the emotional state of one,
a few or several workers, in can significantly affect the ability of people to work together
(Jehn & Bezrukova, 2004).Wang & Noe (2010) state that a supervisor who routinely
expresses negative emotions can overwhelm workers. Co-workers who routinely project
emotional outbursts can create hostile working relationships.
Companies have come to recognize the importance of language when it comes to service
delivery, (Quintas, 2002). They have also understood the importance of an official corporate
language in regards to employees and investors’ commitment, (Kochan et.al, 2004). In
addition, Laroche, (2003) adds that more companies have begun to put in place language
guidelines for use in virtual communication including e-mail, texting and video -
conferencing in order to avoid misinterpretations. So, the interplay between corporate
language and natural and national languages is a critical challenge to international business
theory and practice, (Imberti, 2007).
Corporate language is built over time around domain-specific usages of words, acronyms and
stories that often reflect the industry context and the national language environment in the
country of origin (Brannen & Doz, 2012). While such specialized language is usually clear to
insiders, it is not to outsiders who lack the shared experience of the former. Moreover,

22
speakers attach invisible meanings to the information exchanged in english as they draw on
the language systems and interpretive frames of their respective mother tongues (Kassis,
2005). This makes it difficult to achieve purposeful communication and significantly
complicates knowledge transfer across distance and differentiated contexts. Tietze and Dick
(2013) take a critical look at the lack of reflexivity in regard to the use of english in business
processes. They note that from the perspective of the individual employee, having english as
a second or third language is mostly seen and felt as a handicap, something to be overcome,
rather than as a potential resource.
2.4. Chapter Summary.
This chapter presents a review of literature based on research objectives; to find out how
employee religion affects organization performance, to establish whether employee value
system affect organization performance and to find out if employee language affects
performance. Chapter three looks into the research methodology used in the research.

23
CHAPTER THREE
3.0. RESEARCH METHODOLOGY
3.1. Introduction
This chapter presents the methodology and procedures the researchers adopted in conducting
the research in order to answer the research objectives that were raised in the chapter one.
This chapter is structured as follows; research design, population and sample, data collection
methods, sampling design and sample size, research procedures, data analysis methods and
finally the chapter summary.
3.2. Research Design
Research design is a detailed outline of how an investigation took place. It entails how data is
collected, the data collection tools used and the mode of analyzing data collected (Cooper &
Schindler (2006). This study used a descriptive research design. Gill and Johnson (2002)
state that a descriptive design looks at particular characteristics of a specific population of
subjects, at a particular point in time or at different times for comparative purposes. The
choice of a survey design for this study was deemed appropriate as Mugenda and Mugenda
(2003) attest that it enables the researcher to determine the nature of prevailing conditions
without manipulating the subjects.
Further, the survey method was useful in describing the characteristics of a large population
and no other method of observation can provide this general capability. On the other hand,
since the time duration to complete the research project was limited, the survey method was a
cost effective way to gather information from a large group of people within a short time.
The survey design made feasible very large samples and thus making the results statistically
significant even when analyzing multiple variables. It allowed for many questions to be
asked about a given topic giving considerable flexibility to the analysis. Usually, high
reliability is easy to obtain by presenting all subjects with a standardized stimulus; observer
subjectivity is greatly eliminated. Cooper and Schindler (2006) assert that the results of a
survey can be easily generalized to the entire population.
24
3.3. Population and sampling design
3.3.1 Population
Population according to Cooper & Schindler (2006) is the total collection of elements about
which we wish to make some inferences. Mugenda and Mugenda (2003) define population as
an entire group of individuals, events or objects having common observable characteristics.
In this study, the study population was the employees of the Libya Oil petrol stations located
within Nairobi.
3.3.2 Sampling Design
Sampling design is a method used in selecting some elements of a group to represent the
entire group of the population of interest (Cooper and Schindler, 2006). According to
Mugenda and Mugenda (2003), the process of selecting a number of individuals for a study
in such a way that the individuals selected represents the large population is referred to as
sampling. Sampling rescues on the length of time needed to complete the study. It cuts on
costs and becomes manageable as it almost mirrors the populations (Gallardo, Lachlan and
Davis 2012). Sampling enables a higher overall accuracy than a census. In additional
collecting data from fewer cases means that you can collect information that is more detailed
(Sharp and Howard 2006). This study made use of probability sampling to obtain the desired
sample. As Cooper and Schindler (2006) put it, this is a controlled, randomized procedure
that assures that each population element is given a known nonzero chance of selection.
3.3.2.1 Sampling Frame
The sampling frame, according to Gill and Johnson (2000) is a list of members of the
research population from which a random sample may be drawn. It is a set defining which
individuals, households, or institutions qualify for a sample, and then the sample is drawn
from those elements. Gallardo, Lachlan and Davis (2012) define sampling frame as the
listing of the accessible population from which you'll draw your sample. In some instances
sampling frame can be the whole or part of a population (Garson 2012). For this study, our
sampling frame was the oil Libya petrol stations employees who are based in Nairobi.

25
3.2.2.2 Sampling Technique
Sampling technique is the process used in drawing a sample from a population (Cooper and
Schindler, 2006). Stratified random sampling was used for this study. With stratified
sampling the population is divided into groups based on some characteristics. Then within
each group a probability sample (often a simple random sample) is selected. In stratified
sampling the groups are called strata (Cooper and Schilndler 2006). A random sample from
each stratum is then identified using proportional allocation procedures. In this case study,
the employees were categorized in terms of job description each consisting of a stratum. A
representative sample was picked at random from each of the seven functions identified.
Every potential respondent had an equal chance of being picked since the sampling was done
at random. Stratification ensured fair representation of all business functions and fairness in
the sample selected.
3.3.2.3 Sample Size
A sample size is the group of people who you select to be in your study (Cooper and
Schilndler 2006). According to Mugenda & Mugenda (2003) an appropriate sample should
be between 10-30% of the population. Owing to the size of the sampling frame, a thirty per
cent (30%) sample size was selected for purposes of this study. This sample size was picked
in relative proportions from each of the petrol stations in Nairobi. The sample size was
considered appropriate and representative of the entire population.
Table 3.2. Sample Size
Function Sampling Frame Sample size The Sample
Pump attendants 102 30% 30
Administrators’ 17 30% 5
Mechanics 20 30% 6
watchmen 17 30% 5
Car wash attendants 14 30% 4
Supervisors 17 30% 5
Managers 17 30% 5
TOTAL 204 30% 60
26
3.4 Data Collection Methods
Data collection is the process of gathering and measuring information on targeted variables
in an established systematic fashion, which then enables one to answer relevant questions and
evaluate outcomes (Cooper and Schilndler 2006). For this study the collection of primary
data was done using a five point Likert scale type of questionnaire designed to capture
aspects of the three research questions. The choice of a questionnaire for this study was
considered to be ideal given that questionnaires are stable consistent and uniform offering a
considered and objective view of issues. The questionnaires that were used in this study
contained only closed ended questions.
3.5 Research Procedures.
In order to validate the research instruments a pilot study was conducted to a small sample of
5 respondents who were not included in the final study. The pilot study was used to identify
items on questionnaire that were ambiguous hence improve the final questionnaire. In the
same vein, the researcher obtained a letter from the university so as to facilitate data
collection.
3.6 Data Analysis Methods
Data Analysis is the process of systematically applying statistical and/or logical techniques,
to describe, illustrate and evaluate data (Cooper and Schilndler 2006). Descriptive statistics
was used to analyze data. Therefore, means, standard deviations, frequency distributions,
percentages and regression analysis were used to analyze quantitative data that was generated
from the research. The data was coded and analyzed with the aid of Statistical Package for
Social sciences (SPSS) and MS Excel. The data was then summarized and presented in tables
and figures.
3.7. Chapter Summary
This chapter outlines how research design was applied, data types and data collection
methods that were available and the way in which information collected was analyzed.
Additionally the population sampling technique, sample frame and sample size that was used
have also been explored. The data analysis tools, SPSS Program and MS Excel have been
mentioned.

27
CHAPTER FOUR
4.0 RESULTS AND FINDINGS
4.1 Introduction
This chapter presents the results of the study on the effect of employee cultural diversity on
organizational performance in Oil Libya. This chapter is categorized into five sections, which
are in line with the research questions. The first component talks about the general
information on the population under study. The second component presents findings on the
employee religion. The third component examines findings on the employee’s value system.
The fourth component examines findings on the employee language. Finally, the last
component presents findings on the organizational performance.
4.2. General Information
This section provides vital information of the respondents based on gender, age, and
designation level, level of education and years of experience in the industry.
4.2.1 Response rate
This study had a sample size of 60 respondents from the six existing stratum at Oil Libya
petrol stations. 53 of the respondents gave a response while 7 of them failed to. This
represents a response rate of 88% as shown in table 4.1. This shows that response rate was
good.
Table4.1: Response rate
Questionnaires Number Percentage
Filled and collected 53 88.4
Non Response 7 11.6
Total 60 100

28
4.2.2 Age of Respondents
From the findings, the variable had a mean of 3.6 and a standard deviation of 0.921.The
respondents with the highest proportion was that of age below 30, this was followed by those
between age 31-40 at 34 %, group 41-50 had at 19 % as shown in figure 4.1 below, while
those over 50 years were the least at 4%. This shows that majority of the employees working
at Oil Libya petrol stations were young people who are still in search of a stable career path.
Figure 4.1: Age of Respondents
4.2.3 Gender of the Respondents
From the findings the variable gender had a mean of 1.5 and a standard deviation of 0.134.
The respondents with the highest proportion were male with 68% while female had a
proportion of 32% as shown in figure 4.2 below. This showed that Oil Libya petrol station
employees are mostly men who are probably more flexible with the working conditions and
hours for that particular job.
Figure 4.2: Gender
0
10
20
30
40
50
60
70
80
Male Female
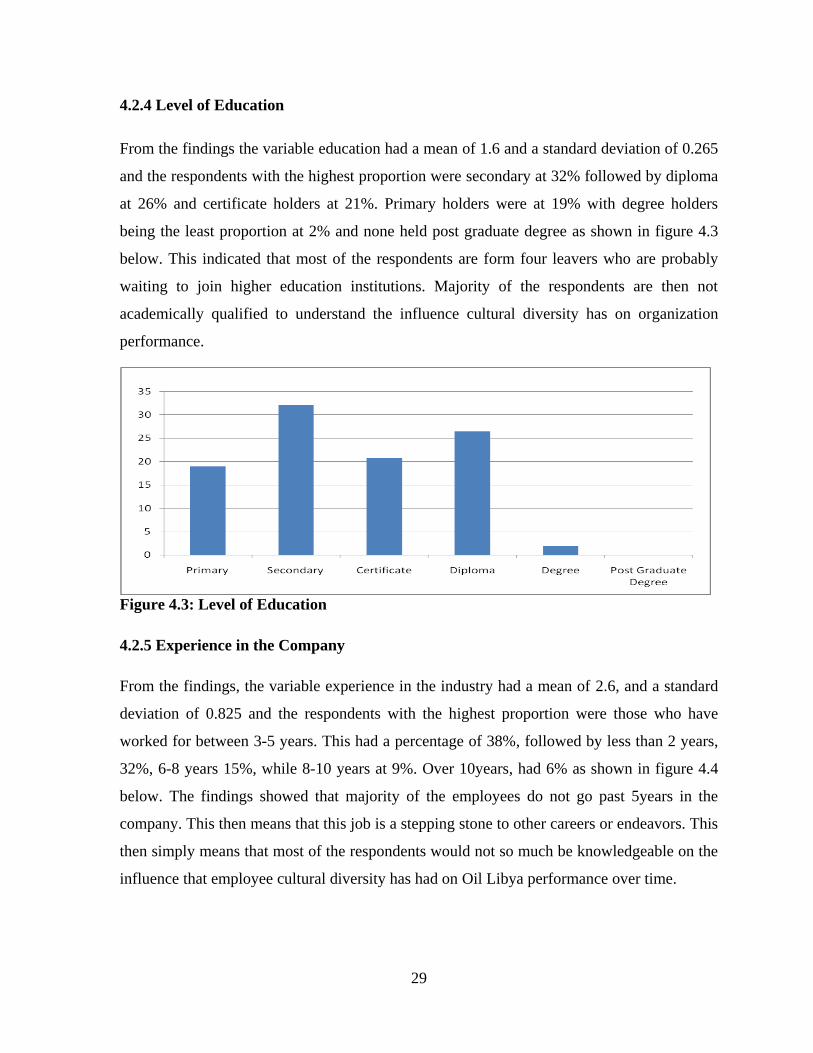
29
4.2.4 Level of Education
From the findings the variable education had a mean of 1.6 and a standard deviation of 0.265
and the respondents with the highest proportion were secondary at 32% followed by diploma
at 26% and certificate holders at 21%. Primary holders were at 19% with degree holders
being the least proportion at 2% and none held post graduate degree as shown in figure 4.3
below. This indicated that most of the respondents are form four leavers who are probably
waiting to join higher education institutions. Majority of the respondents are then not
academically qualified to understand the influence cultural diversity has on organization
performance.
Figure 4.3: Level of Education
4.2.5 Experience in the Company
From the findings, the variable experience in the industry had a mean of 2.6, and a standard
deviation of 0.825 and the respondents with the highest proportion were those who have
worked for between 3-5 years. This had a percentage of 38%, followed by less than 2 years,
32%, 6-8 years 15%, while 8-10 years at 9%. Over 10years, had 6% as shown in figure 4.4
below. The findings showed that majority of the employees do not go past 5years in the
company. This then means that this job is a stepping stone to other careers or endeavors. This
then simply means that most of the respondents would not so much be knowledgeable on the
influence that employee cultural diversity has had on Oil Libya performance over time.

30
Figure 4.4: Experience in the Industry
4.2.6 Designation of the Employees
From the findings low level managers had the highest number of respondents at (58%),
middle level managers was at (28%) while top level had the least respondents at (14%) as
shown in table 4.2 below. This shows that most of the respondents in this study were the
employees whose actions directly impacted on organizational performance.
Table 4.2: Designation of the employees
Position Distribution
Frequency Percentage
Managers 2 4
Supervisors 3 6
Employees 48 90
Total 53 100

31
4.3 Employee Religion and Organization Performance
In this section, the study sought to determine whether religion had an influence on Oil Libya
performance. The first part will look at the descriptive of religion with the second part
looking at the regression analysis of religion and organization performance.
4.3.1 Descriptive on the variables of Religion
Table 4.3: Descriptive on the variables of influence of Religion
Variable Mean Standard
Deviation
My religion encourages hard work 4.73 0.753
The company gives me time to practice my religion 4.67 0.830
My religion guides my everyday life 4.63 0.942
My religious beliefs influence the way I work 4.21 1.025
The company respects my religion 4.18 0.869
I prefer working with people with similar religious beliefs 4.15 0.793
My religious practices enable me to cop well with others 4.11 0.810
My religious beliefs greatly influence my commitment to work 4.09 0.932
My religious beliefs make me a better employee 4.06 1.075
I would choose my religion over my job. 3.2 0.889
The respondents were asked to respond whether religion influenced their performance.
Using a five point liker scale the findings revealed that most of the respondents agreed with
the variables and the variables with the highest mean was on how religion encourages hard
work (4.73). The respondents when asked if they would choose religion over their job had
the lowest mean (3.2). Religion encourages hard work had the least SD (0.753) indicating
that the respondents had minimal variations in their responses to this question while religion
influences the way I work had the highest SD (1.025) indicating that the respondents had the
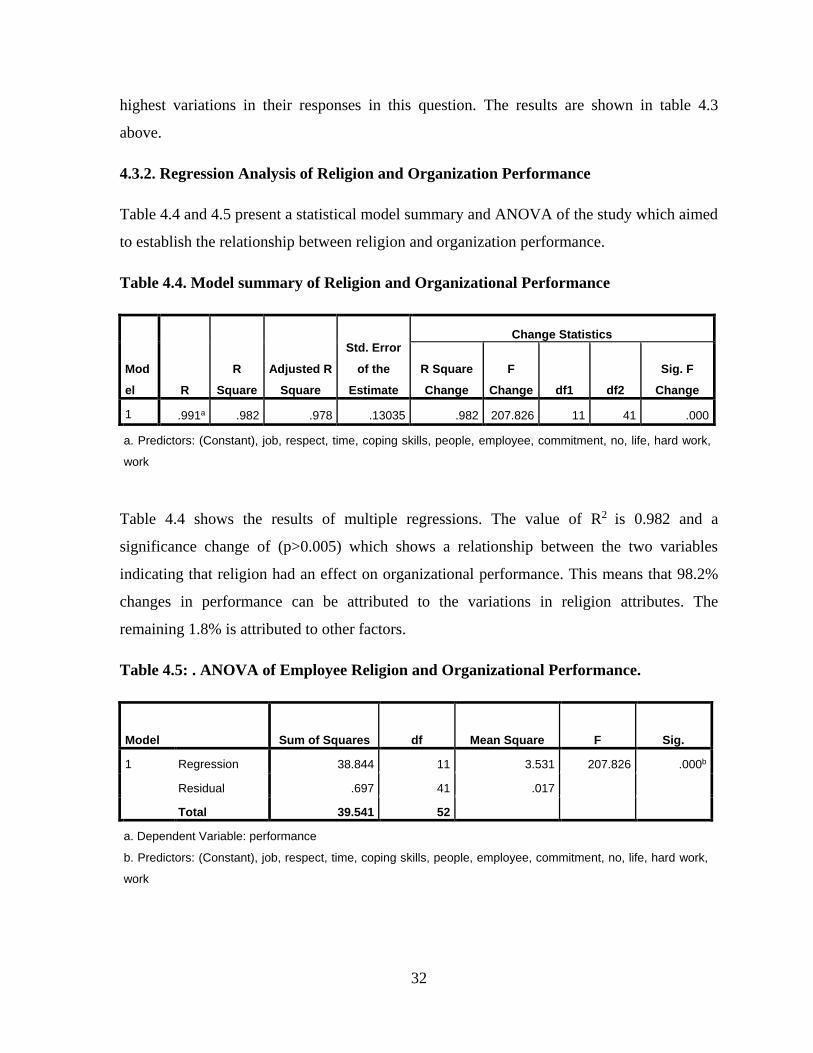
32
highest variations in their responses in this question. The results are shown in table 4.3
above.
4.3.2. Regression Analysis of Religion and Organization Performance
Table 4.4 and 4.5 present a statistical model summary and ANOVA of the study which aimed
to establish the relationship between religion and organization performance.
Table 4.4. Model summary of Religion and Organizational Performance
Mod
el R
R
Square
Adjusted R
Square
Std. Error
of the
Estimate
Change Statistics
R Square
Change
F
Change df1 df2
Sig. F
Change
1 .991a .982 .978 .13035 .982 207.826 11 41 .000
a. Predictors: (Constant), job, respect, time, coping skills, people, employee, commitment, no, life, hard work,
work
Table 4.4 shows the results of multiple regressions. The value of R2 is 0.982 and a
significance change of (p>0.005) which shows a relationship between the two variables
indicating that religion had an effect on organizational performance. This means that 98.2%
changes in performance can be attributed to the variations in religion attributes. The
remaining 1.8% is attributed to other factors.
Table 4.5: . ANOVA of Employee Religion and Organizational Performance.
Model Sum of Squares df Mean Square F Sig.
1 Regression 38.844 11 3.531 207.826 .000b
Residual .697 41 .017
Total 39.541 52
a. Dependent Variable: performance
b. Predictors: (Constant), job, respect, time, coping skills, people, employee, commitment, no, life, hard work,
work

33
The table shows the significant level denoted by significant F in the ANOVA table is 0.00
while the F critical is 207.826. The p value (sig) = (0.000<0.005) is significant and therefore
the entire model fits well. This shows that the model was significant indicating that religion
does affect organization performance.
Table 4.6. Coefficient of Religion and Organizational Performance
Model
Unstandardized
Coefficients
Standardize
d
Coefficient
s
t Sig.
95.0% Confidence
Interval for B
B Std. Error Beta
Lower
Bound
Upper
Bound
1 (Constant) 2.844 .446 6.377 .000 1.944 3.745
no -.037 .005 -.658 -6.815 .000 -.048 -.026
work -.020 .079 -.032 -.256 .799 -.179 .139
life -.109 .088 -.150 -1.234 .224 -.286 .069
respect .155 .065 .135 2.393 .021 .024 .286
time .141 .049 .173 2.855 .007 .041 .241
employee -.034 .072 -.035 -.476 .637 -.180 .111
people -.117 .069 -.157 -1.704 .096 -.256 .022
commitment .053 .060 .069 .877 .386 -.069 .174
Hard work .028 .082 .042 .338 .737 -.138 .194
coping skills -.022 .056 -.031 -.399 .692 -.135 .090
job .308 .078 .351 3.947 .000 .150 .465
a. Dependent Variable: performance
The results of the regression coefficients, t-statistics, standard errors of the estimates and p
values are shown in table 4.6 above. The variables were positively correlated. When
performance was predicted on company respect for employee religion (Beta=.135, p=.021),
time to practice religion (Beta=.173, p=.007), influence on commitment to work (Beta=.069,
p=.386) and hard work (Beta=.042, p=737) were positive but insignificant predictors with
only choosing religion over job (Beta=.351, p>0.005) being a positive and significant

34
predictor. This means that respect, time, commitment and hard work positively affect
performance even though not in a significant way. Job on the other hand positively affects
performance in a significant way.
When performance was predicted on work (Beta=-.032 p>.799), life (Beta= -.150 p>.224),
employee (Beta-.035 p>.637), people (Beta=.-.157 p>.096) and coping skills (Beta=.-.031
p>.692) were negative and not significant factors. This means that work, life, employee,
people and coping skills variables negatively affect performance though not in a significant
way.
4.4. Employee Value system and Organization Performance
The second objective sought to determine whether employee value system had an influence
on Oil Libya performance. The first part looked at the descriptive of value system with the
second part looking at the regression analysis of value system and organization performance.
4.4.1. Descriptive on Employee Values
Table 4.7: Descriptive on Employee Values
Variable Mean Standard
Deviation
My cultural values emphasize greatly on team work 4.96 1.193
Cultural values affect integrity 4.24 0.989
My cultural values greatly influence job performance 4.15 1.065
My company’s values are in line with my cultural values 4.12 0.843
My company emphasizes on positive cultural values 4.11 0.840
My company discourages negative cultural values 4.09 0.952
cultural values affect sales productivity 3.2 1.134
Strong adherence to my cultural values improves business
outcomes
3.16 1.025
I am comfortable with changes in the company 2.4 1.03
Cultural values affect customer satisfaction 1.96 0.879

35
A descriptive statistic of the various variables of employee values was done and according to
the findings, only the variables: cultural values emphasize greatly on team work, cultural
values affect integrity, cultural values greatly influence job performance, company’s values
are in line with my cultural values, company emphasizes on positive cultural values and
company discourages negative cultural values had a mean above 4.0. Cultural values affect
customer satisfaction had the lowest mean of (1.96). My company emphasizes on positive
cultural values had the least SD (0.843) indicating that the respondents had minimal variations
in their responses to this question while my cultural values emphasize greatly on team work
had the highest SD (1.193) indicating that the respondents had the highest variations in their
responses in this question. These results are shown in table 4.7 above.
Table 4.8 Model summary of Employee Value System and Performance
Model R
R
Square
Adjusted R
Square
Std. Error of the
Estimate
Change Statistics
R Square
Change
F
Change df1 df2
Sig. F
Change
1 .987a .975 .970 .15177 .975 185.951 9 43 .000
a. Predictors: (Constant), change, teamwork, negative cv, customer, biz outcome, sales product, job perform,
positive cv, COMPANY VALUES
Table 4.8 shows the results of multiple regressions. The value of R2 is 0.975 and a
significance change of (p>0.005) which shows a relationship between the two variables
indicating that employee value system had an effect on organizational performance. This
means that 97.5% changes in performance can be attributed to the variations in value system
attributes. The remaining 2.5% is attributed to other factors.
Table 4.9. ANOVA of Employee Value System and Organizational Performance.
Model Sum of Squares df Mean Square F Sig.
1 Regression 38.550 9 4.283 185.951 .000b
Residual .991 43 .023
Total 39.541 52

36
a. Dependent Variable: performance
b. Predictors: (Constant), change, teamwork, negative cv, customer, biz outcome, sales product, job
perform, positive cv, COMPANY VALUES
The table shows the significant level denoted by significant F in the ANOVA table is 0.00
while the F critical is 185.951. The p value (sig) = (0.000<0.005) is significant and therefore
the entire model fits well. This shows that the model was significant indicating that employee
value system does affect organization performance
Table 4.10. Coefficients of Employee value system Effect on Organization Performance.
Model
Unstandardized
Coefficients
Standardiz
ed
Coefficient
s
t Sig.
95.0% Confidence
Interval for B
B Std. Error Beta
Lower
Bound
Upper
Bound
1 (Constant) .011 .112 .095 .924 -.215 .236
COMPANY
VALUES .204 .098 .238 2.090 .043 .007 .401
customer .310 .062 .304 4.969 .000 .184 .436
sales product .126 .113 .134 1.116 .271 -.102 .353
biz outcome .270 .092 .291 2.941 .005 .085 .456
teamwork .145 .044 .207 3.330 .002 .057 .233
positive cv .083 .076 .120 1.095 .280 -.070 .236
negative cv .010 .105 .013 .099 .922 -.201 .222
job perform -.202 .077 -.271 -2.617 .012 -.357 -.046
change .061 .070 .071 .867 .391 -.081 .202
a. Dependent Variable: performance
The results of the regression coefficients, t-statistics, standard errors of the estimates and p
values are shown in table 4.10 above. When organizational performance was predicted on
customer (Beta=.304, p>0.005), business outcome (Beta=.291, p>0.005), team work
(Beta=.207, p>0.005), were positive and significant predictors with sales product
(Beta=.134, p>0.271), company values (Beta=.238, p>.043), positive cultural values
(Beta=.120, p>0.280), negative cultural values (Beta=.013, p>0.922), and change

37
(Beta=.071, p>0.391) being positive but not a significant predictors. This means that
customer, business outcome, team work affect organizational performance in a significant
positive way while sales product, company values, positive cultural values, negative cultural
values and change affect performance in a positive but insignificant way.
4.5. Employee Language and Organization Performance.
The third objective of the study sought to determine whether employee language had an
influence on Oil Libya performance. The first part will look at the descriptive of value
system with the second part looking at the regression analysis of language and organization
performance.
4.5.1. Descriptive on the variables of Employee language
Table 4.11: Descriptive on the variables of Employee language
Variable mean Standard
deviation
Use of English hinders my proper transfer of knowledge 4.67 0.890
I am able to fluently communicate with my fellow employees 4.56 1.123
I am able to fluently communicate with clients 4.49 0.997
My ethnic language influences my interpersonal skills 4.21 0.897
My ethnic language affects my work performance positively 4.18 1.104
Differences in Language generate conflict among employees 4.11 0.943
Having official language use policies improves performance 4.09 0.922
I face communication challenges when communicating with
people
4.03
1.035
I prefer working with people of same ethnic language as myself 1.96 0.846
My ethnic language affects my work performance negatively 1.9 0.934

38
A descriptive statistic of the various variables of employee language was done and according
to the findings, only the variables: I prefer working with people who speak the same ethnic
language as myself and my ethnic language affects my work performance negatively had a
mean of less than (4.0). Use of corporate language (English) hinders my proper transfer of
knowledge had the highest mean of 4.11. I prefer working with people who speak the same
ethnic language as myself had the least SD (0.846) indicating that the respondents had
minimal variations in their responses to this question while I am able to fluently
communicate with my fellow employees had the highest SD (1.123) indicating that the
respondents had the highest variations in their responses in this question. These results are
shown in table 4.11 above.
4.5.2. Regression Analysis of Language and Organization Performance
Table 4.12 and 4.13 present a statistical model summary and ANOVA of the study which
aimed to establish the relationship between language and organization performance.
Table 4.12.Model summary of Employee Language and Organizational Performance
Table 4.12 shows the results of multiple regressions. The significant level denoted by
significant F in the ANOVA table is 0.00 while the F critical is 161.230.The value of R2 is
0.975 and a significance change of (p>0.005) which shows a relationship between the two
variables indicating that employee language had an effect on organizational performance
Model R
R
Square
Adjusted R
Square
Std. Error
of the
Estimate
Change Statistics
R Square
Change
F
Change df1 df2
Sig. F
Change
1 .987a .975 .969 .15460 .975 161.230 10 42 .000
a. Predictors: (Constant), ethicity, EMPLOYEES, challenges, conflict, client, negative wp, positive wp, inter
skills, policies, English

39
Table 4.13 ANOVA of Employee Language and Organizational Performance.
The table shows the p value (sig) = (0.000<0.005) is significant and therefore the entire
model fits well. This shows that the model was significant indicating that employee language
does affect organization performance. It means that 97.5% of language affects performance
of a company. The remaining 2.5% is attributed to other factors.
Table 4.14. Coefficients of Employee Language and Organization Performance
Model
Unstandardized
Coefficients
Standardize
d
Coefficients
t Sig.
95.0% Confidence
Interval for B
B Std. Error Beta
Lower
Bound
Upper
Bound
1 (Constant) -.056 .151 -.370 .713 -.361 .249
EMPLOYEES .050 .078 .047 .640 .526 -.108 .208
client .105 .085 .099 1.235 .224 -.067 .276
challenges .080 .079 .119 1.008 .319 -.080 .239
conflict .080 .061 .099 1.321 .194 -.042 .202
English -.063 .099 -.084 -.634 .530 -.262 .137
policies .008 .109 .009 .076 .940 -.211 .227
positive wp .099 .089 .105 1.110 .273 -.081 .278
negative wp .215 .074 .229 2.921 .006 .067 .364
inter skills .100 .123 .103 .814 .420 -.148 .349
ethnicity .289 .059 .358 4.851 .000 .169 .409
a. Dependent Variable: performance
Model Sum of Squares df Mean Square F Sig.
1 Regression 38.537 10 3.854 161.230 .000b
Residual 1.004 42 .024
Total 39.541 52
a. Dependent Variable: performance
b. Predictors: (Constant), ethicity, EMPLOYEES, challenges, conflict, client, negative wp, positive wp, inter
skills, policies, english

40
The results of the regression coefficients, t-statistics, standard errors of the estimates and p
values are shown in table 4.10 above. When organizational performance was predicted on
employees (Beta=.047, p>0.526), client (Beta=.099, p>0.224), challenges (Beta=.119,
p>0.319), conflict (Beta=.099, p>0.194), policies (Beta=.009, p>0.940), positive work
performance (Beta=.105, p>0.273), negative cultural values (Beta=.074, p>0.229), and
interpersonal skills (Beta=.103, p>0.420) were positive and insignificant predictors. This
means that these variables positively affect performance however in an insignificant way.
Ethnicity (Beta=.358, p>0.005) on the other hand was positive and significant predictor. This
means that ethnicity positively affects performance in a significant way. When organizational
performance was predicted on use of english language (Beta=.-.084 p>.530), it became the
only negative insignificant predictor. This means that english language negatively affects
organizational performance.
4.6. Chapter Summary
This chapter provided an analysis of the data collected from the respondents. The first part
provided an analysis of the demographic information on the respondents. The second part
analyzed the findings on employee religion on organization performance. The third section
provided findings on employee value system effect on organization performance. The final
section provided findings on how language affects performance. The next chapter puts
forward the discussions, conclusions on the findings and recommendations for improvement
and further advancement in future research.

41
CHAPTER FIVE
5.0 SUMMARY, DISCUSSION, CONCLUSIONS AND RECOMMENDATIONS
5.1 Introduction
This chapter presents the summary and discussions on the results of the research as well
as explanations and significance to established literature . It looks at the effects of the
findings to the prevailing body of facts in the field of strategic management. The conclusion
and the recommendation sections are presented according to the research questions.
5.2 Summary
The purpose of this study was to investigate the effect of employee cultural diversity on
organization performance. The research was guided by the following objectives; to find out
how employee religion affect organization performance, to establish how employee value
system affect organization performance and to determine whether employee language
affected performance
A descriptive research approach was taken and the information obtained used to better
describe the characteristics associated with the target population and to estimate the
proportion of a population demonstrating the said characteristics. The target population for
this research therefore composed of the Oil Libya petrol station employees in Nairobi.
Quantitative data collected was analyzed by the use of descriptive statistics in Statistical
Package of SPSS and excel. This was presented in percentages, means, standard deviations,
frequencies and Frequency tables and regression tables.
The first objective was to determine the effect of employee religion on organization
performance. According to the findings, employee religion has an effect on organization
performance. The findings revealed that company respect for employee religion (Beta=.135,
p=.021), time to practice religion (Beta=.173, p=.007), influence on commitment to work
(Beta=.069, p=.386) and hard work (Beta=.042, p=737) positively affected organizational
performance in an insignificant way. Choosing religion over job (Beta=.351, p>0.005) was
found to positively affect performance in a significant way. The findings also revealed that
work (Beta=-.032 p>.799), life (Beta= -.150 p>.224), employee (Beta-.035 p>.637), people

42
(Beta=.-.157 p>.096) and coping skills (Beta=.-.031 p>.692) negatively affected performance
however not in a significant manner.
The second objective was to determine the effects of employee value systems on
organization performance. On analyzing the research objective it was established that,
cultural values affected organization performance with customer (Beta=.304, p>0.005),
business outcome (Beta=.291, p>0.005), team work (Beta=.207, p>0.005), positively
affecting organizational performance in a significant manner. Sales product (Beta=.134,
p>0.271), company values (Beta=.238, p>.043), positive cultural values (Beta=.120,
p>0.280), negative cultural values (Beta=.013, p>0.922), and change (Beta=.071, p>0.391)
also positively affected organizational performance insignificantly. The findings showed that
job performance (Beta=.-.271 p>.012) negatively affects organization performance in an
insignificant way.
The third objective was to determine whether employee language had an effect on
organization performance. On analyzing the objective the findings revealed that employees
(Beta=.047, p>0.526), client (Beta=.099, p>0.224), challenges (Beta=.119, p>0.319), conflict
(Beta=.099, p>0.194), policies (Beta=.009, p>0.940), positive work performance (Beta=.105,
p>0.273), negative cultural values (Beta=.074, p>0.229), and interpersonal skills
(Beta=.103, p>0.420) positively affect performance however in an insignificant way.
Ethnicity (Beta=.358, p>0.005) on the other hand positively affects performance in a
significant way. Further the findings revealed that english language (Beta=.-.084 p>.530)
negatively affects organizational performance insignificantly.
5.3 Discussion
5.3.1 Religion and Organization Performance
On analyzing the research objective it was revealed that employee religion had an effect on
organization performance. This is similar to the findings by Cash & Gray, (2000) whose
findings revealed that religion and spirituality strongly influence many American managers’
behaviors’ at work. The findings revealed that the company respects its employee’s religion
and it giving employees time to practice their religions positively affected performance. This
supports Kutcher, et al., (2010) who noted that the many benefits religious beliefs has been

43
found to have on physical and mental health and ethical decision making, has pushed some
organizations to support and encourage expressions of religion and faith in the workplace.
The finding also revealed that as religious beliefs influenced work performance negatively.
The findings agree with Barro and McCleary ( 2005) who argued that, on average, it is
true that the religious are more involved in civic organizations than the non-religious but
up to a certain level; as religiousness increases, religious involvement also increases leading
to individuals spending less time engaged in secular, civic organizations. Individuals who
are highly religious often devote a significant amount of their time and resources to their
religious activities leaving little time for secular and civic activities. This then affects the
organization’s commitments and performance (Elm, 2003). Day (2005) states that as an
individual’s religiosity increases, they become more devoted to their religious social
networks which then weaken ties to other civic activities and organizations as well as
coworkers. Garcia‐Zamor (2003) explains that as religiosity in an individual increases, they
begin to place more emphasis on their spiritual world and less emphasis on the material,
secular world. The need to engage more in religious good works surpasses the desire to
volunteer in civic activities (King, & Williamson, 2005).
It was further revealed that employees’ commitment to work was positively influenced by
religion. This is in line with Weaver, & Agle, (2002) findings that showed that that the more
religious individuals easily took part in civic volunteer activities in the society. Day (2005)
research findings also stated that individuals with higher levels of religious involvement had
lower rates of alcohol and drug abuse and addiction which have negative impacts on an
employee’s productivity and job commitment. Contrary to Barro and McCleary (2005)
findings that indicated that religion significantly affected the level of an individual's
happiness and overall sense of well-being, the findings revealed that the variables; religion
guides my everyday life and religion makes me a better employee negatively affects
organization performance. Elm (2003) theory that happy people tend to be productive and
law-abiding and also tend to learn well, thus having a positive impact on an organization’s
performance was contradicted in this study.
The findings revealed that religious employees coped well with their colleagues. This is
similar to Weaver, & Agle, (2002) findings that indicated that employees who frequently

44
attend religious services are less stressed, and have a greater sense of control which is
correlated with decreased distress hence are more productive at work. They further add that
the employees with religiously commitments have an increased self-esteem and social
support, as well as enhanced coping skills which positively contribute to their work
performance.
Finally the findings revealed that majority of the respondents would choose their religion
over their jobs. This is similar to Day (2005) findings that indicated that as an individual’s
religiosity increases, they become more devoted to their religious social networks which then
weaken ties to other civic activities and organizations as well as coworkers. Garcia‐Zamor
(2003) findings also stated that as religiosity in an individual increases, they begin to place
more emphasis on their spiritual world and less emphasis on the material, secular world. The
need to engage more in religious good works surpasses the desire to volunteer in civic
activities (King, & Williamson, 2005).Noland, (2003) research also revealed that individuals
who possess high levels of religiosity are more likely to place significant value on
spiritual rewards than material rewards. This then may result to less attachment to financial
or otherwise results offered by ones job. When this is the case, an organization faces a high
employee turnover from the highly religious employees than from the non- religious ones
(Cash & Gray, 2000).
5.3.2. Effects of Employee Value system on Performance
According to the findings, cultural values affected organization performance. This is in line
with Knippenberg (2000) research who states that human beings have different goals and
expectations about their work depending on the culture they live in. Hofstede (1980) asserts
that the values and beliefs held by members of cultures influence the degree to which the
behaviors of individuals, groups, and institution within cultures are enacted and the degree to
which they are viewed as legitimate, acceptable, and effective. Soares, et.al (2007) adds that
People who lack strong or ethical values may participate in negative behavior that can hurt
the organization.
The findings revealed that when employee values are in line with the organization values,
performance is affected positively. The findings indeed affirm that Knippenberg (2000) was

45
right to state that when an individual discovers genuine and meaningful alignment between
his or her own personal values with those of his or her employer, a powerful connection is
created. This connection creates numerous possibilities for both individual growth and
company productivity, manifested in several ways. When employees not only share similar
values – but also a similar vision – the performance of a company is enhanced (Barret, 2005).
The study discovered that the emphasis of cultural values on team work positively affected
organization performance in a significant manner. This is true according to Ringov et.al
(2007) who explains that when an organization and its team members unite around a shared
set of values, they become more flexible, less hierarchical, less bureaucratic, and they
develop an enhanced capacity for collective action. Soares, et.al (2007) adds that shared
values build trust. Trust is the foundation on which relationships are established, both with
team members and customers alike. Values-based leadership is a way of making authentic
decisions that build the trust and commitment of employees and customers (Barret, 2005).
The findings also revealed that the company’s emphasizes on positive cultural values while
discouraging negative cultural values positively affected organization performance. This is
similar to Li, Lam, & Qian, (2001) recommendations that while a company cannot do
anything about the influences that shape a person's values and behavior before hiring, the
organization can try to influence employee behavior in the workplace. Knippenberg (2000)
states that a system of punishments and rewards can help foster the type of values the
company wants to see in its employees, essentially filtering behavior through conditioning. If
people see that certain behaviors are rewarded, then they may decide to alter their behavior
and in turn alter their values.
Finally the studies revealed that majority of the respondents were not comfortable with
changes in the company. This is in line with Merritt (2000) who describes this character as
uncertainty avoidance culture attribute. He further describes it as the extent to which a
society feels threatened by uncertain and ambiguous situations and tries to avoid them.
Hofstede (1980) refers to it as the degree to which the society willingly accepts ambiguity
and risk. Employees characterized by high scores of uncertainty avoidance are risk averse;
they prefer certainty and security.

46
5.3.3. Effects of Employee Language on Performance
The findings revealed that employees being able to communicate with fellow employees and
clients positively influenced organization performance. This affirmed Imberti (2007) study
that language allows us to relate and understand each other. It enables one to express their
emotions and feelings, tell stories, as well as convey complex messages and knowledge
(Imberti, 2007; Lauring, 2008). In this regard, language can facilitate and significantly limit
strategic growth and performance of companies.
The study revealed that facing communication challenges when communicating with people
positively influenced performance. This contradicted Brannen & Doz, (2012) findings that
revealed that language barriers can be key factors that prevent information about the target
market from reaching organizational decision makers. Imberti, (2007) stated that language
barriers can arise between individuals from diverse cultural backgrounds. These barriers then
influence various aspects of the service experience and become a critical issue during
intercultural service encounters.The findings also revealed that having official language use
policies positively influenced performance. This is in line with Brannen & Doz, (2012)
findings that state that the language used by decision makers in a company both shapes and
bounds what the company focuses on and how it articulates its strategic options. In this
regard, language can facilitate and significantly limit strategic growth and performance of
companies
The findings also showed that conflict generated by language differences negatively
influenced performance. This is true according to Bartel, (2001) findings that established that
not being able to identify with other cultural groups leads to negative attitudes towards such
groups. Baker & Haretl, (2004) add that a sense of ignorance due to such differences can
prevent customers who cannot understand the language being used by an employee, from
interacting with them was also contradicted. Employees from different cultures display
emotions differently. What is considered an appropriate display of emotions differs from
culture to culture (Jehn & Bezrukova, 2004). Some cultures encourage open displaying of
anger, fear or frustration in the workplace while others deem it as being inappropriate and
only discuss the factual aspects of the situation (Ang,et.al 2007).

47
The study revealed that corporate language (English) hindering proper transfer of knowledge
negatively affected performance. The findings affirm Lauring (2008) findings that stated that
the lack of fluency in the corporate language creates a possible big obstacle which reduces
the limits of understanding each other’s behaviors. This leads to misunderstandings and
communication problems in multicultural settings and affects the knowledge sharing, transfer
and learning processes heavily (Mambert 2001). According to Riege, (2005) verbal
communication is the most common carrier of sharing of tacit knowledge. Laroche (2003
states that, cross-cultural communication problems may come in different forms and sizes but
all these results in the fact that the message did not get across. Sometimes in such situations
the recipient did not understand the meaning of message but the worst situation is that when
the recipients have understood the meanings of message totally different from the actual
ones. Katz & Pesetsky (2011) adds that employees who are not fluent in the primary
language used in the workplace may have difficulty expressing their needs or responding to
requests from colleagues and customers. This can lead to providing incorrect or misleading
information. A customer who is unable to clearly understand the worker due to a heavy
accent or lack of command of the language may become frustrated and take his business
elsewhere (Levinson, et.al 2002).
Finally the study revealed that employees preferring to work with people who spoke the same
language as them positively influenced performance. This is similar to Levinson et.al (2002)
findings that indicated that employees of similar cultural backgrounds or who speak the same
primary language tend to bond together. Kochan et.al, (2004) findings revealed that
individuals may have little social interaction with those outside of their clique, engaging
them only out of business necessity. This then contradicted Levinson, et.al (2002) who
discourages ethnicity by stating that in culturally integrated work groups, some employees
may choose to speak their primary language with each other instead of the primary
workplace language hence side lining others.

48
5.4 Conclusion
5.4.1 Effects of Employee Religion on Organization Performance
On analyzing the research objective it was evident that employee religion had an effect on
organization performance. Seven religion variables did not have a significant effect on
organizational performance with only three which were; respect, time and job that had a
positive significant effect on organizational performance. Religious beliefs had a negative
impact on employee work performance, however they positively influenced on work
commitment.
5.4.2. Effects of Employee Value system on Performance.
The study established that cultural values affected organization performance positively. Five
employee value system variables did not have a significant effect on organizational
performance with only five which were; company values, customer, business outcomes and
team work that had a positive significant effect, and job performance which had a negative
effect on organizational performance. The findings revealed that cultural values emphasized
on team work and that the company emphasized on positive cultural values and discouraged
negative cultural values which positively influenced its performance.
5.4.3. Effects of Employee Language on Performance
From the findings, all the employee language variables did not have a significant effect on
organizational performance with only ethnicity and negative working practices having a
positive significant effect on organizational performance. The findings revealed that
differences in language generated conflict because of the lack of skill of being able to
identify with other cultural groups. The findings also showed that differences in language
raised communication barriers that hindered effective transfer of knowledge. The results of
the research also indicated that having official language use policies negatively affected
performance.

49
5.5 Recommendation
5.5.1 Recommendation for Improvements
5.5.1.1.1Effects of Religion on Organization performance
In order to avoid a high employee turnover, there is a dire need to ensure that all employees
are given an opportunity to practice their religion. Alternatively there is a need for the firm to
have a system that fairly allows all the employees to practice their religion and engage in
religious activities that both contribute positively to the individual and organization.
5.5.1.2 Effects of Cultural Values on Organization Performance
In order to avoid conflict the company needs to have its values in line with the employee
cultural values. Training needs to be done on the different dimensions of cultural values to
reduce on any conflict that arises because of differences in value system, and enhance unity
and cohesion at the work place. A gap sometimes exists between a person's values and
behavior. The company can use strategies, such as a reward system, to close that gap.
5.5.1.3 Effect of Language on Organization Performance
The company needs to conduct a training on how on how to minimize communication
barriers. A seminar on cultural diversity will also come in handy to curb the conflict that
arises from diversity in ethnicity. Having language use policies will also minimize cases of
employees feeling outcast when working with colleagues who speak the same language.
5.5.2 Recommendation
The study focused only on three aspects of employee cultural diversity, it is recommended
that other studies be done to unearth more on the subject. This will ensure increased
reliability of the statistics and effects for generalization. The study covered only one
company, this shows that the results of this study are skewed towards the perceptions and
data from only one organization. It is suggested that such a study be done in other firms in
other sectors to increase the statistical power of the study and more reliable results.

50
One of the distinct challenges faced in the section of literature review was the absence of
comparative studies across the ethnic groups in Kenya. In short, there are not many studies
that have focused on how organizations perform in the different ethno-cultural and
geographical locations in Kenya. There is therefore a tremendous potential for research in
this direction.

51
REFERENCES
Ahiauzu, A. I. (2000).The African Thought System and the Work Behavior of the African
Industrial Man :International Studies of Management and Organization. Fashoyin.
Nigeria: Macmillan Publishers
Al-Alawi, A.I., Al-Marzooqi, N.Y., & Mohammed, Y.F. (2007).Organizational Culture and
Knowledge Sharing: Critical Success Factors. Journal of Knowledge Management,
Vol. 11 Iss: 2, pp.22–42
Ang, S., Van Dyne, L., Koh, C., Ng, K. Y., Templer, K. J., Tay, C., & Chandrasekar, N. A.
(2007). Cultural Intelligence: Its Measurement and Effects on Cultural Judgment and
Decision Making, Cultural Adaptation and Task Performance. Journal of
Management and Organization Review, Vol (3), pp.335-371.
Aluko, M. A.. O. (1998) Factors that Motivate the Nigerian Workers. Journal of Ife Social
Science Review, Obafemi Awolowo University, Vol. 15, pp. 190–199.
Noland, M. (2003). Religion, Culture, and Economic Performance. Institute for International
Economics Working Paper.pp3-8.
Barro, R. J., & McCleary, R. (2003). Religion and Economic Growth .National Bureau of
Economic Research. No. w9682.
Bartel, C.A. (2001) ‘Social Comparisons in Boundary-spanning Work: Effects of
Community Outreach on Members’ Organizational Identity and Identification’.
Journal of Administrative Science Quarterly. Vol,46: pp.379–413.
Barker, S., & Haertel, C. E. J. (2004). Intercultural Service Encounters: An Exploratory
study of Customer Experiences. Journal of Cross Cultural Management, Vol, 11 ;
issue,1,pp. 3-14.
Berry, H., Guillén, M. F., & Zhou, N. (2010). An institutional approach to cross-national
distance. Journal of International Business Studies, 41(9), 1460-1480.
Blunt, P. and Jones, L. M. (1992). Managing Organizations in Africa. New York: Walter de
Gruyter & Co.
Brannen, M. Y., & Doz, Y. L. (2010). From a Distance and Detached to up close and
Personal: Bridging Strategic and Cross-Cultural Perspectives in International
Management Research and Practice. Scandinavian Journal of Management, 26: 236-
247
Briksonn, J., (2000). Management Innovation. Academy of Management Review, 33, 825–45.
Cannella, A. A., Park, J. H., & Lee, H. U. (2008). Top Management Team Functional
Background Diversity and Firm performance: Examining the roles of team member
colocation and Environmental Uncertainty. Academy of Management Journal, 51,768-
784.

52
Cash, K. C., & Gray, G. R. (2000). A framework for Accommodating Religion and
Spirituality in the workplace. The Academy of Management Executive, 14(3), 124-
133.
Cox, T. (1994). Cultural Diversity in Organizations: Theory, Research and Practice. Berrett-
Koehler Publishers.
Cox, D. (2001). Product and Process Innovations: A Review of Organizational and
Environmental Determinants. Innovation, Science, and Institutional Change. Oxford:
Oxford University Press, 38–66.
Chrisman, J. J., Chua, J. H., & Steier, L. P. (2002). The Influence of National Culture and
Family Involvement on Entrepreneurial Perceptions and Performance at the State
Level. Entrepreneurship: Theory and Practice, 26(4), 113-131.
Day, N. E. (2005). Religion in the workplace: Correlates and Consequences of Individual
Behavior. Journal of management, spirituality & religion, 2(1), 104-135.
Ely, R. J., & Thomas, D. A. (2001). Cultural diversity at work: The effects of Diversity
Perspectives on Work group processes and outcomes. Administrative science
quarterly, 46(2), 229-273.
Elm, D. R. (2003). Honesty, spirituality, and performance at work. Handbook of workplace
spirituality and organizational performance, 277-288.
Engelen, A., Brettel, M., & Wiest, G. (2012). Cross-functional integration and new product
performance—the impact of national and corporate culture.Journal of International
Management, 18(1), 52-65.
Garcia‐Zamor, J. C. (2003). Workplace spirituality and organizational performance. Public
administration review, 63(3), 355-363.
George, M. J. & Jones, G. R. 1996.Understanding and Managing Organizational Behavior.
New York:Addison-Wesley.
Harrison, D. A., Price, K. H., Gavin, J. H., & Florey, A. T. (2002). Time, teams, and task
performance: Changing effects of surface-and deep-level diversity on group
functioning. Academy of management journal, 45(5), 1029-1045.
Hofstede,G. (1984). Cultures' Consequences: International Differences in Work-Related
Values. Abridged edition. Beverly Hills, CA: Sage Publications.
Hofstede,G. (2001) Cultural Consequences: Comparing values, behaviors, institutions and
Organizations across nations. (2nd ed) Thousand oaks, ca: sage publication inc.
Irungu, M. S. (2007). The Effect of top Management Teams on the Performance of Publicly
Quoted Companies in Kenya. Unpublished PhD. Thesis, School of Business,
University of Nairobi.
53
Imberti, P. (2007). Who resides behind the words? Exploring and understanding the language
experience of the non-English speaking immigrant. Families in Society, Vol.
88(1),pp.67-73.
Kassis Henderson, J. 2005. Language diversity in international management teams.
International Studies of Organization & Management, 35(2): 66–82.
Lauring, J. (2008). Rethinking social identity theory in international encounters: Language
use as a negotiated object for identity making. International Journal of Cross
Cultural Management, Vol.8, pp.343.
Lauring,J.(2007).Language and ethnicity in international management. Corporate
Communications: An International Journal Vol. 12 No. 3, pp. 255-266.
Laroche,L.(2003).Managing cultural diversity in technical professions. NY-USA.
Butterworth-Heinemann Publications,
Jackson, S.E., Joshi, A. & Erhardt, N. L. (2003). Recent research on team and organizational
diversity: SWOT analysis and implications. Journal of Management, Vol.29 (6),pp.
801-830.
Jackson, S. E., May. K. E., & Whitney, K. (1995). Understanding the dynamics of diversity
in decision-making teams. In R. A. Guzzo & E. Salas (Eds.) Team effectiveness and
decision making in organizations. pp. 204-261. San Francisco: Jossey-Bass
Morgan, J. F.(2005) Perhaps oil and water can mix: The Workplace Religious Freedom Act
of 2005. Employee Relations Law Journal, Vol.31: pp.27-47.
Jehn, K. A., & Bezrukova, K. (2004). A field study of group diversity, workgroup context,
and performance. Journal of Organizational Behavior, Vol. 25(6), pp.703-729
Katz, J., & Pesetsky, D. (2011). The identity thesis for language and music.URL http://ling.
auf. net/lingBuzz/000959.
Kimberly,J.R. & Evanisko, M. J. (1981). Organizational innovation: The influence of
individual, organizational and contextual factors on hospital adoption of technological
and administrative innovations. Academy of Management Journal, Vol.24, pp.689-
713.
Kirkman,B.L. & Rosen,B.(1999). Beyond Self Management: Antecedents and Consequences
of Team Empowerment. Academy of Management Journal, Vol. 42
Knight, D., Pearce, C.L., Smith, K.G., Olean, J.D., Sims, H.P., Smith, K.A.& Flood, P.
(1999). Top management team diversity, group process, and strategic consensuses.
Strategic Management Journal, Vol.(20)5, pp.445-465.

54
King, J. E., & Williamson, I. O. (2005). Workplace religious expression, religiosity and job
satisfaction: Clarifying a relationship. Journal of management, spirituality & religion,
2(2), 173-198.
Kochan, T., Bezrukova, K., Ely, R., Jackson, S., Joshi, A., Jehn, K., & Thomas, D. (2003).
The effects of diversity on business performance: Report of the diversity research
network. Human resource management, Vol.42(1), pp.3-21.
Levinson, S. C., Kita, S., Haun, D. B., & Rasch, B. H. (2002). Returning the tables:
Language affects spatial reasoning. Cognition, Vol.84(2), pp.155-188.
Li, J., Lam, K., & Qian, G. (2001). Does culture affect behavior and performance of firms?
The case of joint ventures in China. Journal of International Business
Studies, Vol.32(1), pp.115-131.
Mambert,W.A.(2001) The elements of effective communication (3rdEd.). Washington,
Acropolis Publishers,.
Merritt, A. (2000). Culture in the cockpit do Hofstede’s dimensions replicate?. Journal of
cross-cultural psychology, 31(3), 283-301.
Pothukuchi, V., Damanpour, F., Choi, J., Chen, C. C., & Park, S. H. (2002). National and
organizational culture differences and international joint venture
performance. Journal of international business studies, 33(2), 243-265.
Ringov, D., & Zollo, M. (2007). The impact of national culture on corporate social
performance. Corporate Governance: The international journal of business in
society, 7(4), 476-485.
Riege, A.(2005).Three-dozen knowledge-sharing barriers managers must consider. Journal
of Knowledge Management, Vol 9, No. 3, pp.18-35.
Soares, A. M., Farhangmehr, M., & Shoham, A. (2007). Hofstede's dimensions of culture in
international marketing studies. Journal of business research, 60(3), 277-284.
Stahl, G. K., Maznevski, M. L., Voigt, A., & Jonsen, K. (2010). Unraveling the effects of
cultural diversity in teams: A meta-analysis of research on multicultural work groups.
Journal of international business studies, 41(4), 690-709.
Triandis, H. C. (2004). The many dimensions of culture. The Academy of Management
Executive, 18(1), 88-93.
Tietze, S., & Dick, P. 2013. The victorious English language: Hegemonic practices in the
management academy. Journal of Management Inquiry, 22(1): 122–134.
Van Knippenberg, D. (2000). Work motivation and performance: A social identity
perspective. Applied psychology, 49(3), 357-371.
Wang, S. & Noe, R.A.(2010).Knowledge sharing: A review and directions for future
research.. Human Resources Management, pp.115-131.
55
Weaver, G. R., & Agle, B. R. (2002). Religiosity and ethical behavior in organizations: A
symbolic interactionist perspective. Academy of management review, 27(1), 77-97.
Welch, D. E., Welch, L. S., &Piekkari, R. (2005). Speaking in tongues: The importance of
language in international management processes. International Studies of
Management & Organization, 35(1):10-27.

56
APPENDICES
Appendix A: Cover Letter
P.O BOX 42066-00100
NAIROBI,Kenya.
Dear respondent,
RE: PARTICIPATION IN AN ACADEMIC SURVEY
I am an MBA student pursuing my degree at United States International University. I am
currently conducting research study entitled “EFFECT OF EMPLOYEE CULTURAL
DIVERSITY ON ORGANIZATION PERFORMANCE.” As one of the major
requirements for attainment of a Degree in Master of Business Administration (MBA), you
have been randomly selected to take part in this study as a respondent.
Please complete all your items to reflect your opinions and experiences. Please answer all
questions freely. You cannot be identified from the information you provide and no
information about individuals will be given to any organization. The data collected will be
used for purposes of this academic research only.
Your participation is important for the success of this project and I greatly appreciate your
contribution.
Yours sincerely,
Neema Mecheo

57
Appendix B: Questionnaire
SECTION A: GENERAL INFORMATION
1. Please indicate your gender
Male Female
2. Kindly indicate your age category
Below 30 years 31- 40 years 41- 50 years Over 51 years
3. For how long have you been working in the organization?
Less than 2 years 3-5 years 6-8years 8-10years Over 10 years
4. What is your designation?
Manager Supervisor Employee
5. What is your level of education?
Primary Secondary certificate
Diploma Degree Post-graduate Degree

58
SECTION B: EMPLOYEE RELIGION
Indicate the extent to which you agree with the following statements. Use the scales of 1 to 5
where 1= Strongly Disagree 2= Disagree 3= Neutral 4= Agree and 5 = Strongly Agree.
Str
on
gly
Dis
agre
e
Dis
agre
e
Neu
tral
Agre
e
Str
on
gly
Agre
e
1.My religious beliefs influence the way I work
2.My religion guides my everyday life
3.The company respects my religion
4.The company gives me time to practice my
religion
5.My religious beliefs make me a better employee
6. I prefer working with people with similar
religious beliefs as mine
7.My religious beliefs greatly influence my
commitment to work
8.My religion encourages hard work
9.My religious practices and beliefs enable me to
cop well with others
10. I would choose my religion over my job.

59
SECTION C: EMPLOYEE VALUE SYSTEMS
Indicate the extent to which you agree with the following statements. Use the scales of 1 to 5
where 1= Strongly Disagree 2= Disagree 3= Neutral 4= Agree and 5 = Strongly Agree.
Statement
Str
on
gly
Dis
agre
e
Dis
agre
e
Neu
tral
Agre
e
Str
on
gly
Agre
e
1.My company’s values are in line with my
cultural values
2. Cultural values affect customer satisfaction
3. cultural values affect sales productivity
4.Strong adherence to my cultural values
improves business outcomes
5. Cultural values affect integrity
6.My cultural values emphasize greatly on team
work
7. My company emphasizes on positive cultural
values
8. My company discourages negative cultural
values
9. My cultural values greatly influence job
performance
10. I am comfortable with changes in the
company

60
SECTION D: EMPLOYEE LANGUAGE
Indicate the extent to which you agree with the following statements. Use the scales of 1 to 5
where 1= Strongly Disagree 2= Disagree 3= Neutral 4= Agree and 5 = Strongly Agree.
Statement
Str
on
gly
Dis
agre
e
Dis
agre
e
Neu
tral
Agre
e
Str
on
gly
Agre
e
1. I am able to fluently communicate with my
fellow employees
2 I am able to fluently communicate with clients
3.I face communication challenges when
communicating with people
4.Diferrences in Language generate conflict
among employees
5. Use of corporate language (English) hinders
my proper transfer of knowledge
6.Having official language use policies improves
on organizational performance
7.My ethnic language affects my work
performance positively
8.My ethnic language affects my work
performance negatively
9.My ethnic language influences my interpersonal
skills
10. I prefer working with people who speak the
same ethnic language as myself
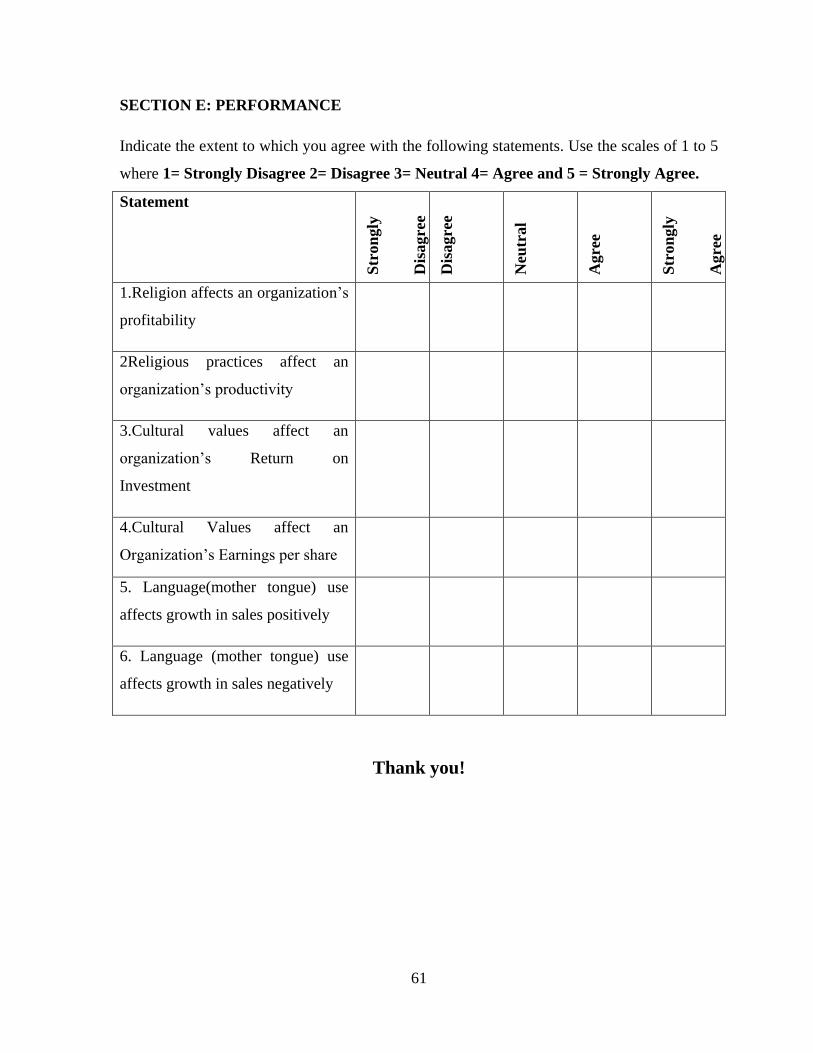
61
SECTION E: PERFORMANCE
Indicate the extent to which you agree with the following statements. Use the scales of 1 to 5
where 1= Strongly Disagree 2= Disagree 3= Neutral 4= Agree and 5 = Strongly Agree.
Statement
Str
on
gly
Dis
agre
e
Dis
agre
e
Neu
tral
Agre
e
Str
on
gly
Agre
e
1.Religion affects an organization’s
profitability
2Religious practices affect an
organization’s productivity
3.Cultural values affect an
organization’s Return on
Investment
4.Cultural Values affect an
Organization’s Earnings per share
5. Language(mother tongue) use
affects growth in sales positively
6. Language (mother tongue) use
affects growth in sales negatively
Thank you!