the effect of excipients on pharmacokinetic parameters of parenteral
TRANSCRIPT

The effect of excipients on pharmacokinetic parameters of parenteral drugs
Inauguraldissertation
zur
Erlangung der Wuumlrde eines Doktors der Philosophie vorgelegt der
Philosophisch-Naturwissenschaftlichen Fakultaumlt der Universitaumlt Basel
von
Barbara Egger-Heigold
aus Grindelwald (BE) Littau (LU) und Plasselb (FR)
Basel 2005
II
Genehmigt von der Philosophisch-Naturwissenschaftlichen Fakultaumlt auf Antrag von Prof Dr Hans Leuenberger PD Dr Georgios Imanidis Dr Bruno Galli Basel den 20 September 2005
Prof Dr Hans-Jakob Wirz Dekan
III
Contents
Summary V
Abbreviations VII
1 Introduction 1
11 The physiology of blood 1
111 The blood cells 1
112 Plasma 1
12 In vitro methods to investigate blood binding parameters 2
121 Blood distribution method 3
122 Protein binding methods 3
13 Characterization of drug candidates 4
131 Physicochemical properties 4
132 Pharmacokinetic parameters 5
133 New trends in characterizing drug candidates 6
14 Strategies and administration of intravenous formulations 7
15 Effect of excipients on pharmacokinetic parameters in blood 9
151 Cremophor EL 9
152 Cyclodextrins 10
153 Tween 80 10
154 Other excipients 11
155 Nanoparticles 11
16 Objectives and specific aims 12
2 Selection and experimental procedure 13
21 Excipients and model compounds 13
22 Experimental setup 15
3 Materials and methods 17
31 Chemicals 17
32 Blood and plasma sources 17
33 In vitro studies 17
331 Preparation of test solutions 17
332 Hemolytic activity 18
333 Blood distribution 18
334 Plasma protein binding 19
335 Determination of protein concentration 20
IV
34 In vivo studies 20
341 Experimental animals 20
342 Drug administration and sample collection 20
343 Bladder catheterization and urine collection 21
344 Ex vivo protein binding 21
35 Measurement of the radioactivity 21
36 Determination of parent drug 22
37 Data analysis 22
38 Pharmacokinetic analysis 23
4 Results and discussions 24
41 Hemolytic activity of excipients 24
42 Impact of the hematocrit on blood partition parameters 25
43 Major binding proteins of model compounds 26
44 The impact of Vitamin E TPGS on COM1 in rat 27
45 The impact of Vitamin E TPGS on COM2 in mouse 29
46 The impact of hydroxypropyl-β-cyclodextrin on COM3 in rat 33
47 The impact of Cremophor EL on COM4 in rat 39
48 The impact of Solutol HS 15 on COM5 in rat 42
5 General discussion and conclusions 47
6 Outlook 54
7 References 56
8 Appendix 64
9 Acknowledgments 81
10 Curriculum Vitae 82
V
Summary
In the pharmaceutical industry the main goal of early phase in vivo studies is to assess pharmacokinetic properties of a compound in laboratory animals These data provide a basis for selecting and optimizing drug candidates However formulation scientists face considerable challenges in finding intravenous preparations for first animal experiments A common problem is the solubilization of lipophilic and sparingly water-soluble compounds The search for suitable delivery vehicles often takes place under little compound availability incomplete physicochemical property characterization and time constraints In addition many experiments have recently generated distinct evidence about the impact of formulation vehicles on the drug pharmacokinetics by affecting transporters metabolic enzymes and distribution processes Consequently drug-excipient interactions are important to consider in the development of parenteral formulations intended for the proper evaluation of animal pharmacokinetics in vivo Gaining a better understanding of potential interactions between drug and formulation in preclinical settings may play a crucial role in clinical and commercial phases of development as well
So far little is known about drug-excipient interactions occurring in blood especially following iv administration of low dosed compounds (lt50 ngmL in blood) including eg highly active drug substances biomarkers PET ligands and microdoses
The purpose of the current work was to examine the potential of excipients commonly used in formulations to modify the blood distribution and protein binding of low dosed compounds under in vitro and in vivo conditions Drug candidates in development at Novartis were used as model compounds and chosen based on different physicochemical and pharmacokinetic properties such as aqueous solubility (poor COM1COM2 good COM3) lipophilicity (low COM4 high COM2) membrane permeability (low COM5 high COM3) and blood cellplasma distribution (mainly in cells COM3 mainly in plasma COM4) Selected excipients comprised one cosolvent (polyethylene glycol 200 PEG 200) one complexing agent (hydroxypropyl-β-cyclodextrin HP-β-CyD) and three non-ionic surfactants (Cremophor EL CEL Solutol HS 15 Solutol D-α-tocopheryl polyethylene glycol 1000 succinate TPGS) most of them present in commercially available intravenous formulations TPGS which is used orally but not as an intravenous excipient was chosen due to its chemical structure and intrinsic properties particularly its benzyl ring and potential modulation of transporterenzyme activities
Preliminary tests in vitro showed that selected excipients except for TPGS were non-hemolytic at 05 which is consistent with data reported in the literature TPGS at 05 induced marked hemolysis after longer contact time (gt 1h) in various species (mouse rat dog and human) whereas TPGS at 01 showed no hemolysis under same conditions Nevertheless TPGS (05) was used in the non-hemolytic time range for further investigations The concentration of all excipients was set at 05 in test systems which is within the relevant range following intravenous dosing in animals
VI
In vitro CEL HP-β-CyD Solutol and TPGS influenced clearly the plasma protein binding and the distribution between blood cells and plasma of model compounds in mice (COM2) or rats (COM1 COM3 COM4 COM5) The addition of TPGS to incubations increased the distributed fraction of COM1 and COM2 in plasma with a concomitant decrease of drug unbound in plasma Formulating COM4 in CEL and COM5 in Solutol lowered the protein binding and the higher drug fraction unbound in plasma was associated with enhanced partitioning into blood cells The presence of HP-β-CyD reduced both the uptake of COM3 into blood cells and the binding to plasma proteins
To assess the correlation between the in vitro findings and the in vivo situation pharmacokinetics and tissue distribution were determined up to 1 h (within PET scan times) after an intravenous bolus injection of model compounds in formulations based on excipients or none (control) to animals using in each case the excipient with the most pronounced interactions detected in vitro Injection preparations contained the excipient to yield estimated blood concentrations of about 05 similar to those used in the in vitro experiments COM2 formulated in TPGS caused a higher accumulation of parent drug and metabolites in plasma without affecting tissue levels in mice Administering COM3 in HP-β-CyD altered the disposition of COM3 characterized by a lower binding to plasma proteins decreased drug levels in the systemic circulation and skin and a higher amount of unchanged drug in the urine COM4 formulated in CEL resulted in a higher drug fraction unbound in plasma which had no impact on the pharmacokinetics and tissue distribution The use of Solutol for COM5 application in rats was associated with decreased protein binding longer persistence in the circulation and higher concentrations in muscle and skin Although TPGS induced a slight shift in the pharmacokinetic parameters of COM1 in rats the compound turned out to be an inappropriate model compound due to its very rapid metabolism and elimination under in vivo conditions
These in vitro and in vivo findings demonstrated that commonly used excipients have a substantial potential for drug-excipient interactions in blood by altering protein binding and blood cellplasma distribution which can influence the tissue distribution and elimination within the first hour after dosing As a result the formulation vehicle can be an important determinant for the disposition of low dosed compounds administered intravenously in animals Moreover results indicate a direct correlation of the excipient effect under in vitro and in vivo conditions Therefore blood distribution and plasma protein binding data generated in vitro seem to be appropriate to reveal potential drug-excipient interactions thereby providing helpful information to improve the rational approach and strategy in the development of parenteral formulations at the preclinical stage A better insight into the contribution of excipients to drug pharmacokinetics suggests also new possibilities of targeting different blood compartments and tissues by selecting the appropriate excipient Such investigations should be considered to develop formulations suitable for intravenous administration of PET ligands where sub-therapeutic doses and short scanning times are used
VII
Abbreviations
AGP α1-acid glycoprotein AUC Area under the drug concentration-time curve BCPR Ratio of concentration in blood cells to that in plasma no units BPR Ratio of concentration in blood to that in plasma no units C0 Initial plasma concentration at time zero CB Concentration of drug in blood CBC Concentration of drug in blood cells CEL Cremophor EL CP Concentration of drug in plasma EtOH Ethanol FP Drug fraction distributed in plasma fu Fraction of unbound to total drug concentrations in plasma funchanged AUC ratio of parent drug to that of total radioactivity Glu 5 aqueous solution of glucose H Hematocrit HDL High density lipoprotein HP-β-CyD Hydroxypropyl-β-cyclodextrin im Intramuscular iv Intravenous k Rate constant h-1 KP Distribution ratio of drug between tissue and bloodplasma no units LC-RID Liquid chromatography-reverse isotope dilution LDL Low density lipoprotein LOQ Level of quantification LSC Liquid scintillation counting nd Not determined PEG 200 Polyethylene glycol 200 PET Positron emission tomography SD Standard deviation Solutol Solutol HS 15 TPGS D-α-tocopheryl polyethylene glycol 1000 succinate t12 Half-life h V0 Volume of distribution based on initial drug concentration in plasma L VLDL Very low density lipoprotein ρ Ratio of concentration in blood cells to that unbound in plasma no units
1
1 Introduction
11 The physiology of blood
Blood is composed of cellular elements suspended in the plasma an aqueous fluid in which solids are dissolved Table 1-1 summarizes the main blood constitution of different laboratory animal species and humans The normal range can vary depending mainly on genetic and environmental factors and methods handling
Table 1-1 Normative data for laboratory animals and humans
Mouse (12)
Rat (134)
Human (5)
Sex Male Male Male Strain OF1 Wistar Body weight (kg) 0030 0250 70 Whole blood (ml100 g) 72 (63-80) 72 plusmn 02 71 plusmn 06 Plasma (ml100 g) 32 39 plusmn 01 44 plusmn 05
Total plasma proteins (g100 mL) 54 plusmn 02 57 plusmn 05 75 plusmn 04
Albumin ( plasma proteins) 61 plusmn 1 48 plusmn 3 62 plusmn 3 α1 globulin ( plasma proteins) 17 plusmn 2 4 plusmn 1 α2 globulin ( plasma proteins)
12 plusmn 1 (α globulin) 10 plusmn 2 9 plusmn 1
β1 globulin ( plasma proteins) β2 globulin ( plasma proteins)
20 plusmn 1 (β globulin)
19 plusmn 1 (β globulin)
11 plusmn 2 (β globulin)
γ globulin ( plasma proteins) 7 plusmn 1 6 plusmn 1 15 plusmn 2 Blood cells Hematocrit () 43 plusmn 3 46 plusmn 2 44 plusmn 2 Red blood cells (x106 cellsmicroL) 9 plusmn 1 7 plusmn 1 5 plusmn 1 White cells (x103 cellsmicroL) 4 plusmn 2 6 plusmn 2 7 plusmn 1 Platelets (x106 cellsmicroL) 13 plusmn 04 12 plusmn 02 03 plusmn 01
111 The blood cells
The different specialized cells found in blood are white blood cells (leukocytes) red blood cells (erythrocytes) and platelets (thrombocytes) Of these the erythrocytes are the most numerous and compose about one-half of the circulating blood volume By carrying hemoglobin in the circulation the red blood cells supply O2 to tissues and remove CO2 Leukocytes are classified as granulocytes (further classification in neutrophils eosinophils and basophils) lymphocytes and monocytes Acting together these cells provide the body with a powerful defense against tumors viral bacterial and parasitic infections Compared to the other blood cells the platelets are much smaller and aid in hemostasis by their primary function in blood clotting Furthermore blood cells can play a key role in binding and transporting of drugs in the circulation thereby contributing to their pharmacokinetic and pharmacological characteristics (67)
112 Plasma
The plasma the liquid portion of the blood is a complex fluid composed of water (approximately 90) and a large number of ions inorganic molecules and organic molecules in solution These dissolved substances primarily proteins are in transit to
2
various parts of the body or aid in the transport of other substances The plasma proteins consist of albumin globulin and fibrinogen fractions which can be separated by electrophoresis Electrophoretic separation followed by immunoprecipitation (immunoelectrophoresis) results in a further division of the proteins If whole blood is allowed to clot and the clot is removed the remaining fluid is called serum and has essentially the same composition as plasma except for the removed fibrinogen and few clotting factors (II V and VIII) Table 1-2 lists the main protein fractions with their main characteristics The table also indicates that a large number of drugs associate with proteins within the bloodstream Albumin is the major drug-binding plasma protein (8) followed by alpha 1-acid glycoprotein as the next important one (9) In recent years studies have shown that lipoproteins are also substantially involved in the bindingtransport of drugs in the blood compartment (10) So far γ-globulins play only a marginal role in plasma binding of drugs
Table 1-2 Proteins in human plasma
Physiological Function
Albumin PrealbuminAlbumin
α1 globulin α1-acid glycoprotein Uncertain (acute phase protein)
α1-lipoprotein (high Transporter Lipidsdensity lipoproteins)
α2 globulin Ceruloplasmin Transporter Copperα2-Macroglobulin Enzyme inhibitor Serum endoproteasesα2-Haptoglobin Binding and carrier protein Cell-free hemoglobin
β globulin Transferrin Transporter Ironβ-lipoprotein (low Transporterdensity lipoproteins)Fibrinogen Precursor to fibrin in hemostasis
γ globulin IgG IgA IgM IgE Antigen Few basic compounds
Electro-phoresis
Immuno-electrophoresis
Protein fraction Binding characteristics
Drugs Endogenous entities
Lipoproteins mainly lipophilic neutral and basic compounds
Humoral immunity (antibodiesimmunoglobulins)
Lipids (mainly cholesterol)
Binding and carrier protein osmotic regulator
Hormones amino acids steroids vitamins fatty acids
Mainly basic and neutral compounds
Mainly acidic but also basic and neutral compounds
Lipoproteins mainly lipophilic neutral and basic compounds
12 In vitro methods to investigate blood binding parameters
The investigation of the partitioning of a drug in the blood compartment is essential in predicting its pharmacokinetic-dynamic profile In general the unbound concentration of a drug in blood reflects more accurately pharmacological effects of the drug than its total concentration in blood (bound + unbound) because only the drug unbound to blood components is able to diffuse through the membranes and then reach the target organ (11) Furthermore the binding to plasma proteins also relates to the volume of distribution and the clearance of the drug For instance many experimental and clinical studies have generated substantial evidence summarized by Akhlaghi (12) that the unbound fraction of cyclosporin in plasma correlates more closely with pharmacodynamic and pharmacokinetic characteristics of cyclosporin than its total blood concentration Therefore determination of extent and rate of bloodplasma distribution and plasma protein binding of a drug is important in both the discovery and clinical phases of drug development
3
121 Blood distribution method
The rate and extent of bloodplasma distribution of drugs is determined in vitro in spiked whole blood The experiments are performed under controlled physiological conditions (pH 74 37degC gently shaken) to reflect the in vivo situation over the entire clinically relevant concentration range of the drug Time samples are taken and centrifuged Subsequently drug concentrations in blood and plasma are determined to calculate the time required to reach equilibrium The extent of bloodplasma and blood cellplasma distribution derives from measured concentrations in blood and plasma and can be expressed with distribution parameters like FP BPR and BCPR BPR depends on the hematocrit of the whole blood used in the determination whereas BCPR is independent of the hematocrit value
122 Protein binding methods
Various methods are available for the determination of free drug concentration and protein-drug binding fraction in plasma (131415) including conventional separation methods summarized in Table 1-3 However the routinely used methods like ultrafiltration or equilibrium dialysis are limited in the case of lipophilic drugs due to their nonspecific adsorption to ultrafiltration device or to the dialysis membrane Along with a trend to more lipophilic compounds observed in the pharmaceutical industry in recent years (16) these adsorption problems are expected to increase As a result ongoing method modifications and new methods are needed to overcome these difficulties Overall the selection of the method of binding assay depends upon the aim of the study and the physicochemical properties of the particular test compound including its formulation
The ratio of bound and total drug concentrations in plasma expresses the degree of drug binding to plasma proteins and ranges between values of 0 and 1 Based on these values drugs can be classified into very highly bound (gt095) highly bound (gt090) poorly bound (lt09) and littlenot bound (lt02)
4
Table 1-3 Conventional methods for determination of plasma protein binding
Method Principle Advantages Disadvantages
Ultrafiltration
Ultracentrifugation
Gel filtration Adoptable for lipophilic drugs automatable binding differences detectable (eg affinity)
Complex handling time consuming
Time consuming expensive equipment false estimation of free fraction by physical phenomena (eg sedimentation back diffusion) protein contamination of free drug layer
Separation by size exclusion and affinity of column
Separation by centrifugation at high speed in absence of a membrane
No membrane effects natural environment no dilution problems adoptable for lipophilic and high MW drugs evaluation of lipoprotein binding
Equilibrium dialysis (reference method)
Sample dilution volume shifts Donnan effects nonspecific adsorption sieve effect time consuming unsuitable for unstable drugs
Separation by filtration through a semipermeable membrane with defined molecular weight cutoffs accelerated by centrifugation or positive pressure (N2 gas syringe)
Equilibrium establishment between two compartments separated by semipermeable membrane with defined molecular weight cutoffs
Physiological conditions universal binding method
Simply applicable short analysis time simple commercially available kits no volume shifts no dilution effects
Donnan effects nonspecific adsorption binding equilibrium changes during separation process small amount for analysis sieve effect
13 Characterization of drug candidates
Successful candidates in drug development must have proper physicochemical properties in addition to acceptable pharmacokinetics efficacy and safety profiles As a result a clear understanding of compound characteristics and their correlations are helpful to rank and sort out unsuitable compounds in drug research (1718)
131 Physicochemical properties
The chemical structure of a drug candidate is used in both predicting the pharmacology and selecting formulation strategies Table 1-4 shows physico-chemical parameters which are critical for in vivo drug action
The molecular weight (MW) indicates roughly the size of a chemical entity and is connected to its membrane permeability namely to the intestinal and brain penetration (1619)
LogP the octanol-water partition coefficient has been widely accepted as a measure of molecular lipophilicity Lipophilicity affects both the pharmacokinetic and pharmacodynamic behavior of drug molecules (2021) LogP considers the molecule in its neutral state (neutral substance or ionizable substance in its neutral form) whereas logD reflects the pH-dependent distribution coefficient consequently taking the ionization of molecules into account If logP and pKa of a compound are known logD can be calculated at any pH (21)
5
The aqueous solubility (LogS) is closely related to drug stability liberation and absorption by passive diffusion thereby playing a key role in its bioavailability (22) Causes for poor solubility are mainly excessive lipophilicity and crystal packing issue (23242526) The solubility of nonionic molecules is pH independent while molecules with ionizable groups show pH dependent solubility Acid drugs have higher solubility at pH higher than pKa and basic drugs at pH lower than pKa due to better solubility of ionic species as compared to the neutral species The acid-basic character accounts also for crossing the blood-brain barrier (27)
The polar surface area (PSA) of a molecule is a useful parameter for predicting drug transport properties PSA is the sum of the molecular surface (either van der Waals or solvent-accessible) that arises from polar atoms usually N O N-H and O-H atoms Some scientists also include sulphur and phosphor and attached hydrogens as polar atoms The PSA of a compound is also closely related to its hydrogen bond accepting and donating ability which can be responsible for interactions with active efflux pumps (2829) PSA has been shown to correlate well with blood-brain distribution (273031) intestinal absorption (323334353637) and oral bioavailability (38) of compounds
Table 1-4 Physicochemical parameters
Parameter Description Predictor Optimal value
MW Molecular weight Size Permeability lt 500lt 450 (BBP)
LogP lt 5
LogS Hydrophilicity gt 20 microgmL
pKa Acid-base character
PSA Polar surface area lt 140 Aringlt 80 Aring (BBP)
Negative logarithm of the acid-base dissociation constant
Acids gt4 and bases lt10 (BBP)
Permeability H-bonding capability
Logarithm of the octanol-water partition coefficient
Lipophilicity Permeability
Logarithm of the aqueous solubility
BBP blood brain penetration
132 Pharmacokinetic parameters
The pharmacokinetic profile is crucial for the clinical success of drug candidates and their development into marketable drugs Therefore today the contribution of pharmacokinetic investigations to the selection and optimization of promising drug candidates is well recognized The four most important parameters are clearance volume of distribution elimination half-life and bioavailability which is the fraction of drug absorbed as such into the systemic circulation (100 per definition for drugs given intravenously)
Drug clearance (CL) expresses the rate or efficiency of drug removal from the systemic circulation and is estimated as the ratio of dose to AUC following intravenous administration of the drug
AUC
DoseCL =
6
AUC is the total area under the curve that describes the concentration of drug in blood or plasma as a function of time AUC represents the drug exposure and is calculated by the trapezoidal rule
The volume of distribution (V0) relates the amount of drug in the body to the concentration of drug in the blood or plasma depending upon the fluid measured This volume does not necessarily refer to an identifiable physiological volume but merely to the fluid volume that would be required to contain all of the drug in the body at the same concentration as in the blood or plasma
o
iv
C
DoseV =0
C0 represents the blood or plasma concentration at time zero and is determined by extrapolation to zero time of the linear plot of concentration vs time in semilogarithmic scale
The half-life (t12) is the time it takes for the blood or plasma concentration or the amount of drug in the body to be reduced by 50
kkt
69302ln21 ==
where k is the elimination rate constant which can be calculated by the slope of the best-fit line to a semilogarithmic plot of the concentration over time The relationship of t12 to both clearance and volume of distribution is given by
V
CLk =
133 New trends in characterizing drug candidates
Before conducting clinical trials in humans preclinical testing is carried out to discover the pharmacology ADME (adsorption distribution metabolism and excretion) and toxicology of a new drug candidate (39) Appropriate pharmacokinetics and a good balance between drug efficacy and safety contribute mainly to an efficient and effective drug development However these factors are the major hurdles in development which primarily cause increased costs and failure rate of candidates Thus pharmaceutical industry needs new concepts able to speed and improve activities and decision-making in drug development (4041) In this context microdosing biomarkers and PET ligands can help to prioritize resources and optimize drug selection in development In many cases these approaches deal with compound concentrations ranging from sub-therapeutic to low pharmacological levels and thus information obtained from these techniques must reflect correctly the conditions at therapeutic doses including interactions with macromolecules like enzymes transporters and proteins In the end a successful integration requires a profound understanding of strengths and limitations of these new concepts
The administration of a low dosed (microdosed) drug candidate to humans was proposed to obtain human pharmacokinetic data before conducting Phase I trial (42) A microdose is one-hundredth of the proposed pharmacological dose determined from animal andor in vitro models or a dose up to 100 microg whichever is the smaller (43) Human microdosing uses labeled agents administered mostly intravenously and their fate in vivo is recorded by positron emission tomography combined with accelerator mass spectrometry or nuclear magnetic resonance (4344) With this new
7
strategy of microdosing drug information regarding human kinetics will be available along with preclinical data and can be useful for the acceptance or rejection of a candidate at an early stage
A biomarker is an indicator of a normal biological or pathophysiological process or a therapeutic response (45) Biomarkers help to select the most sensitive drugs in all phases of drug development (46) by providing data of pharmacological response dosing regimen and risk-benefit assessment Therefore efforts are moving rapidly forward to achieve strong predictive biomarkers which could be used for diagnostic and therapeutical purposes (47)
PET tracers labeled with short-lived radionuclides (eg 11C 18F 124I) are used as molecular probes of physiology and pathophysiology in animals and humans These labeled compounds are administered mostly intravenously at 600 MBq to humans which corresponds to 6-20 nmol (3-10 microg assuming a MW of 500) (48) To achieve the same imaging quality in animals roughly the same total amount of radiopharmaceutical must be given to animals as to a human subject (49)
14 Strategies and administration of intravenous formulations
In the pharmaceutical industry formulation scientists have faced growing challenges in recent years as a result of new drug candidates characterized as being more lipophilic hydrophobic and water-insoluble particularly candidates originated from leads associated with combinatorial chemistry and high-throughput screening (1624) In addition timelines and resources are very limited to develop an optimized formulation and thus the search for a suitable dosing vehicle intended for activities in preclinical research represents a challenging task for the formulators (50) Ideally it is best to select and use solubilizers that would maximize the solubility of the compound and could be applied for all preclinical settings Moreover the solubilizing agents should not influence the intrinsic pharmacokinetic characteristics of the compound being evaluated (except the interaction is well understood) which would lead to misinterpretation of the pharmacological response (51) Strategies for solubilization of intravenous drugs are summarized in Table 1-5 and well exemplified by the formulation approaches for the anticancer agent Paclitaxel (52)
Usually the first step is to check the solubility of the compound in an aqueous dosing vehicle at physiological pH and osmolarity If the target concentration cannot be achieved with this approach and the drug molecule is ionizable adjustment of the pH to non-physiological values can be suitable to increase water solubility (pKa must be sufficiently away from the formulation pH) Non-electrolytes are insensitive to pH modification The next approach most frequently tried is the addition of water-miscible organic solvents (cosolvents) and the use of surfactants or complexing agents To reach the required dose combination of these methods is often used Dispersal systems are other techniques but they may be difficult costly and time-consuming due to biological and technical complexity eg liposomes (53)
8
Table 1-5 Intravenous formulation approaches
Approach Examples Administered in commercial productsa Potential drawbacks
NaCl 09 (wv) pH 2-12 (bolus) pH 2-10 (infusion) PrecipitationGlucose 5 (wv) rarr preferred range pH 4-9 PainStrong acidsbases (HCl NaOH)Buffers (tartarte phosphate)
Cosolvents Propylene glycol le 68 (bolus) le 6 (infusion) Precipitation Ethanol le 20 (bolus) le 10 (infusion) IrritationPainPolyethylene glycol 300 le 50 (bolus) HemolysisPolyethylene glycol 400 le 9 (bolus) Impact on PK profile
Surfactants Cremophor EL le 10 (infusion) ditoTween 80 le 04 (bolus) le 2 (infusion)Solutol HS 15 50
Complexing agents Hydroxypropyl-β-cyclodextrin 20 (infusion) ditoDispersal systems Impact on PK profile
EmulsionbMicroemulsionc Water with 10-20 oil (fatty acids + lecithin + glycerol) Sustained releaseLiposomes Water with phospholipids (5-20 mgmL) + isotonicifier + buffer plusmn cholesterol Instability
Nanosuspensiond Water with stabilizer not yet marketede Slow dissolution
Aqueous solution at physiological osmolarity and pH or with pH adjustment
a(54) b(55) c(56) d(57) e(58)
For compounds administered intravenously to animals the dose volume viscosity
of injection material speed of injection and species are important factors to consider in addition to formulation properties including additives solubility and stability (Table 1-6) (59) A compound can be given over a short period of le1 min (bolus injection) 5-10 min (slow injection) and longer time period (intravenous infusion) Rapid injections require the dose to be compatible with blood and not too viscous and the rate of injection is suggested not to exceed 3 mLmin for rodents Depending on study objectives and compound solubility in an acceptable formulation a larger volume may be needed to be given to animals to accomplish requirements Regarding the formulation aqueous solutions or simple systems containing cosolvent surfactant or complexing agent are recommended for animal investigations at early stage in development due to easy handling and characterization For excipient selection consideration should be given for toxic and biological effects interferences with the drug compound and suitability for clinical use (Table 1-5) Injectable excipients preferred for dosing in animals are ethanol propylene glycol low molecular weight polyethylene glycols Cremophor EL Tween 80 and cyclodextrins
Table 1-6 Dose volumes and rates for intravenous administration(59)
Species Bolus injection Slow injection Infusion
Volume Rate Volume Rate Time Volume Rat
(mLkg) (mLmin) (mLkg) (mLmin) (h) (mLkgd) (mLkgh) Mouse 5 3 max 25 3 4
24 96 4 Rat 5 3 max 20 3 4 20 5 24 60 25
9
15 Effect of excipients on pharmacokinetic parameters in blood
Over the last years more attention has been paid to the extensive investigation of formulation vehicles as biologically and pharmacologically active compounds The main stages in which pharmaceutical excipients can interact and hence may modulate the properties of an administered drug-agent are transporter enzyme and distribution process in the systemic circulation (eg plasma protein binding) The effect of excipients on transporter activity has been studied intensively namely for P-glycoprotein (606162636465666768) multidrug resistance-associated protein (6970) and peptide transporter (71) It is interesting to say that particularly nonionic surfactants effectively inhibit transporters In contrast up to this day little is known about drug-excipient interactions at the level of cytochrome-mediated metabolism (63727374) and blood distribution (see below) The biological and pharmacological properties of excipients with a focus on the central blood compartment will be reviewed in the following paragraphs
151 Cremophor EL
The amphiphilic polyethoxylated castor oil derivative Cremophor EL (CEL) is one of the most frequently used surface-active formulation ingredients in parenteral dosage forms As early as 1977 lipoprotein alterations were observed in patients receiving miconazole therapy (75) which was caused only by CEL both in vitro and in vivo (767778) Extended studies revealed later on that CEL has a destructive effect on HDL resulting in a shift of the electrophoretic and density gradient HDL to LDL (79808182) Furthermore several hydrophobic anti-tumor agents tin etiopurpurin (8384) C8KC (85) and Taxol (8182) showed strong affinity for these lipoprotein dissociation products inducing changes in plasma protein binding potentially affecting pharmacokinetics
Various animal studies demonstrated (85868788899091110) that CEL modifies the pharmacokinetic behavior of drugs after intravenous administration like paclitaxel (Taxol) C8KC and cyclosporin The most common observation was a substantial increase in the area under the plasma concentration-time curve and in peak plasma concentration of studied agent with a reduction in the clearance as was first described for paclitaxel in a mouse model (91) The drug-CEL interactions were supposed to be caused not only by altered protein binding characteristics (82) but also by altered hepatobiliary secretion (92) and endogenous P-glycoprotein-mediated biliary excretion (93) However the very small volume of distribution of CEL approximately equal to the volume of the central blood compartment suggests that the observed interference occurs in the central blood compartment This hypothesis was confirmed by studies recently published (9495) The main finding was a profound alteration of cellular partitioning and bloodplasma concentration ratio of paclitaxel in a CEL concentration-dependent manner as a result of an entrapment of the compound into micelles formed by CEL (96) Consequently the free drug fraction available for distribution was reduced This effect was also observed in the absence of plasma proteins pointing at contributing factors other than altered protein binding and increased affinity of paclitaxel for CEL-induced lipoprotein degradation products (8182)
10
For the purpose of finding out a potential paclitaxel delivery vehicle with an ideal profile the investigation of several delivery vehicles based on the chemical structures of CEL and Tween 80 led to alteration of blood distribution of paclitaxel in presence of all tested vehicles (97) Different formulation approaches such as liposomes and poloxamer-micelles affected the pharmacokinetics of paclitaxel in mice as compared to the CEL-containing formulation (98) In contrast paclitaxel administered in a solvent-free formulation in a clinical study showed a higher efficacy combined with reduced adverse effects compared to the drug delivered in a solution of CEL (99)
Overall numerous investigations have shown that CEL can play a pivotal role in the pharmacological behavior of the formulated drugs In addition several drug-drug interactions are reported on agents administered intravenously in conjunction with CEL-containing formulation of other compounds namely paclitaxel (100101102103) cyclosporin (104105106107) and valspodar (108109) Most likely the presence of CEL in drug formulations contributes to the observed pharmacokinetic interactions Indeed recent experiments revealed a substantial increase of plasma concentrations of cyclosporin after an additional injection of another drug preparation containing CEL (110)
152 Cyclodextrins
Cyclodextrins are ring-shaped oligosaccharides with a hydrophilic exterior and a hydrophobic interior (111) The interior cavity is capable of forming water-soluble complexes with many drugs Due to the rapid release of a drug from the complex after administration in vivo it is assumed that drug-cyclodextrin complexes do not affect the drug pharmacokinetics (112) However if the drug is slowly or incompletely released from the complex drug dosing as complexes in cyclodextrin can be critical
The binding of drugs to plasma proteins was influenced in vitro in the presence of β-cyclodextrin (113) and hydroxypropyl-β-cyclodextrin (HP-β-CyD) (114115) The intravenous administration of flurbiprofen in HP-β-CyD led to transient higher tissue concentrations in rats (114) Alterations in tissue distribution were also found for other drugs injected as cyclodextrin complexes either free in solution (116117) or included into liposomes (118) Following iv dosing in HP-β-CyD a higher amount of carbamazepine appeared in the urine compared to oral preparations (122) A similar trend was observed in dogs treated iv with either dexamethasone formulated in HP-β-CyD or as its phosphate prodrug (123) In addition cyclodextrins interacts with endogenous lipids such as lipoproteins (119120) and cholesterol (113121)
153 Tween 80
As mentioned above for CEL lipoprotein alteration induced by Tween 80 was observed (80) However this effect was not confirmed in a further study (85) In patients receiving Tween 80 co-administered with etoposide an increase of the volume of distribution and the clearance of doxorubicin was detected due to reduced plasma concentrations of doxorubicin during the early phase of the concentration-time profile (124) Lately changes in the bloodplasma ratio of paclitaxel were described in the presence of Tween 80 and other solubilizers structurally related to Tween 80 (97) More recently it was shown that Tween 80 has a concentration-dependent influence on the normal binding of docetaxel to serum proteins leading to changes in pharmacokinetics of docetaxel in vivo (125) although Tween 80 is
11
degradated rapidly by esterases in plasma (126) The mechanistic basis for altered plasma binding of docetaxel in the presence of Tween 80 still needs to be clarified
154 Other excipients
To date little is reported in the literature about the impact of Solutol HS 15 and Poloxamer 188 on blood distribution of drugs An interference between Solutol HS 15 and the co-administered ketochlorin photosensitizer C8KC was suggested by Woodburn (127) The similar half-lives of Solutol HS 15 and the sensitizer found in mice indicate the correlation of the persistence of C8KC in plasma with that of the vehicle Further recent plasma protein binding interaction studies demonstrated an apparent increase in the unbound fraction of propranolol in combination with Poloxamer 188 (128) Also the administration of compounds formulated in mixed micelles can alter the protein binding (129) Most notably compounds binding with high affinity but low capacity to α1-acid glycoprotein showed free fractions increased by 50 to 85 Moreover blood protein interactions can occur with dosing vehicles like liposomes (130) thereby affecting maybe the fate of co-administered drugs in blood and body (131)
155 Nanoparticles
Methyl methacrylate nanoparticles of 130 nm in size suspended in different concentrations (01-5) of Tween 80 or poloxamine 908 exhibited prolonged circulation time with altered tissue concentrations as compared to uncoated nanoparticles (132) Extended blood circulation time was also found for polystyrene nanoparticels (40-137 nm) coated with poloxamer 407 (133)
12
16 Objectives and specific aims
The main purpose of this thesis was to investigate in vitro drug-excipient interactions in blood and to assess the implications of the in vitro findings both for the in vivo situation and the formulation strategy Compounds in drug development at Novartis were chosen as model substances and dosed at concentrations ranging from sub-therapeutic to low pharmacological levels Excipients commonly used in formulations were selected including CEL HP-β-CyD Solutol PEG 200 and TPGS The following specific aims of the thesis were 1 To collect and use available compound information including physicochemical
properties and pharmacokinetics to select appropriate model substances with as many different properties as possible
2 To determine the hemolytic activity of selected excipients to rule out any changes of blood distribution caused by hemolysis
3 To explore in vitro possible effects of selected excipients in the blood with special emphasis on the blood distribution and plasma protein binding of model compounds
4 To identify the pharmacokinetic profile and tissue distribution of model compounds following single intravenous dosing in the presence and absence of selected excipients
5 To compare and relate pharmacokinetic outcomes to the in vitro findings thereby assessing the impact of in vitro data for the in vivo situation and evaluating the in vitro-in vivo correlation
6 To generate criteria for optimizing delivery vehicle selection in drug research that allow reducing drug-excipient interactions and leading to more rational and selective drug formulations
7 To propose an intravenous formulation strategy based on the data generated by this research project to provide better candidate-tailored formulations in drug development
13
2 Selection and experimental procedure
21 Excipients and model compounds
Investigations involved five excipients along with five pharmacologically active compounds exhibiting different properties
The excipients CEL HP-β-CyD Solutol and PEG 200 were selected based upon their common use in intravenous formulations and their diversity of molecular structure and solubilization technique (Figure 2-1 and Table 2-1) CEL and Solutol are surface-active agents which increase the drug solubility by incorporation of the drug into a micellar structure Whereas CEL exhibit a highly variable composition with the major hydrophobic component (~87) identified as oxyethylated triglycerides of ricinoleic acid (Figure 2-1) Solutol consists of ~70 lipophilic polyglycol mono- and di-esters of 12-hydroxystearic acid and ~30 hydrophilic polyethylene glycol HP-β-CyD is a cyclic (α-14)-linked oligosaccharide containing seven α-D-gluco-pyranose units (Figure 2-1) which form a relatively hydrophobic central cavity and a hydrophilic outer surface The inclusion of a drug within the inner core of the complexing agent and the interaction of the outer core with water render the complex soluble PEG 200 is often used as a cosolvent for improving solubility of preclinical compounds by interrupting the hydrogen structure of water (eg water exclusion) and lowering the dielectric constant of the solution Although TPGS is exclusively known in oral formulations it was chosen due to its chemical structure (benzyl ring) and drug interaction potential at the level of active transporters and metabolizing enzyme systems
Cremophor EL
H2C(CH
2CH
2O)xOCO(CH
2)7CH CHCH
2CHOH(CH
2)5CH
3
HC(CH2CH
2O)yOCO(CH
2)7CH CHCHCH
2CHOH(CH
2)5CH
3
H2C(CH
2CH
2O)zOCO(CH
2)7CH CHCH
2CHOH(CH
2)5CH
3
primary constituent with x + y + z ~35
Solutol HS 15
CH3
(CH2)5
CH (CH2)10
C O CH2
CH2
OHn
OH O
Polyethylene glycol 200
O
HOH
n
Hydroxypropyl-β-cyclodextrin
O
ROCH2
O
ROOH
n
glucopyranose with R=CH2CH2OH or H and n=7
Vitamin E TPGS
O
O C CH2
CH2
C O
O O
CH3
CH3
OH n
CH3
CH3
CH (CH2)3
CH3
CH (CH2)3
CH(CH2)3
n=20-22
Figure 2-1 Chemical structures of selected excipients
14
Table 2-1 Properties of selected excipients
Excipient name Type Solubilization Use in iv Biological activity
approach formulation
Cremophor EL Non-ionic Micelles Yes bull Dyslipidaemia (polyoxyethylene surfactant (developmental bull Inhibition of active castor oil derivatives) amp commercial) transporters MW ~3000 CMC ge009 mgmL Hydroxypropyl-β- Oligomeric Complexation Yes bull Lipid interactions cyclodextrin substance (developmental MW ~1600 amp commercial) Solutol HS 15 Non-ionic Micelles Yes bull Dyslipidaemia (polyethyleneglycol 660 surfactant (developmental bull Inhibition of active 12-hydroxystearate) amp commercial) transporters MW 960 bull Inhibition of cyto- CMC ge02 mgmL chrome enzymes Polyethylene glycol 200 Oligomeric Cosolvent Yes MW ~200 substance (change of (developmental solution amp commercial) polarity) Vitamin E TPGS Non-ionic Micelles No bull Inhibition of active (D-α-tocopheryl surfactant (oral use transporters polyethylene glycol 1000 developmental bull Inhibition of cyto- succinate) amp commercial) chrome enzymes MW ~1513 CMC ge02 mgmL CMC Critical micelle concentration MW Molecular weight Higher molecular weight PEGs such as PEG 300 and 400
Drug candidates in development at Novartis were chosen as model compounds
regarding aqueous solubility lipophilicity membrane permeability and blood cellplasma distribution (Figure 2-2 and Table 2-2) COM2 and COM1 (base) are lipophilic and poorly water-soluble PET ligands which are used in sub-therapeutic doses and COM2 distributes equally between plasma and whole blood COM3 is much better water-soluble and is mainly located in the cellular fraction in blood In contrast COM4 with a low lipophilicity penetrates hardly into blood cells and distributes poorly into tissues COM5 is a bigger molecule characterized by a high polar surface area many H-bond acceptors and a very low volume of distribution similar to that obtained for COM4
COM1 COM2 COM3 COM4 COM5
N
N
O
R1
R2
O
N
O
N
N
S
R1
R2
N
O
N
R
NN
R2
R1
N
NO
S O
NH
O
O
NH
OR1
R2
R3
Figure 2-2 Chemical structures of model compounds
15
Table 2-2 Properties of model compounds
Physicochemical (PC) and pharmacokinetic (PK) data available at the time of selecting model compounds for investigating drug-excipient interactions in blood
COM1 COM2 COM3 COM4 COM5
PET ligand PET ligand NCE NCE NCE
PC properties MW (gmol) 240 410 295 lt400 533 LogD 68 34 45 23 17 37 pKa 38 57 41 87 32 46 106 H2O solubility pH 68 (mgL) 20 lt25 4000 lt500 100 PSA (Aring2) 35 50 25 63 166 H-bond acceptors 3 5 3 4 12 H-bond donors 0 0 0 1 3 PK properties Species Mouse Rat Rat Rat In vitro Fraction in plasma () 45 20 ~100 80 Free in plasma () 12 24 11 In vivo Matrix Blood Blood Plasma Plasma t12 (h) 11 11 10 04 CL (mLminkg) 10 142 04 72 Vss (Lkg) 14 10 03 03 funchanged () 49 14 98 94 Main selection criteria bull Active bull Active bull Blood bull Blood bull MW principle principle distribution distribution bull Polarity bull H2O sol bull H2O sol bull Vss bull Vss (base) bull Lipophilicity funchanged Fraction of unchanged drug based on AUC ratio of parent drug and total radioactivity LogD Logarithm of octanol-water distribution coefficient MW Molecular weight NCE New chemical entity pKa Negative logarithm of dissociation constant PSA Polar surface area CL Drug clearance t12 Main elimination half-life Vss Volume of distribution under steady-state conditions
22 Experimental setup
The effect of excipients on pharmacokinetic parameters was examined in rats except for COM2 which was investigated in mice due to available animal models appropriate to analyze drug target interactions if required Model compounds were used in their clinically relevant blood range as follows sub-therapeutic (lt5 ngmL) for COM1 and COM2 low-therapeutic (5-50 ngmL) for COM3 and therapeutic (gt50 ngmL) for COM4 and COM5 because of low distribution volumes to assure detectable tissue concentrations To allow in vitro and in vivo study comparisons the amount of excipient in blood was set at ~05 which is within the range after an iv bolus injection in mice and rats
Blood distribution and protein binding studies were done in vitro using model compounds in the appropriate concentration range with and without selected excipients fixed at 05 in the test system Since COM4 is almost completely located in the plasma fraction in blood (FP ~100) independent of the concentration (10-10rsquo000 ngmL) (149) the concentration of COM4 was kept constant (100 ngmL) whereas the excipient amount was varied between 001-1 Compounds formulated as excipient-free solution in glucose 5 or saline served as reference The excipient with the most prominent effect compared to the reference was selected for the in vivo
16
study where animals received intravenously a single dose as a control formulation or solution containing the selected excipient Control formulation were based on glucose 5 (COM1 COM3) saline (COM4 COM5) or blank plasma (COM2) To assure a fast and complete solubility of COM3 and COM5 in the control formulation convenient excipients were added with in vitro binding parameters similar to those obtained for the in vitro reference The concentration of model compounds in blood plasma and tissue were measured until 1 h after iv administration thereby including the scanning time of PET ligands Moreover it is assumed if excipient-induced changes occur they should be detectable in this time period
17
3 Materials and methods
31 Chemicals
COM1 and COM2 were supplied by the Neuroscience Research Department of Novartis (Basel Switzerland) COM3 was obtained from the Novartis Institutes for BioMedical Research (Basel Switzerland) 3H-radiolabeled COM1 (specific activity 11780 MBqmg gt99) COM2 (specific activity 2320 MBqmg gt98) and COM3 (base specific activity 311 MBqmg gt98) were provided by the Isotope Laboratories of Novartis (Basel Switzerland) 14C-radiolabeled COM3 used for investigation of renal excretion (2middotHCl salt specific activity 587 MBqmg gt98) COM4 (specific activity 585 MBqmg gt98) and COM5 (specific activity 33 MBqmg gt98) were provided by the Isotope Laboratories of Novartis (Basel Switzerland)
The excipients purchased by the Pharmaceutical and Analytical Development Department of Novartis (Basel Switzerland) were Cremophor EL (CEL BASF) hydroxypropyl-β-cyclodextrin (HP-β-CyD CERESTAR USA Inc) polyethylene glycol 200 (PEG 200 Fluka) Solutol HS 15 (Solutol BASF) and D-α-tocopheryl polyethylene glycol 1000 succinate (TPGS Eastman) All other chemicals and reagents were of analytical grade or will be described separately in the methods section
32 Blood and plasma sources
Fresh blood was obtained from healthy male species (nge3) as follows mice (albino OF1 Charles River Laboratories LrsquoArbresle France) rats (Wistar HAN IGS Charles River Laboratories Sulzfeld Germany) dogs (Marshall beagles Marshall Farm NY USA and Harlan France SARL Gannat France) and humans (drug-free blood donors Blutspendezentrum SRK Basel Switzerland) Pooled plasma (nge3) was defrosted from storage at -20degC Lithium heparin was used as an anticoagulant for all species
33 In vitro studies
Test compounds in the in vitro samples excluding protein binding samples of COM2 were quantified by LSC due to no major degradation (gt95) under investigated conditions (146147148149150) Protein binding samples of COM2 were quantified by LC-RID due to instability after longer incubation (gt2 h) and very low fraction unbound in plasma (lt2)
331 Preparation of test solutions
For in vitro blood distribution and protein binding studies test solutions were prepared by dissolving the radiolabeled test compound in ethanol Ethanol was evaporated and the residue was reconstituted in the appropriate formulation namely excipient-free solution as control (saline or glucose 5) and solutions containing CELEtOH 6535 (vv) CEL HP-β-CyD Solutol PEG 200 and TPGS Final compound concentrations in blood or plasma were 006-6 ngmL (COM1) 001-100 ngmL (COM2) 5-500 ngmL (COM3) 100 ngmL (COM4) and
18
10-300 ngmL (COM5) Excipient concentrations were kept constant at 05 in the test system except for COM1 (05-5 due to no alterations at 05) and COM4 (001-1 due to its plasma fraction see 22)
332 Hemolytic activity
The hemolytic activity of the excipients was assayed using a spectrophotometric method CELEtOH 6535 (vv) EtOH HP-β-CyD PEG 200 Solutol and TPGS were added to the appropriate volume of freshly prepared heparinised whole blood to obtain a final excipient concentration of 05 To avoid hemolysis due to higher concentrations during the adding the blood was partially centrifuged and the excipient was pipetted in the cell-free layer By tapping the test tubes the samples were immediately mixed Two control tubes were prepared one for spontaneous hemolysis (pure blood used as the reaction blank) and another for 100 hemolysis (total cell lysis induced by sodium dodecyl sulfate at a final blood concentration of 1) Samples were incubated at 37degC At certain points of time aliquots were removed and centrifuged for 10 min at 3100 x g (37degC) to obtain plasma The absorbance of hemoglobin in the supernatant (dilution with water 1200) was measured at 405 nm (Emax precision microplate reader Bucher Biotech Basel Switzerland) The degree of hemolysis due to the excipient activity was calculated according to
100()0100
0times
minus
minus
=
AA
AAHemoylsis e
where Ae is the absorbance of hemoglobin in the supernatant after incubation with excipient A0 is the absorbance of hemoglobin in the supernatant of the reaction blank and A100 is the absorbance of hemoglobin in the supernatant after total cell lysis with sodium dodecyl sulfate Hemolytic activity was considered to have started when mean values were greater than 2 of hemolysis
333 Blood distribution
Freshly prepared heparinised blood was used and experiments were performed in triplicate both in the presence and absence of excipients The hematocrit was determined using a hematocrit centrifuge and a hematocrit reader (Haemofuge Heraeus Sepatech Germany) In order to reduce hemolysis blood aliquots (1 mL) were partially centrifuged (500 x g for 2 min) before adding the test solution in the cell-free layer followed by mixing immediately Samples were incubated at 37degC Time aliquots (1 mL) were removed and prepared for measuring radioactivity of the test compound in whole blood before centrifugation and in plasma after centrifugation for 10 min at 3100 x g (37degC) by LSC
The fraction of the test compound in plasma (FP) was calculated according to
100)1(
() times
minustimes
=
B
P
PC
HCF
where CB and CP are the drug concentration in blood and plasma respectively and H is the hematocrit value The concentration in blood cells (CBC) was calculated as follows
19
H
HCCC PB
BC
)1( minustimesminus=
and used for calculations of blood cell to plasma concentration ratio (BCPR CBCCP) and blood cell to unbound in plasma concentration ratio (ρ CBC(CPfu)) fu is the drug fraction unbound in plasma determined by the appropriate protein binding method for each compound
334 Plasma protein binding
Control experiments in phosphate buffered saline (PBS Gibco Paisley Scotland) were carried out to assess the suitability of the methods described below for each test compound in the following order ultrafiltration gt dialysis gt ultracentrifugation with ultrafiltration being the first procedure Control experiments indicated that ultrafiltration is a suitable method for COM1 COM3 COM4 and COM5 (free-permeation gt075 recovery gt85) and ultracentrifugation for COM2 (no sedimentation after 6-h centrifugation recovery gt85 ultrafiltration and dialysis showed insufficient recovery and free-permeation) Therefore protein binding was determined by the ultrafiltration technique (COM1 COM3 COM4 and COM5) or the ultracentrifugation technique (COM2)
Ultrafiltration
Samples of spiked plasma were incubated at 37degC until binding equilibrium Aliquots of 1 mL were introduced in prewarmed (37degC) Centrifree micropartition tubes (Amicon Inc Beverly MA USA) and centrifuged for 10 min at 2000 x g (37degC) For the determination of the unbound drug fraction in plasma concentrations of the test compound in ultrafiltrate and plasma were measured The unbound fraction in plasma (fu) was calculated as follows fu()=(CUFCP)x100 where CUF and CP are the drug concentration in ultrafiltrate and in plasma respectively
Equilibrium dialysis
Test solution was added to plasma followed by mixing Dialysis was carried out with 150 microL of this sample against an equal volume of phosphate-buffered saline (pH 72) in a 96-well micro-equilibrium dialysis block (HTDialysis LLC Gales Ferry CT USA) Dialysis membranes with a 12000-14000 molecular weight cut-off were soaked in phosphate buffered saline (pH 72) before use After establishment of the equilibrium buffer solution aliquots containing only unbound drug and plasma aliquots containing both bound and unbound drug were analyzed for the test compound The ratio of drug concentrations measured in the buffer and plasma after dialysis was taken as an estimate of unbound drug fraction in plasma
Ultracentrifugation
Samples of spiked plasma were incubated at 37degC until binding equilibrium Aliquots of 1 mL were transferred to polycarbonate centrifuge tubes (Beckman) and either centrifuged in a TLA 1002 rotor in Beckman TL 100 centrifuge (200000 x g 6 h 37degC) or incubated for 6 h (37degC) After centrifugation samples were separated into three layers according to density A 80-microL aliquot of the middle layer (protein-free partplasma water) was taken and analyzed for the test compound representing the unbound concentration in plasma (CU) Total plasma concentration (CP) was
20
determined in incubated samples The unbound drug fraction in plasma was calculated using CUCP
Determination of major binding protein
The affinity of test compounds to different plasma proteins was determined using the appropriate method for each compound Purified human plasma proteins were dissolved in phosphate buffered saline (PBS Gibco Paisley Scotland) at physiological concentrations as follows albumin 40 gL (ge96 Sigma) α-acid glycoprotein 1 gL (from Cohn Fraction VI 99 Sigma) γ-globulins 12 gL (from Cohn Fraction II and III Sigma) high density lipoprotein 39 gL (gt95 Calbiochem) low density lipoprotein 36 gL (gt95 Calbiochem) and very low density lipoprotein 13 gL (gt95 Calbiochem) Test solution was added to protein solutions to obtain a compound concentration of 10 ngmL (COM1 COM2) or 1000 ngmL (COM3 COM4 COM5) After incubation at 37degC separation of bound and unbound compound was achieved according methods Ultrafiltration was performed by centrifugation for 10 min for samples containing albumin and γ-globulins and for 2 min for all other samples
335 Determination of protein concentration
Protein concentration was measured by the method of Bradford (Coomassie blue protein assay) at 595 nm by using a Bio-Rad protein assay (Bio-Rad Laboratories Muumlnchen Germany) The protein concentration was determined by using a calibration curve that was established with known concentrations of human serum albumin (ge96 Sigma) ranging from 0 to 05 mgmL 10-microL aliquots of plasma (1200 dilution) and plasma water were pipetted into microtiter plate wells 200 microL dye reagent were added and samples were mixed After 1-h incubation at room temperature absorbance was measured
34 In vivo studies
Samples collected after intravenous administration of COM1 COM2 and COM3 were assayed for radioactivity by LSC and parent drug by LC-RID COM4 and COM5 were quantified in all in vivo samples only by radioactivity measurements (LSC) since the radioactivity of both radiolabeled compounds reflects well the parent drug due to no major degradation at 1 h after intravenous administration in rats (151152)
341 Experimental animals
Male Wistar rats (~250 g) and male OF1 mice (~30 g) were obtained from Charles River (Sulzfeld Germany) All animals were housed in standard cages in a controlled environment maintained on an automatic 12-h lighting cycle at a temperature of 22degC according to institutional guidelines The animals were given a standard chow and water ad libitum The animals were used after having been starved overnight
342 Drug administration and sample collection
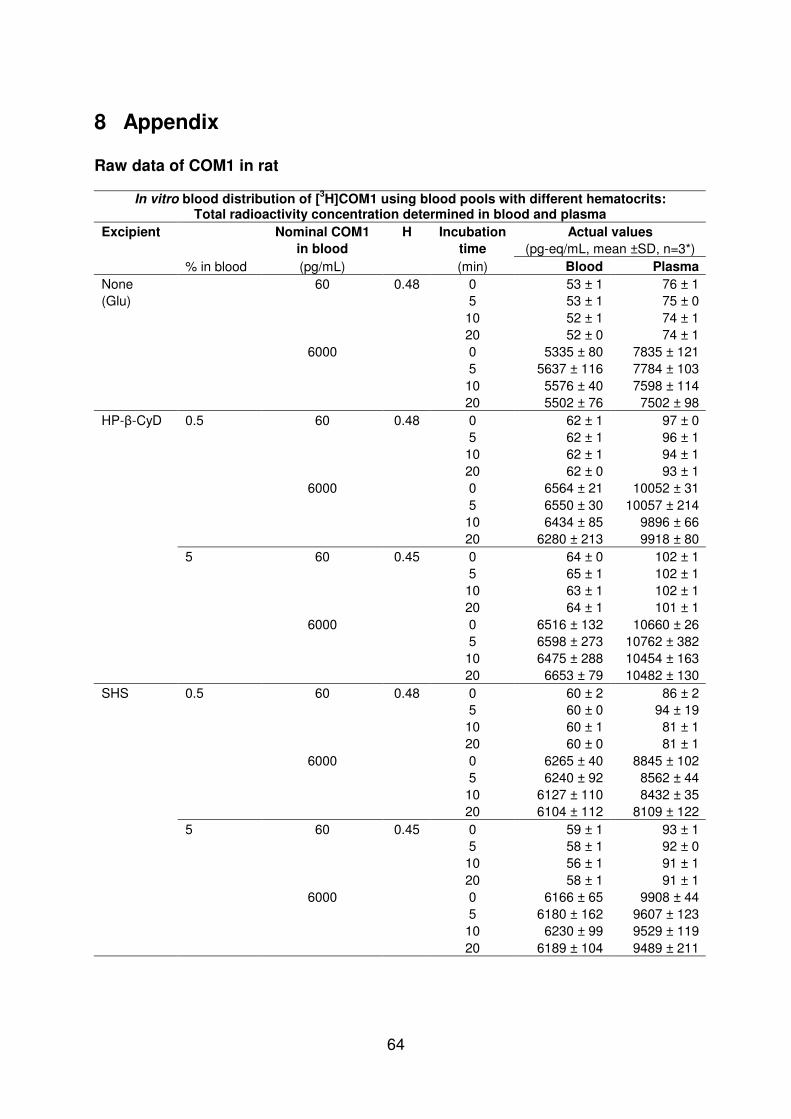
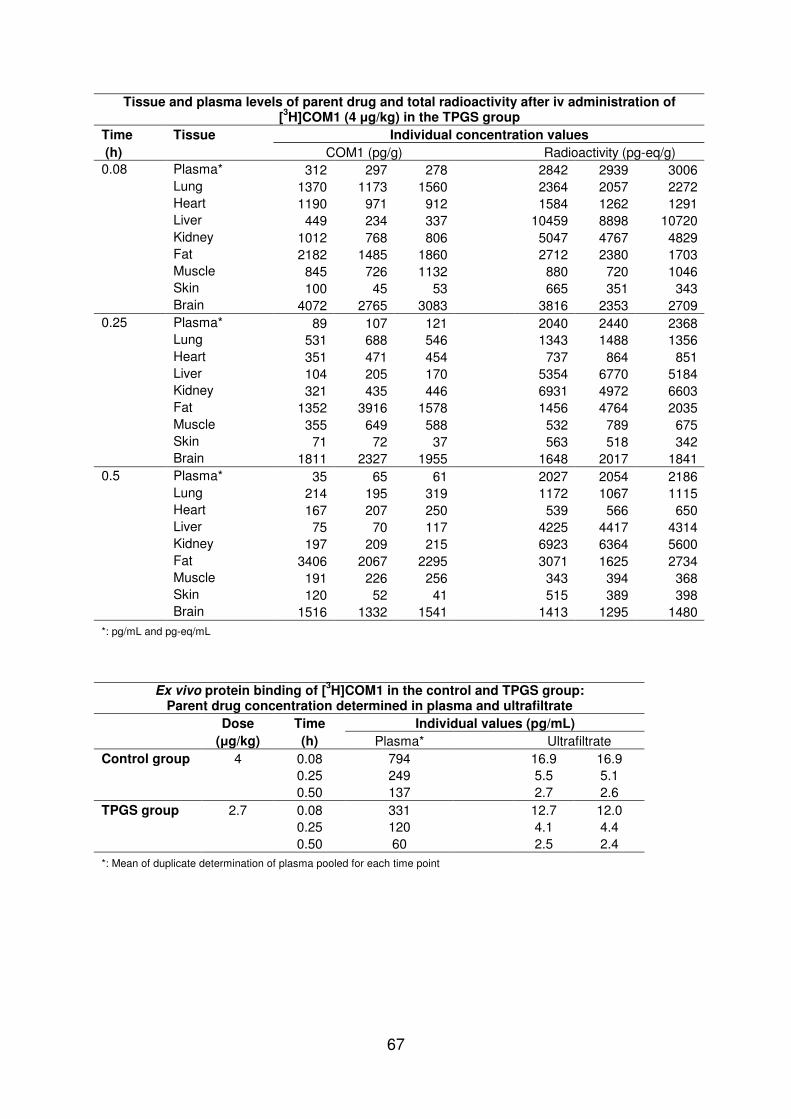
All dosing solutions were prepared within 1 h prior to injection and stored at room temperature until use Administration was performed by a single bolus injection into the femoral vein after animals had been lightly anesthetized by isoflurane (Forenereg) Rats received [3H]COM1 at 4 microgkg as solution (1 mLkg) in glucose 5 containing
21
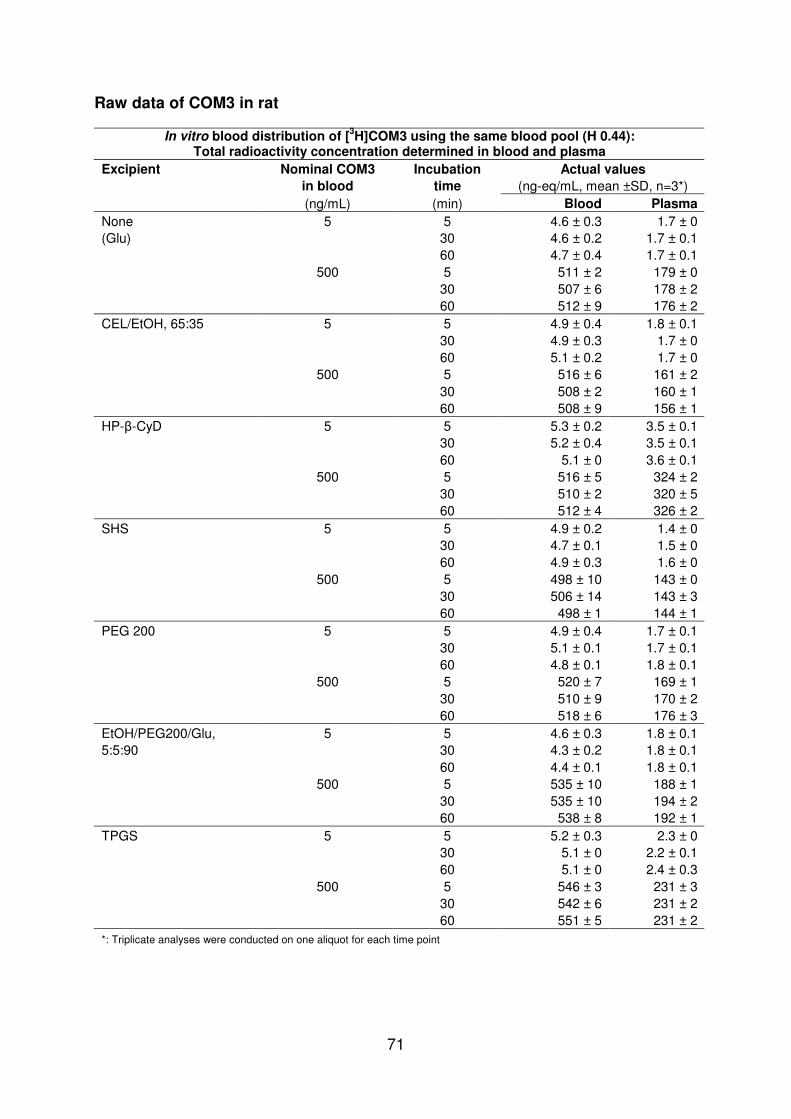
ethanol 1 (vv) or TPGS 20 (wv) Mice were injected a dose of 400 ngkg of [3H]COM2 formulated as solution (5 mLkg) in blank plasma (obtained by centrifugation of freshly drawn mouse blood) or in glucose 5 containing TPGS 10 (wv) An iv dose of 1 micromolkg radiolabeled COM3 (3H 300 microgkg 14C 370 microgkg) in EtOHPEG200Glu 5590 (vvv) or 40 HP-β-CyD (wv) was injected to rats (1 mLkg) [14C]COM4 was administered at 400 microgkg in saline or 17 CEL (vv) to rats (2 mLkg) [14C]COM5 at 1 mgkg in saline containing either ethanol 10 (vv) or 17 Solutol (wv) were injected to rats (2 mLkg)
Using these injection preparations excipient concentrations in blood may be estimated as about 03 (COM1) 05 (COM3 COM4 COM5) and 07 (COM2) in animals (~70 mL bloodkg) These concentrations were similar to those used in the in vitro experiments
Samples were collected after drug administration at 008 025 and 05 h for COM1 and at 008 025 05 and 1 h for COM2 COM3 COM4 and COM5 Animals (n=3 per time point) were sacrificed by isoflurane inhalation for sample collection Blood samples were collected from the vena cava and transferred into tubes containing heparin (heparin-Na BBraun) as anticoagulant Plasma samples were obtained by immediate centrifugation of blood samples at 3000 x g for 10 min Tissues were excised blotted dry and weighed Collected tissue comprised lung heart liver kidney fat muscle skin and brain for COM1 COM2 COM3 and lung muscle and skin for COM4 and brain muscle and skin for COM5 All samples were immediately frozen and stored at -20degC until analysis Tissue samples were homogenized before quantification
343 Bladder catheterization and urine collection
The experiment was performed in situ under anesthetized rats Animals (n=3formulation) received im injections of ketamine hydrochloride at a dose of 50 mgkg (100 mgmL 05 mLkg) and are positioned on an isothermal heating pad prewarmed at 38degC The abdomen was opened through a mid-line incision A polyethylene tubing (Clay-Adams PE-50) was inserted into the dome of the bladder and held in place with a purse string suture The formulation was injected into the surgically exposed femoral vein and urine was collected at 05 1 15 and 2 h after dosing All samples were frozen and stored at -20degC until analysis
344 Ex vivo protein binding
Ex vivo protein binding was determined for COM1 COM3 COM4 and COM5 according to the in vitro procedure Briefly remaining plasma samples of each time point were pooled and the unbound drug concentration in plasma was quantified using the ultrafiltration technique (see 334) After centrifugation plasma and ultrafiltrate samples were assayed for radioactivity by LSC and parent drug by LC-RID
35 Measurement of the radioactivity
Aliquots of blood plasma urine (25-50 microL) and homogenates (250 microL) were introduced into counting vials and solubilized in Biolute-S (Zinsser Analytic) Samples obtained from in vivo studies containing tritium-labeled drug were dried and the residue was reconstituted in water before solubilization To the blood samples
22
hydrogen peroxide 30 was additionally added and vials were gently swirled for several seconds and let stand for 30 min After adjusting pH gt7 by addition of hydrochloric acid 2 N the vials were filled with scintillation cocktail (Irgasafe Plus Zinsser Analytic) kept in the dark for 16 h and measured in a Tri-Carb liquid scintillation spectrometer Model A2200 (Packard)
36 Determination of parent drug 3H-radiolabeled COM1 COM2 and COM3 were determined by a liquid
chromatography-reverse isotope dilution method (LC-RID) A sample aliquot (100-500 microL) and 200 microL water containing 5 microg (COM1 COM3) or 2 microg (COM2) non-radiolabeled test compound as internal standard was added to a glass tube After further addition of 1 mL water 100 microL Titrisol buffer (pH 4 COM1 COM2 pH 7 COM3) and 4 mL diethyl ether (COM1 COM2) or tert-butylmethylether (COM3) tubes were shaken for 30 min and centrifuged (3300 x g for 10 min) The organic layer was collected in another glass tube and evaporated in a vacuum centrifuge (Univapo 150H UniEquip Martinsried Germany) The residue was taken up in 250 microL of mobile phase-water (8020 vv) and 75 microL n-hexane and the mixture was transferred in an auto sampler glass vial After centrifugation (13000 x g for 2 min) the hexane layer was discarded and 200 microL of the remainder was injected into the HPLC system equipped with a Supelcosil LC-18 column (5 microm 46 mm x 150 mm) for COM1 or Waters XTerra RP 8 column (5 microm 39 x 150 mm) for COM2 and COM3 The column temperature was 40degC and the absorbance was detected at a wavelength of 312 nm (COM1) 441 nm (COM2) or 261 nm (COM3) The mobile phase (isocratic gradient) consisted of ammonium acetate 10 mM-acetonitrile (4555 COM1 5050 COM2) or ammonium acetate 10 mM-triethylamine 01 in acetonitrile (5842 COM3) and was pumped at a rate of 10 mLmin The peak corresponding to the unchanged compound was collected in a polyethylene vial by a fraction collector (Pharmacia LKB SuperFrac) and analyzed for radioactivity Concentrations of the test compound in samples were calculated from the ratio of the amount of radioactivity in the eluted fraction and the area of the absorbance of the non-radiolabeled test compound used as internal standard
37 Data analysis
Total radioactivity concentrations expressed as ng-eqmL or ng-eqg were estimated by dividing the radioactivity concentration in samples by the specific radioactivity of administered test compound using Microsoft Excel Concentrations of parent drug were determined by the principle of reverse isotope dilution using following equation in Microsoft Excel
ID
AD
IS
AS
A
A
A
A=
where AAS is the amount of analyte in the sample (unknown to be determined) AIS is the amount of internal standard added to the sample AAD is the amount of analyte detected and AID is the amount of internal standard detected AAD was calculated using R(SRxS) where R is the amount of radioactivity determined in the peak fraction SR is the specific radioactivity and S is the slope The amount of internal standard detected was calculated as AID=AreaRF-AAD where RF is the response factor (Areang) The level of quantification (LOQ) was set to 75 dpm LOQs of
23
radioactivity and test compound in blood plasma urine and tissues were calculated by dividing 75 dpm by the specific radioactivity of the administered test compound and by the sample amount P values were calculated with a two-sample t-test in Microsoft Excel assuming unequal variances The level of significance was set at P lt005
38 Pharmacokinetic analysis
Pharmacokinetic parameters were estimated as follows The area under the drug concentration-time curve (AUC) was determined by the linear trapezoidal rule using the mean data points The half-life (t12) was calculated using ln2k where k is the rate constant k was estimated by the slope of the regression line plotted through the three final data points of the semilogarithmic AUC taking into consideration a square of correlation coefficient of RSQ gt090 Volume of distribution (V0) was calculated by dividing the dose by the concentration at time zero (C0) C0 was obtained by extrapolation to zero time of the concentration-time plot in semilogarithmic scale
24
4 Results and discussions
41 Hemolytic activity of excipients
In vitro results
CELEtOH 6535 EtOH HP-β-CyD PEG 200 and Solutol did not induce hemolysis in dog and human blood at 05 and a contact time of 4 h (data not shown) In contrast TPGS at 05 incubated with blood of various species caused hemolysis in a time-dependent manner (Figure 4-1) Erythrocytes from rat and human were more sensitive than those of mouse and dog indicated by cell lysis at shorter contact times Reducing the TPGS concentration from 05 to 01 induced no hemolysis in all four species in the investigated time range (data not shown)
010
2030
4050
6070
1 h 2 h 4 h 6 h
Incubation time
Hem
oly
sis
(
)
Rat
Mouse
Dog
Human
Figure 4-1 Effect of incubation time on the hemolytic activity of TPGS
Induced hemolysis by 05 TPGS in blood of various species (n=3 mean plusmn SD) Hemolysis in rat blood after 6-h incubation was not determined
Discussion
Except for TPGS all tested excipients (CEL EtOH HP-β-CyD Solutol and PEG 200) were non-hemolytic which is consistent with data reported in the literature (134135136137138) and the fact that they are widely used in commercially available parenteralia (54) TPGS at 05 exhibited marked hemolysis after longer contact time (gt1 h) whereas TPGS at 01 showed no hemolysis under equal incubation conditions The detected hemolysis might possibly result not mainly from TPGS but from metabolites namely α-tocopheryl succinate and polyethylene glycols both being able to destruct erythrocytes (134139140) This phenomena could contribute to the extensively delayed onset of hemolysis For the investigations TPGS at 05 was used in the non-hemolytic time range
25
42 Impact of the hematocrit on blood partition parameters
In vitro results
Whole blood derived from three species was incubated with COM2 (100 ngmL) at varying hematocrit values Concentrations of COM2 in blood and plasma were measured at equilibrium and partition parameters calculated from these data are summarized in Table 4-1 Concentrations in blood plasma and blood cells remained unaffected by the hematocrit value (040-060) The partition parameter BPR was also similar over the investigated hematocrit range whereas BCPR changed slightly and FP distinctly both decreasing by increasing the hematocrit from 040 to 060
Table 4-1 Effect of hematocrit on the in vitro blood distribution of COM2
Blood cell concentrations and partition parameters (FP BPR and BCPR) derived from [3H]COM2 concentrations measured in blood and plasma using same blood pools at different hematocrit values (n=3 mean plusmn SD)
Species Hematocrit Concentration (ngmL) FP BPR BCPR
Blood Plasma Blood cells () Mouse 040 50 plusmn 1 121 plusmn 003 152 plusmn 007 045 46 plusmn 2 120 plusmn 006 144 plusmn 013 050 101 plusmn 3 87 plusmn 4 116 plusmn 8 43 plusmn 0 116 plusmn 001 132 plusmn 001 055 40 plusmn 1 113 plusmn 004 123 plusmn 006 060 36 plusmn 1 112 plusmn 003 119 plusmn 005 Dog 040 48 plusmn 2 126 plusmn 006 166 plusmn 014 045 44 plusmn 1 125 plusmn 004 157 plusmn 009 050 109 plusmn 4 90 plusmn 2 131 plusmn 15 41 plusmn 1 125 plusmn 003 151 plusmn 005 055 38 plusmn 1 119 plusmn 003 135 plusmn 006 060 35 plusmn 1 113 plusmn 002 122 plusmn 003 Human 040 70 plusmn 3 086 plusmn 003 066 plusmn 008 045 65 plusmn 2 084 plusmn 003 065 plusmn 007 050 101 plusmn 5 125 plusmn 10 78 plusmn 6 63 plusmn 2 080 plusmn 003 060 plusmn 006 055 55 plusmn 2 082 plusmn 003 068 plusmn 006 060 55 plusmn 1 073 plusmn 002 055 plusmn 003
Discussion
The in vitro method for investigating distribution of drugs in blood commonly uses whole blood freshly prepared and pooled Drug concentrations in blood and plasma are determined Based on these data further partition parameters including CBC FP BPR and BCPR can be estimated but they are partially dependent on the hematocrit Therefore it is important to know how the hematocrit affects these parameters thereby providing useful information for comparing results With this in mind present experiments were performed over the entire physiological hematocrit range in blood pools of three different species (mouse dog and human) COM2 was used as test compound due to sufficient availability
The rank order of hematocrit influences was FP gt BCPR gt BPR gt CB asymp CP asymp CBC with most pronounced changes for FP and none for CBCPCBC Parameters calculated from concentrations measured in samples decreased constantly with increasing the hematocrit (040-060) which was most distinct for FP But within a hematocrit variation of 005 none of the parameters was dependent on the
26
hematocrit Consequently blood partition data obtained from in vitro experiments with similar hematocrits are consistent and can be compared together For data comparison across studies hematocrit adjusting to values of previous studies is suggested taking into consideration a difference of le005 between the lowest and highest value
43 Major binding proteins of model compounds
In vitro results
Figure 4-2 illustrates the qualitative binding of model compounds to isolated proteins compared to the total fraction bound in plasma The following ranking was obtained with regard to decreasing order of protein binding
COM1 albumin gt α1-acid glycoprotein gt γ-globulins asymp lipoproteins COM2 albumin gt lipoproteins gt γ-globulins gtgt α1-acid glycoprotein COM3 α1-acid glycoprotein gt albumin gt γ-globulins gtgt lipoproteins COM4 albumin gt α1-acid glycoprotein gtgt γ-globulins asymp lipoproteins COM5 albumin asymp α1-acid glycoprotein gtgt γ-globulins asymp lipoproteins
0
10
20
30
40
50
60
70
80
90
100
COM1 COM2 COM3 COM4 COM5
Bo
un
d f
racti
on
(
)
Plasma Albumin AGP γ-globulins HDL LDL VLDL
Figure 4-2 Qualitative differences in protein binding patterns of model compounds in vitro
Total protein-bound fraction of compounds in human plasma compared to the qualitative extent of compound binding to various isolated human proteins (albumin AGP γ-globulins and lipoproteins such as HDL LDL and VLDL) Each bar represents mean plusmn SD (n=3)
Discussion
In vitro experiments showed the binding of model compounds with different degrees to the three major drug-binding proteins in plasma (albumin α1-acid glycoprotein lipoproteins) A high binding to albumin (A) and α1-acid glycoprotein (AGP) was found for COM1 and COM4 (AgtAGP) COM5 (AasympAGP) and COM3 (AltAGP) In contrast COM2 was highly bound to albumin and lipoproteins
27
44 The impact of Vitamin E TPGS on COM1 in rat
In vitro results
The equilibrium of COM1 between plasma and blood cells was reached within few minutes (lt5 min data not shown) and the fraction of COM1 distributed in plasma (~75) was independent of initial blood concentrations of COM1 (006-6 ngmL) and of excipients at 05 (Table 4-2) Enhancing the excipient concentration to 5 in blood resulted in decreased COM1 in blood cells especially in the presence of TPGS (Table 4-2) In plasma COM1 was highly protein bound with high contribution of albumin and α1-acid glycoprotein in binding (Figure 4-2) and a lower free fraction was found for COM1 in TPGS at 5 (Table 4-2) TPGS was taken for the in vivo study due to the most pronounced changes observed in the in vitro experiments
Table 4-2 Effect of excipients on blood distribution and protein binding of COM1 in vitro
Partition parameters of [3H]COM1 at 006-6 ngmL obtained at equilibrium after incubation with and without excipients in rat blood (pH 74 H 046 plusmn 003 n ge3 mean plusmn SD)
Excipient FP BPR BCPR fu ρ
() () ()
None 728 plusmn 22 071 plusmn 002 041 plusmn 004 41 plusmn 02 99 plusmn 1 HP-β-CyD 05 798 plusmn 17 065 plusmn 001 027 plusmn 002 nd nd 5 882 plusmn 24 063 plusmn 002 017 plusmn 004 nd nd Solutol 05 702 plusmn 24 073 plusmn 001 043 plusmn 001 nd nd 5 878 plusmn 23 064 plusmn 001 018 plusmn 002 nd nd TPGS 05 802 plusmn 24 064 plusmn 001 026 plusmn 001 39 plusmn 07 66 plusmn 03 5 956 plusmn 20 063 plusmn 001 008 plusmn 003 17 plusmn 03 53 plusmn 15
In vivo results
In contrast to the control group where a dose of 4 microgkg was applied COM1 was administered in the TPGS group at 27 microgkg due to little compound availability Data presented within this section are normalized to a dose of 1 microgkg
Independent of the formulation plasma levels declined very rapidly with an apparent half-life of 017 h and COM1 was rapidly metabolized (lt30 unchanged COM1 in plasma at 008 h post-dose) Metabolites were fast eliminated from body indicated by a low recovery of administered COM1 shortly after dosing (lt30 of administered dose recovered at 008 h post-dose)
Upon intravenous administration of COM1 as a TPGS-containing solution lower total plasma concentrations combined with an increase of COM1 unbound in plasma by 50 were found in contrast to the control group (Table 4-3 Figure 4-3) However free drug concentrations in plasma did not differ between both groups resulting in similar AUCs (Table 4-3) This is in line with identical tissue concentrations observed in both groups (data not shown) since only the unbound drug is supposed to pass across membranes Furthermore COM1 in TPGS led to a lower fraction of parent drug in plasma (funchanged Table 4-3) and higher metabolite-related concentrations in plasma (2-fold increase Figure 4-3) indicating alterations in the kinetic profile of metabolites
28
Table 4-3 Comparative plasma kinetics of COM1 with and without TPGS
Plasma concentrations and pharmacokinetic parameters of [3H]COM1 administered intravenously in formulations based on glucose 5 (control) or TPGS 20 to rats (LOQ=2 pgmL n=3 mean plusmn SD) Data are normalized to a dose of 1 microgkg AUC(u)008-05h relates to area under unbound drug plasma concentration-time curve
Time Control TPGS
(h) COM1 in plasma (pgmL) Percentage of control value
008 184 plusmn 77 110 plusmn 6 60 025 59 plusmn 13 39 plusmn 6 66 05 32 plusmn 11 20 plusmn 6 62 C0 (pgmL) 215 132 AUC008-05h (pgmiddotmL
-1middoth) 32 20
AUC(u)008-05h (pgmiddotmL-1
middoth) 067 076 t12 (h) 017 017 funchanged () 187 55 fu () 21 plusmn 01 38 plusmn 03
Parent drug Metabolites
10
100
1000
0 025 05
Time (h)
CO
M1
(p
gm
L)
100
1000
10000
0 025 05
Time (h)
Rad
ioacti
vit
y (
pg
-eq
mL
)
Figure 4-3 Influence of TPGS on the systemic exposure of COM1 and metabolites
Plasma concentration-time profiles of parent drug and metabolite-related radioactivity of [3H]COM1 after intravenous administration to rats COM1 was injected in glucose 5 (closed symbols black line) or TPGS 20 (open symbols dashed line) Data shown are normalized to a dose of 1 microgkg and symbols represent single values and lines mean values (n=3) Values of metabolite-related radioactivity were obtained by subtracting concentrations of parent drug from concentrations of total radioactivity
Discussion
Drug-excipient interaction studies showed no direct correlation between the in vitro results and the in vivo situation in rats Upon intravenous administration of COM1 in TPGS slightly lower plasma concentrations and binding to plasma proteins were observed in animals as compared to those received COM1 in a TPGS-free solution In contrast to these in vivo findings COM1 displayed in vitro no alterations in the presence of TPGS at 05 whereas a higher TPGS concentration (5) led to
29
enhanced distribution into plasma and a higher fraction bound in plasma Furthermore very rapid metabolism and elimination of COM1 under in vivo conditions contributed to a pharmacokinetic profile inappropriate for studying drug-excipient interactions
45 The impact of Vitamin E TPGS on COM2 in mouse
In vitro results
To assess whether the ultracentrifugation time could be shortened for minimizing the degradation of COM2 in plasma (147) blank plasma samples were centrifuged and time aliquots were analyzed for total protein concentrations in plasma and plasma water After 4-h centrifugation protein levels in the plasma water section were below 005 ngmL corresponding to ~01 of total plasma proteins adequate to assure a sufficient separation of plasma water and proteins Therefore samples were collected after 4-h centrifugation for analysis
COM2 (001-100 ngmL) distributed almost equally between whole blood and plasma (FP ~45) and was very highly bound to plasma proteins (gt98 mainly to albumin and lipoproteins) (Figure 4-2) The plasma fraction (63) was enhanced for COM2 in TPGS at the beginning (lt1-h incubation) followed by equalization to excipient-free incubations (Table 4-4 Figure 4-4) The presence of TPGS reduced also the free fraction in plasma by 30 (Table 4-4) Finally TPGS was selected for the in vivo study because of the most pronounced drug-excipient interactions detected in vitro
Table 4-4 Effect of excipients on blood distribution and protein binding of COM2 in vitro
Partition parameters of [3H]COM2 at 01 ngmL obtained at equilibrium after incubation with and without excipients (05) in mouse blood (pH 73 H 045 nge3 mean plusmn SD)
Excipient Time FP BPR BCPR fu ρ
(h) () ()
None 008 406 plusmn 07 136 plusmn 002 179 plusmn 005 102 plusmn 3 1 448 plusmn 24 123 plusmn 007 151 plusmn 015
176 plusmn 003 86 plusmn 8
CELEtOH 6535(vv) 008 455 plusmn 14 121 plusmn 004 146 plusmn 009 nd 1 438 plusmn 03 125 plusmn 001 157 plusmn 002
nd nd
HP-β-CyD 008 472 plusmn 14 117 plusmn 009 138 plusmn 019 nd 1 494 plusmn 16 111 plusmn 004 125 plusmn 008
nd nd
Solutol 008 468 plusmn 11 118 plusmn 003 139 plusmn 006 nd 1 472 plusmn 16 117 plusmn 004 137 plusmn 009
nd nd
PEG 200 008 425 plusmn 13 129 plusmn 004 165 plusmn 009 nd 1 418 plusmn 20 132 plusmn 006 171 plusmn 014
nd nd
TPGS 008 629 plusmn 23 087 plusmn 003 072 plusmn 007 58 plusmn 7 1 533 plusmn 07 103 plusmn 001 107 plusmn 003
122 plusmn 012 88 plusmn 3
30
(a)
00
05
10
15
008 h 1 h
BP
R(b)
00
05
10
15
20
008 h 1 h
BC
PR
(c)
0
20
40
60
80
100
008 h 1 h
ρ
Figure 4-4 TPGS-mediated alteration of COM2 distribution in blood
Blood-plasma (a) blood cell-plasma (b) and blood cell-unbound in plasma (c) concentration ratios of [3H]COM2 at 01 ngmL in the presence (white bars) and absence (black bars) of TGPS (05) after 008-h and 1-h incubation in mouse blood (pH 73 H 045 nge3 mean plusmn SD)
In vivo results
In a previous study (153) the disposition kinetics of COM2 was evaluated in mice after iv administration in a solution containing HP-β-CyD 10 (5 mLkg) To enable a comparison of former data with those in the current investigation for internal purposes only COM2 was injected at a volume of 5 mLkg dissolved in plasma or TPGS 10 The blood concentration of TPGS from this injection preparation was estimated as ~07 assuming a blood volume of 72 mLkg Thus the amount of TPGS in blood was higher in vivo compared to the amount used in vitro (05)
The administration of COM2 as TPGS-containing solution at the same dosage caused approximately 2-fold higher plasma concentrations as compared to COM2 formulated in plasma (control) (Table 4-5 Figure 4-5) These findings are in line with data obtained in blood distribution studies in vitro where partitioning into blood cells was reduced in the presence of TPGS resulting in a higher concentration in plasma at the same total blood concentration Furthermore in vivo a higher plasma exposure to metabolites and a slower elimination of metabolites from the systemic circulation were found for COM2 in TPGS indicated by 4-fold increased AUC and t12 of metabolite-related radioactivity in plasma (Table 4-6) Determination of unbound COM2 in plasma could not be performed on samples from mice due to concentrations below LOQ (3 pgmL)
No differences in tissue concentrations were observed between both groups although COM2 in TPGS resulted in a decrease of V0 (Table 4-5) and KP (Table 4-7) both suggesting altered tissue distribution and being in line with higher drug accumulation in the circulation Because the free drug fraction in plasma generally reflects more accurately distribution processes due to the ability of unbound drugs to pass through membranes and then reach the target organ the free drug fraction determined in vitro was considered Calculated tissue-unbound in plasma concentration ratios KP(u) were reduced in the TPGS group only within the first minutes after drug administration (Table 4-7)
31
Table 4-5 Comparative plasma kinetics of COM2 with and without TPGS
Plasma concentrations (a) and pharmacokinetic parameters (b) of [3H]COM2 after iv dosing at 400 ngkg in formulations based on blank plasma (control) or TPGS to mice (LOQ=3 pgmL n=3 mean plusmn SD) significantly different from the control at Plt005 and 001 respectively
(a)
Time COM2 in plasma (pgmL)
(h) Control TPGS Percentage of control value
008 104 plusmn 11 247 plusmn 23 238 025 81 plusmn 12 159 plusmn 16 196 05 59 plusmn 2 124 plusmn 17 210 1 34 plusmn 7 80 plusmn 17 235
(b)
Parameter Unit Formulation
Blank plasma TPGS 10 Body weight kg 0028 0027 Dose ng 110 107 C0 pgmL 111 237 tfrac12 h 057 061 V0 Lkg 36 17 AUC008-1h pgmiddotmL-1middoth 56 121 DoseAUC008-1h mLh 196 89 funchanged 54 35
Parent drug Metabolites
10
100
1000
0 025 05 075 1
Time (h)
CO
M2 (
pg
mL
)
10
100
1000
0 025 05 075 1
Time (h)
Rad
ioacti
vit
y (
pg
-eq
mL
)
Figure 4-5 Influence of TPGS on the systemic exposure of COM2 and metabolites
Plasma concentration-time profiles of parent drug and metabolite-related radioactivity of [3H]COM2 after intravenous administration to mice at 400 ngkg formulated in blank plasma (closed symbols black line) or as a solution containing TPGS 10 (open symbols dashed line) Symbols represent single values and lines mean values (n=3) Values of metabolite-related radioactivity were obtained by subtracting concentrations of parent drug from concentrations of total radioactivity
32
Table 4-6 Comparative plasma kinetics of metabolites of COM2 with and without TPGS
Plasma concentrations and pharmacokinetic parameters of metabolite-related radioactivity after iv administration of [3H]COM2 (400 ngkg) in blank plasma (control) or TPGS 10 to mice (n=3 mean plusmn SD) Values of metabolite-related radioactivity were obtained by subtracting concentrations of parent drug from concentrations of total radioactivity significantly different from the control at Plt001
Time Control TPGS
(h) Metabolites in plasma (pg-eqmL) Percentage of control value
008 75 plusmn 6 307 plusmn 28 408 025 67 plusmn 4 233 plusmn 9 346 05 56 plusmn 2 246 plusmn 30 441 1 29 plusmn 8 218 plusmn 31 744 AUC008-1h (pgmiddotmL
-1middoth) 49 222 453
t12 (h) 06 24 395
Table 4-7 Comparison of tissue distribution of COM2 with and without TPGS
Tissue concentrations and tissue-plasma concentration ratios (KP) of [3H]COM2 administered intravenously at 400 ngkg in blank plasma (control) or 10 TPGS solution to mice (n=3) KP(u) relates to the free compound concentration in plasma based on the free fraction determined in vitro Values represent mean plusmn SD
Time Tissue Concentration (pgg) KP KP(u)
(h) Control TPGS Control TPGS Control TPGS 008 Lung 1808 plusmn 263 1861 plusmn 64 173 plusmn 07 76 plusmn 05 981 plusmn 39 621 plusmn 42 Heart 750 plusmn 111 699 plusmn 33 72 plusmn 03 28 plusmn 01 407 plusmn 17 233 plusmn 11 Liver 2188 plusmn 355 2314 plusmn 56 209 plusmn 12 94 plusmn 09 1186 plusmn 69 773 plusmn 72 Kidney 1761 plusmn 390 1735 plusmn 84 167 plusmn 22 71 plusmn 07 951 plusmn 124 580 plusmn 59 Fat 232 plusmn 94 238 plusmn 83 22 plusmn 09 1 plusmn 03 127 plusmn 49 79 plusmn 25 Muscle 166 plusmn 40 190 plusmn 82 16 plusmn 06 08 plusmn 03 92 plusmn 32 62 plusmn 22 Brain 1095 plusmn 70 1038 plusmn 113 105 plusmn 06 42 plusmn 01 598 plusmn 35 345 plusmn 9 025 Lung 1206 plusmn 258 1277 plusmn 213 15 plusmn 26 8 plusmn 05 850 plusmn 148 657 plusmn 43 Heart 464 plusmn 31 473 plusmn 19 58 plusmn 06 3 plusmn 02 330 plusmn 37 246 plusmn 20 Liver 1447 plusmn 203 1626 plusmn 122 18 plusmn 19 103 plusmn 13 1024 plusmn 109 846 plusmn 109 Kidney 1176 plusmn 93 1161 plusmn 83 147 plusmn 19 74 plusmn 1 837 plusmn 108 605 plusmn 86 Fat 650 plusmn 169 1109 plusmn 321 81 plusmn 19 71 plusmn 24 458 plusmn 108 581 plusmn 198 Muscle 215 plusmn 13 214 plusmn 28 27 plusmn 05 14 plusmn 01 155 plusmn 28 111 plusmn 12 Brain 1199 plusmn 143 1180 plusmn 81 152 plusmn 34 75 plusmn 12 863 plusmn 194 616 plusmn 100 05 Lung 755 plusmn 76 923 plusmn 40 129 plusmn 15 75 plusmn 06 732 plusmn 83 615 plusmn 53 Heart 296 plusmn 34 354 plusmn 53 5 plusmn 06 29 plusmn 04 287 plusmn 34 234 plusmn 29 Liver 960 plusmn 91 1138 plusmn 58 163 plusmn 15 93 plusmn 12 929 plusmn 88 760 plusmn 100 Kidney 814 plusmn 102 987 plusmn 120 139 plusmn 19 8 plusmn 04 789 plusmn 110 654 plusmn 34 Fat 863 plusmn 227 1079 plusmn 444 147 plusmn 37 89 plusmn 51 834 plusmn 209 732 plusmn 416 Muscle 181 plusmn 12 170 plusmn 13 31 plusmn 02 14 plusmn 02 175 plusmn 11 113 plusmn 13 Brain 1086 plusmn 108 1215 plusmn 147 18 plusmn 18 98 plusmn 08 1050 plusmn 77 805 plusmn 69 1 Lung 439 plusmn 60 688 plusmn 187 133 plusmn 32 86 plusmn 05 758 plusmn 179 702 plusmn 43 Heart 186 plusmn 28 220 plusmn 72 57 plusmn 15 27 plusmn 04 322 plusmn 87 222 plusmn 31 Liver 581 plusmn 43 867 plusmn 140 176 plusmn 23 11 plusmn 15 998 plusmn 132 903 plusmn 123 Kidney 481 plusmn 37 740 plusmn 89 145 plusmn 19 94 plusmn 09 825 plusmn 105 771 plusmn 78 Fat 551 plusmn 143 504 plusmn 260 173 plusmn 77 71 plusmn 54 984 plusmn 439 584 plusmn 442 Muscle 91 plusmn 12 119 plusmn 37 28 plusmn 08 15 plusmn 03 159 plusmn 43 121 plusmn 25 Brain 731 plusmn 88 1073 plusmn 161 22 plusmn 26 136 plusmn 11 1249 plusmn 147 1114 plusmn 93
33
Discussion
Results signified the ability of the excipient TPGS to modify the blood distribution of COM2 in mouse under in vitro and in vivo conditions in a similar manner Plasma concentrations of COM2 and metabolites were significantly increased and the free fraction of drug in plasma (in vitro) decreased Concentrations in tissues were independent of the formulation whereas distribution ratios of drug in tissue to drug unbound in plasma were lower within the first minutes after dosing COM2 in TPGS Overall the altered pharmacokinetic profile of COM2 in plasma suggests drug inclusion in excipient-micelles andor promoted protein binding by excipient in plasma
The altered disposition of COM2 and metabolites in plasma is likely caused by the ability of TPGS to form micelles (141) Drug trapping by micelles in blood can be responsible for increased total plasma concentrations and decreased unbound fraction in plasma thereby influencing drug accumulation in plasma and blood cells (94) Changes in the free fraction could also be caused by altered protein binding There are different suggested mechanisms by which formulation vehicles can influence the free fraction of compounds such as vehicle-compound interactions (association andor micellar encapsulation) and vehicle-protein interactions The interaction either promotes or blocks the binding of the compound in plasma Most likely different interacting processes contribute to the effective free fraction (125)
The alteration in tissue distribution at the beginning may be induced by changes of the free drug fraction in the presence of TPGS and exists only for few minutes probably due to the excipient degradation in blood The phenomenon found after some minutes post-dose is reported in the literature for Paclitaxel formulated in Cremophor EL (94) The main characteristics are disproportionally increased plasma concentrations accompanied by unchanged tissue levels and tissue distribution processes
46 The impact of hydroxypropyl-β-cyclodextrin on COM3 in rat
In vitro results
COM3 was predominantly located in the cellular fraction (80) and was moderately bound to plasma proteins with high binding to α1-glycoprotein and albumin in a concentration-independent manner (Table 4-8 Figure 4-2) The drug partitioning into blood cells and the fraction bound to proteins were markedly reduced in incubations containing HP-β-CyD consequently lowering both the blood-plasma and blood cell-unbound in plasma concentration ratios (Table 4-8 Figure 4-6) Whereas HP-β-CyD decreased the protein binding suggesting more COM3 available for uptake into cells higher plasma levels associated with reduced concentrations in cells were observed for COM3 in HP-β-CyD In conclusion HP-β-CyD was selected for the in vivo study because of the most pronounced drug-excipient interactions detected in vitro
34
(a)
0
1
2
3
None HP-β-CyD
BP
R(b)
0
1
2
3
4
5
None HP-β-CyD
BC
PR
(c)
0
10
20
30
40
None HP-β-CyD
ρ
Figure 4-6 HP-β-CyD-mediated alteration of COM3 distribution in blood
Blood-plasma (a) blood cell-plasma (b) and blood cell-unbound in plasma (c) concentration ratios of [3H]COM3 at 5 (white bars) and 500 ngmL (black bars) in the presence and absence of HP-β-CyD (05) after incubation in rat blood (pH 76 H 044 nge3 mean plusmn SD)
Table 4-8 Effect of excipients on blood distribution and protein binding of COM3 in vitro
Partition parameters of [3H]COM3 obtained at equilibrium after incubation with and without excipients (05) in rat blood (pH 76 H 044 nge3 mean plusmn SD)
Excipient COM3 FP BPR BCPR fu ρ
(ngmL) () () None 5 209 plusmn 15 26 plusmn 01 46 plusmn 02 121 plusmn 09 399 plusmn 39 500 195 plusmn 03 29 plusmn 00 53 plusmn 01 122 plusmn 02 431 plusmn 08
5 194 plusmn 14 29 plusmn 02 56 plusmn 02 nd nd CELEtOH 6535 (vv) 500 175 plusmn 03 32 plusmn 01 60 plusmn 01 nd nd HP-β-CyD 5 385 plusmn 22 14 plusmn 01 21 plusmn 02 401 plusmn 18 51 plusmn 05 500 353 plusmn 04 16 plusmn 00 23 plusmn 00 396 plusmn 07 59 plusmn 01 Solutol 5 174 plusmn 14 32 plusmn 03 61 plusmn 04 nd nd 500 161 plusmn 03 35 plusmn 01 67 plusmn 01 nd nd PEG 200 5 197 plusmn 20 29 plusmn 03 51 plusmn 06 nd nd 500 186 plusmn 05 30 plusmn 01 56 plusmn 02 nd nd
5 227 plusmn 18 25 plusmn 02 44 plusmn 04 126 plusmn 01 346 plusmn 36 EtOHPEG200Glu 5590 (vvv) 500 200 plusmn 04 28 plusmn 01 51 plusmn 01 118 plusmn 02 432 plusmn 10 TPGS 5 249 plusmn 18 23 plusmn 02 40 plusmn 02 nd nd 500 237 plusmn 03 24 plusmn 00 41 plusmn 01 nd nd
In vivo results
Since COM3 dissolved in EtOHPEG200Glu (5590 vvv) showed similar distribution kinetics in vitro as compared to glucose 5 without additives (Table 4-8) the control formulation consisted of EtOHPEG200Glu This assured a sufficient solubility of COM3
Dosing COM3 in a HP-β-CyD-containing formulation resulted in decreased protein binding and blood cell partitioning as compared to the control group (Table 4-9) However these changes were transient and most pronounced after 5 min post-dosing followed by a decline At 60 min after drug administration differences in blood pharmacokinetics could not be longer detected between both groups anymore (Table 4-9) In contrast to the in vitro findings a lower plasma distribution was found at 5 min after applying COM3 in HP-β-CyD resulting in slightly enhanced blood-plasma and blood cell-plasma concentration ratios (Table 4-9 Figure 4-7)
35
The bolus injection of COM3 in HP-β-CyD led to an earlier decrease of kidney and lung concentrations and to a later decrease of skin liver and fat concentrations compared to tissue levels obtained after administration of COM3 alone (Table 4-11) The calculation of tissue-blood concentration ratios supported the lower distribution of COM3 formulated in HP-β-CyD (Table 4-11) especially at 1 h post-dose (Figure 4-8)
As a result of the difference in plasma pharmacokinetic parameters (Table 4-10) and tissue levels between both groups the renal elimination of COM3 was examined in addition More COM3 appeared in the urine of rats from the HP-β-CyD containing formulation (Table 4-12 Figure 4-9) especially within the first 30 minutes after drug administration (36-fold higher amount of unchanged COM3 in urine compared to the control group)
Table 4-9 Comparison of blood and plasma levels of COM3 with and without HP-β-CyD
[3H]COM3 concentrations in the systemic circulation (a) and partition parameters derived from these concentrations (b) after iv administration to rats at 300 microgkg formulated in HP-β-CyD or in a cyclodextrin-free solution (n=3 mean plusmn SD LOQ=008 ngmL assuming a hematocrit of 046(145) for calculations) significantly different from the control at Plt005 and 001 respectively
(a)
Formulation Time (h) Drug concentration (ngmL)
Blood Plasma EtOHPEG200Glu 5590 008 431 plusmn 68 175 plusmn 24 (control) 05 179 plusmn 40 61 plusmn 19 1 97 plusmn 09 41 plusmn 05 HP-β-CyD 40 008 327 plusmn 16 104 plusmn 11 025 263 plusmn 22 84 plusmn 09 05 180 plusmn 08 59 plusmn 01 1 104 plusmn 06 35 plusmn 02
(b)
Formulation Time (h) fu () FP () BPR BCPR ρ
008 225 plusmn 15 25 plusmn 02 42 plusmn 04 559 plusmn 48 EtOHPEG200Glu 5590 05 76 plusmn 08 187 plusmn 19 30 plusmn 03 54 plusmn 07 709 plusmn 89 (control) 1 233 plusmn 12 24 plusmn 01 40 plusmn 03 533 plusmn 37 HP-β-CyD 40 008 249 plusmn 12 174 plusmn 11 32 plusmn 02 58 plusmn 04 233 plusmn 17 025 177 plusmn 13 175 plusmn 06 31 plusmn 01 58 plusmn 02 325 plusmn 13 05 141 plusmn 06 180 plusmn 07 31 plusmn 01 56 plusmn 03 397 plusmn 18 1 78 plusmn 05 188 plusmn 12 29 plusmn 02 53 plusmn 04 681 plusmn 52
36
Table 4-10 Comparative pharmacokinetics of COM3 with and without HP-β-CyD
Pharmacokinetic parameters of [3H]COM3 administered intravenously in EtOHPEG 200Glu (control group) or in HP-β-CyD 40 to rats (n=3)
Parameter Unit Control group HP-β-CyD group
Blood Plasma Blood Plasma Body weight kg 0233 0221 Dose microg 70 66 C0 ngmL 46 17 35 11 V0 Lkg 66 174 85 271 AUC008-1h ngmL-1
h 197 75 177 58 funchanged 28 10 28 9
Blood Plasma
0
10
20
30
40
50
60
0 025 05 075 1Time (h)
CO
M3 (
ng
mL
)
0
5
10
15
20
25
0 025 05 075 1
Time (h)
CO
M3 (
ng
mL
)
Figure 4-7 Influence of HP-β-CyD on the systemic exposure of COM3
Blood and plasma concentration-time profiles of [3H]COM3 after intravenous administration to rats at 300 microgmL formulated in EtOHPEG 200Glu (open symbols black line) and as a solution containing HP-β-CyD (closed symbols dotted line) Symbols represent single values and lines mean values (n=3)
37
0
10
20
30
40
50
60
70
Liver Kidney Brain
0
5
10
15
Fat Muscle Skin Heart0
50
100
150
Lung
KP
Figure 4-8 Influence of HP-β-CyD on tissue distribution of COM3
Tissue to blood concentration ratio (KP) at 1 h after an iv injection of COM3 in EtOHPEG 200Glu (white bars) or in HP-β-CyD (black bars) in rats (dose 300 microgkg n=3 mean plusmn SD) significantly different from EtOHPEG 200Glu at Plt005
Table 4-11 Comparison of tissue distribution of COM3 with and without HP-β-CyD
Tissue concentrations and tissue-blood concentration ratios (KP) of [3H]COM3 after bolus injection to rats at 300 microgkg in EtOHPEG 200Glu (control) or HP-β-CyD (n=3 mean plusmn SD) significantly different from the control at Plt005
Time Tissue Concentration (ngmL) KP
(h) Control HP-β-CyD Percentage of control value Control HP-β-CyD
008 Liver 1412 plusmn 225 1058 plusmn 211 75 328 plusmn 01 326 plusmn 75 Kidney 1809 plusmn 191 1406 plusmn 72 78 424 plusmn 50 431 plusmn 24 Fat 128 plusmn 29 85 plusmn 18 67 31 plusmn 11 26 plusmn 06 Heart 597 plusmn 108 563 plusmn 55 94 139 plusmn 11 172 plusmn 13 Lung 6179 plusmn 809 4595 plusmn 192 74 1441 plusmn 110 1407 plusmn 6 Muscle 123 plusmn 25 142 plusmn 12 115 30 plusmn 11 44 plusmn 03 Skin 144 plusmn 62 74 plusmn 15 51 36 plusmn 20 22 plusmn 03 Brain 1164 plusmn 189 951 plusmn 41 82 271 plusmn 19 291 plusmn 21 05 Liver 588 plusmn 149 617 plusmn 60 105 329 plusmn 53 345 plusmn 42 Kidney 587 plusmn 163 479 plusmn 55 82 327 plusmn 51 267 plusmn 29 Fat 57 plusmn 10 46 plusmn 6 81 32 plusmn 02 26 plusmn 04 Heart 178 plusmn 46 187 plusmn 23 105 99 plusmn 10 104 plusmn 08 Lung 2003 plusmn 599 2376 plusmn 129 119 1108 plusmn 156 1324 plusmn 76 Muscle 155 plusmn 63 130 plusmn 12 84 84 plusmn 16 72 plusmn 05 Skin 94 plusmn 11 40 plusmn 9 42 54 plusmn 06 22 plusmn 06 Brain 905 plusmn 100 766 plusmn 49 85 515 plusmn 60 428 plusmn 44 1 Liver 394 plusmn 29 340 plusmn 6 86 407 plusmn 12 328 plusmn 19 Kidney 357 plusmn 44 293 plusmn 39 82 366 plusmn 12 283 plusmn 47 Fat 31 plusmn 1 22 plusmn 5 72 32 plusmn 04 21 plusmn 04 Heart 111 plusmn 13 99 plusmn 6 89 114 plusmn 04 95 plusmn 01 Lung 1197 plusmn 128 1053 plusmn 178 88 1247 plusmn 246 1011 plusmn 128 Muscle 99 plusmn 9 85 plusmn 23 86 102 plusmn 02 81 plusmn 19 Skin 68 plusmn 16 25 plusmn 3 37 69 plusmn 11 25 plusmn 02 Brain 653 plusmn 35 599 plusmn 10 92 674 plusmn 27 578 plusmn 22
38
Table 4-12 Comparison of COM3 excretion in urine with and without HP-β-CyD
[14C]COM3 (a) and its cumulative amount (b) appeared in the urine of rats following iv dosing at 370 microgkg in EtOHPEG 200Glu (control) or HP-β-CyD 40 (mean plusmn SD n=2 control n=3 HP-β-CyD) significantly different from the control at Plt005 and 001 respectively (a)
Time (h) COM3 in urine (ng) funchanged ()
Control HP-β-CyD Control HP-β-CyD 05 123 plusmn 10 4440 plusmn 594 25 plusmn 02 448 plusmn 82 1 240 plusmn 129 762 plusmn 191 34 plusmn 08 13 plusmn 41 15 85 plusmn 19 325 plusmn 150 25 plusmn 08 73 plusmn 28 2 43 plusmn 11 174 plusmn 89 2 plusmn 08 46 plusmn 21
(b)
Time Cumulative amount of COM3 in urine
(h) ng dose
Control HP-β-CyD Control HP-β-CyD 05 123 plusmn 10 4440 plusmn 594 013 plusmn 001 46 plusmn 09 1 363 plusmn 139 5202 plusmn 693 039 plusmn 014 54 plusmn 11 15 449 plusmn 159 5527 plusmn 799 048 plusmn 016 57 plusmn 12 2 491 plusmn 169 5702 plusmn 857 053 plusmn 017 59 plusmn 12
0
1000
2000
3000
4000
5000
6000
7000
05 1 15 2
Time (h)
Am
ou
nt
excre
ted
(n
g)
Figure 4-9 Effect of HP-β-CyD on the renal elimination of COM3
Cumulative amount of [14C]COM3 appeared in urine after iv administration of 370 microgkg either in EtOHPEG 200Glu (white bars) or as a solution in HP-β-CyD (black bars) Data are expressed as mean plusmn SD (n=2 EtOHPEG 200Glu n=3 HP-β-CyD) significantly different from the EtOHPEG 200Glu at Plt001
Discussion
In vitro and in vivo experiments demonstrated a strong influence of the excipient HP-β-CyD on the disposition kinetics of COM3 in rats There was a significant decrease in the plasma protein binding and in plasma and tissue concentrations of COM3 formulated in HP-β-CyD Changes in the systemic circulation were transient (le05 h post-dose) and most distinct shortly after dosing Alterations in tissue
39
concentrations and tissue-blood distribution ratios were tissue dependent and most pronounced for skin The amount of unchanged COM3 eliminated in the urine was significantly increased following drug administration in HP-β-CyD This alteration in the pharmacokinetic behavior of COM3 is most likely due to the elimination of COM3 included in cyclodextrin complexes
It is known (142) that HP-β-CyD forms drugcyclodextrin complexes in biological fluids is unable to cross biological membranes and is rapidly eliminated renally Even though the release of drugs from drugcyclodextrin complexes is expected to be fast (within seconds) (112) drug pharmacokinetics can be modified in the presence of cyclodextrins (143) Given that COM3 is included in complexes in the systemic circulation less COM3 is available for distribution which could have led to the lower protein binding and celltissue partitioning of COM3 formulated in HP-β-CyD compared to the cyclodextrin-free solution of COM3 Lower ρ-values of COM3 in HP-β-CyD support the possible existence of long-lasting complexes in vivo and indicate that unbound plasma concentrations obtained from ultrafiltration (30000 MW cut-off) are probably the sum of free and cyclodextrin-associated drug (MWHP-β-CyD
~1500) Furthermore blood partition parameters altered till 30 min post-dose indicate a slow dissociation of COM3 from complexes After total drug release COM3 formulated in HP-β-CyD seemed to assimilate the pharmacokinetic behavior in blood obtained in the control group (60 min post-dose)
The marked increase of unchanged COM3 in the urine occurred mainly in the first 30 min following drug administration in HP-β-CyD which is consistent with the decreased plasma levels right after dosing in the HP-β-CyD group Similar observations are reported for carbamazepine and dexamethasone where the renal excretion of unchanged drug applied intravenously in HP-β-CyD was increased most likely due to the renal clearance of the formulation vehicle (112) The faster elimination of COM3 associated to HP-β-CyD in contrast to COM3 alone might have attributed to less COM3 available for tissue distribution even after completed drug release from the vehicle being in line with decreased tissue levels and KP values at 60 min post-dose
47 The impact of Cremophor EL on COM4 in rat
In vitro results
In excipient-free incubations COM4 was highly bound to plasma proteins (gt97 bound predominantly to albumin) and penetrated hardly into blood cells (gt95 located in plasma) (Tables 4-13 and 4-14 Figure 4-2) The free fraction in plasma and the partitioning into blood cells of COM4 were enhanced in the presence of CEL HP-β-CyD and Solutol The protein binding decreased in an excipient concentration-dependent manner (Table 4-13 Figure 4-10) At excipient concentrations below 01 the protein binding was not altered At and above excipient concentrations of 01 the free fraction was markedly elevated with a maximal effect at 1 for all three formulations The addition of these excipients to incubations resulted to higher blood-plasma and blood cell-plasma concentration ratios both indicating increased uptake of COM4 into blood cells (Table 4-14) CEL was selected for the in vivo study because of the most pronounced drug-excipient interactions detected in vitro
40
Table 4-13 Effect of excipients on the in vitro protein binding of COM4
Protein binding of [14C]COM4 at 100 ngmL in the presence and absence of excipients in rat plasma using the ultrafiltration technique (pH 74 n=3 mean plusmn SD)
Excipient fu
() ()
Percentage of control value
None 24 plusmn 02 CEL 001 23 plusmn 01 96 01 31 plusmn 01 131 05 111 plusmn 03 464 1 260 plusmn 03 1089 HP-β-CyD 001 26 plusmn 02 109 01 43 plusmn 02 179 05 98 plusmn 01 412 1 141 plusmn 11 592 Solutol 001 23 plusmn 02 97 01 32 plusmn 02 134 05 97 plusmn 02 407 1 152 plusmn 03 638 PEG 200 05 24 plusmn 01 99 TPGS 05 2 plusmn 01 85
Table 4-14 Effect of excipients on the in vitro partition parameters of COM4 in blood
Plasma fraction (FP) and distribution ratios (BPR BCPR ρ) of [14C]COM4 at 100 ngmL in rat blood obtained at equilibrium after incubations with and without excipients at 05 and 1 (pH 75 H 044 37degC nge3 mean plusmn SD)
Excipient FP BPR BCPR ρ
() ()
None 959 plusmn 20 058 plusmn 001 005 plusmn 003 21 plusmn 06 CEL 05 739 plusmn 16 075 plusmn 002 043 plusmn 006 39 + 05 1 656 plusmn 17 085 plusmn 002 067 plusmn 005 26 + 02 HP-β-CyD 05 900 plusmn 13 062 plusmn 001 014 plusmn 002 15 plusmn 02 1 819 plusmn 14 068 plusmn 001 028 plusmn 003 20 plusmn 02 Solutol 05 786 plusmn 15 071 plusmn 001 035 plusmn 003 36 plusmn 03 1 749 plusmn 14 075 plusmn 001 043 plusmn 003 28 plusmn 03
In vivo results
Dosing COM4 in a CEL-containing formulation resulted in a decrease of the protein binding as compared to the control group (Table 4-15 Figure 4-10) This effect was time-dependent and most pronounced at 5 min after drug administration followed by a decline The increased fraction of COM4 unbound in plasma did not affect the drug levels in the systemic circulation resulting in similar pharmacokinetic parameters in both groups (Table 4-15) Identical tissue concentrations were observed independently of the formulation (Table 4-16)
41
In vitro Ex vivo
0
5
10
15
20
25
30
0 05 1
Excipient concentration ()
Fre
e f
racti
on
(
)
Cremophor EL
Hydroxypropyl-β-cyclodextrin
Solutol HS 15
0
5
10
15
20
25
0 025 05 075 1
Time (h)
Fre
e f
racti
on
(
)
Control group
Cremophor EL group
Figure 4-10 Excipient-mediated alterations of COM4 protein binding in plasma
Left Unbound fraction of [14C]COM4 (100 ngmL) incubated with different excipient concentrations in rat plasma (mean plusmn SD n=3) Right Unbound fraction of compound-related radioactivity in plasma after intravenous administration of [14C]COM4 at 400 microgkg formulated in buffer (control group closed symbols) or in CEL (open symbols) Symbols represent mean plusmn SD (n=3)
Table 4-15 Comparative blood and plasma kinetics of COM4 with and without CEL
Compound-related radioactivity concentrations in the systemic circulation (a) and pharmacokinetic parameters (b) after iv administration of [14C]COM4 at 400 microgkg formulated in buffer or in CEL to rats (n=3 mean plusmn SD LOQ=43 ng-eqmL assuming a hematocrit of 046(145) for calculations) significantly different from the control at Plt005 (a)
Formulation Time (h) Concentration (ng-eqmL)
Blood Plasma Unbound in plasma ()
008 1555 plusmn 299 2483 plusmn 382 025 1192 plusmn 119 2073 plusmn 238 05 1377 plusmn 67 2388 plusmn 153
Phosphate buffered saline (control)
1 1248 plusmn 68 2105 plusmn 172
38 + 15
Cremophor EL 17 008 1471 plusmn 115 2426 plusmn 186 169 plusmn 34 025 1316 plusmn 119 2180 plusmn 237 77 plusmn 24 05 1216 plusmn 155 2084 plusmn 237 74 plusmn 27 1 1315 plusmn 337 2210 plusmn 607 74 plusmn 28
(b)
Parameter Unit Control group Cremophor group
Blood Plasma Blood Plasma Body weight kg 0201 0199 Dose microg 81 80 C0 ngmL 1427 2373 1385 2296 V0 Lkg 028 017 029 017 AUC008-1h ngmL-1
h 1211 2068 1186 1998
42
Table 4-16 Comparison of tissue distribution of COM4 with and without CEL
Tissue concentrations and tissue-blood concentration ratios of radioactivity of [14C]COM4 after bolus injection to rats at 400 microgkg formulated either in buffer (control group) or in CEL (n=3 mean plusmn SD)
Time Tissue Drug concentration (ng-eqg) Tissue-blood distribution ratio
Control group Cremophor group Control group Cremophor group
008 h Lung 737 + 78 768 + 17 048 + 004 052 + 003 Muscle 222 + 6 243 + 12 015 + 002 017 + 002 Skin 276 + 63 254 + 46 019 + 008 017 + 002 025 h Lung 654 + 44 710 + 51 055 + 002 054 + 001 Muscle 209 + 5 211 + 6 018 + 002 016 + 002 Skin 363 + 70 395 + 41 030 + 004 030 + 004 05 h Lung 695 + 46 676 + 40 050 + 001 056 + 004 Muscle 202 + 4 204 + 1 015 + 0 017 + 002 Skin 408 + 39 372 + 25 030 + 004 031 + 004 1 h Lung 628 + 19 629 + 78 050 + 001 059 + 013 Muscle 212 + 10 196 + 13 017 + 001 019 + 008 Skin 409 + 24 391 + 45 033 + 001 037 + 009
Discussion
CEL lowered the binding of COM4 to plasma proteins in vitro and the higher free drug fraction was associated with enhanced partitioning into blood cells as compared to the excipient-free incubations Similar increases of unbound drug levels in plasma were observed after bolus injection of COM4 in CEL In contrast to the in vitro findings CEL induced no changes in the in vivo bloodplasma distribution of COM4 and no alterations in the tissue distribution were detected as well
Even though the plasma protein binding of COM4 is influenced by CEL in an analogous manner under in vitro and in vivo conditions a direct translation of the altered protein binding into blood and plasma concentrations is lacking in vivo Different to the in vitro investigations the in vivo situation involves not only distribution but also elimination processes which can initiate shifts in the systemic drug exposure Besides this the effective excipient concentration achieved in vivo in the circulation is usually unknown and can quite differ from concentrations applied in vitro Although excipient concentrations can be theoretically estimated using blood volume dose and application volume values are fairly arbitrary because excipient levels can decline fast in the body due to dilution (144) and degradation (126) within the blood compartment
48 The impact of Solutol HS 15 on COM5 in rat
In vitro results
The distribution of COM5 between whole blood and plasma was slightly concentration-dependent in rat regardless of incubations with or without excipients (Table 4-17) and the equilibrium conditions were rapidly reached for all solutions (lt5 min) except for CEL (equilibrium after 1-h incubation data not shown) The binding of COM5 to plasma proteins was moderate (lt90) with a high binding to albumin and α1-acid glycoprotein (Figure 4-2) and the bound fraction was reduced by the addition of CEL and Solutol Furthermore both excipients caused alterations in the blood-plasma and blood cell-plasma concentration ratios characterized by
43
enhanced drug partitioning into blood cells (Table 4-17 Figure 4-11) The higher cell uptake is consistent with decreased drug binding to plasma proteins in the presence of CEL and Solutol These effects were more prominent for COM5 with Solutol than with CEL Thus Solutol was selected for the in vivo study
Table 4-17 Effect of excipients on blood distribution and protein binding of COM5 in vitro
Partition parameters of [14C]COM5 obtained at equilibrium after incubation with and without excipients (05) in rat blood (pH 75 H 045 nge3 mean plusmn SD)
Excipient COM5 FP BPR BCPR fu ρ
(ngmL) () () None 10 857 plusmn 40 064 plusmn 003 021 plusmn 007 162 plusmn 11 14 plusmn 03 300 768 plusmn 16 072 plusmn 002 037 plusmn 003 119 plusmn 02 31 plusmn 02 Ethanol 10 812 plusmn 01 066 plusmn 005 023 plusmn 011 114 plusmn 04 22 plusmn 07 300 779 plusmn 09 072 plusmn 001 036 plusmn 002 116 plusmn 02 30 plusmn 02
10 660 plusmn 22 083 plusmn 003 063 plusmn 006 227 plusmn 18 28 plusmn 03 CELEtOH 6535 (vv) 300 577 plusmn 12 095 plusmn 002 090 plusmn 004 237 plusmn 04 38 plusmn 02 HP-β-CyD 10 803 plusmn 27 069 plusmn 002 030 plusmn 005 nd nd 300 754 plusmn 18 073 plusmn 002 040 plusmn 004 nd nd Solutol 10 550 plusmn 05 097 plusmn 006 100 plusmn 002 281 plusmn 10 33 plusmn 05 300 487 plusmn 09 113 plusmn 002 129 plusmn 004 277 plusmn 04 43 plusmn 04 PEG 200 10 769 plusmn 23 072 plusmn 002 037 plusmn 005 nd nd 300 736 plusmn 13 075 plusmn 001 044 plusmn 003 nd nd TPGS 10 832 plusmn 13 063 plusmn 005 018 plusmn 012 nd nd 300 785 plusmn 18 070 plusmn 002 033 plusmn 004 nd nd
(a)
00
02
04
06
08
10
12
10 ngmL 300 ngmL
BP
R
(b)
00
02
04
06
08
10
12
14
10 ngmL 300 ngmL
BC
PR
(c)
00
10
20
30
40
50
10 ngmL 300 ngmL
ρ
Figure 4-11 Excipient-mediated alterations of COM5 distribution in blood by CEL and Solutol
Blood-plasma (a) blood cell-plasma (b) and blood cell-unbound in plasma (c) concentration ratios of [14C]COM5 (10-300 ngmL) without excipients (black bars) and in the presence of Cremophor EL (white bars) and Solutol HS 15 (hatched bars) at 05 in rat blood (pH 75 H 045 nge3 mean plusmn SD)
In vivo results
In vitro studies demonstrated that the addition of ethanol to incubations had no impact on the blood partition of COM5 (Table 4-17) Therefore COM5 was dissolved in ethanol 10 for the administration in the control group thereby assuring sufficient solubility of the compound
Within the first 15 min post-dose higher blood concentrations accompanied by similar plasma concentrations were observed for COM5 in Solutol compared to concentrations for COM5 in ethanol 10 (control group) thereby increasing
44
concentration ratios of blood-plasma and blood cell-plasma in the Solutol group (Table 4-18) Subsequently similar ratios were obtained in both groups with a concomitant slower decline of circulation concentrations in animals treated with Solutol These changes in the Solutol group are in line with a reduced rate constant that resulted in a 2-fold higher half-life compared to that in the control group (Table 4-19) At 1 h post-dose concentrations of COM5 in the systemic circulation were 300 higher than those obtained after dosing the compound in the control formulation (Table 4-18 Figure 4-12) The doseAUC ratio was also decreased for COM5 in Solutol (Table 4-19) In agreement with the in vitro findings COM5 formulated in Solutol led to a permanent lower protein binding up to 1 h post-dose in addition to enhanced uptake into blood cells right after dosing (higher blood-plasma concentration ratio) (Table 4-18)
Table 4-18 Comparison of blood and plasma levels of COM5 with and without Solutol
Concentrations of compound-related radioactivity in the systemic circulation (a) and partition parameters (b) derived from these concentrations after iv administration of [14C]COM5 at 1 mgkg formulated in Solutol or in a Solutol-free solution (control group) to rats (n=3 mean plusmn SD LOQ=8 ng-eqmL assuming a hematocrit of 046(145) for calculations) significantly different from the control group at Plt005 and 001 respectively (a)
Time (h) Drug concentration (ng-eqmL)
Control group Solutol group Percentage of control value
Blood 008 1308 plusmn 178 1853 plusmn 155 142 025 895 plusmn 195 1243 plusmn 250 139 05 615 plusmn 193 976 plusmn 115 159 1 194 plusmn 24 585 plusmn 113 301 Plasma 008 2592 plusmn 558 2720 plusmn 266 105 025 1584 plusmn 168 1895 plusmn 337 120 05 1014 plusmn 385 1526 plusmn 112 150 1 311 plusmn 47 900 plusmn 165 289
(b)
Formulation Time (h) fu () FP () BPR BCPR ρ
Control 008 1062 plusmn 93 051 plusmn 004 -006 plusmn 01 -07 plusmn 11 (ethanol 10) 025 975 plusmn 148 056 plusmn 008 005 plusmn 017 19 plusmn 05 05 876 plusmn 125 062 plusmn 009 018 plusmn 019 42 plusmn 22 1
84 plusmn 14
862 plusmn 25 063 plusmn 002 019 plusmn 004 19 plusmn 04 Solutol 17 008 792 plusmn 18 068 plusmn 002 031 plusmn 003 22 plusmn 02 025 825 plusmn 18 065 plusmn 001 025 plusmn 003 19 plusmn 02 05 847 plusmn 51 064 plusmn 004 021 plusmn 008 14 plusmn 05 1
150 plusmn 23
832 plusmn 12 065 plusmn 001 024 plusmn 002 12 plusmn 01
Independent of the formulation brain levels ranged in concentrations corresponding
to the vascular contamination indicating no significant penetration of COM5 into brain (Table 4-20) A later increase in muscle and skin concentrations was detected for COM5 administered in Solutol (Table 4-20) The muscle concentration-time profile showed an analogous pattern to that in the systemic circulation with a longer persistence going along with higher concentrations at later post-dose times in the Solutol group (Table 4-21 Figure 4-12) However similar muscle-plasma concentration ratios between both groups pointed that Solutol did not affect the
45
muscle distribution pattern In contrast the higher skin concentrations of COM5 formulated in Solutol were associated with altered KP values (025 and 1 h post-dose) and same half-life compared to the control group (Tables 4-20 and 4-21)
Table 4-19 Comparative pharmacokinetics of COM5 with and without Solutol
Pharmacokinetic parameters of compound-related radioactivity after intravenous administration of [14C]COM5 in ethanol 10 (control group) or in Solutol 17 to rats (n=3)
Parameter Unit Control group Solutol group
Blood Plasma Blood Plasma Body weight kg 0214 0212 Dose microg 214 212 C0 ngmL 1562 2998 1840 2749 V0 Lkg 064 033 054 036 AUC008-1h ngmL-1
h 578 1011 931 1426 t12 h 033 032 069 069 DoseAUC008-1h mLh 369 211 228 149
Table 4-20 Comparison of tissue distribution of COM5 with and without Solutol
Tissue concentrations and tissue-plasma concentration ratios of radioactivity of [14C]COM5 after bolus injection at 1 mgkg to rats in ethanol 10 (control) or Solutol 17 (n=3 mean plusmn SD)
Time Tissue Concentration (ngg) Tissue-plasma ratio
Control Solutol Percentage of control value Control Solutol
008 h Muscle 400 + 53 476 + 69 119 016 plusmn 002 018 plusmn 004 Skin 248 + 26 240 + 48 97 010 plusmn 003 009 plusmn 003 Brain 27 + 3 40 + 2 150 001 plusmn 0 001 plusmn 0 025 h Muscle 311 + 43 424 + 21 137 020 plusmn 003 023 plusmn 004 Skin 243 + 15 413 + 62 170 015 plusmn 001 022 plusmn 002 Brain 16 + 2 26 + 4 161 001 plusmn 0 001 plusmn 0 05 h Muscle 228 + 25 333 + 15 146 025 plusmn 009 022 plusmn 001 Skin 235 + 33 384 + 11 163 025 plusmn 008 025 plusmn 001 Brain 10 + 2 18 + 3 188 001 plusmn 0 001 plusmn 0 1 h Muscle 57 + 2 174 + 30 307 019 plusmn 003 019 plusmn 0 Skin 152 + 11 246 + 46 162 050 plusmn 011 028 plusmn 004 Brain mdasha 11 + 1 nd 001 plusmn 0 001 plusmn 0 a below LOQ significantly different from the control at Plt005
Table 4-21 Comparison of muscle and skin kinetics of COM5 with and without Solutol
Pharmacokinetic parameters of compound-related radioactivity in tissues after intravenous administration of [14C]COM5 at 1 mgkg formulated in ethanol 10 (control group) or Solutol 17 to rats (n=3)
Parameter Unit Muscle Skin
Control group Solutol group Control group Solutol group AUC008-1h ngmL-1
h 199 298 198 313 C0 ngg 533 548 nd nd t12 h 030 058 104 097
46
Plasma Muscle Skin
100
1000
10000
0 025 05 075 1
Time (h)
Co
ncen
trati
on
(n
g-e
qm
L)
10
100
1000
0 025 05 075 1
Time (h)
Co
ncen
trati
on
(n
g-e
qm
L)
100
1000
0 025 05 075 1
Time (h)
Co
ncen
trati
on
(n
g-e
qm
L)
Figure 4-12 Influence of Solutol on plasma muscle and skin profiles of COM5
Concentration-time courses of compound-related radioactivity in plasma muscle and skin after intravenous administration of [14C]COM5 at 1 mgkg formulated in ethanol 10 (closed symbols black line) and as a solution containing Solutol 17 (open symbols dotted line) Symbols represent single values and lines mean values (n=3)
Discussion
In vitro and in vivo experiments showed that Solutol significantly modulated the disposition profile of COM5 in rats by drug-excipient interactions in blood COM5 formulated in Solutol decreased both the drug distribution into plasma (transient in vivo) and the binding to plasma proteins (prolonged in vivo) Furthermore animals treated with Solutol showed a later concentration increase in the circulation and tissues (muscle skin) (ge025 h post-dose)
Altered drug levels were related to prolonged half-lives in the circulation and muscle The longer blood persistence is consistent with the reduced clearance (doseAUC) which presumes a lower elimination of COM5 in the presence of Solutol In contrast to the muscle concentration-time profile similar to that in the circulation the skin profile exhibited no changes in the half-life potentially due to a lower vascularization in skin compared to that in muscle However the skin-plasma concentration ratio was affected by the Solutol formulation whereas no changes in KP values were observed for muscle This altered pharmacokinetic profile might relate to a lower clearance of COM5 in the presence of Solutol
Previous investigations in mice revealed an interaction between Solutol and a co-administered ketochlorine photosensitizer (C8KC) in plasma (127) Protein binding experiments indicated the formation of either a binary drug-excipient complex or a ternary complex involving drug excipient and plasma components This effect was correlated to similar half-lives of Solutol and C8KC in plasma suggesting the persistence of C8KC in the circulation associated with that of the excipient Likewise half-lives in the same range were also observed for C8KC and the excipient Cremophor EL going along with prolonged C8KC persistence in plasma and tissues in mice (85)
47
5 General discussion and conclusions
In vitro and in vivo experiments were carried out to investigate the potential of five excipients commonly used in formulations to modify the pharmacokinetics of co-administered model compounds at concentrations ranging from sub-therapeutic to pharmacological levels Conducted studies focused mainly on the impact of excipients in the blood compartment since such data have rarely been published up to now especially for intravenously low dosed compounds including highly active drug substances biomarkers PET ligands and microdoses
PEG 200 CEL HP-β-CyD and Solutol were chosen as excipients because of their use in intravenous formulations and their high solubilizing ability related to different molecular structures and solubilization principles by either a direct solvent effect or by formation of micelles or complexes TPGS known in oral formulations completed the set of selected excipients and is an interesting functional excipient in terms of its chemical properties (benzyl ring) and ability to alter metabolism andor transporter activities thereby potentially influencing cellular distribution
Five drug candidates in development at Novartis were selected as model compounds exhibiting different physicochemical and pharmacokinetic properties (Table 5-1) The two PET ligands COM1 (base) and COM2 are lipophilic and poorly water-soluble COM3 is characterized by its predominant location in the cellular fraction in blood whereas COM4 hardly penetrates into blood cells COM2 distributes equally between plasma and whole blood COM5 is a molecule with a high polar surface area and a low volume of distribution similar to that of COM4 Moreover COM2 COM1 and COM4 are very highly protein bound (gt95) and COM3 and COM5 are moderately protein bound (lt90) In addition binding studies using isolated plasma proteins showed that model compounds bind with different affinity to the three major drug-binding proteins in plasma (albumin α1-acid glycoprotein and lipoproteins)
Model compounds were used in low doses to achieve blood concentrations of lt5 ngmL for COM1 and COM2 and low-therapeutic levels for COM3 (5-50 ngmL) Due to the very low volume of distribution COM4 and COM5 were investigated at normal pharmacological concentrations (gt50 ngmL in blood) to guarantee detectable tissue levels
In order to analyze the in vitro-in vivo correlation the excipient was set at an excipient-blood ratio of 1200 This concentration was found to be non-hemolytic in vitro for selected excipients except TPGS which induced hemolysis after a longer contact time To rule out any changes caused by cell lysis TPGS investigations were carried out in the non-hemolytic range The excipient concentration of 05 also correlates to the normal dosing range estimated for an intravenous bolus injection in mice and rats assuming a blood volume of ~70 mLkg and an injection volume of lt3 mLkg However in humans according to the literature (54) excipient concentrations above 01 in blood are regarded as high and generally only obtained following intravenous infusions Considering marketed injectable formulations for example the amount of excipient in blood is up to 015 HP-β-CyD (Sporanox) and 03-05 CEL (Vumon and Taxol respectively)
48
Table 5-1 Overview of model compounds
Physicochemical (PC) and pharmacokinetic (PK) properties of model compounds selected for investigating drug-excipient interactions in blood
Compound COM1 COM2 COM3 COM4 COM5 PET ligand PET ligand NCE NCE NCE
Chemical structure
N
N
O
R1
R2
O
N
O
N
N
S
R1
R2
N
O
N
R
NN
R2
R1
N
NO
S O
NH
O
O
NH
OR1
R2
R3
PC properties MW (gmol) 240 410 295 lt400 533 LogD 68 34 45 23 17 37 pKa 38 57 41 87 32 46 106 H20 solubility pH 68 (mgL) 20 lt25 4000 lt500 100 PSA (Aring2) 35 50 25 63 166 H-bond acceptors 3 5 3 4 12 H-bond donors 0 0 0 1 3 Critical value(s) Solubility (base) Solubility MW PSA H-bond acc PK parameters Species Rat Mouse Rat Rat Rat In vitro Fraction in plasma () 75 45 20 ~100 80 Free in plasma () 21 18 12 24 11 Major binding protein Albumin gt AGP Albumin gt LP AGP gt Albumin Albumin gt AGP Albumin asymp AGP In vivo Matrix Plasma Blood Blood Plasma Plasma t12 (h) 008 11 11 10 04 CL (mLminkg) 202 10 142 04 72 Vss (Lkg) 11 14 10 03 03 funchanged () 14 49 14 98 94 AGP α1-acid glycoprotein CL Drug clearance funchanged Fraction of unchanged drug based on AUC ratio of parent drug and total radioactivity LogD Logarithm of octanol-water distribution coefficient LP Lipoproteins MW Molecular weight NCE New chemical entity pKa Negative logarithm of dissociation constant PSA Polar surface area t12 Main elimination half-life Vss Volume of distribution under steady-state conditions
49
In trying to evaluate the potential of excipients to affect partition parameters in blood selected excipients were screened in vitro for interactions with the model compounds using a blood distribution method and protein binding assays (ultrafiltrationultracentrifugation) The most interacting excipients were subsequently taken forward for in vivo studies in animals given a single iv dose to ascertain whether there was a change in pharmacokinetics and whether an in vitro-in vivo correlation existed
Amongst the excipients tested the excipient PEG 200 was not active as an interacting agent whereas the others were more or less active (Table 5-2) However there was no apparent relationship between the nature of interactions and the compound properties
TPGS was found in vitro to enhance the plasma fraction of COM1 and COM2 in blood and higher plasma concentrations were associated with a decrease of compound unbound in plasma A significant increase in plasma concentrations of parent drug (2-fold) and metabolites (4-fold) were observed following intravenous administration of COM2 in mice and t12 of COM2 remained unchanged whereas t12 of metabolites was 4-fold higher While TPGS led to similar trends of COM1-related metabolites after injection in rats values determined for parent drug were inconsistent with those obtained in vitro A very extensive metabolism coupled to fast elimination was detected for COM1 which led to a stop in additional investigations to understand the in vitro-in vivo discrepancy
The use of CEL and Solutol in rats reduced in vitro the binding of COM4 and COM5 to plasma proteins and the higher free drug fraction was accompanied by enhanced partitioning into blood cells Both excipients led to 2-fold higher unbound plasma concentrations following iv administration of COM4 formulated in CEL and COM5 in a Solutol-containing solution Systemic and tissue levels of COM4 remained unaffected In contrast dosing COM5 in Solutol resulted in an earlier increase of blood-plasma concentration ratios indicating enhanced uptake into blood cells Later on COM5 concentrations in blood and plasma were significantly enhanced to a similar extent (2-fold) yielding ratios equalized to control values The systemic accumulation was correlated to higher t12 (2-fold) The AUC of COM5 in muscle and skin increased going along with a raise of t12 in muscle and none in skin
In vitro HP-β-CyD increased the amount of COM3 distributed into rat plasma and lowered the binding to plasma proteins Concentration ratios were only about 12 for blood-plasma and 18 for blood cell-unbound in plasma as compared to reference values At earlier time points after iv dosing concentrations of COM3 in blood and plasma were lower in the presence of HP-β-CyD (~23 of control) whereas over 30-fold higher levels of COM3 in urine were found Subsequently tissue concentrations and tissue-blood concentration ratios of COM3 with HP-β-CyD were significantly decreased
50
Table 5-2 Qualitative impact of excipients on pharmacokinetic parameters
Excipient-compound interactions obtained after in vitro incubations and after intravenous administration in animals using excipients at ~05 in blood and compounds at a dose of either ~1 nmolkg (COM1 COM2) or ~1 micromolkg (COM3 COM4 COM5) Arrows indicate excipient-induced changes compared to the excipient-free group (harr no changes uarr increase darr decrease) Compound Excipient Species Changes Comments
In vitro In vivo COM1 Vit E TPGS Rat uarr Accumulation in plasma darr Plasma protein binding bull No changes in vitro at le05 TPGS darr Partitioning into blood cells darr AUC008-05h bull Similar AUCs of drug free in plasma uarr Plasma protein binding darr C0 bull Increase in AUC of metabolites
harr t12 bull Inappropriate model compound due harr Tissue distribution to rapid metabolismelimination COM2 Vit E TPGS Mice uarr Accumulation in plasma uarr AUC008-1h bull uarr AUC and uarr t12 of metabolites darr Partitioning into blood cells uarr C0 bull Ex vivo protein binding not available
uarr Plasma protein binding harr t12 due to values ltLOQ harr Tissue distribution
COM3 HP-β-cyclodextrin Rat uarr Accumulation in plasma darr Plasma protein binding
darr Partitioning into blood cells darr AUC008-1h
darr Plasma protein binding darr C0
harr t12
darr Skin concentrations
uarr Urinary excretion
COM4 Cremophor EL Rat darr Accumulation in plasma darr Plasma protein binding uarr Partitioning into blood cells harr AUC008-1h
darr Plasma protein binding harr C0
harr t12
harr Tissue distribution
COM5 Solutol HS 15 Rat darr Accumulation in plasma darr Plasma protein binding
uarr Partitioning into blood cells uarr AUC008-1h
darr Plasma protein binding harr C0
uarr t12
uarr Muscleskin concentrations
AUC Area under the plasma drug concentration-time curve C0 Initial plasma concentration at time zero LOQ Limit of quantification t12 Half-life in plasma using the last three data points
51
These results clearly show the role of excipients as a modulator of the protein binding and cellular partitioning of compounds in blood which can impact the overall drug disposition Excipient-induced changes in the free fraction and cell uptake of drugs within the blood compartment are explained by various mechanisms (Figure 5-1) An excipient is able to influence the fraction of a co-administered drug in plasma and blood cells by direct drug interactions andor interferences with blood components such as proteins and cell constituents particularly membranes Consequently bound and free concentrations in plasma and cellular concentrations may be shifted potentially contributing to a ldquonewrdquo steady state Altered plasma concentrations can be the result of changes in drug protein binding drug adsorption to excipients andor drug trapping into excipient micelles or complexes Whichever effect dominates more drug can be free or bound thereby accounting for the amount of drug available for cellular partitioning Excipients could also vary the uptake into blood cells due to alterations in membrane structure andor drug presentation both mechanisms either facilitating or hindering drug transport via membranes In the end most likely different interacting processes contribute to the final effect depending on the force and nature of each single interaction
Free drug Free drug
Bound drug
Protein-bound drug
Excipient-drug interactions
(solubilization adsorption incorporation)
(destruction adsorption integration penetration)
PLASMA BLOOD CELLS
Excipient-membrane interactionsExcipient-protein interactions
(destruction adsorption binding)
Figure 5-1 Mechanisms underlying alterations in drug partition parameters in blood
The presence of excipients in blood may influence drug levels in plasma (protein-bound and free fraction) and blood cells by interacting with the drug or blood components thereby either blocking or promoting the protein binding andor the drug available for cellular partitioning
Analyzing the in vitro with the in vivo situation the effect of selected excipients on
the protein binding showed a good in vitro-in vivo correlation whereas systemic concentrations after iv administration in animals could often not be predicted well from in vitro data In contrast to in vitro assays reflecting stationary conditions the in vivo situation entails processes running in an open and dynamic system thereby involving not only distribution but also elimination This can initiate shifts in the systemic drug exposure and be responsible for the absence of a direct correlation to bloodplasma concentrations and thus to pharmacokinetic parameters as well Apart from this the effective excipient concentration achieved in vivo in the circulation is usually unknown and may differ from concentrations applied in vitro Although excipient concentrations can be theoretically estimated using blood volume dose and application volume values are fairly arbitrary because excipient levels decline most likely fast in the body due to dilution and degradation within the blood
52
compartment This suggests that if alterations in blood partitioning occur following administration in vivo they should be best detectable at times shortly post-dose
Even though differences between the in vitro and in vivo results were found the in vitro test can serve as a straightforward tool for rapid detection of excipient-drug interactions in blood while requiring little amounts of drug As a result the determination of in vitro blood partition parameters is proposed as a rough estimator of a possible potential of excipients to contribute to pharmacokinetics of parenteral drugs In addition to the blood-to-plasma distribution ratio the protein binding provides useful information to elucidate excipient-induced alterations and allows the calculation of the blood cell-to-free in plasma distribution ratio These data help not only to optimize the proper evaluation of pharmacokinetics in animals but also to enable a more rational approach in the development of formulations for drug candidates Therefore the in vitro investigation of blood distribution and protein binding with and without excipient is recommended at a very early preclinical stage in cases where animal pharmacokinetics of lower dosed compounds (eg PET ligands) must be examined from excipient-containing solutions (eg surfactants complexing agents) The influence assessment of excipients may also be a promising formulation approach for iv solutions of non-ionizable lipophilic and nonpolar molecules which are very challenging to formulate appropriately due to poor water solubility (eg paclitaxel docetaxel cyclosporin)
Figure 5-2 illustrates a possible formulation procedure that integrates data generated by in vitro investigations in blood Cosolvents complexing agents surfactants and combinations of these excipients are frequently used to dissolve a compound for intravenous administration in animals Method(s) are chosen considering available compound characteristics such as physicochemical and pharmacokinetic properties doses and clinical objectives If an appropriate formulation in terms of solubility and stability is found blood distribution and protein binding studies are performed both in the presence and absence (reference) of excipient(s) using in vitro assays Protein binding studies should mainly be considered if the extent of binding can be appropriately determined by ultrafiltration dialysis or ultracentrifugation all three conventional and simple methods Next partition parameters (FP fu BPR BCPR and ρ) are evaluated and compared to those obtained for the reference formulation representing an excipient-free solution (eg glucose 5 or saline including pH adjustment buffer blank plasma) Formulations are ranked in order of changes relative to the reference As a result a formulation can be modified adapted or selected for intravenous administration in animals In cases where the in vivo administration requires the addition of excipient(s) to the reference formulation to solubilize the compound the formulation must be tested in vitro The formulation is an acceptable in vivo reference if the in vitro parameters are similar to those of the excipient-free solution ie the in vitro reference The outcome of the in vivo study triggers formulation optimization to minimize or abolish excipient effects further investigation to better interpret data or formulation acceptance for in vivo dosing and formulation development Finally it should be possible to exclude or at least be aware of a potential impact of excipient(s) on the drug disposition Data can also be applied to identify both the activity of a certain excipient with different compounds and the excipient sensitivity of compounds with similar properties
53
Compound characteristics
Formulation principle Excipients
Formulation properties
In vitro assays using blood plasma
Data analysis
Adapt formulation In vivo application
Assess in vitro-in vivo correlation
Candidate-tailored formulation
Figure 5-2 Suggested flow chart for an iv formulation development strategy
In conclusion substantial drug-excipient interactions in animals have been
identified for different excipients commonly used in drug formulation and pharmacologically active compounds with diverse properties These findings support the assumption that certain excipients are not ldquoinertrdquo but are ldquofunctionalrdquo excipients and are able to alter the disposition of co-administered drugs Such data need special attention since excipient-related changes may occur with similar or other drugexcipient formulations Identifying excipient-drug interactions and understanding how excipients affect the drug behavior will assist in the pharmacokinetic characterization and the formulation developmentoptimization of drug candidates in development Furthermore a better knowledge of the relationship between drug excipient and blood constituents suggests new approaches in drug development in terms of controlling the pharmacokinetic profile by the right choice of excipient and its amount This may enable to better anticipate the target of different blood and body compartments without extensive animal and human tests potentially resulting in modulated pharmacological responses
54
6 Outlook
The results of this work demonstrated the ability of commonly used injectable excipients especially CEL HP-β-CyD and SHS to influence pharmacokinetic parameters in blood consequently contributing to altered drug disposition following iv dosing However to increase the knowledge of drug-excipient interactions additional studies are required to confirm the above findings with further drugexcipient formulations and with an emphasis on the role of excipients per se in pharmacokinetics of parenteral drugs
The excipients were tested in vitro and in vivo at a fixed concentration of 05 in
blood being within the normal range for animal injections and higher for clinical ones Investigations by varying the excipient amount would give insight into the concentration-effect relationship and potency of excipients Examination of lower excipient levels should also give an indication about the relevance and impact of excipient-induced alterations on applications in humans
No direct correlation between the interacting excipient and the compound
properties were found and no trends could be apparently observed in changes regarding the excipient characteristics Continued investigations are necessary to elucidate whether observed phenomena are associated with certain drugs or more by some drug classes characterized by specific physicochemical properties Focusing on excipients it would be of interest to explore more in detail the frequency and significance of interactions and the excipient preference in terms of particular changes
The emphasis throughout the current work was placed on providing an insight into
excipient-triggered effects and their in vitro-in vivo correlation According to the literature little is known about mechanisms underlying these alterations taking into account in vitro-in vivo investigations (94110112) To explain findings and improve excipient characterization further investigations should focus on the mechanistic basis for the role of excipients in protein binding bloodplasma partitioning and cellular distribution using in vitro assays appropriate to understand the observed effects In addition modification of in vitro approaches could facilitate correlation of effects and mechanisms determined in vitro with in vivo situations increase the understanding of in vitro-in vivo relationships and enable extrapolation of in vitro results to in vivo pharmacokinetics A better in vitro-in vivo correlation could also reduce in vivo studies and may contribute to more efficient drug development
There are drug-drug interactions reported in the literature where drugs were
administered intravenously in conjunction with excipient-containing formulation of other drugs (eg valspodar formulated in CEL) (108109) Most likely the presence of excipient(s) in drug formulations contributed to observed pharmacokinetic interactions
55
The research into the potential of excipients to induce kinetic alterations of agents administered intravenously in conjunction with excipient-containing formulation of other compounds should lead to a deeper insight into drug-drug interactions These data may provide helpful information relevant for safety issues dosage planning and treatment optimization in clinical drug monitoring
Further studies could focus on the potential clinical significance of drug-excipient
interactions observed in animals Finally ongoing efforts for a proper understanding of excipients as biologically and
pharmacologically active compounds will allow a better control of designing formulations with optimal characteristics for a better drug therapy
56
7 References
References to external publications and books
(1) Values received from Charles River Laboratoires (2) In E Green (ed) The biology of the laboratory mouse McGraw-Hill Inc New York 1966 (3) In H Baker J Lindsey and S Weisbroth (eds) The laboratory rat Academic Press Inc
New York 1979 (4) H E Weimer D M Roberts P Villanuevo and H G Porter Genetic differences in
electrophoretic patterns during the phlogistic response in the albino rat Comp Biochem Physiol B 43965-973 (1972)
(5) Geigy Scientific Tables 8th ed Vol2 Ciba-Geigy Basel 1983 (6) M Lemaire Drug binding to leucocytes and platelets Symposia Medica Hoechst 79-93
(1986) (7) P H Hinderling Red blood cells a neglected compartment in pharmacokinetics and
pharmacodynamics Pharmacol Rev 49279-295 (1997) (8) J Tillement G Houin R Zini S Urien E Albengres J Barre M Lecomte P DAthis and
B Sebille The binding of drugs to blood plasma macromolecules recent advances and therapeutic significance Adv Drug Res 1359-94 (1984)
(9) Z H Israili and P G Dayton Human alpha-1-glycoprotein and its interactions with drugs Drug Metab Rev 33161-235 (2001)
(10) K M Wasan and S M Cassidy Role of plasma lipoproteins in modifying the biological activity of hydrophobic drugs J Pharm Sci 87411-424 (1998)
(11) P du Souich J Verges and S Erill Plasma protein binding and pharmacological response Clin Pharmacokinet 24435-440 (1993)
(12) F Akhlaghi and A K Trull Distribution of cyclosporin in organ transplant recipients Clin Pharmacokinet 41615-637 (2002)
(13) G M Pacifici and A Viani Methods of determining plasma and tissue binding of drugs Pharmacokinetic consequences Clin Pharmacokinet 23449-468 (1992)
(14) J Oravcova B Bohs and W Lindner Drug-protein binding sites New trends in analytical and experimental methodology J Chromatogr B Biomed Appl 6771-28 (1996)
(15) Z Liu F Li and Y Huang Determination of unbound drug concentration and protein-drug binding fraction in plasma Biomed Chromatogr 13262-266 (1999)
(16) A Lipinski Experimental and computational approaches to estimate solubility and permeability in drug discovery and development settings Adv Drug Deliv Rev 233-26 (1997)
(17) R Panchagnula N S Thomas Biopharmaceutics and pharmacokinetics in drug research Int J Pharm 201131-150 (2000)
(18) M S Lajiness M Vieth and J Erickson Molecular properties that influence oral drug-like behavior 16 Curr Opin Drug Discov Devel 7470-477 (2004)
(19) H van de Waterbeemd G Camenisch G Folkers J R Chretien and O A Raevsky Estimation of blood-brain barrier crossing of drugs using molecular size and shape and H-bonding descriptors J Drug Target 6151-165 (1998)
(20) B Testa P Crivori M Reist P Carrupt The influence of lipophilicity on the pharmacokinetic behavior of drugs concepts and examples Persp Drug Discov Design 19179-211 (2000)
(21) In V Pliska B Testa H van Waterbeemd (eds) Methods and Principles in Medicinal Chemistry Vol4 VCH Weinheim Germany 1996
(22) G L Amidon H Lennernas V P Shah and J R Crison A theoretical basis for a biopharmaceutic drug classification the correlation of in vitro drug product dissolution and in vivo bioavailability Pharm Res 12413-420 (1995)
(23) C A Lipinski Poor aqueous solubility - an industry-wide problem in ADME screening Capsugel Symposium Tokyo Japan 33-48 (2003)
(24) C A Lipinski Drug-like properties and the causes of poor solubility and poor permeability J Pharmacol Toxicol Methods 44235-249 (2000)
57
(25) K R Horspool and C A Lipinski Advancing new drug delivery concepts to gain the lead Drug Deliv Technol 334-46 (2003)
(26) M Kaushal Amorphous drug delivery systems molecular aspects design and performance Crit Rev Ther Drug Carrier Sys 21133-193 (2004)
(27) H Fischer Blood-brain barrier permeation molecular parameters governing passive diffusion J Membrane Biol 165201-211 (1998)
(28) A Seelig A general pattern for substrate recognition by P-glycoprotein Eur J Biochem 251252-261 (1998)
(29) A Seelig X L Blatter and F Wohnsland Substrate recognition by P-glycoprotein and the multidrug resistance-associated protein MRP1 a comparison Int J Clin Pharmacol Ther 38111-121 (2000)
(30) D E Clark Rapid calculation of polar molecular surface area and its application to the prediction of transport phenomena 2 Prediction of blood-brain barrier penetration J Pharm Sci 88815-821 (1999)
(31) J Kelder Polar molecular surface as a dominating determinant for oral absorption and brain penetration of drugs Pharm Res 161514-1519 (1999)
(32) K Palm K Luthman A L Ungell G Strandlund and P Artursson Correlation of drug absorption with molecular surface properties J Pharm Sci 8532-39 (1996)
(33) K Palm P Stenberg K Luthman and P Artursson Polar molecular surface properties predict the intestinal absorption of drugs in humans Pharm Res 14568-571 (1997)
(34) D E Clark Rapid calculation of polar molecular surface area and its application to the prediction of transport phenomena 1 Prediction of intestinal absorption J Pharm Sci 88807-814 (1999)
(35) H van der Waterbeemd G Camenisch G Folkers and O A Raevsky Estimation of Caco-2 cell permeability using calculated molecular descriptors Quant Struct Act Relat 15480-490 (1996)
(36) S Winiwarter N M Bonham F Ax A Hallberg H Lennernas and A Karlen Correlation of human jejunal permeability (in vivo) of drugs with experimentally and theoretically derived parameters A multivariate data analysis approach J Med Chem 414939-4949 (1998)
(37) A Bergstroem Absorption classification of oral drugs based on molecular surface properties J Med Chem 46558-570 (2003)
(38) D F Veber S R Johnson H Y Cheng B R Smith K W Ward and K D Kopple Molecular properties that influence the oral bioavailability of drug candidates J Med Chem 452615-2623 (2002)
(39) J F Pritchard M Jurima-Romet M L Reimer E Mortimer B Rolfe and M N Cayen Making better drugs Decision gates in non-clinical drug development Nat Rev Drug Discov 2542-553 (2003)
(40) P Preziosi Opinion science pharmacoeconomics and ethics in drug RampD a sustainable future scenario Nature Rev Drug Discov 3521-526 (2004)
(41) I Kola Opinion Can the pharmaceutical industry reduce attrition rates Nature Rev Drug Discov 3711-716 (2004)
(42) L J Lesko M Rowland C C Peck T F Blaschke D Breimer H J de Jong A Grahnen J J Kuhlmann and B Stewart Optimizing the science of drug development opportunities for better candidate selection and accelerated evaluation in humans Eur J Pharm Sci 10iv-xiv (2000)
(43) G Lappin and R C Garner Big physics small doses the use of AMS and PET in human microdosing of development drugs Nat Rev Drug Discov 2233-240 (2003)
(44) R D Combes T Berridge J Connelly M D Eve R C Garner S Toon and P Wilcox Early microdose drug studies in human volunteers can minimise animal testing proceedings of a workshop organised by volunteers in research and testing Eur J Pharm Sci 191-11 (2003)
(45) Biomarkers definitions working group Biomarkers and surrogate endpoints preferred definitions and conceptual framework Clin Pharmacol Ther 6989-95 (2001)
(46) J Lesko Use of biomarkers and surrogate endpoints in drug development and regulatory decision making criteria validation strategies Annu Rev Pharmacol Toxicol 41347-366 (2001)
58
(47) R Frank and R Hargreaves Clinical biomarkers in drug discovery and development Nat Rev Drug Discov 2566-580 (2003)
(48) M Bergstrom A Grahnen and B Langstrom Positron emission tomography microdosing a new concept with application in tracer and early clinical drug development Eur J Clin Pharmacol 59357-366 (2003)
(49) M Jagoda Experiment assessment of mass effects in the rat implications for small animal PET imaging Nucl Med Biol 31771-779 (2004)
(50) Y C Lee P D Zocharski and B Samas An intravenous formulation decision tree for discovery compound formulation development Int J Pharm 253111-119 (2003)
(51) B Bittner and R J Mountfield Intravenous administration of poorly soluble new drug entities in early drug discovery the potential impact of formulation on pharmacokinetic parameters Curr Opin Drug Discov Devel 559-71 (2002)
(52) A K Singla A Garg and D Aggarwal Paclitaxel and its formulations Int J Pharm 235179-192 (2002)
(53) N Maurer D B Fenske and P R Cullis Developments in liposomal drug delivery systems Expert Opin Biol Ther 1923-947 (2001)
(54) R G Strickley Solubilizing excipients in oral and injectable formulations Pharm Res 21201-230 (2004)
(55) A G Floyd Top ten considerations in the development of parenteral emulsions 4134-143 (1999)
(56) M J Lawrence and G D Rees Microemulsion-based media as novel drug delivery systems Adv Drug Deliv Rev 4589-121 (2000)
(57) E Merisko-Liversidge G G Liversidge and E R Cooper Nanosizing a formulation approach for poorly-water-soluble compounds Eur J Pharm Sci 18113-120 (2003)
(58) E B Rabinow Nanosuspensions in drug delivery Nature Rev Drug Discov 3785-796 (2004)
(59) H Karl A good practice guide to the administration of substances and removal of blood including routes and volumes J Appl Toxicol 2115-23 (2001)
(60) D M Woodcock S Jefferson M E Linsenmeyer P J Crowther G M Chojnowski B Williams and I Bertoncello Reversal of the multidrug resistance phenotype with Cremophor EL a common vehicle for water-insoluble vitamins and drugs Cancer Res 504199-4203 (1990)
(61) D M Woodcock M E Linsenmeyer G Chojnowski A B Kriegler V Nink L K Webster and W H Sawyer Reversal of multidrug resistance by surfactants Br J Cancer 6662-68 (1992)
(62) J M Dintaman and J A Silverman Inhibition of P-glycoprotein by D-alpha-tocopheryl polyethylene glycol 1000 succinate (TPGS) Pharm Res 161550-1556 (1999)
(63) K R W A S C Wandel C Inactive ingredients may alter bioavailability of drugs through effects on P-glycoprotein (PGP) and CYP3A Clin Pharmacol Ther 69P71 (2001)
(64) A N Abulrob M Mason R Bryce and M Gumbleton The effect of fatty acids and analogues upon intracellular levels of doxorubicin in cells displaying P-glycoprotein mediated multidrug resistance J Drug Target 8247-256 (2000)
(65) G Cornaire J F Woodley S Saivin J Y Legendre S Decourt A Cloarec and G Houin Effect of polyoxyl 35 castor oil and polysorbate 80 on the intestinal absorption of digoxin in vitro Arzneimittelforschung 50576-579 (2000)
(66) E D Hugger B L Novak P S Burton K L Audus and R T Borchardt A comparison of commonly used polyethoxylated pharmaceutical excipients on their ability to inhibit P-glycoprotein activity in vitro J Pharm Sci 911991-2002 (2002)
(67) J Zastre J Jackson M Bajwa R Liggins F Iqbal and H Burt Enhanced cellular accumulation of a P-glycoprotein substrate rhodamine-123 by Caco-2 cells using low molecular weight methoxypolyethylene glycol-block-polycaprolactone diblock copolymers Eur J Pharm Biopharm 54299-309 (2002)
(68) A V Kabanov E V Batrakova and D W Miller Pluronic block copolymers as modulators of drug efflux transporter activity in the blood-brain barrier Adv Drug Deliv Rev 55151-164 (2003)
59
(69) D W Miller E V Batrakova and A V Kabanov Inhibition of multidrug resistance-associated protein (MRP) functional activity with pluronic block copolymers Pharm Res 16396-401 (1999)
(70) K Yunomae H Arima F Hirayama and K Uekama Involvement of cholesterol in the inhibitory effect of dimethyl-beta-cyclodextrin on P-glycoprotein and MRP2 function in Caco-2 cells FEBS Lett 536225-231 (2003)
(71) M M Nerurkar P S Burton and R T Borchardt The use of surfactants to enhance the permeability of peptides through Caco-2 cells by inhibition of an apically polarized efflux system Pharm Res 13528-534 (1996)
(72) R J Mountfield S Senepin M Schleimer I Walter and B Bittner Potential inhibitory effects of formulation ingredients on intestinal cytochrome P450 Int J Pharm 21189-92 (2000)
(73) B M Johnson W N Charman and C J Porter An in vitro examination of the impact of polyethylene glycol 400 Pluronic P85 and vitamin E d-alpha-tocopheryl polyethylene glycol 1000 succinate on P-glycoprotein efflux and enterocyte-based metabolism in excised rat intestine AAPS PharmSci 4E40 (2002)
(74) R C Bravo Gonzalez J Huwyler F Boess I Walter and B Bittner In vitro investigation on the impact of the surface-active excipients Cremophor EL Tween 80 and Solutol HS 15 on the metabolism of midazolam Biopharm Drug Dispos 2537-49 (2004)
(75) A G Bagnarello L A Lewis M C McHenry A J Weinstein H K Naito A J McCullough R J Lederman and T L Gavan Unusual serum lipoprotein abnormality induced by the vehicle of miconazole N Engl J Med 296497-499 (1977)
(76) H K Naito and L A Lewis Induced hyperlipidemia and delipidation of serum alpha-lipoproteins by polyethoxylated castor oil Protides Biol Fluids 25COM2-398 (1978)
(77) H K Naito M C McHenry and L A Lewis Drug-induced dyslipoproteinemia a report of two cases Clin Chem 26163-168 (1980)
(78) M Hacker M Koeferl C B Hong and M A Fagan Cremophor and Emulphor induced alterations of serum lipids and lipoprotein electrophoretic patterns of dogs Res Commun Chem Pathol Pharmacol 31119-128 (1981)
(79) M Kongshaug L S Cheng J Moan and C Rimington Interaction of Cremophor EL with human plasma Int J Biochem 23473-478 (1991)
(80) K Woodburn and D Kessel The alteration of plasma lipoproteins by Cremophor EL J Photochem Photobiol B 22197-201 (1994)
(81) D Kessel K Woodburn D Decker and E Sykes Fractionation of Cremophor EL delineates components responsible for plasma lipoprotein alterations and multidrug resistance reversal Oncol Res 7207-212 (1995)
(82) E Sykes K Woodburn D Decker and D Kessel Effects of Cremophor EL on distribution of Taxol to serum lipoproteins Br J Cancer 70401-404 (1994)
(83) G M Garbo The use of liposomes emulsions or inclusion complexes may potentiate in vivo effects of SnET2 Proc SPIE 1203118-125 (1990)
(84) D Kessel A Morgan and G M Garbo Sites and efficacy of photodamage by tin etiopurpurin in vitro using different delivery systems Photochem Photobiol 54193-196 (1991)
(85) K Woodburn C K Chang S Lee B Henderson and D Kessel Biodistribution and PDT efficacy of a ketochlorin photosensitizer as a function of the delivery vehicle Photochem Photobiol 60154-159 (1994)
(86) L K Webster E J Cosson K H Stokes and M J Millward Effect of the paclitaxel vehicle Cremophor EL on the pharmacokinetics of doxorubicin and doxorubicinol in mice Br J Cancer 73522-524 (1996)
(87) T Colombo P O Gonzalez M Zucchetti A Maneo C Sessa A Goldhirsch M DIncalci and M Maneo Paclitaxel induces significant changes in epidoxorubicin distribution in mice Ann Oncol 7801-805 (1996)
(88) T Colombo I Parisi M Zucchetti C Sessa A Goldhirsch and M DIncalci Pharmacokinetic interactions of paclitaxel docetaxel and their vehicles with doxorubicin Ann Oncol 10391-395 (1999)
(89) M J Millward L K Webster D Rischin K H Stokes G C Toner J F Bishop I N Olver B M Linahan M E Linsenmeyer and D M Woodcock Phase I trial of cremophor EL with bolus doxorubicin Clin Cancer Res 42321-2329 (1998)
60
(90) J Liu E H Kraut S Balcerzak M Grever S DAmbrosio and K K Chan Dosing sequence-dependent pharmacokinetic interaction of oxaliplatin with paclitaxel in the rat Cancer Chemother Pharmacol 50445-453 (2002)
(91) A Sparreboom O van Tellingen W J Nooijen and J H Beijnen Nonlinear pharmacokinetics of paclitaxel in mice results from the pharmaceutical vehicle Cremophor EL Cancer Res 562112-2115 (1996)
(92) A G Ellis and L K Webster Inhibition of paclitaxel elimination in the isolated perfused rat liver by Cremophor EL Cancer Chemother Pharmacol 4313-18 (1999)
(93) L Gianni L Vigano A Locatelli G Capri A Giani E Tarenzi and G Bonadonna Human pharmacokinetic characterization and in vitro study of the interaction between doxorubicin and paclitaxel in patients with breast cancer J Clin Oncol 151906-1915 (1997)
(94) A Sparreboom L van Zuylen E Brouwer W J Loos P de Bruijn H Gelderblom M Pillay K Nooter G Stoter and J Verweij Cremophor EL-mediated alteration of paclitaxel distribution in human blood clinical pharmacokinetic implications Cancer Res 591454-1457 (1999)
(95) L van Zuylen J Verweij and A Sparreboom Role of formulation vehicles in taxane pharmacology Invest New Drugs 19125-141 (2001)
(96) D Kessel Properties of Cremophor EL micelles probed by fluorescence Photochem Photobiol 56447-451 (1992)
(97) W J Loos J Szebeni A J ten Tije J Verweij D M van Zomeren K N Chung K Nooter G Stoter and A Sparreboom Preclinical evaluation of alternative pharmaceutical delivery vehicles for paclitaxel Anticancer Drugs 13767-775 (2002)
(98) Dhanikula AB Singh DR and Panchagnula R In vivo pharmacokinetic and tissue distribution studies in mice of alternative formulations for local and systemic delivery of paclitaxel gel film prodrug liposomes and micelles Curr Drug Deliv 235-44 (2005)
(99) Solvent-free paclitaxel formulation better than taxol Scrip (S00825922 20031209) 2003 (100) L Vigano A Locatelli G Grasselli and L Gianni Drug interactions of paclitaxel and
docetaxel and their relevance for the design of combination therapy Invest New Drugs 19179-196 (2001)
(101) R Danesi F Innocenti S Fogli A Gennari E Baldini A Di Paolo B Salvadori G Bocci P F Conte and M Del Tacca Pharmacokinetics and pharmacodynamics of combination chemotherapy with paclitaxel and epirubicin in breast cancer patients Br J Clin Pharmacol 53508-518 (2002)
(102) S Fogli R Danesi A Gennari S Donati P F Conte and M Del Tacca Gemcitabine epirubicin and paclitaxel pharmacokinetic and pharmacodynamic interactions in advanced breast cancer Ann Oncol 13919-927 (2002)
(103) T Kasai M Oka H Soda J Tsurutani M Fukuda Y Nakamura S Kawabata K Nakatomi S Nagashima H Takatani M Fukuda A Kinoshita and S Kohno Phase I and pharmacokinetic study of paclitaxel and irinotecan for patients with advanced non-small cell lung cancer Eur J Cancer 381871-1878 (2002)
(104) B L Lum S Kaubisch A M Yahanda K M Adler L Jew M N Ehsan N A Brophy J Halsey M P Gosland and B I Sikic Alteration of etoposide pharmacokinetics and pharmacodynamics by cyclosporine in a phase I trial to modulate multidrug resistance J Clin Oncol 101635-1642 (1992)
(105) N J Lacayo B L Lum D L Becton H Weinstein Y Ravindranath M N Chang L Bomgaars S J Lauer B I Sikic and G V Dahl Pharmacokinetic interactions of cyclosporine with etoposide and mitoxantrone in children with acute myeloid leukemia Leukemia 16920-927 (2002)
(106) D A Rushing S R Raber K A Rodvold S C Piscitelli G S Plank and D A Tewksbury The effects of cyclosporine on the pharmacokinetics of doxorubicin in patients with small cell lung cancer Cancer 74834-841 (1994)
(107) B L Samuels R Mick N J Vogelzang S F Williams R L Schilsky A R Safa S M OBrien and M J Ratain Modulation of vinblastine resistance with cyclosporine a phase I study Clin Pharmacol Ther 54421-429 (1993)
61
(108) D J Boote I F Dennis P R Twentyman R J Osborne C Laburte S Hensel J F Smyth M H Brampton and N M Bleehen Phase I study of etoposide with SDZ PSC 833 as a modulator of multidrug resistance in patients with cancer J Clin Oncol 14610-618 (1996)
(109) H Minami T Ohtsu H Fujii T Igarashi K Itoh N Uchiyama-Kokubu T Aizawa T Watanabe Y Uda Y Tanigawara and Y Sasaki Phase I study of intravenous PSC-833 and doxorubicin reversal of multidrug resistance Jpn J Cancer Res 92220-230 (2001)
(110) M Jin T Shimada K Yokogawa M Nomura Y Mizuhara H Furukawa J Ishizaki and K Miyamoto Cremophor EL releases cyclosporin A adsorbed on blood cells and blood vessels and increases apparent plasma concentration of cyclosporin A Int J Pharm 293137-144 (2005)
(111) M E Davis and M E Brewster Cyclodextrin-based pharmaceutics past present and future Nat Rev Drug Discov 31023-1035 (2004)
(112) V J Stella V M Rao E A Zannou and V Zia V Mechanisms of drug release from cyclodextrin complexes Adv Drug Deliv Rev 363-16 (1999)
(113) H W Frijlink A C Eissens N R Hefting K Poelstra C F Lerk and D K Meijer The effect of parenterally administered cyclodextrins on cholesterol levels in the rat Pharm Res 89-16 (1991)
(114) H W Frijlink E J Franssen A C Eissens R Oosting C F Lerk and D K Meijer The effects of cyclodextrins on the disposition of intravenously injected drugs in the rat Pharm Res 8380-384 (1991)
(115) E E Sideris M A Koupparis and P E Macheras Effect of cyclodextrins on protein binding of drugs the diflunisalhydroxypropyl-beta-cyclodextrin model case Pharm Res 1190-95 (1994)
(116) P Y Grosse F Bressolle P Rouanet and J M Joulia Methyl-beta-cyclodextrin and doxorubicin pharmacokinetics and tissue concentrations following bolus injection of these drugs alone or together in the rabbit Int J Pharm 180215-223 (1999)
(117) T Shinoda S Kagatani A Maeda Y Konno H Hashimoto K Hara K Fujita and T Sonobe Sugar-branched-cyclodextrins as injectable drug carriers in mice Drug Dev Ind Pharm 251185-1192 (1999)
(118) B McCormack and G Gregoriadis Comparative studies of the fate of free and liposome-entrapped hydroxypropyl-beta-cyclodextrindrug complexes after intravenous injection into rats implications in drug delivery Biochim Biophys Acta 1291237-244 (1996)
(119) A Sharma K Anderson and J W Baker Flocculation of serum lipoproteins with cyclodextrins application to assay of hyperlipidemic serum Clin Chem 36529-532 (1990)
(120) A Sharma and L S Janis Lipoprotein-cyclodextrin interaction Clin Chim Acta 199129-137 (1991)
(121) T Irie M Otagiri M Sunada K Uekama Y Ohtani Y Yamada and Y Sugiyama Cyclodextrin-induced hemolysis and shape changes of human erythrocytes in vitro J Pharmacobiodyn 5741-744 (1982)
(122) M E Brewster W R Anderson D Meinsma D Moreno A I Webb L Pablo K S Estes H Derendorf N Bodor R Sawchuk B Cheung and E Pop Intravenous and oral pharmacokinetic evaluation of a 2-hydroxypropyl-beta-cyclodextrin-based formulation of carbamazepine in the dog comparison with commercially available tablets and suspensions J Pharm Sci 86335-339 (1997)
(123) K Dietzel K S Estes M E Brewster N S Bodor and H Derendorf The use of 2-hydroxypropyl-beta-cyclodextrin as a vehicle for intravenous administration of dexamethasone in dogs Int J Pharm 59225-230 (1990)
(124) J Cummings G J Forrest D Cunningham N L Gilchrist and M Soukop Influence of polysorbate 80 (Tween 80) and etoposide (VP-16-213) on the pharmacokinetics and urinary excretion of adriamycin and its metabolites in cancer patients Cancer Chemother Pharmacol 1780-84 (1986)
(125) W J Loos S D Baker J Verweij J G Boonstra and A Sparreboom Clinical pharmacokinetics of unbound docetaxel role of polysorbate 80 and serum proteins Clin Pharmacol Ther 74364-371 (2003)
62
(126) O van Tellingen J H Beijnen J Verweij E J Scherrenburg W J Nooijen and A Sparreboom Rapid esterase-sensitive breakdown of polysorbate 80 and its impact on the plasma pharmacokinetics of docetaxel and metabolites in mice Clin Cancer Res 52918-2924 (1999)
(127) K Woodburn E Sykes and D Kessel Interactions of Solutol HS 15 and Cremophor EL with plasma lipoproteins Int J Biochem Cell Biol 27693-699 (1995)
(128) J M Grindel T Jaworski R M Emanuele and P Culbreth Pharmacokinetics of a novel surface-active agent purified poloxamer 188 in rat rabbit dog and man Biopharm Drug Dispos 2387-103 (2002)
(129) T W Guentert S Oie L Paalzow B M Frey R Brandt L J Aarons and M Rowland Interaction of mixed micelles formed from glycocholic acid and lecithin with the protein binding of various drugs Br J Clin Pharmacol 23569-577 (1987)
(130) P R Cullis A Chonn and S C Semple Interactions of liposomes and lipid-based carrier systems with blood proteins Relation to clearance behaviour in vivo Adv Drug Deliv Rev 323-17 (1998)
(131) P Opanasopit M Nishikawa and M Hashida Factors affecting drug and gene delivery effects of interaction with blood components Crit Rev Ther Drug Carrier Syst 19191-233 (2002)
(132) L Araujo R Lobenberg and J Kreuter Influence of the surfactant concentration on the body distribution of nanoparticles J Drug Target 6373-385 (1999)
(133) S Stolnik B Daudali A Arien J Whetstone C R Heald M C Garnett S S Davis and L Illum The effect of surface coverage and conformation of poly(ethylene oxide) (PEO) chains of poloxamer 407 on the biological fate of model colloidal drug carriers Biochim Biophys acta 1514261-279 (2001)
(134) J F Krzyzaniak D M Raymond and S H Yalkowsky Lysis of human red blood cells 2 Effect of contact time on cosolvent induced hemolysis Int J Pharm 152193-200 (1997)
(135) F Mottu M J Stelling D A Rufenacht and E Doelker Comparative hemolytic activity of undiluted organic water-miscible solvents for intravenous and intra-arterial injection PDA J Pharm Sci Technol 5516-23 (2001)
(136) E Soderlind M Wollbratt and C von Corswant The usefulness of sugar surfactants as solubilizing agents in parenteral formulations Int J Pharm 25261-71 (2003)
(137) B Nuijen M Bouma C Manada J M Jimeno A Bult and J H Beijnen In vitro hemolysis and buffer capacity studies with the novel marine anticancer agent kahalalide F and its reconstitution vehicle Cremophor ELethanol PDA J Pharm Sci Technol 55223-229 (200)
(138) R A Rajewski G Traiger J Bresnahan P Jaberaboansari V J Stella and D O Thompson Preliminary safety evaluation of parenterally administered sulfoalkyl ether beta-cyclodextrin derivatives J Pharm Sci 84927-932 (1995)
(139) T M Florence and J L Stauber Hemolysis of human erythrocytes by alpha-tocopheryl succinate J Nutrit Environ Med 8345-347 (1998)
(140) J Neuzil M Zhao G Ostermann M Sticha N Gellert C Weber J W Eaton and U T Brunk Alpha-tocopheryl succinate an agent with in vivo anti-tumour activity induces apoptosis by causing lysosomal instability Biochem J 362709-715 (2002)
(141) S H Wu and W K Hopkins Characteristics of d-a-tocopheryl PEG 1000 succinate for applications as an absorption enhancer in drug delivery systems Pharm Technol 2352-68 (1999)
(142) H W Frijlink J Visser N R Hefting R Oosting D K Meijer and C F Lerk The pharmacokinetics of beta-cyclodextrin and hydroxypropyl-beta-cyclodextrin in the rat Pharm Res 71248-1252 (1990)
(143) V J Stella and R A Rajewski Cyclodextrins their future in drug formulation and delivery Pharm Res 14556-567 (1997)
(144) In P K Gupta and G A Brazeau (eds) Injectable drug development techniques to reduce pain and irritation Interpharm Press Denver Colorado 1999
(145) B Davies and T Morris Physiological parameters in laboratory animals and humans Pharm Res 101093-1095 (1993)
63
References to internal reports of Novartis Pharma AG
(146) In vitro blood distribution and plasma protein binding of [3H]COM1 including stability in blood and plasma for rat and human PCS(EU) R0400014 Preclinical Safety Novartis Pharma AG Basel Switzerland 14-May-2004
(147) In vitro blood distribution and stability of [3H]COM2 for mouse rat and human PCS(EU) R0201077 Preclinical Safety Novartis Pharma AG Basel Switzerland 07-May-2003
(148) In vitro blood distribution plasma protein binding and stability in blood and plasma of [3H]COM3 for mouse rat dog cynomolgus monkey and human DMPK R0400595 Drug Metabolism and Pharmacokinetics Novartis Pharma AG Basel Switzerland 01-Feb-2005
(149) In vitro blood distribution and plasma protein binding of [14C]COM4 and stability in blood and plasma for rat ferret dog monkey and human PCS(EU) R0201539 Preclinical Safety Novartis Pharma AG Basel Switzerland 24-Sep-2003
(150) In vitro blood distribution plasma protein binding and stability in blood of [14C]COM5 for mouse rat dog and human PCS(EU) R0201107 Preclinical Safety Novartis Pharma AG Basel Switzerland 14-May-2003
(151) Absorption distribution and excretion of [14C]COM5 after single intravenous (1 mLkg) and oral (3 mgkg) administration to rat PCS(EU) R0201108 Preclinical Safety Novartis Pharma AG Basel Switzerland 19-May-2003
(152) ADME in rat after oral (08 mgkg) and intravenous (04 mgkg) administration of [14C]COM4 PCS(EU) R0201540 Preclinical Safety Novartis Pharma AG Basel Switzerland 19-Dec-2003
(153) Blood pharmacokinetics tissue distribution and excretion of [3H]COM2 in OF1 normal male mice and brain penetration of [3H]COM2 in APP23 transgenic and wild-type female mice after single intravenous (4 microgkg) administration PCS(EU) R0201082 Preclinical Safety Novartis Pharma AG Basel Switzerland 08-May-2003
64
8 Appendix
Raw data of COM1 in rat
In vitro blood distribution of [3H]COM1 using blood pools with different hematocrits
Total radioactivity concentration determined in blood and plasma
Excipient Nominal COM1 H Incubation Actual values
in blood time (pg-eqmL mean plusmnSD n=3) in blood (pgmL) (min) Blood Plasma
None 60 048 0 53 plusmn 1 76 plusmn 1 (Glu) 5 53 plusmn 1 75 plusmn 0 10 52 plusmn 1 74 plusmn 1 20 52 plusmn 0 74 plusmn 1 6000 0 5335 plusmn 80 7835 plusmn 121 5 5637 plusmn 116 7784 plusmn 103 10 5576 plusmn 40 7598 plusmn 114 20 5502 plusmn 76 7502 plusmn 98 HP-β-CyD 05 60 048 0 62 plusmn 1 97 plusmn 0 5 62 plusmn 1 96 plusmn 1 10 62 plusmn 1 94 plusmn 1 20 62 plusmn 0 93 plusmn 1 6000 0 6564 plusmn 21 10052 plusmn 31 5 6550 plusmn 30 10057 plusmn 214 10 6434 plusmn 85 9896 plusmn 66 20 6280 plusmn 213 9918 plusmn 80 5 60 045 0 64 plusmn 0 102 plusmn 1 5 65 plusmn 1 102 plusmn 1 10 63 plusmn 1 102 plusmn 1 20 64 plusmn 1 101 plusmn 1 6000 0 6516 plusmn 132 10660 plusmn 26 5 6598 plusmn 273 10762 plusmn 382 10 6475 plusmn 288 10454 plusmn 163 20 6653 plusmn 79 10482 plusmn 130 SHS 05 60 048 0 60 plusmn 2 86 plusmn 2 5 60 plusmn 0 94 plusmn 19 10 60 plusmn 1 81 plusmn 1 20 60 plusmn 0 81 plusmn 1 6000 0 6265 plusmn 40 8845 plusmn 102 5 6240 plusmn 92 8562 plusmn 44 10 6127 plusmn 110 8432 plusmn 35 20 6104 plusmn 112 8109 plusmn 122 5 60 045 0 59 plusmn 1 93 plusmn 1 5 58 plusmn 1 92 plusmn 0 10 56 plusmn 1 91 plusmn 1 20 58 plusmn 1 91 plusmn 1 6000 0 6166 plusmn 65 9908 plusmn 44 5 6180 plusmn 162 9607 plusmn 123 10 6230 plusmn 99 9529 plusmn 119 20 6189 plusmn 104 9489 plusmn 211
65
In vitro blood distribution of [3H]COM1 continued
Excipient Nominal COM1 H Incubation Actual values
in blood time (pg-eqmL mean plusmnSD n=3) in blood (pgmL) (min) Blood Plasma
TPGS 05 60 048 0 59 plusmn 1 92 plusmn 1 5 58 plusmn 1 90 plusmn 1 10 58 plusmn 1 88 plusmn 2 20 58 plusmn 0 87 plusmn 1 6000 0 5494 plusmn 102 8949 plusmn 87 5 5518 plusmn 124 8549 plusmn 165 10 5552 plusmn 74 8387 plusmn 101 20 5431 plusmn 23 8286 plusmn 71 5 60 040 0 50 plusmn 1 81 plusmn 1 5 50 plusmn 1 80 plusmn 1 10 50 plusmn 0 79 plusmn 1 20 50 plusmn 1 72 plusmn 1 6000 0 5042 plusmn 20 8175 plusmn 148 5 5014 plusmn 34 7907 plusmn 136 10 5102 plusmn 59 7952 plusmn 77 20 5069 plusmn 68 7204 plusmn 35 Triplicate analyses were conducted on one aliquot for each time point
In vitro protein binding of [3H]COM1 using the same plasma pool
Total radioactivity concentration determined in plasma and ultrafiltrate samples
Excipient Nominal COM1 Actual values (pg-eqmL) in plasma (pgmL) Plasma Ultrafiltrate None 60 65 26 (Glu) 26 26 6000 6302 270 268 272 TPGS 05 60 62 27 21 29 6000 5708 171 230 133 5 60 67 12 13 11 6000 5886 187 103 68 Mean of duplicate determination of plasma spiked with different COM1 stock solutions
66
Tissue and plasma levels of parent drug and total radioactivity after iv administration of [3H]COM1 (4 microgkg) in the control group
Time Tissue Individual concentration values
(h) COM1 (pgg) Radioactivity (pg-eqg) 008 Plasma 866 381 958 2529 1871 2052 Lung 2012 1440 1867 3431 2224 2538 Heart 2366 973 1619 2593 1490 1808 Liver 1069 384 724 11805 9501 10699 Kidney 2263 995 1692 6350 5770 5281 Fat 2803 1982 4753 2638 2213 4859 Muscle 1405 811 1234 1312 882 1172 Skin 433 225 296 937 524 583 Brain 6229 4525 4712 5431 4004 4053 025 Plasma 275 257 178 1719 1482 1366 Lung 399 607 518 1491 1378 1374 Heart 517 645 285 1034 1023 778 Liver 274 511 238 7904 6502 6920 Kidney 557 664 321 5270 5046 5425 Fat 6508 5897 4206 5953 5307 4112 Muscle 565 574 306 659 686 463 Skin 228 213 219 581 702 570 Brain 3407 4085 3014 3033 3552 2719 05 Plasma 179 103 101 1525 1442 1379 Lung 622 367 335 1365 1089 1030 Heart 310 211 214 684 684 661 Liver 138 71 100 7090 5263 4993 Kidney 345 220 202 4924 4585 5053 Fat 8008 4790 4248 6586 4071 3649 Muscle 270 159 166 409 349 342 Skin 199 64 104 559 449 480 Brain 2676 2419 2123 2310 2180 1953 pgmL and pg-eqmL
67
Tissue and plasma levels of parent drug and total radioactivity after iv administration of [3H]COM1 (4 microgkg) in the TPGS group
Time Tissue Individual concentration values
(h) COM1 (pgg) Radioactivity (pg-eqg) 008 Plasma 312 297 278 2842 2939 3006 Lung 1370 1173 1560 2364 2057 2272 Heart 1190 971 912 1584 1262 1291 Liver 449 234 337 10459 8898 10720 Kidney 1012 768 806 5047 4767 4829 Fat 2182 1485 1860 2712 2380 1703 Muscle 845 726 1132 880 720 1046 Skin 100 45 53 665 351 343 Brain 4072 2765 3083 3816 2353 2709 025 Plasma 89 107 121 2040 2440 2368 Lung 531 688 546 1343 1488 1356 Heart 351 471 454 737 864 851 Liver 104 205 170 5354 6770 5184 Kidney 321 435 446 6931 4972 6603 Fat 1352 3916 1578 1456 4764 2035 Muscle 355 649 588 532 789 675 Skin 71 72 37 563 518 342 Brain 1811 2327 1955 1648 2017 1841 05 Plasma 35 65 61 2027 2054 2186 Lung 214 195 319 1172 1067 1115 Heart 167 207 250 539 566 650 Liver 75 70 117 4225 4417 4314 Kidney 197 209 215 6923 6364 5600 Fat 3406 2067 2295 3071 1625 2734 Muscle 191 226 256 343 394 368 Skin 120 52 41 515 389 398 Brain 1516 1332 1541 1413 1295 1480 pgmL and pg-eqmL
Ex vivo protein binding of [3H]COM1 in the control and TPGS group
Parent drug concentration determined in plasma and ultrafiltrate
Dose Time Individual values (pgmL)
(microgkg) (h) Plasma Ultrafiltrate Control group 4 008 794 169 169 025 249 55 51 050 137 27 26 TPGS group 27 008 331 127 120 025 120 41 44 050 60 25 24 Mean of duplicate determination of plasma pooled for each time point
68
Raw data of COM2 in mouse
In vitro blood distribution of [3H]COM2 using blood pools with different hematocrits
Total radioactivity concentration determined in blood and plasma
Excipient Nominal COM2 H Incubation Actual values
in blood time (pg-eqmL mean plusmnSD n=3) (pgmL) (min) Blood Plasma
None 100 045 5 115 plusmn 2 85 plusmn 3 (Glu) 60 115 plusmn 5 93 plusmn 4 240 112 plusmn 6 101 plusmn 2 CELEtOH 6535 100 045 5 104 plusmn 5 86 plusmn 4 60 105 plusmn 2 83 plusmn 1 240 102 plusmn 1 87 plusmn 6 100rsquo000 046 5 103797 plusmn 1430 83684 plusmn 1446 60 102979 plusmn 1547 81784 plusmn 896 240 105912 plusmn 2594 80887 plusmn 998 HP-β-CyD 100 045 5 103 plusmn 5 88 plusmn 2 60 104 plusmn 5 94 plusmn 1 240 99 plusmn 2 94 plusmn 7 100rsquo000 043 5 105176 plusmn 1165 92396 plusmn 1519 60 104609 plusmn 1238 95791 plusmn 668 240 107331 plusmn 880 96454 plusmn 1780 SHS 100 045 5 101 plusmn 1 86 plusmn 1 60 99 plusmn 4 85 plusmn 1 240 105 plusmn 3 84 plusmn 3 100rsquo000 044 5 118080 plusmn 891 99140 plusmn 1915 60 116422 plusmn 2822 93052 plusmn 1190 240 116363 plusmn 890 89790 plusmn 1735 PEG 200 100 045 5 124 plusmn 4 96 plusmn 1 60 125 plusmn 6 95 plusmn 2 240 122 plusmn 2 103 plusmn 5 100rsquo000 046 5 112001 plusmn 3923 87146 plusmn 1273 60 112161 plusmn 1189 89801 plusmn 1646 240 110680 plusmn 652 90561 plusmn 1883 TPGS 100 045 5 101 plusmn 2 115 plusmn 2 60 104 plusmn 2 101 plusmn 1 240 101 plusmn 3 95 plusmn 3 100rsquo000 043 5 100911 plusmn 1443 106192 plusmn 992 60 100608 plusmn 3207 88758 plusmn 1037 240 100236 plusmn 4088 81755 plusmn 810 Triplicate analyses were conducted on one aliquot for each time point similar to previous study
In vitro protein binding of [
3H]COM2 at 10 ngmL using the same plasma pool
Parent drug concentration determined in plasma and ultracentrifugate
Excipient Actual values (pgmL) in plasma Plasma Ultracentrifugate None 9649 166 (plasma) 9278 164 9162 164 9292 164 TPGS 05 8624 116 8651 124 8722 103 8739 99
69
Tissue and plasma levels of parent drug and total radioactivity after iv administration of [3H]COM2 (04 microgkg) in the control group
Time Tissue Individual concentration values
(h) COM2 (pgg) Radioactivity (pg-eqg) 008 Plasma 110 112 91 181 194 164 Lung 1964 1955 1504 2450 2199 1704 Heart 796 830 623 1074 950 741 Liver 2398 2387 1778 3112 3022 2360 Kidney 2083 1871 1327 2276 2024 1511 Fat 140 327 230 58 540 603 Muscle 124 170 203 160 218 234 Skin 0 35 10 14 76 32 Brain 1155 1112 1018 1097 1086 1046 025 Plasma 94 71 77 164 141 139 Lung 1344 908 1365 1648 1849 1759 Heart 495 465 433 622 593 580 Liver 1579 1214 1549 2218 2161 2381 Kidney 1194 1075 1259 1468 1445 1518 Fat 714 459 778 1103 977 1218 Muscle 201 217 227 251 268 258 Skin 113 16 59 160 73 114 Brain 1060 1191 1345 1064 1150 1287 05 Plasma 60 58 58 119 113 111 Lung 720 703 842 1192 1444 1350 Heart 295 262 331 454 447 447 Liver 978 861 1040 1918 2348 2129 Kidney 757 753 932 1017 1303 1336 Fat 1014 602 973 1836 1164 2203 Muscle 187 167 189 242 252 231 Skin 87 16 18 97 129 104 Brain 1209 1006 1044 1160 1003 1044 1 Plasma 32 41 28 60 79 49 Lung 369 478 468 1465 1274 1171 Heart 154 199 205 347 377 364 Liver 591 618 534 2077 1736 1383 Kidney 471 522 451 1088 1020 846 Fat 496 444 713 1066 1458 1253 Muscle 103 80 91 171 169 146 Skin 0 38 48 138 123 122 Brain 673 832 688 826 902 806 pgmL and pg-eqmL value below LOQ
70
Tissue and plasma levels of parent drug and total radioactivity after iv administration of [3H]COM2 (04 microgkg) in the TPGS group
Time Tissue Individual concentration values
(h) COM2 (pgg) Radioactivity (pg-eqg) 008 Plasma 223 248 268 506 549 606 Lung 1789 1913 1880 2036 2137 2116 Heart 661 711 724 766 890 924 Liver 2331 2252 2360 2593 2585 2656 Kidney 1697 1831 1677 1815 2014 1839 Fat 246 150 317 362 366 740 Muscle 108 190 272 144 246 330 Skin 0 20 60 39 36 77 Brain 913 1069 1133 904 1024 1080 025 Plasma 178 148 151 403 377 394 Lung 1522 1175 1133 1820 1412 1436 Heart 489 478 452 593 597 578 Liver 1636 1743 1500 2243 2293 2130 Kidney 1112 1114 1256 1387 1415 1513 Fat 932 915 1480 1742 1392 2239 Muscle 237 222 183 290 288 283 Skin 23 0 38 144 140 96 Brain 1088 1244 1207 1004 1150 1166 05 Plasma 111 118 143 330 359 421 Lung 890 911 968 1292 1728 1599 Heart 292 385 384 420 630 570 Liver 1086 1200 1128 1901 2342 2002 Kidney 864 996 1103 1124 1584 1452 Fat 1393 ― 765 1492 ― 1576 Muscle 156 181 173 232 273 269 Skin 44 73 114 106 131 192 Brain 1048 1272 1325 1003 1298 1237 1 Plasma 79 97 63 333 296 264 Lung 669 885 512 1672 1588 1769 Heart 231 285 143 519 483 423 Liver 774 1028 798 2073 1946 2394 Kidney 726 835 659 1431 1342 1374 Fat ― 320 688 ― 1036 1712 Muscle 143 137 76 210 240 221 Skin 30 147 52 158 220 194 Brain 1141 1188 889 1204 1202 1070 pgmL and pg-eqmL value below LOQ no fat dissectible
71
Raw data of COM3 in rat
In vitro blood distribution of [3H]COM3 using the same blood pool (H 044)
Total radioactivity concentration determined in blood and plasma
Excipient Nominal COM3 Incubation Actual values
in blood time (ng-eqmL mean plusmnSD n=3) (ngmL) (min) Blood Plasma
None 5 5 46 plusmn 03 17 plusmn 0 (Glu) 30 46 plusmn 02 17 plusmn 01 60 47 plusmn 04 17 plusmn 01 500 5 511 plusmn 2 179 plusmn 0 30 507 plusmn 6 178 plusmn 2 60 512 plusmn 9 176 plusmn 2 CELEtOH 6535 5 5 49 plusmn 04 18 plusmn 01 30 49 plusmn 03 17 plusmn 0 60 51 plusmn 02 17 plusmn 0 500 5 516 plusmn 6 161 plusmn 2 30 508 plusmn 2 160 plusmn 1 60 508 plusmn 9 156 plusmn 1 HP-β-CyD 5 5 53 plusmn 02 35 plusmn 01 30 52 plusmn 04 35 plusmn 01 60 51 plusmn 0 36 plusmn 01 500 5 516 plusmn 5 324 plusmn 2 30 510 plusmn 2 320 plusmn 5 60 512 plusmn 4 326 plusmn 2 SHS 5 5 49 plusmn 02 14 plusmn 0 30 47 plusmn 01 15 plusmn 0 60 49 plusmn 03 16 plusmn 0 500 5 498 plusmn 10 143 plusmn 0 30 506 plusmn 14 143 plusmn 3 60 498 plusmn 1 144 plusmn 1 PEG 200 5 5 49 plusmn 04 17 plusmn 01 30 51 plusmn 01 17 plusmn 01 60 48 plusmn 01 18 plusmn 01 500 5 520 plusmn 7 169 plusmn 1 30 510 plusmn 9 170 plusmn 2 60 518 plusmn 6 176 plusmn 3 EtOHPEG200Glu 5 5 46 plusmn 03 18 plusmn 01 5590 30 43 plusmn 02 18 plusmn 01 60 44 plusmn 01 18 plusmn 01 500 5 535 plusmn 10 188 plusmn 1 30 535 plusmn 10 194 plusmn 2 60 538 plusmn 8 192 plusmn 1 TPGS 5 5 52 plusmn 03 23 plusmn 0 30 51 plusmn 0 22 plusmn 01 60 51 plusmn 0 24 plusmn 03 500 5 546 plusmn 3 231 plusmn 3 30 542 plusmn 6 231 plusmn 2 60 551 plusmn 5 231 plusmn 2 Triplicate analyses were conducted on one aliquot for each time point
72
In vitro protein binding of [3H]COM3 using the same plasma pool
Excipient Nominal COM3 Actual values
in plasma (ng-eqmL) (ngmL) Plasma Ultrafiltrate None 5 58 067 (Glu) 076 068 500 512 63 63 62 HP-β-CyD 5 54 22 21 22 500 538 214 216 209 EtOHPEG200Glu 5 5590 5 52 066 067 065 500 552 66 66 64 Mean of duplicate determination of plasma spiked with different COM3 stock solutions
Ex vivo protein binding of [3H]COM3 in the control and HP-β-CyD group
Parent drug concentration determined in plasma amp ultrafiltrate
Time Individual values (pgmL)
(h) Plasma Ultrafiltrate Control group 008 168 11 13 05 46 04 1 35 03 HP-β-CyD group 008 97 25 23 05 54 08 07 1 34 02 03 Mean of duplicate determination of plasma pooled for each time point
73
Circulation and tissue levels of parent drug and total radioactivity after iv administration of [3H]COM3 (03 mgkg) in the control group
Time Tissue Individual concentration values
(h) COM3 (ngg) Radioactivity (ng-eqg) 008 Blood 39 42 57 60 63 81 Plasma 15 19 19 38 40 41 Liver 1196 1394 1645 2097 2517 2767 Kidney 1760 1646 2019 2354 2286 2677 Fat 152 137 95 193 176 97 Heart 536 534 722 668 676 927 Lung 5712 5711 7113 8073 7897 9688 Muscle 152 112 105 161 112 98 Skin 209 139 85 216 136 86 Brain 1048 1062 1382 1323 1334 1736 05 Blood 20 13 18 75 85 83 Plasma 8 5 6 89 115 104 Liver 644 419 700 2619 2716 2654 Kidney 671 400 692 1162 843 1144 Fat 66 45 59 89 80 83 Heart 210 125 199 296 201 278 Lung 2425 1317 2267 3403 1811 2947 Muscle 222 98 144 282 144 185 Skin 103 81 99 131 119 164 Brain 1002 803 909 1260 996 1164 1 Blood 11 11 10 80 70 60 Plasma 4 5 4 105 99 74 Liver 383 427 373 1866 2152 2030 Kidney 345 405 320 707 758 659 Fat 30 31 33 49 52 53 Heart 106 126 102 161 188 157 Lung 1158 1092 1340 1680 1539 1817 Muscle 96 109 92 154 167 149 Skin 55 85 63 118 148 129 Brain 647 691 622 811 875 775 pgmL and pg-eqmL
74
Circulation and tissue levels of parent drug and total radioactivity after iv administration of [3H]COM3 (03 mgkg) in the HP-β-CyD group
Time Tissue Individual concentration values
(h) COM3 (ngg) Radioactivity (ng-eqg) 008 Blood 34 31 32 53 52 48 Plasma 12 10 10 29 32 28 Liver 850 1052 1271 1181 1665 1901 Kidney 1413 1330 1474 1770 1611 1778 Fat 68 85 103 70 99 121 Heart 592 500 598 719 593 725 Lung 4669 4377 4739 6069 5352 5939 Muscle 151 147 129 159 157 129 Skin 84 64 nd 66 49 nd Brain 954 990 908 1125 1165 1087 05 Blood 19 18 17 74 70 82 Plasma 6 6 6 77 75 96 Liver 617 558 677 2110 2107 2159 Kidney 524 417 496 743 652 810 Fat 47 39 51 59 51 68 Heart 212 178 169 276 233 222 Lung 2355 2513 2258 2931 3032 2853 Muscle 137 137 116 172 169 143 Skin 32 37 50 52 65 135 Brain 733 743 822 895 864 958 1 Blood 11 10 10 65 69 71 Plasma 4 3 4 77 87 92 Liver 344 nd 336 1765 nd 1597 Kidney 300 251 328 515 454 617 Fat 28 19 20 41 43 44 Heart 106 98 94 143 153 143 Lung 1257 926 976 1582 1205 1237 Muscle 98 98 59 133 161 84 Skin 29 27 23 49 110 68 Brain 606 604 588 734 726 697 pgmL and pg-eqmL not determined due to glas vial broken by homogenization
In situ bladder catheterization of [14
C]COM3 in the control and HP-β-CyD group
Time Urinary concentration Urine excreted
(h) COM3 (ngmL) Radioactivity (ng-eqmL) (g) Control 05 190 331 7226 13857 0685 0350 group 1 721 339 17998 12039 0460 0439 15 88 151 2855 7869 1130 0477 2 64 134 2435 9293 0790 0261 HP-β-CyD 05 1911 5216 4903 3523 13028 12248 2635 0851 0784 group 1 7900 524 2965 44618 5086 27031 0119 1068 0265 15 4209 899 1268 40724 18439 19080 0111 0188 0267 2 1993 184 597 31856 7994 11100 0124 0412 0335 Rat Ndeg3 died during in situ experiment
75
Raw data of COM4 in rat
In vitro blood distribution of [14
C]COM4 at 100 ngmL using the same blood pool (H 044) Total radioactivity concentration determined in blood and plasma
Excipient Incubation Actual values
time (ng-eqmL mean plusmnSD n=3) in blood (min) Blood Plasma None 05 5 98 plusmn 2 169 plusmn 0 (saline) 30 98 plusmn 1 167 plusmn 1 60 98 plusmn 2 168 plusmn 3 CEL 05 5 99 plusmn 0 147 plusmn 0 30 99 plusmn 2 135 plusmn 2 60 98 plusmn 1 128 plusmn 1 1 5 103 plusmn 1 139 plusmn 1 30 104 plusmn 0 125 plusmn 1 60 104 plusmn 2 120 plusmn 2 HP-β-CyD 05 5 125 plusmn 2 202 plusmn 1 30 125 plusmn 1 201 plusmn 3 60 124 plusmn 0 199 plusmn 3 1 5 116 plusmn 2 171 plusmn 3 30 117 plusmn 3 171 plusmn 2 60 117 plusmn 2 170 plusmn 3 SHS 05 5 110 plusmn 2 165 plusmn 2 30 110 plusmn 1 155 plusmn 1 60 110 plusmn 1 153 plusmn 3 1 5 112 plusmn 1 150 plusmn 2 30 112 plusmn 3 150 plusmn 1 60 112 plusmn 0 148 plusmn 2 Triplicate analyses were conducted on one aliquot for each time point
76
In vitro protein binding of [14
C]COM4 at 100 ngmL using the same plasma pool Total radioactivity concentration determined in plasma and ultrafiltrate
Excipient Actual values
(pg-eqmL) in plasma Plasma Ultrafiltrate None 97 25 (saline) 23 22 CEL 001 105 25 24 23 01 117 36 38 35 05 102 115 109 113 1 97 254 250 249 HP-β-CyD 001 99 27 25 24 01 102 43 47 43 05 134 131 133 131 1 112 172 151 150 SHS 001 99 25 22 22 01 101 34 31 33 05 116 115 111 112 1 112 171 174 167 PEG 200 100 22 24 24 TPGS 114 23 24 22 Mean of duplicate determination of plasma spiked with different COM4 stock solutions
77
Circulation and tissue levels of total radioactivity after iv administration of [14
C]COM4
Time Tissue Individual concentration values (ng-eqg)
(h) Control group CEL group 008 Blood 1258 1855 1551 1340 1515 1556 Plasma 2047 2761 2640 2211 2548 2517 Plasma water 123 50 49 287 477 478 Lung 659 815 737 754 763 788 Muscle 216 228 222 251 230 250 Skin 348 229 253 229 227 307 025 Blood 1306 1202 1069 1350 1183 1414 Plasma 2343 1983 1893 2357 1910 2273 Plasma water 92 99 83 118 179 201 Lung 697 657 608 737 651 741 Muscle 206 215 205 204 212 216 Skin 443 317 330 351 402 432 05 Blood 1398 1431 1303 1394 1112 1142 Plasma 2382 2543 2238 2357 1969 1926 Plasma water 63 124 46 106 151 191 Lung 710 731 644 720 666 641 Muscle 202 206 197 204 203 204 Skin 363 426 436 384 389 343 1 Blood 1322 1189 1233 1329 732 1301 Plasma 2297 1967 2049 2361 1192 2059 Plasma water 35 101 99 99 106 186 Lung 649 618 616 674 539 674 Muscle 218 200 217 187 212 191 Skin 424 381 421 425 340 407 ng-eqmL
78
Raw data of COM5
In vitro blood distribution of [14
C]COM5 using blood pools with the same H 044 Total radioactivity concentration determined in blood and plasma
Excipient Nominal COM5 Incubation Actual values
in blood time (ng-eqmL mean plusmnSD n=3) (ngmL) (min) Blood Plasma
None 10 5 73 plusmn 06 115 plusmn 02 (saline) 30 78 plusmn 02 118 plusmn 02 60 76 plusmn 07 118 plusmn 07 300 5 278 plusmn 2 386 plusmn 4 30 277 plusmn 0 391 plusmn 4 60 275 plusmn 7 384 plusmn 2 EtOH 10 5 98 plusmn 06 138 plusmn 05 30 98 plusmn 06 135 plusmn 05 60 92 plusmn 06 139 plusmn 01 300 5 286 plusmn 2 404 plusmn 3 30 287 plusmn 6 400 plusmn 4 60 284 plusmn 5 395 plusmn 3 CELEtOH 6535 10 5 88 plusmn 03 129 plusmn 06 30 91 plusmn 05 128 plusmn 03 60 92 plusmn 03 11 plusmn 03 120 98 plusmn 03 109 plusmn 03 1 5 257 plusmn 4 322 plusmn 3 30 259 plusmn 3 313 plusmn 5 60 255 plusmn 5 267 plusmn 2 120 281 plusmn 3 279 plusmn 1 HP-β-CyD 05 5 93 plusmn 05 143 plusmn 03 30 95 plusmn 03 139 plusmn 03 60 96 plusmn 02 141 plusmn 07 1 5 293 plusmn 1 412 plusmn 10 30 297 plusmn 6 414 plusmn 6 60 296 plusmn 6 405 plusmn 1 SHS 05 5 106 plusmn 04 125 plusmn 04 30 107 plusmn 04 108 plusmn 03 60 108 plusmn 05 112 plusmn 03 1 5 256 plusmn 1 257 plusmn 1 30 257 plusmn 2 247 plusmn 4 60 260 plusmn 3 230 plusmn 1 PEG 200 05 5 101 plusmn 03 141 plusmn 03 30 99 plusmn 08 145 plusmn 02 60 102 plusmn 03 142 plusmn 02 1 5 304 plusmn 7 402 plusmn 3 30 304 plusmn 8 413 plusmn 4 60 307 plusmn 2 410 plusmn 4 TPGS 05 5 88 plusmn 03 146 plusmn 04 30 91 plusmn 06 145 plusmn 03 60 89 plusmn 02 133 plusmn 03 1 5 308 plusmn 5 448 plusmn 3 30 312 plusmn 7 446 plusmn 7 60 311 plusmn 3 390 plusmn 22 Triplicate analyses were conducted on one aliquot for each time point
79
In vitro protein binding of [14
C]COM5 using the same plasma pool Total radioactivity concentration determined in plasma and ultrafiltrate
Excipient Nominal COM5 Actual values
in plasma (ng-eqmL) (ngmL) Plasma Ultrafiltrate None 10 86 13 (saline) 15 300 292 35 35 34 EtOH 10 108 13 12 300 295 35 35 34 CELEtOH 6535 10 104 25 24 21 300 269 65 64 63 SHS 10 107 30 29 31 300 268 76 74 73 Mean of duplicate determination of plasma spiked with different COM5 stock solutions
80
Circulation and tissue levels of total radioactivity after iv dosing of [14
C]COM5 (1 mgkg)
Time Tissue Individual concentration values (ng-eqg)
(h) Control group SHS group 008 Blood 1109 1450 1365 1694 2005 1859 Plasma 2009 3120 2647 2486 3010 2665 Muscle 355 458 387 555 426 448 Skin 275 224 245 296 207 219 Brain 24 29 28 41 38 41 025 Blood 712 873 1100 1519 1179 1033 Plasma 1508 1468 1777 2265 1813 1606 Muscle 262 341 330 423 445 404 Skin 229 242 259 456 441 342 Brain 14 16 18 29 27 21 05 Blood 642 409 792 1096 867 965 Plasma 1194 572 1275 1655 1455 1467 Muscle 244 199 241 342 341 315 Skin 252 198 256 397 382 374 Brain 11 7 11 22 15 18 1 Blood 172 192 219 688 603 464 Plasma 269 304 361 1055 919 727 Muscle 59 55 57 203 176 144 Skin 164 146 145 299 217 223 Brain 3 3 3 12 11 9 ng-eqmL value below LOQ
Ex vivo protein binding of [14
C]COM5 in the control and SHS group Total radioactivity concentration determined in plasma amp ultrafiltrate
Time Individual values (pg-eqmL)
(h) Plasma Ultrafiltrate Control group 008 2465 217 221 025 1587 123 126 05 1031 69 67 1 305 31 31 SHS group 008 2679 378 372 025 1914 245 05 1524 230 230 1 864 167 Mean of duplicate determination of plasma pooled for each time point
81
9 Acknowledgments
I would like to thank Prof Hans Leuenberger for giving me the opportunity to accomplish a PhD thesis at the University of Basel in collaboration with Novartis Ltd I would also like to thank my advisor PD Dr Georgios Imanidis for his guidance support and advice I would like to thank Dr Bruno Galli for acting as a co-examiner and co-referee for my PhD thesis I would like to thank Dr Gerhard Gross and his group for allowing me to conduct my dissertation research in their laboratories In particular I would like to thank Mr Armin Bruumllisauer and Dr Markus Weiss for helpful comments and discussions I am also thankful for Pierrette Guntz Heidi Huumlgli Marcel Fresneau and Albert Spielmann for not only assisting with my training and sharing laboratory space but for their friendships I would like to thank Dr Ernst Ulrich Koelle and Dr Michel Lemaire for their scientific advice and discussions concerning kinetics and suggestions throughout my dissertation project I would like to thank the Isotope Laboratories of Novartis for providing me with radiolabeled compounds Finally this research was made possible by financial support of Novartis Pharma AG Basel
82
10 Curriculum Vitae
Name Barbara Egger-Heigold Address Lettenweg 8 4102 Binningen
1975 Born on October 30th in Lucerne
1982-1988 Primary school in ReussbuumlhlLU 1988-1995 Matura Typus B Gymnasium ReussbuumlhlLU
1995-1996 1Propedeuticum in Medicines University of Basel 1997-2002 Studies in Pharmaceutical Sciences University of Basel 2002 Diploma thesis at Novartis Pharma AG Basel Thesis title The effect of excipients commonly used for drug
formulation on the in vitro rat blood distribution and protein-binding of SAB 378
2003-2005 PhD student University of Basel Laboratory work conducted at Novartis Pharma AG Basel During my PhD thesis I attended following lectures and courses given by the following lecturers Prof Dr H Leuenberger PD Dr GImanidis Prof Dr J Drewe Prof Dr J Seelig PD Dr H Heerklotz PD Dr A Seelig Dr S Rogers

II
Genehmigt von der Philosophisch-Naturwissenschaftlichen Fakultaumlt auf Antrag von Prof Dr Hans Leuenberger PD Dr Georgios Imanidis Dr Bruno Galli Basel den 20 September 2005
Prof Dr Hans-Jakob Wirz Dekan
III
Contents
Summary V
Abbreviations VII
1 Introduction 1
11 The physiology of blood 1
111 The blood cells 1
112 Plasma 1
12 In vitro methods to investigate blood binding parameters 2
121 Blood distribution method 3
122 Protein binding methods 3
13 Characterization of drug candidates 4
131 Physicochemical properties 4
132 Pharmacokinetic parameters 5
133 New trends in characterizing drug candidates 6
14 Strategies and administration of intravenous formulations 7
15 Effect of excipients on pharmacokinetic parameters in blood 9
151 Cremophor EL 9
152 Cyclodextrins 10
153 Tween 80 10
154 Other excipients 11
155 Nanoparticles 11
16 Objectives and specific aims 12
2 Selection and experimental procedure 13
21 Excipients and model compounds 13
22 Experimental setup 15
3 Materials and methods 17
31 Chemicals 17
32 Blood and plasma sources 17
33 In vitro studies 17
331 Preparation of test solutions 17
332 Hemolytic activity 18
333 Blood distribution 18
334 Plasma protein binding 19
335 Determination of protein concentration 20
IV
34 In vivo studies 20
341 Experimental animals 20
342 Drug administration and sample collection 20
343 Bladder catheterization and urine collection 21
344 Ex vivo protein binding 21
35 Measurement of the radioactivity 21
36 Determination of parent drug 22
37 Data analysis 22
38 Pharmacokinetic analysis 23
4 Results and discussions 24
41 Hemolytic activity of excipients 24
42 Impact of the hematocrit on blood partition parameters 25
43 Major binding proteins of model compounds 26
44 The impact of Vitamin E TPGS on COM1 in rat 27
45 The impact of Vitamin E TPGS on COM2 in mouse 29
46 The impact of hydroxypropyl-β-cyclodextrin on COM3 in rat 33
47 The impact of Cremophor EL on COM4 in rat 39
48 The impact of Solutol HS 15 on COM5 in rat 42
5 General discussion and conclusions 47
6 Outlook 54
7 References 56
8 Appendix 64
9 Acknowledgments 81
10 Curriculum Vitae 82
V
Summary
In the pharmaceutical industry the main goal of early phase in vivo studies is to assess pharmacokinetic properties of a compound in laboratory animals These data provide a basis for selecting and optimizing drug candidates However formulation scientists face considerable challenges in finding intravenous preparations for first animal experiments A common problem is the solubilization of lipophilic and sparingly water-soluble compounds The search for suitable delivery vehicles often takes place under little compound availability incomplete physicochemical property characterization and time constraints In addition many experiments have recently generated distinct evidence about the impact of formulation vehicles on the drug pharmacokinetics by affecting transporters metabolic enzymes and distribution processes Consequently drug-excipient interactions are important to consider in the development of parenteral formulations intended for the proper evaluation of animal pharmacokinetics in vivo Gaining a better understanding of potential interactions between drug and formulation in preclinical settings may play a crucial role in clinical and commercial phases of development as well
So far little is known about drug-excipient interactions occurring in blood especially following iv administration of low dosed compounds (lt50 ngmL in blood) including eg highly active drug substances biomarkers PET ligands and microdoses
The purpose of the current work was to examine the potential of excipients commonly used in formulations to modify the blood distribution and protein binding of low dosed compounds under in vitro and in vivo conditions Drug candidates in development at Novartis were used as model compounds and chosen based on different physicochemical and pharmacokinetic properties such as aqueous solubility (poor COM1COM2 good COM3) lipophilicity (low COM4 high COM2) membrane permeability (low COM5 high COM3) and blood cellplasma distribution (mainly in cells COM3 mainly in plasma COM4) Selected excipients comprised one cosolvent (polyethylene glycol 200 PEG 200) one complexing agent (hydroxypropyl-β-cyclodextrin HP-β-CyD) and three non-ionic surfactants (Cremophor EL CEL Solutol HS 15 Solutol D-α-tocopheryl polyethylene glycol 1000 succinate TPGS) most of them present in commercially available intravenous formulations TPGS which is used orally but not as an intravenous excipient was chosen due to its chemical structure and intrinsic properties particularly its benzyl ring and potential modulation of transporterenzyme activities
Preliminary tests in vitro showed that selected excipients except for TPGS were non-hemolytic at 05 which is consistent with data reported in the literature TPGS at 05 induced marked hemolysis after longer contact time (gt 1h) in various species (mouse rat dog and human) whereas TPGS at 01 showed no hemolysis under same conditions Nevertheless TPGS (05) was used in the non-hemolytic time range for further investigations The concentration of all excipients was set at 05 in test systems which is within the relevant range following intravenous dosing in animals
VI
In vitro CEL HP-β-CyD Solutol and TPGS influenced clearly the plasma protein binding and the distribution between blood cells and plasma of model compounds in mice (COM2) or rats (COM1 COM3 COM4 COM5) The addition of TPGS to incubations increased the distributed fraction of COM1 and COM2 in plasma with a concomitant decrease of drug unbound in plasma Formulating COM4 in CEL and COM5 in Solutol lowered the protein binding and the higher drug fraction unbound in plasma was associated with enhanced partitioning into blood cells The presence of HP-β-CyD reduced both the uptake of COM3 into blood cells and the binding to plasma proteins
To assess the correlation between the in vitro findings and the in vivo situation pharmacokinetics and tissue distribution were determined up to 1 h (within PET scan times) after an intravenous bolus injection of model compounds in formulations based on excipients or none (control) to animals using in each case the excipient with the most pronounced interactions detected in vitro Injection preparations contained the excipient to yield estimated blood concentrations of about 05 similar to those used in the in vitro experiments COM2 formulated in TPGS caused a higher accumulation of parent drug and metabolites in plasma without affecting tissue levels in mice Administering COM3 in HP-β-CyD altered the disposition of COM3 characterized by a lower binding to plasma proteins decreased drug levels in the systemic circulation and skin and a higher amount of unchanged drug in the urine COM4 formulated in CEL resulted in a higher drug fraction unbound in plasma which had no impact on the pharmacokinetics and tissue distribution The use of Solutol for COM5 application in rats was associated with decreased protein binding longer persistence in the circulation and higher concentrations in muscle and skin Although TPGS induced a slight shift in the pharmacokinetic parameters of COM1 in rats the compound turned out to be an inappropriate model compound due to its very rapid metabolism and elimination under in vivo conditions
These in vitro and in vivo findings demonstrated that commonly used excipients have a substantial potential for drug-excipient interactions in blood by altering protein binding and blood cellplasma distribution which can influence the tissue distribution and elimination within the first hour after dosing As a result the formulation vehicle can be an important determinant for the disposition of low dosed compounds administered intravenously in animals Moreover results indicate a direct correlation of the excipient effect under in vitro and in vivo conditions Therefore blood distribution and plasma protein binding data generated in vitro seem to be appropriate to reveal potential drug-excipient interactions thereby providing helpful information to improve the rational approach and strategy in the development of parenteral formulations at the preclinical stage A better insight into the contribution of excipients to drug pharmacokinetics suggests also new possibilities of targeting different blood compartments and tissues by selecting the appropriate excipient Such investigations should be considered to develop formulations suitable for intravenous administration of PET ligands where sub-therapeutic doses and short scanning times are used
VII
Abbreviations
AGP α1-acid glycoprotein AUC Area under the drug concentration-time curve BCPR Ratio of concentration in blood cells to that in plasma no units BPR Ratio of concentration in blood to that in plasma no units C0 Initial plasma concentration at time zero CB Concentration of drug in blood CBC Concentration of drug in blood cells CEL Cremophor EL CP Concentration of drug in plasma EtOH Ethanol FP Drug fraction distributed in plasma fu Fraction of unbound to total drug concentrations in plasma funchanged AUC ratio of parent drug to that of total radioactivity Glu 5 aqueous solution of glucose H Hematocrit HDL High density lipoprotein HP-β-CyD Hydroxypropyl-β-cyclodextrin im Intramuscular iv Intravenous k Rate constant h-1 KP Distribution ratio of drug between tissue and bloodplasma no units LC-RID Liquid chromatography-reverse isotope dilution LDL Low density lipoprotein LOQ Level of quantification LSC Liquid scintillation counting nd Not determined PEG 200 Polyethylene glycol 200 PET Positron emission tomography SD Standard deviation Solutol Solutol HS 15 TPGS D-α-tocopheryl polyethylene glycol 1000 succinate t12 Half-life h V0 Volume of distribution based on initial drug concentration in plasma L VLDL Very low density lipoprotein ρ Ratio of concentration in blood cells to that unbound in plasma no units
1
1 Introduction
11 The physiology of blood
Blood is composed of cellular elements suspended in the plasma an aqueous fluid in which solids are dissolved Table 1-1 summarizes the main blood constitution of different laboratory animal species and humans The normal range can vary depending mainly on genetic and environmental factors and methods handling
Table 1-1 Normative data for laboratory animals and humans
Mouse (12)
Rat (134)
Human (5)
Sex Male Male Male Strain OF1 Wistar Body weight (kg) 0030 0250 70 Whole blood (ml100 g) 72 (63-80) 72 plusmn 02 71 plusmn 06 Plasma (ml100 g) 32 39 plusmn 01 44 plusmn 05
Total plasma proteins (g100 mL) 54 plusmn 02 57 plusmn 05 75 plusmn 04
Albumin ( plasma proteins) 61 plusmn 1 48 plusmn 3 62 plusmn 3 α1 globulin ( plasma proteins) 17 plusmn 2 4 plusmn 1 α2 globulin ( plasma proteins)
12 plusmn 1 (α globulin) 10 plusmn 2 9 plusmn 1
β1 globulin ( plasma proteins) β2 globulin ( plasma proteins)
20 plusmn 1 (β globulin)
19 plusmn 1 (β globulin)
11 plusmn 2 (β globulin)
γ globulin ( plasma proteins) 7 plusmn 1 6 plusmn 1 15 plusmn 2 Blood cells Hematocrit () 43 plusmn 3 46 plusmn 2 44 plusmn 2 Red blood cells (x106 cellsmicroL) 9 plusmn 1 7 plusmn 1 5 plusmn 1 White cells (x103 cellsmicroL) 4 plusmn 2 6 plusmn 2 7 plusmn 1 Platelets (x106 cellsmicroL) 13 plusmn 04 12 plusmn 02 03 plusmn 01
111 The blood cells
The different specialized cells found in blood are white blood cells (leukocytes) red blood cells (erythrocytes) and platelets (thrombocytes) Of these the erythrocytes are the most numerous and compose about one-half of the circulating blood volume By carrying hemoglobin in the circulation the red blood cells supply O2 to tissues and remove CO2 Leukocytes are classified as granulocytes (further classification in neutrophils eosinophils and basophils) lymphocytes and monocytes Acting together these cells provide the body with a powerful defense against tumors viral bacterial and parasitic infections Compared to the other blood cells the platelets are much smaller and aid in hemostasis by their primary function in blood clotting Furthermore blood cells can play a key role in binding and transporting of drugs in the circulation thereby contributing to their pharmacokinetic and pharmacological characteristics (67)
112 Plasma
The plasma the liquid portion of the blood is a complex fluid composed of water (approximately 90) and a large number of ions inorganic molecules and organic molecules in solution These dissolved substances primarily proteins are in transit to
2
various parts of the body or aid in the transport of other substances The plasma proteins consist of albumin globulin and fibrinogen fractions which can be separated by electrophoresis Electrophoretic separation followed by immunoprecipitation (immunoelectrophoresis) results in a further division of the proteins If whole blood is allowed to clot and the clot is removed the remaining fluid is called serum and has essentially the same composition as plasma except for the removed fibrinogen and few clotting factors (II V and VIII) Table 1-2 lists the main protein fractions with their main characteristics The table also indicates that a large number of drugs associate with proteins within the bloodstream Albumin is the major drug-binding plasma protein (8) followed by alpha 1-acid glycoprotein as the next important one (9) In recent years studies have shown that lipoproteins are also substantially involved in the bindingtransport of drugs in the blood compartment (10) So far γ-globulins play only a marginal role in plasma binding of drugs
Table 1-2 Proteins in human plasma
Physiological Function
Albumin PrealbuminAlbumin
α1 globulin α1-acid glycoprotein Uncertain (acute phase protein)
α1-lipoprotein (high Transporter Lipidsdensity lipoproteins)
α2 globulin Ceruloplasmin Transporter Copperα2-Macroglobulin Enzyme inhibitor Serum endoproteasesα2-Haptoglobin Binding and carrier protein Cell-free hemoglobin
β globulin Transferrin Transporter Ironβ-lipoprotein (low Transporterdensity lipoproteins)Fibrinogen Precursor to fibrin in hemostasis
γ globulin IgG IgA IgM IgE Antigen Few basic compounds
Electro-phoresis
Immuno-electrophoresis
Protein fraction Binding characteristics
Drugs Endogenous entities
Lipoproteins mainly lipophilic neutral and basic compounds
Humoral immunity (antibodiesimmunoglobulins)
Lipids (mainly cholesterol)
Binding and carrier protein osmotic regulator
Hormones amino acids steroids vitamins fatty acids
Mainly basic and neutral compounds
Mainly acidic but also basic and neutral compounds
Lipoproteins mainly lipophilic neutral and basic compounds
12 In vitro methods to investigate blood binding parameters
The investigation of the partitioning of a drug in the blood compartment is essential in predicting its pharmacokinetic-dynamic profile In general the unbound concentration of a drug in blood reflects more accurately pharmacological effects of the drug than its total concentration in blood (bound + unbound) because only the drug unbound to blood components is able to diffuse through the membranes and then reach the target organ (11) Furthermore the binding to plasma proteins also relates to the volume of distribution and the clearance of the drug For instance many experimental and clinical studies have generated substantial evidence summarized by Akhlaghi (12) that the unbound fraction of cyclosporin in plasma correlates more closely with pharmacodynamic and pharmacokinetic characteristics of cyclosporin than its total blood concentration Therefore determination of extent and rate of bloodplasma distribution and plasma protein binding of a drug is important in both the discovery and clinical phases of drug development
3
121 Blood distribution method
The rate and extent of bloodplasma distribution of drugs is determined in vitro in spiked whole blood The experiments are performed under controlled physiological conditions (pH 74 37degC gently shaken) to reflect the in vivo situation over the entire clinically relevant concentration range of the drug Time samples are taken and centrifuged Subsequently drug concentrations in blood and plasma are determined to calculate the time required to reach equilibrium The extent of bloodplasma and blood cellplasma distribution derives from measured concentrations in blood and plasma and can be expressed with distribution parameters like FP BPR and BCPR BPR depends on the hematocrit of the whole blood used in the determination whereas BCPR is independent of the hematocrit value
122 Protein binding methods
Various methods are available for the determination of free drug concentration and protein-drug binding fraction in plasma (131415) including conventional separation methods summarized in Table 1-3 However the routinely used methods like ultrafiltration or equilibrium dialysis are limited in the case of lipophilic drugs due to their nonspecific adsorption to ultrafiltration device or to the dialysis membrane Along with a trend to more lipophilic compounds observed in the pharmaceutical industry in recent years (16) these adsorption problems are expected to increase As a result ongoing method modifications and new methods are needed to overcome these difficulties Overall the selection of the method of binding assay depends upon the aim of the study and the physicochemical properties of the particular test compound including its formulation
The ratio of bound and total drug concentrations in plasma expresses the degree of drug binding to plasma proteins and ranges between values of 0 and 1 Based on these values drugs can be classified into very highly bound (gt095) highly bound (gt090) poorly bound (lt09) and littlenot bound (lt02)
4
Table 1-3 Conventional methods for determination of plasma protein binding
Method Principle Advantages Disadvantages
Ultrafiltration
Ultracentrifugation
Gel filtration Adoptable for lipophilic drugs automatable binding differences detectable (eg affinity)
Complex handling time consuming
Time consuming expensive equipment false estimation of free fraction by physical phenomena (eg sedimentation back diffusion) protein contamination of free drug layer
Separation by size exclusion and affinity of column
Separation by centrifugation at high speed in absence of a membrane
No membrane effects natural environment no dilution problems adoptable for lipophilic and high MW drugs evaluation of lipoprotein binding
Equilibrium dialysis (reference method)
Sample dilution volume shifts Donnan effects nonspecific adsorption sieve effect time consuming unsuitable for unstable drugs
Separation by filtration through a semipermeable membrane with defined molecular weight cutoffs accelerated by centrifugation or positive pressure (N2 gas syringe)
Equilibrium establishment between two compartments separated by semipermeable membrane with defined molecular weight cutoffs
Physiological conditions universal binding method
Simply applicable short analysis time simple commercially available kits no volume shifts no dilution effects
Donnan effects nonspecific adsorption binding equilibrium changes during separation process small amount for analysis sieve effect
13 Characterization of drug candidates
Successful candidates in drug development must have proper physicochemical properties in addition to acceptable pharmacokinetics efficacy and safety profiles As a result a clear understanding of compound characteristics and their correlations are helpful to rank and sort out unsuitable compounds in drug research (1718)
131 Physicochemical properties
The chemical structure of a drug candidate is used in both predicting the pharmacology and selecting formulation strategies Table 1-4 shows physico-chemical parameters which are critical for in vivo drug action
The molecular weight (MW) indicates roughly the size of a chemical entity and is connected to its membrane permeability namely to the intestinal and brain penetration (1619)
LogP the octanol-water partition coefficient has been widely accepted as a measure of molecular lipophilicity Lipophilicity affects both the pharmacokinetic and pharmacodynamic behavior of drug molecules (2021) LogP considers the molecule in its neutral state (neutral substance or ionizable substance in its neutral form) whereas logD reflects the pH-dependent distribution coefficient consequently taking the ionization of molecules into account If logP and pKa of a compound are known logD can be calculated at any pH (21)
5
The aqueous solubility (LogS) is closely related to drug stability liberation and absorption by passive diffusion thereby playing a key role in its bioavailability (22) Causes for poor solubility are mainly excessive lipophilicity and crystal packing issue (23242526) The solubility of nonionic molecules is pH independent while molecules with ionizable groups show pH dependent solubility Acid drugs have higher solubility at pH higher than pKa and basic drugs at pH lower than pKa due to better solubility of ionic species as compared to the neutral species The acid-basic character accounts also for crossing the blood-brain barrier (27)
The polar surface area (PSA) of a molecule is a useful parameter for predicting drug transport properties PSA is the sum of the molecular surface (either van der Waals or solvent-accessible) that arises from polar atoms usually N O N-H and O-H atoms Some scientists also include sulphur and phosphor and attached hydrogens as polar atoms The PSA of a compound is also closely related to its hydrogen bond accepting and donating ability which can be responsible for interactions with active efflux pumps (2829) PSA has been shown to correlate well with blood-brain distribution (273031) intestinal absorption (323334353637) and oral bioavailability (38) of compounds
Table 1-4 Physicochemical parameters
Parameter Description Predictor Optimal value
MW Molecular weight Size Permeability lt 500lt 450 (BBP)
LogP lt 5
LogS Hydrophilicity gt 20 microgmL
pKa Acid-base character
PSA Polar surface area lt 140 Aringlt 80 Aring (BBP)
Negative logarithm of the acid-base dissociation constant
Acids gt4 and bases lt10 (BBP)
Permeability H-bonding capability
Logarithm of the octanol-water partition coefficient
Lipophilicity Permeability
Logarithm of the aqueous solubility
BBP blood brain penetration
132 Pharmacokinetic parameters
The pharmacokinetic profile is crucial for the clinical success of drug candidates and their development into marketable drugs Therefore today the contribution of pharmacokinetic investigations to the selection and optimization of promising drug candidates is well recognized The four most important parameters are clearance volume of distribution elimination half-life and bioavailability which is the fraction of drug absorbed as such into the systemic circulation (100 per definition for drugs given intravenously)
Drug clearance (CL) expresses the rate or efficiency of drug removal from the systemic circulation and is estimated as the ratio of dose to AUC following intravenous administration of the drug
AUC
DoseCL =
6
AUC is the total area under the curve that describes the concentration of drug in blood or plasma as a function of time AUC represents the drug exposure and is calculated by the trapezoidal rule
The volume of distribution (V0) relates the amount of drug in the body to the concentration of drug in the blood or plasma depending upon the fluid measured This volume does not necessarily refer to an identifiable physiological volume but merely to the fluid volume that would be required to contain all of the drug in the body at the same concentration as in the blood or plasma
o
iv
C
DoseV =0
C0 represents the blood or plasma concentration at time zero and is determined by extrapolation to zero time of the linear plot of concentration vs time in semilogarithmic scale
The half-life (t12) is the time it takes for the blood or plasma concentration or the amount of drug in the body to be reduced by 50
kkt
69302ln21 ==
where k is the elimination rate constant which can be calculated by the slope of the best-fit line to a semilogarithmic plot of the concentration over time The relationship of t12 to both clearance and volume of distribution is given by
V
CLk =
133 New trends in characterizing drug candidates
Before conducting clinical trials in humans preclinical testing is carried out to discover the pharmacology ADME (adsorption distribution metabolism and excretion) and toxicology of a new drug candidate (39) Appropriate pharmacokinetics and a good balance between drug efficacy and safety contribute mainly to an efficient and effective drug development However these factors are the major hurdles in development which primarily cause increased costs and failure rate of candidates Thus pharmaceutical industry needs new concepts able to speed and improve activities and decision-making in drug development (4041) In this context microdosing biomarkers and PET ligands can help to prioritize resources and optimize drug selection in development In many cases these approaches deal with compound concentrations ranging from sub-therapeutic to low pharmacological levels and thus information obtained from these techniques must reflect correctly the conditions at therapeutic doses including interactions with macromolecules like enzymes transporters and proteins In the end a successful integration requires a profound understanding of strengths and limitations of these new concepts
The administration of a low dosed (microdosed) drug candidate to humans was proposed to obtain human pharmacokinetic data before conducting Phase I trial (42) A microdose is one-hundredth of the proposed pharmacological dose determined from animal andor in vitro models or a dose up to 100 microg whichever is the smaller (43) Human microdosing uses labeled agents administered mostly intravenously and their fate in vivo is recorded by positron emission tomography combined with accelerator mass spectrometry or nuclear magnetic resonance (4344) With this new
7
strategy of microdosing drug information regarding human kinetics will be available along with preclinical data and can be useful for the acceptance or rejection of a candidate at an early stage
A biomarker is an indicator of a normal biological or pathophysiological process or a therapeutic response (45) Biomarkers help to select the most sensitive drugs in all phases of drug development (46) by providing data of pharmacological response dosing regimen and risk-benefit assessment Therefore efforts are moving rapidly forward to achieve strong predictive biomarkers which could be used for diagnostic and therapeutical purposes (47)
PET tracers labeled with short-lived radionuclides (eg 11C 18F 124I) are used as molecular probes of physiology and pathophysiology in animals and humans These labeled compounds are administered mostly intravenously at 600 MBq to humans which corresponds to 6-20 nmol (3-10 microg assuming a MW of 500) (48) To achieve the same imaging quality in animals roughly the same total amount of radiopharmaceutical must be given to animals as to a human subject (49)
14 Strategies and administration of intravenous formulations
In the pharmaceutical industry formulation scientists have faced growing challenges in recent years as a result of new drug candidates characterized as being more lipophilic hydrophobic and water-insoluble particularly candidates originated from leads associated with combinatorial chemistry and high-throughput screening (1624) In addition timelines and resources are very limited to develop an optimized formulation and thus the search for a suitable dosing vehicle intended for activities in preclinical research represents a challenging task for the formulators (50) Ideally it is best to select and use solubilizers that would maximize the solubility of the compound and could be applied for all preclinical settings Moreover the solubilizing agents should not influence the intrinsic pharmacokinetic characteristics of the compound being evaluated (except the interaction is well understood) which would lead to misinterpretation of the pharmacological response (51) Strategies for solubilization of intravenous drugs are summarized in Table 1-5 and well exemplified by the formulation approaches for the anticancer agent Paclitaxel (52)
Usually the first step is to check the solubility of the compound in an aqueous dosing vehicle at physiological pH and osmolarity If the target concentration cannot be achieved with this approach and the drug molecule is ionizable adjustment of the pH to non-physiological values can be suitable to increase water solubility (pKa must be sufficiently away from the formulation pH) Non-electrolytes are insensitive to pH modification The next approach most frequently tried is the addition of water-miscible organic solvents (cosolvents) and the use of surfactants or complexing agents To reach the required dose combination of these methods is often used Dispersal systems are other techniques but they may be difficult costly and time-consuming due to biological and technical complexity eg liposomes (53)
8
Table 1-5 Intravenous formulation approaches
Approach Examples Administered in commercial productsa Potential drawbacks
NaCl 09 (wv) pH 2-12 (bolus) pH 2-10 (infusion) PrecipitationGlucose 5 (wv) rarr preferred range pH 4-9 PainStrong acidsbases (HCl NaOH)Buffers (tartarte phosphate)
Cosolvents Propylene glycol le 68 (bolus) le 6 (infusion) Precipitation Ethanol le 20 (bolus) le 10 (infusion) IrritationPainPolyethylene glycol 300 le 50 (bolus) HemolysisPolyethylene glycol 400 le 9 (bolus) Impact on PK profile
Surfactants Cremophor EL le 10 (infusion) ditoTween 80 le 04 (bolus) le 2 (infusion)Solutol HS 15 50
Complexing agents Hydroxypropyl-β-cyclodextrin 20 (infusion) ditoDispersal systems Impact on PK profile
EmulsionbMicroemulsionc Water with 10-20 oil (fatty acids + lecithin + glycerol) Sustained releaseLiposomes Water with phospholipids (5-20 mgmL) + isotonicifier + buffer plusmn cholesterol Instability
Nanosuspensiond Water with stabilizer not yet marketede Slow dissolution
Aqueous solution at physiological osmolarity and pH or with pH adjustment
a(54) b(55) c(56) d(57) e(58)
For compounds administered intravenously to animals the dose volume viscosity
of injection material speed of injection and species are important factors to consider in addition to formulation properties including additives solubility and stability (Table 1-6) (59) A compound can be given over a short period of le1 min (bolus injection) 5-10 min (slow injection) and longer time period (intravenous infusion) Rapid injections require the dose to be compatible with blood and not too viscous and the rate of injection is suggested not to exceed 3 mLmin for rodents Depending on study objectives and compound solubility in an acceptable formulation a larger volume may be needed to be given to animals to accomplish requirements Regarding the formulation aqueous solutions or simple systems containing cosolvent surfactant or complexing agent are recommended for animal investigations at early stage in development due to easy handling and characterization For excipient selection consideration should be given for toxic and biological effects interferences with the drug compound and suitability for clinical use (Table 1-5) Injectable excipients preferred for dosing in animals are ethanol propylene glycol low molecular weight polyethylene glycols Cremophor EL Tween 80 and cyclodextrins
Table 1-6 Dose volumes and rates for intravenous administration(59)
Species Bolus injection Slow injection Infusion
Volume Rate Volume Rate Time Volume Rat
(mLkg) (mLmin) (mLkg) (mLmin) (h) (mLkgd) (mLkgh) Mouse 5 3 max 25 3 4
24 96 4 Rat 5 3 max 20 3 4 20 5 24 60 25
9
15 Effect of excipients on pharmacokinetic parameters in blood
Over the last years more attention has been paid to the extensive investigation of formulation vehicles as biologically and pharmacologically active compounds The main stages in which pharmaceutical excipients can interact and hence may modulate the properties of an administered drug-agent are transporter enzyme and distribution process in the systemic circulation (eg plasma protein binding) The effect of excipients on transporter activity has been studied intensively namely for P-glycoprotein (606162636465666768) multidrug resistance-associated protein (6970) and peptide transporter (71) It is interesting to say that particularly nonionic surfactants effectively inhibit transporters In contrast up to this day little is known about drug-excipient interactions at the level of cytochrome-mediated metabolism (63727374) and blood distribution (see below) The biological and pharmacological properties of excipients with a focus on the central blood compartment will be reviewed in the following paragraphs
151 Cremophor EL
The amphiphilic polyethoxylated castor oil derivative Cremophor EL (CEL) is one of the most frequently used surface-active formulation ingredients in parenteral dosage forms As early as 1977 lipoprotein alterations were observed in patients receiving miconazole therapy (75) which was caused only by CEL both in vitro and in vivo (767778) Extended studies revealed later on that CEL has a destructive effect on HDL resulting in a shift of the electrophoretic and density gradient HDL to LDL (79808182) Furthermore several hydrophobic anti-tumor agents tin etiopurpurin (8384) C8KC (85) and Taxol (8182) showed strong affinity for these lipoprotein dissociation products inducing changes in plasma protein binding potentially affecting pharmacokinetics
Various animal studies demonstrated (85868788899091110) that CEL modifies the pharmacokinetic behavior of drugs after intravenous administration like paclitaxel (Taxol) C8KC and cyclosporin The most common observation was a substantial increase in the area under the plasma concentration-time curve and in peak plasma concentration of studied agent with a reduction in the clearance as was first described for paclitaxel in a mouse model (91) The drug-CEL interactions were supposed to be caused not only by altered protein binding characteristics (82) but also by altered hepatobiliary secretion (92) and endogenous P-glycoprotein-mediated biliary excretion (93) However the very small volume of distribution of CEL approximately equal to the volume of the central blood compartment suggests that the observed interference occurs in the central blood compartment This hypothesis was confirmed by studies recently published (9495) The main finding was a profound alteration of cellular partitioning and bloodplasma concentration ratio of paclitaxel in a CEL concentration-dependent manner as a result of an entrapment of the compound into micelles formed by CEL (96) Consequently the free drug fraction available for distribution was reduced This effect was also observed in the absence of plasma proteins pointing at contributing factors other than altered protein binding and increased affinity of paclitaxel for CEL-induced lipoprotein degradation products (8182)
10
For the purpose of finding out a potential paclitaxel delivery vehicle with an ideal profile the investigation of several delivery vehicles based on the chemical structures of CEL and Tween 80 led to alteration of blood distribution of paclitaxel in presence of all tested vehicles (97) Different formulation approaches such as liposomes and poloxamer-micelles affected the pharmacokinetics of paclitaxel in mice as compared to the CEL-containing formulation (98) In contrast paclitaxel administered in a solvent-free formulation in a clinical study showed a higher efficacy combined with reduced adverse effects compared to the drug delivered in a solution of CEL (99)
Overall numerous investigations have shown that CEL can play a pivotal role in the pharmacological behavior of the formulated drugs In addition several drug-drug interactions are reported on agents administered intravenously in conjunction with CEL-containing formulation of other compounds namely paclitaxel (100101102103) cyclosporin (104105106107) and valspodar (108109) Most likely the presence of CEL in drug formulations contributes to the observed pharmacokinetic interactions Indeed recent experiments revealed a substantial increase of plasma concentrations of cyclosporin after an additional injection of another drug preparation containing CEL (110)
152 Cyclodextrins
Cyclodextrins are ring-shaped oligosaccharides with a hydrophilic exterior and a hydrophobic interior (111) The interior cavity is capable of forming water-soluble complexes with many drugs Due to the rapid release of a drug from the complex after administration in vivo it is assumed that drug-cyclodextrin complexes do not affect the drug pharmacokinetics (112) However if the drug is slowly or incompletely released from the complex drug dosing as complexes in cyclodextrin can be critical
The binding of drugs to plasma proteins was influenced in vitro in the presence of β-cyclodextrin (113) and hydroxypropyl-β-cyclodextrin (HP-β-CyD) (114115) The intravenous administration of flurbiprofen in HP-β-CyD led to transient higher tissue concentrations in rats (114) Alterations in tissue distribution were also found for other drugs injected as cyclodextrin complexes either free in solution (116117) or included into liposomes (118) Following iv dosing in HP-β-CyD a higher amount of carbamazepine appeared in the urine compared to oral preparations (122) A similar trend was observed in dogs treated iv with either dexamethasone formulated in HP-β-CyD or as its phosphate prodrug (123) In addition cyclodextrins interacts with endogenous lipids such as lipoproteins (119120) and cholesterol (113121)
153 Tween 80
As mentioned above for CEL lipoprotein alteration induced by Tween 80 was observed (80) However this effect was not confirmed in a further study (85) In patients receiving Tween 80 co-administered with etoposide an increase of the volume of distribution and the clearance of doxorubicin was detected due to reduced plasma concentrations of doxorubicin during the early phase of the concentration-time profile (124) Lately changes in the bloodplasma ratio of paclitaxel were described in the presence of Tween 80 and other solubilizers structurally related to Tween 80 (97) More recently it was shown that Tween 80 has a concentration-dependent influence on the normal binding of docetaxel to serum proteins leading to changes in pharmacokinetics of docetaxel in vivo (125) although Tween 80 is
11
degradated rapidly by esterases in plasma (126) The mechanistic basis for altered plasma binding of docetaxel in the presence of Tween 80 still needs to be clarified
154 Other excipients
To date little is reported in the literature about the impact of Solutol HS 15 and Poloxamer 188 on blood distribution of drugs An interference between Solutol HS 15 and the co-administered ketochlorin photosensitizer C8KC was suggested by Woodburn (127) The similar half-lives of Solutol HS 15 and the sensitizer found in mice indicate the correlation of the persistence of C8KC in plasma with that of the vehicle Further recent plasma protein binding interaction studies demonstrated an apparent increase in the unbound fraction of propranolol in combination with Poloxamer 188 (128) Also the administration of compounds formulated in mixed micelles can alter the protein binding (129) Most notably compounds binding with high affinity but low capacity to α1-acid glycoprotein showed free fractions increased by 50 to 85 Moreover blood protein interactions can occur with dosing vehicles like liposomes (130) thereby affecting maybe the fate of co-administered drugs in blood and body (131)
155 Nanoparticles
Methyl methacrylate nanoparticles of 130 nm in size suspended in different concentrations (01-5) of Tween 80 or poloxamine 908 exhibited prolonged circulation time with altered tissue concentrations as compared to uncoated nanoparticles (132) Extended blood circulation time was also found for polystyrene nanoparticels (40-137 nm) coated with poloxamer 407 (133)
12
16 Objectives and specific aims
The main purpose of this thesis was to investigate in vitro drug-excipient interactions in blood and to assess the implications of the in vitro findings both for the in vivo situation and the formulation strategy Compounds in drug development at Novartis were chosen as model substances and dosed at concentrations ranging from sub-therapeutic to low pharmacological levels Excipients commonly used in formulations were selected including CEL HP-β-CyD Solutol PEG 200 and TPGS The following specific aims of the thesis were 1 To collect and use available compound information including physicochemical
properties and pharmacokinetics to select appropriate model substances with as many different properties as possible
2 To determine the hemolytic activity of selected excipients to rule out any changes of blood distribution caused by hemolysis
3 To explore in vitro possible effects of selected excipients in the blood with special emphasis on the blood distribution and plasma protein binding of model compounds
4 To identify the pharmacokinetic profile and tissue distribution of model compounds following single intravenous dosing in the presence and absence of selected excipients
5 To compare and relate pharmacokinetic outcomes to the in vitro findings thereby assessing the impact of in vitro data for the in vivo situation and evaluating the in vitro-in vivo correlation
6 To generate criteria for optimizing delivery vehicle selection in drug research that allow reducing drug-excipient interactions and leading to more rational and selective drug formulations
7 To propose an intravenous formulation strategy based on the data generated by this research project to provide better candidate-tailored formulations in drug development
13
2 Selection and experimental procedure
21 Excipients and model compounds
Investigations involved five excipients along with five pharmacologically active compounds exhibiting different properties
The excipients CEL HP-β-CyD Solutol and PEG 200 were selected based upon their common use in intravenous formulations and their diversity of molecular structure and solubilization technique (Figure 2-1 and Table 2-1) CEL and Solutol are surface-active agents which increase the drug solubility by incorporation of the drug into a micellar structure Whereas CEL exhibit a highly variable composition with the major hydrophobic component (~87) identified as oxyethylated triglycerides of ricinoleic acid (Figure 2-1) Solutol consists of ~70 lipophilic polyglycol mono- and di-esters of 12-hydroxystearic acid and ~30 hydrophilic polyethylene glycol HP-β-CyD is a cyclic (α-14)-linked oligosaccharide containing seven α-D-gluco-pyranose units (Figure 2-1) which form a relatively hydrophobic central cavity and a hydrophilic outer surface The inclusion of a drug within the inner core of the complexing agent and the interaction of the outer core with water render the complex soluble PEG 200 is often used as a cosolvent for improving solubility of preclinical compounds by interrupting the hydrogen structure of water (eg water exclusion) and lowering the dielectric constant of the solution Although TPGS is exclusively known in oral formulations it was chosen due to its chemical structure (benzyl ring) and drug interaction potential at the level of active transporters and metabolizing enzyme systems
Cremophor EL
H2C(CH
2CH
2O)xOCO(CH
2)7CH CHCH
2CHOH(CH
2)5CH
3
HC(CH2CH
2O)yOCO(CH
2)7CH CHCHCH
2CHOH(CH
2)5CH
3
H2C(CH
2CH
2O)zOCO(CH
2)7CH CHCH
2CHOH(CH
2)5CH
3
primary constituent with x + y + z ~35
Solutol HS 15
CH3
(CH2)5
CH (CH2)10
C O CH2
CH2
OHn
OH O
Polyethylene glycol 200
O
HOH
n
Hydroxypropyl-β-cyclodextrin
O
ROCH2
O
ROOH
n
glucopyranose with R=CH2CH2OH or H and n=7
Vitamin E TPGS
O
O C CH2
CH2
C O
O O
CH3
CH3
OH n
CH3
CH3
CH (CH2)3
CH3
CH (CH2)3
CH(CH2)3
n=20-22
Figure 2-1 Chemical structures of selected excipients
14
Table 2-1 Properties of selected excipients
Excipient name Type Solubilization Use in iv Biological activity
approach formulation
Cremophor EL Non-ionic Micelles Yes bull Dyslipidaemia (polyoxyethylene surfactant (developmental bull Inhibition of active castor oil derivatives) amp commercial) transporters MW ~3000 CMC ge009 mgmL Hydroxypropyl-β- Oligomeric Complexation Yes bull Lipid interactions cyclodextrin substance (developmental MW ~1600 amp commercial) Solutol HS 15 Non-ionic Micelles Yes bull Dyslipidaemia (polyethyleneglycol 660 surfactant (developmental bull Inhibition of active 12-hydroxystearate) amp commercial) transporters MW 960 bull Inhibition of cyto- CMC ge02 mgmL chrome enzymes Polyethylene glycol 200 Oligomeric Cosolvent Yes MW ~200 substance (change of (developmental solution amp commercial) polarity) Vitamin E TPGS Non-ionic Micelles No bull Inhibition of active (D-α-tocopheryl surfactant (oral use transporters polyethylene glycol 1000 developmental bull Inhibition of cyto- succinate) amp commercial) chrome enzymes MW ~1513 CMC ge02 mgmL CMC Critical micelle concentration MW Molecular weight Higher molecular weight PEGs such as PEG 300 and 400
Drug candidates in development at Novartis were chosen as model compounds
regarding aqueous solubility lipophilicity membrane permeability and blood cellplasma distribution (Figure 2-2 and Table 2-2) COM2 and COM1 (base) are lipophilic and poorly water-soluble PET ligands which are used in sub-therapeutic doses and COM2 distributes equally between plasma and whole blood COM3 is much better water-soluble and is mainly located in the cellular fraction in blood In contrast COM4 with a low lipophilicity penetrates hardly into blood cells and distributes poorly into tissues COM5 is a bigger molecule characterized by a high polar surface area many H-bond acceptors and a very low volume of distribution similar to that obtained for COM4
COM1 COM2 COM3 COM4 COM5
N
N
O
R1
R2
O
N
O
N
N
S
R1
R2
N
O
N
R
NN
R2
R1
N
NO
S O
NH
O
O
NH
OR1
R2
R3
Figure 2-2 Chemical structures of model compounds
15
Table 2-2 Properties of model compounds
Physicochemical (PC) and pharmacokinetic (PK) data available at the time of selecting model compounds for investigating drug-excipient interactions in blood
COM1 COM2 COM3 COM4 COM5
PET ligand PET ligand NCE NCE NCE
PC properties MW (gmol) 240 410 295 lt400 533 LogD 68 34 45 23 17 37 pKa 38 57 41 87 32 46 106 H2O solubility pH 68 (mgL) 20 lt25 4000 lt500 100 PSA (Aring2) 35 50 25 63 166 H-bond acceptors 3 5 3 4 12 H-bond donors 0 0 0 1 3 PK properties Species Mouse Rat Rat Rat In vitro Fraction in plasma () 45 20 ~100 80 Free in plasma () 12 24 11 In vivo Matrix Blood Blood Plasma Plasma t12 (h) 11 11 10 04 CL (mLminkg) 10 142 04 72 Vss (Lkg) 14 10 03 03 funchanged () 49 14 98 94 Main selection criteria bull Active bull Active bull Blood bull Blood bull MW principle principle distribution distribution bull Polarity bull H2O sol bull H2O sol bull Vss bull Vss (base) bull Lipophilicity funchanged Fraction of unchanged drug based on AUC ratio of parent drug and total radioactivity LogD Logarithm of octanol-water distribution coefficient MW Molecular weight NCE New chemical entity pKa Negative logarithm of dissociation constant PSA Polar surface area CL Drug clearance t12 Main elimination half-life Vss Volume of distribution under steady-state conditions
22 Experimental setup
The effect of excipients on pharmacokinetic parameters was examined in rats except for COM2 which was investigated in mice due to available animal models appropriate to analyze drug target interactions if required Model compounds were used in their clinically relevant blood range as follows sub-therapeutic (lt5 ngmL) for COM1 and COM2 low-therapeutic (5-50 ngmL) for COM3 and therapeutic (gt50 ngmL) for COM4 and COM5 because of low distribution volumes to assure detectable tissue concentrations To allow in vitro and in vivo study comparisons the amount of excipient in blood was set at ~05 which is within the range after an iv bolus injection in mice and rats
Blood distribution and protein binding studies were done in vitro using model compounds in the appropriate concentration range with and without selected excipients fixed at 05 in the test system Since COM4 is almost completely located in the plasma fraction in blood (FP ~100) independent of the concentration (10-10rsquo000 ngmL) (149) the concentration of COM4 was kept constant (100 ngmL) whereas the excipient amount was varied between 001-1 Compounds formulated as excipient-free solution in glucose 5 or saline served as reference The excipient with the most prominent effect compared to the reference was selected for the in vivo
16
study where animals received intravenously a single dose as a control formulation or solution containing the selected excipient Control formulation were based on glucose 5 (COM1 COM3) saline (COM4 COM5) or blank plasma (COM2) To assure a fast and complete solubility of COM3 and COM5 in the control formulation convenient excipients were added with in vitro binding parameters similar to those obtained for the in vitro reference The concentration of model compounds in blood plasma and tissue were measured until 1 h after iv administration thereby including the scanning time of PET ligands Moreover it is assumed if excipient-induced changes occur they should be detectable in this time period
17
3 Materials and methods
31 Chemicals
COM1 and COM2 were supplied by the Neuroscience Research Department of Novartis (Basel Switzerland) COM3 was obtained from the Novartis Institutes for BioMedical Research (Basel Switzerland) 3H-radiolabeled COM1 (specific activity 11780 MBqmg gt99) COM2 (specific activity 2320 MBqmg gt98) and COM3 (base specific activity 311 MBqmg gt98) were provided by the Isotope Laboratories of Novartis (Basel Switzerland) 14C-radiolabeled COM3 used for investigation of renal excretion (2middotHCl salt specific activity 587 MBqmg gt98) COM4 (specific activity 585 MBqmg gt98) and COM5 (specific activity 33 MBqmg gt98) were provided by the Isotope Laboratories of Novartis (Basel Switzerland)
The excipients purchased by the Pharmaceutical and Analytical Development Department of Novartis (Basel Switzerland) were Cremophor EL (CEL BASF) hydroxypropyl-β-cyclodextrin (HP-β-CyD CERESTAR USA Inc) polyethylene glycol 200 (PEG 200 Fluka) Solutol HS 15 (Solutol BASF) and D-α-tocopheryl polyethylene glycol 1000 succinate (TPGS Eastman) All other chemicals and reagents were of analytical grade or will be described separately in the methods section
32 Blood and plasma sources
Fresh blood was obtained from healthy male species (nge3) as follows mice (albino OF1 Charles River Laboratories LrsquoArbresle France) rats (Wistar HAN IGS Charles River Laboratories Sulzfeld Germany) dogs (Marshall beagles Marshall Farm NY USA and Harlan France SARL Gannat France) and humans (drug-free blood donors Blutspendezentrum SRK Basel Switzerland) Pooled plasma (nge3) was defrosted from storage at -20degC Lithium heparin was used as an anticoagulant for all species
33 In vitro studies
Test compounds in the in vitro samples excluding protein binding samples of COM2 were quantified by LSC due to no major degradation (gt95) under investigated conditions (146147148149150) Protein binding samples of COM2 were quantified by LC-RID due to instability after longer incubation (gt2 h) and very low fraction unbound in plasma (lt2)
331 Preparation of test solutions
For in vitro blood distribution and protein binding studies test solutions were prepared by dissolving the radiolabeled test compound in ethanol Ethanol was evaporated and the residue was reconstituted in the appropriate formulation namely excipient-free solution as control (saline or glucose 5) and solutions containing CELEtOH 6535 (vv) CEL HP-β-CyD Solutol PEG 200 and TPGS Final compound concentrations in blood or plasma were 006-6 ngmL (COM1) 001-100 ngmL (COM2) 5-500 ngmL (COM3) 100 ngmL (COM4) and
18
10-300 ngmL (COM5) Excipient concentrations were kept constant at 05 in the test system except for COM1 (05-5 due to no alterations at 05) and COM4 (001-1 due to its plasma fraction see 22)
332 Hemolytic activity
The hemolytic activity of the excipients was assayed using a spectrophotometric method CELEtOH 6535 (vv) EtOH HP-β-CyD PEG 200 Solutol and TPGS were added to the appropriate volume of freshly prepared heparinised whole blood to obtain a final excipient concentration of 05 To avoid hemolysis due to higher concentrations during the adding the blood was partially centrifuged and the excipient was pipetted in the cell-free layer By tapping the test tubes the samples were immediately mixed Two control tubes were prepared one for spontaneous hemolysis (pure blood used as the reaction blank) and another for 100 hemolysis (total cell lysis induced by sodium dodecyl sulfate at a final blood concentration of 1) Samples were incubated at 37degC At certain points of time aliquots were removed and centrifuged for 10 min at 3100 x g (37degC) to obtain plasma The absorbance of hemoglobin in the supernatant (dilution with water 1200) was measured at 405 nm (Emax precision microplate reader Bucher Biotech Basel Switzerland) The degree of hemolysis due to the excipient activity was calculated according to
100()0100
0times
minus
minus
=
AA
AAHemoylsis e
where Ae is the absorbance of hemoglobin in the supernatant after incubation with excipient A0 is the absorbance of hemoglobin in the supernatant of the reaction blank and A100 is the absorbance of hemoglobin in the supernatant after total cell lysis with sodium dodecyl sulfate Hemolytic activity was considered to have started when mean values were greater than 2 of hemolysis
333 Blood distribution
Freshly prepared heparinised blood was used and experiments were performed in triplicate both in the presence and absence of excipients The hematocrit was determined using a hematocrit centrifuge and a hematocrit reader (Haemofuge Heraeus Sepatech Germany) In order to reduce hemolysis blood aliquots (1 mL) were partially centrifuged (500 x g for 2 min) before adding the test solution in the cell-free layer followed by mixing immediately Samples were incubated at 37degC Time aliquots (1 mL) were removed and prepared for measuring radioactivity of the test compound in whole blood before centrifugation and in plasma after centrifugation for 10 min at 3100 x g (37degC) by LSC
The fraction of the test compound in plasma (FP) was calculated according to
100)1(
() times
minustimes
=
B
P
PC
HCF
where CB and CP are the drug concentration in blood and plasma respectively and H is the hematocrit value The concentration in blood cells (CBC) was calculated as follows
19
H
HCCC PB
BC
)1( minustimesminus=
and used for calculations of blood cell to plasma concentration ratio (BCPR CBCCP) and blood cell to unbound in plasma concentration ratio (ρ CBC(CPfu)) fu is the drug fraction unbound in plasma determined by the appropriate protein binding method for each compound
334 Plasma protein binding
Control experiments in phosphate buffered saline (PBS Gibco Paisley Scotland) were carried out to assess the suitability of the methods described below for each test compound in the following order ultrafiltration gt dialysis gt ultracentrifugation with ultrafiltration being the first procedure Control experiments indicated that ultrafiltration is a suitable method for COM1 COM3 COM4 and COM5 (free-permeation gt075 recovery gt85) and ultracentrifugation for COM2 (no sedimentation after 6-h centrifugation recovery gt85 ultrafiltration and dialysis showed insufficient recovery and free-permeation) Therefore protein binding was determined by the ultrafiltration technique (COM1 COM3 COM4 and COM5) or the ultracentrifugation technique (COM2)
Ultrafiltration
Samples of spiked plasma were incubated at 37degC until binding equilibrium Aliquots of 1 mL were introduced in prewarmed (37degC) Centrifree micropartition tubes (Amicon Inc Beverly MA USA) and centrifuged for 10 min at 2000 x g (37degC) For the determination of the unbound drug fraction in plasma concentrations of the test compound in ultrafiltrate and plasma were measured The unbound fraction in plasma (fu) was calculated as follows fu()=(CUFCP)x100 where CUF and CP are the drug concentration in ultrafiltrate and in plasma respectively
Equilibrium dialysis
Test solution was added to plasma followed by mixing Dialysis was carried out with 150 microL of this sample against an equal volume of phosphate-buffered saline (pH 72) in a 96-well micro-equilibrium dialysis block (HTDialysis LLC Gales Ferry CT USA) Dialysis membranes with a 12000-14000 molecular weight cut-off were soaked in phosphate buffered saline (pH 72) before use After establishment of the equilibrium buffer solution aliquots containing only unbound drug and plasma aliquots containing both bound and unbound drug were analyzed for the test compound The ratio of drug concentrations measured in the buffer and plasma after dialysis was taken as an estimate of unbound drug fraction in plasma
Ultracentrifugation
Samples of spiked plasma were incubated at 37degC until binding equilibrium Aliquots of 1 mL were transferred to polycarbonate centrifuge tubes (Beckman) and either centrifuged in a TLA 1002 rotor in Beckman TL 100 centrifuge (200000 x g 6 h 37degC) or incubated for 6 h (37degC) After centrifugation samples were separated into three layers according to density A 80-microL aliquot of the middle layer (protein-free partplasma water) was taken and analyzed for the test compound representing the unbound concentration in plasma (CU) Total plasma concentration (CP) was
20
determined in incubated samples The unbound drug fraction in plasma was calculated using CUCP
Determination of major binding protein
The affinity of test compounds to different plasma proteins was determined using the appropriate method for each compound Purified human plasma proteins were dissolved in phosphate buffered saline (PBS Gibco Paisley Scotland) at physiological concentrations as follows albumin 40 gL (ge96 Sigma) α-acid glycoprotein 1 gL (from Cohn Fraction VI 99 Sigma) γ-globulins 12 gL (from Cohn Fraction II and III Sigma) high density lipoprotein 39 gL (gt95 Calbiochem) low density lipoprotein 36 gL (gt95 Calbiochem) and very low density lipoprotein 13 gL (gt95 Calbiochem) Test solution was added to protein solutions to obtain a compound concentration of 10 ngmL (COM1 COM2) or 1000 ngmL (COM3 COM4 COM5) After incubation at 37degC separation of bound and unbound compound was achieved according methods Ultrafiltration was performed by centrifugation for 10 min for samples containing albumin and γ-globulins and for 2 min for all other samples
335 Determination of protein concentration
Protein concentration was measured by the method of Bradford (Coomassie blue protein assay) at 595 nm by using a Bio-Rad protein assay (Bio-Rad Laboratories Muumlnchen Germany) The protein concentration was determined by using a calibration curve that was established with known concentrations of human serum albumin (ge96 Sigma) ranging from 0 to 05 mgmL 10-microL aliquots of plasma (1200 dilution) and plasma water were pipetted into microtiter plate wells 200 microL dye reagent were added and samples were mixed After 1-h incubation at room temperature absorbance was measured
34 In vivo studies
Samples collected after intravenous administration of COM1 COM2 and COM3 were assayed for radioactivity by LSC and parent drug by LC-RID COM4 and COM5 were quantified in all in vivo samples only by radioactivity measurements (LSC) since the radioactivity of both radiolabeled compounds reflects well the parent drug due to no major degradation at 1 h after intravenous administration in rats (151152)
341 Experimental animals
Male Wistar rats (~250 g) and male OF1 mice (~30 g) were obtained from Charles River (Sulzfeld Germany) All animals were housed in standard cages in a controlled environment maintained on an automatic 12-h lighting cycle at a temperature of 22degC according to institutional guidelines The animals were given a standard chow and water ad libitum The animals were used after having been starved overnight
342 Drug administration and sample collection
All dosing solutions were prepared within 1 h prior to injection and stored at room temperature until use Administration was performed by a single bolus injection into the femoral vein after animals had been lightly anesthetized by isoflurane (Forenereg) Rats received [3H]COM1 at 4 microgkg as solution (1 mLkg) in glucose 5 containing
21
ethanol 1 (vv) or TPGS 20 (wv) Mice were injected a dose of 400 ngkg of [3H]COM2 formulated as solution (5 mLkg) in blank plasma (obtained by centrifugation of freshly drawn mouse blood) or in glucose 5 containing TPGS 10 (wv) An iv dose of 1 micromolkg radiolabeled COM3 (3H 300 microgkg 14C 370 microgkg) in EtOHPEG200Glu 5590 (vvv) or 40 HP-β-CyD (wv) was injected to rats (1 mLkg) [14C]COM4 was administered at 400 microgkg in saline or 17 CEL (vv) to rats (2 mLkg) [14C]COM5 at 1 mgkg in saline containing either ethanol 10 (vv) or 17 Solutol (wv) were injected to rats (2 mLkg)
Using these injection preparations excipient concentrations in blood may be estimated as about 03 (COM1) 05 (COM3 COM4 COM5) and 07 (COM2) in animals (~70 mL bloodkg) These concentrations were similar to those used in the in vitro experiments
Samples were collected after drug administration at 008 025 and 05 h for COM1 and at 008 025 05 and 1 h for COM2 COM3 COM4 and COM5 Animals (n=3 per time point) were sacrificed by isoflurane inhalation for sample collection Blood samples were collected from the vena cava and transferred into tubes containing heparin (heparin-Na BBraun) as anticoagulant Plasma samples were obtained by immediate centrifugation of blood samples at 3000 x g for 10 min Tissues were excised blotted dry and weighed Collected tissue comprised lung heart liver kidney fat muscle skin and brain for COM1 COM2 COM3 and lung muscle and skin for COM4 and brain muscle and skin for COM5 All samples were immediately frozen and stored at -20degC until analysis Tissue samples were homogenized before quantification
343 Bladder catheterization and urine collection
The experiment was performed in situ under anesthetized rats Animals (n=3formulation) received im injections of ketamine hydrochloride at a dose of 50 mgkg (100 mgmL 05 mLkg) and are positioned on an isothermal heating pad prewarmed at 38degC The abdomen was opened through a mid-line incision A polyethylene tubing (Clay-Adams PE-50) was inserted into the dome of the bladder and held in place with a purse string suture The formulation was injected into the surgically exposed femoral vein and urine was collected at 05 1 15 and 2 h after dosing All samples were frozen and stored at -20degC until analysis
344 Ex vivo protein binding
Ex vivo protein binding was determined for COM1 COM3 COM4 and COM5 according to the in vitro procedure Briefly remaining plasma samples of each time point were pooled and the unbound drug concentration in plasma was quantified using the ultrafiltration technique (see 334) After centrifugation plasma and ultrafiltrate samples were assayed for radioactivity by LSC and parent drug by LC-RID
35 Measurement of the radioactivity
Aliquots of blood plasma urine (25-50 microL) and homogenates (250 microL) were introduced into counting vials and solubilized in Biolute-S (Zinsser Analytic) Samples obtained from in vivo studies containing tritium-labeled drug were dried and the residue was reconstituted in water before solubilization To the blood samples
22
hydrogen peroxide 30 was additionally added and vials were gently swirled for several seconds and let stand for 30 min After adjusting pH gt7 by addition of hydrochloric acid 2 N the vials were filled with scintillation cocktail (Irgasafe Plus Zinsser Analytic) kept in the dark for 16 h and measured in a Tri-Carb liquid scintillation spectrometer Model A2200 (Packard)
36 Determination of parent drug 3H-radiolabeled COM1 COM2 and COM3 were determined by a liquid
chromatography-reverse isotope dilution method (LC-RID) A sample aliquot (100-500 microL) and 200 microL water containing 5 microg (COM1 COM3) or 2 microg (COM2) non-radiolabeled test compound as internal standard was added to a glass tube After further addition of 1 mL water 100 microL Titrisol buffer (pH 4 COM1 COM2 pH 7 COM3) and 4 mL diethyl ether (COM1 COM2) or tert-butylmethylether (COM3) tubes were shaken for 30 min and centrifuged (3300 x g for 10 min) The organic layer was collected in another glass tube and evaporated in a vacuum centrifuge (Univapo 150H UniEquip Martinsried Germany) The residue was taken up in 250 microL of mobile phase-water (8020 vv) and 75 microL n-hexane and the mixture was transferred in an auto sampler glass vial After centrifugation (13000 x g for 2 min) the hexane layer was discarded and 200 microL of the remainder was injected into the HPLC system equipped with a Supelcosil LC-18 column (5 microm 46 mm x 150 mm) for COM1 or Waters XTerra RP 8 column (5 microm 39 x 150 mm) for COM2 and COM3 The column temperature was 40degC and the absorbance was detected at a wavelength of 312 nm (COM1) 441 nm (COM2) or 261 nm (COM3) The mobile phase (isocratic gradient) consisted of ammonium acetate 10 mM-acetonitrile (4555 COM1 5050 COM2) or ammonium acetate 10 mM-triethylamine 01 in acetonitrile (5842 COM3) and was pumped at a rate of 10 mLmin The peak corresponding to the unchanged compound was collected in a polyethylene vial by a fraction collector (Pharmacia LKB SuperFrac) and analyzed for radioactivity Concentrations of the test compound in samples were calculated from the ratio of the amount of radioactivity in the eluted fraction and the area of the absorbance of the non-radiolabeled test compound used as internal standard
37 Data analysis
Total radioactivity concentrations expressed as ng-eqmL or ng-eqg were estimated by dividing the radioactivity concentration in samples by the specific radioactivity of administered test compound using Microsoft Excel Concentrations of parent drug were determined by the principle of reverse isotope dilution using following equation in Microsoft Excel
ID
AD
IS
AS
A
A
A
A=
where AAS is the amount of analyte in the sample (unknown to be determined) AIS is the amount of internal standard added to the sample AAD is the amount of analyte detected and AID is the amount of internal standard detected AAD was calculated using R(SRxS) where R is the amount of radioactivity determined in the peak fraction SR is the specific radioactivity and S is the slope The amount of internal standard detected was calculated as AID=AreaRF-AAD where RF is the response factor (Areang) The level of quantification (LOQ) was set to 75 dpm LOQs of
23
radioactivity and test compound in blood plasma urine and tissues were calculated by dividing 75 dpm by the specific radioactivity of the administered test compound and by the sample amount P values were calculated with a two-sample t-test in Microsoft Excel assuming unequal variances The level of significance was set at P lt005
38 Pharmacokinetic analysis
Pharmacokinetic parameters were estimated as follows The area under the drug concentration-time curve (AUC) was determined by the linear trapezoidal rule using the mean data points The half-life (t12) was calculated using ln2k where k is the rate constant k was estimated by the slope of the regression line plotted through the three final data points of the semilogarithmic AUC taking into consideration a square of correlation coefficient of RSQ gt090 Volume of distribution (V0) was calculated by dividing the dose by the concentration at time zero (C0) C0 was obtained by extrapolation to zero time of the concentration-time plot in semilogarithmic scale
24
4 Results and discussions
41 Hemolytic activity of excipients
In vitro results
CELEtOH 6535 EtOH HP-β-CyD PEG 200 and Solutol did not induce hemolysis in dog and human blood at 05 and a contact time of 4 h (data not shown) In contrast TPGS at 05 incubated with blood of various species caused hemolysis in a time-dependent manner (Figure 4-1) Erythrocytes from rat and human were more sensitive than those of mouse and dog indicated by cell lysis at shorter contact times Reducing the TPGS concentration from 05 to 01 induced no hemolysis in all four species in the investigated time range (data not shown)
010
2030
4050
6070
1 h 2 h 4 h 6 h
Incubation time
Hem
oly
sis
(
)
Rat
Mouse
Dog
Human
Figure 4-1 Effect of incubation time on the hemolytic activity of TPGS
Induced hemolysis by 05 TPGS in blood of various species (n=3 mean plusmn SD) Hemolysis in rat blood after 6-h incubation was not determined
Discussion
Except for TPGS all tested excipients (CEL EtOH HP-β-CyD Solutol and PEG 200) were non-hemolytic which is consistent with data reported in the literature (134135136137138) and the fact that they are widely used in commercially available parenteralia (54) TPGS at 05 exhibited marked hemolysis after longer contact time (gt1 h) whereas TPGS at 01 showed no hemolysis under equal incubation conditions The detected hemolysis might possibly result not mainly from TPGS but from metabolites namely α-tocopheryl succinate and polyethylene glycols both being able to destruct erythrocytes (134139140) This phenomena could contribute to the extensively delayed onset of hemolysis For the investigations TPGS at 05 was used in the non-hemolytic time range
25
42 Impact of the hematocrit on blood partition parameters
In vitro results
Whole blood derived from three species was incubated with COM2 (100 ngmL) at varying hematocrit values Concentrations of COM2 in blood and plasma were measured at equilibrium and partition parameters calculated from these data are summarized in Table 4-1 Concentrations in blood plasma and blood cells remained unaffected by the hematocrit value (040-060) The partition parameter BPR was also similar over the investigated hematocrit range whereas BCPR changed slightly and FP distinctly both decreasing by increasing the hematocrit from 040 to 060
Table 4-1 Effect of hematocrit on the in vitro blood distribution of COM2
Blood cell concentrations and partition parameters (FP BPR and BCPR) derived from [3H]COM2 concentrations measured in blood and plasma using same blood pools at different hematocrit values (n=3 mean plusmn SD)
Species Hematocrit Concentration (ngmL) FP BPR BCPR
Blood Plasma Blood cells () Mouse 040 50 plusmn 1 121 plusmn 003 152 plusmn 007 045 46 plusmn 2 120 plusmn 006 144 plusmn 013 050 101 plusmn 3 87 plusmn 4 116 plusmn 8 43 plusmn 0 116 plusmn 001 132 plusmn 001 055 40 plusmn 1 113 plusmn 004 123 plusmn 006 060 36 plusmn 1 112 plusmn 003 119 plusmn 005 Dog 040 48 plusmn 2 126 plusmn 006 166 plusmn 014 045 44 plusmn 1 125 plusmn 004 157 plusmn 009 050 109 plusmn 4 90 plusmn 2 131 plusmn 15 41 plusmn 1 125 plusmn 003 151 plusmn 005 055 38 plusmn 1 119 plusmn 003 135 plusmn 006 060 35 plusmn 1 113 plusmn 002 122 plusmn 003 Human 040 70 plusmn 3 086 plusmn 003 066 plusmn 008 045 65 plusmn 2 084 plusmn 003 065 plusmn 007 050 101 plusmn 5 125 plusmn 10 78 plusmn 6 63 plusmn 2 080 plusmn 003 060 plusmn 006 055 55 plusmn 2 082 plusmn 003 068 plusmn 006 060 55 plusmn 1 073 plusmn 002 055 plusmn 003
Discussion
The in vitro method for investigating distribution of drugs in blood commonly uses whole blood freshly prepared and pooled Drug concentrations in blood and plasma are determined Based on these data further partition parameters including CBC FP BPR and BCPR can be estimated but they are partially dependent on the hematocrit Therefore it is important to know how the hematocrit affects these parameters thereby providing useful information for comparing results With this in mind present experiments were performed over the entire physiological hematocrit range in blood pools of three different species (mouse dog and human) COM2 was used as test compound due to sufficient availability
The rank order of hematocrit influences was FP gt BCPR gt BPR gt CB asymp CP asymp CBC with most pronounced changes for FP and none for CBCPCBC Parameters calculated from concentrations measured in samples decreased constantly with increasing the hematocrit (040-060) which was most distinct for FP But within a hematocrit variation of 005 none of the parameters was dependent on the
26
hematocrit Consequently blood partition data obtained from in vitro experiments with similar hematocrits are consistent and can be compared together For data comparison across studies hematocrit adjusting to values of previous studies is suggested taking into consideration a difference of le005 between the lowest and highest value
43 Major binding proteins of model compounds
In vitro results
Figure 4-2 illustrates the qualitative binding of model compounds to isolated proteins compared to the total fraction bound in plasma The following ranking was obtained with regard to decreasing order of protein binding
COM1 albumin gt α1-acid glycoprotein gt γ-globulins asymp lipoproteins COM2 albumin gt lipoproteins gt γ-globulins gtgt α1-acid glycoprotein COM3 α1-acid glycoprotein gt albumin gt γ-globulins gtgt lipoproteins COM4 albumin gt α1-acid glycoprotein gtgt γ-globulins asymp lipoproteins COM5 albumin asymp α1-acid glycoprotein gtgt γ-globulins asymp lipoproteins
0
10
20
30
40
50
60
70
80
90
100
COM1 COM2 COM3 COM4 COM5
Bo
un
d f
racti
on
(
)
Plasma Albumin AGP γ-globulins HDL LDL VLDL
Figure 4-2 Qualitative differences in protein binding patterns of model compounds in vitro
Total protein-bound fraction of compounds in human plasma compared to the qualitative extent of compound binding to various isolated human proteins (albumin AGP γ-globulins and lipoproteins such as HDL LDL and VLDL) Each bar represents mean plusmn SD (n=3)
Discussion
In vitro experiments showed the binding of model compounds with different degrees to the three major drug-binding proteins in plasma (albumin α1-acid glycoprotein lipoproteins) A high binding to albumin (A) and α1-acid glycoprotein (AGP) was found for COM1 and COM4 (AgtAGP) COM5 (AasympAGP) and COM3 (AltAGP) In contrast COM2 was highly bound to albumin and lipoproteins
27
44 The impact of Vitamin E TPGS on COM1 in rat
In vitro results
The equilibrium of COM1 between plasma and blood cells was reached within few minutes (lt5 min data not shown) and the fraction of COM1 distributed in plasma (~75) was independent of initial blood concentrations of COM1 (006-6 ngmL) and of excipients at 05 (Table 4-2) Enhancing the excipient concentration to 5 in blood resulted in decreased COM1 in blood cells especially in the presence of TPGS (Table 4-2) In plasma COM1 was highly protein bound with high contribution of albumin and α1-acid glycoprotein in binding (Figure 4-2) and a lower free fraction was found for COM1 in TPGS at 5 (Table 4-2) TPGS was taken for the in vivo study due to the most pronounced changes observed in the in vitro experiments
Table 4-2 Effect of excipients on blood distribution and protein binding of COM1 in vitro
Partition parameters of [3H]COM1 at 006-6 ngmL obtained at equilibrium after incubation with and without excipients in rat blood (pH 74 H 046 plusmn 003 n ge3 mean plusmn SD)
Excipient FP BPR BCPR fu ρ
() () ()
None 728 plusmn 22 071 plusmn 002 041 plusmn 004 41 plusmn 02 99 plusmn 1 HP-β-CyD 05 798 plusmn 17 065 plusmn 001 027 plusmn 002 nd nd 5 882 plusmn 24 063 plusmn 002 017 plusmn 004 nd nd Solutol 05 702 plusmn 24 073 plusmn 001 043 plusmn 001 nd nd 5 878 plusmn 23 064 plusmn 001 018 plusmn 002 nd nd TPGS 05 802 plusmn 24 064 plusmn 001 026 plusmn 001 39 plusmn 07 66 plusmn 03 5 956 plusmn 20 063 plusmn 001 008 plusmn 003 17 plusmn 03 53 plusmn 15
In vivo results
In contrast to the control group where a dose of 4 microgkg was applied COM1 was administered in the TPGS group at 27 microgkg due to little compound availability Data presented within this section are normalized to a dose of 1 microgkg
Independent of the formulation plasma levels declined very rapidly with an apparent half-life of 017 h and COM1 was rapidly metabolized (lt30 unchanged COM1 in plasma at 008 h post-dose) Metabolites were fast eliminated from body indicated by a low recovery of administered COM1 shortly after dosing (lt30 of administered dose recovered at 008 h post-dose)
Upon intravenous administration of COM1 as a TPGS-containing solution lower total plasma concentrations combined with an increase of COM1 unbound in plasma by 50 were found in contrast to the control group (Table 4-3 Figure 4-3) However free drug concentrations in plasma did not differ between both groups resulting in similar AUCs (Table 4-3) This is in line with identical tissue concentrations observed in both groups (data not shown) since only the unbound drug is supposed to pass across membranes Furthermore COM1 in TPGS led to a lower fraction of parent drug in plasma (funchanged Table 4-3) and higher metabolite-related concentrations in plasma (2-fold increase Figure 4-3) indicating alterations in the kinetic profile of metabolites
28
Table 4-3 Comparative plasma kinetics of COM1 with and without TPGS
Plasma concentrations and pharmacokinetic parameters of [3H]COM1 administered intravenously in formulations based on glucose 5 (control) or TPGS 20 to rats (LOQ=2 pgmL n=3 mean plusmn SD) Data are normalized to a dose of 1 microgkg AUC(u)008-05h relates to area under unbound drug plasma concentration-time curve
Time Control TPGS
(h) COM1 in plasma (pgmL) Percentage of control value
008 184 plusmn 77 110 plusmn 6 60 025 59 plusmn 13 39 plusmn 6 66 05 32 plusmn 11 20 plusmn 6 62 C0 (pgmL) 215 132 AUC008-05h (pgmiddotmL
-1middoth) 32 20
AUC(u)008-05h (pgmiddotmL-1
middoth) 067 076 t12 (h) 017 017 funchanged () 187 55 fu () 21 plusmn 01 38 plusmn 03
Parent drug Metabolites
10
100
1000
0 025 05
Time (h)
CO
M1
(p
gm
L)
100
1000
10000
0 025 05
Time (h)
Rad
ioacti
vit
y (
pg
-eq
mL
)
Figure 4-3 Influence of TPGS on the systemic exposure of COM1 and metabolites
Plasma concentration-time profiles of parent drug and metabolite-related radioactivity of [3H]COM1 after intravenous administration to rats COM1 was injected in glucose 5 (closed symbols black line) or TPGS 20 (open symbols dashed line) Data shown are normalized to a dose of 1 microgkg and symbols represent single values and lines mean values (n=3) Values of metabolite-related radioactivity were obtained by subtracting concentrations of parent drug from concentrations of total radioactivity
Discussion
Drug-excipient interaction studies showed no direct correlation between the in vitro results and the in vivo situation in rats Upon intravenous administration of COM1 in TPGS slightly lower plasma concentrations and binding to plasma proteins were observed in animals as compared to those received COM1 in a TPGS-free solution In contrast to these in vivo findings COM1 displayed in vitro no alterations in the presence of TPGS at 05 whereas a higher TPGS concentration (5) led to
29
enhanced distribution into plasma and a higher fraction bound in plasma Furthermore very rapid metabolism and elimination of COM1 under in vivo conditions contributed to a pharmacokinetic profile inappropriate for studying drug-excipient interactions
45 The impact of Vitamin E TPGS on COM2 in mouse
In vitro results
To assess whether the ultracentrifugation time could be shortened for minimizing the degradation of COM2 in plasma (147) blank plasma samples were centrifuged and time aliquots were analyzed for total protein concentrations in plasma and plasma water After 4-h centrifugation protein levels in the plasma water section were below 005 ngmL corresponding to ~01 of total plasma proteins adequate to assure a sufficient separation of plasma water and proteins Therefore samples were collected after 4-h centrifugation for analysis
COM2 (001-100 ngmL) distributed almost equally between whole blood and plasma (FP ~45) and was very highly bound to plasma proteins (gt98 mainly to albumin and lipoproteins) (Figure 4-2) The plasma fraction (63) was enhanced for COM2 in TPGS at the beginning (lt1-h incubation) followed by equalization to excipient-free incubations (Table 4-4 Figure 4-4) The presence of TPGS reduced also the free fraction in plasma by 30 (Table 4-4) Finally TPGS was selected for the in vivo study because of the most pronounced drug-excipient interactions detected in vitro
Table 4-4 Effect of excipients on blood distribution and protein binding of COM2 in vitro
Partition parameters of [3H]COM2 at 01 ngmL obtained at equilibrium after incubation with and without excipients (05) in mouse blood (pH 73 H 045 nge3 mean plusmn SD)
Excipient Time FP BPR BCPR fu ρ
(h) () ()
None 008 406 plusmn 07 136 plusmn 002 179 plusmn 005 102 plusmn 3 1 448 plusmn 24 123 plusmn 007 151 plusmn 015
176 plusmn 003 86 plusmn 8
CELEtOH 6535(vv) 008 455 plusmn 14 121 plusmn 004 146 plusmn 009 nd 1 438 plusmn 03 125 plusmn 001 157 plusmn 002
nd nd
HP-β-CyD 008 472 plusmn 14 117 plusmn 009 138 plusmn 019 nd 1 494 plusmn 16 111 plusmn 004 125 plusmn 008
nd nd
Solutol 008 468 plusmn 11 118 plusmn 003 139 plusmn 006 nd 1 472 plusmn 16 117 plusmn 004 137 plusmn 009
nd nd
PEG 200 008 425 plusmn 13 129 plusmn 004 165 plusmn 009 nd 1 418 plusmn 20 132 plusmn 006 171 plusmn 014
nd nd
TPGS 008 629 plusmn 23 087 plusmn 003 072 plusmn 007 58 plusmn 7 1 533 plusmn 07 103 plusmn 001 107 plusmn 003
122 plusmn 012 88 plusmn 3
30
(a)
00
05
10
15
008 h 1 h
BP
R(b)
00
05
10
15
20
008 h 1 h
BC
PR
(c)
0
20
40
60
80
100
008 h 1 h
ρ
Figure 4-4 TPGS-mediated alteration of COM2 distribution in blood
Blood-plasma (a) blood cell-plasma (b) and blood cell-unbound in plasma (c) concentration ratios of [3H]COM2 at 01 ngmL in the presence (white bars) and absence (black bars) of TGPS (05) after 008-h and 1-h incubation in mouse blood (pH 73 H 045 nge3 mean plusmn SD)
In vivo results
In a previous study (153) the disposition kinetics of COM2 was evaluated in mice after iv administration in a solution containing HP-β-CyD 10 (5 mLkg) To enable a comparison of former data with those in the current investigation for internal purposes only COM2 was injected at a volume of 5 mLkg dissolved in plasma or TPGS 10 The blood concentration of TPGS from this injection preparation was estimated as ~07 assuming a blood volume of 72 mLkg Thus the amount of TPGS in blood was higher in vivo compared to the amount used in vitro (05)
The administration of COM2 as TPGS-containing solution at the same dosage caused approximately 2-fold higher plasma concentrations as compared to COM2 formulated in plasma (control) (Table 4-5 Figure 4-5) These findings are in line with data obtained in blood distribution studies in vitro where partitioning into blood cells was reduced in the presence of TPGS resulting in a higher concentration in plasma at the same total blood concentration Furthermore in vivo a higher plasma exposure to metabolites and a slower elimination of metabolites from the systemic circulation were found for COM2 in TPGS indicated by 4-fold increased AUC and t12 of metabolite-related radioactivity in plasma (Table 4-6) Determination of unbound COM2 in plasma could not be performed on samples from mice due to concentrations below LOQ (3 pgmL)
No differences in tissue concentrations were observed between both groups although COM2 in TPGS resulted in a decrease of V0 (Table 4-5) and KP (Table 4-7) both suggesting altered tissue distribution and being in line with higher drug accumulation in the circulation Because the free drug fraction in plasma generally reflects more accurately distribution processes due to the ability of unbound drugs to pass through membranes and then reach the target organ the free drug fraction determined in vitro was considered Calculated tissue-unbound in plasma concentration ratios KP(u) were reduced in the TPGS group only within the first minutes after drug administration (Table 4-7)
31
Table 4-5 Comparative plasma kinetics of COM2 with and without TPGS
Plasma concentrations (a) and pharmacokinetic parameters (b) of [3H]COM2 after iv dosing at 400 ngkg in formulations based on blank plasma (control) or TPGS to mice (LOQ=3 pgmL n=3 mean plusmn SD) significantly different from the control at Plt005 and 001 respectively
(a)
Time COM2 in plasma (pgmL)
(h) Control TPGS Percentage of control value
008 104 plusmn 11 247 plusmn 23 238 025 81 plusmn 12 159 plusmn 16 196 05 59 plusmn 2 124 plusmn 17 210 1 34 plusmn 7 80 plusmn 17 235
(b)
Parameter Unit Formulation
Blank plasma TPGS 10 Body weight kg 0028 0027 Dose ng 110 107 C0 pgmL 111 237 tfrac12 h 057 061 V0 Lkg 36 17 AUC008-1h pgmiddotmL-1middoth 56 121 DoseAUC008-1h mLh 196 89 funchanged 54 35
Parent drug Metabolites
10
100
1000
0 025 05 075 1
Time (h)
CO
M2 (
pg
mL
)
10
100
1000
0 025 05 075 1
Time (h)
Rad
ioacti
vit
y (
pg
-eq
mL
)
Figure 4-5 Influence of TPGS on the systemic exposure of COM2 and metabolites
Plasma concentration-time profiles of parent drug and metabolite-related radioactivity of [3H]COM2 after intravenous administration to mice at 400 ngkg formulated in blank plasma (closed symbols black line) or as a solution containing TPGS 10 (open symbols dashed line) Symbols represent single values and lines mean values (n=3) Values of metabolite-related radioactivity were obtained by subtracting concentrations of parent drug from concentrations of total radioactivity
32
Table 4-6 Comparative plasma kinetics of metabolites of COM2 with and without TPGS
Plasma concentrations and pharmacokinetic parameters of metabolite-related radioactivity after iv administration of [3H]COM2 (400 ngkg) in blank plasma (control) or TPGS 10 to mice (n=3 mean plusmn SD) Values of metabolite-related radioactivity were obtained by subtracting concentrations of parent drug from concentrations of total radioactivity significantly different from the control at Plt001
Time Control TPGS
(h) Metabolites in plasma (pg-eqmL) Percentage of control value
008 75 plusmn 6 307 plusmn 28 408 025 67 plusmn 4 233 plusmn 9 346 05 56 plusmn 2 246 plusmn 30 441 1 29 plusmn 8 218 plusmn 31 744 AUC008-1h (pgmiddotmL
-1middoth) 49 222 453
t12 (h) 06 24 395
Table 4-7 Comparison of tissue distribution of COM2 with and without TPGS
Tissue concentrations and tissue-plasma concentration ratios (KP) of [3H]COM2 administered intravenously at 400 ngkg in blank plasma (control) or 10 TPGS solution to mice (n=3) KP(u) relates to the free compound concentration in plasma based on the free fraction determined in vitro Values represent mean plusmn SD
Time Tissue Concentration (pgg) KP KP(u)
(h) Control TPGS Control TPGS Control TPGS 008 Lung 1808 plusmn 263 1861 plusmn 64 173 plusmn 07 76 plusmn 05 981 plusmn 39 621 plusmn 42 Heart 750 plusmn 111 699 plusmn 33 72 plusmn 03 28 plusmn 01 407 plusmn 17 233 plusmn 11 Liver 2188 plusmn 355 2314 plusmn 56 209 plusmn 12 94 plusmn 09 1186 plusmn 69 773 plusmn 72 Kidney 1761 plusmn 390 1735 plusmn 84 167 plusmn 22 71 plusmn 07 951 plusmn 124 580 plusmn 59 Fat 232 plusmn 94 238 plusmn 83 22 plusmn 09 1 plusmn 03 127 plusmn 49 79 plusmn 25 Muscle 166 plusmn 40 190 plusmn 82 16 plusmn 06 08 plusmn 03 92 plusmn 32 62 plusmn 22 Brain 1095 plusmn 70 1038 plusmn 113 105 plusmn 06 42 plusmn 01 598 plusmn 35 345 plusmn 9 025 Lung 1206 plusmn 258 1277 plusmn 213 15 plusmn 26 8 plusmn 05 850 plusmn 148 657 plusmn 43 Heart 464 plusmn 31 473 plusmn 19 58 plusmn 06 3 plusmn 02 330 plusmn 37 246 plusmn 20 Liver 1447 plusmn 203 1626 plusmn 122 18 plusmn 19 103 plusmn 13 1024 plusmn 109 846 plusmn 109 Kidney 1176 plusmn 93 1161 plusmn 83 147 plusmn 19 74 plusmn 1 837 plusmn 108 605 plusmn 86 Fat 650 plusmn 169 1109 plusmn 321 81 plusmn 19 71 plusmn 24 458 plusmn 108 581 plusmn 198 Muscle 215 plusmn 13 214 plusmn 28 27 plusmn 05 14 plusmn 01 155 plusmn 28 111 plusmn 12 Brain 1199 plusmn 143 1180 plusmn 81 152 plusmn 34 75 plusmn 12 863 plusmn 194 616 plusmn 100 05 Lung 755 plusmn 76 923 plusmn 40 129 plusmn 15 75 plusmn 06 732 plusmn 83 615 plusmn 53 Heart 296 plusmn 34 354 plusmn 53 5 plusmn 06 29 plusmn 04 287 plusmn 34 234 plusmn 29 Liver 960 plusmn 91 1138 plusmn 58 163 plusmn 15 93 plusmn 12 929 plusmn 88 760 plusmn 100 Kidney 814 plusmn 102 987 plusmn 120 139 plusmn 19 8 plusmn 04 789 plusmn 110 654 plusmn 34 Fat 863 plusmn 227 1079 plusmn 444 147 plusmn 37 89 plusmn 51 834 plusmn 209 732 plusmn 416 Muscle 181 plusmn 12 170 plusmn 13 31 plusmn 02 14 plusmn 02 175 plusmn 11 113 plusmn 13 Brain 1086 plusmn 108 1215 plusmn 147 18 plusmn 18 98 plusmn 08 1050 plusmn 77 805 plusmn 69 1 Lung 439 plusmn 60 688 plusmn 187 133 plusmn 32 86 plusmn 05 758 plusmn 179 702 plusmn 43 Heart 186 plusmn 28 220 plusmn 72 57 plusmn 15 27 plusmn 04 322 plusmn 87 222 plusmn 31 Liver 581 plusmn 43 867 plusmn 140 176 plusmn 23 11 plusmn 15 998 plusmn 132 903 plusmn 123 Kidney 481 plusmn 37 740 plusmn 89 145 plusmn 19 94 plusmn 09 825 plusmn 105 771 plusmn 78 Fat 551 plusmn 143 504 plusmn 260 173 plusmn 77 71 plusmn 54 984 plusmn 439 584 plusmn 442 Muscle 91 plusmn 12 119 plusmn 37 28 plusmn 08 15 plusmn 03 159 plusmn 43 121 plusmn 25 Brain 731 plusmn 88 1073 plusmn 161 22 plusmn 26 136 plusmn 11 1249 plusmn 147 1114 plusmn 93
33
Discussion
Results signified the ability of the excipient TPGS to modify the blood distribution of COM2 in mouse under in vitro and in vivo conditions in a similar manner Plasma concentrations of COM2 and metabolites were significantly increased and the free fraction of drug in plasma (in vitro) decreased Concentrations in tissues were independent of the formulation whereas distribution ratios of drug in tissue to drug unbound in plasma were lower within the first minutes after dosing COM2 in TPGS Overall the altered pharmacokinetic profile of COM2 in plasma suggests drug inclusion in excipient-micelles andor promoted protein binding by excipient in plasma
The altered disposition of COM2 and metabolites in plasma is likely caused by the ability of TPGS to form micelles (141) Drug trapping by micelles in blood can be responsible for increased total plasma concentrations and decreased unbound fraction in plasma thereby influencing drug accumulation in plasma and blood cells (94) Changes in the free fraction could also be caused by altered protein binding There are different suggested mechanisms by which formulation vehicles can influence the free fraction of compounds such as vehicle-compound interactions (association andor micellar encapsulation) and vehicle-protein interactions The interaction either promotes or blocks the binding of the compound in plasma Most likely different interacting processes contribute to the effective free fraction (125)
The alteration in tissue distribution at the beginning may be induced by changes of the free drug fraction in the presence of TPGS and exists only for few minutes probably due to the excipient degradation in blood The phenomenon found after some minutes post-dose is reported in the literature for Paclitaxel formulated in Cremophor EL (94) The main characteristics are disproportionally increased plasma concentrations accompanied by unchanged tissue levels and tissue distribution processes
46 The impact of hydroxypropyl-β-cyclodextrin on COM3 in rat
In vitro results
COM3 was predominantly located in the cellular fraction (80) and was moderately bound to plasma proteins with high binding to α1-glycoprotein and albumin in a concentration-independent manner (Table 4-8 Figure 4-2) The drug partitioning into blood cells and the fraction bound to proteins were markedly reduced in incubations containing HP-β-CyD consequently lowering both the blood-plasma and blood cell-unbound in plasma concentration ratios (Table 4-8 Figure 4-6) Whereas HP-β-CyD decreased the protein binding suggesting more COM3 available for uptake into cells higher plasma levels associated with reduced concentrations in cells were observed for COM3 in HP-β-CyD In conclusion HP-β-CyD was selected for the in vivo study because of the most pronounced drug-excipient interactions detected in vitro
34
(a)
0
1
2
3
None HP-β-CyD
BP
R(b)
0
1
2
3
4
5
None HP-β-CyD
BC
PR
(c)
0
10
20
30
40
None HP-β-CyD
ρ
Figure 4-6 HP-β-CyD-mediated alteration of COM3 distribution in blood
Blood-plasma (a) blood cell-plasma (b) and blood cell-unbound in plasma (c) concentration ratios of [3H]COM3 at 5 (white bars) and 500 ngmL (black bars) in the presence and absence of HP-β-CyD (05) after incubation in rat blood (pH 76 H 044 nge3 mean plusmn SD)
Table 4-8 Effect of excipients on blood distribution and protein binding of COM3 in vitro
Partition parameters of [3H]COM3 obtained at equilibrium after incubation with and without excipients (05) in rat blood (pH 76 H 044 nge3 mean plusmn SD)
Excipient COM3 FP BPR BCPR fu ρ
(ngmL) () () None 5 209 plusmn 15 26 plusmn 01 46 plusmn 02 121 plusmn 09 399 plusmn 39 500 195 plusmn 03 29 plusmn 00 53 plusmn 01 122 plusmn 02 431 plusmn 08
5 194 plusmn 14 29 plusmn 02 56 plusmn 02 nd nd CELEtOH 6535 (vv) 500 175 plusmn 03 32 plusmn 01 60 plusmn 01 nd nd HP-β-CyD 5 385 plusmn 22 14 plusmn 01 21 plusmn 02 401 plusmn 18 51 plusmn 05 500 353 plusmn 04 16 plusmn 00 23 plusmn 00 396 plusmn 07 59 plusmn 01 Solutol 5 174 plusmn 14 32 plusmn 03 61 plusmn 04 nd nd 500 161 plusmn 03 35 plusmn 01 67 plusmn 01 nd nd PEG 200 5 197 plusmn 20 29 plusmn 03 51 plusmn 06 nd nd 500 186 plusmn 05 30 plusmn 01 56 plusmn 02 nd nd
5 227 plusmn 18 25 plusmn 02 44 plusmn 04 126 plusmn 01 346 plusmn 36 EtOHPEG200Glu 5590 (vvv) 500 200 plusmn 04 28 plusmn 01 51 plusmn 01 118 plusmn 02 432 plusmn 10 TPGS 5 249 plusmn 18 23 plusmn 02 40 plusmn 02 nd nd 500 237 plusmn 03 24 plusmn 00 41 plusmn 01 nd nd
In vivo results
Since COM3 dissolved in EtOHPEG200Glu (5590 vvv) showed similar distribution kinetics in vitro as compared to glucose 5 without additives (Table 4-8) the control formulation consisted of EtOHPEG200Glu This assured a sufficient solubility of COM3
Dosing COM3 in a HP-β-CyD-containing formulation resulted in decreased protein binding and blood cell partitioning as compared to the control group (Table 4-9) However these changes were transient and most pronounced after 5 min post-dosing followed by a decline At 60 min after drug administration differences in blood pharmacokinetics could not be longer detected between both groups anymore (Table 4-9) In contrast to the in vitro findings a lower plasma distribution was found at 5 min after applying COM3 in HP-β-CyD resulting in slightly enhanced blood-plasma and blood cell-plasma concentration ratios (Table 4-9 Figure 4-7)
35
The bolus injection of COM3 in HP-β-CyD led to an earlier decrease of kidney and lung concentrations and to a later decrease of skin liver and fat concentrations compared to tissue levels obtained after administration of COM3 alone (Table 4-11) The calculation of tissue-blood concentration ratios supported the lower distribution of COM3 formulated in HP-β-CyD (Table 4-11) especially at 1 h post-dose (Figure 4-8)
As a result of the difference in plasma pharmacokinetic parameters (Table 4-10) and tissue levels between both groups the renal elimination of COM3 was examined in addition More COM3 appeared in the urine of rats from the HP-β-CyD containing formulation (Table 4-12 Figure 4-9) especially within the first 30 minutes after drug administration (36-fold higher amount of unchanged COM3 in urine compared to the control group)
Table 4-9 Comparison of blood and plasma levels of COM3 with and without HP-β-CyD
[3H]COM3 concentrations in the systemic circulation (a) and partition parameters derived from these concentrations (b) after iv administration to rats at 300 microgkg formulated in HP-β-CyD or in a cyclodextrin-free solution (n=3 mean plusmn SD LOQ=008 ngmL assuming a hematocrit of 046(145) for calculations) significantly different from the control at Plt005 and 001 respectively
(a)
Formulation Time (h) Drug concentration (ngmL)
Blood Plasma EtOHPEG200Glu 5590 008 431 plusmn 68 175 plusmn 24 (control) 05 179 plusmn 40 61 plusmn 19 1 97 plusmn 09 41 plusmn 05 HP-β-CyD 40 008 327 plusmn 16 104 plusmn 11 025 263 plusmn 22 84 plusmn 09 05 180 plusmn 08 59 plusmn 01 1 104 plusmn 06 35 plusmn 02
(b)
Formulation Time (h) fu () FP () BPR BCPR ρ
008 225 plusmn 15 25 plusmn 02 42 plusmn 04 559 plusmn 48 EtOHPEG200Glu 5590 05 76 plusmn 08 187 plusmn 19 30 plusmn 03 54 plusmn 07 709 plusmn 89 (control) 1 233 plusmn 12 24 plusmn 01 40 plusmn 03 533 plusmn 37 HP-β-CyD 40 008 249 plusmn 12 174 plusmn 11 32 plusmn 02 58 plusmn 04 233 plusmn 17 025 177 plusmn 13 175 plusmn 06 31 plusmn 01 58 plusmn 02 325 plusmn 13 05 141 plusmn 06 180 plusmn 07 31 plusmn 01 56 plusmn 03 397 plusmn 18 1 78 plusmn 05 188 plusmn 12 29 plusmn 02 53 plusmn 04 681 plusmn 52
36
Table 4-10 Comparative pharmacokinetics of COM3 with and without HP-β-CyD
Pharmacokinetic parameters of [3H]COM3 administered intravenously in EtOHPEG 200Glu (control group) or in HP-β-CyD 40 to rats (n=3)
Parameter Unit Control group HP-β-CyD group
Blood Plasma Blood Plasma Body weight kg 0233 0221 Dose microg 70 66 C0 ngmL 46 17 35 11 V0 Lkg 66 174 85 271 AUC008-1h ngmL-1
h 197 75 177 58 funchanged 28 10 28 9
Blood Plasma
0
10
20
30
40
50
60
0 025 05 075 1Time (h)
CO
M3 (
ng
mL
)
0
5
10
15
20
25
0 025 05 075 1
Time (h)
CO
M3 (
ng
mL
)
Figure 4-7 Influence of HP-β-CyD on the systemic exposure of COM3
Blood and plasma concentration-time profiles of [3H]COM3 after intravenous administration to rats at 300 microgmL formulated in EtOHPEG 200Glu (open symbols black line) and as a solution containing HP-β-CyD (closed symbols dotted line) Symbols represent single values and lines mean values (n=3)
37
0
10
20
30
40
50
60
70
Liver Kidney Brain
0
5
10
15
Fat Muscle Skin Heart0
50
100
150
Lung
KP
Figure 4-8 Influence of HP-β-CyD on tissue distribution of COM3
Tissue to blood concentration ratio (KP) at 1 h after an iv injection of COM3 in EtOHPEG 200Glu (white bars) or in HP-β-CyD (black bars) in rats (dose 300 microgkg n=3 mean plusmn SD) significantly different from EtOHPEG 200Glu at Plt005
Table 4-11 Comparison of tissue distribution of COM3 with and without HP-β-CyD
Tissue concentrations and tissue-blood concentration ratios (KP) of [3H]COM3 after bolus injection to rats at 300 microgkg in EtOHPEG 200Glu (control) or HP-β-CyD (n=3 mean plusmn SD) significantly different from the control at Plt005
Time Tissue Concentration (ngmL) KP
(h) Control HP-β-CyD Percentage of control value Control HP-β-CyD
008 Liver 1412 plusmn 225 1058 plusmn 211 75 328 plusmn 01 326 plusmn 75 Kidney 1809 plusmn 191 1406 plusmn 72 78 424 plusmn 50 431 plusmn 24 Fat 128 plusmn 29 85 plusmn 18 67 31 plusmn 11 26 plusmn 06 Heart 597 plusmn 108 563 plusmn 55 94 139 plusmn 11 172 plusmn 13 Lung 6179 plusmn 809 4595 plusmn 192 74 1441 plusmn 110 1407 plusmn 6 Muscle 123 plusmn 25 142 plusmn 12 115 30 plusmn 11 44 plusmn 03 Skin 144 plusmn 62 74 plusmn 15 51 36 plusmn 20 22 plusmn 03 Brain 1164 plusmn 189 951 plusmn 41 82 271 plusmn 19 291 plusmn 21 05 Liver 588 plusmn 149 617 plusmn 60 105 329 plusmn 53 345 plusmn 42 Kidney 587 plusmn 163 479 plusmn 55 82 327 plusmn 51 267 plusmn 29 Fat 57 plusmn 10 46 plusmn 6 81 32 plusmn 02 26 plusmn 04 Heart 178 plusmn 46 187 plusmn 23 105 99 plusmn 10 104 plusmn 08 Lung 2003 plusmn 599 2376 plusmn 129 119 1108 plusmn 156 1324 plusmn 76 Muscle 155 plusmn 63 130 plusmn 12 84 84 plusmn 16 72 plusmn 05 Skin 94 plusmn 11 40 plusmn 9 42 54 plusmn 06 22 plusmn 06 Brain 905 plusmn 100 766 plusmn 49 85 515 plusmn 60 428 plusmn 44 1 Liver 394 plusmn 29 340 plusmn 6 86 407 plusmn 12 328 plusmn 19 Kidney 357 plusmn 44 293 plusmn 39 82 366 plusmn 12 283 plusmn 47 Fat 31 plusmn 1 22 plusmn 5 72 32 plusmn 04 21 plusmn 04 Heart 111 plusmn 13 99 plusmn 6 89 114 plusmn 04 95 plusmn 01 Lung 1197 plusmn 128 1053 plusmn 178 88 1247 plusmn 246 1011 plusmn 128 Muscle 99 plusmn 9 85 plusmn 23 86 102 plusmn 02 81 plusmn 19 Skin 68 plusmn 16 25 plusmn 3 37 69 plusmn 11 25 plusmn 02 Brain 653 plusmn 35 599 plusmn 10 92 674 plusmn 27 578 plusmn 22
38
Table 4-12 Comparison of COM3 excretion in urine with and without HP-β-CyD
[14C]COM3 (a) and its cumulative amount (b) appeared in the urine of rats following iv dosing at 370 microgkg in EtOHPEG 200Glu (control) or HP-β-CyD 40 (mean plusmn SD n=2 control n=3 HP-β-CyD) significantly different from the control at Plt005 and 001 respectively (a)
Time (h) COM3 in urine (ng) funchanged ()
Control HP-β-CyD Control HP-β-CyD 05 123 plusmn 10 4440 plusmn 594 25 plusmn 02 448 plusmn 82 1 240 plusmn 129 762 plusmn 191 34 plusmn 08 13 plusmn 41 15 85 plusmn 19 325 plusmn 150 25 plusmn 08 73 plusmn 28 2 43 plusmn 11 174 plusmn 89 2 plusmn 08 46 plusmn 21
(b)
Time Cumulative amount of COM3 in urine
(h) ng dose
Control HP-β-CyD Control HP-β-CyD 05 123 plusmn 10 4440 plusmn 594 013 plusmn 001 46 plusmn 09 1 363 plusmn 139 5202 plusmn 693 039 plusmn 014 54 plusmn 11 15 449 plusmn 159 5527 plusmn 799 048 plusmn 016 57 plusmn 12 2 491 plusmn 169 5702 plusmn 857 053 plusmn 017 59 plusmn 12
0
1000
2000
3000
4000
5000
6000
7000
05 1 15 2
Time (h)
Am
ou
nt
excre
ted
(n
g)
Figure 4-9 Effect of HP-β-CyD on the renal elimination of COM3
Cumulative amount of [14C]COM3 appeared in urine after iv administration of 370 microgkg either in EtOHPEG 200Glu (white bars) or as a solution in HP-β-CyD (black bars) Data are expressed as mean plusmn SD (n=2 EtOHPEG 200Glu n=3 HP-β-CyD) significantly different from the EtOHPEG 200Glu at Plt001
Discussion
In vitro and in vivo experiments demonstrated a strong influence of the excipient HP-β-CyD on the disposition kinetics of COM3 in rats There was a significant decrease in the plasma protein binding and in plasma and tissue concentrations of COM3 formulated in HP-β-CyD Changes in the systemic circulation were transient (le05 h post-dose) and most distinct shortly after dosing Alterations in tissue
39
concentrations and tissue-blood distribution ratios were tissue dependent and most pronounced for skin The amount of unchanged COM3 eliminated in the urine was significantly increased following drug administration in HP-β-CyD This alteration in the pharmacokinetic behavior of COM3 is most likely due to the elimination of COM3 included in cyclodextrin complexes
It is known (142) that HP-β-CyD forms drugcyclodextrin complexes in biological fluids is unable to cross biological membranes and is rapidly eliminated renally Even though the release of drugs from drugcyclodextrin complexes is expected to be fast (within seconds) (112) drug pharmacokinetics can be modified in the presence of cyclodextrins (143) Given that COM3 is included in complexes in the systemic circulation less COM3 is available for distribution which could have led to the lower protein binding and celltissue partitioning of COM3 formulated in HP-β-CyD compared to the cyclodextrin-free solution of COM3 Lower ρ-values of COM3 in HP-β-CyD support the possible existence of long-lasting complexes in vivo and indicate that unbound plasma concentrations obtained from ultrafiltration (30000 MW cut-off) are probably the sum of free and cyclodextrin-associated drug (MWHP-β-CyD
~1500) Furthermore blood partition parameters altered till 30 min post-dose indicate a slow dissociation of COM3 from complexes After total drug release COM3 formulated in HP-β-CyD seemed to assimilate the pharmacokinetic behavior in blood obtained in the control group (60 min post-dose)
The marked increase of unchanged COM3 in the urine occurred mainly in the first 30 min following drug administration in HP-β-CyD which is consistent with the decreased plasma levels right after dosing in the HP-β-CyD group Similar observations are reported for carbamazepine and dexamethasone where the renal excretion of unchanged drug applied intravenously in HP-β-CyD was increased most likely due to the renal clearance of the formulation vehicle (112) The faster elimination of COM3 associated to HP-β-CyD in contrast to COM3 alone might have attributed to less COM3 available for tissue distribution even after completed drug release from the vehicle being in line with decreased tissue levels and KP values at 60 min post-dose
47 The impact of Cremophor EL on COM4 in rat
In vitro results
In excipient-free incubations COM4 was highly bound to plasma proteins (gt97 bound predominantly to albumin) and penetrated hardly into blood cells (gt95 located in plasma) (Tables 4-13 and 4-14 Figure 4-2) The free fraction in plasma and the partitioning into blood cells of COM4 were enhanced in the presence of CEL HP-β-CyD and Solutol The protein binding decreased in an excipient concentration-dependent manner (Table 4-13 Figure 4-10) At excipient concentrations below 01 the protein binding was not altered At and above excipient concentrations of 01 the free fraction was markedly elevated with a maximal effect at 1 for all three formulations The addition of these excipients to incubations resulted to higher blood-plasma and blood cell-plasma concentration ratios both indicating increased uptake of COM4 into blood cells (Table 4-14) CEL was selected for the in vivo study because of the most pronounced drug-excipient interactions detected in vitro
40
Table 4-13 Effect of excipients on the in vitro protein binding of COM4
Protein binding of [14C]COM4 at 100 ngmL in the presence and absence of excipients in rat plasma using the ultrafiltration technique (pH 74 n=3 mean plusmn SD)
Excipient fu
() ()
Percentage of control value
None 24 plusmn 02 CEL 001 23 plusmn 01 96 01 31 plusmn 01 131 05 111 plusmn 03 464 1 260 plusmn 03 1089 HP-β-CyD 001 26 plusmn 02 109 01 43 plusmn 02 179 05 98 plusmn 01 412 1 141 plusmn 11 592 Solutol 001 23 plusmn 02 97 01 32 plusmn 02 134 05 97 plusmn 02 407 1 152 plusmn 03 638 PEG 200 05 24 plusmn 01 99 TPGS 05 2 plusmn 01 85
Table 4-14 Effect of excipients on the in vitro partition parameters of COM4 in blood
Plasma fraction (FP) and distribution ratios (BPR BCPR ρ) of [14C]COM4 at 100 ngmL in rat blood obtained at equilibrium after incubations with and without excipients at 05 and 1 (pH 75 H 044 37degC nge3 mean plusmn SD)
Excipient FP BPR BCPR ρ
() ()
None 959 plusmn 20 058 plusmn 001 005 plusmn 003 21 plusmn 06 CEL 05 739 plusmn 16 075 plusmn 002 043 plusmn 006 39 + 05 1 656 plusmn 17 085 plusmn 002 067 plusmn 005 26 + 02 HP-β-CyD 05 900 plusmn 13 062 plusmn 001 014 plusmn 002 15 plusmn 02 1 819 plusmn 14 068 plusmn 001 028 plusmn 003 20 plusmn 02 Solutol 05 786 plusmn 15 071 plusmn 001 035 plusmn 003 36 plusmn 03 1 749 plusmn 14 075 plusmn 001 043 plusmn 003 28 plusmn 03
In vivo results
Dosing COM4 in a CEL-containing formulation resulted in a decrease of the protein binding as compared to the control group (Table 4-15 Figure 4-10) This effect was time-dependent and most pronounced at 5 min after drug administration followed by a decline The increased fraction of COM4 unbound in plasma did not affect the drug levels in the systemic circulation resulting in similar pharmacokinetic parameters in both groups (Table 4-15) Identical tissue concentrations were observed independently of the formulation (Table 4-16)
41
In vitro Ex vivo
0
5
10
15
20
25
30
0 05 1
Excipient concentration ()
Fre
e f
racti
on
(
)
Cremophor EL
Hydroxypropyl-β-cyclodextrin
Solutol HS 15
0
5
10
15
20
25
0 025 05 075 1
Time (h)
Fre
e f
racti
on
(
)
Control group
Cremophor EL group
Figure 4-10 Excipient-mediated alterations of COM4 protein binding in plasma
Left Unbound fraction of [14C]COM4 (100 ngmL) incubated with different excipient concentrations in rat plasma (mean plusmn SD n=3) Right Unbound fraction of compound-related radioactivity in plasma after intravenous administration of [14C]COM4 at 400 microgkg formulated in buffer (control group closed symbols) or in CEL (open symbols) Symbols represent mean plusmn SD (n=3)
Table 4-15 Comparative blood and plasma kinetics of COM4 with and without CEL
Compound-related radioactivity concentrations in the systemic circulation (a) and pharmacokinetic parameters (b) after iv administration of [14C]COM4 at 400 microgkg formulated in buffer or in CEL to rats (n=3 mean plusmn SD LOQ=43 ng-eqmL assuming a hematocrit of 046(145) for calculations) significantly different from the control at Plt005 (a)
Formulation Time (h) Concentration (ng-eqmL)
Blood Plasma Unbound in plasma ()
008 1555 plusmn 299 2483 plusmn 382 025 1192 plusmn 119 2073 plusmn 238 05 1377 plusmn 67 2388 plusmn 153
Phosphate buffered saline (control)
1 1248 plusmn 68 2105 plusmn 172
38 + 15
Cremophor EL 17 008 1471 plusmn 115 2426 plusmn 186 169 plusmn 34 025 1316 plusmn 119 2180 plusmn 237 77 plusmn 24 05 1216 plusmn 155 2084 plusmn 237 74 plusmn 27 1 1315 plusmn 337 2210 plusmn 607 74 plusmn 28
(b)
Parameter Unit Control group Cremophor group
Blood Plasma Blood Plasma Body weight kg 0201 0199 Dose microg 81 80 C0 ngmL 1427 2373 1385 2296 V0 Lkg 028 017 029 017 AUC008-1h ngmL-1
h 1211 2068 1186 1998
42
Table 4-16 Comparison of tissue distribution of COM4 with and without CEL
Tissue concentrations and tissue-blood concentration ratios of radioactivity of [14C]COM4 after bolus injection to rats at 400 microgkg formulated either in buffer (control group) or in CEL (n=3 mean plusmn SD)
Time Tissue Drug concentration (ng-eqg) Tissue-blood distribution ratio
Control group Cremophor group Control group Cremophor group
008 h Lung 737 + 78 768 + 17 048 + 004 052 + 003 Muscle 222 + 6 243 + 12 015 + 002 017 + 002 Skin 276 + 63 254 + 46 019 + 008 017 + 002 025 h Lung 654 + 44 710 + 51 055 + 002 054 + 001 Muscle 209 + 5 211 + 6 018 + 002 016 + 002 Skin 363 + 70 395 + 41 030 + 004 030 + 004 05 h Lung 695 + 46 676 + 40 050 + 001 056 + 004 Muscle 202 + 4 204 + 1 015 + 0 017 + 002 Skin 408 + 39 372 + 25 030 + 004 031 + 004 1 h Lung 628 + 19 629 + 78 050 + 001 059 + 013 Muscle 212 + 10 196 + 13 017 + 001 019 + 008 Skin 409 + 24 391 + 45 033 + 001 037 + 009
Discussion
CEL lowered the binding of COM4 to plasma proteins in vitro and the higher free drug fraction was associated with enhanced partitioning into blood cells as compared to the excipient-free incubations Similar increases of unbound drug levels in plasma were observed after bolus injection of COM4 in CEL In contrast to the in vitro findings CEL induced no changes in the in vivo bloodplasma distribution of COM4 and no alterations in the tissue distribution were detected as well
Even though the plasma protein binding of COM4 is influenced by CEL in an analogous manner under in vitro and in vivo conditions a direct translation of the altered protein binding into blood and plasma concentrations is lacking in vivo Different to the in vitro investigations the in vivo situation involves not only distribution but also elimination processes which can initiate shifts in the systemic drug exposure Besides this the effective excipient concentration achieved in vivo in the circulation is usually unknown and can quite differ from concentrations applied in vitro Although excipient concentrations can be theoretically estimated using blood volume dose and application volume values are fairly arbitrary because excipient levels can decline fast in the body due to dilution (144) and degradation (126) within the blood compartment
48 The impact of Solutol HS 15 on COM5 in rat
In vitro results
The distribution of COM5 between whole blood and plasma was slightly concentration-dependent in rat regardless of incubations with or without excipients (Table 4-17) and the equilibrium conditions were rapidly reached for all solutions (lt5 min) except for CEL (equilibrium after 1-h incubation data not shown) The binding of COM5 to plasma proteins was moderate (lt90) with a high binding to albumin and α1-acid glycoprotein (Figure 4-2) and the bound fraction was reduced by the addition of CEL and Solutol Furthermore both excipients caused alterations in the blood-plasma and blood cell-plasma concentration ratios characterized by
43
enhanced drug partitioning into blood cells (Table 4-17 Figure 4-11) The higher cell uptake is consistent with decreased drug binding to plasma proteins in the presence of CEL and Solutol These effects were more prominent for COM5 with Solutol than with CEL Thus Solutol was selected for the in vivo study
Table 4-17 Effect of excipients on blood distribution and protein binding of COM5 in vitro
Partition parameters of [14C]COM5 obtained at equilibrium after incubation with and without excipients (05) in rat blood (pH 75 H 045 nge3 mean plusmn SD)
Excipient COM5 FP BPR BCPR fu ρ
(ngmL) () () None 10 857 plusmn 40 064 plusmn 003 021 plusmn 007 162 plusmn 11 14 plusmn 03 300 768 plusmn 16 072 plusmn 002 037 plusmn 003 119 plusmn 02 31 plusmn 02 Ethanol 10 812 plusmn 01 066 plusmn 005 023 plusmn 011 114 plusmn 04 22 plusmn 07 300 779 plusmn 09 072 plusmn 001 036 plusmn 002 116 plusmn 02 30 plusmn 02
10 660 plusmn 22 083 plusmn 003 063 plusmn 006 227 plusmn 18 28 plusmn 03 CELEtOH 6535 (vv) 300 577 plusmn 12 095 plusmn 002 090 plusmn 004 237 plusmn 04 38 plusmn 02 HP-β-CyD 10 803 plusmn 27 069 plusmn 002 030 plusmn 005 nd nd 300 754 plusmn 18 073 plusmn 002 040 plusmn 004 nd nd Solutol 10 550 plusmn 05 097 plusmn 006 100 plusmn 002 281 plusmn 10 33 plusmn 05 300 487 plusmn 09 113 plusmn 002 129 plusmn 004 277 plusmn 04 43 plusmn 04 PEG 200 10 769 plusmn 23 072 plusmn 002 037 plusmn 005 nd nd 300 736 plusmn 13 075 plusmn 001 044 plusmn 003 nd nd TPGS 10 832 plusmn 13 063 plusmn 005 018 plusmn 012 nd nd 300 785 plusmn 18 070 plusmn 002 033 plusmn 004 nd nd
(a)
00
02
04
06
08
10
12
10 ngmL 300 ngmL
BP
R
(b)
00
02
04
06
08
10
12
14
10 ngmL 300 ngmL
BC
PR
(c)
00
10
20
30
40
50
10 ngmL 300 ngmL
ρ
Figure 4-11 Excipient-mediated alterations of COM5 distribution in blood by CEL and Solutol
Blood-plasma (a) blood cell-plasma (b) and blood cell-unbound in plasma (c) concentration ratios of [14C]COM5 (10-300 ngmL) without excipients (black bars) and in the presence of Cremophor EL (white bars) and Solutol HS 15 (hatched bars) at 05 in rat blood (pH 75 H 045 nge3 mean plusmn SD)
In vivo results
In vitro studies demonstrated that the addition of ethanol to incubations had no impact on the blood partition of COM5 (Table 4-17) Therefore COM5 was dissolved in ethanol 10 for the administration in the control group thereby assuring sufficient solubility of the compound
Within the first 15 min post-dose higher blood concentrations accompanied by similar plasma concentrations were observed for COM5 in Solutol compared to concentrations for COM5 in ethanol 10 (control group) thereby increasing
44
concentration ratios of blood-plasma and blood cell-plasma in the Solutol group (Table 4-18) Subsequently similar ratios were obtained in both groups with a concomitant slower decline of circulation concentrations in animals treated with Solutol These changes in the Solutol group are in line with a reduced rate constant that resulted in a 2-fold higher half-life compared to that in the control group (Table 4-19) At 1 h post-dose concentrations of COM5 in the systemic circulation were 300 higher than those obtained after dosing the compound in the control formulation (Table 4-18 Figure 4-12) The doseAUC ratio was also decreased for COM5 in Solutol (Table 4-19) In agreement with the in vitro findings COM5 formulated in Solutol led to a permanent lower protein binding up to 1 h post-dose in addition to enhanced uptake into blood cells right after dosing (higher blood-plasma concentration ratio) (Table 4-18)
Table 4-18 Comparison of blood and plasma levels of COM5 with and without Solutol
Concentrations of compound-related radioactivity in the systemic circulation (a) and partition parameters (b) derived from these concentrations after iv administration of [14C]COM5 at 1 mgkg formulated in Solutol or in a Solutol-free solution (control group) to rats (n=3 mean plusmn SD LOQ=8 ng-eqmL assuming a hematocrit of 046(145) for calculations) significantly different from the control group at Plt005 and 001 respectively (a)
Time (h) Drug concentration (ng-eqmL)
Control group Solutol group Percentage of control value
Blood 008 1308 plusmn 178 1853 plusmn 155 142 025 895 plusmn 195 1243 plusmn 250 139 05 615 plusmn 193 976 plusmn 115 159 1 194 plusmn 24 585 plusmn 113 301 Plasma 008 2592 plusmn 558 2720 plusmn 266 105 025 1584 plusmn 168 1895 plusmn 337 120 05 1014 plusmn 385 1526 plusmn 112 150 1 311 plusmn 47 900 plusmn 165 289
(b)
Formulation Time (h) fu () FP () BPR BCPR ρ
Control 008 1062 plusmn 93 051 plusmn 004 -006 plusmn 01 -07 plusmn 11 (ethanol 10) 025 975 plusmn 148 056 plusmn 008 005 plusmn 017 19 plusmn 05 05 876 plusmn 125 062 plusmn 009 018 plusmn 019 42 plusmn 22 1
84 plusmn 14
862 plusmn 25 063 plusmn 002 019 plusmn 004 19 plusmn 04 Solutol 17 008 792 plusmn 18 068 plusmn 002 031 plusmn 003 22 plusmn 02 025 825 plusmn 18 065 plusmn 001 025 plusmn 003 19 plusmn 02 05 847 plusmn 51 064 plusmn 004 021 plusmn 008 14 plusmn 05 1
150 plusmn 23
832 plusmn 12 065 plusmn 001 024 plusmn 002 12 plusmn 01
Independent of the formulation brain levels ranged in concentrations corresponding
to the vascular contamination indicating no significant penetration of COM5 into brain (Table 4-20) A later increase in muscle and skin concentrations was detected for COM5 administered in Solutol (Table 4-20) The muscle concentration-time profile showed an analogous pattern to that in the systemic circulation with a longer persistence going along with higher concentrations at later post-dose times in the Solutol group (Table 4-21 Figure 4-12) However similar muscle-plasma concentration ratios between both groups pointed that Solutol did not affect the
45
muscle distribution pattern In contrast the higher skin concentrations of COM5 formulated in Solutol were associated with altered KP values (025 and 1 h post-dose) and same half-life compared to the control group (Tables 4-20 and 4-21)
Table 4-19 Comparative pharmacokinetics of COM5 with and without Solutol
Pharmacokinetic parameters of compound-related radioactivity after intravenous administration of [14C]COM5 in ethanol 10 (control group) or in Solutol 17 to rats (n=3)
Parameter Unit Control group Solutol group
Blood Plasma Blood Plasma Body weight kg 0214 0212 Dose microg 214 212 C0 ngmL 1562 2998 1840 2749 V0 Lkg 064 033 054 036 AUC008-1h ngmL-1
h 578 1011 931 1426 t12 h 033 032 069 069 DoseAUC008-1h mLh 369 211 228 149
Table 4-20 Comparison of tissue distribution of COM5 with and without Solutol
Tissue concentrations and tissue-plasma concentration ratios of radioactivity of [14C]COM5 after bolus injection at 1 mgkg to rats in ethanol 10 (control) or Solutol 17 (n=3 mean plusmn SD)
Time Tissue Concentration (ngg) Tissue-plasma ratio
Control Solutol Percentage of control value Control Solutol
008 h Muscle 400 + 53 476 + 69 119 016 plusmn 002 018 plusmn 004 Skin 248 + 26 240 + 48 97 010 plusmn 003 009 plusmn 003 Brain 27 + 3 40 + 2 150 001 plusmn 0 001 plusmn 0 025 h Muscle 311 + 43 424 + 21 137 020 plusmn 003 023 plusmn 004 Skin 243 + 15 413 + 62 170 015 plusmn 001 022 plusmn 002 Brain 16 + 2 26 + 4 161 001 plusmn 0 001 plusmn 0 05 h Muscle 228 + 25 333 + 15 146 025 plusmn 009 022 plusmn 001 Skin 235 + 33 384 + 11 163 025 plusmn 008 025 plusmn 001 Brain 10 + 2 18 + 3 188 001 plusmn 0 001 plusmn 0 1 h Muscle 57 + 2 174 + 30 307 019 plusmn 003 019 plusmn 0 Skin 152 + 11 246 + 46 162 050 plusmn 011 028 plusmn 004 Brain mdasha 11 + 1 nd 001 plusmn 0 001 plusmn 0 a below LOQ significantly different from the control at Plt005
Table 4-21 Comparison of muscle and skin kinetics of COM5 with and without Solutol
Pharmacokinetic parameters of compound-related radioactivity in tissues after intravenous administration of [14C]COM5 at 1 mgkg formulated in ethanol 10 (control group) or Solutol 17 to rats (n=3)
Parameter Unit Muscle Skin
Control group Solutol group Control group Solutol group AUC008-1h ngmL-1
h 199 298 198 313 C0 ngg 533 548 nd nd t12 h 030 058 104 097
46
Plasma Muscle Skin
100
1000
10000
0 025 05 075 1
Time (h)
Co
ncen
trati
on
(n
g-e
qm
L)
10
100
1000
0 025 05 075 1
Time (h)
Co
ncen
trati
on
(n
g-e
qm
L)
100
1000
0 025 05 075 1
Time (h)
Co
ncen
trati
on
(n
g-e
qm
L)
Figure 4-12 Influence of Solutol on plasma muscle and skin profiles of COM5
Concentration-time courses of compound-related radioactivity in plasma muscle and skin after intravenous administration of [14C]COM5 at 1 mgkg formulated in ethanol 10 (closed symbols black line) and as a solution containing Solutol 17 (open symbols dotted line) Symbols represent single values and lines mean values (n=3)
Discussion
In vitro and in vivo experiments showed that Solutol significantly modulated the disposition profile of COM5 in rats by drug-excipient interactions in blood COM5 formulated in Solutol decreased both the drug distribution into plasma (transient in vivo) and the binding to plasma proteins (prolonged in vivo) Furthermore animals treated with Solutol showed a later concentration increase in the circulation and tissues (muscle skin) (ge025 h post-dose)
Altered drug levels were related to prolonged half-lives in the circulation and muscle The longer blood persistence is consistent with the reduced clearance (doseAUC) which presumes a lower elimination of COM5 in the presence of Solutol In contrast to the muscle concentration-time profile similar to that in the circulation the skin profile exhibited no changes in the half-life potentially due to a lower vascularization in skin compared to that in muscle However the skin-plasma concentration ratio was affected by the Solutol formulation whereas no changes in KP values were observed for muscle This altered pharmacokinetic profile might relate to a lower clearance of COM5 in the presence of Solutol
Previous investigations in mice revealed an interaction between Solutol and a co-administered ketochlorine photosensitizer (C8KC) in plasma (127) Protein binding experiments indicated the formation of either a binary drug-excipient complex or a ternary complex involving drug excipient and plasma components This effect was correlated to similar half-lives of Solutol and C8KC in plasma suggesting the persistence of C8KC in the circulation associated with that of the excipient Likewise half-lives in the same range were also observed for C8KC and the excipient Cremophor EL going along with prolonged C8KC persistence in plasma and tissues in mice (85)
47
5 General discussion and conclusions
In vitro and in vivo experiments were carried out to investigate the potential of five excipients commonly used in formulations to modify the pharmacokinetics of co-administered model compounds at concentrations ranging from sub-therapeutic to pharmacological levels Conducted studies focused mainly on the impact of excipients in the blood compartment since such data have rarely been published up to now especially for intravenously low dosed compounds including highly active drug substances biomarkers PET ligands and microdoses
PEG 200 CEL HP-β-CyD and Solutol were chosen as excipients because of their use in intravenous formulations and their high solubilizing ability related to different molecular structures and solubilization principles by either a direct solvent effect or by formation of micelles or complexes TPGS known in oral formulations completed the set of selected excipients and is an interesting functional excipient in terms of its chemical properties (benzyl ring) and ability to alter metabolism andor transporter activities thereby potentially influencing cellular distribution
Five drug candidates in development at Novartis were selected as model compounds exhibiting different physicochemical and pharmacokinetic properties (Table 5-1) The two PET ligands COM1 (base) and COM2 are lipophilic and poorly water-soluble COM3 is characterized by its predominant location in the cellular fraction in blood whereas COM4 hardly penetrates into blood cells COM2 distributes equally between plasma and whole blood COM5 is a molecule with a high polar surface area and a low volume of distribution similar to that of COM4 Moreover COM2 COM1 and COM4 are very highly protein bound (gt95) and COM3 and COM5 are moderately protein bound (lt90) In addition binding studies using isolated plasma proteins showed that model compounds bind with different affinity to the three major drug-binding proteins in plasma (albumin α1-acid glycoprotein and lipoproteins)
Model compounds were used in low doses to achieve blood concentrations of lt5 ngmL for COM1 and COM2 and low-therapeutic levels for COM3 (5-50 ngmL) Due to the very low volume of distribution COM4 and COM5 were investigated at normal pharmacological concentrations (gt50 ngmL in blood) to guarantee detectable tissue levels
In order to analyze the in vitro-in vivo correlation the excipient was set at an excipient-blood ratio of 1200 This concentration was found to be non-hemolytic in vitro for selected excipients except TPGS which induced hemolysis after a longer contact time To rule out any changes caused by cell lysis TPGS investigations were carried out in the non-hemolytic range The excipient concentration of 05 also correlates to the normal dosing range estimated for an intravenous bolus injection in mice and rats assuming a blood volume of ~70 mLkg and an injection volume of lt3 mLkg However in humans according to the literature (54) excipient concentrations above 01 in blood are regarded as high and generally only obtained following intravenous infusions Considering marketed injectable formulations for example the amount of excipient in blood is up to 015 HP-β-CyD (Sporanox) and 03-05 CEL (Vumon and Taxol respectively)
48
Table 5-1 Overview of model compounds
Physicochemical (PC) and pharmacokinetic (PK) properties of model compounds selected for investigating drug-excipient interactions in blood
Compound COM1 COM2 COM3 COM4 COM5 PET ligand PET ligand NCE NCE NCE
Chemical structure
N
N
O
R1
R2
O
N
O
N
N
S
R1
R2
N
O
N
R
NN
R2
R1
N
NO
S O
NH
O
O
NH
OR1
R2
R3
PC properties MW (gmol) 240 410 295 lt400 533 LogD 68 34 45 23 17 37 pKa 38 57 41 87 32 46 106 H20 solubility pH 68 (mgL) 20 lt25 4000 lt500 100 PSA (Aring2) 35 50 25 63 166 H-bond acceptors 3 5 3 4 12 H-bond donors 0 0 0 1 3 Critical value(s) Solubility (base) Solubility MW PSA H-bond acc PK parameters Species Rat Mouse Rat Rat Rat In vitro Fraction in plasma () 75 45 20 ~100 80 Free in plasma () 21 18 12 24 11 Major binding protein Albumin gt AGP Albumin gt LP AGP gt Albumin Albumin gt AGP Albumin asymp AGP In vivo Matrix Plasma Blood Blood Plasma Plasma t12 (h) 008 11 11 10 04 CL (mLminkg) 202 10 142 04 72 Vss (Lkg) 11 14 10 03 03 funchanged () 14 49 14 98 94 AGP α1-acid glycoprotein CL Drug clearance funchanged Fraction of unchanged drug based on AUC ratio of parent drug and total radioactivity LogD Logarithm of octanol-water distribution coefficient LP Lipoproteins MW Molecular weight NCE New chemical entity pKa Negative logarithm of dissociation constant PSA Polar surface area t12 Main elimination half-life Vss Volume of distribution under steady-state conditions
49
In trying to evaluate the potential of excipients to affect partition parameters in blood selected excipients were screened in vitro for interactions with the model compounds using a blood distribution method and protein binding assays (ultrafiltrationultracentrifugation) The most interacting excipients were subsequently taken forward for in vivo studies in animals given a single iv dose to ascertain whether there was a change in pharmacokinetics and whether an in vitro-in vivo correlation existed
Amongst the excipients tested the excipient PEG 200 was not active as an interacting agent whereas the others were more or less active (Table 5-2) However there was no apparent relationship between the nature of interactions and the compound properties
TPGS was found in vitro to enhance the plasma fraction of COM1 and COM2 in blood and higher plasma concentrations were associated with a decrease of compound unbound in plasma A significant increase in plasma concentrations of parent drug (2-fold) and metabolites (4-fold) were observed following intravenous administration of COM2 in mice and t12 of COM2 remained unchanged whereas t12 of metabolites was 4-fold higher While TPGS led to similar trends of COM1-related metabolites after injection in rats values determined for parent drug were inconsistent with those obtained in vitro A very extensive metabolism coupled to fast elimination was detected for COM1 which led to a stop in additional investigations to understand the in vitro-in vivo discrepancy
The use of CEL and Solutol in rats reduced in vitro the binding of COM4 and COM5 to plasma proteins and the higher free drug fraction was accompanied by enhanced partitioning into blood cells Both excipients led to 2-fold higher unbound plasma concentrations following iv administration of COM4 formulated in CEL and COM5 in a Solutol-containing solution Systemic and tissue levels of COM4 remained unaffected In contrast dosing COM5 in Solutol resulted in an earlier increase of blood-plasma concentration ratios indicating enhanced uptake into blood cells Later on COM5 concentrations in blood and plasma were significantly enhanced to a similar extent (2-fold) yielding ratios equalized to control values The systemic accumulation was correlated to higher t12 (2-fold) The AUC of COM5 in muscle and skin increased going along with a raise of t12 in muscle and none in skin
In vitro HP-β-CyD increased the amount of COM3 distributed into rat plasma and lowered the binding to plasma proteins Concentration ratios were only about 12 for blood-plasma and 18 for blood cell-unbound in plasma as compared to reference values At earlier time points after iv dosing concentrations of COM3 in blood and plasma were lower in the presence of HP-β-CyD (~23 of control) whereas over 30-fold higher levels of COM3 in urine were found Subsequently tissue concentrations and tissue-blood concentration ratios of COM3 with HP-β-CyD were significantly decreased
50
Table 5-2 Qualitative impact of excipients on pharmacokinetic parameters
Excipient-compound interactions obtained after in vitro incubations and after intravenous administration in animals using excipients at ~05 in blood and compounds at a dose of either ~1 nmolkg (COM1 COM2) or ~1 micromolkg (COM3 COM4 COM5) Arrows indicate excipient-induced changes compared to the excipient-free group (harr no changes uarr increase darr decrease) Compound Excipient Species Changes Comments
In vitro In vivo COM1 Vit E TPGS Rat uarr Accumulation in plasma darr Plasma protein binding bull No changes in vitro at le05 TPGS darr Partitioning into blood cells darr AUC008-05h bull Similar AUCs of drug free in plasma uarr Plasma protein binding darr C0 bull Increase in AUC of metabolites
harr t12 bull Inappropriate model compound due harr Tissue distribution to rapid metabolismelimination COM2 Vit E TPGS Mice uarr Accumulation in plasma uarr AUC008-1h bull uarr AUC and uarr t12 of metabolites darr Partitioning into blood cells uarr C0 bull Ex vivo protein binding not available
uarr Plasma protein binding harr t12 due to values ltLOQ harr Tissue distribution
COM3 HP-β-cyclodextrin Rat uarr Accumulation in plasma darr Plasma protein binding
darr Partitioning into blood cells darr AUC008-1h
darr Plasma protein binding darr C0
harr t12
darr Skin concentrations
uarr Urinary excretion
COM4 Cremophor EL Rat darr Accumulation in plasma darr Plasma protein binding uarr Partitioning into blood cells harr AUC008-1h
darr Plasma protein binding harr C0
harr t12
harr Tissue distribution
COM5 Solutol HS 15 Rat darr Accumulation in plasma darr Plasma protein binding
uarr Partitioning into blood cells uarr AUC008-1h
darr Plasma protein binding harr C0
uarr t12
uarr Muscleskin concentrations
AUC Area under the plasma drug concentration-time curve C0 Initial plasma concentration at time zero LOQ Limit of quantification t12 Half-life in plasma using the last three data points
51
These results clearly show the role of excipients as a modulator of the protein binding and cellular partitioning of compounds in blood which can impact the overall drug disposition Excipient-induced changes in the free fraction and cell uptake of drugs within the blood compartment are explained by various mechanisms (Figure 5-1) An excipient is able to influence the fraction of a co-administered drug in plasma and blood cells by direct drug interactions andor interferences with blood components such as proteins and cell constituents particularly membranes Consequently bound and free concentrations in plasma and cellular concentrations may be shifted potentially contributing to a ldquonewrdquo steady state Altered plasma concentrations can be the result of changes in drug protein binding drug adsorption to excipients andor drug trapping into excipient micelles or complexes Whichever effect dominates more drug can be free or bound thereby accounting for the amount of drug available for cellular partitioning Excipients could also vary the uptake into blood cells due to alterations in membrane structure andor drug presentation both mechanisms either facilitating or hindering drug transport via membranes In the end most likely different interacting processes contribute to the final effect depending on the force and nature of each single interaction
Free drug Free drug
Bound drug
Protein-bound drug
Excipient-drug interactions
(solubilization adsorption incorporation)
(destruction adsorption integration penetration)
PLASMA BLOOD CELLS
Excipient-membrane interactionsExcipient-protein interactions
(destruction adsorption binding)
Figure 5-1 Mechanisms underlying alterations in drug partition parameters in blood
The presence of excipients in blood may influence drug levels in plasma (protein-bound and free fraction) and blood cells by interacting with the drug or blood components thereby either blocking or promoting the protein binding andor the drug available for cellular partitioning
Analyzing the in vitro with the in vivo situation the effect of selected excipients on
the protein binding showed a good in vitro-in vivo correlation whereas systemic concentrations after iv administration in animals could often not be predicted well from in vitro data In contrast to in vitro assays reflecting stationary conditions the in vivo situation entails processes running in an open and dynamic system thereby involving not only distribution but also elimination This can initiate shifts in the systemic drug exposure and be responsible for the absence of a direct correlation to bloodplasma concentrations and thus to pharmacokinetic parameters as well Apart from this the effective excipient concentration achieved in vivo in the circulation is usually unknown and may differ from concentrations applied in vitro Although excipient concentrations can be theoretically estimated using blood volume dose and application volume values are fairly arbitrary because excipient levels decline most likely fast in the body due to dilution and degradation within the blood
52
compartment This suggests that if alterations in blood partitioning occur following administration in vivo they should be best detectable at times shortly post-dose
Even though differences between the in vitro and in vivo results were found the in vitro test can serve as a straightforward tool for rapid detection of excipient-drug interactions in blood while requiring little amounts of drug As a result the determination of in vitro blood partition parameters is proposed as a rough estimator of a possible potential of excipients to contribute to pharmacokinetics of parenteral drugs In addition to the blood-to-plasma distribution ratio the protein binding provides useful information to elucidate excipient-induced alterations and allows the calculation of the blood cell-to-free in plasma distribution ratio These data help not only to optimize the proper evaluation of pharmacokinetics in animals but also to enable a more rational approach in the development of formulations for drug candidates Therefore the in vitro investigation of blood distribution and protein binding with and without excipient is recommended at a very early preclinical stage in cases where animal pharmacokinetics of lower dosed compounds (eg PET ligands) must be examined from excipient-containing solutions (eg surfactants complexing agents) The influence assessment of excipients may also be a promising formulation approach for iv solutions of non-ionizable lipophilic and nonpolar molecules which are very challenging to formulate appropriately due to poor water solubility (eg paclitaxel docetaxel cyclosporin)
Figure 5-2 illustrates a possible formulation procedure that integrates data generated by in vitro investigations in blood Cosolvents complexing agents surfactants and combinations of these excipients are frequently used to dissolve a compound for intravenous administration in animals Method(s) are chosen considering available compound characteristics such as physicochemical and pharmacokinetic properties doses and clinical objectives If an appropriate formulation in terms of solubility and stability is found blood distribution and protein binding studies are performed both in the presence and absence (reference) of excipient(s) using in vitro assays Protein binding studies should mainly be considered if the extent of binding can be appropriately determined by ultrafiltration dialysis or ultracentrifugation all three conventional and simple methods Next partition parameters (FP fu BPR BCPR and ρ) are evaluated and compared to those obtained for the reference formulation representing an excipient-free solution (eg glucose 5 or saline including pH adjustment buffer blank plasma) Formulations are ranked in order of changes relative to the reference As a result a formulation can be modified adapted or selected for intravenous administration in animals In cases where the in vivo administration requires the addition of excipient(s) to the reference formulation to solubilize the compound the formulation must be tested in vitro The formulation is an acceptable in vivo reference if the in vitro parameters are similar to those of the excipient-free solution ie the in vitro reference The outcome of the in vivo study triggers formulation optimization to minimize or abolish excipient effects further investigation to better interpret data or formulation acceptance for in vivo dosing and formulation development Finally it should be possible to exclude or at least be aware of a potential impact of excipient(s) on the drug disposition Data can also be applied to identify both the activity of a certain excipient with different compounds and the excipient sensitivity of compounds with similar properties
53
Compound characteristics
Formulation principle Excipients
Formulation properties
In vitro assays using blood plasma
Data analysis
Adapt formulation In vivo application
Assess in vitro-in vivo correlation
Candidate-tailored formulation
Figure 5-2 Suggested flow chart for an iv formulation development strategy
In conclusion substantial drug-excipient interactions in animals have been
identified for different excipients commonly used in drug formulation and pharmacologically active compounds with diverse properties These findings support the assumption that certain excipients are not ldquoinertrdquo but are ldquofunctionalrdquo excipients and are able to alter the disposition of co-administered drugs Such data need special attention since excipient-related changes may occur with similar or other drugexcipient formulations Identifying excipient-drug interactions and understanding how excipients affect the drug behavior will assist in the pharmacokinetic characterization and the formulation developmentoptimization of drug candidates in development Furthermore a better knowledge of the relationship between drug excipient and blood constituents suggests new approaches in drug development in terms of controlling the pharmacokinetic profile by the right choice of excipient and its amount This may enable to better anticipate the target of different blood and body compartments without extensive animal and human tests potentially resulting in modulated pharmacological responses
54
6 Outlook
The results of this work demonstrated the ability of commonly used injectable excipients especially CEL HP-β-CyD and SHS to influence pharmacokinetic parameters in blood consequently contributing to altered drug disposition following iv dosing However to increase the knowledge of drug-excipient interactions additional studies are required to confirm the above findings with further drugexcipient formulations and with an emphasis on the role of excipients per se in pharmacokinetics of parenteral drugs
The excipients were tested in vitro and in vivo at a fixed concentration of 05 in
blood being within the normal range for animal injections and higher for clinical ones Investigations by varying the excipient amount would give insight into the concentration-effect relationship and potency of excipients Examination of lower excipient levels should also give an indication about the relevance and impact of excipient-induced alterations on applications in humans
No direct correlation between the interacting excipient and the compound
properties were found and no trends could be apparently observed in changes regarding the excipient characteristics Continued investigations are necessary to elucidate whether observed phenomena are associated with certain drugs or more by some drug classes characterized by specific physicochemical properties Focusing on excipients it would be of interest to explore more in detail the frequency and significance of interactions and the excipient preference in terms of particular changes
The emphasis throughout the current work was placed on providing an insight into
excipient-triggered effects and their in vitro-in vivo correlation According to the literature little is known about mechanisms underlying these alterations taking into account in vitro-in vivo investigations (94110112) To explain findings and improve excipient characterization further investigations should focus on the mechanistic basis for the role of excipients in protein binding bloodplasma partitioning and cellular distribution using in vitro assays appropriate to understand the observed effects In addition modification of in vitro approaches could facilitate correlation of effects and mechanisms determined in vitro with in vivo situations increase the understanding of in vitro-in vivo relationships and enable extrapolation of in vitro results to in vivo pharmacokinetics A better in vitro-in vivo correlation could also reduce in vivo studies and may contribute to more efficient drug development
There are drug-drug interactions reported in the literature where drugs were
administered intravenously in conjunction with excipient-containing formulation of other drugs (eg valspodar formulated in CEL) (108109) Most likely the presence of excipient(s) in drug formulations contributed to observed pharmacokinetic interactions
55
The research into the potential of excipients to induce kinetic alterations of agents administered intravenously in conjunction with excipient-containing formulation of other compounds should lead to a deeper insight into drug-drug interactions These data may provide helpful information relevant for safety issues dosage planning and treatment optimization in clinical drug monitoring
Further studies could focus on the potential clinical significance of drug-excipient
interactions observed in animals Finally ongoing efforts for a proper understanding of excipients as biologically and
pharmacologically active compounds will allow a better control of designing formulations with optimal characteristics for a better drug therapy
56
7 References
References to external publications and books
(1) Values received from Charles River Laboratoires (2) In E Green (ed) The biology of the laboratory mouse McGraw-Hill Inc New York 1966 (3) In H Baker J Lindsey and S Weisbroth (eds) The laboratory rat Academic Press Inc
New York 1979 (4) H E Weimer D M Roberts P Villanuevo and H G Porter Genetic differences in
electrophoretic patterns during the phlogistic response in the albino rat Comp Biochem Physiol B 43965-973 (1972)
(5) Geigy Scientific Tables 8th ed Vol2 Ciba-Geigy Basel 1983 (6) M Lemaire Drug binding to leucocytes and platelets Symposia Medica Hoechst 79-93
(1986) (7) P H Hinderling Red blood cells a neglected compartment in pharmacokinetics and
pharmacodynamics Pharmacol Rev 49279-295 (1997) (8) J Tillement G Houin R Zini S Urien E Albengres J Barre M Lecomte P DAthis and
B Sebille The binding of drugs to blood plasma macromolecules recent advances and therapeutic significance Adv Drug Res 1359-94 (1984)
(9) Z H Israili and P G Dayton Human alpha-1-glycoprotein and its interactions with drugs Drug Metab Rev 33161-235 (2001)
(10) K M Wasan and S M Cassidy Role of plasma lipoproteins in modifying the biological activity of hydrophobic drugs J Pharm Sci 87411-424 (1998)
(11) P du Souich J Verges and S Erill Plasma protein binding and pharmacological response Clin Pharmacokinet 24435-440 (1993)
(12) F Akhlaghi and A K Trull Distribution of cyclosporin in organ transplant recipients Clin Pharmacokinet 41615-637 (2002)
(13) G M Pacifici and A Viani Methods of determining plasma and tissue binding of drugs Pharmacokinetic consequences Clin Pharmacokinet 23449-468 (1992)
(14) J Oravcova B Bohs and W Lindner Drug-protein binding sites New trends in analytical and experimental methodology J Chromatogr B Biomed Appl 6771-28 (1996)
(15) Z Liu F Li and Y Huang Determination of unbound drug concentration and protein-drug binding fraction in plasma Biomed Chromatogr 13262-266 (1999)
(16) A Lipinski Experimental and computational approaches to estimate solubility and permeability in drug discovery and development settings Adv Drug Deliv Rev 233-26 (1997)
(17) R Panchagnula N S Thomas Biopharmaceutics and pharmacokinetics in drug research Int J Pharm 201131-150 (2000)
(18) M S Lajiness M Vieth and J Erickson Molecular properties that influence oral drug-like behavior 16 Curr Opin Drug Discov Devel 7470-477 (2004)
(19) H van de Waterbeemd G Camenisch G Folkers J R Chretien and O A Raevsky Estimation of blood-brain barrier crossing of drugs using molecular size and shape and H-bonding descriptors J Drug Target 6151-165 (1998)
(20) B Testa P Crivori M Reist P Carrupt The influence of lipophilicity on the pharmacokinetic behavior of drugs concepts and examples Persp Drug Discov Design 19179-211 (2000)
(21) In V Pliska B Testa H van Waterbeemd (eds) Methods and Principles in Medicinal Chemistry Vol4 VCH Weinheim Germany 1996
(22) G L Amidon H Lennernas V P Shah and J R Crison A theoretical basis for a biopharmaceutic drug classification the correlation of in vitro drug product dissolution and in vivo bioavailability Pharm Res 12413-420 (1995)
(23) C A Lipinski Poor aqueous solubility - an industry-wide problem in ADME screening Capsugel Symposium Tokyo Japan 33-48 (2003)
(24) C A Lipinski Drug-like properties and the causes of poor solubility and poor permeability J Pharmacol Toxicol Methods 44235-249 (2000)
57
(25) K R Horspool and C A Lipinski Advancing new drug delivery concepts to gain the lead Drug Deliv Technol 334-46 (2003)
(26) M Kaushal Amorphous drug delivery systems molecular aspects design and performance Crit Rev Ther Drug Carrier Sys 21133-193 (2004)
(27) H Fischer Blood-brain barrier permeation molecular parameters governing passive diffusion J Membrane Biol 165201-211 (1998)
(28) A Seelig A general pattern for substrate recognition by P-glycoprotein Eur J Biochem 251252-261 (1998)
(29) A Seelig X L Blatter and F Wohnsland Substrate recognition by P-glycoprotein and the multidrug resistance-associated protein MRP1 a comparison Int J Clin Pharmacol Ther 38111-121 (2000)
(30) D E Clark Rapid calculation of polar molecular surface area and its application to the prediction of transport phenomena 2 Prediction of blood-brain barrier penetration J Pharm Sci 88815-821 (1999)
(31) J Kelder Polar molecular surface as a dominating determinant for oral absorption and brain penetration of drugs Pharm Res 161514-1519 (1999)
(32) K Palm K Luthman A L Ungell G Strandlund and P Artursson Correlation of drug absorption with molecular surface properties J Pharm Sci 8532-39 (1996)
(33) K Palm P Stenberg K Luthman and P Artursson Polar molecular surface properties predict the intestinal absorption of drugs in humans Pharm Res 14568-571 (1997)
(34) D E Clark Rapid calculation of polar molecular surface area and its application to the prediction of transport phenomena 1 Prediction of intestinal absorption J Pharm Sci 88807-814 (1999)
(35) H van der Waterbeemd G Camenisch G Folkers and O A Raevsky Estimation of Caco-2 cell permeability using calculated molecular descriptors Quant Struct Act Relat 15480-490 (1996)
(36) S Winiwarter N M Bonham F Ax A Hallberg H Lennernas and A Karlen Correlation of human jejunal permeability (in vivo) of drugs with experimentally and theoretically derived parameters A multivariate data analysis approach J Med Chem 414939-4949 (1998)
(37) A Bergstroem Absorption classification of oral drugs based on molecular surface properties J Med Chem 46558-570 (2003)
(38) D F Veber S R Johnson H Y Cheng B R Smith K W Ward and K D Kopple Molecular properties that influence the oral bioavailability of drug candidates J Med Chem 452615-2623 (2002)
(39) J F Pritchard M Jurima-Romet M L Reimer E Mortimer B Rolfe and M N Cayen Making better drugs Decision gates in non-clinical drug development Nat Rev Drug Discov 2542-553 (2003)
(40) P Preziosi Opinion science pharmacoeconomics and ethics in drug RampD a sustainable future scenario Nature Rev Drug Discov 3521-526 (2004)
(41) I Kola Opinion Can the pharmaceutical industry reduce attrition rates Nature Rev Drug Discov 3711-716 (2004)
(42) L J Lesko M Rowland C C Peck T F Blaschke D Breimer H J de Jong A Grahnen J J Kuhlmann and B Stewart Optimizing the science of drug development opportunities for better candidate selection and accelerated evaluation in humans Eur J Pharm Sci 10iv-xiv (2000)
(43) G Lappin and R C Garner Big physics small doses the use of AMS and PET in human microdosing of development drugs Nat Rev Drug Discov 2233-240 (2003)
(44) R D Combes T Berridge J Connelly M D Eve R C Garner S Toon and P Wilcox Early microdose drug studies in human volunteers can minimise animal testing proceedings of a workshop organised by volunteers in research and testing Eur J Pharm Sci 191-11 (2003)
(45) Biomarkers definitions working group Biomarkers and surrogate endpoints preferred definitions and conceptual framework Clin Pharmacol Ther 6989-95 (2001)
(46) J Lesko Use of biomarkers and surrogate endpoints in drug development and regulatory decision making criteria validation strategies Annu Rev Pharmacol Toxicol 41347-366 (2001)
58
(47) R Frank and R Hargreaves Clinical biomarkers in drug discovery and development Nat Rev Drug Discov 2566-580 (2003)
(48) M Bergstrom A Grahnen and B Langstrom Positron emission tomography microdosing a new concept with application in tracer and early clinical drug development Eur J Clin Pharmacol 59357-366 (2003)
(49) M Jagoda Experiment assessment of mass effects in the rat implications for small animal PET imaging Nucl Med Biol 31771-779 (2004)
(50) Y C Lee P D Zocharski and B Samas An intravenous formulation decision tree for discovery compound formulation development Int J Pharm 253111-119 (2003)
(51) B Bittner and R J Mountfield Intravenous administration of poorly soluble new drug entities in early drug discovery the potential impact of formulation on pharmacokinetic parameters Curr Opin Drug Discov Devel 559-71 (2002)
(52) A K Singla A Garg and D Aggarwal Paclitaxel and its formulations Int J Pharm 235179-192 (2002)
(53) N Maurer D B Fenske and P R Cullis Developments in liposomal drug delivery systems Expert Opin Biol Ther 1923-947 (2001)
(54) R G Strickley Solubilizing excipients in oral and injectable formulations Pharm Res 21201-230 (2004)
(55) A G Floyd Top ten considerations in the development of parenteral emulsions 4134-143 (1999)
(56) M J Lawrence and G D Rees Microemulsion-based media as novel drug delivery systems Adv Drug Deliv Rev 4589-121 (2000)
(57) E Merisko-Liversidge G G Liversidge and E R Cooper Nanosizing a formulation approach for poorly-water-soluble compounds Eur J Pharm Sci 18113-120 (2003)
(58) E B Rabinow Nanosuspensions in drug delivery Nature Rev Drug Discov 3785-796 (2004)
(59) H Karl A good practice guide to the administration of substances and removal of blood including routes and volumes J Appl Toxicol 2115-23 (2001)
(60) D M Woodcock S Jefferson M E Linsenmeyer P J Crowther G M Chojnowski B Williams and I Bertoncello Reversal of the multidrug resistance phenotype with Cremophor EL a common vehicle for water-insoluble vitamins and drugs Cancer Res 504199-4203 (1990)
(61) D M Woodcock M E Linsenmeyer G Chojnowski A B Kriegler V Nink L K Webster and W H Sawyer Reversal of multidrug resistance by surfactants Br J Cancer 6662-68 (1992)
(62) J M Dintaman and J A Silverman Inhibition of P-glycoprotein by D-alpha-tocopheryl polyethylene glycol 1000 succinate (TPGS) Pharm Res 161550-1556 (1999)
(63) K R W A S C Wandel C Inactive ingredients may alter bioavailability of drugs through effects on P-glycoprotein (PGP) and CYP3A Clin Pharmacol Ther 69P71 (2001)
(64) A N Abulrob M Mason R Bryce and M Gumbleton The effect of fatty acids and analogues upon intracellular levels of doxorubicin in cells displaying P-glycoprotein mediated multidrug resistance J Drug Target 8247-256 (2000)
(65) G Cornaire J F Woodley S Saivin J Y Legendre S Decourt A Cloarec and G Houin Effect of polyoxyl 35 castor oil and polysorbate 80 on the intestinal absorption of digoxin in vitro Arzneimittelforschung 50576-579 (2000)
(66) E D Hugger B L Novak P S Burton K L Audus and R T Borchardt A comparison of commonly used polyethoxylated pharmaceutical excipients on their ability to inhibit P-glycoprotein activity in vitro J Pharm Sci 911991-2002 (2002)
(67) J Zastre J Jackson M Bajwa R Liggins F Iqbal and H Burt Enhanced cellular accumulation of a P-glycoprotein substrate rhodamine-123 by Caco-2 cells using low molecular weight methoxypolyethylene glycol-block-polycaprolactone diblock copolymers Eur J Pharm Biopharm 54299-309 (2002)
(68) A V Kabanov E V Batrakova and D W Miller Pluronic block copolymers as modulators of drug efflux transporter activity in the blood-brain barrier Adv Drug Deliv Rev 55151-164 (2003)
59
(69) D W Miller E V Batrakova and A V Kabanov Inhibition of multidrug resistance-associated protein (MRP) functional activity with pluronic block copolymers Pharm Res 16396-401 (1999)
(70) K Yunomae H Arima F Hirayama and K Uekama Involvement of cholesterol in the inhibitory effect of dimethyl-beta-cyclodextrin on P-glycoprotein and MRP2 function in Caco-2 cells FEBS Lett 536225-231 (2003)
(71) M M Nerurkar P S Burton and R T Borchardt The use of surfactants to enhance the permeability of peptides through Caco-2 cells by inhibition of an apically polarized efflux system Pharm Res 13528-534 (1996)
(72) R J Mountfield S Senepin M Schleimer I Walter and B Bittner Potential inhibitory effects of formulation ingredients on intestinal cytochrome P450 Int J Pharm 21189-92 (2000)
(73) B M Johnson W N Charman and C J Porter An in vitro examination of the impact of polyethylene glycol 400 Pluronic P85 and vitamin E d-alpha-tocopheryl polyethylene glycol 1000 succinate on P-glycoprotein efflux and enterocyte-based metabolism in excised rat intestine AAPS PharmSci 4E40 (2002)
(74) R C Bravo Gonzalez J Huwyler F Boess I Walter and B Bittner In vitro investigation on the impact of the surface-active excipients Cremophor EL Tween 80 and Solutol HS 15 on the metabolism of midazolam Biopharm Drug Dispos 2537-49 (2004)
(75) A G Bagnarello L A Lewis M C McHenry A J Weinstein H K Naito A J McCullough R J Lederman and T L Gavan Unusual serum lipoprotein abnormality induced by the vehicle of miconazole N Engl J Med 296497-499 (1977)
(76) H K Naito and L A Lewis Induced hyperlipidemia and delipidation of serum alpha-lipoproteins by polyethoxylated castor oil Protides Biol Fluids 25COM2-398 (1978)
(77) H K Naito M C McHenry and L A Lewis Drug-induced dyslipoproteinemia a report of two cases Clin Chem 26163-168 (1980)
(78) M Hacker M Koeferl C B Hong and M A Fagan Cremophor and Emulphor induced alterations of serum lipids and lipoprotein electrophoretic patterns of dogs Res Commun Chem Pathol Pharmacol 31119-128 (1981)
(79) M Kongshaug L S Cheng J Moan and C Rimington Interaction of Cremophor EL with human plasma Int J Biochem 23473-478 (1991)
(80) K Woodburn and D Kessel The alteration of plasma lipoproteins by Cremophor EL J Photochem Photobiol B 22197-201 (1994)
(81) D Kessel K Woodburn D Decker and E Sykes Fractionation of Cremophor EL delineates components responsible for plasma lipoprotein alterations and multidrug resistance reversal Oncol Res 7207-212 (1995)
(82) E Sykes K Woodburn D Decker and D Kessel Effects of Cremophor EL on distribution of Taxol to serum lipoproteins Br J Cancer 70401-404 (1994)
(83) G M Garbo The use of liposomes emulsions or inclusion complexes may potentiate in vivo effects of SnET2 Proc SPIE 1203118-125 (1990)
(84) D Kessel A Morgan and G M Garbo Sites and efficacy of photodamage by tin etiopurpurin in vitro using different delivery systems Photochem Photobiol 54193-196 (1991)
(85) K Woodburn C K Chang S Lee B Henderson and D Kessel Biodistribution and PDT efficacy of a ketochlorin photosensitizer as a function of the delivery vehicle Photochem Photobiol 60154-159 (1994)
(86) L K Webster E J Cosson K H Stokes and M J Millward Effect of the paclitaxel vehicle Cremophor EL on the pharmacokinetics of doxorubicin and doxorubicinol in mice Br J Cancer 73522-524 (1996)
(87) T Colombo P O Gonzalez M Zucchetti A Maneo C Sessa A Goldhirsch M DIncalci and M Maneo Paclitaxel induces significant changes in epidoxorubicin distribution in mice Ann Oncol 7801-805 (1996)
(88) T Colombo I Parisi M Zucchetti C Sessa A Goldhirsch and M DIncalci Pharmacokinetic interactions of paclitaxel docetaxel and their vehicles with doxorubicin Ann Oncol 10391-395 (1999)
(89) M J Millward L K Webster D Rischin K H Stokes G C Toner J F Bishop I N Olver B M Linahan M E Linsenmeyer and D M Woodcock Phase I trial of cremophor EL with bolus doxorubicin Clin Cancer Res 42321-2329 (1998)
60
(90) J Liu E H Kraut S Balcerzak M Grever S DAmbrosio and K K Chan Dosing sequence-dependent pharmacokinetic interaction of oxaliplatin with paclitaxel in the rat Cancer Chemother Pharmacol 50445-453 (2002)
(91) A Sparreboom O van Tellingen W J Nooijen and J H Beijnen Nonlinear pharmacokinetics of paclitaxel in mice results from the pharmaceutical vehicle Cremophor EL Cancer Res 562112-2115 (1996)
(92) A G Ellis and L K Webster Inhibition of paclitaxel elimination in the isolated perfused rat liver by Cremophor EL Cancer Chemother Pharmacol 4313-18 (1999)
(93) L Gianni L Vigano A Locatelli G Capri A Giani E Tarenzi and G Bonadonna Human pharmacokinetic characterization and in vitro study of the interaction between doxorubicin and paclitaxel in patients with breast cancer J Clin Oncol 151906-1915 (1997)
(94) A Sparreboom L van Zuylen E Brouwer W J Loos P de Bruijn H Gelderblom M Pillay K Nooter G Stoter and J Verweij Cremophor EL-mediated alteration of paclitaxel distribution in human blood clinical pharmacokinetic implications Cancer Res 591454-1457 (1999)
(95) L van Zuylen J Verweij and A Sparreboom Role of formulation vehicles in taxane pharmacology Invest New Drugs 19125-141 (2001)
(96) D Kessel Properties of Cremophor EL micelles probed by fluorescence Photochem Photobiol 56447-451 (1992)
(97) W J Loos J Szebeni A J ten Tije J Verweij D M van Zomeren K N Chung K Nooter G Stoter and A Sparreboom Preclinical evaluation of alternative pharmaceutical delivery vehicles for paclitaxel Anticancer Drugs 13767-775 (2002)
(98) Dhanikula AB Singh DR and Panchagnula R In vivo pharmacokinetic and tissue distribution studies in mice of alternative formulations for local and systemic delivery of paclitaxel gel film prodrug liposomes and micelles Curr Drug Deliv 235-44 (2005)
(99) Solvent-free paclitaxel formulation better than taxol Scrip (S00825922 20031209) 2003 (100) L Vigano A Locatelli G Grasselli and L Gianni Drug interactions of paclitaxel and
docetaxel and their relevance for the design of combination therapy Invest New Drugs 19179-196 (2001)
(101) R Danesi F Innocenti S Fogli A Gennari E Baldini A Di Paolo B Salvadori G Bocci P F Conte and M Del Tacca Pharmacokinetics and pharmacodynamics of combination chemotherapy with paclitaxel and epirubicin in breast cancer patients Br J Clin Pharmacol 53508-518 (2002)
(102) S Fogli R Danesi A Gennari S Donati P F Conte and M Del Tacca Gemcitabine epirubicin and paclitaxel pharmacokinetic and pharmacodynamic interactions in advanced breast cancer Ann Oncol 13919-927 (2002)
(103) T Kasai M Oka H Soda J Tsurutani M Fukuda Y Nakamura S Kawabata K Nakatomi S Nagashima H Takatani M Fukuda A Kinoshita and S Kohno Phase I and pharmacokinetic study of paclitaxel and irinotecan for patients with advanced non-small cell lung cancer Eur J Cancer 381871-1878 (2002)
(104) B L Lum S Kaubisch A M Yahanda K M Adler L Jew M N Ehsan N A Brophy J Halsey M P Gosland and B I Sikic Alteration of etoposide pharmacokinetics and pharmacodynamics by cyclosporine in a phase I trial to modulate multidrug resistance J Clin Oncol 101635-1642 (1992)
(105) N J Lacayo B L Lum D L Becton H Weinstein Y Ravindranath M N Chang L Bomgaars S J Lauer B I Sikic and G V Dahl Pharmacokinetic interactions of cyclosporine with etoposide and mitoxantrone in children with acute myeloid leukemia Leukemia 16920-927 (2002)
(106) D A Rushing S R Raber K A Rodvold S C Piscitelli G S Plank and D A Tewksbury The effects of cyclosporine on the pharmacokinetics of doxorubicin in patients with small cell lung cancer Cancer 74834-841 (1994)
(107) B L Samuels R Mick N J Vogelzang S F Williams R L Schilsky A R Safa S M OBrien and M J Ratain Modulation of vinblastine resistance with cyclosporine a phase I study Clin Pharmacol Ther 54421-429 (1993)
61
(108) D J Boote I F Dennis P R Twentyman R J Osborne C Laburte S Hensel J F Smyth M H Brampton and N M Bleehen Phase I study of etoposide with SDZ PSC 833 as a modulator of multidrug resistance in patients with cancer J Clin Oncol 14610-618 (1996)
(109) H Minami T Ohtsu H Fujii T Igarashi K Itoh N Uchiyama-Kokubu T Aizawa T Watanabe Y Uda Y Tanigawara and Y Sasaki Phase I study of intravenous PSC-833 and doxorubicin reversal of multidrug resistance Jpn J Cancer Res 92220-230 (2001)
(110) M Jin T Shimada K Yokogawa M Nomura Y Mizuhara H Furukawa J Ishizaki and K Miyamoto Cremophor EL releases cyclosporin A adsorbed on blood cells and blood vessels and increases apparent plasma concentration of cyclosporin A Int J Pharm 293137-144 (2005)
(111) M E Davis and M E Brewster Cyclodextrin-based pharmaceutics past present and future Nat Rev Drug Discov 31023-1035 (2004)
(112) V J Stella V M Rao E A Zannou and V Zia V Mechanisms of drug release from cyclodextrin complexes Adv Drug Deliv Rev 363-16 (1999)
(113) H W Frijlink A C Eissens N R Hefting K Poelstra C F Lerk and D K Meijer The effect of parenterally administered cyclodextrins on cholesterol levels in the rat Pharm Res 89-16 (1991)
(114) H W Frijlink E J Franssen A C Eissens R Oosting C F Lerk and D K Meijer The effects of cyclodextrins on the disposition of intravenously injected drugs in the rat Pharm Res 8380-384 (1991)
(115) E E Sideris M A Koupparis and P E Macheras Effect of cyclodextrins on protein binding of drugs the diflunisalhydroxypropyl-beta-cyclodextrin model case Pharm Res 1190-95 (1994)
(116) P Y Grosse F Bressolle P Rouanet and J M Joulia Methyl-beta-cyclodextrin and doxorubicin pharmacokinetics and tissue concentrations following bolus injection of these drugs alone or together in the rabbit Int J Pharm 180215-223 (1999)
(117) T Shinoda S Kagatani A Maeda Y Konno H Hashimoto K Hara K Fujita and T Sonobe Sugar-branched-cyclodextrins as injectable drug carriers in mice Drug Dev Ind Pharm 251185-1192 (1999)
(118) B McCormack and G Gregoriadis Comparative studies of the fate of free and liposome-entrapped hydroxypropyl-beta-cyclodextrindrug complexes after intravenous injection into rats implications in drug delivery Biochim Biophys Acta 1291237-244 (1996)
(119) A Sharma K Anderson and J W Baker Flocculation of serum lipoproteins with cyclodextrins application to assay of hyperlipidemic serum Clin Chem 36529-532 (1990)
(120) A Sharma and L S Janis Lipoprotein-cyclodextrin interaction Clin Chim Acta 199129-137 (1991)
(121) T Irie M Otagiri M Sunada K Uekama Y Ohtani Y Yamada and Y Sugiyama Cyclodextrin-induced hemolysis and shape changes of human erythrocytes in vitro J Pharmacobiodyn 5741-744 (1982)
(122) M E Brewster W R Anderson D Meinsma D Moreno A I Webb L Pablo K S Estes H Derendorf N Bodor R Sawchuk B Cheung and E Pop Intravenous and oral pharmacokinetic evaluation of a 2-hydroxypropyl-beta-cyclodextrin-based formulation of carbamazepine in the dog comparison with commercially available tablets and suspensions J Pharm Sci 86335-339 (1997)
(123) K Dietzel K S Estes M E Brewster N S Bodor and H Derendorf The use of 2-hydroxypropyl-beta-cyclodextrin as a vehicle for intravenous administration of dexamethasone in dogs Int J Pharm 59225-230 (1990)
(124) J Cummings G J Forrest D Cunningham N L Gilchrist and M Soukop Influence of polysorbate 80 (Tween 80) and etoposide (VP-16-213) on the pharmacokinetics and urinary excretion of adriamycin and its metabolites in cancer patients Cancer Chemother Pharmacol 1780-84 (1986)
(125) W J Loos S D Baker J Verweij J G Boonstra and A Sparreboom Clinical pharmacokinetics of unbound docetaxel role of polysorbate 80 and serum proteins Clin Pharmacol Ther 74364-371 (2003)
62
(126) O van Tellingen J H Beijnen J Verweij E J Scherrenburg W J Nooijen and A Sparreboom Rapid esterase-sensitive breakdown of polysorbate 80 and its impact on the plasma pharmacokinetics of docetaxel and metabolites in mice Clin Cancer Res 52918-2924 (1999)
(127) K Woodburn E Sykes and D Kessel Interactions of Solutol HS 15 and Cremophor EL with plasma lipoproteins Int J Biochem Cell Biol 27693-699 (1995)
(128) J M Grindel T Jaworski R M Emanuele and P Culbreth Pharmacokinetics of a novel surface-active agent purified poloxamer 188 in rat rabbit dog and man Biopharm Drug Dispos 2387-103 (2002)
(129) T W Guentert S Oie L Paalzow B M Frey R Brandt L J Aarons and M Rowland Interaction of mixed micelles formed from glycocholic acid and lecithin with the protein binding of various drugs Br J Clin Pharmacol 23569-577 (1987)
(130) P R Cullis A Chonn and S C Semple Interactions of liposomes and lipid-based carrier systems with blood proteins Relation to clearance behaviour in vivo Adv Drug Deliv Rev 323-17 (1998)
(131) P Opanasopit M Nishikawa and M Hashida Factors affecting drug and gene delivery effects of interaction with blood components Crit Rev Ther Drug Carrier Syst 19191-233 (2002)
(132) L Araujo R Lobenberg and J Kreuter Influence of the surfactant concentration on the body distribution of nanoparticles J Drug Target 6373-385 (1999)
(133) S Stolnik B Daudali A Arien J Whetstone C R Heald M C Garnett S S Davis and L Illum The effect of surface coverage and conformation of poly(ethylene oxide) (PEO) chains of poloxamer 407 on the biological fate of model colloidal drug carriers Biochim Biophys acta 1514261-279 (2001)
(134) J F Krzyzaniak D M Raymond and S H Yalkowsky Lysis of human red blood cells 2 Effect of contact time on cosolvent induced hemolysis Int J Pharm 152193-200 (1997)
(135) F Mottu M J Stelling D A Rufenacht and E Doelker Comparative hemolytic activity of undiluted organic water-miscible solvents for intravenous and intra-arterial injection PDA J Pharm Sci Technol 5516-23 (2001)
(136) E Soderlind M Wollbratt and C von Corswant The usefulness of sugar surfactants as solubilizing agents in parenteral formulations Int J Pharm 25261-71 (2003)
(137) B Nuijen M Bouma C Manada J M Jimeno A Bult and J H Beijnen In vitro hemolysis and buffer capacity studies with the novel marine anticancer agent kahalalide F and its reconstitution vehicle Cremophor ELethanol PDA J Pharm Sci Technol 55223-229 (200)
(138) R A Rajewski G Traiger J Bresnahan P Jaberaboansari V J Stella and D O Thompson Preliminary safety evaluation of parenterally administered sulfoalkyl ether beta-cyclodextrin derivatives J Pharm Sci 84927-932 (1995)
(139) T M Florence and J L Stauber Hemolysis of human erythrocytes by alpha-tocopheryl succinate J Nutrit Environ Med 8345-347 (1998)
(140) J Neuzil M Zhao G Ostermann M Sticha N Gellert C Weber J W Eaton and U T Brunk Alpha-tocopheryl succinate an agent with in vivo anti-tumour activity induces apoptosis by causing lysosomal instability Biochem J 362709-715 (2002)
(141) S H Wu and W K Hopkins Characteristics of d-a-tocopheryl PEG 1000 succinate for applications as an absorption enhancer in drug delivery systems Pharm Technol 2352-68 (1999)
(142) H W Frijlink J Visser N R Hefting R Oosting D K Meijer and C F Lerk The pharmacokinetics of beta-cyclodextrin and hydroxypropyl-beta-cyclodextrin in the rat Pharm Res 71248-1252 (1990)
(143) V J Stella and R A Rajewski Cyclodextrins their future in drug formulation and delivery Pharm Res 14556-567 (1997)
(144) In P K Gupta and G A Brazeau (eds) Injectable drug development techniques to reduce pain and irritation Interpharm Press Denver Colorado 1999
(145) B Davies and T Morris Physiological parameters in laboratory animals and humans Pharm Res 101093-1095 (1993)
63
References to internal reports of Novartis Pharma AG
(146) In vitro blood distribution and plasma protein binding of [3H]COM1 including stability in blood and plasma for rat and human PCS(EU) R0400014 Preclinical Safety Novartis Pharma AG Basel Switzerland 14-May-2004
(147) In vitro blood distribution and stability of [3H]COM2 for mouse rat and human PCS(EU) R0201077 Preclinical Safety Novartis Pharma AG Basel Switzerland 07-May-2003
(148) In vitro blood distribution plasma protein binding and stability in blood and plasma of [3H]COM3 for mouse rat dog cynomolgus monkey and human DMPK R0400595 Drug Metabolism and Pharmacokinetics Novartis Pharma AG Basel Switzerland 01-Feb-2005
(149) In vitro blood distribution and plasma protein binding of [14C]COM4 and stability in blood and plasma for rat ferret dog monkey and human PCS(EU) R0201539 Preclinical Safety Novartis Pharma AG Basel Switzerland 24-Sep-2003
(150) In vitro blood distribution plasma protein binding and stability in blood of [14C]COM5 for mouse rat dog and human PCS(EU) R0201107 Preclinical Safety Novartis Pharma AG Basel Switzerland 14-May-2003
(151) Absorption distribution and excretion of [14C]COM5 after single intravenous (1 mLkg) and oral (3 mgkg) administration to rat PCS(EU) R0201108 Preclinical Safety Novartis Pharma AG Basel Switzerland 19-May-2003
(152) ADME in rat after oral (08 mgkg) and intravenous (04 mgkg) administration of [14C]COM4 PCS(EU) R0201540 Preclinical Safety Novartis Pharma AG Basel Switzerland 19-Dec-2003
(153) Blood pharmacokinetics tissue distribution and excretion of [3H]COM2 in OF1 normal male mice and brain penetration of [3H]COM2 in APP23 transgenic and wild-type female mice after single intravenous (4 microgkg) administration PCS(EU) R0201082 Preclinical Safety Novartis Pharma AG Basel Switzerland 08-May-2003
64
8 Appendix
Raw data of COM1 in rat
In vitro blood distribution of [3H]COM1 using blood pools with different hematocrits
Total radioactivity concentration determined in blood and plasma
Excipient Nominal COM1 H Incubation Actual values
in blood time (pg-eqmL mean plusmnSD n=3) in blood (pgmL) (min) Blood Plasma
None 60 048 0 53 plusmn 1 76 plusmn 1 (Glu) 5 53 plusmn 1 75 plusmn 0 10 52 plusmn 1 74 plusmn 1 20 52 plusmn 0 74 plusmn 1 6000 0 5335 plusmn 80 7835 plusmn 121 5 5637 plusmn 116 7784 plusmn 103 10 5576 plusmn 40 7598 plusmn 114 20 5502 plusmn 76 7502 plusmn 98 HP-β-CyD 05 60 048 0 62 plusmn 1 97 plusmn 0 5 62 plusmn 1 96 plusmn 1 10 62 plusmn 1 94 plusmn 1 20 62 plusmn 0 93 plusmn 1 6000 0 6564 plusmn 21 10052 plusmn 31 5 6550 plusmn 30 10057 plusmn 214 10 6434 plusmn 85 9896 plusmn 66 20 6280 plusmn 213 9918 plusmn 80 5 60 045 0 64 plusmn 0 102 plusmn 1 5 65 plusmn 1 102 plusmn 1 10 63 plusmn 1 102 plusmn 1 20 64 plusmn 1 101 plusmn 1 6000 0 6516 plusmn 132 10660 plusmn 26 5 6598 plusmn 273 10762 plusmn 382 10 6475 plusmn 288 10454 plusmn 163 20 6653 plusmn 79 10482 plusmn 130 SHS 05 60 048 0 60 plusmn 2 86 plusmn 2 5 60 plusmn 0 94 plusmn 19 10 60 plusmn 1 81 plusmn 1 20 60 plusmn 0 81 plusmn 1 6000 0 6265 plusmn 40 8845 plusmn 102 5 6240 plusmn 92 8562 plusmn 44 10 6127 plusmn 110 8432 plusmn 35 20 6104 plusmn 112 8109 plusmn 122 5 60 045 0 59 plusmn 1 93 plusmn 1 5 58 plusmn 1 92 plusmn 0 10 56 plusmn 1 91 plusmn 1 20 58 plusmn 1 91 plusmn 1 6000 0 6166 plusmn 65 9908 plusmn 44 5 6180 plusmn 162 9607 plusmn 123 10 6230 plusmn 99 9529 plusmn 119 20 6189 plusmn 104 9489 plusmn 211
65
In vitro blood distribution of [3H]COM1 continued
Excipient Nominal COM1 H Incubation Actual values
in blood time (pg-eqmL mean plusmnSD n=3) in blood (pgmL) (min) Blood Plasma
TPGS 05 60 048 0 59 plusmn 1 92 plusmn 1 5 58 plusmn 1 90 plusmn 1 10 58 plusmn 1 88 plusmn 2 20 58 plusmn 0 87 plusmn 1 6000 0 5494 plusmn 102 8949 plusmn 87 5 5518 plusmn 124 8549 plusmn 165 10 5552 plusmn 74 8387 plusmn 101 20 5431 plusmn 23 8286 plusmn 71 5 60 040 0 50 plusmn 1 81 plusmn 1 5 50 plusmn 1 80 plusmn 1 10 50 plusmn 0 79 plusmn 1 20 50 plusmn 1 72 plusmn 1 6000 0 5042 plusmn 20 8175 plusmn 148 5 5014 plusmn 34 7907 plusmn 136 10 5102 plusmn 59 7952 plusmn 77 20 5069 plusmn 68 7204 plusmn 35 Triplicate analyses were conducted on one aliquot for each time point
In vitro protein binding of [3H]COM1 using the same plasma pool
Total radioactivity concentration determined in plasma and ultrafiltrate samples
Excipient Nominal COM1 Actual values (pg-eqmL) in plasma (pgmL) Plasma Ultrafiltrate None 60 65 26 (Glu) 26 26 6000 6302 270 268 272 TPGS 05 60 62 27 21 29 6000 5708 171 230 133 5 60 67 12 13 11 6000 5886 187 103 68 Mean of duplicate determination of plasma spiked with different COM1 stock solutions
66
Tissue and plasma levels of parent drug and total radioactivity after iv administration of [3H]COM1 (4 microgkg) in the control group
Time Tissue Individual concentration values
(h) COM1 (pgg) Radioactivity (pg-eqg) 008 Plasma 866 381 958 2529 1871 2052 Lung 2012 1440 1867 3431 2224 2538 Heart 2366 973 1619 2593 1490 1808 Liver 1069 384 724 11805 9501 10699 Kidney 2263 995 1692 6350 5770 5281 Fat 2803 1982 4753 2638 2213 4859 Muscle 1405 811 1234 1312 882 1172 Skin 433 225 296 937 524 583 Brain 6229 4525 4712 5431 4004 4053 025 Plasma 275 257 178 1719 1482 1366 Lung 399 607 518 1491 1378 1374 Heart 517 645 285 1034 1023 778 Liver 274 511 238 7904 6502 6920 Kidney 557 664 321 5270 5046 5425 Fat 6508 5897 4206 5953 5307 4112 Muscle 565 574 306 659 686 463 Skin 228 213 219 581 702 570 Brain 3407 4085 3014 3033 3552 2719 05 Plasma 179 103 101 1525 1442 1379 Lung 622 367 335 1365 1089 1030 Heart 310 211 214 684 684 661 Liver 138 71 100 7090 5263 4993 Kidney 345 220 202 4924 4585 5053 Fat 8008 4790 4248 6586 4071 3649 Muscle 270 159 166 409 349 342 Skin 199 64 104 559 449 480 Brain 2676 2419 2123 2310 2180 1953 pgmL and pg-eqmL
67
Tissue and plasma levels of parent drug and total radioactivity after iv administration of [3H]COM1 (4 microgkg) in the TPGS group
Time Tissue Individual concentration values
(h) COM1 (pgg) Radioactivity (pg-eqg) 008 Plasma 312 297 278 2842 2939 3006 Lung 1370 1173 1560 2364 2057 2272 Heart 1190 971 912 1584 1262 1291 Liver 449 234 337 10459 8898 10720 Kidney 1012 768 806 5047 4767 4829 Fat 2182 1485 1860 2712 2380 1703 Muscle 845 726 1132 880 720 1046 Skin 100 45 53 665 351 343 Brain 4072 2765 3083 3816 2353 2709 025 Plasma 89 107 121 2040 2440 2368 Lung 531 688 546 1343 1488 1356 Heart 351 471 454 737 864 851 Liver 104 205 170 5354 6770 5184 Kidney 321 435 446 6931 4972 6603 Fat 1352 3916 1578 1456 4764 2035 Muscle 355 649 588 532 789 675 Skin 71 72 37 563 518 342 Brain 1811 2327 1955 1648 2017 1841 05 Plasma 35 65 61 2027 2054 2186 Lung 214 195 319 1172 1067 1115 Heart 167 207 250 539 566 650 Liver 75 70 117 4225 4417 4314 Kidney 197 209 215 6923 6364 5600 Fat 3406 2067 2295 3071 1625 2734 Muscle 191 226 256 343 394 368 Skin 120 52 41 515 389 398 Brain 1516 1332 1541 1413 1295 1480 pgmL and pg-eqmL
Ex vivo protein binding of [3H]COM1 in the control and TPGS group
Parent drug concentration determined in plasma and ultrafiltrate
Dose Time Individual values (pgmL)
(microgkg) (h) Plasma Ultrafiltrate Control group 4 008 794 169 169 025 249 55 51 050 137 27 26 TPGS group 27 008 331 127 120 025 120 41 44 050 60 25 24 Mean of duplicate determination of plasma pooled for each time point
68
Raw data of COM2 in mouse
In vitro blood distribution of [3H]COM2 using blood pools with different hematocrits
Total radioactivity concentration determined in blood and plasma
Excipient Nominal COM2 H Incubation Actual values
in blood time (pg-eqmL mean plusmnSD n=3) (pgmL) (min) Blood Plasma
None 100 045 5 115 plusmn 2 85 plusmn 3 (Glu) 60 115 plusmn 5 93 plusmn 4 240 112 plusmn 6 101 plusmn 2 CELEtOH 6535 100 045 5 104 plusmn 5 86 plusmn 4 60 105 plusmn 2 83 plusmn 1 240 102 plusmn 1 87 plusmn 6 100rsquo000 046 5 103797 plusmn 1430 83684 plusmn 1446 60 102979 plusmn 1547 81784 plusmn 896 240 105912 plusmn 2594 80887 plusmn 998 HP-β-CyD 100 045 5 103 plusmn 5 88 plusmn 2 60 104 plusmn 5 94 plusmn 1 240 99 plusmn 2 94 plusmn 7 100rsquo000 043 5 105176 plusmn 1165 92396 plusmn 1519 60 104609 plusmn 1238 95791 plusmn 668 240 107331 plusmn 880 96454 plusmn 1780 SHS 100 045 5 101 plusmn 1 86 plusmn 1 60 99 plusmn 4 85 plusmn 1 240 105 plusmn 3 84 plusmn 3 100rsquo000 044 5 118080 plusmn 891 99140 plusmn 1915 60 116422 plusmn 2822 93052 plusmn 1190 240 116363 plusmn 890 89790 plusmn 1735 PEG 200 100 045 5 124 plusmn 4 96 plusmn 1 60 125 plusmn 6 95 plusmn 2 240 122 plusmn 2 103 plusmn 5 100rsquo000 046 5 112001 plusmn 3923 87146 plusmn 1273 60 112161 plusmn 1189 89801 plusmn 1646 240 110680 plusmn 652 90561 plusmn 1883 TPGS 100 045 5 101 plusmn 2 115 plusmn 2 60 104 plusmn 2 101 plusmn 1 240 101 plusmn 3 95 plusmn 3 100rsquo000 043 5 100911 plusmn 1443 106192 plusmn 992 60 100608 plusmn 3207 88758 plusmn 1037 240 100236 plusmn 4088 81755 plusmn 810 Triplicate analyses were conducted on one aliquot for each time point similar to previous study
In vitro protein binding of [
3H]COM2 at 10 ngmL using the same plasma pool
Parent drug concentration determined in plasma and ultracentrifugate
Excipient Actual values (pgmL) in plasma Plasma Ultracentrifugate None 9649 166 (plasma) 9278 164 9162 164 9292 164 TPGS 05 8624 116 8651 124 8722 103 8739 99
69
Tissue and plasma levels of parent drug and total radioactivity after iv administration of [3H]COM2 (04 microgkg) in the control group
Time Tissue Individual concentration values
(h) COM2 (pgg) Radioactivity (pg-eqg) 008 Plasma 110 112 91 181 194 164 Lung 1964 1955 1504 2450 2199 1704 Heart 796 830 623 1074 950 741 Liver 2398 2387 1778 3112 3022 2360 Kidney 2083 1871 1327 2276 2024 1511 Fat 140 327 230 58 540 603 Muscle 124 170 203 160 218 234 Skin 0 35 10 14 76 32 Brain 1155 1112 1018 1097 1086 1046 025 Plasma 94 71 77 164 141 139 Lung 1344 908 1365 1648 1849 1759 Heart 495 465 433 622 593 580 Liver 1579 1214 1549 2218 2161 2381 Kidney 1194 1075 1259 1468 1445 1518 Fat 714 459 778 1103 977 1218 Muscle 201 217 227 251 268 258 Skin 113 16 59 160 73 114 Brain 1060 1191 1345 1064 1150 1287 05 Plasma 60 58 58 119 113 111 Lung 720 703 842 1192 1444 1350 Heart 295 262 331 454 447 447 Liver 978 861 1040 1918 2348 2129 Kidney 757 753 932 1017 1303 1336 Fat 1014 602 973 1836 1164 2203 Muscle 187 167 189 242 252 231 Skin 87 16 18 97 129 104 Brain 1209 1006 1044 1160 1003 1044 1 Plasma 32 41 28 60 79 49 Lung 369 478 468 1465 1274 1171 Heart 154 199 205 347 377 364 Liver 591 618 534 2077 1736 1383 Kidney 471 522 451 1088 1020 846 Fat 496 444 713 1066 1458 1253 Muscle 103 80 91 171 169 146 Skin 0 38 48 138 123 122 Brain 673 832 688 826 902 806 pgmL and pg-eqmL value below LOQ
70
Tissue and plasma levels of parent drug and total radioactivity after iv administration of [3H]COM2 (04 microgkg) in the TPGS group
Time Tissue Individual concentration values
(h) COM2 (pgg) Radioactivity (pg-eqg) 008 Plasma 223 248 268 506 549 606 Lung 1789 1913 1880 2036 2137 2116 Heart 661 711 724 766 890 924 Liver 2331 2252 2360 2593 2585 2656 Kidney 1697 1831 1677 1815 2014 1839 Fat 246 150 317 362 366 740 Muscle 108 190 272 144 246 330 Skin 0 20 60 39 36 77 Brain 913 1069 1133 904 1024 1080 025 Plasma 178 148 151 403 377 394 Lung 1522 1175 1133 1820 1412 1436 Heart 489 478 452 593 597 578 Liver 1636 1743 1500 2243 2293 2130 Kidney 1112 1114 1256 1387 1415 1513 Fat 932 915 1480 1742 1392 2239 Muscle 237 222 183 290 288 283 Skin 23 0 38 144 140 96 Brain 1088 1244 1207 1004 1150 1166 05 Plasma 111 118 143 330 359 421 Lung 890 911 968 1292 1728 1599 Heart 292 385 384 420 630 570 Liver 1086 1200 1128 1901 2342 2002 Kidney 864 996 1103 1124 1584 1452 Fat 1393 ― 765 1492 ― 1576 Muscle 156 181 173 232 273 269 Skin 44 73 114 106 131 192 Brain 1048 1272 1325 1003 1298 1237 1 Plasma 79 97 63 333 296 264 Lung 669 885 512 1672 1588 1769 Heart 231 285 143 519 483 423 Liver 774 1028 798 2073 1946 2394 Kidney 726 835 659 1431 1342 1374 Fat ― 320 688 ― 1036 1712 Muscle 143 137 76 210 240 221 Skin 30 147 52 158 220 194 Brain 1141 1188 889 1204 1202 1070 pgmL and pg-eqmL value below LOQ no fat dissectible
71
Raw data of COM3 in rat
In vitro blood distribution of [3H]COM3 using the same blood pool (H 044)
Total radioactivity concentration determined in blood and plasma
Excipient Nominal COM3 Incubation Actual values
in blood time (ng-eqmL mean plusmnSD n=3) (ngmL) (min) Blood Plasma
None 5 5 46 plusmn 03 17 plusmn 0 (Glu) 30 46 plusmn 02 17 plusmn 01 60 47 plusmn 04 17 plusmn 01 500 5 511 plusmn 2 179 plusmn 0 30 507 plusmn 6 178 plusmn 2 60 512 plusmn 9 176 plusmn 2 CELEtOH 6535 5 5 49 plusmn 04 18 plusmn 01 30 49 plusmn 03 17 plusmn 0 60 51 plusmn 02 17 plusmn 0 500 5 516 plusmn 6 161 plusmn 2 30 508 plusmn 2 160 plusmn 1 60 508 plusmn 9 156 plusmn 1 HP-β-CyD 5 5 53 plusmn 02 35 plusmn 01 30 52 plusmn 04 35 plusmn 01 60 51 plusmn 0 36 plusmn 01 500 5 516 plusmn 5 324 plusmn 2 30 510 plusmn 2 320 plusmn 5 60 512 plusmn 4 326 plusmn 2 SHS 5 5 49 plusmn 02 14 plusmn 0 30 47 plusmn 01 15 plusmn 0 60 49 plusmn 03 16 plusmn 0 500 5 498 plusmn 10 143 plusmn 0 30 506 plusmn 14 143 plusmn 3 60 498 plusmn 1 144 plusmn 1 PEG 200 5 5 49 plusmn 04 17 plusmn 01 30 51 plusmn 01 17 plusmn 01 60 48 plusmn 01 18 plusmn 01 500 5 520 plusmn 7 169 plusmn 1 30 510 plusmn 9 170 plusmn 2 60 518 plusmn 6 176 plusmn 3 EtOHPEG200Glu 5 5 46 plusmn 03 18 plusmn 01 5590 30 43 plusmn 02 18 plusmn 01 60 44 plusmn 01 18 plusmn 01 500 5 535 plusmn 10 188 plusmn 1 30 535 plusmn 10 194 plusmn 2 60 538 plusmn 8 192 plusmn 1 TPGS 5 5 52 plusmn 03 23 plusmn 0 30 51 plusmn 0 22 plusmn 01 60 51 plusmn 0 24 plusmn 03 500 5 546 plusmn 3 231 plusmn 3 30 542 plusmn 6 231 plusmn 2 60 551 plusmn 5 231 plusmn 2 Triplicate analyses were conducted on one aliquot for each time point
72
In vitro protein binding of [3H]COM3 using the same plasma pool
Excipient Nominal COM3 Actual values
in plasma (ng-eqmL) (ngmL) Plasma Ultrafiltrate None 5 58 067 (Glu) 076 068 500 512 63 63 62 HP-β-CyD 5 54 22 21 22 500 538 214 216 209 EtOHPEG200Glu 5 5590 5 52 066 067 065 500 552 66 66 64 Mean of duplicate determination of plasma spiked with different COM3 stock solutions
Ex vivo protein binding of [3H]COM3 in the control and HP-β-CyD group
Parent drug concentration determined in plasma amp ultrafiltrate
Time Individual values (pgmL)
(h) Plasma Ultrafiltrate Control group 008 168 11 13 05 46 04 1 35 03 HP-β-CyD group 008 97 25 23 05 54 08 07 1 34 02 03 Mean of duplicate determination of plasma pooled for each time point
73
Circulation and tissue levels of parent drug and total radioactivity after iv administration of [3H]COM3 (03 mgkg) in the control group
Time Tissue Individual concentration values
(h) COM3 (ngg) Radioactivity (ng-eqg) 008 Blood 39 42 57 60 63 81 Plasma 15 19 19 38 40 41 Liver 1196 1394 1645 2097 2517 2767 Kidney 1760 1646 2019 2354 2286 2677 Fat 152 137 95 193 176 97 Heart 536 534 722 668 676 927 Lung 5712 5711 7113 8073 7897 9688 Muscle 152 112 105 161 112 98 Skin 209 139 85 216 136 86 Brain 1048 1062 1382 1323 1334 1736 05 Blood 20 13 18 75 85 83 Plasma 8 5 6 89 115 104 Liver 644 419 700 2619 2716 2654 Kidney 671 400 692 1162 843 1144 Fat 66 45 59 89 80 83 Heart 210 125 199 296 201 278 Lung 2425 1317 2267 3403 1811 2947 Muscle 222 98 144 282 144 185 Skin 103 81 99 131 119 164 Brain 1002 803 909 1260 996 1164 1 Blood 11 11 10 80 70 60 Plasma 4 5 4 105 99 74 Liver 383 427 373 1866 2152 2030 Kidney 345 405 320 707 758 659 Fat 30 31 33 49 52 53 Heart 106 126 102 161 188 157 Lung 1158 1092 1340 1680 1539 1817 Muscle 96 109 92 154 167 149 Skin 55 85 63 118 148 129 Brain 647 691 622 811 875 775 pgmL and pg-eqmL
74
Circulation and tissue levels of parent drug and total radioactivity after iv administration of [3H]COM3 (03 mgkg) in the HP-β-CyD group
Time Tissue Individual concentration values
(h) COM3 (ngg) Radioactivity (ng-eqg) 008 Blood 34 31 32 53 52 48 Plasma 12 10 10 29 32 28 Liver 850 1052 1271 1181 1665 1901 Kidney 1413 1330 1474 1770 1611 1778 Fat 68 85 103 70 99 121 Heart 592 500 598 719 593 725 Lung 4669 4377 4739 6069 5352 5939 Muscle 151 147 129 159 157 129 Skin 84 64 nd 66 49 nd Brain 954 990 908 1125 1165 1087 05 Blood 19 18 17 74 70 82 Plasma 6 6 6 77 75 96 Liver 617 558 677 2110 2107 2159 Kidney 524 417 496 743 652 810 Fat 47 39 51 59 51 68 Heart 212 178 169 276 233 222 Lung 2355 2513 2258 2931 3032 2853 Muscle 137 137 116 172 169 143 Skin 32 37 50 52 65 135 Brain 733 743 822 895 864 958 1 Blood 11 10 10 65 69 71 Plasma 4 3 4 77 87 92 Liver 344 nd 336 1765 nd 1597 Kidney 300 251 328 515 454 617 Fat 28 19 20 41 43 44 Heart 106 98 94 143 153 143 Lung 1257 926 976 1582 1205 1237 Muscle 98 98 59 133 161 84 Skin 29 27 23 49 110 68 Brain 606 604 588 734 726 697 pgmL and pg-eqmL not determined due to glas vial broken by homogenization
In situ bladder catheterization of [14
C]COM3 in the control and HP-β-CyD group
Time Urinary concentration Urine excreted
(h) COM3 (ngmL) Radioactivity (ng-eqmL) (g) Control 05 190 331 7226 13857 0685 0350 group 1 721 339 17998 12039 0460 0439 15 88 151 2855 7869 1130 0477 2 64 134 2435 9293 0790 0261 HP-β-CyD 05 1911 5216 4903 3523 13028 12248 2635 0851 0784 group 1 7900 524 2965 44618 5086 27031 0119 1068 0265 15 4209 899 1268 40724 18439 19080 0111 0188 0267 2 1993 184 597 31856 7994 11100 0124 0412 0335 Rat Ndeg3 died during in situ experiment
75
Raw data of COM4 in rat
In vitro blood distribution of [14
C]COM4 at 100 ngmL using the same blood pool (H 044) Total radioactivity concentration determined in blood and plasma
Excipient Incubation Actual values
time (ng-eqmL mean plusmnSD n=3) in blood (min) Blood Plasma None 05 5 98 plusmn 2 169 plusmn 0 (saline) 30 98 plusmn 1 167 plusmn 1 60 98 plusmn 2 168 plusmn 3 CEL 05 5 99 plusmn 0 147 plusmn 0 30 99 plusmn 2 135 plusmn 2 60 98 plusmn 1 128 plusmn 1 1 5 103 plusmn 1 139 plusmn 1 30 104 plusmn 0 125 plusmn 1 60 104 plusmn 2 120 plusmn 2 HP-β-CyD 05 5 125 plusmn 2 202 plusmn 1 30 125 plusmn 1 201 plusmn 3 60 124 plusmn 0 199 plusmn 3 1 5 116 plusmn 2 171 plusmn 3 30 117 plusmn 3 171 plusmn 2 60 117 plusmn 2 170 plusmn 3 SHS 05 5 110 plusmn 2 165 plusmn 2 30 110 plusmn 1 155 plusmn 1 60 110 plusmn 1 153 plusmn 3 1 5 112 plusmn 1 150 plusmn 2 30 112 plusmn 3 150 plusmn 1 60 112 plusmn 0 148 plusmn 2 Triplicate analyses were conducted on one aliquot for each time point
76
In vitro protein binding of [14
C]COM4 at 100 ngmL using the same plasma pool Total radioactivity concentration determined in plasma and ultrafiltrate
Excipient Actual values
(pg-eqmL) in plasma Plasma Ultrafiltrate None 97 25 (saline) 23 22 CEL 001 105 25 24 23 01 117 36 38 35 05 102 115 109 113 1 97 254 250 249 HP-β-CyD 001 99 27 25 24 01 102 43 47 43 05 134 131 133 131 1 112 172 151 150 SHS 001 99 25 22 22 01 101 34 31 33 05 116 115 111 112 1 112 171 174 167 PEG 200 100 22 24 24 TPGS 114 23 24 22 Mean of duplicate determination of plasma spiked with different COM4 stock solutions
77
Circulation and tissue levels of total radioactivity after iv administration of [14
C]COM4
Time Tissue Individual concentration values (ng-eqg)
(h) Control group CEL group 008 Blood 1258 1855 1551 1340 1515 1556 Plasma 2047 2761 2640 2211 2548 2517 Plasma water 123 50 49 287 477 478 Lung 659 815 737 754 763 788 Muscle 216 228 222 251 230 250 Skin 348 229 253 229 227 307 025 Blood 1306 1202 1069 1350 1183 1414 Plasma 2343 1983 1893 2357 1910 2273 Plasma water 92 99 83 118 179 201 Lung 697 657 608 737 651 741 Muscle 206 215 205 204 212 216 Skin 443 317 330 351 402 432 05 Blood 1398 1431 1303 1394 1112 1142 Plasma 2382 2543 2238 2357 1969 1926 Plasma water 63 124 46 106 151 191 Lung 710 731 644 720 666 641 Muscle 202 206 197 204 203 204 Skin 363 426 436 384 389 343 1 Blood 1322 1189 1233 1329 732 1301 Plasma 2297 1967 2049 2361 1192 2059 Plasma water 35 101 99 99 106 186 Lung 649 618 616 674 539 674 Muscle 218 200 217 187 212 191 Skin 424 381 421 425 340 407 ng-eqmL
78
Raw data of COM5
In vitro blood distribution of [14
C]COM5 using blood pools with the same H 044 Total radioactivity concentration determined in blood and plasma
Excipient Nominal COM5 Incubation Actual values
in blood time (ng-eqmL mean plusmnSD n=3) (ngmL) (min) Blood Plasma
None 10 5 73 plusmn 06 115 plusmn 02 (saline) 30 78 plusmn 02 118 plusmn 02 60 76 plusmn 07 118 plusmn 07 300 5 278 plusmn 2 386 plusmn 4 30 277 plusmn 0 391 plusmn 4 60 275 plusmn 7 384 plusmn 2 EtOH 10 5 98 plusmn 06 138 plusmn 05 30 98 plusmn 06 135 plusmn 05 60 92 plusmn 06 139 plusmn 01 300 5 286 plusmn 2 404 plusmn 3 30 287 plusmn 6 400 plusmn 4 60 284 plusmn 5 395 plusmn 3 CELEtOH 6535 10 5 88 plusmn 03 129 plusmn 06 30 91 plusmn 05 128 plusmn 03 60 92 plusmn 03 11 plusmn 03 120 98 plusmn 03 109 plusmn 03 1 5 257 plusmn 4 322 plusmn 3 30 259 plusmn 3 313 plusmn 5 60 255 plusmn 5 267 plusmn 2 120 281 plusmn 3 279 plusmn 1 HP-β-CyD 05 5 93 plusmn 05 143 plusmn 03 30 95 plusmn 03 139 plusmn 03 60 96 plusmn 02 141 plusmn 07 1 5 293 plusmn 1 412 plusmn 10 30 297 plusmn 6 414 plusmn 6 60 296 plusmn 6 405 plusmn 1 SHS 05 5 106 plusmn 04 125 plusmn 04 30 107 plusmn 04 108 plusmn 03 60 108 plusmn 05 112 plusmn 03 1 5 256 plusmn 1 257 plusmn 1 30 257 plusmn 2 247 plusmn 4 60 260 plusmn 3 230 plusmn 1 PEG 200 05 5 101 plusmn 03 141 plusmn 03 30 99 plusmn 08 145 plusmn 02 60 102 plusmn 03 142 plusmn 02 1 5 304 plusmn 7 402 plusmn 3 30 304 plusmn 8 413 plusmn 4 60 307 plusmn 2 410 plusmn 4 TPGS 05 5 88 plusmn 03 146 plusmn 04 30 91 plusmn 06 145 plusmn 03 60 89 plusmn 02 133 plusmn 03 1 5 308 plusmn 5 448 plusmn 3 30 312 plusmn 7 446 plusmn 7 60 311 plusmn 3 390 plusmn 22 Triplicate analyses were conducted on one aliquot for each time point
79
In vitro protein binding of [14
C]COM5 using the same plasma pool Total radioactivity concentration determined in plasma and ultrafiltrate
Excipient Nominal COM5 Actual values
in plasma (ng-eqmL) (ngmL) Plasma Ultrafiltrate None 10 86 13 (saline) 15 300 292 35 35 34 EtOH 10 108 13 12 300 295 35 35 34 CELEtOH 6535 10 104 25 24 21 300 269 65 64 63 SHS 10 107 30 29 31 300 268 76 74 73 Mean of duplicate determination of plasma spiked with different COM5 stock solutions
80
Circulation and tissue levels of total radioactivity after iv dosing of [14
C]COM5 (1 mgkg)
Time Tissue Individual concentration values (ng-eqg)
(h) Control group SHS group 008 Blood 1109 1450 1365 1694 2005 1859 Plasma 2009 3120 2647 2486 3010 2665 Muscle 355 458 387 555 426 448 Skin 275 224 245 296 207 219 Brain 24 29 28 41 38 41 025 Blood 712 873 1100 1519 1179 1033 Plasma 1508 1468 1777 2265 1813 1606 Muscle 262 341 330 423 445 404 Skin 229 242 259 456 441 342 Brain 14 16 18 29 27 21 05 Blood 642 409 792 1096 867 965 Plasma 1194 572 1275 1655 1455 1467 Muscle 244 199 241 342 341 315 Skin 252 198 256 397 382 374 Brain 11 7 11 22 15 18 1 Blood 172 192 219 688 603 464 Plasma 269 304 361 1055 919 727 Muscle 59 55 57 203 176 144 Skin 164 146 145 299 217 223 Brain 3 3 3 12 11 9 ng-eqmL value below LOQ
Ex vivo protein binding of [14
C]COM5 in the control and SHS group Total radioactivity concentration determined in plasma amp ultrafiltrate
Time Individual values (pg-eqmL)
(h) Plasma Ultrafiltrate Control group 008 2465 217 221 025 1587 123 126 05 1031 69 67 1 305 31 31 SHS group 008 2679 378 372 025 1914 245 05 1524 230 230 1 864 167 Mean of duplicate determination of plasma pooled for each time point
81
9 Acknowledgments
I would like to thank Prof Hans Leuenberger for giving me the opportunity to accomplish a PhD thesis at the University of Basel in collaboration with Novartis Ltd I would also like to thank my advisor PD Dr Georgios Imanidis for his guidance support and advice I would like to thank Dr Bruno Galli for acting as a co-examiner and co-referee for my PhD thesis I would like to thank Dr Gerhard Gross and his group for allowing me to conduct my dissertation research in their laboratories In particular I would like to thank Mr Armin Bruumllisauer and Dr Markus Weiss for helpful comments and discussions I am also thankful for Pierrette Guntz Heidi Huumlgli Marcel Fresneau and Albert Spielmann for not only assisting with my training and sharing laboratory space but for their friendships I would like to thank Dr Ernst Ulrich Koelle and Dr Michel Lemaire for their scientific advice and discussions concerning kinetics and suggestions throughout my dissertation project I would like to thank the Isotope Laboratories of Novartis for providing me with radiolabeled compounds Finally this research was made possible by financial support of Novartis Pharma AG Basel
82
10 Curriculum Vitae
Name Barbara Egger-Heigold Address Lettenweg 8 4102 Binningen
1975 Born on October 30th in Lucerne
1982-1988 Primary school in ReussbuumlhlLU 1988-1995 Matura Typus B Gymnasium ReussbuumlhlLU
1995-1996 1Propedeuticum in Medicines University of Basel 1997-2002 Studies in Pharmaceutical Sciences University of Basel 2002 Diploma thesis at Novartis Pharma AG Basel Thesis title The effect of excipients commonly used for drug
formulation on the in vitro rat blood distribution and protein-binding of SAB 378
2003-2005 PhD student University of Basel Laboratory work conducted at Novartis Pharma AG Basel During my PhD thesis I attended following lectures and courses given by the following lecturers Prof Dr H Leuenberger PD Dr GImanidis Prof Dr J Drewe Prof Dr J Seelig PD Dr H Heerklotz PD Dr A Seelig Dr S Rogers

V
Summary
In the pharmaceutical industry the main goal of early phase in vivo studies is to assess pharmacokinetic properties of a compound in laboratory animals These data provide a basis for selecting and optimizing drug candidates However formulation scientists face considerable challenges in finding intravenous preparations for first animal experiments A common problem is the solubilization of lipophilic and sparingly water-soluble compounds The search for suitable delivery vehicles often takes place under little compound availability incomplete physicochemical property characterization and time constraints In addition many experiments have recently generated distinct evidence about the impact of formulation vehicles on the drug pharmacokinetics by affecting transporters metabolic enzymes and distribution processes Consequently drug-excipient interactions are important to consider in the development of parenteral formulations intended for the proper evaluation of animal pharmacokinetics in vivo Gaining a better understanding of potential interactions between drug and formulation in preclinical settings may play a crucial role in clinical and commercial phases of development as well
So far little is known about drug-excipient interactions occurring in blood especially following iv administration of low dosed compounds (lt50 ngmL in blood) including eg highly active drug substances biomarkers PET ligands and microdoses
The purpose of the current work was to examine the potential of excipients commonly used in formulations to modify the blood distribution and protein binding of low dosed compounds under in vitro and in vivo conditions Drug candidates in development at Novartis were used as model compounds and chosen based on different physicochemical and pharmacokinetic properties such as aqueous solubility (poor COM1COM2 good COM3) lipophilicity (low COM4 high COM2) membrane permeability (low COM5 high COM3) and blood cellplasma distribution (mainly in cells COM3 mainly in plasma COM4) Selected excipients comprised one cosolvent (polyethylene glycol 200 PEG 200) one complexing agent (hydroxypropyl-β-cyclodextrin HP-β-CyD) and three non-ionic surfactants (Cremophor EL CEL Solutol HS 15 Solutol D-α-tocopheryl polyethylene glycol 1000 succinate TPGS) most of them present in commercially available intravenous formulations TPGS which is used orally but not as an intravenous excipient was chosen due to its chemical structure and intrinsic properties particularly its benzyl ring and potential modulation of transporterenzyme activities
Preliminary tests in vitro showed that selected excipients except for TPGS were non-hemolytic at 05 which is consistent with data reported in the literature TPGS at 05 induced marked hemolysis after longer contact time (gt 1h) in various species (mouse rat dog and human) whereas TPGS at 01 showed no hemolysis under same conditions Nevertheless TPGS (05) was used in the non-hemolytic time range for further investigations The concentration of all excipients was set at 05 in test systems which is within the relevant range following intravenous dosing in animals
VI
In vitro CEL HP-β-CyD Solutol and TPGS influenced clearly the plasma protein binding and the distribution between blood cells and plasma of model compounds in mice (COM2) or rats (COM1 COM3 COM4 COM5) The addition of TPGS to incubations increased the distributed fraction of COM1 and COM2 in plasma with a concomitant decrease of drug unbound in plasma Formulating COM4 in CEL and COM5 in Solutol lowered the protein binding and the higher drug fraction unbound in plasma was associated with enhanced partitioning into blood cells The presence of HP-β-CyD reduced both the uptake of COM3 into blood cells and the binding to plasma proteins
To assess the correlation between the in vitro findings and the in vivo situation pharmacokinetics and tissue distribution were determined up to 1 h (within PET scan times) after an intravenous bolus injection of model compounds in formulations based on excipients or none (control) to animals using in each case the excipient with the most pronounced interactions detected in vitro Injection preparations contained the excipient to yield estimated blood concentrations of about 05 similar to those used in the in vitro experiments COM2 formulated in TPGS caused a higher accumulation of parent drug and metabolites in plasma without affecting tissue levels in mice Administering COM3 in HP-β-CyD altered the disposition of COM3 characterized by a lower binding to plasma proteins decreased drug levels in the systemic circulation and skin and a higher amount of unchanged drug in the urine COM4 formulated in CEL resulted in a higher drug fraction unbound in plasma which had no impact on the pharmacokinetics and tissue distribution The use of Solutol for COM5 application in rats was associated with decreased protein binding longer persistence in the circulation and higher concentrations in muscle and skin Although TPGS induced a slight shift in the pharmacokinetic parameters of COM1 in rats the compound turned out to be an inappropriate model compound due to its very rapid metabolism and elimination under in vivo conditions
These in vitro and in vivo findings demonstrated that commonly used excipients have a substantial potential for drug-excipient interactions in blood by altering protein binding and blood cellplasma distribution which can influence the tissue distribution and elimination within the first hour after dosing As a result the formulation vehicle can be an important determinant for the disposition of low dosed compounds administered intravenously in animals Moreover results indicate a direct correlation of the excipient effect under in vitro and in vivo conditions Therefore blood distribution and plasma protein binding data generated in vitro seem to be appropriate to reveal potential drug-excipient interactions thereby providing helpful information to improve the rational approach and strategy in the development of parenteral formulations at the preclinical stage A better insight into the contribution of excipients to drug pharmacokinetics suggests also new possibilities of targeting different blood compartments and tissues by selecting the appropriate excipient Such investigations should be considered to develop formulations suitable for intravenous administration of PET ligands where sub-therapeutic doses and short scanning times are used
VII
Abbreviations
AGP α1-acid glycoprotein AUC Area under the drug concentration-time curve BCPR Ratio of concentration in blood cells to that in plasma no units BPR Ratio of concentration in blood to that in plasma no units C0 Initial plasma concentration at time zero CB Concentration of drug in blood CBC Concentration of drug in blood cells CEL Cremophor EL CP Concentration of drug in plasma EtOH Ethanol FP Drug fraction distributed in plasma fu Fraction of unbound to total drug concentrations in plasma funchanged AUC ratio of parent drug to that of total radioactivity Glu 5 aqueous solution of glucose H Hematocrit HDL High density lipoprotein HP-β-CyD Hydroxypropyl-β-cyclodextrin im Intramuscular iv Intravenous k Rate constant h-1 KP Distribution ratio of drug between tissue and bloodplasma no units LC-RID Liquid chromatography-reverse isotope dilution LDL Low density lipoprotein LOQ Level of quantification LSC Liquid scintillation counting nd Not determined PEG 200 Polyethylene glycol 200 PET Positron emission tomography SD Standard deviation Solutol Solutol HS 15 TPGS D-α-tocopheryl polyethylene glycol 1000 succinate t12 Half-life h V0 Volume of distribution based on initial drug concentration in plasma L VLDL Very low density lipoprotein ρ Ratio of concentration in blood cells to that unbound in plasma no units
1
1 Introduction
11 The physiology of blood
Blood is composed of cellular elements suspended in the plasma an aqueous fluid in which solids are dissolved Table 1-1 summarizes the main blood constitution of different laboratory animal species and humans The normal range can vary depending mainly on genetic and environmental factors and methods handling
Table 1-1 Normative data for laboratory animals and humans
Mouse (12)
Rat (134)
Human (5)
Sex Male Male Male Strain OF1 Wistar Body weight (kg) 0030 0250 70 Whole blood (ml100 g) 72 (63-80) 72 plusmn 02 71 plusmn 06 Plasma (ml100 g) 32 39 plusmn 01 44 plusmn 05
Total plasma proteins (g100 mL) 54 plusmn 02 57 plusmn 05 75 plusmn 04
Albumin ( plasma proteins) 61 plusmn 1 48 plusmn 3 62 plusmn 3 α1 globulin ( plasma proteins) 17 plusmn 2 4 plusmn 1 α2 globulin ( plasma proteins)
12 plusmn 1 (α globulin) 10 plusmn 2 9 plusmn 1
β1 globulin ( plasma proteins) β2 globulin ( plasma proteins)
20 plusmn 1 (β globulin)
19 plusmn 1 (β globulin)
11 plusmn 2 (β globulin)
γ globulin ( plasma proteins) 7 plusmn 1 6 plusmn 1 15 plusmn 2 Blood cells Hematocrit () 43 plusmn 3 46 plusmn 2 44 plusmn 2 Red blood cells (x106 cellsmicroL) 9 plusmn 1 7 plusmn 1 5 plusmn 1 White cells (x103 cellsmicroL) 4 plusmn 2 6 plusmn 2 7 plusmn 1 Platelets (x106 cellsmicroL) 13 plusmn 04 12 plusmn 02 03 plusmn 01
111 The blood cells
The different specialized cells found in blood are white blood cells (leukocytes) red blood cells (erythrocytes) and platelets (thrombocytes) Of these the erythrocytes are the most numerous and compose about one-half of the circulating blood volume By carrying hemoglobin in the circulation the red blood cells supply O2 to tissues and remove CO2 Leukocytes are classified as granulocytes (further classification in neutrophils eosinophils and basophils) lymphocytes and monocytes Acting together these cells provide the body with a powerful defense against tumors viral bacterial and parasitic infections Compared to the other blood cells the platelets are much smaller and aid in hemostasis by their primary function in blood clotting Furthermore blood cells can play a key role in binding and transporting of drugs in the circulation thereby contributing to their pharmacokinetic and pharmacological characteristics (67)
112 Plasma
The plasma the liquid portion of the blood is a complex fluid composed of water (approximately 90) and a large number of ions inorganic molecules and organic molecules in solution These dissolved substances primarily proteins are in transit to
2
various parts of the body or aid in the transport of other substances The plasma proteins consist of albumin globulin and fibrinogen fractions which can be separated by electrophoresis Electrophoretic separation followed by immunoprecipitation (immunoelectrophoresis) results in a further division of the proteins If whole blood is allowed to clot and the clot is removed the remaining fluid is called serum and has essentially the same composition as plasma except for the removed fibrinogen and few clotting factors (II V and VIII) Table 1-2 lists the main protein fractions with their main characteristics The table also indicates that a large number of drugs associate with proteins within the bloodstream Albumin is the major drug-binding plasma protein (8) followed by alpha 1-acid glycoprotein as the next important one (9) In recent years studies have shown that lipoproteins are also substantially involved in the bindingtransport of drugs in the blood compartment (10) So far γ-globulins play only a marginal role in plasma binding of drugs
Table 1-2 Proteins in human plasma
Physiological Function
Albumin PrealbuminAlbumin
α1 globulin α1-acid glycoprotein Uncertain (acute phase protein)
α1-lipoprotein (high Transporter Lipidsdensity lipoproteins)
α2 globulin Ceruloplasmin Transporter Copperα2-Macroglobulin Enzyme inhibitor Serum endoproteasesα2-Haptoglobin Binding and carrier protein Cell-free hemoglobin
β globulin Transferrin Transporter Ironβ-lipoprotein (low Transporterdensity lipoproteins)Fibrinogen Precursor to fibrin in hemostasis
γ globulin IgG IgA IgM IgE Antigen Few basic compounds
Electro-phoresis
Immuno-electrophoresis
Protein fraction Binding characteristics
Drugs Endogenous entities
Lipoproteins mainly lipophilic neutral and basic compounds
Humoral immunity (antibodiesimmunoglobulins)
Lipids (mainly cholesterol)
Binding and carrier protein osmotic regulator
Hormones amino acids steroids vitamins fatty acids
Mainly basic and neutral compounds
Mainly acidic but also basic and neutral compounds
Lipoproteins mainly lipophilic neutral and basic compounds
12 In vitro methods to investigate blood binding parameters
The investigation of the partitioning of a drug in the blood compartment is essential in predicting its pharmacokinetic-dynamic profile In general the unbound concentration of a drug in blood reflects more accurately pharmacological effects of the drug than its total concentration in blood (bound + unbound) because only the drug unbound to blood components is able to diffuse through the membranes and then reach the target organ (11) Furthermore the binding to plasma proteins also relates to the volume of distribution and the clearance of the drug For instance many experimental and clinical studies have generated substantial evidence summarized by Akhlaghi (12) that the unbound fraction of cyclosporin in plasma correlates more closely with pharmacodynamic and pharmacokinetic characteristics of cyclosporin than its total blood concentration Therefore determination of extent and rate of bloodplasma distribution and plasma protein binding of a drug is important in both the discovery and clinical phases of drug development
3
121 Blood distribution method
The rate and extent of bloodplasma distribution of drugs is determined in vitro in spiked whole blood The experiments are performed under controlled physiological conditions (pH 74 37degC gently shaken) to reflect the in vivo situation over the entire clinically relevant concentration range of the drug Time samples are taken and centrifuged Subsequently drug concentrations in blood and plasma are determined to calculate the time required to reach equilibrium The extent of bloodplasma and blood cellplasma distribution derives from measured concentrations in blood and plasma and can be expressed with distribution parameters like FP BPR and BCPR BPR depends on the hematocrit of the whole blood used in the determination whereas BCPR is independent of the hematocrit value
122 Protein binding methods
Various methods are available for the determination of free drug concentration and protein-drug binding fraction in plasma (131415) including conventional separation methods summarized in Table 1-3 However the routinely used methods like ultrafiltration or equilibrium dialysis are limited in the case of lipophilic drugs due to their nonspecific adsorption to ultrafiltration device or to the dialysis membrane Along with a trend to more lipophilic compounds observed in the pharmaceutical industry in recent years (16) these adsorption problems are expected to increase As a result ongoing method modifications and new methods are needed to overcome these difficulties Overall the selection of the method of binding assay depends upon the aim of the study and the physicochemical properties of the particular test compound including its formulation
The ratio of bound and total drug concentrations in plasma expresses the degree of drug binding to plasma proteins and ranges between values of 0 and 1 Based on these values drugs can be classified into very highly bound (gt095) highly bound (gt090) poorly bound (lt09) and littlenot bound (lt02)
4
Table 1-3 Conventional methods for determination of plasma protein binding
Method Principle Advantages Disadvantages
Ultrafiltration
Ultracentrifugation
Gel filtration Adoptable for lipophilic drugs automatable binding differences detectable (eg affinity)
Complex handling time consuming
Time consuming expensive equipment false estimation of free fraction by physical phenomena (eg sedimentation back diffusion) protein contamination of free drug layer
Separation by size exclusion and affinity of column
Separation by centrifugation at high speed in absence of a membrane
No membrane effects natural environment no dilution problems adoptable for lipophilic and high MW drugs evaluation of lipoprotein binding
Equilibrium dialysis (reference method)
Sample dilution volume shifts Donnan effects nonspecific adsorption sieve effect time consuming unsuitable for unstable drugs
Separation by filtration through a semipermeable membrane with defined molecular weight cutoffs accelerated by centrifugation or positive pressure (N2 gas syringe)
Equilibrium establishment between two compartments separated by semipermeable membrane with defined molecular weight cutoffs
Physiological conditions universal binding method
Simply applicable short analysis time simple commercially available kits no volume shifts no dilution effects
Donnan effects nonspecific adsorption binding equilibrium changes during separation process small amount for analysis sieve effect
13 Characterization of drug candidates
Successful candidates in drug development must have proper physicochemical properties in addition to acceptable pharmacokinetics efficacy and safety profiles As a result a clear understanding of compound characteristics and their correlations are helpful to rank and sort out unsuitable compounds in drug research (1718)
131 Physicochemical properties
The chemical structure of a drug candidate is used in both predicting the pharmacology and selecting formulation strategies Table 1-4 shows physico-chemical parameters which are critical for in vivo drug action
The molecular weight (MW) indicates roughly the size of a chemical entity and is connected to its membrane permeability namely to the intestinal and brain penetration (1619)
LogP the octanol-water partition coefficient has been widely accepted as a measure of molecular lipophilicity Lipophilicity affects both the pharmacokinetic and pharmacodynamic behavior of drug molecules (2021) LogP considers the molecule in its neutral state (neutral substance or ionizable substance in its neutral form) whereas logD reflects the pH-dependent distribution coefficient consequently taking the ionization of molecules into account If logP and pKa of a compound are known logD can be calculated at any pH (21)
5
The aqueous solubility (LogS) is closely related to drug stability liberation and absorption by passive diffusion thereby playing a key role in its bioavailability (22) Causes for poor solubility are mainly excessive lipophilicity and crystal packing issue (23242526) The solubility of nonionic molecules is pH independent while molecules with ionizable groups show pH dependent solubility Acid drugs have higher solubility at pH higher than pKa and basic drugs at pH lower than pKa due to better solubility of ionic species as compared to the neutral species The acid-basic character accounts also for crossing the blood-brain barrier (27)
The polar surface area (PSA) of a molecule is a useful parameter for predicting drug transport properties PSA is the sum of the molecular surface (either van der Waals or solvent-accessible) that arises from polar atoms usually N O N-H and O-H atoms Some scientists also include sulphur and phosphor and attached hydrogens as polar atoms The PSA of a compound is also closely related to its hydrogen bond accepting and donating ability which can be responsible for interactions with active efflux pumps (2829) PSA has been shown to correlate well with blood-brain distribution (273031) intestinal absorption (323334353637) and oral bioavailability (38) of compounds
Table 1-4 Physicochemical parameters
Parameter Description Predictor Optimal value
MW Molecular weight Size Permeability lt 500lt 450 (BBP)
LogP lt 5
LogS Hydrophilicity gt 20 microgmL
pKa Acid-base character
PSA Polar surface area lt 140 Aringlt 80 Aring (BBP)
Negative logarithm of the acid-base dissociation constant
Acids gt4 and bases lt10 (BBP)
Permeability H-bonding capability
Logarithm of the octanol-water partition coefficient
Lipophilicity Permeability
Logarithm of the aqueous solubility
BBP blood brain penetration
132 Pharmacokinetic parameters
The pharmacokinetic profile is crucial for the clinical success of drug candidates and their development into marketable drugs Therefore today the contribution of pharmacokinetic investigations to the selection and optimization of promising drug candidates is well recognized The four most important parameters are clearance volume of distribution elimination half-life and bioavailability which is the fraction of drug absorbed as such into the systemic circulation (100 per definition for drugs given intravenously)
Drug clearance (CL) expresses the rate or efficiency of drug removal from the systemic circulation and is estimated as the ratio of dose to AUC following intravenous administration of the drug
AUC
DoseCL =
6
AUC is the total area under the curve that describes the concentration of drug in blood or plasma as a function of time AUC represents the drug exposure and is calculated by the trapezoidal rule
The volume of distribution (V0) relates the amount of drug in the body to the concentration of drug in the blood or plasma depending upon the fluid measured This volume does not necessarily refer to an identifiable physiological volume but merely to the fluid volume that would be required to contain all of the drug in the body at the same concentration as in the blood or plasma
o
iv
C
DoseV =0
C0 represents the blood or plasma concentration at time zero and is determined by extrapolation to zero time of the linear plot of concentration vs time in semilogarithmic scale
The half-life (t12) is the time it takes for the blood or plasma concentration or the amount of drug in the body to be reduced by 50
kkt
69302ln21 ==
where k is the elimination rate constant which can be calculated by the slope of the best-fit line to a semilogarithmic plot of the concentration over time The relationship of t12 to both clearance and volume of distribution is given by
V
CLk =
133 New trends in characterizing drug candidates
Before conducting clinical trials in humans preclinical testing is carried out to discover the pharmacology ADME (adsorption distribution metabolism and excretion) and toxicology of a new drug candidate (39) Appropriate pharmacokinetics and a good balance between drug efficacy and safety contribute mainly to an efficient and effective drug development However these factors are the major hurdles in development which primarily cause increased costs and failure rate of candidates Thus pharmaceutical industry needs new concepts able to speed and improve activities and decision-making in drug development (4041) In this context microdosing biomarkers and PET ligands can help to prioritize resources and optimize drug selection in development In many cases these approaches deal with compound concentrations ranging from sub-therapeutic to low pharmacological levels and thus information obtained from these techniques must reflect correctly the conditions at therapeutic doses including interactions with macromolecules like enzymes transporters and proteins In the end a successful integration requires a profound understanding of strengths and limitations of these new concepts
The administration of a low dosed (microdosed) drug candidate to humans was proposed to obtain human pharmacokinetic data before conducting Phase I trial (42) A microdose is one-hundredth of the proposed pharmacological dose determined from animal andor in vitro models or a dose up to 100 microg whichever is the smaller (43) Human microdosing uses labeled agents administered mostly intravenously and their fate in vivo is recorded by positron emission tomography combined with accelerator mass spectrometry or nuclear magnetic resonance (4344) With this new
7
strategy of microdosing drug information regarding human kinetics will be available along with preclinical data and can be useful for the acceptance or rejection of a candidate at an early stage
A biomarker is an indicator of a normal biological or pathophysiological process or a therapeutic response (45) Biomarkers help to select the most sensitive drugs in all phases of drug development (46) by providing data of pharmacological response dosing regimen and risk-benefit assessment Therefore efforts are moving rapidly forward to achieve strong predictive biomarkers which could be used for diagnostic and therapeutical purposes (47)
PET tracers labeled with short-lived radionuclides (eg 11C 18F 124I) are used as molecular probes of physiology and pathophysiology in animals and humans These labeled compounds are administered mostly intravenously at 600 MBq to humans which corresponds to 6-20 nmol (3-10 microg assuming a MW of 500) (48) To achieve the same imaging quality in animals roughly the same total amount of radiopharmaceutical must be given to animals as to a human subject (49)
14 Strategies and administration of intravenous formulations
In the pharmaceutical industry formulation scientists have faced growing challenges in recent years as a result of new drug candidates characterized as being more lipophilic hydrophobic and water-insoluble particularly candidates originated from leads associated with combinatorial chemistry and high-throughput screening (1624) In addition timelines and resources are very limited to develop an optimized formulation and thus the search for a suitable dosing vehicle intended for activities in preclinical research represents a challenging task for the formulators (50) Ideally it is best to select and use solubilizers that would maximize the solubility of the compound and could be applied for all preclinical settings Moreover the solubilizing agents should not influence the intrinsic pharmacokinetic characteristics of the compound being evaluated (except the interaction is well understood) which would lead to misinterpretation of the pharmacological response (51) Strategies for solubilization of intravenous drugs are summarized in Table 1-5 and well exemplified by the formulation approaches for the anticancer agent Paclitaxel (52)
Usually the first step is to check the solubility of the compound in an aqueous dosing vehicle at physiological pH and osmolarity If the target concentration cannot be achieved with this approach and the drug molecule is ionizable adjustment of the pH to non-physiological values can be suitable to increase water solubility (pKa must be sufficiently away from the formulation pH) Non-electrolytes are insensitive to pH modification The next approach most frequently tried is the addition of water-miscible organic solvents (cosolvents) and the use of surfactants or complexing agents To reach the required dose combination of these methods is often used Dispersal systems are other techniques but they may be difficult costly and time-consuming due to biological and technical complexity eg liposomes (53)
8
Table 1-5 Intravenous formulation approaches
Approach Examples Administered in commercial productsa Potential drawbacks
NaCl 09 (wv) pH 2-12 (bolus) pH 2-10 (infusion) PrecipitationGlucose 5 (wv) rarr preferred range pH 4-9 PainStrong acidsbases (HCl NaOH)Buffers (tartarte phosphate)
Cosolvents Propylene glycol le 68 (bolus) le 6 (infusion) Precipitation Ethanol le 20 (bolus) le 10 (infusion) IrritationPainPolyethylene glycol 300 le 50 (bolus) HemolysisPolyethylene glycol 400 le 9 (bolus) Impact on PK profile
Surfactants Cremophor EL le 10 (infusion) ditoTween 80 le 04 (bolus) le 2 (infusion)Solutol HS 15 50
Complexing agents Hydroxypropyl-β-cyclodextrin 20 (infusion) ditoDispersal systems Impact on PK profile
EmulsionbMicroemulsionc Water with 10-20 oil (fatty acids + lecithin + glycerol) Sustained releaseLiposomes Water with phospholipids (5-20 mgmL) + isotonicifier + buffer plusmn cholesterol Instability
Nanosuspensiond Water with stabilizer not yet marketede Slow dissolution
Aqueous solution at physiological osmolarity and pH or with pH adjustment
a(54) b(55) c(56) d(57) e(58)
For compounds administered intravenously to animals the dose volume viscosity
of injection material speed of injection and species are important factors to consider in addition to formulation properties including additives solubility and stability (Table 1-6) (59) A compound can be given over a short period of le1 min (bolus injection) 5-10 min (slow injection) and longer time period (intravenous infusion) Rapid injections require the dose to be compatible with blood and not too viscous and the rate of injection is suggested not to exceed 3 mLmin for rodents Depending on study objectives and compound solubility in an acceptable formulation a larger volume may be needed to be given to animals to accomplish requirements Regarding the formulation aqueous solutions or simple systems containing cosolvent surfactant or complexing agent are recommended for animal investigations at early stage in development due to easy handling and characterization For excipient selection consideration should be given for toxic and biological effects interferences with the drug compound and suitability for clinical use (Table 1-5) Injectable excipients preferred for dosing in animals are ethanol propylene glycol low molecular weight polyethylene glycols Cremophor EL Tween 80 and cyclodextrins
Table 1-6 Dose volumes and rates for intravenous administration(59)
Species Bolus injection Slow injection Infusion
Volume Rate Volume Rate Time Volume Rat
(mLkg) (mLmin) (mLkg) (mLmin) (h) (mLkgd) (mLkgh) Mouse 5 3 max 25 3 4
24 96 4 Rat 5 3 max 20 3 4 20 5 24 60 25
9
15 Effect of excipients on pharmacokinetic parameters in blood
Over the last years more attention has been paid to the extensive investigation of formulation vehicles as biologically and pharmacologically active compounds The main stages in which pharmaceutical excipients can interact and hence may modulate the properties of an administered drug-agent are transporter enzyme and distribution process in the systemic circulation (eg plasma protein binding) The effect of excipients on transporter activity has been studied intensively namely for P-glycoprotein (606162636465666768) multidrug resistance-associated protein (6970) and peptide transporter (71) It is interesting to say that particularly nonionic surfactants effectively inhibit transporters In contrast up to this day little is known about drug-excipient interactions at the level of cytochrome-mediated metabolism (63727374) and blood distribution (see below) The biological and pharmacological properties of excipients with a focus on the central blood compartment will be reviewed in the following paragraphs
151 Cremophor EL
The amphiphilic polyethoxylated castor oil derivative Cremophor EL (CEL) is one of the most frequently used surface-active formulation ingredients in parenteral dosage forms As early as 1977 lipoprotein alterations were observed in patients receiving miconazole therapy (75) which was caused only by CEL both in vitro and in vivo (767778) Extended studies revealed later on that CEL has a destructive effect on HDL resulting in a shift of the electrophoretic and density gradient HDL to LDL (79808182) Furthermore several hydrophobic anti-tumor agents tin etiopurpurin (8384) C8KC (85) and Taxol (8182) showed strong affinity for these lipoprotein dissociation products inducing changes in plasma protein binding potentially affecting pharmacokinetics
Various animal studies demonstrated (85868788899091110) that CEL modifies the pharmacokinetic behavior of drugs after intravenous administration like paclitaxel (Taxol) C8KC and cyclosporin The most common observation was a substantial increase in the area under the plasma concentration-time curve and in peak plasma concentration of studied agent with a reduction in the clearance as was first described for paclitaxel in a mouse model (91) The drug-CEL interactions were supposed to be caused not only by altered protein binding characteristics (82) but also by altered hepatobiliary secretion (92) and endogenous P-glycoprotein-mediated biliary excretion (93) However the very small volume of distribution of CEL approximately equal to the volume of the central blood compartment suggests that the observed interference occurs in the central blood compartment This hypothesis was confirmed by studies recently published (9495) The main finding was a profound alteration of cellular partitioning and bloodplasma concentration ratio of paclitaxel in a CEL concentration-dependent manner as a result of an entrapment of the compound into micelles formed by CEL (96) Consequently the free drug fraction available for distribution was reduced This effect was also observed in the absence of plasma proteins pointing at contributing factors other than altered protein binding and increased affinity of paclitaxel for CEL-induced lipoprotein degradation products (8182)
10
For the purpose of finding out a potential paclitaxel delivery vehicle with an ideal profile the investigation of several delivery vehicles based on the chemical structures of CEL and Tween 80 led to alteration of blood distribution of paclitaxel in presence of all tested vehicles (97) Different formulation approaches such as liposomes and poloxamer-micelles affected the pharmacokinetics of paclitaxel in mice as compared to the CEL-containing formulation (98) In contrast paclitaxel administered in a solvent-free formulation in a clinical study showed a higher efficacy combined with reduced adverse effects compared to the drug delivered in a solution of CEL (99)
Overall numerous investigations have shown that CEL can play a pivotal role in the pharmacological behavior of the formulated drugs In addition several drug-drug interactions are reported on agents administered intravenously in conjunction with CEL-containing formulation of other compounds namely paclitaxel (100101102103) cyclosporin (104105106107) and valspodar (108109) Most likely the presence of CEL in drug formulations contributes to the observed pharmacokinetic interactions Indeed recent experiments revealed a substantial increase of plasma concentrations of cyclosporin after an additional injection of another drug preparation containing CEL (110)
152 Cyclodextrins
Cyclodextrins are ring-shaped oligosaccharides with a hydrophilic exterior and a hydrophobic interior (111) The interior cavity is capable of forming water-soluble complexes with many drugs Due to the rapid release of a drug from the complex after administration in vivo it is assumed that drug-cyclodextrin complexes do not affect the drug pharmacokinetics (112) However if the drug is slowly or incompletely released from the complex drug dosing as complexes in cyclodextrin can be critical
The binding of drugs to plasma proteins was influenced in vitro in the presence of β-cyclodextrin (113) and hydroxypropyl-β-cyclodextrin (HP-β-CyD) (114115) The intravenous administration of flurbiprofen in HP-β-CyD led to transient higher tissue concentrations in rats (114) Alterations in tissue distribution were also found for other drugs injected as cyclodextrin complexes either free in solution (116117) or included into liposomes (118) Following iv dosing in HP-β-CyD a higher amount of carbamazepine appeared in the urine compared to oral preparations (122) A similar trend was observed in dogs treated iv with either dexamethasone formulated in HP-β-CyD or as its phosphate prodrug (123) In addition cyclodextrins interacts with endogenous lipids such as lipoproteins (119120) and cholesterol (113121)
153 Tween 80
As mentioned above for CEL lipoprotein alteration induced by Tween 80 was observed (80) However this effect was not confirmed in a further study (85) In patients receiving Tween 80 co-administered with etoposide an increase of the volume of distribution and the clearance of doxorubicin was detected due to reduced plasma concentrations of doxorubicin during the early phase of the concentration-time profile (124) Lately changes in the bloodplasma ratio of paclitaxel were described in the presence of Tween 80 and other solubilizers structurally related to Tween 80 (97) More recently it was shown that Tween 80 has a concentration-dependent influence on the normal binding of docetaxel to serum proteins leading to changes in pharmacokinetics of docetaxel in vivo (125) although Tween 80 is
11
degradated rapidly by esterases in plasma (126) The mechanistic basis for altered plasma binding of docetaxel in the presence of Tween 80 still needs to be clarified
154 Other excipients
To date little is reported in the literature about the impact of Solutol HS 15 and Poloxamer 188 on blood distribution of drugs An interference between Solutol HS 15 and the co-administered ketochlorin photosensitizer C8KC was suggested by Woodburn (127) The similar half-lives of Solutol HS 15 and the sensitizer found in mice indicate the correlation of the persistence of C8KC in plasma with that of the vehicle Further recent plasma protein binding interaction studies demonstrated an apparent increase in the unbound fraction of propranolol in combination with Poloxamer 188 (128) Also the administration of compounds formulated in mixed micelles can alter the protein binding (129) Most notably compounds binding with high affinity but low capacity to α1-acid glycoprotein showed free fractions increased by 50 to 85 Moreover blood protein interactions can occur with dosing vehicles like liposomes (130) thereby affecting maybe the fate of co-administered drugs in blood and body (131)
155 Nanoparticles
Methyl methacrylate nanoparticles of 130 nm in size suspended in different concentrations (01-5) of Tween 80 or poloxamine 908 exhibited prolonged circulation time with altered tissue concentrations as compared to uncoated nanoparticles (132) Extended blood circulation time was also found for polystyrene nanoparticels (40-137 nm) coated with poloxamer 407 (133)
12
16 Objectives and specific aims
The main purpose of this thesis was to investigate in vitro drug-excipient interactions in blood and to assess the implications of the in vitro findings both for the in vivo situation and the formulation strategy Compounds in drug development at Novartis were chosen as model substances and dosed at concentrations ranging from sub-therapeutic to low pharmacological levels Excipients commonly used in formulations were selected including CEL HP-β-CyD Solutol PEG 200 and TPGS The following specific aims of the thesis were 1 To collect and use available compound information including physicochemical
properties and pharmacokinetics to select appropriate model substances with as many different properties as possible
2 To determine the hemolytic activity of selected excipients to rule out any changes of blood distribution caused by hemolysis
3 To explore in vitro possible effects of selected excipients in the blood with special emphasis on the blood distribution and plasma protein binding of model compounds
4 To identify the pharmacokinetic profile and tissue distribution of model compounds following single intravenous dosing in the presence and absence of selected excipients
5 To compare and relate pharmacokinetic outcomes to the in vitro findings thereby assessing the impact of in vitro data for the in vivo situation and evaluating the in vitro-in vivo correlation
6 To generate criteria for optimizing delivery vehicle selection in drug research that allow reducing drug-excipient interactions and leading to more rational and selective drug formulations
7 To propose an intravenous formulation strategy based on the data generated by this research project to provide better candidate-tailored formulations in drug development
13
2 Selection and experimental procedure
21 Excipients and model compounds
Investigations involved five excipients along with five pharmacologically active compounds exhibiting different properties
The excipients CEL HP-β-CyD Solutol and PEG 200 were selected based upon their common use in intravenous formulations and their diversity of molecular structure and solubilization technique (Figure 2-1 and Table 2-1) CEL and Solutol are surface-active agents which increase the drug solubility by incorporation of the drug into a micellar structure Whereas CEL exhibit a highly variable composition with the major hydrophobic component (~87) identified as oxyethylated triglycerides of ricinoleic acid (Figure 2-1) Solutol consists of ~70 lipophilic polyglycol mono- and di-esters of 12-hydroxystearic acid and ~30 hydrophilic polyethylene glycol HP-β-CyD is a cyclic (α-14)-linked oligosaccharide containing seven α-D-gluco-pyranose units (Figure 2-1) which form a relatively hydrophobic central cavity and a hydrophilic outer surface The inclusion of a drug within the inner core of the complexing agent and the interaction of the outer core with water render the complex soluble PEG 200 is often used as a cosolvent for improving solubility of preclinical compounds by interrupting the hydrogen structure of water (eg water exclusion) and lowering the dielectric constant of the solution Although TPGS is exclusively known in oral formulations it was chosen due to its chemical structure (benzyl ring) and drug interaction potential at the level of active transporters and metabolizing enzyme systems
Cremophor EL
H2C(CH
2CH
2O)xOCO(CH
2)7CH CHCH
2CHOH(CH
2)5CH
3
HC(CH2CH
2O)yOCO(CH
2)7CH CHCHCH
2CHOH(CH
2)5CH
3
H2C(CH
2CH
2O)zOCO(CH
2)7CH CHCH
2CHOH(CH
2)5CH
3
primary constituent with x + y + z ~35
Solutol HS 15
CH3
(CH2)5
CH (CH2)10
C O CH2
CH2
OHn
OH O
Polyethylene glycol 200
O
HOH
n
Hydroxypropyl-β-cyclodextrin
O
ROCH2
O
ROOH
n
glucopyranose with R=CH2CH2OH or H and n=7
Vitamin E TPGS
O
O C CH2
CH2
C O
O O
CH3
CH3
OH n
CH3
CH3
CH (CH2)3
CH3
CH (CH2)3
CH(CH2)3
n=20-22
Figure 2-1 Chemical structures of selected excipients
14
Table 2-1 Properties of selected excipients
Excipient name Type Solubilization Use in iv Biological activity
approach formulation
Cremophor EL Non-ionic Micelles Yes bull Dyslipidaemia (polyoxyethylene surfactant (developmental bull Inhibition of active castor oil derivatives) amp commercial) transporters MW ~3000 CMC ge009 mgmL Hydroxypropyl-β- Oligomeric Complexation Yes bull Lipid interactions cyclodextrin substance (developmental MW ~1600 amp commercial) Solutol HS 15 Non-ionic Micelles Yes bull Dyslipidaemia (polyethyleneglycol 660 surfactant (developmental bull Inhibition of active 12-hydroxystearate) amp commercial) transporters MW 960 bull Inhibition of cyto- CMC ge02 mgmL chrome enzymes Polyethylene glycol 200 Oligomeric Cosolvent Yes MW ~200 substance (change of (developmental solution amp commercial) polarity) Vitamin E TPGS Non-ionic Micelles No bull Inhibition of active (D-α-tocopheryl surfactant (oral use transporters polyethylene glycol 1000 developmental bull Inhibition of cyto- succinate) amp commercial) chrome enzymes MW ~1513 CMC ge02 mgmL CMC Critical micelle concentration MW Molecular weight Higher molecular weight PEGs such as PEG 300 and 400
Drug candidates in development at Novartis were chosen as model compounds
regarding aqueous solubility lipophilicity membrane permeability and blood cellplasma distribution (Figure 2-2 and Table 2-2) COM2 and COM1 (base) are lipophilic and poorly water-soluble PET ligands which are used in sub-therapeutic doses and COM2 distributes equally between plasma and whole blood COM3 is much better water-soluble and is mainly located in the cellular fraction in blood In contrast COM4 with a low lipophilicity penetrates hardly into blood cells and distributes poorly into tissues COM5 is a bigger molecule characterized by a high polar surface area many H-bond acceptors and a very low volume of distribution similar to that obtained for COM4
COM1 COM2 COM3 COM4 COM5
N
N
O
R1
R2
O
N
O
N
N
S
R1
R2
N
O
N
R
NN
R2
R1
N
NO
S O
NH
O
O
NH
OR1
R2
R3
Figure 2-2 Chemical structures of model compounds
15
Table 2-2 Properties of model compounds
Physicochemical (PC) and pharmacokinetic (PK) data available at the time of selecting model compounds for investigating drug-excipient interactions in blood
COM1 COM2 COM3 COM4 COM5
PET ligand PET ligand NCE NCE NCE
PC properties MW (gmol) 240 410 295 lt400 533 LogD 68 34 45 23 17 37 pKa 38 57 41 87 32 46 106 H2O solubility pH 68 (mgL) 20 lt25 4000 lt500 100 PSA (Aring2) 35 50 25 63 166 H-bond acceptors 3 5 3 4 12 H-bond donors 0 0 0 1 3 PK properties Species Mouse Rat Rat Rat In vitro Fraction in plasma () 45 20 ~100 80 Free in plasma () 12 24 11 In vivo Matrix Blood Blood Plasma Plasma t12 (h) 11 11 10 04 CL (mLminkg) 10 142 04 72 Vss (Lkg) 14 10 03 03 funchanged () 49 14 98 94 Main selection criteria bull Active bull Active bull Blood bull Blood bull MW principle principle distribution distribution bull Polarity bull H2O sol bull H2O sol bull Vss bull Vss (base) bull Lipophilicity funchanged Fraction of unchanged drug based on AUC ratio of parent drug and total radioactivity LogD Logarithm of octanol-water distribution coefficient MW Molecular weight NCE New chemical entity pKa Negative logarithm of dissociation constant PSA Polar surface area CL Drug clearance t12 Main elimination half-life Vss Volume of distribution under steady-state conditions
22 Experimental setup
The effect of excipients on pharmacokinetic parameters was examined in rats except for COM2 which was investigated in mice due to available animal models appropriate to analyze drug target interactions if required Model compounds were used in their clinically relevant blood range as follows sub-therapeutic (lt5 ngmL) for COM1 and COM2 low-therapeutic (5-50 ngmL) for COM3 and therapeutic (gt50 ngmL) for COM4 and COM5 because of low distribution volumes to assure detectable tissue concentrations To allow in vitro and in vivo study comparisons the amount of excipient in blood was set at ~05 which is within the range after an iv bolus injection in mice and rats
Blood distribution and protein binding studies were done in vitro using model compounds in the appropriate concentration range with and without selected excipients fixed at 05 in the test system Since COM4 is almost completely located in the plasma fraction in blood (FP ~100) independent of the concentration (10-10rsquo000 ngmL) (149) the concentration of COM4 was kept constant (100 ngmL) whereas the excipient amount was varied between 001-1 Compounds formulated as excipient-free solution in glucose 5 or saline served as reference The excipient with the most prominent effect compared to the reference was selected for the in vivo
16
study where animals received intravenously a single dose as a control formulation or solution containing the selected excipient Control formulation were based on glucose 5 (COM1 COM3) saline (COM4 COM5) or blank plasma (COM2) To assure a fast and complete solubility of COM3 and COM5 in the control formulation convenient excipients were added with in vitro binding parameters similar to those obtained for the in vitro reference The concentration of model compounds in blood plasma and tissue were measured until 1 h after iv administration thereby including the scanning time of PET ligands Moreover it is assumed if excipient-induced changes occur they should be detectable in this time period
17
3 Materials and methods
31 Chemicals
COM1 and COM2 were supplied by the Neuroscience Research Department of Novartis (Basel Switzerland) COM3 was obtained from the Novartis Institutes for BioMedical Research (Basel Switzerland) 3H-radiolabeled COM1 (specific activity 11780 MBqmg gt99) COM2 (specific activity 2320 MBqmg gt98) and COM3 (base specific activity 311 MBqmg gt98) were provided by the Isotope Laboratories of Novartis (Basel Switzerland) 14C-radiolabeled COM3 used for investigation of renal excretion (2middotHCl salt specific activity 587 MBqmg gt98) COM4 (specific activity 585 MBqmg gt98) and COM5 (specific activity 33 MBqmg gt98) were provided by the Isotope Laboratories of Novartis (Basel Switzerland)
The excipients purchased by the Pharmaceutical and Analytical Development Department of Novartis (Basel Switzerland) were Cremophor EL (CEL BASF) hydroxypropyl-β-cyclodextrin (HP-β-CyD CERESTAR USA Inc) polyethylene glycol 200 (PEG 200 Fluka) Solutol HS 15 (Solutol BASF) and D-α-tocopheryl polyethylene glycol 1000 succinate (TPGS Eastman) All other chemicals and reagents were of analytical grade or will be described separately in the methods section
32 Blood and plasma sources
Fresh blood was obtained from healthy male species (nge3) as follows mice (albino OF1 Charles River Laboratories LrsquoArbresle France) rats (Wistar HAN IGS Charles River Laboratories Sulzfeld Germany) dogs (Marshall beagles Marshall Farm NY USA and Harlan France SARL Gannat France) and humans (drug-free blood donors Blutspendezentrum SRK Basel Switzerland) Pooled plasma (nge3) was defrosted from storage at -20degC Lithium heparin was used as an anticoagulant for all species
33 In vitro studies
Test compounds in the in vitro samples excluding protein binding samples of COM2 were quantified by LSC due to no major degradation (gt95) under investigated conditions (146147148149150) Protein binding samples of COM2 were quantified by LC-RID due to instability after longer incubation (gt2 h) and very low fraction unbound in plasma (lt2)
331 Preparation of test solutions
For in vitro blood distribution and protein binding studies test solutions were prepared by dissolving the radiolabeled test compound in ethanol Ethanol was evaporated and the residue was reconstituted in the appropriate formulation namely excipient-free solution as control (saline or glucose 5) and solutions containing CELEtOH 6535 (vv) CEL HP-β-CyD Solutol PEG 200 and TPGS Final compound concentrations in blood or plasma were 006-6 ngmL (COM1) 001-100 ngmL (COM2) 5-500 ngmL (COM3) 100 ngmL (COM4) and
18
10-300 ngmL (COM5) Excipient concentrations were kept constant at 05 in the test system except for COM1 (05-5 due to no alterations at 05) and COM4 (001-1 due to its plasma fraction see 22)
332 Hemolytic activity
The hemolytic activity of the excipients was assayed using a spectrophotometric method CELEtOH 6535 (vv) EtOH HP-β-CyD PEG 200 Solutol and TPGS were added to the appropriate volume of freshly prepared heparinised whole blood to obtain a final excipient concentration of 05 To avoid hemolysis due to higher concentrations during the adding the blood was partially centrifuged and the excipient was pipetted in the cell-free layer By tapping the test tubes the samples were immediately mixed Two control tubes were prepared one for spontaneous hemolysis (pure blood used as the reaction blank) and another for 100 hemolysis (total cell lysis induced by sodium dodecyl sulfate at a final blood concentration of 1) Samples were incubated at 37degC At certain points of time aliquots were removed and centrifuged for 10 min at 3100 x g (37degC) to obtain plasma The absorbance of hemoglobin in the supernatant (dilution with water 1200) was measured at 405 nm (Emax precision microplate reader Bucher Biotech Basel Switzerland) The degree of hemolysis due to the excipient activity was calculated according to
100()0100
0times
minus
minus
=
AA
AAHemoylsis e
where Ae is the absorbance of hemoglobin in the supernatant after incubation with excipient A0 is the absorbance of hemoglobin in the supernatant of the reaction blank and A100 is the absorbance of hemoglobin in the supernatant after total cell lysis with sodium dodecyl sulfate Hemolytic activity was considered to have started when mean values were greater than 2 of hemolysis
333 Blood distribution
Freshly prepared heparinised blood was used and experiments were performed in triplicate both in the presence and absence of excipients The hematocrit was determined using a hematocrit centrifuge and a hematocrit reader (Haemofuge Heraeus Sepatech Germany) In order to reduce hemolysis blood aliquots (1 mL) were partially centrifuged (500 x g for 2 min) before adding the test solution in the cell-free layer followed by mixing immediately Samples were incubated at 37degC Time aliquots (1 mL) were removed and prepared for measuring radioactivity of the test compound in whole blood before centrifugation and in plasma after centrifugation for 10 min at 3100 x g (37degC) by LSC
The fraction of the test compound in plasma (FP) was calculated according to
100)1(
() times
minustimes
=
B
P
PC
HCF
where CB and CP are the drug concentration in blood and plasma respectively and H is the hematocrit value The concentration in blood cells (CBC) was calculated as follows
19
H
HCCC PB
BC
)1( minustimesminus=
and used for calculations of blood cell to plasma concentration ratio (BCPR CBCCP) and blood cell to unbound in plasma concentration ratio (ρ CBC(CPfu)) fu is the drug fraction unbound in plasma determined by the appropriate protein binding method for each compound
334 Plasma protein binding
Control experiments in phosphate buffered saline (PBS Gibco Paisley Scotland) were carried out to assess the suitability of the methods described below for each test compound in the following order ultrafiltration gt dialysis gt ultracentrifugation with ultrafiltration being the first procedure Control experiments indicated that ultrafiltration is a suitable method for COM1 COM3 COM4 and COM5 (free-permeation gt075 recovery gt85) and ultracentrifugation for COM2 (no sedimentation after 6-h centrifugation recovery gt85 ultrafiltration and dialysis showed insufficient recovery and free-permeation) Therefore protein binding was determined by the ultrafiltration technique (COM1 COM3 COM4 and COM5) or the ultracentrifugation technique (COM2)
Ultrafiltration
Samples of spiked plasma were incubated at 37degC until binding equilibrium Aliquots of 1 mL were introduced in prewarmed (37degC) Centrifree micropartition tubes (Amicon Inc Beverly MA USA) and centrifuged for 10 min at 2000 x g (37degC) For the determination of the unbound drug fraction in plasma concentrations of the test compound in ultrafiltrate and plasma were measured The unbound fraction in plasma (fu) was calculated as follows fu()=(CUFCP)x100 where CUF and CP are the drug concentration in ultrafiltrate and in plasma respectively
Equilibrium dialysis
Test solution was added to plasma followed by mixing Dialysis was carried out with 150 microL of this sample against an equal volume of phosphate-buffered saline (pH 72) in a 96-well micro-equilibrium dialysis block (HTDialysis LLC Gales Ferry CT USA) Dialysis membranes with a 12000-14000 molecular weight cut-off were soaked in phosphate buffered saline (pH 72) before use After establishment of the equilibrium buffer solution aliquots containing only unbound drug and plasma aliquots containing both bound and unbound drug were analyzed for the test compound The ratio of drug concentrations measured in the buffer and plasma after dialysis was taken as an estimate of unbound drug fraction in plasma
Ultracentrifugation
Samples of spiked plasma were incubated at 37degC until binding equilibrium Aliquots of 1 mL were transferred to polycarbonate centrifuge tubes (Beckman) and either centrifuged in a TLA 1002 rotor in Beckman TL 100 centrifuge (200000 x g 6 h 37degC) or incubated for 6 h (37degC) After centrifugation samples were separated into three layers according to density A 80-microL aliquot of the middle layer (protein-free partplasma water) was taken and analyzed for the test compound representing the unbound concentration in plasma (CU) Total plasma concentration (CP) was
20
determined in incubated samples The unbound drug fraction in plasma was calculated using CUCP
Determination of major binding protein
The affinity of test compounds to different plasma proteins was determined using the appropriate method for each compound Purified human plasma proteins were dissolved in phosphate buffered saline (PBS Gibco Paisley Scotland) at physiological concentrations as follows albumin 40 gL (ge96 Sigma) α-acid glycoprotein 1 gL (from Cohn Fraction VI 99 Sigma) γ-globulins 12 gL (from Cohn Fraction II and III Sigma) high density lipoprotein 39 gL (gt95 Calbiochem) low density lipoprotein 36 gL (gt95 Calbiochem) and very low density lipoprotein 13 gL (gt95 Calbiochem) Test solution was added to protein solutions to obtain a compound concentration of 10 ngmL (COM1 COM2) or 1000 ngmL (COM3 COM4 COM5) After incubation at 37degC separation of bound and unbound compound was achieved according methods Ultrafiltration was performed by centrifugation for 10 min for samples containing albumin and γ-globulins and for 2 min for all other samples
335 Determination of protein concentration
Protein concentration was measured by the method of Bradford (Coomassie blue protein assay) at 595 nm by using a Bio-Rad protein assay (Bio-Rad Laboratories Muumlnchen Germany) The protein concentration was determined by using a calibration curve that was established with known concentrations of human serum albumin (ge96 Sigma) ranging from 0 to 05 mgmL 10-microL aliquots of plasma (1200 dilution) and plasma water were pipetted into microtiter plate wells 200 microL dye reagent were added and samples were mixed After 1-h incubation at room temperature absorbance was measured
34 In vivo studies
Samples collected after intravenous administration of COM1 COM2 and COM3 were assayed for radioactivity by LSC and parent drug by LC-RID COM4 and COM5 were quantified in all in vivo samples only by radioactivity measurements (LSC) since the radioactivity of both radiolabeled compounds reflects well the parent drug due to no major degradation at 1 h after intravenous administration in rats (151152)
341 Experimental animals
Male Wistar rats (~250 g) and male OF1 mice (~30 g) were obtained from Charles River (Sulzfeld Germany) All animals were housed in standard cages in a controlled environment maintained on an automatic 12-h lighting cycle at a temperature of 22degC according to institutional guidelines The animals were given a standard chow and water ad libitum The animals were used after having been starved overnight
342 Drug administration and sample collection
All dosing solutions were prepared within 1 h prior to injection and stored at room temperature until use Administration was performed by a single bolus injection into the femoral vein after animals had been lightly anesthetized by isoflurane (Forenereg) Rats received [3H]COM1 at 4 microgkg as solution (1 mLkg) in glucose 5 containing
21
ethanol 1 (vv) or TPGS 20 (wv) Mice were injected a dose of 400 ngkg of [3H]COM2 formulated as solution (5 mLkg) in blank plasma (obtained by centrifugation of freshly drawn mouse blood) or in glucose 5 containing TPGS 10 (wv) An iv dose of 1 micromolkg radiolabeled COM3 (3H 300 microgkg 14C 370 microgkg) in EtOHPEG200Glu 5590 (vvv) or 40 HP-β-CyD (wv) was injected to rats (1 mLkg) [14C]COM4 was administered at 400 microgkg in saline or 17 CEL (vv) to rats (2 mLkg) [14C]COM5 at 1 mgkg in saline containing either ethanol 10 (vv) or 17 Solutol (wv) were injected to rats (2 mLkg)
Using these injection preparations excipient concentrations in blood may be estimated as about 03 (COM1) 05 (COM3 COM4 COM5) and 07 (COM2) in animals (~70 mL bloodkg) These concentrations were similar to those used in the in vitro experiments
Samples were collected after drug administration at 008 025 and 05 h for COM1 and at 008 025 05 and 1 h for COM2 COM3 COM4 and COM5 Animals (n=3 per time point) were sacrificed by isoflurane inhalation for sample collection Blood samples were collected from the vena cava and transferred into tubes containing heparin (heparin-Na BBraun) as anticoagulant Plasma samples were obtained by immediate centrifugation of blood samples at 3000 x g for 10 min Tissues were excised blotted dry and weighed Collected tissue comprised lung heart liver kidney fat muscle skin and brain for COM1 COM2 COM3 and lung muscle and skin for COM4 and brain muscle and skin for COM5 All samples were immediately frozen and stored at -20degC until analysis Tissue samples were homogenized before quantification
343 Bladder catheterization and urine collection
The experiment was performed in situ under anesthetized rats Animals (n=3formulation) received im injections of ketamine hydrochloride at a dose of 50 mgkg (100 mgmL 05 mLkg) and are positioned on an isothermal heating pad prewarmed at 38degC The abdomen was opened through a mid-line incision A polyethylene tubing (Clay-Adams PE-50) was inserted into the dome of the bladder and held in place with a purse string suture The formulation was injected into the surgically exposed femoral vein and urine was collected at 05 1 15 and 2 h after dosing All samples were frozen and stored at -20degC until analysis
344 Ex vivo protein binding
Ex vivo protein binding was determined for COM1 COM3 COM4 and COM5 according to the in vitro procedure Briefly remaining plasma samples of each time point were pooled and the unbound drug concentration in plasma was quantified using the ultrafiltration technique (see 334) After centrifugation plasma and ultrafiltrate samples were assayed for radioactivity by LSC and parent drug by LC-RID
35 Measurement of the radioactivity
Aliquots of blood plasma urine (25-50 microL) and homogenates (250 microL) were introduced into counting vials and solubilized in Biolute-S (Zinsser Analytic) Samples obtained from in vivo studies containing tritium-labeled drug were dried and the residue was reconstituted in water before solubilization To the blood samples
22
hydrogen peroxide 30 was additionally added and vials were gently swirled for several seconds and let stand for 30 min After adjusting pH gt7 by addition of hydrochloric acid 2 N the vials were filled with scintillation cocktail (Irgasafe Plus Zinsser Analytic) kept in the dark for 16 h and measured in a Tri-Carb liquid scintillation spectrometer Model A2200 (Packard)
36 Determination of parent drug 3H-radiolabeled COM1 COM2 and COM3 were determined by a liquid
chromatography-reverse isotope dilution method (LC-RID) A sample aliquot (100-500 microL) and 200 microL water containing 5 microg (COM1 COM3) or 2 microg (COM2) non-radiolabeled test compound as internal standard was added to a glass tube After further addition of 1 mL water 100 microL Titrisol buffer (pH 4 COM1 COM2 pH 7 COM3) and 4 mL diethyl ether (COM1 COM2) or tert-butylmethylether (COM3) tubes were shaken for 30 min and centrifuged (3300 x g for 10 min) The organic layer was collected in another glass tube and evaporated in a vacuum centrifuge (Univapo 150H UniEquip Martinsried Germany) The residue was taken up in 250 microL of mobile phase-water (8020 vv) and 75 microL n-hexane and the mixture was transferred in an auto sampler glass vial After centrifugation (13000 x g for 2 min) the hexane layer was discarded and 200 microL of the remainder was injected into the HPLC system equipped with a Supelcosil LC-18 column (5 microm 46 mm x 150 mm) for COM1 or Waters XTerra RP 8 column (5 microm 39 x 150 mm) for COM2 and COM3 The column temperature was 40degC and the absorbance was detected at a wavelength of 312 nm (COM1) 441 nm (COM2) or 261 nm (COM3) The mobile phase (isocratic gradient) consisted of ammonium acetate 10 mM-acetonitrile (4555 COM1 5050 COM2) or ammonium acetate 10 mM-triethylamine 01 in acetonitrile (5842 COM3) and was pumped at a rate of 10 mLmin The peak corresponding to the unchanged compound was collected in a polyethylene vial by a fraction collector (Pharmacia LKB SuperFrac) and analyzed for radioactivity Concentrations of the test compound in samples were calculated from the ratio of the amount of radioactivity in the eluted fraction and the area of the absorbance of the non-radiolabeled test compound used as internal standard
37 Data analysis
Total radioactivity concentrations expressed as ng-eqmL or ng-eqg were estimated by dividing the radioactivity concentration in samples by the specific radioactivity of administered test compound using Microsoft Excel Concentrations of parent drug were determined by the principle of reverse isotope dilution using following equation in Microsoft Excel
ID
AD
IS
AS
A
A
A
A=
where AAS is the amount of analyte in the sample (unknown to be determined) AIS is the amount of internal standard added to the sample AAD is the amount of analyte detected and AID is the amount of internal standard detected AAD was calculated using R(SRxS) where R is the amount of radioactivity determined in the peak fraction SR is the specific radioactivity and S is the slope The amount of internal standard detected was calculated as AID=AreaRF-AAD where RF is the response factor (Areang) The level of quantification (LOQ) was set to 75 dpm LOQs of
23
radioactivity and test compound in blood plasma urine and tissues were calculated by dividing 75 dpm by the specific radioactivity of the administered test compound and by the sample amount P values were calculated with a two-sample t-test in Microsoft Excel assuming unequal variances The level of significance was set at P lt005
38 Pharmacokinetic analysis
Pharmacokinetic parameters were estimated as follows The area under the drug concentration-time curve (AUC) was determined by the linear trapezoidal rule using the mean data points The half-life (t12) was calculated using ln2k where k is the rate constant k was estimated by the slope of the regression line plotted through the three final data points of the semilogarithmic AUC taking into consideration a square of correlation coefficient of RSQ gt090 Volume of distribution (V0) was calculated by dividing the dose by the concentration at time zero (C0) C0 was obtained by extrapolation to zero time of the concentration-time plot in semilogarithmic scale
24
4 Results and discussions
41 Hemolytic activity of excipients
In vitro results
CELEtOH 6535 EtOH HP-β-CyD PEG 200 and Solutol did not induce hemolysis in dog and human blood at 05 and a contact time of 4 h (data not shown) In contrast TPGS at 05 incubated with blood of various species caused hemolysis in a time-dependent manner (Figure 4-1) Erythrocytes from rat and human were more sensitive than those of mouse and dog indicated by cell lysis at shorter contact times Reducing the TPGS concentration from 05 to 01 induced no hemolysis in all four species in the investigated time range (data not shown)
010
2030
4050
6070
1 h 2 h 4 h 6 h
Incubation time
Hem
oly
sis
(
)
Rat
Mouse
Dog
Human
Figure 4-1 Effect of incubation time on the hemolytic activity of TPGS
Induced hemolysis by 05 TPGS in blood of various species (n=3 mean plusmn SD) Hemolysis in rat blood after 6-h incubation was not determined
Discussion
Except for TPGS all tested excipients (CEL EtOH HP-β-CyD Solutol and PEG 200) were non-hemolytic which is consistent with data reported in the literature (134135136137138) and the fact that they are widely used in commercially available parenteralia (54) TPGS at 05 exhibited marked hemolysis after longer contact time (gt1 h) whereas TPGS at 01 showed no hemolysis under equal incubation conditions The detected hemolysis might possibly result not mainly from TPGS but from metabolites namely α-tocopheryl succinate and polyethylene glycols both being able to destruct erythrocytes (134139140) This phenomena could contribute to the extensively delayed onset of hemolysis For the investigations TPGS at 05 was used in the non-hemolytic time range
25
42 Impact of the hematocrit on blood partition parameters
In vitro results
Whole blood derived from three species was incubated with COM2 (100 ngmL) at varying hematocrit values Concentrations of COM2 in blood and plasma were measured at equilibrium and partition parameters calculated from these data are summarized in Table 4-1 Concentrations in blood plasma and blood cells remained unaffected by the hematocrit value (040-060) The partition parameter BPR was also similar over the investigated hematocrit range whereas BCPR changed slightly and FP distinctly both decreasing by increasing the hematocrit from 040 to 060
Table 4-1 Effect of hematocrit on the in vitro blood distribution of COM2
Blood cell concentrations and partition parameters (FP BPR and BCPR) derived from [3H]COM2 concentrations measured in blood and plasma using same blood pools at different hematocrit values (n=3 mean plusmn SD)
Species Hematocrit Concentration (ngmL) FP BPR BCPR
Blood Plasma Blood cells () Mouse 040 50 plusmn 1 121 plusmn 003 152 plusmn 007 045 46 plusmn 2 120 plusmn 006 144 plusmn 013 050 101 plusmn 3 87 plusmn 4 116 plusmn 8 43 plusmn 0 116 plusmn 001 132 plusmn 001 055 40 plusmn 1 113 plusmn 004 123 plusmn 006 060 36 plusmn 1 112 plusmn 003 119 plusmn 005 Dog 040 48 plusmn 2 126 plusmn 006 166 plusmn 014 045 44 plusmn 1 125 plusmn 004 157 plusmn 009 050 109 plusmn 4 90 plusmn 2 131 plusmn 15 41 plusmn 1 125 plusmn 003 151 plusmn 005 055 38 plusmn 1 119 plusmn 003 135 plusmn 006 060 35 plusmn 1 113 plusmn 002 122 plusmn 003 Human 040 70 plusmn 3 086 plusmn 003 066 plusmn 008 045 65 plusmn 2 084 plusmn 003 065 plusmn 007 050 101 plusmn 5 125 plusmn 10 78 plusmn 6 63 plusmn 2 080 plusmn 003 060 plusmn 006 055 55 plusmn 2 082 plusmn 003 068 plusmn 006 060 55 plusmn 1 073 plusmn 002 055 plusmn 003
Discussion
The in vitro method for investigating distribution of drugs in blood commonly uses whole blood freshly prepared and pooled Drug concentrations in blood and plasma are determined Based on these data further partition parameters including CBC FP BPR and BCPR can be estimated but they are partially dependent on the hematocrit Therefore it is important to know how the hematocrit affects these parameters thereby providing useful information for comparing results With this in mind present experiments were performed over the entire physiological hematocrit range in blood pools of three different species (mouse dog and human) COM2 was used as test compound due to sufficient availability
The rank order of hematocrit influences was FP gt BCPR gt BPR gt CB asymp CP asymp CBC with most pronounced changes for FP and none for CBCPCBC Parameters calculated from concentrations measured in samples decreased constantly with increasing the hematocrit (040-060) which was most distinct for FP But within a hematocrit variation of 005 none of the parameters was dependent on the
26
hematocrit Consequently blood partition data obtained from in vitro experiments with similar hematocrits are consistent and can be compared together For data comparison across studies hematocrit adjusting to values of previous studies is suggested taking into consideration a difference of le005 between the lowest and highest value
43 Major binding proteins of model compounds
In vitro results
Figure 4-2 illustrates the qualitative binding of model compounds to isolated proteins compared to the total fraction bound in plasma The following ranking was obtained with regard to decreasing order of protein binding
COM1 albumin gt α1-acid glycoprotein gt γ-globulins asymp lipoproteins COM2 albumin gt lipoproteins gt γ-globulins gtgt α1-acid glycoprotein COM3 α1-acid glycoprotein gt albumin gt γ-globulins gtgt lipoproteins COM4 albumin gt α1-acid glycoprotein gtgt γ-globulins asymp lipoproteins COM5 albumin asymp α1-acid glycoprotein gtgt γ-globulins asymp lipoproteins
0
10
20
30
40
50
60
70
80
90
100
COM1 COM2 COM3 COM4 COM5
Bo
un
d f
racti
on
(
)
Plasma Albumin AGP γ-globulins HDL LDL VLDL
Figure 4-2 Qualitative differences in protein binding patterns of model compounds in vitro
Total protein-bound fraction of compounds in human plasma compared to the qualitative extent of compound binding to various isolated human proteins (albumin AGP γ-globulins and lipoproteins such as HDL LDL and VLDL) Each bar represents mean plusmn SD (n=3)
Discussion
In vitro experiments showed the binding of model compounds with different degrees to the three major drug-binding proteins in plasma (albumin α1-acid glycoprotein lipoproteins) A high binding to albumin (A) and α1-acid glycoprotein (AGP) was found for COM1 and COM4 (AgtAGP) COM5 (AasympAGP) and COM3 (AltAGP) In contrast COM2 was highly bound to albumin and lipoproteins
27
44 The impact of Vitamin E TPGS on COM1 in rat
In vitro results
The equilibrium of COM1 between plasma and blood cells was reached within few minutes (lt5 min data not shown) and the fraction of COM1 distributed in plasma (~75) was independent of initial blood concentrations of COM1 (006-6 ngmL) and of excipients at 05 (Table 4-2) Enhancing the excipient concentration to 5 in blood resulted in decreased COM1 in blood cells especially in the presence of TPGS (Table 4-2) In plasma COM1 was highly protein bound with high contribution of albumin and α1-acid glycoprotein in binding (Figure 4-2) and a lower free fraction was found for COM1 in TPGS at 5 (Table 4-2) TPGS was taken for the in vivo study due to the most pronounced changes observed in the in vitro experiments
Table 4-2 Effect of excipients on blood distribution and protein binding of COM1 in vitro
Partition parameters of [3H]COM1 at 006-6 ngmL obtained at equilibrium after incubation with and without excipients in rat blood (pH 74 H 046 plusmn 003 n ge3 mean plusmn SD)
Excipient FP BPR BCPR fu ρ
() () ()
None 728 plusmn 22 071 plusmn 002 041 plusmn 004 41 plusmn 02 99 plusmn 1 HP-β-CyD 05 798 plusmn 17 065 plusmn 001 027 plusmn 002 nd nd 5 882 plusmn 24 063 plusmn 002 017 plusmn 004 nd nd Solutol 05 702 plusmn 24 073 plusmn 001 043 plusmn 001 nd nd 5 878 plusmn 23 064 plusmn 001 018 plusmn 002 nd nd TPGS 05 802 plusmn 24 064 plusmn 001 026 plusmn 001 39 plusmn 07 66 plusmn 03 5 956 plusmn 20 063 plusmn 001 008 plusmn 003 17 plusmn 03 53 plusmn 15
In vivo results
In contrast to the control group where a dose of 4 microgkg was applied COM1 was administered in the TPGS group at 27 microgkg due to little compound availability Data presented within this section are normalized to a dose of 1 microgkg
Independent of the formulation plasma levels declined very rapidly with an apparent half-life of 017 h and COM1 was rapidly metabolized (lt30 unchanged COM1 in plasma at 008 h post-dose) Metabolites were fast eliminated from body indicated by a low recovery of administered COM1 shortly after dosing (lt30 of administered dose recovered at 008 h post-dose)
Upon intravenous administration of COM1 as a TPGS-containing solution lower total plasma concentrations combined with an increase of COM1 unbound in plasma by 50 were found in contrast to the control group (Table 4-3 Figure 4-3) However free drug concentrations in plasma did not differ between both groups resulting in similar AUCs (Table 4-3) This is in line with identical tissue concentrations observed in both groups (data not shown) since only the unbound drug is supposed to pass across membranes Furthermore COM1 in TPGS led to a lower fraction of parent drug in plasma (funchanged Table 4-3) and higher metabolite-related concentrations in plasma (2-fold increase Figure 4-3) indicating alterations in the kinetic profile of metabolites
28
Table 4-3 Comparative plasma kinetics of COM1 with and without TPGS
Plasma concentrations and pharmacokinetic parameters of [3H]COM1 administered intravenously in formulations based on glucose 5 (control) or TPGS 20 to rats (LOQ=2 pgmL n=3 mean plusmn SD) Data are normalized to a dose of 1 microgkg AUC(u)008-05h relates to area under unbound drug plasma concentration-time curve
Time Control TPGS
(h) COM1 in plasma (pgmL) Percentage of control value
008 184 plusmn 77 110 plusmn 6 60 025 59 plusmn 13 39 plusmn 6 66 05 32 plusmn 11 20 plusmn 6 62 C0 (pgmL) 215 132 AUC008-05h (pgmiddotmL
-1middoth) 32 20
AUC(u)008-05h (pgmiddotmL-1
middoth) 067 076 t12 (h) 017 017 funchanged () 187 55 fu () 21 plusmn 01 38 plusmn 03
Parent drug Metabolites
10
100
1000
0 025 05
Time (h)
CO
M1
(p
gm
L)
100
1000
10000
0 025 05
Time (h)
Rad
ioacti
vit
y (
pg
-eq
mL
)
Figure 4-3 Influence of TPGS on the systemic exposure of COM1 and metabolites
Plasma concentration-time profiles of parent drug and metabolite-related radioactivity of [3H]COM1 after intravenous administration to rats COM1 was injected in glucose 5 (closed symbols black line) or TPGS 20 (open symbols dashed line) Data shown are normalized to a dose of 1 microgkg and symbols represent single values and lines mean values (n=3) Values of metabolite-related radioactivity were obtained by subtracting concentrations of parent drug from concentrations of total radioactivity
Discussion
Drug-excipient interaction studies showed no direct correlation between the in vitro results and the in vivo situation in rats Upon intravenous administration of COM1 in TPGS slightly lower plasma concentrations and binding to plasma proteins were observed in animals as compared to those received COM1 in a TPGS-free solution In contrast to these in vivo findings COM1 displayed in vitro no alterations in the presence of TPGS at 05 whereas a higher TPGS concentration (5) led to
29
enhanced distribution into plasma and a higher fraction bound in plasma Furthermore very rapid metabolism and elimination of COM1 under in vivo conditions contributed to a pharmacokinetic profile inappropriate for studying drug-excipient interactions
45 The impact of Vitamin E TPGS on COM2 in mouse
In vitro results
To assess whether the ultracentrifugation time could be shortened for minimizing the degradation of COM2 in plasma (147) blank plasma samples were centrifuged and time aliquots were analyzed for total protein concentrations in plasma and plasma water After 4-h centrifugation protein levels in the plasma water section were below 005 ngmL corresponding to ~01 of total plasma proteins adequate to assure a sufficient separation of plasma water and proteins Therefore samples were collected after 4-h centrifugation for analysis
COM2 (001-100 ngmL) distributed almost equally between whole blood and plasma (FP ~45) and was very highly bound to plasma proteins (gt98 mainly to albumin and lipoproteins) (Figure 4-2) The plasma fraction (63) was enhanced for COM2 in TPGS at the beginning (lt1-h incubation) followed by equalization to excipient-free incubations (Table 4-4 Figure 4-4) The presence of TPGS reduced also the free fraction in plasma by 30 (Table 4-4) Finally TPGS was selected for the in vivo study because of the most pronounced drug-excipient interactions detected in vitro
Table 4-4 Effect of excipients on blood distribution and protein binding of COM2 in vitro
Partition parameters of [3H]COM2 at 01 ngmL obtained at equilibrium after incubation with and without excipients (05) in mouse blood (pH 73 H 045 nge3 mean plusmn SD)
Excipient Time FP BPR BCPR fu ρ
(h) () ()
None 008 406 plusmn 07 136 plusmn 002 179 plusmn 005 102 plusmn 3 1 448 plusmn 24 123 plusmn 007 151 plusmn 015
176 plusmn 003 86 plusmn 8
CELEtOH 6535(vv) 008 455 plusmn 14 121 plusmn 004 146 plusmn 009 nd 1 438 plusmn 03 125 plusmn 001 157 plusmn 002
nd nd
HP-β-CyD 008 472 plusmn 14 117 plusmn 009 138 plusmn 019 nd 1 494 plusmn 16 111 plusmn 004 125 plusmn 008
nd nd
Solutol 008 468 plusmn 11 118 plusmn 003 139 plusmn 006 nd 1 472 plusmn 16 117 plusmn 004 137 plusmn 009
nd nd
PEG 200 008 425 plusmn 13 129 plusmn 004 165 plusmn 009 nd 1 418 plusmn 20 132 plusmn 006 171 plusmn 014
nd nd
TPGS 008 629 plusmn 23 087 plusmn 003 072 plusmn 007 58 plusmn 7 1 533 plusmn 07 103 plusmn 001 107 plusmn 003
122 plusmn 012 88 plusmn 3
30
(a)
00
05
10
15
008 h 1 h
BP
R(b)
00
05
10
15
20
008 h 1 h
BC
PR
(c)
0
20
40
60
80
100
008 h 1 h
ρ
Figure 4-4 TPGS-mediated alteration of COM2 distribution in blood
Blood-plasma (a) blood cell-plasma (b) and blood cell-unbound in plasma (c) concentration ratios of [3H]COM2 at 01 ngmL in the presence (white bars) and absence (black bars) of TGPS (05) after 008-h and 1-h incubation in mouse blood (pH 73 H 045 nge3 mean plusmn SD)
In vivo results
In a previous study (153) the disposition kinetics of COM2 was evaluated in mice after iv administration in a solution containing HP-β-CyD 10 (5 mLkg) To enable a comparison of former data with those in the current investigation for internal purposes only COM2 was injected at a volume of 5 mLkg dissolved in plasma or TPGS 10 The blood concentration of TPGS from this injection preparation was estimated as ~07 assuming a blood volume of 72 mLkg Thus the amount of TPGS in blood was higher in vivo compared to the amount used in vitro (05)
The administration of COM2 as TPGS-containing solution at the same dosage caused approximately 2-fold higher plasma concentrations as compared to COM2 formulated in plasma (control) (Table 4-5 Figure 4-5) These findings are in line with data obtained in blood distribution studies in vitro where partitioning into blood cells was reduced in the presence of TPGS resulting in a higher concentration in plasma at the same total blood concentration Furthermore in vivo a higher plasma exposure to metabolites and a slower elimination of metabolites from the systemic circulation were found for COM2 in TPGS indicated by 4-fold increased AUC and t12 of metabolite-related radioactivity in plasma (Table 4-6) Determination of unbound COM2 in plasma could not be performed on samples from mice due to concentrations below LOQ (3 pgmL)
No differences in tissue concentrations were observed between both groups although COM2 in TPGS resulted in a decrease of V0 (Table 4-5) and KP (Table 4-7) both suggesting altered tissue distribution and being in line with higher drug accumulation in the circulation Because the free drug fraction in plasma generally reflects more accurately distribution processes due to the ability of unbound drugs to pass through membranes and then reach the target organ the free drug fraction determined in vitro was considered Calculated tissue-unbound in plasma concentration ratios KP(u) were reduced in the TPGS group only within the first minutes after drug administration (Table 4-7)
31
Table 4-5 Comparative plasma kinetics of COM2 with and without TPGS
Plasma concentrations (a) and pharmacokinetic parameters (b) of [3H]COM2 after iv dosing at 400 ngkg in formulations based on blank plasma (control) or TPGS to mice (LOQ=3 pgmL n=3 mean plusmn SD) significantly different from the control at Plt005 and 001 respectively
(a)
Time COM2 in plasma (pgmL)
(h) Control TPGS Percentage of control value
008 104 plusmn 11 247 plusmn 23 238 025 81 plusmn 12 159 plusmn 16 196 05 59 plusmn 2 124 plusmn 17 210 1 34 plusmn 7 80 plusmn 17 235
(b)
Parameter Unit Formulation
Blank plasma TPGS 10 Body weight kg 0028 0027 Dose ng 110 107 C0 pgmL 111 237 tfrac12 h 057 061 V0 Lkg 36 17 AUC008-1h pgmiddotmL-1middoth 56 121 DoseAUC008-1h mLh 196 89 funchanged 54 35
Parent drug Metabolites
10
100
1000
0 025 05 075 1
Time (h)
CO
M2 (
pg
mL
)
10
100
1000
0 025 05 075 1
Time (h)
Rad
ioacti
vit
y (
pg
-eq
mL
)
Figure 4-5 Influence of TPGS on the systemic exposure of COM2 and metabolites
Plasma concentration-time profiles of parent drug and metabolite-related radioactivity of [3H]COM2 after intravenous administration to mice at 400 ngkg formulated in blank plasma (closed symbols black line) or as a solution containing TPGS 10 (open symbols dashed line) Symbols represent single values and lines mean values (n=3) Values of metabolite-related radioactivity were obtained by subtracting concentrations of parent drug from concentrations of total radioactivity
32
Table 4-6 Comparative plasma kinetics of metabolites of COM2 with and without TPGS
Plasma concentrations and pharmacokinetic parameters of metabolite-related radioactivity after iv administration of [3H]COM2 (400 ngkg) in blank plasma (control) or TPGS 10 to mice (n=3 mean plusmn SD) Values of metabolite-related radioactivity were obtained by subtracting concentrations of parent drug from concentrations of total radioactivity significantly different from the control at Plt001
Time Control TPGS
(h) Metabolites in plasma (pg-eqmL) Percentage of control value
008 75 plusmn 6 307 plusmn 28 408 025 67 plusmn 4 233 plusmn 9 346 05 56 plusmn 2 246 plusmn 30 441 1 29 plusmn 8 218 plusmn 31 744 AUC008-1h (pgmiddotmL
-1middoth) 49 222 453
t12 (h) 06 24 395
Table 4-7 Comparison of tissue distribution of COM2 with and without TPGS
Tissue concentrations and tissue-plasma concentration ratios (KP) of [3H]COM2 administered intravenously at 400 ngkg in blank plasma (control) or 10 TPGS solution to mice (n=3) KP(u) relates to the free compound concentration in plasma based on the free fraction determined in vitro Values represent mean plusmn SD
Time Tissue Concentration (pgg) KP KP(u)
(h) Control TPGS Control TPGS Control TPGS 008 Lung 1808 plusmn 263 1861 plusmn 64 173 plusmn 07 76 plusmn 05 981 plusmn 39 621 plusmn 42 Heart 750 plusmn 111 699 plusmn 33 72 plusmn 03 28 plusmn 01 407 plusmn 17 233 plusmn 11 Liver 2188 plusmn 355 2314 plusmn 56 209 plusmn 12 94 plusmn 09 1186 plusmn 69 773 plusmn 72 Kidney 1761 plusmn 390 1735 plusmn 84 167 plusmn 22 71 plusmn 07 951 plusmn 124 580 plusmn 59 Fat 232 plusmn 94 238 plusmn 83 22 plusmn 09 1 plusmn 03 127 plusmn 49 79 plusmn 25 Muscle 166 plusmn 40 190 plusmn 82 16 plusmn 06 08 plusmn 03 92 plusmn 32 62 plusmn 22 Brain 1095 plusmn 70 1038 plusmn 113 105 plusmn 06 42 plusmn 01 598 plusmn 35 345 plusmn 9 025 Lung 1206 plusmn 258 1277 plusmn 213 15 plusmn 26 8 plusmn 05 850 plusmn 148 657 plusmn 43 Heart 464 plusmn 31 473 plusmn 19 58 plusmn 06 3 plusmn 02 330 plusmn 37 246 plusmn 20 Liver 1447 plusmn 203 1626 plusmn 122 18 plusmn 19 103 plusmn 13 1024 plusmn 109 846 plusmn 109 Kidney 1176 plusmn 93 1161 plusmn 83 147 plusmn 19 74 plusmn 1 837 plusmn 108 605 plusmn 86 Fat 650 plusmn 169 1109 plusmn 321 81 plusmn 19 71 plusmn 24 458 plusmn 108 581 plusmn 198 Muscle 215 plusmn 13 214 plusmn 28 27 plusmn 05 14 plusmn 01 155 plusmn 28 111 plusmn 12 Brain 1199 plusmn 143 1180 plusmn 81 152 plusmn 34 75 plusmn 12 863 plusmn 194 616 plusmn 100 05 Lung 755 plusmn 76 923 plusmn 40 129 plusmn 15 75 plusmn 06 732 plusmn 83 615 plusmn 53 Heart 296 plusmn 34 354 plusmn 53 5 plusmn 06 29 plusmn 04 287 plusmn 34 234 plusmn 29 Liver 960 plusmn 91 1138 plusmn 58 163 plusmn 15 93 plusmn 12 929 plusmn 88 760 plusmn 100 Kidney 814 plusmn 102 987 plusmn 120 139 plusmn 19 8 plusmn 04 789 plusmn 110 654 plusmn 34 Fat 863 plusmn 227 1079 plusmn 444 147 plusmn 37 89 plusmn 51 834 plusmn 209 732 plusmn 416 Muscle 181 plusmn 12 170 plusmn 13 31 plusmn 02 14 plusmn 02 175 plusmn 11 113 plusmn 13 Brain 1086 plusmn 108 1215 plusmn 147 18 plusmn 18 98 plusmn 08 1050 plusmn 77 805 plusmn 69 1 Lung 439 plusmn 60 688 plusmn 187 133 plusmn 32 86 plusmn 05 758 plusmn 179 702 plusmn 43 Heart 186 plusmn 28 220 plusmn 72 57 plusmn 15 27 plusmn 04 322 plusmn 87 222 plusmn 31 Liver 581 plusmn 43 867 plusmn 140 176 plusmn 23 11 plusmn 15 998 plusmn 132 903 plusmn 123 Kidney 481 plusmn 37 740 plusmn 89 145 plusmn 19 94 plusmn 09 825 plusmn 105 771 plusmn 78 Fat 551 plusmn 143 504 plusmn 260 173 plusmn 77 71 plusmn 54 984 plusmn 439 584 plusmn 442 Muscle 91 plusmn 12 119 plusmn 37 28 plusmn 08 15 plusmn 03 159 plusmn 43 121 plusmn 25 Brain 731 plusmn 88 1073 plusmn 161 22 plusmn 26 136 plusmn 11 1249 plusmn 147 1114 plusmn 93
33
Discussion
Results signified the ability of the excipient TPGS to modify the blood distribution of COM2 in mouse under in vitro and in vivo conditions in a similar manner Plasma concentrations of COM2 and metabolites were significantly increased and the free fraction of drug in plasma (in vitro) decreased Concentrations in tissues were independent of the formulation whereas distribution ratios of drug in tissue to drug unbound in plasma were lower within the first minutes after dosing COM2 in TPGS Overall the altered pharmacokinetic profile of COM2 in plasma suggests drug inclusion in excipient-micelles andor promoted protein binding by excipient in plasma
The altered disposition of COM2 and metabolites in plasma is likely caused by the ability of TPGS to form micelles (141) Drug trapping by micelles in blood can be responsible for increased total plasma concentrations and decreased unbound fraction in plasma thereby influencing drug accumulation in plasma and blood cells (94) Changes in the free fraction could also be caused by altered protein binding There are different suggested mechanisms by which formulation vehicles can influence the free fraction of compounds such as vehicle-compound interactions (association andor micellar encapsulation) and vehicle-protein interactions The interaction either promotes or blocks the binding of the compound in plasma Most likely different interacting processes contribute to the effective free fraction (125)
The alteration in tissue distribution at the beginning may be induced by changes of the free drug fraction in the presence of TPGS and exists only for few minutes probably due to the excipient degradation in blood The phenomenon found after some minutes post-dose is reported in the literature for Paclitaxel formulated in Cremophor EL (94) The main characteristics are disproportionally increased plasma concentrations accompanied by unchanged tissue levels and tissue distribution processes
46 The impact of hydroxypropyl-β-cyclodextrin on COM3 in rat
In vitro results
COM3 was predominantly located in the cellular fraction (80) and was moderately bound to plasma proteins with high binding to α1-glycoprotein and albumin in a concentration-independent manner (Table 4-8 Figure 4-2) The drug partitioning into blood cells and the fraction bound to proteins were markedly reduced in incubations containing HP-β-CyD consequently lowering both the blood-plasma and blood cell-unbound in plasma concentration ratios (Table 4-8 Figure 4-6) Whereas HP-β-CyD decreased the protein binding suggesting more COM3 available for uptake into cells higher plasma levels associated with reduced concentrations in cells were observed for COM3 in HP-β-CyD In conclusion HP-β-CyD was selected for the in vivo study because of the most pronounced drug-excipient interactions detected in vitro
34
(a)
0
1
2
3
None HP-β-CyD
BP
R(b)
0
1
2
3
4
5
None HP-β-CyD
BC
PR
(c)
0
10
20
30
40
None HP-β-CyD
ρ
Figure 4-6 HP-β-CyD-mediated alteration of COM3 distribution in blood
Blood-plasma (a) blood cell-plasma (b) and blood cell-unbound in plasma (c) concentration ratios of [3H]COM3 at 5 (white bars) and 500 ngmL (black bars) in the presence and absence of HP-β-CyD (05) after incubation in rat blood (pH 76 H 044 nge3 mean plusmn SD)
Table 4-8 Effect of excipients on blood distribution and protein binding of COM3 in vitro
Partition parameters of [3H]COM3 obtained at equilibrium after incubation with and without excipients (05) in rat blood (pH 76 H 044 nge3 mean plusmn SD)
Excipient COM3 FP BPR BCPR fu ρ
(ngmL) () () None 5 209 plusmn 15 26 plusmn 01 46 plusmn 02 121 plusmn 09 399 plusmn 39 500 195 plusmn 03 29 plusmn 00 53 plusmn 01 122 plusmn 02 431 plusmn 08
5 194 plusmn 14 29 plusmn 02 56 plusmn 02 nd nd CELEtOH 6535 (vv) 500 175 plusmn 03 32 plusmn 01 60 plusmn 01 nd nd HP-β-CyD 5 385 plusmn 22 14 plusmn 01 21 plusmn 02 401 plusmn 18 51 plusmn 05 500 353 plusmn 04 16 plusmn 00 23 plusmn 00 396 plusmn 07 59 plusmn 01 Solutol 5 174 plusmn 14 32 plusmn 03 61 plusmn 04 nd nd 500 161 plusmn 03 35 plusmn 01 67 plusmn 01 nd nd PEG 200 5 197 plusmn 20 29 plusmn 03 51 plusmn 06 nd nd 500 186 plusmn 05 30 plusmn 01 56 plusmn 02 nd nd
5 227 plusmn 18 25 plusmn 02 44 plusmn 04 126 plusmn 01 346 plusmn 36 EtOHPEG200Glu 5590 (vvv) 500 200 plusmn 04 28 plusmn 01 51 plusmn 01 118 plusmn 02 432 plusmn 10 TPGS 5 249 plusmn 18 23 plusmn 02 40 plusmn 02 nd nd 500 237 plusmn 03 24 plusmn 00 41 plusmn 01 nd nd
In vivo results
Since COM3 dissolved in EtOHPEG200Glu (5590 vvv) showed similar distribution kinetics in vitro as compared to glucose 5 without additives (Table 4-8) the control formulation consisted of EtOHPEG200Glu This assured a sufficient solubility of COM3
Dosing COM3 in a HP-β-CyD-containing formulation resulted in decreased protein binding and blood cell partitioning as compared to the control group (Table 4-9) However these changes were transient and most pronounced after 5 min post-dosing followed by a decline At 60 min after drug administration differences in blood pharmacokinetics could not be longer detected between both groups anymore (Table 4-9) In contrast to the in vitro findings a lower plasma distribution was found at 5 min after applying COM3 in HP-β-CyD resulting in slightly enhanced blood-plasma and blood cell-plasma concentration ratios (Table 4-9 Figure 4-7)
35
The bolus injection of COM3 in HP-β-CyD led to an earlier decrease of kidney and lung concentrations and to a later decrease of skin liver and fat concentrations compared to tissue levels obtained after administration of COM3 alone (Table 4-11) The calculation of tissue-blood concentration ratios supported the lower distribution of COM3 formulated in HP-β-CyD (Table 4-11) especially at 1 h post-dose (Figure 4-8)
As a result of the difference in plasma pharmacokinetic parameters (Table 4-10) and tissue levels between both groups the renal elimination of COM3 was examined in addition More COM3 appeared in the urine of rats from the HP-β-CyD containing formulation (Table 4-12 Figure 4-9) especially within the first 30 minutes after drug administration (36-fold higher amount of unchanged COM3 in urine compared to the control group)
Table 4-9 Comparison of blood and plasma levels of COM3 with and without HP-β-CyD
[3H]COM3 concentrations in the systemic circulation (a) and partition parameters derived from these concentrations (b) after iv administration to rats at 300 microgkg formulated in HP-β-CyD or in a cyclodextrin-free solution (n=3 mean plusmn SD LOQ=008 ngmL assuming a hematocrit of 046(145) for calculations) significantly different from the control at Plt005 and 001 respectively
(a)
Formulation Time (h) Drug concentration (ngmL)
Blood Plasma EtOHPEG200Glu 5590 008 431 plusmn 68 175 plusmn 24 (control) 05 179 plusmn 40 61 plusmn 19 1 97 plusmn 09 41 plusmn 05 HP-β-CyD 40 008 327 plusmn 16 104 plusmn 11 025 263 plusmn 22 84 plusmn 09 05 180 plusmn 08 59 plusmn 01 1 104 plusmn 06 35 plusmn 02
(b)
Formulation Time (h) fu () FP () BPR BCPR ρ
008 225 plusmn 15 25 plusmn 02 42 plusmn 04 559 plusmn 48 EtOHPEG200Glu 5590 05 76 plusmn 08 187 plusmn 19 30 plusmn 03 54 plusmn 07 709 plusmn 89 (control) 1 233 plusmn 12 24 plusmn 01 40 plusmn 03 533 plusmn 37 HP-β-CyD 40 008 249 plusmn 12 174 plusmn 11 32 plusmn 02 58 plusmn 04 233 plusmn 17 025 177 plusmn 13 175 plusmn 06 31 plusmn 01 58 plusmn 02 325 plusmn 13 05 141 plusmn 06 180 plusmn 07 31 plusmn 01 56 plusmn 03 397 plusmn 18 1 78 plusmn 05 188 plusmn 12 29 plusmn 02 53 plusmn 04 681 plusmn 52
36
Table 4-10 Comparative pharmacokinetics of COM3 with and without HP-β-CyD
Pharmacokinetic parameters of [3H]COM3 administered intravenously in EtOHPEG 200Glu (control group) or in HP-β-CyD 40 to rats (n=3)
Parameter Unit Control group HP-β-CyD group
Blood Plasma Blood Plasma Body weight kg 0233 0221 Dose microg 70 66 C0 ngmL 46 17 35 11 V0 Lkg 66 174 85 271 AUC008-1h ngmL-1
h 197 75 177 58 funchanged 28 10 28 9
Blood Plasma
0
10
20
30
40
50
60
0 025 05 075 1Time (h)
CO
M3 (
ng
mL
)
0
5
10
15
20
25
0 025 05 075 1
Time (h)
CO
M3 (
ng
mL
)
Figure 4-7 Influence of HP-β-CyD on the systemic exposure of COM3
Blood and plasma concentration-time profiles of [3H]COM3 after intravenous administration to rats at 300 microgmL formulated in EtOHPEG 200Glu (open symbols black line) and as a solution containing HP-β-CyD (closed symbols dotted line) Symbols represent single values and lines mean values (n=3)
37
0
10
20
30
40
50
60
70
Liver Kidney Brain
0
5
10
15
Fat Muscle Skin Heart0
50
100
150
Lung
KP
Figure 4-8 Influence of HP-β-CyD on tissue distribution of COM3
Tissue to blood concentration ratio (KP) at 1 h after an iv injection of COM3 in EtOHPEG 200Glu (white bars) or in HP-β-CyD (black bars) in rats (dose 300 microgkg n=3 mean plusmn SD) significantly different from EtOHPEG 200Glu at Plt005
Table 4-11 Comparison of tissue distribution of COM3 with and without HP-β-CyD
Tissue concentrations and tissue-blood concentration ratios (KP) of [3H]COM3 after bolus injection to rats at 300 microgkg in EtOHPEG 200Glu (control) or HP-β-CyD (n=3 mean plusmn SD) significantly different from the control at Plt005
Time Tissue Concentration (ngmL) KP
(h) Control HP-β-CyD Percentage of control value Control HP-β-CyD
008 Liver 1412 plusmn 225 1058 plusmn 211 75 328 plusmn 01 326 plusmn 75 Kidney 1809 plusmn 191 1406 plusmn 72 78 424 plusmn 50 431 plusmn 24 Fat 128 plusmn 29 85 plusmn 18 67 31 plusmn 11 26 plusmn 06 Heart 597 plusmn 108 563 plusmn 55 94 139 plusmn 11 172 plusmn 13 Lung 6179 plusmn 809 4595 plusmn 192 74 1441 plusmn 110 1407 plusmn 6 Muscle 123 plusmn 25 142 plusmn 12 115 30 plusmn 11 44 plusmn 03 Skin 144 plusmn 62 74 plusmn 15 51 36 plusmn 20 22 plusmn 03 Brain 1164 plusmn 189 951 plusmn 41 82 271 plusmn 19 291 plusmn 21 05 Liver 588 plusmn 149 617 plusmn 60 105 329 plusmn 53 345 plusmn 42 Kidney 587 plusmn 163 479 plusmn 55 82 327 plusmn 51 267 plusmn 29 Fat 57 plusmn 10 46 plusmn 6 81 32 plusmn 02 26 plusmn 04 Heart 178 plusmn 46 187 plusmn 23 105 99 plusmn 10 104 plusmn 08 Lung 2003 plusmn 599 2376 plusmn 129 119 1108 plusmn 156 1324 plusmn 76 Muscle 155 plusmn 63 130 plusmn 12 84 84 plusmn 16 72 plusmn 05 Skin 94 plusmn 11 40 plusmn 9 42 54 plusmn 06 22 plusmn 06 Brain 905 plusmn 100 766 plusmn 49 85 515 plusmn 60 428 plusmn 44 1 Liver 394 plusmn 29 340 plusmn 6 86 407 plusmn 12 328 plusmn 19 Kidney 357 plusmn 44 293 plusmn 39 82 366 plusmn 12 283 plusmn 47 Fat 31 plusmn 1 22 plusmn 5 72 32 plusmn 04 21 plusmn 04 Heart 111 plusmn 13 99 plusmn 6 89 114 plusmn 04 95 plusmn 01 Lung 1197 plusmn 128 1053 plusmn 178 88 1247 plusmn 246 1011 plusmn 128 Muscle 99 plusmn 9 85 plusmn 23 86 102 plusmn 02 81 plusmn 19 Skin 68 plusmn 16 25 plusmn 3 37 69 plusmn 11 25 plusmn 02 Brain 653 plusmn 35 599 plusmn 10 92 674 plusmn 27 578 plusmn 22
38
Table 4-12 Comparison of COM3 excretion in urine with and without HP-β-CyD
[14C]COM3 (a) and its cumulative amount (b) appeared in the urine of rats following iv dosing at 370 microgkg in EtOHPEG 200Glu (control) or HP-β-CyD 40 (mean plusmn SD n=2 control n=3 HP-β-CyD) significantly different from the control at Plt005 and 001 respectively (a)
Time (h) COM3 in urine (ng) funchanged ()
Control HP-β-CyD Control HP-β-CyD 05 123 plusmn 10 4440 plusmn 594 25 plusmn 02 448 plusmn 82 1 240 plusmn 129 762 plusmn 191 34 plusmn 08 13 plusmn 41 15 85 plusmn 19 325 plusmn 150 25 plusmn 08 73 plusmn 28 2 43 plusmn 11 174 plusmn 89 2 plusmn 08 46 plusmn 21
(b)
Time Cumulative amount of COM3 in urine
(h) ng dose
Control HP-β-CyD Control HP-β-CyD 05 123 plusmn 10 4440 plusmn 594 013 plusmn 001 46 plusmn 09 1 363 plusmn 139 5202 plusmn 693 039 plusmn 014 54 plusmn 11 15 449 plusmn 159 5527 plusmn 799 048 plusmn 016 57 plusmn 12 2 491 plusmn 169 5702 plusmn 857 053 plusmn 017 59 plusmn 12
0
1000
2000
3000
4000
5000
6000
7000
05 1 15 2
Time (h)
Am
ou
nt
excre
ted
(n
g)
Figure 4-9 Effect of HP-β-CyD on the renal elimination of COM3
Cumulative amount of [14C]COM3 appeared in urine after iv administration of 370 microgkg either in EtOHPEG 200Glu (white bars) or as a solution in HP-β-CyD (black bars) Data are expressed as mean plusmn SD (n=2 EtOHPEG 200Glu n=3 HP-β-CyD) significantly different from the EtOHPEG 200Glu at Plt001
Discussion
In vitro and in vivo experiments demonstrated a strong influence of the excipient HP-β-CyD on the disposition kinetics of COM3 in rats There was a significant decrease in the plasma protein binding and in plasma and tissue concentrations of COM3 formulated in HP-β-CyD Changes in the systemic circulation were transient (le05 h post-dose) and most distinct shortly after dosing Alterations in tissue
39
concentrations and tissue-blood distribution ratios were tissue dependent and most pronounced for skin The amount of unchanged COM3 eliminated in the urine was significantly increased following drug administration in HP-β-CyD This alteration in the pharmacokinetic behavior of COM3 is most likely due to the elimination of COM3 included in cyclodextrin complexes
It is known (142) that HP-β-CyD forms drugcyclodextrin complexes in biological fluids is unable to cross biological membranes and is rapidly eliminated renally Even though the release of drugs from drugcyclodextrin complexes is expected to be fast (within seconds) (112) drug pharmacokinetics can be modified in the presence of cyclodextrins (143) Given that COM3 is included in complexes in the systemic circulation less COM3 is available for distribution which could have led to the lower protein binding and celltissue partitioning of COM3 formulated in HP-β-CyD compared to the cyclodextrin-free solution of COM3 Lower ρ-values of COM3 in HP-β-CyD support the possible existence of long-lasting complexes in vivo and indicate that unbound plasma concentrations obtained from ultrafiltration (30000 MW cut-off) are probably the sum of free and cyclodextrin-associated drug (MWHP-β-CyD
~1500) Furthermore blood partition parameters altered till 30 min post-dose indicate a slow dissociation of COM3 from complexes After total drug release COM3 formulated in HP-β-CyD seemed to assimilate the pharmacokinetic behavior in blood obtained in the control group (60 min post-dose)
The marked increase of unchanged COM3 in the urine occurred mainly in the first 30 min following drug administration in HP-β-CyD which is consistent with the decreased plasma levels right after dosing in the HP-β-CyD group Similar observations are reported for carbamazepine and dexamethasone where the renal excretion of unchanged drug applied intravenously in HP-β-CyD was increased most likely due to the renal clearance of the formulation vehicle (112) The faster elimination of COM3 associated to HP-β-CyD in contrast to COM3 alone might have attributed to less COM3 available for tissue distribution even after completed drug release from the vehicle being in line with decreased tissue levels and KP values at 60 min post-dose
47 The impact of Cremophor EL on COM4 in rat
In vitro results
In excipient-free incubations COM4 was highly bound to plasma proteins (gt97 bound predominantly to albumin) and penetrated hardly into blood cells (gt95 located in plasma) (Tables 4-13 and 4-14 Figure 4-2) The free fraction in plasma and the partitioning into blood cells of COM4 were enhanced in the presence of CEL HP-β-CyD and Solutol The protein binding decreased in an excipient concentration-dependent manner (Table 4-13 Figure 4-10) At excipient concentrations below 01 the protein binding was not altered At and above excipient concentrations of 01 the free fraction was markedly elevated with a maximal effect at 1 for all three formulations The addition of these excipients to incubations resulted to higher blood-plasma and blood cell-plasma concentration ratios both indicating increased uptake of COM4 into blood cells (Table 4-14) CEL was selected for the in vivo study because of the most pronounced drug-excipient interactions detected in vitro
40
Table 4-13 Effect of excipients on the in vitro protein binding of COM4
Protein binding of [14C]COM4 at 100 ngmL in the presence and absence of excipients in rat plasma using the ultrafiltration technique (pH 74 n=3 mean plusmn SD)
Excipient fu
() ()
Percentage of control value
None 24 plusmn 02 CEL 001 23 plusmn 01 96 01 31 plusmn 01 131 05 111 plusmn 03 464 1 260 plusmn 03 1089 HP-β-CyD 001 26 plusmn 02 109 01 43 plusmn 02 179 05 98 plusmn 01 412 1 141 plusmn 11 592 Solutol 001 23 plusmn 02 97 01 32 plusmn 02 134 05 97 plusmn 02 407 1 152 plusmn 03 638 PEG 200 05 24 plusmn 01 99 TPGS 05 2 plusmn 01 85
Table 4-14 Effect of excipients on the in vitro partition parameters of COM4 in blood
Plasma fraction (FP) and distribution ratios (BPR BCPR ρ) of [14C]COM4 at 100 ngmL in rat blood obtained at equilibrium after incubations with and without excipients at 05 and 1 (pH 75 H 044 37degC nge3 mean plusmn SD)
Excipient FP BPR BCPR ρ
() ()
None 959 plusmn 20 058 plusmn 001 005 plusmn 003 21 plusmn 06 CEL 05 739 plusmn 16 075 plusmn 002 043 plusmn 006 39 + 05 1 656 plusmn 17 085 plusmn 002 067 plusmn 005 26 + 02 HP-β-CyD 05 900 plusmn 13 062 plusmn 001 014 plusmn 002 15 plusmn 02 1 819 plusmn 14 068 plusmn 001 028 plusmn 003 20 plusmn 02 Solutol 05 786 plusmn 15 071 plusmn 001 035 plusmn 003 36 plusmn 03 1 749 plusmn 14 075 plusmn 001 043 plusmn 003 28 plusmn 03
In vivo results
Dosing COM4 in a CEL-containing formulation resulted in a decrease of the protein binding as compared to the control group (Table 4-15 Figure 4-10) This effect was time-dependent and most pronounced at 5 min after drug administration followed by a decline The increased fraction of COM4 unbound in plasma did not affect the drug levels in the systemic circulation resulting in similar pharmacokinetic parameters in both groups (Table 4-15) Identical tissue concentrations were observed independently of the formulation (Table 4-16)
41
In vitro Ex vivo
0
5
10
15
20
25
30
0 05 1
Excipient concentration ()
Fre
e f
racti
on
(
)
Cremophor EL
Hydroxypropyl-β-cyclodextrin
Solutol HS 15
0
5
10
15
20
25
0 025 05 075 1
Time (h)
Fre
e f
racti
on
(
)
Control group
Cremophor EL group
Figure 4-10 Excipient-mediated alterations of COM4 protein binding in plasma
Left Unbound fraction of [14C]COM4 (100 ngmL) incubated with different excipient concentrations in rat plasma (mean plusmn SD n=3) Right Unbound fraction of compound-related radioactivity in plasma after intravenous administration of [14C]COM4 at 400 microgkg formulated in buffer (control group closed symbols) or in CEL (open symbols) Symbols represent mean plusmn SD (n=3)
Table 4-15 Comparative blood and plasma kinetics of COM4 with and without CEL
Compound-related radioactivity concentrations in the systemic circulation (a) and pharmacokinetic parameters (b) after iv administration of [14C]COM4 at 400 microgkg formulated in buffer or in CEL to rats (n=3 mean plusmn SD LOQ=43 ng-eqmL assuming a hematocrit of 046(145) for calculations) significantly different from the control at Plt005 (a)
Formulation Time (h) Concentration (ng-eqmL)
Blood Plasma Unbound in plasma ()
008 1555 plusmn 299 2483 plusmn 382 025 1192 plusmn 119 2073 plusmn 238 05 1377 plusmn 67 2388 plusmn 153
Phosphate buffered saline (control)
1 1248 plusmn 68 2105 plusmn 172
38 + 15
Cremophor EL 17 008 1471 plusmn 115 2426 plusmn 186 169 plusmn 34 025 1316 plusmn 119 2180 plusmn 237 77 plusmn 24 05 1216 plusmn 155 2084 plusmn 237 74 plusmn 27 1 1315 plusmn 337 2210 plusmn 607 74 plusmn 28
(b)
Parameter Unit Control group Cremophor group
Blood Plasma Blood Plasma Body weight kg 0201 0199 Dose microg 81 80 C0 ngmL 1427 2373 1385 2296 V0 Lkg 028 017 029 017 AUC008-1h ngmL-1
h 1211 2068 1186 1998
42
Table 4-16 Comparison of tissue distribution of COM4 with and without CEL
Tissue concentrations and tissue-blood concentration ratios of radioactivity of [14C]COM4 after bolus injection to rats at 400 microgkg formulated either in buffer (control group) or in CEL (n=3 mean plusmn SD)
Time Tissue Drug concentration (ng-eqg) Tissue-blood distribution ratio
Control group Cremophor group Control group Cremophor group
008 h Lung 737 + 78 768 + 17 048 + 004 052 + 003 Muscle 222 + 6 243 + 12 015 + 002 017 + 002 Skin 276 + 63 254 + 46 019 + 008 017 + 002 025 h Lung 654 + 44 710 + 51 055 + 002 054 + 001 Muscle 209 + 5 211 + 6 018 + 002 016 + 002 Skin 363 + 70 395 + 41 030 + 004 030 + 004 05 h Lung 695 + 46 676 + 40 050 + 001 056 + 004 Muscle 202 + 4 204 + 1 015 + 0 017 + 002 Skin 408 + 39 372 + 25 030 + 004 031 + 004 1 h Lung 628 + 19 629 + 78 050 + 001 059 + 013 Muscle 212 + 10 196 + 13 017 + 001 019 + 008 Skin 409 + 24 391 + 45 033 + 001 037 + 009
Discussion
CEL lowered the binding of COM4 to plasma proteins in vitro and the higher free drug fraction was associated with enhanced partitioning into blood cells as compared to the excipient-free incubations Similar increases of unbound drug levels in plasma were observed after bolus injection of COM4 in CEL In contrast to the in vitro findings CEL induced no changes in the in vivo bloodplasma distribution of COM4 and no alterations in the tissue distribution were detected as well
Even though the plasma protein binding of COM4 is influenced by CEL in an analogous manner under in vitro and in vivo conditions a direct translation of the altered protein binding into blood and plasma concentrations is lacking in vivo Different to the in vitro investigations the in vivo situation involves not only distribution but also elimination processes which can initiate shifts in the systemic drug exposure Besides this the effective excipient concentration achieved in vivo in the circulation is usually unknown and can quite differ from concentrations applied in vitro Although excipient concentrations can be theoretically estimated using blood volume dose and application volume values are fairly arbitrary because excipient levels can decline fast in the body due to dilution (144) and degradation (126) within the blood compartment
48 The impact of Solutol HS 15 on COM5 in rat
In vitro results
The distribution of COM5 between whole blood and plasma was slightly concentration-dependent in rat regardless of incubations with or without excipients (Table 4-17) and the equilibrium conditions were rapidly reached for all solutions (lt5 min) except for CEL (equilibrium after 1-h incubation data not shown) The binding of COM5 to plasma proteins was moderate (lt90) with a high binding to albumin and α1-acid glycoprotein (Figure 4-2) and the bound fraction was reduced by the addition of CEL and Solutol Furthermore both excipients caused alterations in the blood-plasma and blood cell-plasma concentration ratios characterized by
43
enhanced drug partitioning into blood cells (Table 4-17 Figure 4-11) The higher cell uptake is consistent with decreased drug binding to plasma proteins in the presence of CEL and Solutol These effects were more prominent for COM5 with Solutol than with CEL Thus Solutol was selected for the in vivo study
Table 4-17 Effect of excipients on blood distribution and protein binding of COM5 in vitro
Partition parameters of [14C]COM5 obtained at equilibrium after incubation with and without excipients (05) in rat blood (pH 75 H 045 nge3 mean plusmn SD)
Excipient COM5 FP BPR BCPR fu ρ
(ngmL) () () None 10 857 plusmn 40 064 plusmn 003 021 plusmn 007 162 plusmn 11 14 plusmn 03 300 768 plusmn 16 072 plusmn 002 037 plusmn 003 119 plusmn 02 31 plusmn 02 Ethanol 10 812 plusmn 01 066 plusmn 005 023 plusmn 011 114 plusmn 04 22 plusmn 07 300 779 plusmn 09 072 plusmn 001 036 plusmn 002 116 plusmn 02 30 plusmn 02
10 660 plusmn 22 083 plusmn 003 063 plusmn 006 227 plusmn 18 28 plusmn 03 CELEtOH 6535 (vv) 300 577 plusmn 12 095 plusmn 002 090 plusmn 004 237 plusmn 04 38 plusmn 02 HP-β-CyD 10 803 plusmn 27 069 plusmn 002 030 plusmn 005 nd nd 300 754 plusmn 18 073 plusmn 002 040 plusmn 004 nd nd Solutol 10 550 plusmn 05 097 plusmn 006 100 plusmn 002 281 plusmn 10 33 plusmn 05 300 487 plusmn 09 113 plusmn 002 129 plusmn 004 277 plusmn 04 43 plusmn 04 PEG 200 10 769 plusmn 23 072 plusmn 002 037 plusmn 005 nd nd 300 736 plusmn 13 075 plusmn 001 044 plusmn 003 nd nd TPGS 10 832 plusmn 13 063 plusmn 005 018 plusmn 012 nd nd 300 785 plusmn 18 070 plusmn 002 033 plusmn 004 nd nd
(a)
00
02
04
06
08
10
12
10 ngmL 300 ngmL
BP
R
(b)
00
02
04
06
08
10
12
14
10 ngmL 300 ngmL
BC
PR
(c)
00
10
20
30
40
50
10 ngmL 300 ngmL
ρ
Figure 4-11 Excipient-mediated alterations of COM5 distribution in blood by CEL and Solutol
Blood-plasma (a) blood cell-plasma (b) and blood cell-unbound in plasma (c) concentration ratios of [14C]COM5 (10-300 ngmL) without excipients (black bars) and in the presence of Cremophor EL (white bars) and Solutol HS 15 (hatched bars) at 05 in rat blood (pH 75 H 045 nge3 mean plusmn SD)
In vivo results
In vitro studies demonstrated that the addition of ethanol to incubations had no impact on the blood partition of COM5 (Table 4-17) Therefore COM5 was dissolved in ethanol 10 for the administration in the control group thereby assuring sufficient solubility of the compound
Within the first 15 min post-dose higher blood concentrations accompanied by similar plasma concentrations were observed for COM5 in Solutol compared to concentrations for COM5 in ethanol 10 (control group) thereby increasing
44
concentration ratios of blood-plasma and blood cell-plasma in the Solutol group (Table 4-18) Subsequently similar ratios were obtained in both groups with a concomitant slower decline of circulation concentrations in animals treated with Solutol These changes in the Solutol group are in line with a reduced rate constant that resulted in a 2-fold higher half-life compared to that in the control group (Table 4-19) At 1 h post-dose concentrations of COM5 in the systemic circulation were 300 higher than those obtained after dosing the compound in the control formulation (Table 4-18 Figure 4-12) The doseAUC ratio was also decreased for COM5 in Solutol (Table 4-19) In agreement with the in vitro findings COM5 formulated in Solutol led to a permanent lower protein binding up to 1 h post-dose in addition to enhanced uptake into blood cells right after dosing (higher blood-plasma concentration ratio) (Table 4-18)
Table 4-18 Comparison of blood and plasma levels of COM5 with and without Solutol
Concentrations of compound-related radioactivity in the systemic circulation (a) and partition parameters (b) derived from these concentrations after iv administration of [14C]COM5 at 1 mgkg formulated in Solutol or in a Solutol-free solution (control group) to rats (n=3 mean plusmn SD LOQ=8 ng-eqmL assuming a hematocrit of 046(145) for calculations) significantly different from the control group at Plt005 and 001 respectively (a)
Time (h) Drug concentration (ng-eqmL)
Control group Solutol group Percentage of control value
Blood 008 1308 plusmn 178 1853 plusmn 155 142 025 895 plusmn 195 1243 plusmn 250 139 05 615 plusmn 193 976 plusmn 115 159 1 194 plusmn 24 585 plusmn 113 301 Plasma 008 2592 plusmn 558 2720 plusmn 266 105 025 1584 plusmn 168 1895 plusmn 337 120 05 1014 plusmn 385 1526 plusmn 112 150 1 311 plusmn 47 900 plusmn 165 289
(b)
Formulation Time (h) fu () FP () BPR BCPR ρ
Control 008 1062 plusmn 93 051 plusmn 004 -006 plusmn 01 -07 plusmn 11 (ethanol 10) 025 975 plusmn 148 056 plusmn 008 005 plusmn 017 19 plusmn 05 05 876 plusmn 125 062 plusmn 009 018 plusmn 019 42 plusmn 22 1
84 plusmn 14
862 plusmn 25 063 plusmn 002 019 plusmn 004 19 plusmn 04 Solutol 17 008 792 plusmn 18 068 plusmn 002 031 plusmn 003 22 plusmn 02 025 825 plusmn 18 065 plusmn 001 025 plusmn 003 19 plusmn 02 05 847 plusmn 51 064 plusmn 004 021 plusmn 008 14 plusmn 05 1
150 plusmn 23
832 plusmn 12 065 plusmn 001 024 plusmn 002 12 plusmn 01
Independent of the formulation brain levels ranged in concentrations corresponding
to the vascular contamination indicating no significant penetration of COM5 into brain (Table 4-20) A later increase in muscle and skin concentrations was detected for COM5 administered in Solutol (Table 4-20) The muscle concentration-time profile showed an analogous pattern to that in the systemic circulation with a longer persistence going along with higher concentrations at later post-dose times in the Solutol group (Table 4-21 Figure 4-12) However similar muscle-plasma concentration ratios between both groups pointed that Solutol did not affect the
45
muscle distribution pattern In contrast the higher skin concentrations of COM5 formulated in Solutol were associated with altered KP values (025 and 1 h post-dose) and same half-life compared to the control group (Tables 4-20 and 4-21)
Table 4-19 Comparative pharmacokinetics of COM5 with and without Solutol
Pharmacokinetic parameters of compound-related radioactivity after intravenous administration of [14C]COM5 in ethanol 10 (control group) or in Solutol 17 to rats (n=3)
Parameter Unit Control group Solutol group
Blood Plasma Blood Plasma Body weight kg 0214 0212 Dose microg 214 212 C0 ngmL 1562 2998 1840 2749 V0 Lkg 064 033 054 036 AUC008-1h ngmL-1
h 578 1011 931 1426 t12 h 033 032 069 069 DoseAUC008-1h mLh 369 211 228 149
Table 4-20 Comparison of tissue distribution of COM5 with and without Solutol
Tissue concentrations and tissue-plasma concentration ratios of radioactivity of [14C]COM5 after bolus injection at 1 mgkg to rats in ethanol 10 (control) or Solutol 17 (n=3 mean plusmn SD)
Time Tissue Concentration (ngg) Tissue-plasma ratio
Control Solutol Percentage of control value Control Solutol
008 h Muscle 400 + 53 476 + 69 119 016 plusmn 002 018 plusmn 004 Skin 248 + 26 240 + 48 97 010 plusmn 003 009 plusmn 003 Brain 27 + 3 40 + 2 150 001 plusmn 0 001 plusmn 0 025 h Muscle 311 + 43 424 + 21 137 020 plusmn 003 023 plusmn 004 Skin 243 + 15 413 + 62 170 015 plusmn 001 022 plusmn 002 Brain 16 + 2 26 + 4 161 001 plusmn 0 001 plusmn 0 05 h Muscle 228 + 25 333 + 15 146 025 plusmn 009 022 plusmn 001 Skin 235 + 33 384 + 11 163 025 plusmn 008 025 plusmn 001 Brain 10 + 2 18 + 3 188 001 plusmn 0 001 plusmn 0 1 h Muscle 57 + 2 174 + 30 307 019 plusmn 003 019 plusmn 0 Skin 152 + 11 246 + 46 162 050 plusmn 011 028 plusmn 004 Brain mdasha 11 + 1 nd 001 plusmn 0 001 plusmn 0 a below LOQ significantly different from the control at Plt005
Table 4-21 Comparison of muscle and skin kinetics of COM5 with and without Solutol
Pharmacokinetic parameters of compound-related radioactivity in tissues after intravenous administration of [14C]COM5 at 1 mgkg formulated in ethanol 10 (control group) or Solutol 17 to rats (n=3)
Parameter Unit Muscle Skin
Control group Solutol group Control group Solutol group AUC008-1h ngmL-1
h 199 298 198 313 C0 ngg 533 548 nd nd t12 h 030 058 104 097
46
Plasma Muscle Skin
100
1000
10000
0 025 05 075 1
Time (h)
Co
ncen
trati
on
(n
g-e
qm
L)
10
100
1000
0 025 05 075 1
Time (h)
Co
ncen
trati
on
(n
g-e
qm
L)
100
1000
0 025 05 075 1
Time (h)
Co
ncen
trati
on
(n
g-e
qm
L)
Figure 4-12 Influence of Solutol on plasma muscle and skin profiles of COM5
Concentration-time courses of compound-related radioactivity in plasma muscle and skin after intravenous administration of [14C]COM5 at 1 mgkg formulated in ethanol 10 (closed symbols black line) and as a solution containing Solutol 17 (open symbols dotted line) Symbols represent single values and lines mean values (n=3)
Discussion
In vitro and in vivo experiments showed that Solutol significantly modulated the disposition profile of COM5 in rats by drug-excipient interactions in blood COM5 formulated in Solutol decreased both the drug distribution into plasma (transient in vivo) and the binding to plasma proteins (prolonged in vivo) Furthermore animals treated with Solutol showed a later concentration increase in the circulation and tissues (muscle skin) (ge025 h post-dose)
Altered drug levels were related to prolonged half-lives in the circulation and muscle The longer blood persistence is consistent with the reduced clearance (doseAUC) which presumes a lower elimination of COM5 in the presence of Solutol In contrast to the muscle concentration-time profile similar to that in the circulation the skin profile exhibited no changes in the half-life potentially due to a lower vascularization in skin compared to that in muscle However the skin-plasma concentration ratio was affected by the Solutol formulation whereas no changes in KP values were observed for muscle This altered pharmacokinetic profile might relate to a lower clearance of COM5 in the presence of Solutol
Previous investigations in mice revealed an interaction between Solutol and a co-administered ketochlorine photosensitizer (C8KC) in plasma (127) Protein binding experiments indicated the formation of either a binary drug-excipient complex or a ternary complex involving drug excipient and plasma components This effect was correlated to similar half-lives of Solutol and C8KC in plasma suggesting the persistence of C8KC in the circulation associated with that of the excipient Likewise half-lives in the same range were also observed for C8KC and the excipient Cremophor EL going along with prolonged C8KC persistence in plasma and tissues in mice (85)
47
5 General discussion and conclusions
In vitro and in vivo experiments were carried out to investigate the potential of five excipients commonly used in formulations to modify the pharmacokinetics of co-administered model compounds at concentrations ranging from sub-therapeutic to pharmacological levels Conducted studies focused mainly on the impact of excipients in the blood compartment since such data have rarely been published up to now especially for intravenously low dosed compounds including highly active drug substances biomarkers PET ligands and microdoses
PEG 200 CEL HP-β-CyD and Solutol were chosen as excipients because of their use in intravenous formulations and their high solubilizing ability related to different molecular structures and solubilization principles by either a direct solvent effect or by formation of micelles or complexes TPGS known in oral formulations completed the set of selected excipients and is an interesting functional excipient in terms of its chemical properties (benzyl ring) and ability to alter metabolism andor transporter activities thereby potentially influencing cellular distribution
Five drug candidates in development at Novartis were selected as model compounds exhibiting different physicochemical and pharmacokinetic properties (Table 5-1) The two PET ligands COM1 (base) and COM2 are lipophilic and poorly water-soluble COM3 is characterized by its predominant location in the cellular fraction in blood whereas COM4 hardly penetrates into blood cells COM2 distributes equally between plasma and whole blood COM5 is a molecule with a high polar surface area and a low volume of distribution similar to that of COM4 Moreover COM2 COM1 and COM4 are very highly protein bound (gt95) and COM3 and COM5 are moderately protein bound (lt90) In addition binding studies using isolated plasma proteins showed that model compounds bind with different affinity to the three major drug-binding proteins in plasma (albumin α1-acid glycoprotein and lipoproteins)
Model compounds were used in low doses to achieve blood concentrations of lt5 ngmL for COM1 and COM2 and low-therapeutic levels for COM3 (5-50 ngmL) Due to the very low volume of distribution COM4 and COM5 were investigated at normal pharmacological concentrations (gt50 ngmL in blood) to guarantee detectable tissue levels
In order to analyze the in vitro-in vivo correlation the excipient was set at an excipient-blood ratio of 1200 This concentration was found to be non-hemolytic in vitro for selected excipients except TPGS which induced hemolysis after a longer contact time To rule out any changes caused by cell lysis TPGS investigations were carried out in the non-hemolytic range The excipient concentration of 05 also correlates to the normal dosing range estimated for an intravenous bolus injection in mice and rats assuming a blood volume of ~70 mLkg and an injection volume of lt3 mLkg However in humans according to the literature (54) excipient concentrations above 01 in blood are regarded as high and generally only obtained following intravenous infusions Considering marketed injectable formulations for example the amount of excipient in blood is up to 015 HP-β-CyD (Sporanox) and 03-05 CEL (Vumon and Taxol respectively)
48
Table 5-1 Overview of model compounds
Physicochemical (PC) and pharmacokinetic (PK) properties of model compounds selected for investigating drug-excipient interactions in blood
Compound COM1 COM2 COM3 COM4 COM5 PET ligand PET ligand NCE NCE NCE
Chemical structure
N
N
O
R1
R2
O
N
O
N
N
S
R1
R2
N
O
N
R
NN
R2
R1
N
NO
S O
NH
O
O
NH
OR1
R2
R3
PC properties MW (gmol) 240 410 295 lt400 533 LogD 68 34 45 23 17 37 pKa 38 57 41 87 32 46 106 H20 solubility pH 68 (mgL) 20 lt25 4000 lt500 100 PSA (Aring2) 35 50 25 63 166 H-bond acceptors 3 5 3 4 12 H-bond donors 0 0 0 1 3 Critical value(s) Solubility (base) Solubility MW PSA H-bond acc PK parameters Species Rat Mouse Rat Rat Rat In vitro Fraction in plasma () 75 45 20 ~100 80 Free in plasma () 21 18 12 24 11 Major binding protein Albumin gt AGP Albumin gt LP AGP gt Albumin Albumin gt AGP Albumin asymp AGP In vivo Matrix Plasma Blood Blood Plasma Plasma t12 (h) 008 11 11 10 04 CL (mLminkg) 202 10 142 04 72 Vss (Lkg) 11 14 10 03 03 funchanged () 14 49 14 98 94 AGP α1-acid glycoprotein CL Drug clearance funchanged Fraction of unchanged drug based on AUC ratio of parent drug and total radioactivity LogD Logarithm of octanol-water distribution coefficient LP Lipoproteins MW Molecular weight NCE New chemical entity pKa Negative logarithm of dissociation constant PSA Polar surface area t12 Main elimination half-life Vss Volume of distribution under steady-state conditions
49
In trying to evaluate the potential of excipients to affect partition parameters in blood selected excipients were screened in vitro for interactions with the model compounds using a blood distribution method and protein binding assays (ultrafiltrationultracentrifugation) The most interacting excipients were subsequently taken forward for in vivo studies in animals given a single iv dose to ascertain whether there was a change in pharmacokinetics and whether an in vitro-in vivo correlation existed
Amongst the excipients tested the excipient PEG 200 was not active as an interacting agent whereas the others were more or less active (Table 5-2) However there was no apparent relationship between the nature of interactions and the compound properties
TPGS was found in vitro to enhance the plasma fraction of COM1 and COM2 in blood and higher plasma concentrations were associated with a decrease of compound unbound in plasma A significant increase in plasma concentrations of parent drug (2-fold) and metabolites (4-fold) were observed following intravenous administration of COM2 in mice and t12 of COM2 remained unchanged whereas t12 of metabolites was 4-fold higher While TPGS led to similar trends of COM1-related metabolites after injection in rats values determined for parent drug were inconsistent with those obtained in vitro A very extensive metabolism coupled to fast elimination was detected for COM1 which led to a stop in additional investigations to understand the in vitro-in vivo discrepancy
The use of CEL and Solutol in rats reduced in vitro the binding of COM4 and COM5 to plasma proteins and the higher free drug fraction was accompanied by enhanced partitioning into blood cells Both excipients led to 2-fold higher unbound plasma concentrations following iv administration of COM4 formulated in CEL and COM5 in a Solutol-containing solution Systemic and tissue levels of COM4 remained unaffected In contrast dosing COM5 in Solutol resulted in an earlier increase of blood-plasma concentration ratios indicating enhanced uptake into blood cells Later on COM5 concentrations in blood and plasma were significantly enhanced to a similar extent (2-fold) yielding ratios equalized to control values The systemic accumulation was correlated to higher t12 (2-fold) The AUC of COM5 in muscle and skin increased going along with a raise of t12 in muscle and none in skin
In vitro HP-β-CyD increased the amount of COM3 distributed into rat plasma and lowered the binding to plasma proteins Concentration ratios were only about 12 for blood-plasma and 18 for blood cell-unbound in plasma as compared to reference values At earlier time points after iv dosing concentrations of COM3 in blood and plasma were lower in the presence of HP-β-CyD (~23 of control) whereas over 30-fold higher levels of COM3 in urine were found Subsequently tissue concentrations and tissue-blood concentration ratios of COM3 with HP-β-CyD were significantly decreased
50
Table 5-2 Qualitative impact of excipients on pharmacokinetic parameters
Excipient-compound interactions obtained after in vitro incubations and after intravenous administration in animals using excipients at ~05 in blood and compounds at a dose of either ~1 nmolkg (COM1 COM2) or ~1 micromolkg (COM3 COM4 COM5) Arrows indicate excipient-induced changes compared to the excipient-free group (harr no changes uarr increase darr decrease) Compound Excipient Species Changes Comments
In vitro In vivo COM1 Vit E TPGS Rat uarr Accumulation in plasma darr Plasma protein binding bull No changes in vitro at le05 TPGS darr Partitioning into blood cells darr AUC008-05h bull Similar AUCs of drug free in plasma uarr Plasma protein binding darr C0 bull Increase in AUC of metabolites
harr t12 bull Inappropriate model compound due harr Tissue distribution to rapid metabolismelimination COM2 Vit E TPGS Mice uarr Accumulation in plasma uarr AUC008-1h bull uarr AUC and uarr t12 of metabolites darr Partitioning into blood cells uarr C0 bull Ex vivo protein binding not available
uarr Plasma protein binding harr t12 due to values ltLOQ harr Tissue distribution
COM3 HP-β-cyclodextrin Rat uarr Accumulation in plasma darr Plasma protein binding
darr Partitioning into blood cells darr AUC008-1h
darr Plasma protein binding darr C0
harr t12
darr Skin concentrations
uarr Urinary excretion
COM4 Cremophor EL Rat darr Accumulation in plasma darr Plasma protein binding uarr Partitioning into blood cells harr AUC008-1h
darr Plasma protein binding harr C0
harr t12
harr Tissue distribution
COM5 Solutol HS 15 Rat darr Accumulation in plasma darr Plasma protein binding
uarr Partitioning into blood cells uarr AUC008-1h
darr Plasma protein binding harr C0
uarr t12
uarr Muscleskin concentrations
AUC Area under the plasma drug concentration-time curve C0 Initial plasma concentration at time zero LOQ Limit of quantification t12 Half-life in plasma using the last three data points
51
These results clearly show the role of excipients as a modulator of the protein binding and cellular partitioning of compounds in blood which can impact the overall drug disposition Excipient-induced changes in the free fraction and cell uptake of drugs within the blood compartment are explained by various mechanisms (Figure 5-1) An excipient is able to influence the fraction of a co-administered drug in plasma and blood cells by direct drug interactions andor interferences with blood components such as proteins and cell constituents particularly membranes Consequently bound and free concentrations in plasma and cellular concentrations may be shifted potentially contributing to a ldquonewrdquo steady state Altered plasma concentrations can be the result of changes in drug protein binding drug adsorption to excipients andor drug trapping into excipient micelles or complexes Whichever effect dominates more drug can be free or bound thereby accounting for the amount of drug available for cellular partitioning Excipients could also vary the uptake into blood cells due to alterations in membrane structure andor drug presentation both mechanisms either facilitating or hindering drug transport via membranes In the end most likely different interacting processes contribute to the final effect depending on the force and nature of each single interaction
Free drug Free drug
Bound drug
Protein-bound drug
Excipient-drug interactions
(solubilization adsorption incorporation)
(destruction adsorption integration penetration)
PLASMA BLOOD CELLS
Excipient-membrane interactionsExcipient-protein interactions
(destruction adsorption binding)
Figure 5-1 Mechanisms underlying alterations in drug partition parameters in blood
The presence of excipients in blood may influence drug levels in plasma (protein-bound and free fraction) and blood cells by interacting with the drug or blood components thereby either blocking or promoting the protein binding andor the drug available for cellular partitioning
Analyzing the in vitro with the in vivo situation the effect of selected excipients on
the protein binding showed a good in vitro-in vivo correlation whereas systemic concentrations after iv administration in animals could often not be predicted well from in vitro data In contrast to in vitro assays reflecting stationary conditions the in vivo situation entails processes running in an open and dynamic system thereby involving not only distribution but also elimination This can initiate shifts in the systemic drug exposure and be responsible for the absence of a direct correlation to bloodplasma concentrations and thus to pharmacokinetic parameters as well Apart from this the effective excipient concentration achieved in vivo in the circulation is usually unknown and may differ from concentrations applied in vitro Although excipient concentrations can be theoretically estimated using blood volume dose and application volume values are fairly arbitrary because excipient levels decline most likely fast in the body due to dilution and degradation within the blood
52
compartment This suggests that if alterations in blood partitioning occur following administration in vivo they should be best detectable at times shortly post-dose
Even though differences between the in vitro and in vivo results were found the in vitro test can serve as a straightforward tool for rapid detection of excipient-drug interactions in blood while requiring little amounts of drug As a result the determination of in vitro blood partition parameters is proposed as a rough estimator of a possible potential of excipients to contribute to pharmacokinetics of parenteral drugs In addition to the blood-to-plasma distribution ratio the protein binding provides useful information to elucidate excipient-induced alterations and allows the calculation of the blood cell-to-free in plasma distribution ratio These data help not only to optimize the proper evaluation of pharmacokinetics in animals but also to enable a more rational approach in the development of formulations for drug candidates Therefore the in vitro investigation of blood distribution and protein binding with and without excipient is recommended at a very early preclinical stage in cases where animal pharmacokinetics of lower dosed compounds (eg PET ligands) must be examined from excipient-containing solutions (eg surfactants complexing agents) The influence assessment of excipients may also be a promising formulation approach for iv solutions of non-ionizable lipophilic and nonpolar molecules which are very challenging to formulate appropriately due to poor water solubility (eg paclitaxel docetaxel cyclosporin)
Figure 5-2 illustrates a possible formulation procedure that integrates data generated by in vitro investigations in blood Cosolvents complexing agents surfactants and combinations of these excipients are frequently used to dissolve a compound for intravenous administration in animals Method(s) are chosen considering available compound characteristics such as physicochemical and pharmacokinetic properties doses and clinical objectives If an appropriate formulation in terms of solubility and stability is found blood distribution and protein binding studies are performed both in the presence and absence (reference) of excipient(s) using in vitro assays Protein binding studies should mainly be considered if the extent of binding can be appropriately determined by ultrafiltration dialysis or ultracentrifugation all three conventional and simple methods Next partition parameters (FP fu BPR BCPR and ρ) are evaluated and compared to those obtained for the reference formulation representing an excipient-free solution (eg glucose 5 or saline including pH adjustment buffer blank plasma) Formulations are ranked in order of changes relative to the reference As a result a formulation can be modified adapted or selected for intravenous administration in animals In cases where the in vivo administration requires the addition of excipient(s) to the reference formulation to solubilize the compound the formulation must be tested in vitro The formulation is an acceptable in vivo reference if the in vitro parameters are similar to those of the excipient-free solution ie the in vitro reference The outcome of the in vivo study triggers formulation optimization to minimize or abolish excipient effects further investigation to better interpret data or formulation acceptance for in vivo dosing and formulation development Finally it should be possible to exclude or at least be aware of a potential impact of excipient(s) on the drug disposition Data can also be applied to identify both the activity of a certain excipient with different compounds and the excipient sensitivity of compounds with similar properties
53
Compound characteristics
Formulation principle Excipients
Formulation properties
In vitro assays using blood plasma
Data analysis
Adapt formulation In vivo application
Assess in vitro-in vivo correlation
Candidate-tailored formulation
Figure 5-2 Suggested flow chart for an iv formulation development strategy
In conclusion substantial drug-excipient interactions in animals have been
identified for different excipients commonly used in drug formulation and pharmacologically active compounds with diverse properties These findings support the assumption that certain excipients are not ldquoinertrdquo but are ldquofunctionalrdquo excipients and are able to alter the disposition of co-administered drugs Such data need special attention since excipient-related changes may occur with similar or other drugexcipient formulations Identifying excipient-drug interactions and understanding how excipients affect the drug behavior will assist in the pharmacokinetic characterization and the formulation developmentoptimization of drug candidates in development Furthermore a better knowledge of the relationship between drug excipient and blood constituents suggests new approaches in drug development in terms of controlling the pharmacokinetic profile by the right choice of excipient and its amount This may enable to better anticipate the target of different blood and body compartments without extensive animal and human tests potentially resulting in modulated pharmacological responses
54
6 Outlook
The results of this work demonstrated the ability of commonly used injectable excipients especially CEL HP-β-CyD and SHS to influence pharmacokinetic parameters in blood consequently contributing to altered drug disposition following iv dosing However to increase the knowledge of drug-excipient interactions additional studies are required to confirm the above findings with further drugexcipient formulations and with an emphasis on the role of excipients per se in pharmacokinetics of parenteral drugs
The excipients were tested in vitro and in vivo at a fixed concentration of 05 in
blood being within the normal range for animal injections and higher for clinical ones Investigations by varying the excipient amount would give insight into the concentration-effect relationship and potency of excipients Examination of lower excipient levels should also give an indication about the relevance and impact of excipient-induced alterations on applications in humans
No direct correlation between the interacting excipient and the compound
properties were found and no trends could be apparently observed in changes regarding the excipient characteristics Continued investigations are necessary to elucidate whether observed phenomena are associated with certain drugs or more by some drug classes characterized by specific physicochemical properties Focusing on excipients it would be of interest to explore more in detail the frequency and significance of interactions and the excipient preference in terms of particular changes
The emphasis throughout the current work was placed on providing an insight into
excipient-triggered effects and their in vitro-in vivo correlation According to the literature little is known about mechanisms underlying these alterations taking into account in vitro-in vivo investigations (94110112) To explain findings and improve excipient characterization further investigations should focus on the mechanistic basis for the role of excipients in protein binding bloodplasma partitioning and cellular distribution using in vitro assays appropriate to understand the observed effects In addition modification of in vitro approaches could facilitate correlation of effects and mechanisms determined in vitro with in vivo situations increase the understanding of in vitro-in vivo relationships and enable extrapolation of in vitro results to in vivo pharmacokinetics A better in vitro-in vivo correlation could also reduce in vivo studies and may contribute to more efficient drug development
There are drug-drug interactions reported in the literature where drugs were
administered intravenously in conjunction with excipient-containing formulation of other drugs (eg valspodar formulated in CEL) (108109) Most likely the presence of excipient(s) in drug formulations contributed to observed pharmacokinetic interactions
55
The research into the potential of excipients to induce kinetic alterations of agents administered intravenously in conjunction with excipient-containing formulation of other compounds should lead to a deeper insight into drug-drug interactions These data may provide helpful information relevant for safety issues dosage planning and treatment optimization in clinical drug monitoring
Further studies could focus on the potential clinical significance of drug-excipient
interactions observed in animals Finally ongoing efforts for a proper understanding of excipients as biologically and
pharmacologically active compounds will allow a better control of designing formulations with optimal characteristics for a better drug therapy
56
7 References
References to external publications and books
(1) Values received from Charles River Laboratoires (2) In E Green (ed) The biology of the laboratory mouse McGraw-Hill Inc New York 1966 (3) In H Baker J Lindsey and S Weisbroth (eds) The laboratory rat Academic Press Inc
New York 1979 (4) H E Weimer D M Roberts P Villanuevo and H G Porter Genetic differences in
electrophoretic patterns during the phlogistic response in the albino rat Comp Biochem Physiol B 43965-973 (1972)
(5) Geigy Scientific Tables 8th ed Vol2 Ciba-Geigy Basel 1983 (6) M Lemaire Drug binding to leucocytes and platelets Symposia Medica Hoechst 79-93
(1986) (7) P H Hinderling Red blood cells a neglected compartment in pharmacokinetics and
pharmacodynamics Pharmacol Rev 49279-295 (1997) (8) J Tillement G Houin R Zini S Urien E Albengres J Barre M Lecomte P DAthis and
B Sebille The binding of drugs to blood plasma macromolecules recent advances and therapeutic significance Adv Drug Res 1359-94 (1984)
(9) Z H Israili and P G Dayton Human alpha-1-glycoprotein and its interactions with drugs Drug Metab Rev 33161-235 (2001)
(10) K M Wasan and S M Cassidy Role of plasma lipoproteins in modifying the biological activity of hydrophobic drugs J Pharm Sci 87411-424 (1998)
(11) P du Souich J Verges and S Erill Plasma protein binding and pharmacological response Clin Pharmacokinet 24435-440 (1993)
(12) F Akhlaghi and A K Trull Distribution of cyclosporin in organ transplant recipients Clin Pharmacokinet 41615-637 (2002)
(13) G M Pacifici and A Viani Methods of determining plasma and tissue binding of drugs Pharmacokinetic consequences Clin Pharmacokinet 23449-468 (1992)
(14) J Oravcova B Bohs and W Lindner Drug-protein binding sites New trends in analytical and experimental methodology J Chromatogr B Biomed Appl 6771-28 (1996)
(15) Z Liu F Li and Y Huang Determination of unbound drug concentration and protein-drug binding fraction in plasma Biomed Chromatogr 13262-266 (1999)
(16) A Lipinski Experimental and computational approaches to estimate solubility and permeability in drug discovery and development settings Adv Drug Deliv Rev 233-26 (1997)
(17) R Panchagnula N S Thomas Biopharmaceutics and pharmacokinetics in drug research Int J Pharm 201131-150 (2000)
(18) M S Lajiness M Vieth and J Erickson Molecular properties that influence oral drug-like behavior 16 Curr Opin Drug Discov Devel 7470-477 (2004)
(19) H van de Waterbeemd G Camenisch G Folkers J R Chretien and O A Raevsky Estimation of blood-brain barrier crossing of drugs using molecular size and shape and H-bonding descriptors J Drug Target 6151-165 (1998)
(20) B Testa P Crivori M Reist P Carrupt The influence of lipophilicity on the pharmacokinetic behavior of drugs concepts and examples Persp Drug Discov Design 19179-211 (2000)
(21) In V Pliska B Testa H van Waterbeemd (eds) Methods and Principles in Medicinal Chemistry Vol4 VCH Weinheim Germany 1996
(22) G L Amidon H Lennernas V P Shah and J R Crison A theoretical basis for a biopharmaceutic drug classification the correlation of in vitro drug product dissolution and in vivo bioavailability Pharm Res 12413-420 (1995)
(23) C A Lipinski Poor aqueous solubility - an industry-wide problem in ADME screening Capsugel Symposium Tokyo Japan 33-48 (2003)
(24) C A Lipinski Drug-like properties and the causes of poor solubility and poor permeability J Pharmacol Toxicol Methods 44235-249 (2000)
57
(25) K R Horspool and C A Lipinski Advancing new drug delivery concepts to gain the lead Drug Deliv Technol 334-46 (2003)
(26) M Kaushal Amorphous drug delivery systems molecular aspects design and performance Crit Rev Ther Drug Carrier Sys 21133-193 (2004)
(27) H Fischer Blood-brain barrier permeation molecular parameters governing passive diffusion J Membrane Biol 165201-211 (1998)
(28) A Seelig A general pattern for substrate recognition by P-glycoprotein Eur J Biochem 251252-261 (1998)
(29) A Seelig X L Blatter and F Wohnsland Substrate recognition by P-glycoprotein and the multidrug resistance-associated protein MRP1 a comparison Int J Clin Pharmacol Ther 38111-121 (2000)
(30) D E Clark Rapid calculation of polar molecular surface area and its application to the prediction of transport phenomena 2 Prediction of blood-brain barrier penetration J Pharm Sci 88815-821 (1999)
(31) J Kelder Polar molecular surface as a dominating determinant for oral absorption and brain penetration of drugs Pharm Res 161514-1519 (1999)
(32) K Palm K Luthman A L Ungell G Strandlund and P Artursson Correlation of drug absorption with molecular surface properties J Pharm Sci 8532-39 (1996)
(33) K Palm P Stenberg K Luthman and P Artursson Polar molecular surface properties predict the intestinal absorption of drugs in humans Pharm Res 14568-571 (1997)
(34) D E Clark Rapid calculation of polar molecular surface area and its application to the prediction of transport phenomena 1 Prediction of intestinal absorption J Pharm Sci 88807-814 (1999)
(35) H van der Waterbeemd G Camenisch G Folkers and O A Raevsky Estimation of Caco-2 cell permeability using calculated molecular descriptors Quant Struct Act Relat 15480-490 (1996)
(36) S Winiwarter N M Bonham F Ax A Hallberg H Lennernas and A Karlen Correlation of human jejunal permeability (in vivo) of drugs with experimentally and theoretically derived parameters A multivariate data analysis approach J Med Chem 414939-4949 (1998)
(37) A Bergstroem Absorption classification of oral drugs based on molecular surface properties J Med Chem 46558-570 (2003)
(38) D F Veber S R Johnson H Y Cheng B R Smith K W Ward and K D Kopple Molecular properties that influence the oral bioavailability of drug candidates J Med Chem 452615-2623 (2002)
(39) J F Pritchard M Jurima-Romet M L Reimer E Mortimer B Rolfe and M N Cayen Making better drugs Decision gates in non-clinical drug development Nat Rev Drug Discov 2542-553 (2003)
(40) P Preziosi Opinion science pharmacoeconomics and ethics in drug RampD a sustainable future scenario Nature Rev Drug Discov 3521-526 (2004)
(41) I Kola Opinion Can the pharmaceutical industry reduce attrition rates Nature Rev Drug Discov 3711-716 (2004)
(42) L J Lesko M Rowland C C Peck T F Blaschke D Breimer H J de Jong A Grahnen J J Kuhlmann and B Stewart Optimizing the science of drug development opportunities for better candidate selection and accelerated evaluation in humans Eur J Pharm Sci 10iv-xiv (2000)
(43) G Lappin and R C Garner Big physics small doses the use of AMS and PET in human microdosing of development drugs Nat Rev Drug Discov 2233-240 (2003)
(44) R D Combes T Berridge J Connelly M D Eve R C Garner S Toon and P Wilcox Early microdose drug studies in human volunteers can minimise animal testing proceedings of a workshop organised by volunteers in research and testing Eur J Pharm Sci 191-11 (2003)
(45) Biomarkers definitions working group Biomarkers and surrogate endpoints preferred definitions and conceptual framework Clin Pharmacol Ther 6989-95 (2001)
(46) J Lesko Use of biomarkers and surrogate endpoints in drug development and regulatory decision making criteria validation strategies Annu Rev Pharmacol Toxicol 41347-366 (2001)
58
(47) R Frank and R Hargreaves Clinical biomarkers in drug discovery and development Nat Rev Drug Discov 2566-580 (2003)
(48) M Bergstrom A Grahnen and B Langstrom Positron emission tomography microdosing a new concept with application in tracer and early clinical drug development Eur J Clin Pharmacol 59357-366 (2003)
(49) M Jagoda Experiment assessment of mass effects in the rat implications for small animal PET imaging Nucl Med Biol 31771-779 (2004)
(50) Y C Lee P D Zocharski and B Samas An intravenous formulation decision tree for discovery compound formulation development Int J Pharm 253111-119 (2003)
(51) B Bittner and R J Mountfield Intravenous administration of poorly soluble new drug entities in early drug discovery the potential impact of formulation on pharmacokinetic parameters Curr Opin Drug Discov Devel 559-71 (2002)
(52) A K Singla A Garg and D Aggarwal Paclitaxel and its formulations Int J Pharm 235179-192 (2002)
(53) N Maurer D B Fenske and P R Cullis Developments in liposomal drug delivery systems Expert Opin Biol Ther 1923-947 (2001)
(54) R G Strickley Solubilizing excipients in oral and injectable formulations Pharm Res 21201-230 (2004)
(55) A G Floyd Top ten considerations in the development of parenteral emulsions 4134-143 (1999)
(56) M J Lawrence and G D Rees Microemulsion-based media as novel drug delivery systems Adv Drug Deliv Rev 4589-121 (2000)
(57) E Merisko-Liversidge G G Liversidge and E R Cooper Nanosizing a formulation approach for poorly-water-soluble compounds Eur J Pharm Sci 18113-120 (2003)
(58) E B Rabinow Nanosuspensions in drug delivery Nature Rev Drug Discov 3785-796 (2004)
(59) H Karl A good practice guide to the administration of substances and removal of blood including routes and volumes J Appl Toxicol 2115-23 (2001)
(60) D M Woodcock S Jefferson M E Linsenmeyer P J Crowther G M Chojnowski B Williams and I Bertoncello Reversal of the multidrug resistance phenotype with Cremophor EL a common vehicle for water-insoluble vitamins and drugs Cancer Res 504199-4203 (1990)
(61) D M Woodcock M E Linsenmeyer G Chojnowski A B Kriegler V Nink L K Webster and W H Sawyer Reversal of multidrug resistance by surfactants Br J Cancer 6662-68 (1992)
(62) J M Dintaman and J A Silverman Inhibition of P-glycoprotein by D-alpha-tocopheryl polyethylene glycol 1000 succinate (TPGS) Pharm Res 161550-1556 (1999)
(63) K R W A S C Wandel C Inactive ingredients may alter bioavailability of drugs through effects on P-glycoprotein (PGP) and CYP3A Clin Pharmacol Ther 69P71 (2001)
(64) A N Abulrob M Mason R Bryce and M Gumbleton The effect of fatty acids and analogues upon intracellular levels of doxorubicin in cells displaying P-glycoprotein mediated multidrug resistance J Drug Target 8247-256 (2000)
(65) G Cornaire J F Woodley S Saivin J Y Legendre S Decourt A Cloarec and G Houin Effect of polyoxyl 35 castor oil and polysorbate 80 on the intestinal absorption of digoxin in vitro Arzneimittelforschung 50576-579 (2000)
(66) E D Hugger B L Novak P S Burton K L Audus and R T Borchardt A comparison of commonly used polyethoxylated pharmaceutical excipients on their ability to inhibit P-glycoprotein activity in vitro J Pharm Sci 911991-2002 (2002)
(67) J Zastre J Jackson M Bajwa R Liggins F Iqbal and H Burt Enhanced cellular accumulation of a P-glycoprotein substrate rhodamine-123 by Caco-2 cells using low molecular weight methoxypolyethylene glycol-block-polycaprolactone diblock copolymers Eur J Pharm Biopharm 54299-309 (2002)
(68) A V Kabanov E V Batrakova and D W Miller Pluronic block copolymers as modulators of drug efflux transporter activity in the blood-brain barrier Adv Drug Deliv Rev 55151-164 (2003)
59
(69) D W Miller E V Batrakova and A V Kabanov Inhibition of multidrug resistance-associated protein (MRP) functional activity with pluronic block copolymers Pharm Res 16396-401 (1999)
(70) K Yunomae H Arima F Hirayama and K Uekama Involvement of cholesterol in the inhibitory effect of dimethyl-beta-cyclodextrin on P-glycoprotein and MRP2 function in Caco-2 cells FEBS Lett 536225-231 (2003)
(71) M M Nerurkar P S Burton and R T Borchardt The use of surfactants to enhance the permeability of peptides through Caco-2 cells by inhibition of an apically polarized efflux system Pharm Res 13528-534 (1996)
(72) R J Mountfield S Senepin M Schleimer I Walter and B Bittner Potential inhibitory effects of formulation ingredients on intestinal cytochrome P450 Int J Pharm 21189-92 (2000)
(73) B M Johnson W N Charman and C J Porter An in vitro examination of the impact of polyethylene glycol 400 Pluronic P85 and vitamin E d-alpha-tocopheryl polyethylene glycol 1000 succinate on P-glycoprotein efflux and enterocyte-based metabolism in excised rat intestine AAPS PharmSci 4E40 (2002)
(74) R C Bravo Gonzalez J Huwyler F Boess I Walter and B Bittner In vitro investigation on the impact of the surface-active excipients Cremophor EL Tween 80 and Solutol HS 15 on the metabolism of midazolam Biopharm Drug Dispos 2537-49 (2004)
(75) A G Bagnarello L A Lewis M C McHenry A J Weinstein H K Naito A J McCullough R J Lederman and T L Gavan Unusual serum lipoprotein abnormality induced by the vehicle of miconazole N Engl J Med 296497-499 (1977)
(76) H K Naito and L A Lewis Induced hyperlipidemia and delipidation of serum alpha-lipoproteins by polyethoxylated castor oil Protides Biol Fluids 25COM2-398 (1978)
(77) H K Naito M C McHenry and L A Lewis Drug-induced dyslipoproteinemia a report of two cases Clin Chem 26163-168 (1980)
(78) M Hacker M Koeferl C B Hong and M A Fagan Cremophor and Emulphor induced alterations of serum lipids and lipoprotein electrophoretic patterns of dogs Res Commun Chem Pathol Pharmacol 31119-128 (1981)
(79) M Kongshaug L S Cheng J Moan and C Rimington Interaction of Cremophor EL with human plasma Int J Biochem 23473-478 (1991)
(80) K Woodburn and D Kessel The alteration of plasma lipoproteins by Cremophor EL J Photochem Photobiol B 22197-201 (1994)
(81) D Kessel K Woodburn D Decker and E Sykes Fractionation of Cremophor EL delineates components responsible for plasma lipoprotein alterations and multidrug resistance reversal Oncol Res 7207-212 (1995)
(82) E Sykes K Woodburn D Decker and D Kessel Effects of Cremophor EL on distribution of Taxol to serum lipoproteins Br J Cancer 70401-404 (1994)
(83) G M Garbo The use of liposomes emulsions or inclusion complexes may potentiate in vivo effects of SnET2 Proc SPIE 1203118-125 (1990)
(84) D Kessel A Morgan and G M Garbo Sites and efficacy of photodamage by tin etiopurpurin in vitro using different delivery systems Photochem Photobiol 54193-196 (1991)
(85) K Woodburn C K Chang S Lee B Henderson and D Kessel Biodistribution and PDT efficacy of a ketochlorin photosensitizer as a function of the delivery vehicle Photochem Photobiol 60154-159 (1994)
(86) L K Webster E J Cosson K H Stokes and M J Millward Effect of the paclitaxel vehicle Cremophor EL on the pharmacokinetics of doxorubicin and doxorubicinol in mice Br J Cancer 73522-524 (1996)
(87) T Colombo P O Gonzalez M Zucchetti A Maneo C Sessa A Goldhirsch M DIncalci and M Maneo Paclitaxel induces significant changes in epidoxorubicin distribution in mice Ann Oncol 7801-805 (1996)
(88) T Colombo I Parisi M Zucchetti C Sessa A Goldhirsch and M DIncalci Pharmacokinetic interactions of paclitaxel docetaxel and their vehicles with doxorubicin Ann Oncol 10391-395 (1999)
(89) M J Millward L K Webster D Rischin K H Stokes G C Toner J F Bishop I N Olver B M Linahan M E Linsenmeyer and D M Woodcock Phase I trial of cremophor EL with bolus doxorubicin Clin Cancer Res 42321-2329 (1998)
60
(90) J Liu E H Kraut S Balcerzak M Grever S DAmbrosio and K K Chan Dosing sequence-dependent pharmacokinetic interaction of oxaliplatin with paclitaxel in the rat Cancer Chemother Pharmacol 50445-453 (2002)
(91) A Sparreboom O van Tellingen W J Nooijen and J H Beijnen Nonlinear pharmacokinetics of paclitaxel in mice results from the pharmaceutical vehicle Cremophor EL Cancer Res 562112-2115 (1996)
(92) A G Ellis and L K Webster Inhibition of paclitaxel elimination in the isolated perfused rat liver by Cremophor EL Cancer Chemother Pharmacol 4313-18 (1999)
(93) L Gianni L Vigano A Locatelli G Capri A Giani E Tarenzi and G Bonadonna Human pharmacokinetic characterization and in vitro study of the interaction between doxorubicin and paclitaxel in patients with breast cancer J Clin Oncol 151906-1915 (1997)
(94) A Sparreboom L van Zuylen E Brouwer W J Loos P de Bruijn H Gelderblom M Pillay K Nooter G Stoter and J Verweij Cremophor EL-mediated alteration of paclitaxel distribution in human blood clinical pharmacokinetic implications Cancer Res 591454-1457 (1999)
(95) L van Zuylen J Verweij and A Sparreboom Role of formulation vehicles in taxane pharmacology Invest New Drugs 19125-141 (2001)
(96) D Kessel Properties of Cremophor EL micelles probed by fluorescence Photochem Photobiol 56447-451 (1992)
(97) W J Loos J Szebeni A J ten Tije J Verweij D M van Zomeren K N Chung K Nooter G Stoter and A Sparreboom Preclinical evaluation of alternative pharmaceutical delivery vehicles for paclitaxel Anticancer Drugs 13767-775 (2002)
(98) Dhanikula AB Singh DR and Panchagnula R In vivo pharmacokinetic and tissue distribution studies in mice of alternative formulations for local and systemic delivery of paclitaxel gel film prodrug liposomes and micelles Curr Drug Deliv 235-44 (2005)
(99) Solvent-free paclitaxel formulation better than taxol Scrip (S00825922 20031209) 2003 (100) L Vigano A Locatelli G Grasselli and L Gianni Drug interactions of paclitaxel and
docetaxel and their relevance for the design of combination therapy Invest New Drugs 19179-196 (2001)
(101) R Danesi F Innocenti S Fogli A Gennari E Baldini A Di Paolo B Salvadori G Bocci P F Conte and M Del Tacca Pharmacokinetics and pharmacodynamics of combination chemotherapy with paclitaxel and epirubicin in breast cancer patients Br J Clin Pharmacol 53508-518 (2002)
(102) S Fogli R Danesi A Gennari S Donati P F Conte and M Del Tacca Gemcitabine epirubicin and paclitaxel pharmacokinetic and pharmacodynamic interactions in advanced breast cancer Ann Oncol 13919-927 (2002)
(103) T Kasai M Oka H Soda J Tsurutani M Fukuda Y Nakamura S Kawabata K Nakatomi S Nagashima H Takatani M Fukuda A Kinoshita and S Kohno Phase I and pharmacokinetic study of paclitaxel and irinotecan for patients with advanced non-small cell lung cancer Eur J Cancer 381871-1878 (2002)
(104) B L Lum S Kaubisch A M Yahanda K M Adler L Jew M N Ehsan N A Brophy J Halsey M P Gosland and B I Sikic Alteration of etoposide pharmacokinetics and pharmacodynamics by cyclosporine in a phase I trial to modulate multidrug resistance J Clin Oncol 101635-1642 (1992)
(105) N J Lacayo B L Lum D L Becton H Weinstein Y Ravindranath M N Chang L Bomgaars S J Lauer B I Sikic and G V Dahl Pharmacokinetic interactions of cyclosporine with etoposide and mitoxantrone in children with acute myeloid leukemia Leukemia 16920-927 (2002)
(106) D A Rushing S R Raber K A Rodvold S C Piscitelli G S Plank and D A Tewksbury The effects of cyclosporine on the pharmacokinetics of doxorubicin in patients with small cell lung cancer Cancer 74834-841 (1994)
(107) B L Samuels R Mick N J Vogelzang S F Williams R L Schilsky A R Safa S M OBrien and M J Ratain Modulation of vinblastine resistance with cyclosporine a phase I study Clin Pharmacol Ther 54421-429 (1993)
61
(108) D J Boote I F Dennis P R Twentyman R J Osborne C Laburte S Hensel J F Smyth M H Brampton and N M Bleehen Phase I study of etoposide with SDZ PSC 833 as a modulator of multidrug resistance in patients with cancer J Clin Oncol 14610-618 (1996)
(109) H Minami T Ohtsu H Fujii T Igarashi K Itoh N Uchiyama-Kokubu T Aizawa T Watanabe Y Uda Y Tanigawara and Y Sasaki Phase I study of intravenous PSC-833 and doxorubicin reversal of multidrug resistance Jpn J Cancer Res 92220-230 (2001)
(110) M Jin T Shimada K Yokogawa M Nomura Y Mizuhara H Furukawa J Ishizaki and K Miyamoto Cremophor EL releases cyclosporin A adsorbed on blood cells and blood vessels and increases apparent plasma concentration of cyclosporin A Int J Pharm 293137-144 (2005)
(111) M E Davis and M E Brewster Cyclodextrin-based pharmaceutics past present and future Nat Rev Drug Discov 31023-1035 (2004)
(112) V J Stella V M Rao E A Zannou and V Zia V Mechanisms of drug release from cyclodextrin complexes Adv Drug Deliv Rev 363-16 (1999)
(113) H W Frijlink A C Eissens N R Hefting K Poelstra C F Lerk and D K Meijer The effect of parenterally administered cyclodextrins on cholesterol levels in the rat Pharm Res 89-16 (1991)
(114) H W Frijlink E J Franssen A C Eissens R Oosting C F Lerk and D K Meijer The effects of cyclodextrins on the disposition of intravenously injected drugs in the rat Pharm Res 8380-384 (1991)
(115) E E Sideris M A Koupparis and P E Macheras Effect of cyclodextrins on protein binding of drugs the diflunisalhydroxypropyl-beta-cyclodextrin model case Pharm Res 1190-95 (1994)
(116) P Y Grosse F Bressolle P Rouanet and J M Joulia Methyl-beta-cyclodextrin and doxorubicin pharmacokinetics and tissue concentrations following bolus injection of these drugs alone or together in the rabbit Int J Pharm 180215-223 (1999)
(117) T Shinoda S Kagatani A Maeda Y Konno H Hashimoto K Hara K Fujita and T Sonobe Sugar-branched-cyclodextrins as injectable drug carriers in mice Drug Dev Ind Pharm 251185-1192 (1999)
(118) B McCormack and G Gregoriadis Comparative studies of the fate of free and liposome-entrapped hydroxypropyl-beta-cyclodextrindrug complexes after intravenous injection into rats implications in drug delivery Biochim Biophys Acta 1291237-244 (1996)
(119) A Sharma K Anderson and J W Baker Flocculation of serum lipoproteins with cyclodextrins application to assay of hyperlipidemic serum Clin Chem 36529-532 (1990)
(120) A Sharma and L S Janis Lipoprotein-cyclodextrin interaction Clin Chim Acta 199129-137 (1991)
(121) T Irie M Otagiri M Sunada K Uekama Y Ohtani Y Yamada and Y Sugiyama Cyclodextrin-induced hemolysis and shape changes of human erythrocytes in vitro J Pharmacobiodyn 5741-744 (1982)
(122) M E Brewster W R Anderson D Meinsma D Moreno A I Webb L Pablo K S Estes H Derendorf N Bodor R Sawchuk B Cheung and E Pop Intravenous and oral pharmacokinetic evaluation of a 2-hydroxypropyl-beta-cyclodextrin-based formulation of carbamazepine in the dog comparison with commercially available tablets and suspensions J Pharm Sci 86335-339 (1997)
(123) K Dietzel K S Estes M E Brewster N S Bodor and H Derendorf The use of 2-hydroxypropyl-beta-cyclodextrin as a vehicle for intravenous administration of dexamethasone in dogs Int J Pharm 59225-230 (1990)
(124) J Cummings G J Forrest D Cunningham N L Gilchrist and M Soukop Influence of polysorbate 80 (Tween 80) and etoposide (VP-16-213) on the pharmacokinetics and urinary excretion of adriamycin and its metabolites in cancer patients Cancer Chemother Pharmacol 1780-84 (1986)
(125) W J Loos S D Baker J Verweij J G Boonstra and A Sparreboom Clinical pharmacokinetics of unbound docetaxel role of polysorbate 80 and serum proteins Clin Pharmacol Ther 74364-371 (2003)
62
(126) O van Tellingen J H Beijnen J Verweij E J Scherrenburg W J Nooijen and A Sparreboom Rapid esterase-sensitive breakdown of polysorbate 80 and its impact on the plasma pharmacokinetics of docetaxel and metabolites in mice Clin Cancer Res 52918-2924 (1999)
(127) K Woodburn E Sykes and D Kessel Interactions of Solutol HS 15 and Cremophor EL with plasma lipoproteins Int J Biochem Cell Biol 27693-699 (1995)
(128) J M Grindel T Jaworski R M Emanuele and P Culbreth Pharmacokinetics of a novel surface-active agent purified poloxamer 188 in rat rabbit dog and man Biopharm Drug Dispos 2387-103 (2002)
(129) T W Guentert S Oie L Paalzow B M Frey R Brandt L J Aarons and M Rowland Interaction of mixed micelles formed from glycocholic acid and lecithin with the protein binding of various drugs Br J Clin Pharmacol 23569-577 (1987)
(130) P R Cullis A Chonn and S C Semple Interactions of liposomes and lipid-based carrier systems with blood proteins Relation to clearance behaviour in vivo Adv Drug Deliv Rev 323-17 (1998)
(131) P Opanasopit M Nishikawa and M Hashida Factors affecting drug and gene delivery effects of interaction with blood components Crit Rev Ther Drug Carrier Syst 19191-233 (2002)
(132) L Araujo R Lobenberg and J Kreuter Influence of the surfactant concentration on the body distribution of nanoparticles J Drug Target 6373-385 (1999)
(133) S Stolnik B Daudali A Arien J Whetstone C R Heald M C Garnett S S Davis and L Illum The effect of surface coverage and conformation of poly(ethylene oxide) (PEO) chains of poloxamer 407 on the biological fate of model colloidal drug carriers Biochim Biophys acta 1514261-279 (2001)
(134) J F Krzyzaniak D M Raymond and S H Yalkowsky Lysis of human red blood cells 2 Effect of contact time on cosolvent induced hemolysis Int J Pharm 152193-200 (1997)
(135) F Mottu M J Stelling D A Rufenacht and E Doelker Comparative hemolytic activity of undiluted organic water-miscible solvents for intravenous and intra-arterial injection PDA J Pharm Sci Technol 5516-23 (2001)
(136) E Soderlind M Wollbratt and C von Corswant The usefulness of sugar surfactants as solubilizing agents in parenteral formulations Int J Pharm 25261-71 (2003)
(137) B Nuijen M Bouma C Manada J M Jimeno A Bult and J H Beijnen In vitro hemolysis and buffer capacity studies with the novel marine anticancer agent kahalalide F and its reconstitution vehicle Cremophor ELethanol PDA J Pharm Sci Technol 55223-229 (200)
(138) R A Rajewski G Traiger J Bresnahan P Jaberaboansari V J Stella and D O Thompson Preliminary safety evaluation of parenterally administered sulfoalkyl ether beta-cyclodextrin derivatives J Pharm Sci 84927-932 (1995)
(139) T M Florence and J L Stauber Hemolysis of human erythrocytes by alpha-tocopheryl succinate J Nutrit Environ Med 8345-347 (1998)
(140) J Neuzil M Zhao G Ostermann M Sticha N Gellert C Weber J W Eaton and U T Brunk Alpha-tocopheryl succinate an agent with in vivo anti-tumour activity induces apoptosis by causing lysosomal instability Biochem J 362709-715 (2002)
(141) S H Wu and W K Hopkins Characteristics of d-a-tocopheryl PEG 1000 succinate for applications as an absorption enhancer in drug delivery systems Pharm Technol 2352-68 (1999)
(142) H W Frijlink J Visser N R Hefting R Oosting D K Meijer and C F Lerk The pharmacokinetics of beta-cyclodextrin and hydroxypropyl-beta-cyclodextrin in the rat Pharm Res 71248-1252 (1990)
(143) V J Stella and R A Rajewski Cyclodextrins their future in drug formulation and delivery Pharm Res 14556-567 (1997)
(144) In P K Gupta and G A Brazeau (eds) Injectable drug development techniques to reduce pain and irritation Interpharm Press Denver Colorado 1999
(145) B Davies and T Morris Physiological parameters in laboratory animals and humans Pharm Res 101093-1095 (1993)
63
References to internal reports of Novartis Pharma AG
(146) In vitro blood distribution and plasma protein binding of [3H]COM1 including stability in blood and plasma for rat and human PCS(EU) R0400014 Preclinical Safety Novartis Pharma AG Basel Switzerland 14-May-2004
(147) In vitro blood distribution and stability of [3H]COM2 for mouse rat and human PCS(EU) R0201077 Preclinical Safety Novartis Pharma AG Basel Switzerland 07-May-2003
(148) In vitro blood distribution plasma protein binding and stability in blood and plasma of [3H]COM3 for mouse rat dog cynomolgus monkey and human DMPK R0400595 Drug Metabolism and Pharmacokinetics Novartis Pharma AG Basel Switzerland 01-Feb-2005
(149) In vitro blood distribution and plasma protein binding of [14C]COM4 and stability in blood and plasma for rat ferret dog monkey and human PCS(EU) R0201539 Preclinical Safety Novartis Pharma AG Basel Switzerland 24-Sep-2003
(150) In vitro blood distribution plasma protein binding and stability in blood of [14C]COM5 for mouse rat dog and human PCS(EU) R0201107 Preclinical Safety Novartis Pharma AG Basel Switzerland 14-May-2003
(151) Absorption distribution and excretion of [14C]COM5 after single intravenous (1 mLkg) and oral (3 mgkg) administration to rat PCS(EU) R0201108 Preclinical Safety Novartis Pharma AG Basel Switzerland 19-May-2003
(152) ADME in rat after oral (08 mgkg) and intravenous (04 mgkg) administration of [14C]COM4 PCS(EU) R0201540 Preclinical Safety Novartis Pharma AG Basel Switzerland 19-Dec-2003
(153) Blood pharmacokinetics tissue distribution and excretion of [3H]COM2 in OF1 normal male mice and brain penetration of [3H]COM2 in APP23 transgenic and wild-type female mice after single intravenous (4 microgkg) administration PCS(EU) R0201082 Preclinical Safety Novartis Pharma AG Basel Switzerland 08-May-2003
64
8 Appendix
Raw data of COM1 in rat
In vitro blood distribution of [3H]COM1 using blood pools with different hematocrits
Total radioactivity concentration determined in blood and plasma
Excipient Nominal COM1 H Incubation Actual values
in blood time (pg-eqmL mean plusmnSD n=3) in blood (pgmL) (min) Blood Plasma
None 60 048 0 53 plusmn 1 76 plusmn 1 (Glu) 5 53 plusmn 1 75 plusmn 0 10 52 plusmn 1 74 plusmn 1 20 52 plusmn 0 74 plusmn 1 6000 0 5335 plusmn 80 7835 plusmn 121 5 5637 plusmn 116 7784 plusmn 103 10 5576 plusmn 40 7598 plusmn 114 20 5502 plusmn 76 7502 plusmn 98 HP-β-CyD 05 60 048 0 62 plusmn 1 97 plusmn 0 5 62 plusmn 1 96 plusmn 1 10 62 plusmn 1 94 plusmn 1 20 62 plusmn 0 93 plusmn 1 6000 0 6564 plusmn 21 10052 plusmn 31 5 6550 plusmn 30 10057 plusmn 214 10 6434 plusmn 85 9896 plusmn 66 20 6280 plusmn 213 9918 plusmn 80 5 60 045 0 64 plusmn 0 102 plusmn 1 5 65 plusmn 1 102 plusmn 1 10 63 plusmn 1 102 plusmn 1 20 64 plusmn 1 101 plusmn 1 6000 0 6516 plusmn 132 10660 plusmn 26 5 6598 plusmn 273 10762 plusmn 382 10 6475 plusmn 288 10454 plusmn 163 20 6653 plusmn 79 10482 plusmn 130 SHS 05 60 048 0 60 plusmn 2 86 plusmn 2 5 60 plusmn 0 94 plusmn 19 10 60 plusmn 1 81 plusmn 1 20 60 plusmn 0 81 plusmn 1 6000 0 6265 plusmn 40 8845 plusmn 102 5 6240 plusmn 92 8562 plusmn 44 10 6127 plusmn 110 8432 plusmn 35 20 6104 plusmn 112 8109 plusmn 122 5 60 045 0 59 plusmn 1 93 plusmn 1 5 58 plusmn 1 92 plusmn 0 10 56 plusmn 1 91 plusmn 1 20 58 plusmn 1 91 plusmn 1 6000 0 6166 plusmn 65 9908 plusmn 44 5 6180 plusmn 162 9607 plusmn 123 10 6230 plusmn 99 9529 plusmn 119 20 6189 plusmn 104 9489 plusmn 211
65
In vitro blood distribution of [3H]COM1 continued
Excipient Nominal COM1 H Incubation Actual values
in blood time (pg-eqmL mean plusmnSD n=3) in blood (pgmL) (min) Blood Plasma
TPGS 05 60 048 0 59 plusmn 1 92 plusmn 1 5 58 plusmn 1 90 plusmn 1 10 58 plusmn 1 88 plusmn 2 20 58 plusmn 0 87 plusmn 1 6000 0 5494 plusmn 102 8949 plusmn 87 5 5518 plusmn 124 8549 plusmn 165 10 5552 plusmn 74 8387 plusmn 101 20 5431 plusmn 23 8286 plusmn 71 5 60 040 0 50 plusmn 1 81 plusmn 1 5 50 plusmn 1 80 plusmn 1 10 50 plusmn 0 79 plusmn 1 20 50 plusmn 1 72 plusmn 1 6000 0 5042 plusmn 20 8175 plusmn 148 5 5014 plusmn 34 7907 plusmn 136 10 5102 plusmn 59 7952 plusmn 77 20 5069 plusmn 68 7204 plusmn 35 Triplicate analyses were conducted on one aliquot for each time point
In vitro protein binding of [3H]COM1 using the same plasma pool
Total radioactivity concentration determined in plasma and ultrafiltrate samples
Excipient Nominal COM1 Actual values (pg-eqmL) in plasma (pgmL) Plasma Ultrafiltrate None 60 65 26 (Glu) 26 26 6000 6302 270 268 272 TPGS 05 60 62 27 21 29 6000 5708 171 230 133 5 60 67 12 13 11 6000 5886 187 103 68 Mean of duplicate determination of plasma spiked with different COM1 stock solutions
66
Tissue and plasma levels of parent drug and total radioactivity after iv administration of [3H]COM1 (4 microgkg) in the control group
Time Tissue Individual concentration values
(h) COM1 (pgg) Radioactivity (pg-eqg) 008 Plasma 866 381 958 2529 1871 2052 Lung 2012 1440 1867 3431 2224 2538 Heart 2366 973 1619 2593 1490 1808 Liver 1069 384 724 11805 9501 10699 Kidney 2263 995 1692 6350 5770 5281 Fat 2803 1982 4753 2638 2213 4859 Muscle 1405 811 1234 1312 882 1172 Skin 433 225 296 937 524 583 Brain 6229 4525 4712 5431 4004 4053 025 Plasma 275 257 178 1719 1482 1366 Lung 399 607 518 1491 1378 1374 Heart 517 645 285 1034 1023 778 Liver 274 511 238 7904 6502 6920 Kidney 557 664 321 5270 5046 5425 Fat 6508 5897 4206 5953 5307 4112 Muscle 565 574 306 659 686 463 Skin 228 213 219 581 702 570 Brain 3407 4085 3014 3033 3552 2719 05 Plasma 179 103 101 1525 1442 1379 Lung 622 367 335 1365 1089 1030 Heart 310 211 214 684 684 661 Liver 138 71 100 7090 5263 4993 Kidney 345 220 202 4924 4585 5053 Fat 8008 4790 4248 6586 4071 3649 Muscle 270 159 166 409 349 342 Skin 199 64 104 559 449 480 Brain 2676 2419 2123 2310 2180 1953 pgmL and pg-eqmL
67
Tissue and plasma levels of parent drug and total radioactivity after iv administration of [3H]COM1 (4 microgkg) in the TPGS group
Time Tissue Individual concentration values
(h) COM1 (pgg) Radioactivity (pg-eqg) 008 Plasma 312 297 278 2842 2939 3006 Lung 1370 1173 1560 2364 2057 2272 Heart 1190 971 912 1584 1262 1291 Liver 449 234 337 10459 8898 10720 Kidney 1012 768 806 5047 4767 4829 Fat 2182 1485 1860 2712 2380 1703 Muscle 845 726 1132 880 720 1046 Skin 100 45 53 665 351 343 Brain 4072 2765 3083 3816 2353 2709 025 Plasma 89 107 121 2040 2440 2368 Lung 531 688 546 1343 1488 1356 Heart 351 471 454 737 864 851 Liver 104 205 170 5354 6770 5184 Kidney 321 435 446 6931 4972 6603 Fat 1352 3916 1578 1456 4764 2035 Muscle 355 649 588 532 789 675 Skin 71 72 37 563 518 342 Brain 1811 2327 1955 1648 2017 1841 05 Plasma 35 65 61 2027 2054 2186 Lung 214 195 319 1172 1067 1115 Heart 167 207 250 539 566 650 Liver 75 70 117 4225 4417 4314 Kidney 197 209 215 6923 6364 5600 Fat 3406 2067 2295 3071 1625 2734 Muscle 191 226 256 343 394 368 Skin 120 52 41 515 389 398 Brain 1516 1332 1541 1413 1295 1480 pgmL and pg-eqmL
Ex vivo protein binding of [3H]COM1 in the control and TPGS group
Parent drug concentration determined in plasma and ultrafiltrate
Dose Time Individual values (pgmL)
(microgkg) (h) Plasma Ultrafiltrate Control group 4 008 794 169 169 025 249 55 51 050 137 27 26 TPGS group 27 008 331 127 120 025 120 41 44 050 60 25 24 Mean of duplicate determination of plasma pooled for each time point
68
Raw data of COM2 in mouse
In vitro blood distribution of [3H]COM2 using blood pools with different hematocrits
Total radioactivity concentration determined in blood and plasma
Excipient Nominal COM2 H Incubation Actual values
in blood time (pg-eqmL mean plusmnSD n=3) (pgmL) (min) Blood Plasma
None 100 045 5 115 plusmn 2 85 plusmn 3 (Glu) 60 115 plusmn 5 93 plusmn 4 240 112 plusmn 6 101 plusmn 2 CELEtOH 6535 100 045 5 104 plusmn 5 86 plusmn 4 60 105 plusmn 2 83 plusmn 1 240 102 plusmn 1 87 plusmn 6 100rsquo000 046 5 103797 plusmn 1430 83684 plusmn 1446 60 102979 plusmn 1547 81784 plusmn 896 240 105912 plusmn 2594 80887 plusmn 998 HP-β-CyD 100 045 5 103 plusmn 5 88 plusmn 2 60 104 plusmn 5 94 plusmn 1 240 99 plusmn 2 94 plusmn 7 100rsquo000 043 5 105176 plusmn 1165 92396 plusmn 1519 60 104609 plusmn 1238 95791 plusmn 668 240 107331 plusmn 880 96454 plusmn 1780 SHS 100 045 5 101 plusmn 1 86 plusmn 1 60 99 plusmn 4 85 plusmn 1 240 105 plusmn 3 84 plusmn 3 100rsquo000 044 5 118080 plusmn 891 99140 plusmn 1915 60 116422 plusmn 2822 93052 plusmn 1190 240 116363 plusmn 890 89790 plusmn 1735 PEG 200 100 045 5 124 plusmn 4 96 plusmn 1 60 125 plusmn 6 95 plusmn 2 240 122 plusmn 2 103 plusmn 5 100rsquo000 046 5 112001 plusmn 3923 87146 plusmn 1273 60 112161 plusmn 1189 89801 plusmn 1646 240 110680 plusmn 652 90561 plusmn 1883 TPGS 100 045 5 101 plusmn 2 115 plusmn 2 60 104 plusmn 2 101 plusmn 1 240 101 plusmn 3 95 plusmn 3 100rsquo000 043 5 100911 plusmn 1443 106192 plusmn 992 60 100608 plusmn 3207 88758 plusmn 1037 240 100236 plusmn 4088 81755 plusmn 810 Triplicate analyses were conducted on one aliquot for each time point similar to previous study
In vitro protein binding of [
3H]COM2 at 10 ngmL using the same plasma pool
Parent drug concentration determined in plasma and ultracentrifugate
Excipient Actual values (pgmL) in plasma Plasma Ultracentrifugate None 9649 166 (plasma) 9278 164 9162 164 9292 164 TPGS 05 8624 116 8651 124 8722 103 8739 99
69
Tissue and plasma levels of parent drug and total radioactivity after iv administration of [3H]COM2 (04 microgkg) in the control group
Time Tissue Individual concentration values
(h) COM2 (pgg) Radioactivity (pg-eqg) 008 Plasma 110 112 91 181 194 164 Lung 1964 1955 1504 2450 2199 1704 Heart 796 830 623 1074 950 741 Liver 2398 2387 1778 3112 3022 2360 Kidney 2083 1871 1327 2276 2024 1511 Fat 140 327 230 58 540 603 Muscle 124 170 203 160 218 234 Skin 0 35 10 14 76 32 Brain 1155 1112 1018 1097 1086 1046 025 Plasma 94 71 77 164 141 139 Lung 1344 908 1365 1648 1849 1759 Heart 495 465 433 622 593 580 Liver 1579 1214 1549 2218 2161 2381 Kidney 1194 1075 1259 1468 1445 1518 Fat 714 459 778 1103 977 1218 Muscle 201 217 227 251 268 258 Skin 113 16 59 160 73 114 Brain 1060 1191 1345 1064 1150 1287 05 Plasma 60 58 58 119 113 111 Lung 720 703 842 1192 1444 1350 Heart 295 262 331 454 447 447 Liver 978 861 1040 1918 2348 2129 Kidney 757 753 932 1017 1303 1336 Fat 1014 602 973 1836 1164 2203 Muscle 187 167 189 242 252 231 Skin 87 16 18 97 129 104 Brain 1209 1006 1044 1160 1003 1044 1 Plasma 32 41 28 60 79 49 Lung 369 478 468 1465 1274 1171 Heart 154 199 205 347 377 364 Liver 591 618 534 2077 1736 1383 Kidney 471 522 451 1088 1020 846 Fat 496 444 713 1066 1458 1253 Muscle 103 80 91 171 169 146 Skin 0 38 48 138 123 122 Brain 673 832 688 826 902 806 pgmL and pg-eqmL value below LOQ
70
Tissue and plasma levels of parent drug and total radioactivity after iv administration of [3H]COM2 (04 microgkg) in the TPGS group
Time Tissue Individual concentration values
(h) COM2 (pgg) Radioactivity (pg-eqg) 008 Plasma 223 248 268 506 549 606 Lung 1789 1913 1880 2036 2137 2116 Heart 661 711 724 766 890 924 Liver 2331 2252 2360 2593 2585 2656 Kidney 1697 1831 1677 1815 2014 1839 Fat 246 150 317 362 366 740 Muscle 108 190 272 144 246 330 Skin 0 20 60 39 36 77 Brain 913 1069 1133 904 1024 1080 025 Plasma 178 148 151 403 377 394 Lung 1522 1175 1133 1820 1412 1436 Heart 489 478 452 593 597 578 Liver 1636 1743 1500 2243 2293 2130 Kidney 1112 1114 1256 1387 1415 1513 Fat 932 915 1480 1742 1392 2239 Muscle 237 222 183 290 288 283 Skin 23 0 38 144 140 96 Brain 1088 1244 1207 1004 1150 1166 05 Plasma 111 118 143 330 359 421 Lung 890 911 968 1292 1728 1599 Heart 292 385 384 420 630 570 Liver 1086 1200 1128 1901 2342 2002 Kidney 864 996 1103 1124 1584 1452 Fat 1393 ― 765 1492 ― 1576 Muscle 156 181 173 232 273 269 Skin 44 73 114 106 131 192 Brain 1048 1272 1325 1003 1298 1237 1 Plasma 79 97 63 333 296 264 Lung 669 885 512 1672 1588 1769 Heart 231 285 143 519 483 423 Liver 774 1028 798 2073 1946 2394 Kidney 726 835 659 1431 1342 1374 Fat ― 320 688 ― 1036 1712 Muscle 143 137 76 210 240 221 Skin 30 147 52 158 220 194 Brain 1141 1188 889 1204 1202 1070 pgmL and pg-eqmL value below LOQ no fat dissectible
71
Raw data of COM3 in rat
In vitro blood distribution of [3H]COM3 using the same blood pool (H 044)
Total radioactivity concentration determined in blood and plasma
Excipient Nominal COM3 Incubation Actual values
in blood time (ng-eqmL mean plusmnSD n=3) (ngmL) (min) Blood Plasma
None 5 5 46 plusmn 03 17 plusmn 0 (Glu) 30 46 plusmn 02 17 plusmn 01 60 47 plusmn 04 17 plusmn 01 500 5 511 plusmn 2 179 plusmn 0 30 507 plusmn 6 178 plusmn 2 60 512 plusmn 9 176 plusmn 2 CELEtOH 6535 5 5 49 plusmn 04 18 plusmn 01 30 49 plusmn 03 17 plusmn 0 60 51 plusmn 02 17 plusmn 0 500 5 516 plusmn 6 161 plusmn 2 30 508 plusmn 2 160 plusmn 1 60 508 plusmn 9 156 plusmn 1 HP-β-CyD 5 5 53 plusmn 02 35 plusmn 01 30 52 plusmn 04 35 plusmn 01 60 51 plusmn 0 36 plusmn 01 500 5 516 plusmn 5 324 plusmn 2 30 510 plusmn 2 320 plusmn 5 60 512 plusmn 4 326 plusmn 2 SHS 5 5 49 plusmn 02 14 plusmn 0 30 47 plusmn 01 15 plusmn 0 60 49 plusmn 03 16 plusmn 0 500 5 498 plusmn 10 143 plusmn 0 30 506 plusmn 14 143 plusmn 3 60 498 plusmn 1 144 plusmn 1 PEG 200 5 5 49 plusmn 04 17 plusmn 01 30 51 plusmn 01 17 plusmn 01 60 48 plusmn 01 18 plusmn 01 500 5 520 plusmn 7 169 plusmn 1 30 510 plusmn 9 170 plusmn 2 60 518 plusmn 6 176 plusmn 3 EtOHPEG200Glu 5 5 46 plusmn 03 18 plusmn 01 5590 30 43 plusmn 02 18 plusmn 01 60 44 plusmn 01 18 plusmn 01 500 5 535 plusmn 10 188 plusmn 1 30 535 plusmn 10 194 plusmn 2 60 538 plusmn 8 192 plusmn 1 TPGS 5 5 52 plusmn 03 23 plusmn 0 30 51 plusmn 0 22 plusmn 01 60 51 plusmn 0 24 plusmn 03 500 5 546 plusmn 3 231 plusmn 3 30 542 plusmn 6 231 plusmn 2 60 551 plusmn 5 231 plusmn 2 Triplicate analyses were conducted on one aliquot for each time point
72
In vitro protein binding of [3H]COM3 using the same plasma pool
Excipient Nominal COM3 Actual values
in plasma (ng-eqmL) (ngmL) Plasma Ultrafiltrate None 5 58 067 (Glu) 076 068 500 512 63 63 62 HP-β-CyD 5 54 22 21 22 500 538 214 216 209 EtOHPEG200Glu 5 5590 5 52 066 067 065 500 552 66 66 64 Mean of duplicate determination of plasma spiked with different COM3 stock solutions
Ex vivo protein binding of [3H]COM3 in the control and HP-β-CyD group
Parent drug concentration determined in plasma amp ultrafiltrate
Time Individual values (pgmL)
(h) Plasma Ultrafiltrate Control group 008 168 11 13 05 46 04 1 35 03 HP-β-CyD group 008 97 25 23 05 54 08 07 1 34 02 03 Mean of duplicate determination of plasma pooled for each time point
73
Circulation and tissue levels of parent drug and total radioactivity after iv administration of [3H]COM3 (03 mgkg) in the control group
Time Tissue Individual concentration values
(h) COM3 (ngg) Radioactivity (ng-eqg) 008 Blood 39 42 57 60 63 81 Plasma 15 19 19 38 40 41 Liver 1196 1394 1645 2097 2517 2767 Kidney 1760 1646 2019 2354 2286 2677 Fat 152 137 95 193 176 97 Heart 536 534 722 668 676 927 Lung 5712 5711 7113 8073 7897 9688 Muscle 152 112 105 161 112 98 Skin 209 139 85 216 136 86 Brain 1048 1062 1382 1323 1334 1736 05 Blood 20 13 18 75 85 83 Plasma 8 5 6 89 115 104 Liver 644 419 700 2619 2716 2654 Kidney 671 400 692 1162 843 1144 Fat 66 45 59 89 80 83 Heart 210 125 199 296 201 278 Lung 2425 1317 2267 3403 1811 2947 Muscle 222 98 144 282 144 185 Skin 103 81 99 131 119 164 Brain 1002 803 909 1260 996 1164 1 Blood 11 11 10 80 70 60 Plasma 4 5 4 105 99 74 Liver 383 427 373 1866 2152 2030 Kidney 345 405 320 707 758 659 Fat 30 31 33 49 52 53 Heart 106 126 102 161 188 157 Lung 1158 1092 1340 1680 1539 1817 Muscle 96 109 92 154 167 149 Skin 55 85 63 118 148 129 Brain 647 691 622 811 875 775 pgmL and pg-eqmL
74
Circulation and tissue levels of parent drug and total radioactivity after iv administration of [3H]COM3 (03 mgkg) in the HP-β-CyD group
Time Tissue Individual concentration values
(h) COM3 (ngg) Radioactivity (ng-eqg) 008 Blood 34 31 32 53 52 48 Plasma 12 10 10 29 32 28 Liver 850 1052 1271 1181 1665 1901 Kidney 1413 1330 1474 1770 1611 1778 Fat 68 85 103 70 99 121 Heart 592 500 598 719 593 725 Lung 4669 4377 4739 6069 5352 5939 Muscle 151 147 129 159 157 129 Skin 84 64 nd 66 49 nd Brain 954 990 908 1125 1165 1087 05 Blood 19 18 17 74 70 82 Plasma 6 6 6 77 75 96 Liver 617 558 677 2110 2107 2159 Kidney 524 417 496 743 652 810 Fat 47 39 51 59 51 68 Heart 212 178 169 276 233 222 Lung 2355 2513 2258 2931 3032 2853 Muscle 137 137 116 172 169 143 Skin 32 37 50 52 65 135 Brain 733 743 822 895 864 958 1 Blood 11 10 10 65 69 71 Plasma 4 3 4 77 87 92 Liver 344 nd 336 1765 nd 1597 Kidney 300 251 328 515 454 617 Fat 28 19 20 41 43 44 Heart 106 98 94 143 153 143 Lung 1257 926 976 1582 1205 1237 Muscle 98 98 59 133 161 84 Skin 29 27 23 49 110 68 Brain 606 604 588 734 726 697 pgmL and pg-eqmL not determined due to glas vial broken by homogenization
In situ bladder catheterization of [14
C]COM3 in the control and HP-β-CyD group
Time Urinary concentration Urine excreted
(h) COM3 (ngmL) Radioactivity (ng-eqmL) (g) Control 05 190 331 7226 13857 0685 0350 group 1 721 339 17998 12039 0460 0439 15 88 151 2855 7869 1130 0477 2 64 134 2435 9293 0790 0261 HP-β-CyD 05 1911 5216 4903 3523 13028 12248 2635 0851 0784 group 1 7900 524 2965 44618 5086 27031 0119 1068 0265 15 4209 899 1268 40724 18439 19080 0111 0188 0267 2 1993 184 597 31856 7994 11100 0124 0412 0335 Rat Ndeg3 died during in situ experiment
75
Raw data of COM4 in rat
In vitro blood distribution of [14
C]COM4 at 100 ngmL using the same blood pool (H 044) Total radioactivity concentration determined in blood and plasma
Excipient Incubation Actual values
time (ng-eqmL mean plusmnSD n=3) in blood (min) Blood Plasma None 05 5 98 plusmn 2 169 plusmn 0 (saline) 30 98 plusmn 1 167 plusmn 1 60 98 plusmn 2 168 plusmn 3 CEL 05 5 99 plusmn 0 147 plusmn 0 30 99 plusmn 2 135 plusmn 2 60 98 plusmn 1 128 plusmn 1 1 5 103 plusmn 1 139 plusmn 1 30 104 plusmn 0 125 plusmn 1 60 104 plusmn 2 120 plusmn 2 HP-β-CyD 05 5 125 plusmn 2 202 plusmn 1 30 125 plusmn 1 201 plusmn 3 60 124 plusmn 0 199 plusmn 3 1 5 116 plusmn 2 171 plusmn 3 30 117 plusmn 3 171 plusmn 2 60 117 plusmn 2 170 plusmn 3 SHS 05 5 110 plusmn 2 165 plusmn 2 30 110 plusmn 1 155 plusmn 1 60 110 plusmn 1 153 plusmn 3 1 5 112 plusmn 1 150 plusmn 2 30 112 plusmn 3 150 plusmn 1 60 112 plusmn 0 148 plusmn 2 Triplicate analyses were conducted on one aliquot for each time point
76
In vitro protein binding of [14
C]COM4 at 100 ngmL using the same plasma pool Total radioactivity concentration determined in plasma and ultrafiltrate
Excipient Actual values
(pg-eqmL) in plasma Plasma Ultrafiltrate None 97 25 (saline) 23 22 CEL 001 105 25 24 23 01 117 36 38 35 05 102 115 109 113 1 97 254 250 249 HP-β-CyD 001 99 27 25 24 01 102 43 47 43 05 134 131 133 131 1 112 172 151 150 SHS 001 99 25 22 22 01 101 34 31 33 05 116 115 111 112 1 112 171 174 167 PEG 200 100 22 24 24 TPGS 114 23 24 22 Mean of duplicate determination of plasma spiked with different COM4 stock solutions
77
Circulation and tissue levels of total radioactivity after iv administration of [14
C]COM4
Time Tissue Individual concentration values (ng-eqg)
(h) Control group CEL group 008 Blood 1258 1855 1551 1340 1515 1556 Plasma 2047 2761 2640 2211 2548 2517 Plasma water 123 50 49 287 477 478 Lung 659 815 737 754 763 788 Muscle 216 228 222 251 230 250 Skin 348 229 253 229 227 307 025 Blood 1306 1202 1069 1350 1183 1414 Plasma 2343 1983 1893 2357 1910 2273 Plasma water 92 99 83 118 179 201 Lung 697 657 608 737 651 741 Muscle 206 215 205 204 212 216 Skin 443 317 330 351 402 432 05 Blood 1398 1431 1303 1394 1112 1142 Plasma 2382 2543 2238 2357 1969 1926 Plasma water 63 124 46 106 151 191 Lung 710 731 644 720 666 641 Muscle 202 206 197 204 203 204 Skin 363 426 436 384 389 343 1 Blood 1322 1189 1233 1329 732 1301 Plasma 2297 1967 2049 2361 1192 2059 Plasma water 35 101 99 99 106 186 Lung 649 618 616 674 539 674 Muscle 218 200 217 187 212 191 Skin 424 381 421 425 340 407 ng-eqmL
78
Raw data of COM5
In vitro blood distribution of [14
C]COM5 using blood pools with the same H 044 Total radioactivity concentration determined in blood and plasma
Excipient Nominal COM5 Incubation Actual values
in blood time (ng-eqmL mean plusmnSD n=3) (ngmL) (min) Blood Plasma
None 10 5 73 plusmn 06 115 plusmn 02 (saline) 30 78 plusmn 02 118 plusmn 02 60 76 plusmn 07 118 plusmn 07 300 5 278 plusmn 2 386 plusmn 4 30 277 plusmn 0 391 plusmn 4 60 275 plusmn 7 384 plusmn 2 EtOH 10 5 98 plusmn 06 138 plusmn 05 30 98 plusmn 06 135 plusmn 05 60 92 plusmn 06 139 plusmn 01 300 5 286 plusmn 2 404 plusmn 3 30 287 plusmn 6 400 plusmn 4 60 284 plusmn 5 395 plusmn 3 CELEtOH 6535 10 5 88 plusmn 03 129 plusmn 06 30 91 plusmn 05 128 plusmn 03 60 92 plusmn 03 11 plusmn 03 120 98 plusmn 03 109 plusmn 03 1 5 257 plusmn 4 322 plusmn 3 30 259 plusmn 3 313 plusmn 5 60 255 plusmn 5 267 plusmn 2 120 281 plusmn 3 279 plusmn 1 HP-β-CyD 05 5 93 plusmn 05 143 plusmn 03 30 95 plusmn 03 139 plusmn 03 60 96 plusmn 02 141 plusmn 07 1 5 293 plusmn 1 412 plusmn 10 30 297 plusmn 6 414 plusmn 6 60 296 plusmn 6 405 plusmn 1 SHS 05 5 106 plusmn 04 125 plusmn 04 30 107 plusmn 04 108 plusmn 03 60 108 plusmn 05 112 plusmn 03 1 5 256 plusmn 1 257 plusmn 1 30 257 plusmn 2 247 plusmn 4 60 260 plusmn 3 230 plusmn 1 PEG 200 05 5 101 plusmn 03 141 plusmn 03 30 99 plusmn 08 145 plusmn 02 60 102 plusmn 03 142 plusmn 02 1 5 304 plusmn 7 402 plusmn 3 30 304 plusmn 8 413 plusmn 4 60 307 plusmn 2 410 plusmn 4 TPGS 05 5 88 plusmn 03 146 plusmn 04 30 91 plusmn 06 145 plusmn 03 60 89 plusmn 02 133 plusmn 03 1 5 308 plusmn 5 448 plusmn 3 30 312 plusmn 7 446 plusmn 7 60 311 plusmn 3 390 plusmn 22 Triplicate analyses were conducted on one aliquot for each time point
79
In vitro protein binding of [14
C]COM5 using the same plasma pool Total radioactivity concentration determined in plasma and ultrafiltrate
Excipient Nominal COM5 Actual values
in plasma (ng-eqmL) (ngmL) Plasma Ultrafiltrate None 10 86 13 (saline) 15 300 292 35 35 34 EtOH 10 108 13 12 300 295 35 35 34 CELEtOH 6535 10 104 25 24 21 300 269 65 64 63 SHS 10 107 30 29 31 300 268 76 74 73 Mean of duplicate determination of plasma spiked with different COM5 stock solutions
80
Circulation and tissue levels of total radioactivity after iv dosing of [14
C]COM5 (1 mgkg)
Time Tissue Individual concentration values (ng-eqg)
(h) Control group SHS group 008 Blood 1109 1450 1365 1694 2005 1859 Plasma 2009 3120 2647 2486 3010 2665 Muscle 355 458 387 555 426 448 Skin 275 224 245 296 207 219 Brain 24 29 28 41 38 41 025 Blood 712 873 1100 1519 1179 1033 Plasma 1508 1468 1777 2265 1813 1606 Muscle 262 341 330 423 445 404 Skin 229 242 259 456 441 342 Brain 14 16 18 29 27 21 05 Blood 642 409 792 1096 867 965 Plasma 1194 572 1275 1655 1455 1467 Muscle 244 199 241 342 341 315 Skin 252 198 256 397 382 374 Brain 11 7 11 22 15 18 1 Blood 172 192 219 688 603 464 Plasma 269 304 361 1055 919 727 Muscle 59 55 57 203 176 144 Skin 164 146 145 299 217 223 Brain 3 3 3 12 11 9 ng-eqmL value below LOQ
Ex vivo protein binding of [14
C]COM5 in the control and SHS group Total radioactivity concentration determined in plasma amp ultrafiltrate
Time Individual values (pg-eqmL)
(h) Plasma Ultrafiltrate Control group 008 2465 217 221 025 1587 123 126 05 1031 69 67 1 305 31 31 SHS group 008 2679 378 372 025 1914 245 05 1524 230 230 1 864 167 Mean of duplicate determination of plasma pooled for each time point
81
9 Acknowledgments
I would like to thank Prof Hans Leuenberger for giving me the opportunity to accomplish a PhD thesis at the University of Basel in collaboration with Novartis Ltd I would also like to thank my advisor PD Dr Georgios Imanidis for his guidance support and advice I would like to thank Dr Bruno Galli for acting as a co-examiner and co-referee for my PhD thesis I would like to thank Dr Gerhard Gross and his group for allowing me to conduct my dissertation research in their laboratories In particular I would like to thank Mr Armin Bruumllisauer and Dr Markus Weiss for helpful comments and discussions I am also thankful for Pierrette Guntz Heidi Huumlgli Marcel Fresneau and Albert Spielmann for not only assisting with my training and sharing laboratory space but for their friendships I would like to thank Dr Ernst Ulrich Koelle and Dr Michel Lemaire for their scientific advice and discussions concerning kinetics and suggestions throughout my dissertation project I would like to thank the Isotope Laboratories of Novartis for providing me with radiolabeled compounds Finally this research was made possible by financial support of Novartis Pharma AG Basel
82
10 Curriculum Vitae
Name Barbara Egger-Heigold Address Lettenweg 8 4102 Binningen
1975 Born on October 30th in Lucerne
1982-1988 Primary school in ReussbuumlhlLU 1988-1995 Matura Typus B Gymnasium ReussbuumlhlLU
1995-1996 1Propedeuticum in Medicines University of Basel 1997-2002 Studies in Pharmaceutical Sciences University of Basel 2002 Diploma thesis at Novartis Pharma AG Basel Thesis title The effect of excipients commonly used for drug
formulation on the in vitro rat blood distribution and protein-binding of SAB 378
2003-2005 PhD student University of Basel Laboratory work conducted at Novartis Pharma AG Basel During my PhD thesis I attended following lectures and courses given by the following lecturers Prof Dr H Leuenberger PD Dr GImanidis Prof Dr J Drewe Prof Dr J Seelig PD Dr H Heerklotz PD Dr A Seelig Dr S Rogers

1
1 Introduction
11 The physiology of blood
Blood is composed of cellular elements suspended in the plasma an aqueous fluid in which solids are dissolved Table 1-1 summarizes the main blood constitution of different laboratory animal species and humans The normal range can vary depending mainly on genetic and environmental factors and methods handling
Table 1-1 Normative data for laboratory animals and humans
Mouse (12)
Rat (134)
Human (5)
Sex Male Male Male Strain OF1 Wistar Body weight (kg) 0030 0250 70 Whole blood (ml100 g) 72 (63-80) 72 plusmn 02 71 plusmn 06 Plasma (ml100 g) 32 39 plusmn 01 44 plusmn 05
Total plasma proteins (g100 mL) 54 plusmn 02 57 plusmn 05 75 plusmn 04
Albumin ( plasma proteins) 61 plusmn 1 48 plusmn 3 62 plusmn 3 α1 globulin ( plasma proteins) 17 plusmn 2 4 plusmn 1 α2 globulin ( plasma proteins)
12 plusmn 1 (α globulin) 10 plusmn 2 9 plusmn 1
β1 globulin ( plasma proteins) β2 globulin ( plasma proteins)
20 plusmn 1 (β globulin)
19 plusmn 1 (β globulin)
11 plusmn 2 (β globulin)
γ globulin ( plasma proteins) 7 plusmn 1 6 plusmn 1 15 plusmn 2 Blood cells Hematocrit () 43 plusmn 3 46 plusmn 2 44 plusmn 2 Red blood cells (x106 cellsmicroL) 9 plusmn 1 7 plusmn 1 5 plusmn 1 White cells (x103 cellsmicroL) 4 plusmn 2 6 plusmn 2 7 plusmn 1 Platelets (x106 cellsmicroL) 13 plusmn 04 12 plusmn 02 03 plusmn 01
111 The blood cells
The different specialized cells found in blood are white blood cells (leukocytes) red blood cells (erythrocytes) and platelets (thrombocytes) Of these the erythrocytes are the most numerous and compose about one-half of the circulating blood volume By carrying hemoglobin in the circulation the red blood cells supply O2 to tissues and remove CO2 Leukocytes are classified as granulocytes (further classification in neutrophils eosinophils and basophils) lymphocytes and monocytes Acting together these cells provide the body with a powerful defense against tumors viral bacterial and parasitic infections Compared to the other blood cells the platelets are much smaller and aid in hemostasis by their primary function in blood clotting Furthermore blood cells can play a key role in binding and transporting of drugs in the circulation thereby contributing to their pharmacokinetic and pharmacological characteristics (67)
112 Plasma
The plasma the liquid portion of the blood is a complex fluid composed of water (approximately 90) and a large number of ions inorganic molecules and organic molecules in solution These dissolved substances primarily proteins are in transit to
2
various parts of the body or aid in the transport of other substances The plasma proteins consist of albumin globulin and fibrinogen fractions which can be separated by electrophoresis Electrophoretic separation followed by immunoprecipitation (immunoelectrophoresis) results in a further division of the proteins If whole blood is allowed to clot and the clot is removed the remaining fluid is called serum and has essentially the same composition as plasma except for the removed fibrinogen and few clotting factors (II V and VIII) Table 1-2 lists the main protein fractions with their main characteristics The table also indicates that a large number of drugs associate with proteins within the bloodstream Albumin is the major drug-binding plasma protein (8) followed by alpha 1-acid glycoprotein as the next important one (9) In recent years studies have shown that lipoproteins are also substantially involved in the bindingtransport of drugs in the blood compartment (10) So far γ-globulins play only a marginal role in plasma binding of drugs
Table 1-2 Proteins in human plasma
Physiological Function
Albumin PrealbuminAlbumin
α1 globulin α1-acid glycoprotein Uncertain (acute phase protein)
α1-lipoprotein (high Transporter Lipidsdensity lipoproteins)
α2 globulin Ceruloplasmin Transporter Copperα2-Macroglobulin Enzyme inhibitor Serum endoproteasesα2-Haptoglobin Binding and carrier protein Cell-free hemoglobin
β globulin Transferrin Transporter Ironβ-lipoprotein (low Transporterdensity lipoproteins)Fibrinogen Precursor to fibrin in hemostasis
γ globulin IgG IgA IgM IgE Antigen Few basic compounds
Electro-phoresis
Immuno-electrophoresis
Protein fraction Binding characteristics
Drugs Endogenous entities
Lipoproteins mainly lipophilic neutral and basic compounds
Humoral immunity (antibodiesimmunoglobulins)
Lipids (mainly cholesterol)
Binding and carrier protein osmotic regulator
Hormones amino acids steroids vitamins fatty acids
Mainly basic and neutral compounds
Mainly acidic but also basic and neutral compounds
Lipoproteins mainly lipophilic neutral and basic compounds
12 In vitro methods to investigate blood binding parameters
The investigation of the partitioning of a drug in the blood compartment is essential in predicting its pharmacokinetic-dynamic profile In general the unbound concentration of a drug in blood reflects more accurately pharmacological effects of the drug than its total concentration in blood (bound + unbound) because only the drug unbound to blood components is able to diffuse through the membranes and then reach the target organ (11) Furthermore the binding to plasma proteins also relates to the volume of distribution and the clearance of the drug For instance many experimental and clinical studies have generated substantial evidence summarized by Akhlaghi (12) that the unbound fraction of cyclosporin in plasma correlates more closely with pharmacodynamic and pharmacokinetic characteristics of cyclosporin than its total blood concentration Therefore determination of extent and rate of bloodplasma distribution and plasma protein binding of a drug is important in both the discovery and clinical phases of drug development
3
121 Blood distribution method
The rate and extent of bloodplasma distribution of drugs is determined in vitro in spiked whole blood The experiments are performed under controlled physiological conditions (pH 74 37degC gently shaken) to reflect the in vivo situation over the entire clinically relevant concentration range of the drug Time samples are taken and centrifuged Subsequently drug concentrations in blood and plasma are determined to calculate the time required to reach equilibrium The extent of bloodplasma and blood cellplasma distribution derives from measured concentrations in blood and plasma and can be expressed with distribution parameters like FP BPR and BCPR BPR depends on the hematocrit of the whole blood used in the determination whereas BCPR is independent of the hematocrit value
122 Protein binding methods
Various methods are available for the determination of free drug concentration and protein-drug binding fraction in plasma (131415) including conventional separation methods summarized in Table 1-3 However the routinely used methods like ultrafiltration or equilibrium dialysis are limited in the case of lipophilic drugs due to their nonspecific adsorption to ultrafiltration device or to the dialysis membrane Along with a trend to more lipophilic compounds observed in the pharmaceutical industry in recent years (16) these adsorption problems are expected to increase As a result ongoing method modifications and new methods are needed to overcome these difficulties Overall the selection of the method of binding assay depends upon the aim of the study and the physicochemical properties of the particular test compound including its formulation
The ratio of bound and total drug concentrations in plasma expresses the degree of drug binding to plasma proteins and ranges between values of 0 and 1 Based on these values drugs can be classified into very highly bound (gt095) highly bound (gt090) poorly bound (lt09) and littlenot bound (lt02)
4
Table 1-3 Conventional methods for determination of plasma protein binding
Method Principle Advantages Disadvantages
Ultrafiltration
Ultracentrifugation
Gel filtration Adoptable for lipophilic drugs automatable binding differences detectable (eg affinity)
Complex handling time consuming
Time consuming expensive equipment false estimation of free fraction by physical phenomena (eg sedimentation back diffusion) protein contamination of free drug layer
Separation by size exclusion and affinity of column
Separation by centrifugation at high speed in absence of a membrane
No membrane effects natural environment no dilution problems adoptable for lipophilic and high MW drugs evaluation of lipoprotein binding
Equilibrium dialysis (reference method)
Sample dilution volume shifts Donnan effects nonspecific adsorption sieve effect time consuming unsuitable for unstable drugs
Separation by filtration through a semipermeable membrane with defined molecular weight cutoffs accelerated by centrifugation or positive pressure (N2 gas syringe)
Equilibrium establishment between two compartments separated by semipermeable membrane with defined molecular weight cutoffs
Physiological conditions universal binding method
Simply applicable short analysis time simple commercially available kits no volume shifts no dilution effects
Donnan effects nonspecific adsorption binding equilibrium changes during separation process small amount for analysis sieve effect
13 Characterization of drug candidates
Successful candidates in drug development must have proper physicochemical properties in addition to acceptable pharmacokinetics efficacy and safety profiles As a result a clear understanding of compound characteristics and their correlations are helpful to rank and sort out unsuitable compounds in drug research (1718)
131 Physicochemical properties
The chemical structure of a drug candidate is used in both predicting the pharmacology and selecting formulation strategies Table 1-4 shows physico-chemical parameters which are critical for in vivo drug action
The molecular weight (MW) indicates roughly the size of a chemical entity and is connected to its membrane permeability namely to the intestinal and brain penetration (1619)
LogP the octanol-water partition coefficient has been widely accepted as a measure of molecular lipophilicity Lipophilicity affects both the pharmacokinetic and pharmacodynamic behavior of drug molecules (2021) LogP considers the molecule in its neutral state (neutral substance or ionizable substance in its neutral form) whereas logD reflects the pH-dependent distribution coefficient consequently taking the ionization of molecules into account If logP and pKa of a compound are known logD can be calculated at any pH (21)
5
The aqueous solubility (LogS) is closely related to drug stability liberation and absorption by passive diffusion thereby playing a key role in its bioavailability (22) Causes for poor solubility are mainly excessive lipophilicity and crystal packing issue (23242526) The solubility of nonionic molecules is pH independent while molecules with ionizable groups show pH dependent solubility Acid drugs have higher solubility at pH higher than pKa and basic drugs at pH lower than pKa due to better solubility of ionic species as compared to the neutral species The acid-basic character accounts also for crossing the blood-brain barrier (27)
The polar surface area (PSA) of a molecule is a useful parameter for predicting drug transport properties PSA is the sum of the molecular surface (either van der Waals or solvent-accessible) that arises from polar atoms usually N O N-H and O-H atoms Some scientists also include sulphur and phosphor and attached hydrogens as polar atoms The PSA of a compound is also closely related to its hydrogen bond accepting and donating ability which can be responsible for interactions with active efflux pumps (2829) PSA has been shown to correlate well with blood-brain distribution (273031) intestinal absorption (323334353637) and oral bioavailability (38) of compounds
Table 1-4 Physicochemical parameters
Parameter Description Predictor Optimal value
MW Molecular weight Size Permeability lt 500lt 450 (BBP)
LogP lt 5
LogS Hydrophilicity gt 20 microgmL
pKa Acid-base character
PSA Polar surface area lt 140 Aringlt 80 Aring (BBP)
Negative logarithm of the acid-base dissociation constant
Acids gt4 and bases lt10 (BBP)
Permeability H-bonding capability
Logarithm of the octanol-water partition coefficient
Lipophilicity Permeability
Logarithm of the aqueous solubility
BBP blood brain penetration
132 Pharmacokinetic parameters
The pharmacokinetic profile is crucial for the clinical success of drug candidates and their development into marketable drugs Therefore today the contribution of pharmacokinetic investigations to the selection and optimization of promising drug candidates is well recognized The four most important parameters are clearance volume of distribution elimination half-life and bioavailability which is the fraction of drug absorbed as such into the systemic circulation (100 per definition for drugs given intravenously)
Drug clearance (CL) expresses the rate or efficiency of drug removal from the systemic circulation and is estimated as the ratio of dose to AUC following intravenous administration of the drug
AUC
DoseCL =
6
AUC is the total area under the curve that describes the concentration of drug in blood or plasma as a function of time AUC represents the drug exposure and is calculated by the trapezoidal rule
The volume of distribution (V0) relates the amount of drug in the body to the concentration of drug in the blood or plasma depending upon the fluid measured This volume does not necessarily refer to an identifiable physiological volume but merely to the fluid volume that would be required to contain all of the drug in the body at the same concentration as in the blood or plasma
o
iv
C
DoseV =0
C0 represents the blood or plasma concentration at time zero and is determined by extrapolation to zero time of the linear plot of concentration vs time in semilogarithmic scale
The half-life (t12) is the time it takes for the blood or plasma concentration or the amount of drug in the body to be reduced by 50
kkt
69302ln21 ==
where k is the elimination rate constant which can be calculated by the slope of the best-fit line to a semilogarithmic plot of the concentration over time The relationship of t12 to both clearance and volume of distribution is given by
V
CLk =
133 New trends in characterizing drug candidates
Before conducting clinical trials in humans preclinical testing is carried out to discover the pharmacology ADME (adsorption distribution metabolism and excretion) and toxicology of a new drug candidate (39) Appropriate pharmacokinetics and a good balance between drug efficacy and safety contribute mainly to an efficient and effective drug development However these factors are the major hurdles in development which primarily cause increased costs and failure rate of candidates Thus pharmaceutical industry needs new concepts able to speed and improve activities and decision-making in drug development (4041) In this context microdosing biomarkers and PET ligands can help to prioritize resources and optimize drug selection in development In many cases these approaches deal with compound concentrations ranging from sub-therapeutic to low pharmacological levels and thus information obtained from these techniques must reflect correctly the conditions at therapeutic doses including interactions with macromolecules like enzymes transporters and proteins In the end a successful integration requires a profound understanding of strengths and limitations of these new concepts
The administration of a low dosed (microdosed) drug candidate to humans was proposed to obtain human pharmacokinetic data before conducting Phase I trial (42) A microdose is one-hundredth of the proposed pharmacological dose determined from animal andor in vitro models or a dose up to 100 microg whichever is the smaller (43) Human microdosing uses labeled agents administered mostly intravenously and their fate in vivo is recorded by positron emission tomography combined with accelerator mass spectrometry or nuclear magnetic resonance (4344) With this new
7
strategy of microdosing drug information regarding human kinetics will be available along with preclinical data and can be useful for the acceptance or rejection of a candidate at an early stage
A biomarker is an indicator of a normal biological or pathophysiological process or a therapeutic response (45) Biomarkers help to select the most sensitive drugs in all phases of drug development (46) by providing data of pharmacological response dosing regimen and risk-benefit assessment Therefore efforts are moving rapidly forward to achieve strong predictive biomarkers which could be used for diagnostic and therapeutical purposes (47)
PET tracers labeled with short-lived radionuclides (eg 11C 18F 124I) are used as molecular probes of physiology and pathophysiology in animals and humans These labeled compounds are administered mostly intravenously at 600 MBq to humans which corresponds to 6-20 nmol (3-10 microg assuming a MW of 500) (48) To achieve the same imaging quality in animals roughly the same total amount of radiopharmaceutical must be given to animals as to a human subject (49)
14 Strategies and administration of intravenous formulations
In the pharmaceutical industry formulation scientists have faced growing challenges in recent years as a result of new drug candidates characterized as being more lipophilic hydrophobic and water-insoluble particularly candidates originated from leads associated with combinatorial chemistry and high-throughput screening (1624) In addition timelines and resources are very limited to develop an optimized formulation and thus the search for a suitable dosing vehicle intended for activities in preclinical research represents a challenging task for the formulators (50) Ideally it is best to select and use solubilizers that would maximize the solubility of the compound and could be applied for all preclinical settings Moreover the solubilizing agents should not influence the intrinsic pharmacokinetic characteristics of the compound being evaluated (except the interaction is well understood) which would lead to misinterpretation of the pharmacological response (51) Strategies for solubilization of intravenous drugs are summarized in Table 1-5 and well exemplified by the formulation approaches for the anticancer agent Paclitaxel (52)
Usually the first step is to check the solubility of the compound in an aqueous dosing vehicle at physiological pH and osmolarity If the target concentration cannot be achieved with this approach and the drug molecule is ionizable adjustment of the pH to non-physiological values can be suitable to increase water solubility (pKa must be sufficiently away from the formulation pH) Non-electrolytes are insensitive to pH modification The next approach most frequently tried is the addition of water-miscible organic solvents (cosolvents) and the use of surfactants or complexing agents To reach the required dose combination of these methods is often used Dispersal systems are other techniques but they may be difficult costly and time-consuming due to biological and technical complexity eg liposomes (53)
8
Table 1-5 Intravenous formulation approaches
Approach Examples Administered in commercial productsa Potential drawbacks
NaCl 09 (wv) pH 2-12 (bolus) pH 2-10 (infusion) PrecipitationGlucose 5 (wv) rarr preferred range pH 4-9 PainStrong acidsbases (HCl NaOH)Buffers (tartarte phosphate)
Cosolvents Propylene glycol le 68 (bolus) le 6 (infusion) Precipitation Ethanol le 20 (bolus) le 10 (infusion) IrritationPainPolyethylene glycol 300 le 50 (bolus) HemolysisPolyethylene glycol 400 le 9 (bolus) Impact on PK profile
Surfactants Cremophor EL le 10 (infusion) ditoTween 80 le 04 (bolus) le 2 (infusion)Solutol HS 15 50
Complexing agents Hydroxypropyl-β-cyclodextrin 20 (infusion) ditoDispersal systems Impact on PK profile
EmulsionbMicroemulsionc Water with 10-20 oil (fatty acids + lecithin + glycerol) Sustained releaseLiposomes Water with phospholipids (5-20 mgmL) + isotonicifier + buffer plusmn cholesterol Instability
Nanosuspensiond Water with stabilizer not yet marketede Slow dissolution
Aqueous solution at physiological osmolarity and pH or with pH adjustment
a(54) b(55) c(56) d(57) e(58)
For compounds administered intravenously to animals the dose volume viscosity
of injection material speed of injection and species are important factors to consider in addition to formulation properties including additives solubility and stability (Table 1-6) (59) A compound can be given over a short period of le1 min (bolus injection) 5-10 min (slow injection) and longer time period (intravenous infusion) Rapid injections require the dose to be compatible with blood and not too viscous and the rate of injection is suggested not to exceed 3 mLmin for rodents Depending on study objectives and compound solubility in an acceptable formulation a larger volume may be needed to be given to animals to accomplish requirements Regarding the formulation aqueous solutions or simple systems containing cosolvent surfactant or complexing agent are recommended for animal investigations at early stage in development due to easy handling and characterization For excipient selection consideration should be given for toxic and biological effects interferences with the drug compound and suitability for clinical use (Table 1-5) Injectable excipients preferred for dosing in animals are ethanol propylene glycol low molecular weight polyethylene glycols Cremophor EL Tween 80 and cyclodextrins
Table 1-6 Dose volumes and rates for intravenous administration(59)
Species Bolus injection Slow injection Infusion
Volume Rate Volume Rate Time Volume Rat
(mLkg) (mLmin) (mLkg) (mLmin) (h) (mLkgd) (mLkgh) Mouse 5 3 max 25 3 4
24 96 4 Rat 5 3 max 20 3 4 20 5 24 60 25
9
15 Effect of excipients on pharmacokinetic parameters in blood
Over the last years more attention has been paid to the extensive investigation of formulation vehicles as biologically and pharmacologically active compounds The main stages in which pharmaceutical excipients can interact and hence may modulate the properties of an administered drug-agent are transporter enzyme and distribution process in the systemic circulation (eg plasma protein binding) The effect of excipients on transporter activity has been studied intensively namely for P-glycoprotein (606162636465666768) multidrug resistance-associated protein (6970) and peptide transporter (71) It is interesting to say that particularly nonionic surfactants effectively inhibit transporters In contrast up to this day little is known about drug-excipient interactions at the level of cytochrome-mediated metabolism (63727374) and blood distribution (see below) The biological and pharmacological properties of excipients with a focus on the central blood compartment will be reviewed in the following paragraphs
151 Cremophor EL
The amphiphilic polyethoxylated castor oil derivative Cremophor EL (CEL) is one of the most frequently used surface-active formulation ingredients in parenteral dosage forms As early as 1977 lipoprotein alterations were observed in patients receiving miconazole therapy (75) which was caused only by CEL both in vitro and in vivo (767778) Extended studies revealed later on that CEL has a destructive effect on HDL resulting in a shift of the electrophoretic and density gradient HDL to LDL (79808182) Furthermore several hydrophobic anti-tumor agents tin etiopurpurin (8384) C8KC (85) and Taxol (8182) showed strong affinity for these lipoprotein dissociation products inducing changes in plasma protein binding potentially affecting pharmacokinetics
Various animal studies demonstrated (85868788899091110) that CEL modifies the pharmacokinetic behavior of drugs after intravenous administration like paclitaxel (Taxol) C8KC and cyclosporin The most common observation was a substantial increase in the area under the plasma concentration-time curve and in peak plasma concentration of studied agent with a reduction in the clearance as was first described for paclitaxel in a mouse model (91) The drug-CEL interactions were supposed to be caused not only by altered protein binding characteristics (82) but also by altered hepatobiliary secretion (92) and endogenous P-glycoprotein-mediated biliary excretion (93) However the very small volume of distribution of CEL approximately equal to the volume of the central blood compartment suggests that the observed interference occurs in the central blood compartment This hypothesis was confirmed by studies recently published (9495) The main finding was a profound alteration of cellular partitioning and bloodplasma concentration ratio of paclitaxel in a CEL concentration-dependent manner as a result of an entrapment of the compound into micelles formed by CEL (96) Consequently the free drug fraction available for distribution was reduced This effect was also observed in the absence of plasma proteins pointing at contributing factors other than altered protein binding and increased affinity of paclitaxel for CEL-induced lipoprotein degradation products (8182)
10
For the purpose of finding out a potential paclitaxel delivery vehicle with an ideal profile the investigation of several delivery vehicles based on the chemical structures of CEL and Tween 80 led to alteration of blood distribution of paclitaxel in presence of all tested vehicles (97) Different formulation approaches such as liposomes and poloxamer-micelles affected the pharmacokinetics of paclitaxel in mice as compared to the CEL-containing formulation (98) In contrast paclitaxel administered in a solvent-free formulation in a clinical study showed a higher efficacy combined with reduced adverse effects compared to the drug delivered in a solution of CEL (99)
Overall numerous investigations have shown that CEL can play a pivotal role in the pharmacological behavior of the formulated drugs In addition several drug-drug interactions are reported on agents administered intravenously in conjunction with CEL-containing formulation of other compounds namely paclitaxel (100101102103) cyclosporin (104105106107) and valspodar (108109) Most likely the presence of CEL in drug formulations contributes to the observed pharmacokinetic interactions Indeed recent experiments revealed a substantial increase of plasma concentrations of cyclosporin after an additional injection of another drug preparation containing CEL (110)
152 Cyclodextrins
Cyclodextrins are ring-shaped oligosaccharides with a hydrophilic exterior and a hydrophobic interior (111) The interior cavity is capable of forming water-soluble complexes with many drugs Due to the rapid release of a drug from the complex after administration in vivo it is assumed that drug-cyclodextrin complexes do not affect the drug pharmacokinetics (112) However if the drug is slowly or incompletely released from the complex drug dosing as complexes in cyclodextrin can be critical
The binding of drugs to plasma proteins was influenced in vitro in the presence of β-cyclodextrin (113) and hydroxypropyl-β-cyclodextrin (HP-β-CyD) (114115) The intravenous administration of flurbiprofen in HP-β-CyD led to transient higher tissue concentrations in rats (114) Alterations in tissue distribution were also found for other drugs injected as cyclodextrin complexes either free in solution (116117) or included into liposomes (118) Following iv dosing in HP-β-CyD a higher amount of carbamazepine appeared in the urine compared to oral preparations (122) A similar trend was observed in dogs treated iv with either dexamethasone formulated in HP-β-CyD or as its phosphate prodrug (123) In addition cyclodextrins interacts with endogenous lipids such as lipoproteins (119120) and cholesterol (113121)
153 Tween 80
As mentioned above for CEL lipoprotein alteration induced by Tween 80 was observed (80) However this effect was not confirmed in a further study (85) In patients receiving Tween 80 co-administered with etoposide an increase of the volume of distribution and the clearance of doxorubicin was detected due to reduced plasma concentrations of doxorubicin during the early phase of the concentration-time profile (124) Lately changes in the bloodplasma ratio of paclitaxel were described in the presence of Tween 80 and other solubilizers structurally related to Tween 80 (97) More recently it was shown that Tween 80 has a concentration-dependent influence on the normal binding of docetaxel to serum proteins leading to changes in pharmacokinetics of docetaxel in vivo (125) although Tween 80 is
11
degradated rapidly by esterases in plasma (126) The mechanistic basis for altered plasma binding of docetaxel in the presence of Tween 80 still needs to be clarified
154 Other excipients
To date little is reported in the literature about the impact of Solutol HS 15 and Poloxamer 188 on blood distribution of drugs An interference between Solutol HS 15 and the co-administered ketochlorin photosensitizer C8KC was suggested by Woodburn (127) The similar half-lives of Solutol HS 15 and the sensitizer found in mice indicate the correlation of the persistence of C8KC in plasma with that of the vehicle Further recent plasma protein binding interaction studies demonstrated an apparent increase in the unbound fraction of propranolol in combination with Poloxamer 188 (128) Also the administration of compounds formulated in mixed micelles can alter the protein binding (129) Most notably compounds binding with high affinity but low capacity to α1-acid glycoprotein showed free fractions increased by 50 to 85 Moreover blood protein interactions can occur with dosing vehicles like liposomes (130) thereby affecting maybe the fate of co-administered drugs in blood and body (131)
155 Nanoparticles
Methyl methacrylate nanoparticles of 130 nm in size suspended in different concentrations (01-5) of Tween 80 or poloxamine 908 exhibited prolonged circulation time with altered tissue concentrations as compared to uncoated nanoparticles (132) Extended blood circulation time was also found for polystyrene nanoparticels (40-137 nm) coated with poloxamer 407 (133)
12
16 Objectives and specific aims
The main purpose of this thesis was to investigate in vitro drug-excipient interactions in blood and to assess the implications of the in vitro findings both for the in vivo situation and the formulation strategy Compounds in drug development at Novartis were chosen as model substances and dosed at concentrations ranging from sub-therapeutic to low pharmacological levels Excipients commonly used in formulations were selected including CEL HP-β-CyD Solutol PEG 200 and TPGS The following specific aims of the thesis were 1 To collect and use available compound information including physicochemical
properties and pharmacokinetics to select appropriate model substances with as many different properties as possible
2 To determine the hemolytic activity of selected excipients to rule out any changes of blood distribution caused by hemolysis
3 To explore in vitro possible effects of selected excipients in the blood with special emphasis on the blood distribution and plasma protein binding of model compounds
4 To identify the pharmacokinetic profile and tissue distribution of model compounds following single intravenous dosing in the presence and absence of selected excipients
5 To compare and relate pharmacokinetic outcomes to the in vitro findings thereby assessing the impact of in vitro data for the in vivo situation and evaluating the in vitro-in vivo correlation
6 To generate criteria for optimizing delivery vehicle selection in drug research that allow reducing drug-excipient interactions and leading to more rational and selective drug formulations
7 To propose an intravenous formulation strategy based on the data generated by this research project to provide better candidate-tailored formulations in drug development
13
2 Selection and experimental procedure
21 Excipients and model compounds
Investigations involved five excipients along with five pharmacologically active compounds exhibiting different properties
The excipients CEL HP-β-CyD Solutol and PEG 200 were selected based upon their common use in intravenous formulations and their diversity of molecular structure and solubilization technique (Figure 2-1 and Table 2-1) CEL and Solutol are surface-active agents which increase the drug solubility by incorporation of the drug into a micellar structure Whereas CEL exhibit a highly variable composition with the major hydrophobic component (~87) identified as oxyethylated triglycerides of ricinoleic acid (Figure 2-1) Solutol consists of ~70 lipophilic polyglycol mono- and di-esters of 12-hydroxystearic acid and ~30 hydrophilic polyethylene glycol HP-β-CyD is a cyclic (α-14)-linked oligosaccharide containing seven α-D-gluco-pyranose units (Figure 2-1) which form a relatively hydrophobic central cavity and a hydrophilic outer surface The inclusion of a drug within the inner core of the complexing agent and the interaction of the outer core with water render the complex soluble PEG 200 is often used as a cosolvent for improving solubility of preclinical compounds by interrupting the hydrogen structure of water (eg water exclusion) and lowering the dielectric constant of the solution Although TPGS is exclusively known in oral formulations it was chosen due to its chemical structure (benzyl ring) and drug interaction potential at the level of active transporters and metabolizing enzyme systems
Cremophor EL
H2C(CH
2CH
2O)xOCO(CH
2)7CH CHCH
2CHOH(CH
2)5CH
3
HC(CH2CH
2O)yOCO(CH
2)7CH CHCHCH
2CHOH(CH
2)5CH
3
H2C(CH
2CH
2O)zOCO(CH
2)7CH CHCH
2CHOH(CH
2)5CH
3
primary constituent with x + y + z ~35
Solutol HS 15
CH3
(CH2)5
CH (CH2)10
C O CH2
CH2
OHn
OH O
Polyethylene glycol 200
O
HOH
n
Hydroxypropyl-β-cyclodextrin
O
ROCH2
O
ROOH
n
glucopyranose with R=CH2CH2OH or H and n=7
Vitamin E TPGS
O
O C CH2
CH2
C O
O O
CH3
CH3
OH n
CH3
CH3
CH (CH2)3
CH3
CH (CH2)3
CH(CH2)3
n=20-22
Figure 2-1 Chemical structures of selected excipients
14
Table 2-1 Properties of selected excipients
Excipient name Type Solubilization Use in iv Biological activity
approach formulation
Cremophor EL Non-ionic Micelles Yes bull Dyslipidaemia (polyoxyethylene surfactant (developmental bull Inhibition of active castor oil derivatives) amp commercial) transporters MW ~3000 CMC ge009 mgmL Hydroxypropyl-β- Oligomeric Complexation Yes bull Lipid interactions cyclodextrin substance (developmental MW ~1600 amp commercial) Solutol HS 15 Non-ionic Micelles Yes bull Dyslipidaemia (polyethyleneglycol 660 surfactant (developmental bull Inhibition of active 12-hydroxystearate) amp commercial) transporters MW 960 bull Inhibition of cyto- CMC ge02 mgmL chrome enzymes Polyethylene glycol 200 Oligomeric Cosolvent Yes MW ~200 substance (change of (developmental solution amp commercial) polarity) Vitamin E TPGS Non-ionic Micelles No bull Inhibition of active (D-α-tocopheryl surfactant (oral use transporters polyethylene glycol 1000 developmental bull Inhibition of cyto- succinate) amp commercial) chrome enzymes MW ~1513 CMC ge02 mgmL CMC Critical micelle concentration MW Molecular weight Higher molecular weight PEGs such as PEG 300 and 400
Drug candidates in development at Novartis were chosen as model compounds
regarding aqueous solubility lipophilicity membrane permeability and blood cellplasma distribution (Figure 2-2 and Table 2-2) COM2 and COM1 (base) are lipophilic and poorly water-soluble PET ligands which are used in sub-therapeutic doses and COM2 distributes equally between plasma and whole blood COM3 is much better water-soluble and is mainly located in the cellular fraction in blood In contrast COM4 with a low lipophilicity penetrates hardly into blood cells and distributes poorly into tissues COM5 is a bigger molecule characterized by a high polar surface area many H-bond acceptors and a very low volume of distribution similar to that obtained for COM4
COM1 COM2 COM3 COM4 COM5
N
N
O
R1
R2
O
N
O
N
N
S
R1
R2
N
O
N
R
NN
R2
R1
N
NO
S O
NH
O
O
NH
OR1
R2
R3
Figure 2-2 Chemical structures of model compounds
15
Table 2-2 Properties of model compounds
Physicochemical (PC) and pharmacokinetic (PK) data available at the time of selecting model compounds for investigating drug-excipient interactions in blood
COM1 COM2 COM3 COM4 COM5
PET ligand PET ligand NCE NCE NCE
PC properties MW (gmol) 240 410 295 lt400 533 LogD 68 34 45 23 17 37 pKa 38 57 41 87 32 46 106 H2O solubility pH 68 (mgL) 20 lt25 4000 lt500 100 PSA (Aring2) 35 50 25 63 166 H-bond acceptors 3 5 3 4 12 H-bond donors 0 0 0 1 3 PK properties Species Mouse Rat Rat Rat In vitro Fraction in plasma () 45 20 ~100 80 Free in plasma () 12 24 11 In vivo Matrix Blood Blood Plasma Plasma t12 (h) 11 11 10 04 CL (mLminkg) 10 142 04 72 Vss (Lkg) 14 10 03 03 funchanged () 49 14 98 94 Main selection criteria bull Active bull Active bull Blood bull Blood bull MW principle principle distribution distribution bull Polarity bull H2O sol bull H2O sol bull Vss bull Vss (base) bull Lipophilicity funchanged Fraction of unchanged drug based on AUC ratio of parent drug and total radioactivity LogD Logarithm of octanol-water distribution coefficient MW Molecular weight NCE New chemical entity pKa Negative logarithm of dissociation constant PSA Polar surface area CL Drug clearance t12 Main elimination half-life Vss Volume of distribution under steady-state conditions
22 Experimental setup
The effect of excipients on pharmacokinetic parameters was examined in rats except for COM2 which was investigated in mice due to available animal models appropriate to analyze drug target interactions if required Model compounds were used in their clinically relevant blood range as follows sub-therapeutic (lt5 ngmL) for COM1 and COM2 low-therapeutic (5-50 ngmL) for COM3 and therapeutic (gt50 ngmL) for COM4 and COM5 because of low distribution volumes to assure detectable tissue concentrations To allow in vitro and in vivo study comparisons the amount of excipient in blood was set at ~05 which is within the range after an iv bolus injection in mice and rats
Blood distribution and protein binding studies were done in vitro using model compounds in the appropriate concentration range with and without selected excipients fixed at 05 in the test system Since COM4 is almost completely located in the plasma fraction in blood (FP ~100) independent of the concentration (10-10rsquo000 ngmL) (149) the concentration of COM4 was kept constant (100 ngmL) whereas the excipient amount was varied between 001-1 Compounds formulated as excipient-free solution in glucose 5 or saline served as reference The excipient with the most prominent effect compared to the reference was selected for the in vivo
16
study where animals received intravenously a single dose as a control formulation or solution containing the selected excipient Control formulation were based on glucose 5 (COM1 COM3) saline (COM4 COM5) or blank plasma (COM2) To assure a fast and complete solubility of COM3 and COM5 in the control formulation convenient excipients were added with in vitro binding parameters similar to those obtained for the in vitro reference The concentration of model compounds in blood plasma and tissue were measured until 1 h after iv administration thereby including the scanning time of PET ligands Moreover it is assumed if excipient-induced changes occur they should be detectable in this time period
17
3 Materials and methods
31 Chemicals
COM1 and COM2 were supplied by the Neuroscience Research Department of Novartis (Basel Switzerland) COM3 was obtained from the Novartis Institutes for BioMedical Research (Basel Switzerland) 3H-radiolabeled COM1 (specific activity 11780 MBqmg gt99) COM2 (specific activity 2320 MBqmg gt98) and COM3 (base specific activity 311 MBqmg gt98) were provided by the Isotope Laboratories of Novartis (Basel Switzerland) 14C-radiolabeled COM3 used for investigation of renal excretion (2middotHCl salt specific activity 587 MBqmg gt98) COM4 (specific activity 585 MBqmg gt98) and COM5 (specific activity 33 MBqmg gt98) were provided by the Isotope Laboratories of Novartis (Basel Switzerland)
The excipients purchased by the Pharmaceutical and Analytical Development Department of Novartis (Basel Switzerland) were Cremophor EL (CEL BASF) hydroxypropyl-β-cyclodextrin (HP-β-CyD CERESTAR USA Inc) polyethylene glycol 200 (PEG 200 Fluka) Solutol HS 15 (Solutol BASF) and D-α-tocopheryl polyethylene glycol 1000 succinate (TPGS Eastman) All other chemicals and reagents were of analytical grade or will be described separately in the methods section
32 Blood and plasma sources
Fresh blood was obtained from healthy male species (nge3) as follows mice (albino OF1 Charles River Laboratories LrsquoArbresle France) rats (Wistar HAN IGS Charles River Laboratories Sulzfeld Germany) dogs (Marshall beagles Marshall Farm NY USA and Harlan France SARL Gannat France) and humans (drug-free blood donors Blutspendezentrum SRK Basel Switzerland) Pooled plasma (nge3) was defrosted from storage at -20degC Lithium heparin was used as an anticoagulant for all species
33 In vitro studies
Test compounds in the in vitro samples excluding protein binding samples of COM2 were quantified by LSC due to no major degradation (gt95) under investigated conditions (146147148149150) Protein binding samples of COM2 were quantified by LC-RID due to instability after longer incubation (gt2 h) and very low fraction unbound in plasma (lt2)
331 Preparation of test solutions
For in vitro blood distribution and protein binding studies test solutions were prepared by dissolving the radiolabeled test compound in ethanol Ethanol was evaporated and the residue was reconstituted in the appropriate formulation namely excipient-free solution as control (saline or glucose 5) and solutions containing CELEtOH 6535 (vv) CEL HP-β-CyD Solutol PEG 200 and TPGS Final compound concentrations in blood or plasma were 006-6 ngmL (COM1) 001-100 ngmL (COM2) 5-500 ngmL (COM3) 100 ngmL (COM4) and
18
10-300 ngmL (COM5) Excipient concentrations were kept constant at 05 in the test system except for COM1 (05-5 due to no alterations at 05) and COM4 (001-1 due to its plasma fraction see 22)
332 Hemolytic activity
The hemolytic activity of the excipients was assayed using a spectrophotometric method CELEtOH 6535 (vv) EtOH HP-β-CyD PEG 200 Solutol and TPGS were added to the appropriate volume of freshly prepared heparinised whole blood to obtain a final excipient concentration of 05 To avoid hemolysis due to higher concentrations during the adding the blood was partially centrifuged and the excipient was pipetted in the cell-free layer By tapping the test tubes the samples were immediately mixed Two control tubes were prepared one for spontaneous hemolysis (pure blood used as the reaction blank) and another for 100 hemolysis (total cell lysis induced by sodium dodecyl sulfate at a final blood concentration of 1) Samples were incubated at 37degC At certain points of time aliquots were removed and centrifuged for 10 min at 3100 x g (37degC) to obtain plasma The absorbance of hemoglobin in the supernatant (dilution with water 1200) was measured at 405 nm (Emax precision microplate reader Bucher Biotech Basel Switzerland) The degree of hemolysis due to the excipient activity was calculated according to
100()0100
0times
minus
minus
=
AA
AAHemoylsis e
where Ae is the absorbance of hemoglobin in the supernatant after incubation with excipient A0 is the absorbance of hemoglobin in the supernatant of the reaction blank and A100 is the absorbance of hemoglobin in the supernatant after total cell lysis with sodium dodecyl sulfate Hemolytic activity was considered to have started when mean values were greater than 2 of hemolysis
333 Blood distribution
Freshly prepared heparinised blood was used and experiments were performed in triplicate both in the presence and absence of excipients The hematocrit was determined using a hematocrit centrifuge and a hematocrit reader (Haemofuge Heraeus Sepatech Germany) In order to reduce hemolysis blood aliquots (1 mL) were partially centrifuged (500 x g for 2 min) before adding the test solution in the cell-free layer followed by mixing immediately Samples were incubated at 37degC Time aliquots (1 mL) were removed and prepared for measuring radioactivity of the test compound in whole blood before centrifugation and in plasma after centrifugation for 10 min at 3100 x g (37degC) by LSC
The fraction of the test compound in plasma (FP) was calculated according to
100)1(
() times
minustimes
=
B
P
PC
HCF
where CB and CP are the drug concentration in blood and plasma respectively and H is the hematocrit value The concentration in blood cells (CBC) was calculated as follows
19
H
HCCC PB
BC
)1( minustimesminus=
and used for calculations of blood cell to plasma concentration ratio (BCPR CBCCP) and blood cell to unbound in plasma concentration ratio (ρ CBC(CPfu)) fu is the drug fraction unbound in plasma determined by the appropriate protein binding method for each compound
334 Plasma protein binding
Control experiments in phosphate buffered saline (PBS Gibco Paisley Scotland) were carried out to assess the suitability of the methods described below for each test compound in the following order ultrafiltration gt dialysis gt ultracentrifugation with ultrafiltration being the first procedure Control experiments indicated that ultrafiltration is a suitable method for COM1 COM3 COM4 and COM5 (free-permeation gt075 recovery gt85) and ultracentrifugation for COM2 (no sedimentation after 6-h centrifugation recovery gt85 ultrafiltration and dialysis showed insufficient recovery and free-permeation) Therefore protein binding was determined by the ultrafiltration technique (COM1 COM3 COM4 and COM5) or the ultracentrifugation technique (COM2)
Ultrafiltration
Samples of spiked plasma were incubated at 37degC until binding equilibrium Aliquots of 1 mL were introduced in prewarmed (37degC) Centrifree micropartition tubes (Amicon Inc Beverly MA USA) and centrifuged for 10 min at 2000 x g (37degC) For the determination of the unbound drug fraction in plasma concentrations of the test compound in ultrafiltrate and plasma were measured The unbound fraction in plasma (fu) was calculated as follows fu()=(CUFCP)x100 where CUF and CP are the drug concentration in ultrafiltrate and in plasma respectively
Equilibrium dialysis
Test solution was added to plasma followed by mixing Dialysis was carried out with 150 microL of this sample against an equal volume of phosphate-buffered saline (pH 72) in a 96-well micro-equilibrium dialysis block (HTDialysis LLC Gales Ferry CT USA) Dialysis membranes with a 12000-14000 molecular weight cut-off were soaked in phosphate buffered saline (pH 72) before use After establishment of the equilibrium buffer solution aliquots containing only unbound drug and plasma aliquots containing both bound and unbound drug were analyzed for the test compound The ratio of drug concentrations measured in the buffer and plasma after dialysis was taken as an estimate of unbound drug fraction in plasma
Ultracentrifugation
Samples of spiked plasma were incubated at 37degC until binding equilibrium Aliquots of 1 mL were transferred to polycarbonate centrifuge tubes (Beckman) and either centrifuged in a TLA 1002 rotor in Beckman TL 100 centrifuge (200000 x g 6 h 37degC) or incubated for 6 h (37degC) After centrifugation samples were separated into three layers according to density A 80-microL aliquot of the middle layer (protein-free partplasma water) was taken and analyzed for the test compound representing the unbound concentration in plasma (CU) Total plasma concentration (CP) was
20
determined in incubated samples The unbound drug fraction in plasma was calculated using CUCP
Determination of major binding protein
The affinity of test compounds to different plasma proteins was determined using the appropriate method for each compound Purified human plasma proteins were dissolved in phosphate buffered saline (PBS Gibco Paisley Scotland) at physiological concentrations as follows albumin 40 gL (ge96 Sigma) α-acid glycoprotein 1 gL (from Cohn Fraction VI 99 Sigma) γ-globulins 12 gL (from Cohn Fraction II and III Sigma) high density lipoprotein 39 gL (gt95 Calbiochem) low density lipoprotein 36 gL (gt95 Calbiochem) and very low density lipoprotein 13 gL (gt95 Calbiochem) Test solution was added to protein solutions to obtain a compound concentration of 10 ngmL (COM1 COM2) or 1000 ngmL (COM3 COM4 COM5) After incubation at 37degC separation of bound and unbound compound was achieved according methods Ultrafiltration was performed by centrifugation for 10 min for samples containing albumin and γ-globulins and for 2 min for all other samples
335 Determination of protein concentration
Protein concentration was measured by the method of Bradford (Coomassie blue protein assay) at 595 nm by using a Bio-Rad protein assay (Bio-Rad Laboratories Muumlnchen Germany) The protein concentration was determined by using a calibration curve that was established with known concentrations of human serum albumin (ge96 Sigma) ranging from 0 to 05 mgmL 10-microL aliquots of plasma (1200 dilution) and plasma water were pipetted into microtiter plate wells 200 microL dye reagent were added and samples were mixed After 1-h incubation at room temperature absorbance was measured
34 In vivo studies
Samples collected after intravenous administration of COM1 COM2 and COM3 were assayed for radioactivity by LSC and parent drug by LC-RID COM4 and COM5 were quantified in all in vivo samples only by radioactivity measurements (LSC) since the radioactivity of both radiolabeled compounds reflects well the parent drug due to no major degradation at 1 h after intravenous administration in rats (151152)
341 Experimental animals
Male Wistar rats (~250 g) and male OF1 mice (~30 g) were obtained from Charles River (Sulzfeld Germany) All animals were housed in standard cages in a controlled environment maintained on an automatic 12-h lighting cycle at a temperature of 22degC according to institutional guidelines The animals were given a standard chow and water ad libitum The animals were used after having been starved overnight
342 Drug administration and sample collection
All dosing solutions were prepared within 1 h prior to injection and stored at room temperature until use Administration was performed by a single bolus injection into the femoral vein after animals had been lightly anesthetized by isoflurane (Forenereg) Rats received [3H]COM1 at 4 microgkg as solution (1 mLkg) in glucose 5 containing
21
ethanol 1 (vv) or TPGS 20 (wv) Mice were injected a dose of 400 ngkg of [3H]COM2 formulated as solution (5 mLkg) in blank plasma (obtained by centrifugation of freshly drawn mouse blood) or in glucose 5 containing TPGS 10 (wv) An iv dose of 1 micromolkg radiolabeled COM3 (3H 300 microgkg 14C 370 microgkg) in EtOHPEG200Glu 5590 (vvv) or 40 HP-β-CyD (wv) was injected to rats (1 mLkg) [14C]COM4 was administered at 400 microgkg in saline or 17 CEL (vv) to rats (2 mLkg) [14C]COM5 at 1 mgkg in saline containing either ethanol 10 (vv) or 17 Solutol (wv) were injected to rats (2 mLkg)
Using these injection preparations excipient concentrations in blood may be estimated as about 03 (COM1) 05 (COM3 COM4 COM5) and 07 (COM2) in animals (~70 mL bloodkg) These concentrations were similar to those used in the in vitro experiments
Samples were collected after drug administration at 008 025 and 05 h for COM1 and at 008 025 05 and 1 h for COM2 COM3 COM4 and COM5 Animals (n=3 per time point) were sacrificed by isoflurane inhalation for sample collection Blood samples were collected from the vena cava and transferred into tubes containing heparin (heparin-Na BBraun) as anticoagulant Plasma samples were obtained by immediate centrifugation of blood samples at 3000 x g for 10 min Tissues were excised blotted dry and weighed Collected tissue comprised lung heart liver kidney fat muscle skin and brain for COM1 COM2 COM3 and lung muscle and skin for COM4 and brain muscle and skin for COM5 All samples were immediately frozen and stored at -20degC until analysis Tissue samples were homogenized before quantification
343 Bladder catheterization and urine collection
The experiment was performed in situ under anesthetized rats Animals (n=3formulation) received im injections of ketamine hydrochloride at a dose of 50 mgkg (100 mgmL 05 mLkg) and are positioned on an isothermal heating pad prewarmed at 38degC The abdomen was opened through a mid-line incision A polyethylene tubing (Clay-Adams PE-50) was inserted into the dome of the bladder and held in place with a purse string suture The formulation was injected into the surgically exposed femoral vein and urine was collected at 05 1 15 and 2 h after dosing All samples were frozen and stored at -20degC until analysis
344 Ex vivo protein binding
Ex vivo protein binding was determined for COM1 COM3 COM4 and COM5 according to the in vitro procedure Briefly remaining plasma samples of each time point were pooled and the unbound drug concentration in plasma was quantified using the ultrafiltration technique (see 334) After centrifugation plasma and ultrafiltrate samples were assayed for radioactivity by LSC and parent drug by LC-RID
35 Measurement of the radioactivity
Aliquots of blood plasma urine (25-50 microL) and homogenates (250 microL) were introduced into counting vials and solubilized in Biolute-S (Zinsser Analytic) Samples obtained from in vivo studies containing tritium-labeled drug were dried and the residue was reconstituted in water before solubilization To the blood samples
22
hydrogen peroxide 30 was additionally added and vials were gently swirled for several seconds and let stand for 30 min After adjusting pH gt7 by addition of hydrochloric acid 2 N the vials were filled with scintillation cocktail (Irgasafe Plus Zinsser Analytic) kept in the dark for 16 h and measured in a Tri-Carb liquid scintillation spectrometer Model A2200 (Packard)
36 Determination of parent drug 3H-radiolabeled COM1 COM2 and COM3 were determined by a liquid
chromatography-reverse isotope dilution method (LC-RID) A sample aliquot (100-500 microL) and 200 microL water containing 5 microg (COM1 COM3) or 2 microg (COM2) non-radiolabeled test compound as internal standard was added to a glass tube After further addition of 1 mL water 100 microL Titrisol buffer (pH 4 COM1 COM2 pH 7 COM3) and 4 mL diethyl ether (COM1 COM2) or tert-butylmethylether (COM3) tubes were shaken for 30 min and centrifuged (3300 x g for 10 min) The organic layer was collected in another glass tube and evaporated in a vacuum centrifuge (Univapo 150H UniEquip Martinsried Germany) The residue was taken up in 250 microL of mobile phase-water (8020 vv) and 75 microL n-hexane and the mixture was transferred in an auto sampler glass vial After centrifugation (13000 x g for 2 min) the hexane layer was discarded and 200 microL of the remainder was injected into the HPLC system equipped with a Supelcosil LC-18 column (5 microm 46 mm x 150 mm) for COM1 or Waters XTerra RP 8 column (5 microm 39 x 150 mm) for COM2 and COM3 The column temperature was 40degC and the absorbance was detected at a wavelength of 312 nm (COM1) 441 nm (COM2) or 261 nm (COM3) The mobile phase (isocratic gradient) consisted of ammonium acetate 10 mM-acetonitrile (4555 COM1 5050 COM2) or ammonium acetate 10 mM-triethylamine 01 in acetonitrile (5842 COM3) and was pumped at a rate of 10 mLmin The peak corresponding to the unchanged compound was collected in a polyethylene vial by a fraction collector (Pharmacia LKB SuperFrac) and analyzed for radioactivity Concentrations of the test compound in samples were calculated from the ratio of the amount of radioactivity in the eluted fraction and the area of the absorbance of the non-radiolabeled test compound used as internal standard
37 Data analysis
Total radioactivity concentrations expressed as ng-eqmL or ng-eqg were estimated by dividing the radioactivity concentration in samples by the specific radioactivity of administered test compound using Microsoft Excel Concentrations of parent drug were determined by the principle of reverse isotope dilution using following equation in Microsoft Excel
ID
AD
IS
AS
A
A
A
A=
where AAS is the amount of analyte in the sample (unknown to be determined) AIS is the amount of internal standard added to the sample AAD is the amount of analyte detected and AID is the amount of internal standard detected AAD was calculated using R(SRxS) where R is the amount of radioactivity determined in the peak fraction SR is the specific radioactivity and S is the slope The amount of internal standard detected was calculated as AID=AreaRF-AAD where RF is the response factor (Areang) The level of quantification (LOQ) was set to 75 dpm LOQs of
23
radioactivity and test compound in blood plasma urine and tissues were calculated by dividing 75 dpm by the specific radioactivity of the administered test compound and by the sample amount P values were calculated with a two-sample t-test in Microsoft Excel assuming unequal variances The level of significance was set at P lt005
38 Pharmacokinetic analysis
Pharmacokinetic parameters were estimated as follows The area under the drug concentration-time curve (AUC) was determined by the linear trapezoidal rule using the mean data points The half-life (t12) was calculated using ln2k where k is the rate constant k was estimated by the slope of the regression line plotted through the three final data points of the semilogarithmic AUC taking into consideration a square of correlation coefficient of RSQ gt090 Volume of distribution (V0) was calculated by dividing the dose by the concentration at time zero (C0) C0 was obtained by extrapolation to zero time of the concentration-time plot in semilogarithmic scale
24
4 Results and discussions
41 Hemolytic activity of excipients
In vitro results
CELEtOH 6535 EtOH HP-β-CyD PEG 200 and Solutol did not induce hemolysis in dog and human blood at 05 and a contact time of 4 h (data not shown) In contrast TPGS at 05 incubated with blood of various species caused hemolysis in a time-dependent manner (Figure 4-1) Erythrocytes from rat and human were more sensitive than those of mouse and dog indicated by cell lysis at shorter contact times Reducing the TPGS concentration from 05 to 01 induced no hemolysis in all four species in the investigated time range (data not shown)
010
2030
4050
6070
1 h 2 h 4 h 6 h
Incubation time
Hem
oly
sis
(
)
Rat
Mouse
Dog
Human
Figure 4-1 Effect of incubation time on the hemolytic activity of TPGS
Induced hemolysis by 05 TPGS in blood of various species (n=3 mean plusmn SD) Hemolysis in rat blood after 6-h incubation was not determined
Discussion
Except for TPGS all tested excipients (CEL EtOH HP-β-CyD Solutol and PEG 200) were non-hemolytic which is consistent with data reported in the literature (134135136137138) and the fact that they are widely used in commercially available parenteralia (54) TPGS at 05 exhibited marked hemolysis after longer contact time (gt1 h) whereas TPGS at 01 showed no hemolysis under equal incubation conditions The detected hemolysis might possibly result not mainly from TPGS but from metabolites namely α-tocopheryl succinate and polyethylene glycols both being able to destruct erythrocytes (134139140) This phenomena could contribute to the extensively delayed onset of hemolysis For the investigations TPGS at 05 was used in the non-hemolytic time range
25
42 Impact of the hematocrit on blood partition parameters
In vitro results
Whole blood derived from three species was incubated with COM2 (100 ngmL) at varying hematocrit values Concentrations of COM2 in blood and plasma were measured at equilibrium and partition parameters calculated from these data are summarized in Table 4-1 Concentrations in blood plasma and blood cells remained unaffected by the hematocrit value (040-060) The partition parameter BPR was also similar over the investigated hematocrit range whereas BCPR changed slightly and FP distinctly both decreasing by increasing the hematocrit from 040 to 060
Table 4-1 Effect of hematocrit on the in vitro blood distribution of COM2
Blood cell concentrations and partition parameters (FP BPR and BCPR) derived from [3H]COM2 concentrations measured in blood and plasma using same blood pools at different hematocrit values (n=3 mean plusmn SD)
Species Hematocrit Concentration (ngmL) FP BPR BCPR
Blood Plasma Blood cells () Mouse 040 50 plusmn 1 121 plusmn 003 152 plusmn 007 045 46 plusmn 2 120 plusmn 006 144 plusmn 013 050 101 plusmn 3 87 plusmn 4 116 plusmn 8 43 plusmn 0 116 plusmn 001 132 plusmn 001 055 40 plusmn 1 113 plusmn 004 123 plusmn 006 060 36 plusmn 1 112 plusmn 003 119 plusmn 005 Dog 040 48 plusmn 2 126 plusmn 006 166 plusmn 014 045 44 plusmn 1 125 plusmn 004 157 plusmn 009 050 109 plusmn 4 90 plusmn 2 131 plusmn 15 41 plusmn 1 125 plusmn 003 151 plusmn 005 055 38 plusmn 1 119 plusmn 003 135 plusmn 006 060 35 plusmn 1 113 plusmn 002 122 plusmn 003 Human 040 70 plusmn 3 086 plusmn 003 066 plusmn 008 045 65 plusmn 2 084 plusmn 003 065 plusmn 007 050 101 plusmn 5 125 plusmn 10 78 plusmn 6 63 plusmn 2 080 plusmn 003 060 plusmn 006 055 55 plusmn 2 082 plusmn 003 068 plusmn 006 060 55 plusmn 1 073 plusmn 002 055 plusmn 003
Discussion
The in vitro method for investigating distribution of drugs in blood commonly uses whole blood freshly prepared and pooled Drug concentrations in blood and plasma are determined Based on these data further partition parameters including CBC FP BPR and BCPR can be estimated but they are partially dependent on the hematocrit Therefore it is important to know how the hematocrit affects these parameters thereby providing useful information for comparing results With this in mind present experiments were performed over the entire physiological hematocrit range in blood pools of three different species (mouse dog and human) COM2 was used as test compound due to sufficient availability
The rank order of hematocrit influences was FP gt BCPR gt BPR gt CB asymp CP asymp CBC with most pronounced changes for FP and none for CBCPCBC Parameters calculated from concentrations measured in samples decreased constantly with increasing the hematocrit (040-060) which was most distinct for FP But within a hematocrit variation of 005 none of the parameters was dependent on the
26
hematocrit Consequently blood partition data obtained from in vitro experiments with similar hematocrits are consistent and can be compared together For data comparison across studies hematocrit adjusting to values of previous studies is suggested taking into consideration a difference of le005 between the lowest and highest value
43 Major binding proteins of model compounds
In vitro results
Figure 4-2 illustrates the qualitative binding of model compounds to isolated proteins compared to the total fraction bound in plasma The following ranking was obtained with regard to decreasing order of protein binding
COM1 albumin gt α1-acid glycoprotein gt γ-globulins asymp lipoproteins COM2 albumin gt lipoproteins gt γ-globulins gtgt α1-acid glycoprotein COM3 α1-acid glycoprotein gt albumin gt γ-globulins gtgt lipoproteins COM4 albumin gt α1-acid glycoprotein gtgt γ-globulins asymp lipoproteins COM5 albumin asymp α1-acid glycoprotein gtgt γ-globulins asymp lipoproteins
0
10
20
30
40
50
60
70
80
90
100
COM1 COM2 COM3 COM4 COM5
Bo
un
d f
racti
on
(
)
Plasma Albumin AGP γ-globulins HDL LDL VLDL
Figure 4-2 Qualitative differences in protein binding patterns of model compounds in vitro
Total protein-bound fraction of compounds in human plasma compared to the qualitative extent of compound binding to various isolated human proteins (albumin AGP γ-globulins and lipoproteins such as HDL LDL and VLDL) Each bar represents mean plusmn SD (n=3)
Discussion
In vitro experiments showed the binding of model compounds with different degrees to the three major drug-binding proteins in plasma (albumin α1-acid glycoprotein lipoproteins) A high binding to albumin (A) and α1-acid glycoprotein (AGP) was found for COM1 and COM4 (AgtAGP) COM5 (AasympAGP) and COM3 (AltAGP) In contrast COM2 was highly bound to albumin and lipoproteins
27
44 The impact of Vitamin E TPGS on COM1 in rat
In vitro results
The equilibrium of COM1 between plasma and blood cells was reached within few minutes (lt5 min data not shown) and the fraction of COM1 distributed in plasma (~75) was independent of initial blood concentrations of COM1 (006-6 ngmL) and of excipients at 05 (Table 4-2) Enhancing the excipient concentration to 5 in blood resulted in decreased COM1 in blood cells especially in the presence of TPGS (Table 4-2) In plasma COM1 was highly protein bound with high contribution of albumin and α1-acid glycoprotein in binding (Figure 4-2) and a lower free fraction was found for COM1 in TPGS at 5 (Table 4-2) TPGS was taken for the in vivo study due to the most pronounced changes observed in the in vitro experiments
Table 4-2 Effect of excipients on blood distribution and protein binding of COM1 in vitro
Partition parameters of [3H]COM1 at 006-6 ngmL obtained at equilibrium after incubation with and without excipients in rat blood (pH 74 H 046 plusmn 003 n ge3 mean plusmn SD)
Excipient FP BPR BCPR fu ρ
() () ()
None 728 plusmn 22 071 plusmn 002 041 plusmn 004 41 plusmn 02 99 plusmn 1 HP-β-CyD 05 798 plusmn 17 065 plusmn 001 027 plusmn 002 nd nd 5 882 plusmn 24 063 plusmn 002 017 plusmn 004 nd nd Solutol 05 702 plusmn 24 073 plusmn 001 043 plusmn 001 nd nd 5 878 plusmn 23 064 plusmn 001 018 plusmn 002 nd nd TPGS 05 802 plusmn 24 064 plusmn 001 026 plusmn 001 39 plusmn 07 66 plusmn 03 5 956 plusmn 20 063 plusmn 001 008 plusmn 003 17 plusmn 03 53 plusmn 15
In vivo results
In contrast to the control group where a dose of 4 microgkg was applied COM1 was administered in the TPGS group at 27 microgkg due to little compound availability Data presented within this section are normalized to a dose of 1 microgkg
Independent of the formulation plasma levels declined very rapidly with an apparent half-life of 017 h and COM1 was rapidly metabolized (lt30 unchanged COM1 in plasma at 008 h post-dose) Metabolites were fast eliminated from body indicated by a low recovery of administered COM1 shortly after dosing (lt30 of administered dose recovered at 008 h post-dose)
Upon intravenous administration of COM1 as a TPGS-containing solution lower total plasma concentrations combined with an increase of COM1 unbound in plasma by 50 were found in contrast to the control group (Table 4-3 Figure 4-3) However free drug concentrations in plasma did not differ between both groups resulting in similar AUCs (Table 4-3) This is in line with identical tissue concentrations observed in both groups (data not shown) since only the unbound drug is supposed to pass across membranes Furthermore COM1 in TPGS led to a lower fraction of parent drug in plasma (funchanged Table 4-3) and higher metabolite-related concentrations in plasma (2-fold increase Figure 4-3) indicating alterations in the kinetic profile of metabolites
28
Table 4-3 Comparative plasma kinetics of COM1 with and without TPGS
Plasma concentrations and pharmacokinetic parameters of [3H]COM1 administered intravenously in formulations based on glucose 5 (control) or TPGS 20 to rats (LOQ=2 pgmL n=3 mean plusmn SD) Data are normalized to a dose of 1 microgkg AUC(u)008-05h relates to area under unbound drug plasma concentration-time curve
Time Control TPGS
(h) COM1 in plasma (pgmL) Percentage of control value
008 184 plusmn 77 110 plusmn 6 60 025 59 plusmn 13 39 plusmn 6 66 05 32 plusmn 11 20 plusmn 6 62 C0 (pgmL) 215 132 AUC008-05h (pgmiddotmL
-1middoth) 32 20
AUC(u)008-05h (pgmiddotmL-1
middoth) 067 076 t12 (h) 017 017 funchanged () 187 55 fu () 21 plusmn 01 38 plusmn 03
Parent drug Metabolites
10
100
1000
0 025 05
Time (h)
CO
M1
(p
gm
L)
100
1000
10000
0 025 05
Time (h)
Rad
ioacti
vit
y (
pg
-eq
mL
)
Figure 4-3 Influence of TPGS on the systemic exposure of COM1 and metabolites
Plasma concentration-time profiles of parent drug and metabolite-related radioactivity of [3H]COM1 after intravenous administration to rats COM1 was injected in glucose 5 (closed symbols black line) or TPGS 20 (open symbols dashed line) Data shown are normalized to a dose of 1 microgkg and symbols represent single values and lines mean values (n=3) Values of metabolite-related radioactivity were obtained by subtracting concentrations of parent drug from concentrations of total radioactivity
Discussion
Drug-excipient interaction studies showed no direct correlation between the in vitro results and the in vivo situation in rats Upon intravenous administration of COM1 in TPGS slightly lower plasma concentrations and binding to plasma proteins were observed in animals as compared to those received COM1 in a TPGS-free solution In contrast to these in vivo findings COM1 displayed in vitro no alterations in the presence of TPGS at 05 whereas a higher TPGS concentration (5) led to
29
enhanced distribution into plasma and a higher fraction bound in plasma Furthermore very rapid metabolism and elimination of COM1 under in vivo conditions contributed to a pharmacokinetic profile inappropriate for studying drug-excipient interactions
45 The impact of Vitamin E TPGS on COM2 in mouse
In vitro results
To assess whether the ultracentrifugation time could be shortened for minimizing the degradation of COM2 in plasma (147) blank plasma samples were centrifuged and time aliquots were analyzed for total protein concentrations in plasma and plasma water After 4-h centrifugation protein levels in the plasma water section were below 005 ngmL corresponding to ~01 of total plasma proteins adequate to assure a sufficient separation of plasma water and proteins Therefore samples were collected after 4-h centrifugation for analysis
COM2 (001-100 ngmL) distributed almost equally between whole blood and plasma (FP ~45) and was very highly bound to plasma proteins (gt98 mainly to albumin and lipoproteins) (Figure 4-2) The plasma fraction (63) was enhanced for COM2 in TPGS at the beginning (lt1-h incubation) followed by equalization to excipient-free incubations (Table 4-4 Figure 4-4) The presence of TPGS reduced also the free fraction in plasma by 30 (Table 4-4) Finally TPGS was selected for the in vivo study because of the most pronounced drug-excipient interactions detected in vitro
Table 4-4 Effect of excipients on blood distribution and protein binding of COM2 in vitro
Partition parameters of [3H]COM2 at 01 ngmL obtained at equilibrium after incubation with and without excipients (05) in mouse blood (pH 73 H 045 nge3 mean plusmn SD)
Excipient Time FP BPR BCPR fu ρ
(h) () ()
None 008 406 plusmn 07 136 plusmn 002 179 plusmn 005 102 plusmn 3 1 448 plusmn 24 123 plusmn 007 151 plusmn 015
176 plusmn 003 86 plusmn 8
CELEtOH 6535(vv) 008 455 plusmn 14 121 plusmn 004 146 plusmn 009 nd 1 438 plusmn 03 125 plusmn 001 157 plusmn 002
nd nd
HP-β-CyD 008 472 plusmn 14 117 plusmn 009 138 plusmn 019 nd 1 494 plusmn 16 111 plusmn 004 125 plusmn 008
nd nd
Solutol 008 468 plusmn 11 118 plusmn 003 139 plusmn 006 nd 1 472 plusmn 16 117 plusmn 004 137 plusmn 009
nd nd
PEG 200 008 425 plusmn 13 129 plusmn 004 165 plusmn 009 nd 1 418 plusmn 20 132 plusmn 006 171 plusmn 014
nd nd
TPGS 008 629 plusmn 23 087 plusmn 003 072 plusmn 007 58 plusmn 7 1 533 plusmn 07 103 plusmn 001 107 plusmn 003
122 plusmn 012 88 plusmn 3
30
(a)
00
05
10
15
008 h 1 h
BP
R(b)
00
05
10
15
20
008 h 1 h
BC
PR
(c)
0
20
40
60
80
100
008 h 1 h
ρ
Figure 4-4 TPGS-mediated alteration of COM2 distribution in blood
Blood-plasma (a) blood cell-plasma (b) and blood cell-unbound in plasma (c) concentration ratios of [3H]COM2 at 01 ngmL in the presence (white bars) and absence (black bars) of TGPS (05) after 008-h and 1-h incubation in mouse blood (pH 73 H 045 nge3 mean plusmn SD)
In vivo results
In a previous study (153) the disposition kinetics of COM2 was evaluated in mice after iv administration in a solution containing HP-β-CyD 10 (5 mLkg) To enable a comparison of former data with those in the current investigation for internal purposes only COM2 was injected at a volume of 5 mLkg dissolved in plasma or TPGS 10 The blood concentration of TPGS from this injection preparation was estimated as ~07 assuming a blood volume of 72 mLkg Thus the amount of TPGS in blood was higher in vivo compared to the amount used in vitro (05)
The administration of COM2 as TPGS-containing solution at the same dosage caused approximately 2-fold higher plasma concentrations as compared to COM2 formulated in plasma (control) (Table 4-5 Figure 4-5) These findings are in line with data obtained in blood distribution studies in vitro where partitioning into blood cells was reduced in the presence of TPGS resulting in a higher concentration in plasma at the same total blood concentration Furthermore in vivo a higher plasma exposure to metabolites and a slower elimination of metabolites from the systemic circulation were found for COM2 in TPGS indicated by 4-fold increased AUC and t12 of metabolite-related radioactivity in plasma (Table 4-6) Determination of unbound COM2 in plasma could not be performed on samples from mice due to concentrations below LOQ (3 pgmL)
No differences in tissue concentrations were observed between both groups although COM2 in TPGS resulted in a decrease of V0 (Table 4-5) and KP (Table 4-7) both suggesting altered tissue distribution and being in line with higher drug accumulation in the circulation Because the free drug fraction in plasma generally reflects more accurately distribution processes due to the ability of unbound drugs to pass through membranes and then reach the target organ the free drug fraction determined in vitro was considered Calculated tissue-unbound in plasma concentration ratios KP(u) were reduced in the TPGS group only within the first minutes after drug administration (Table 4-7)
31
Table 4-5 Comparative plasma kinetics of COM2 with and without TPGS
Plasma concentrations (a) and pharmacokinetic parameters (b) of [3H]COM2 after iv dosing at 400 ngkg in formulations based on blank plasma (control) or TPGS to mice (LOQ=3 pgmL n=3 mean plusmn SD) significantly different from the control at Plt005 and 001 respectively
(a)
Time COM2 in plasma (pgmL)
(h) Control TPGS Percentage of control value
008 104 plusmn 11 247 plusmn 23 238 025 81 plusmn 12 159 plusmn 16 196 05 59 plusmn 2 124 plusmn 17 210 1 34 plusmn 7 80 plusmn 17 235
(b)
Parameter Unit Formulation
Blank plasma TPGS 10 Body weight kg 0028 0027 Dose ng 110 107 C0 pgmL 111 237 tfrac12 h 057 061 V0 Lkg 36 17 AUC008-1h pgmiddotmL-1middoth 56 121 DoseAUC008-1h mLh 196 89 funchanged 54 35
Parent drug Metabolites
10
100
1000
0 025 05 075 1
Time (h)
CO
M2 (
pg
mL
)
10
100
1000
0 025 05 075 1
Time (h)
Rad
ioacti
vit
y (
pg
-eq
mL
)
Figure 4-5 Influence of TPGS on the systemic exposure of COM2 and metabolites
Plasma concentration-time profiles of parent drug and metabolite-related radioactivity of [3H]COM2 after intravenous administration to mice at 400 ngkg formulated in blank plasma (closed symbols black line) or as a solution containing TPGS 10 (open symbols dashed line) Symbols represent single values and lines mean values (n=3) Values of metabolite-related radioactivity were obtained by subtracting concentrations of parent drug from concentrations of total radioactivity
32
Table 4-6 Comparative plasma kinetics of metabolites of COM2 with and without TPGS
Plasma concentrations and pharmacokinetic parameters of metabolite-related radioactivity after iv administration of [3H]COM2 (400 ngkg) in blank plasma (control) or TPGS 10 to mice (n=3 mean plusmn SD) Values of metabolite-related radioactivity were obtained by subtracting concentrations of parent drug from concentrations of total radioactivity significantly different from the control at Plt001
Time Control TPGS
(h) Metabolites in plasma (pg-eqmL) Percentage of control value
008 75 plusmn 6 307 plusmn 28 408 025 67 plusmn 4 233 plusmn 9 346 05 56 plusmn 2 246 plusmn 30 441 1 29 plusmn 8 218 plusmn 31 744 AUC008-1h (pgmiddotmL
-1middoth) 49 222 453
t12 (h) 06 24 395
Table 4-7 Comparison of tissue distribution of COM2 with and without TPGS
Tissue concentrations and tissue-plasma concentration ratios (KP) of [3H]COM2 administered intravenously at 400 ngkg in blank plasma (control) or 10 TPGS solution to mice (n=3) KP(u) relates to the free compound concentration in plasma based on the free fraction determined in vitro Values represent mean plusmn SD
Time Tissue Concentration (pgg) KP KP(u)
(h) Control TPGS Control TPGS Control TPGS 008 Lung 1808 plusmn 263 1861 plusmn 64 173 plusmn 07 76 plusmn 05 981 plusmn 39 621 plusmn 42 Heart 750 plusmn 111 699 plusmn 33 72 plusmn 03 28 plusmn 01 407 plusmn 17 233 plusmn 11 Liver 2188 plusmn 355 2314 plusmn 56 209 plusmn 12 94 plusmn 09 1186 plusmn 69 773 plusmn 72 Kidney 1761 plusmn 390 1735 plusmn 84 167 plusmn 22 71 plusmn 07 951 plusmn 124 580 plusmn 59 Fat 232 plusmn 94 238 plusmn 83 22 plusmn 09 1 plusmn 03 127 plusmn 49 79 plusmn 25 Muscle 166 plusmn 40 190 plusmn 82 16 plusmn 06 08 plusmn 03 92 plusmn 32 62 plusmn 22 Brain 1095 plusmn 70 1038 plusmn 113 105 plusmn 06 42 plusmn 01 598 plusmn 35 345 plusmn 9 025 Lung 1206 plusmn 258 1277 plusmn 213 15 plusmn 26 8 plusmn 05 850 plusmn 148 657 plusmn 43 Heart 464 plusmn 31 473 plusmn 19 58 plusmn 06 3 plusmn 02 330 plusmn 37 246 plusmn 20 Liver 1447 plusmn 203 1626 plusmn 122 18 plusmn 19 103 plusmn 13 1024 plusmn 109 846 plusmn 109 Kidney 1176 plusmn 93 1161 plusmn 83 147 plusmn 19 74 plusmn 1 837 plusmn 108 605 plusmn 86 Fat 650 plusmn 169 1109 plusmn 321 81 plusmn 19 71 plusmn 24 458 plusmn 108 581 plusmn 198 Muscle 215 plusmn 13 214 plusmn 28 27 plusmn 05 14 plusmn 01 155 plusmn 28 111 plusmn 12 Brain 1199 plusmn 143 1180 plusmn 81 152 plusmn 34 75 plusmn 12 863 plusmn 194 616 plusmn 100 05 Lung 755 plusmn 76 923 plusmn 40 129 plusmn 15 75 plusmn 06 732 plusmn 83 615 plusmn 53 Heart 296 plusmn 34 354 plusmn 53 5 plusmn 06 29 plusmn 04 287 plusmn 34 234 plusmn 29 Liver 960 plusmn 91 1138 plusmn 58 163 plusmn 15 93 plusmn 12 929 plusmn 88 760 plusmn 100 Kidney 814 plusmn 102 987 plusmn 120 139 plusmn 19 8 plusmn 04 789 plusmn 110 654 plusmn 34 Fat 863 plusmn 227 1079 plusmn 444 147 plusmn 37 89 plusmn 51 834 plusmn 209 732 plusmn 416 Muscle 181 plusmn 12 170 plusmn 13 31 plusmn 02 14 plusmn 02 175 plusmn 11 113 plusmn 13 Brain 1086 plusmn 108 1215 plusmn 147 18 plusmn 18 98 plusmn 08 1050 plusmn 77 805 plusmn 69 1 Lung 439 plusmn 60 688 plusmn 187 133 plusmn 32 86 plusmn 05 758 plusmn 179 702 plusmn 43 Heart 186 plusmn 28 220 plusmn 72 57 plusmn 15 27 plusmn 04 322 plusmn 87 222 plusmn 31 Liver 581 plusmn 43 867 plusmn 140 176 plusmn 23 11 plusmn 15 998 plusmn 132 903 plusmn 123 Kidney 481 plusmn 37 740 plusmn 89 145 plusmn 19 94 plusmn 09 825 plusmn 105 771 plusmn 78 Fat 551 plusmn 143 504 plusmn 260 173 plusmn 77 71 plusmn 54 984 plusmn 439 584 plusmn 442 Muscle 91 plusmn 12 119 plusmn 37 28 plusmn 08 15 plusmn 03 159 plusmn 43 121 plusmn 25 Brain 731 plusmn 88 1073 plusmn 161 22 plusmn 26 136 plusmn 11 1249 plusmn 147 1114 plusmn 93
33
Discussion
Results signified the ability of the excipient TPGS to modify the blood distribution of COM2 in mouse under in vitro and in vivo conditions in a similar manner Plasma concentrations of COM2 and metabolites were significantly increased and the free fraction of drug in plasma (in vitro) decreased Concentrations in tissues were independent of the formulation whereas distribution ratios of drug in tissue to drug unbound in plasma were lower within the first minutes after dosing COM2 in TPGS Overall the altered pharmacokinetic profile of COM2 in plasma suggests drug inclusion in excipient-micelles andor promoted protein binding by excipient in plasma
The altered disposition of COM2 and metabolites in plasma is likely caused by the ability of TPGS to form micelles (141) Drug trapping by micelles in blood can be responsible for increased total plasma concentrations and decreased unbound fraction in plasma thereby influencing drug accumulation in plasma and blood cells (94) Changes in the free fraction could also be caused by altered protein binding There are different suggested mechanisms by which formulation vehicles can influence the free fraction of compounds such as vehicle-compound interactions (association andor micellar encapsulation) and vehicle-protein interactions The interaction either promotes or blocks the binding of the compound in plasma Most likely different interacting processes contribute to the effective free fraction (125)
The alteration in tissue distribution at the beginning may be induced by changes of the free drug fraction in the presence of TPGS and exists only for few minutes probably due to the excipient degradation in blood The phenomenon found after some minutes post-dose is reported in the literature for Paclitaxel formulated in Cremophor EL (94) The main characteristics are disproportionally increased plasma concentrations accompanied by unchanged tissue levels and tissue distribution processes
46 The impact of hydroxypropyl-β-cyclodextrin on COM3 in rat
In vitro results
COM3 was predominantly located in the cellular fraction (80) and was moderately bound to plasma proteins with high binding to α1-glycoprotein and albumin in a concentration-independent manner (Table 4-8 Figure 4-2) The drug partitioning into blood cells and the fraction bound to proteins were markedly reduced in incubations containing HP-β-CyD consequently lowering both the blood-plasma and blood cell-unbound in plasma concentration ratios (Table 4-8 Figure 4-6) Whereas HP-β-CyD decreased the protein binding suggesting more COM3 available for uptake into cells higher plasma levels associated with reduced concentrations in cells were observed for COM3 in HP-β-CyD In conclusion HP-β-CyD was selected for the in vivo study because of the most pronounced drug-excipient interactions detected in vitro
34
(a)
0
1
2
3
None HP-β-CyD
BP
R(b)
0
1
2
3
4
5
None HP-β-CyD
BC
PR
(c)
0
10
20
30
40
None HP-β-CyD
ρ
Figure 4-6 HP-β-CyD-mediated alteration of COM3 distribution in blood
Blood-plasma (a) blood cell-plasma (b) and blood cell-unbound in plasma (c) concentration ratios of [3H]COM3 at 5 (white bars) and 500 ngmL (black bars) in the presence and absence of HP-β-CyD (05) after incubation in rat blood (pH 76 H 044 nge3 mean plusmn SD)
Table 4-8 Effect of excipients on blood distribution and protein binding of COM3 in vitro
Partition parameters of [3H]COM3 obtained at equilibrium after incubation with and without excipients (05) in rat blood (pH 76 H 044 nge3 mean plusmn SD)
Excipient COM3 FP BPR BCPR fu ρ
(ngmL) () () None 5 209 plusmn 15 26 plusmn 01 46 plusmn 02 121 plusmn 09 399 plusmn 39 500 195 plusmn 03 29 plusmn 00 53 plusmn 01 122 plusmn 02 431 plusmn 08
5 194 plusmn 14 29 plusmn 02 56 plusmn 02 nd nd CELEtOH 6535 (vv) 500 175 plusmn 03 32 plusmn 01 60 plusmn 01 nd nd HP-β-CyD 5 385 plusmn 22 14 plusmn 01 21 plusmn 02 401 plusmn 18 51 plusmn 05 500 353 plusmn 04 16 plusmn 00 23 plusmn 00 396 plusmn 07 59 plusmn 01 Solutol 5 174 plusmn 14 32 plusmn 03 61 plusmn 04 nd nd 500 161 plusmn 03 35 plusmn 01 67 plusmn 01 nd nd PEG 200 5 197 plusmn 20 29 plusmn 03 51 plusmn 06 nd nd 500 186 plusmn 05 30 plusmn 01 56 plusmn 02 nd nd
5 227 plusmn 18 25 plusmn 02 44 plusmn 04 126 plusmn 01 346 plusmn 36 EtOHPEG200Glu 5590 (vvv) 500 200 plusmn 04 28 plusmn 01 51 plusmn 01 118 plusmn 02 432 plusmn 10 TPGS 5 249 plusmn 18 23 plusmn 02 40 plusmn 02 nd nd 500 237 plusmn 03 24 plusmn 00 41 plusmn 01 nd nd
In vivo results
Since COM3 dissolved in EtOHPEG200Glu (5590 vvv) showed similar distribution kinetics in vitro as compared to glucose 5 without additives (Table 4-8) the control formulation consisted of EtOHPEG200Glu This assured a sufficient solubility of COM3
Dosing COM3 in a HP-β-CyD-containing formulation resulted in decreased protein binding and blood cell partitioning as compared to the control group (Table 4-9) However these changes were transient and most pronounced after 5 min post-dosing followed by a decline At 60 min after drug administration differences in blood pharmacokinetics could not be longer detected between both groups anymore (Table 4-9) In contrast to the in vitro findings a lower plasma distribution was found at 5 min after applying COM3 in HP-β-CyD resulting in slightly enhanced blood-plasma and blood cell-plasma concentration ratios (Table 4-9 Figure 4-7)
35
The bolus injection of COM3 in HP-β-CyD led to an earlier decrease of kidney and lung concentrations and to a later decrease of skin liver and fat concentrations compared to tissue levels obtained after administration of COM3 alone (Table 4-11) The calculation of tissue-blood concentration ratios supported the lower distribution of COM3 formulated in HP-β-CyD (Table 4-11) especially at 1 h post-dose (Figure 4-8)
As a result of the difference in plasma pharmacokinetic parameters (Table 4-10) and tissue levels between both groups the renal elimination of COM3 was examined in addition More COM3 appeared in the urine of rats from the HP-β-CyD containing formulation (Table 4-12 Figure 4-9) especially within the first 30 minutes after drug administration (36-fold higher amount of unchanged COM3 in urine compared to the control group)
Table 4-9 Comparison of blood and plasma levels of COM3 with and without HP-β-CyD
[3H]COM3 concentrations in the systemic circulation (a) and partition parameters derived from these concentrations (b) after iv administration to rats at 300 microgkg formulated in HP-β-CyD or in a cyclodextrin-free solution (n=3 mean plusmn SD LOQ=008 ngmL assuming a hematocrit of 046(145) for calculations) significantly different from the control at Plt005 and 001 respectively
(a)
Formulation Time (h) Drug concentration (ngmL)
Blood Plasma EtOHPEG200Glu 5590 008 431 plusmn 68 175 plusmn 24 (control) 05 179 plusmn 40 61 plusmn 19 1 97 plusmn 09 41 plusmn 05 HP-β-CyD 40 008 327 plusmn 16 104 plusmn 11 025 263 plusmn 22 84 plusmn 09 05 180 plusmn 08 59 plusmn 01 1 104 plusmn 06 35 plusmn 02
(b)
Formulation Time (h) fu () FP () BPR BCPR ρ
008 225 plusmn 15 25 plusmn 02 42 plusmn 04 559 plusmn 48 EtOHPEG200Glu 5590 05 76 plusmn 08 187 plusmn 19 30 plusmn 03 54 plusmn 07 709 plusmn 89 (control) 1 233 plusmn 12 24 plusmn 01 40 plusmn 03 533 plusmn 37 HP-β-CyD 40 008 249 plusmn 12 174 plusmn 11 32 plusmn 02 58 plusmn 04 233 plusmn 17 025 177 plusmn 13 175 plusmn 06 31 plusmn 01 58 plusmn 02 325 plusmn 13 05 141 plusmn 06 180 plusmn 07 31 plusmn 01 56 plusmn 03 397 plusmn 18 1 78 plusmn 05 188 plusmn 12 29 plusmn 02 53 plusmn 04 681 plusmn 52
36
Table 4-10 Comparative pharmacokinetics of COM3 with and without HP-β-CyD
Pharmacokinetic parameters of [3H]COM3 administered intravenously in EtOHPEG 200Glu (control group) or in HP-β-CyD 40 to rats (n=3)
Parameter Unit Control group HP-β-CyD group
Blood Plasma Blood Plasma Body weight kg 0233 0221 Dose microg 70 66 C0 ngmL 46 17 35 11 V0 Lkg 66 174 85 271 AUC008-1h ngmL-1
h 197 75 177 58 funchanged 28 10 28 9
Blood Plasma
0
10
20
30
40
50
60
0 025 05 075 1Time (h)
CO
M3 (
ng
mL
)
0
5
10
15
20
25
0 025 05 075 1
Time (h)
CO
M3 (
ng
mL
)
Figure 4-7 Influence of HP-β-CyD on the systemic exposure of COM3
Blood and plasma concentration-time profiles of [3H]COM3 after intravenous administration to rats at 300 microgmL formulated in EtOHPEG 200Glu (open symbols black line) and as a solution containing HP-β-CyD (closed symbols dotted line) Symbols represent single values and lines mean values (n=3)
37
0
10
20
30
40
50
60
70
Liver Kidney Brain
0
5
10
15
Fat Muscle Skin Heart0
50
100
150
Lung
KP
Figure 4-8 Influence of HP-β-CyD on tissue distribution of COM3
Tissue to blood concentration ratio (KP) at 1 h after an iv injection of COM3 in EtOHPEG 200Glu (white bars) or in HP-β-CyD (black bars) in rats (dose 300 microgkg n=3 mean plusmn SD) significantly different from EtOHPEG 200Glu at Plt005
Table 4-11 Comparison of tissue distribution of COM3 with and without HP-β-CyD
Tissue concentrations and tissue-blood concentration ratios (KP) of [3H]COM3 after bolus injection to rats at 300 microgkg in EtOHPEG 200Glu (control) or HP-β-CyD (n=3 mean plusmn SD) significantly different from the control at Plt005
Time Tissue Concentration (ngmL) KP
(h) Control HP-β-CyD Percentage of control value Control HP-β-CyD
008 Liver 1412 plusmn 225 1058 plusmn 211 75 328 plusmn 01 326 plusmn 75 Kidney 1809 plusmn 191 1406 plusmn 72 78 424 plusmn 50 431 plusmn 24 Fat 128 plusmn 29 85 plusmn 18 67 31 plusmn 11 26 plusmn 06 Heart 597 plusmn 108 563 plusmn 55 94 139 plusmn 11 172 plusmn 13 Lung 6179 plusmn 809 4595 plusmn 192 74 1441 plusmn 110 1407 plusmn 6 Muscle 123 plusmn 25 142 plusmn 12 115 30 plusmn 11 44 plusmn 03 Skin 144 plusmn 62 74 plusmn 15 51 36 plusmn 20 22 plusmn 03 Brain 1164 plusmn 189 951 plusmn 41 82 271 plusmn 19 291 plusmn 21 05 Liver 588 plusmn 149 617 plusmn 60 105 329 plusmn 53 345 plusmn 42 Kidney 587 plusmn 163 479 plusmn 55 82 327 plusmn 51 267 plusmn 29 Fat 57 plusmn 10 46 plusmn 6 81 32 plusmn 02 26 plusmn 04 Heart 178 plusmn 46 187 plusmn 23 105 99 plusmn 10 104 plusmn 08 Lung 2003 plusmn 599 2376 plusmn 129 119 1108 plusmn 156 1324 plusmn 76 Muscle 155 plusmn 63 130 plusmn 12 84 84 plusmn 16 72 plusmn 05 Skin 94 plusmn 11 40 plusmn 9 42 54 plusmn 06 22 plusmn 06 Brain 905 plusmn 100 766 plusmn 49 85 515 plusmn 60 428 plusmn 44 1 Liver 394 plusmn 29 340 plusmn 6 86 407 plusmn 12 328 plusmn 19 Kidney 357 plusmn 44 293 plusmn 39 82 366 plusmn 12 283 plusmn 47 Fat 31 plusmn 1 22 plusmn 5 72 32 plusmn 04 21 plusmn 04 Heart 111 plusmn 13 99 plusmn 6 89 114 plusmn 04 95 plusmn 01 Lung 1197 plusmn 128 1053 plusmn 178 88 1247 plusmn 246 1011 plusmn 128 Muscle 99 plusmn 9 85 plusmn 23 86 102 plusmn 02 81 plusmn 19 Skin 68 plusmn 16 25 plusmn 3 37 69 plusmn 11 25 plusmn 02 Brain 653 plusmn 35 599 plusmn 10 92 674 plusmn 27 578 plusmn 22
38
Table 4-12 Comparison of COM3 excretion in urine with and without HP-β-CyD
[14C]COM3 (a) and its cumulative amount (b) appeared in the urine of rats following iv dosing at 370 microgkg in EtOHPEG 200Glu (control) or HP-β-CyD 40 (mean plusmn SD n=2 control n=3 HP-β-CyD) significantly different from the control at Plt005 and 001 respectively (a)
Time (h) COM3 in urine (ng) funchanged ()
Control HP-β-CyD Control HP-β-CyD 05 123 plusmn 10 4440 plusmn 594 25 plusmn 02 448 plusmn 82 1 240 plusmn 129 762 plusmn 191 34 plusmn 08 13 plusmn 41 15 85 plusmn 19 325 plusmn 150 25 plusmn 08 73 plusmn 28 2 43 plusmn 11 174 plusmn 89 2 plusmn 08 46 plusmn 21
(b)
Time Cumulative amount of COM3 in urine
(h) ng dose
Control HP-β-CyD Control HP-β-CyD 05 123 plusmn 10 4440 plusmn 594 013 plusmn 001 46 plusmn 09 1 363 plusmn 139 5202 plusmn 693 039 plusmn 014 54 plusmn 11 15 449 plusmn 159 5527 plusmn 799 048 plusmn 016 57 plusmn 12 2 491 plusmn 169 5702 plusmn 857 053 plusmn 017 59 plusmn 12
0
1000
2000
3000
4000
5000
6000
7000
05 1 15 2
Time (h)
Am
ou
nt
excre
ted
(n
g)
Figure 4-9 Effect of HP-β-CyD on the renal elimination of COM3
Cumulative amount of [14C]COM3 appeared in urine after iv administration of 370 microgkg either in EtOHPEG 200Glu (white bars) or as a solution in HP-β-CyD (black bars) Data are expressed as mean plusmn SD (n=2 EtOHPEG 200Glu n=3 HP-β-CyD) significantly different from the EtOHPEG 200Glu at Plt001
Discussion
In vitro and in vivo experiments demonstrated a strong influence of the excipient HP-β-CyD on the disposition kinetics of COM3 in rats There was a significant decrease in the plasma protein binding and in plasma and tissue concentrations of COM3 formulated in HP-β-CyD Changes in the systemic circulation were transient (le05 h post-dose) and most distinct shortly after dosing Alterations in tissue
39
concentrations and tissue-blood distribution ratios were tissue dependent and most pronounced for skin The amount of unchanged COM3 eliminated in the urine was significantly increased following drug administration in HP-β-CyD This alteration in the pharmacokinetic behavior of COM3 is most likely due to the elimination of COM3 included in cyclodextrin complexes
It is known (142) that HP-β-CyD forms drugcyclodextrin complexes in biological fluids is unable to cross biological membranes and is rapidly eliminated renally Even though the release of drugs from drugcyclodextrin complexes is expected to be fast (within seconds) (112) drug pharmacokinetics can be modified in the presence of cyclodextrins (143) Given that COM3 is included in complexes in the systemic circulation less COM3 is available for distribution which could have led to the lower protein binding and celltissue partitioning of COM3 formulated in HP-β-CyD compared to the cyclodextrin-free solution of COM3 Lower ρ-values of COM3 in HP-β-CyD support the possible existence of long-lasting complexes in vivo and indicate that unbound plasma concentrations obtained from ultrafiltration (30000 MW cut-off) are probably the sum of free and cyclodextrin-associated drug (MWHP-β-CyD
~1500) Furthermore blood partition parameters altered till 30 min post-dose indicate a slow dissociation of COM3 from complexes After total drug release COM3 formulated in HP-β-CyD seemed to assimilate the pharmacokinetic behavior in blood obtained in the control group (60 min post-dose)
The marked increase of unchanged COM3 in the urine occurred mainly in the first 30 min following drug administration in HP-β-CyD which is consistent with the decreased plasma levels right after dosing in the HP-β-CyD group Similar observations are reported for carbamazepine and dexamethasone where the renal excretion of unchanged drug applied intravenously in HP-β-CyD was increased most likely due to the renal clearance of the formulation vehicle (112) The faster elimination of COM3 associated to HP-β-CyD in contrast to COM3 alone might have attributed to less COM3 available for tissue distribution even after completed drug release from the vehicle being in line with decreased tissue levels and KP values at 60 min post-dose
47 The impact of Cremophor EL on COM4 in rat
In vitro results
In excipient-free incubations COM4 was highly bound to plasma proteins (gt97 bound predominantly to albumin) and penetrated hardly into blood cells (gt95 located in plasma) (Tables 4-13 and 4-14 Figure 4-2) The free fraction in plasma and the partitioning into blood cells of COM4 were enhanced in the presence of CEL HP-β-CyD and Solutol The protein binding decreased in an excipient concentration-dependent manner (Table 4-13 Figure 4-10) At excipient concentrations below 01 the protein binding was not altered At and above excipient concentrations of 01 the free fraction was markedly elevated with a maximal effect at 1 for all three formulations The addition of these excipients to incubations resulted to higher blood-plasma and blood cell-plasma concentration ratios both indicating increased uptake of COM4 into blood cells (Table 4-14) CEL was selected for the in vivo study because of the most pronounced drug-excipient interactions detected in vitro
40
Table 4-13 Effect of excipients on the in vitro protein binding of COM4
Protein binding of [14C]COM4 at 100 ngmL in the presence and absence of excipients in rat plasma using the ultrafiltration technique (pH 74 n=3 mean plusmn SD)
Excipient fu
() ()
Percentage of control value
None 24 plusmn 02 CEL 001 23 plusmn 01 96 01 31 plusmn 01 131 05 111 plusmn 03 464 1 260 plusmn 03 1089 HP-β-CyD 001 26 plusmn 02 109 01 43 plusmn 02 179 05 98 plusmn 01 412 1 141 plusmn 11 592 Solutol 001 23 plusmn 02 97 01 32 plusmn 02 134 05 97 plusmn 02 407 1 152 plusmn 03 638 PEG 200 05 24 plusmn 01 99 TPGS 05 2 plusmn 01 85
Table 4-14 Effect of excipients on the in vitro partition parameters of COM4 in blood
Plasma fraction (FP) and distribution ratios (BPR BCPR ρ) of [14C]COM4 at 100 ngmL in rat blood obtained at equilibrium after incubations with and without excipients at 05 and 1 (pH 75 H 044 37degC nge3 mean plusmn SD)
Excipient FP BPR BCPR ρ
() ()
None 959 plusmn 20 058 plusmn 001 005 plusmn 003 21 plusmn 06 CEL 05 739 plusmn 16 075 plusmn 002 043 plusmn 006 39 + 05 1 656 plusmn 17 085 plusmn 002 067 plusmn 005 26 + 02 HP-β-CyD 05 900 plusmn 13 062 plusmn 001 014 plusmn 002 15 plusmn 02 1 819 plusmn 14 068 plusmn 001 028 plusmn 003 20 plusmn 02 Solutol 05 786 plusmn 15 071 plusmn 001 035 plusmn 003 36 plusmn 03 1 749 plusmn 14 075 plusmn 001 043 plusmn 003 28 plusmn 03
In vivo results
Dosing COM4 in a CEL-containing formulation resulted in a decrease of the protein binding as compared to the control group (Table 4-15 Figure 4-10) This effect was time-dependent and most pronounced at 5 min after drug administration followed by a decline The increased fraction of COM4 unbound in plasma did not affect the drug levels in the systemic circulation resulting in similar pharmacokinetic parameters in both groups (Table 4-15) Identical tissue concentrations were observed independently of the formulation (Table 4-16)
41
In vitro Ex vivo
0
5
10
15
20
25
30
0 05 1
Excipient concentration ()
Fre
e f
racti
on
(
)
Cremophor EL
Hydroxypropyl-β-cyclodextrin
Solutol HS 15
0
5
10
15
20
25
0 025 05 075 1
Time (h)
Fre
e f
racti
on
(
)
Control group
Cremophor EL group
Figure 4-10 Excipient-mediated alterations of COM4 protein binding in plasma
Left Unbound fraction of [14C]COM4 (100 ngmL) incubated with different excipient concentrations in rat plasma (mean plusmn SD n=3) Right Unbound fraction of compound-related radioactivity in plasma after intravenous administration of [14C]COM4 at 400 microgkg formulated in buffer (control group closed symbols) or in CEL (open symbols) Symbols represent mean plusmn SD (n=3)
Table 4-15 Comparative blood and plasma kinetics of COM4 with and without CEL
Compound-related radioactivity concentrations in the systemic circulation (a) and pharmacokinetic parameters (b) after iv administration of [14C]COM4 at 400 microgkg formulated in buffer or in CEL to rats (n=3 mean plusmn SD LOQ=43 ng-eqmL assuming a hematocrit of 046(145) for calculations) significantly different from the control at Plt005 (a)
Formulation Time (h) Concentration (ng-eqmL)
Blood Plasma Unbound in plasma ()
008 1555 plusmn 299 2483 plusmn 382 025 1192 plusmn 119 2073 plusmn 238 05 1377 plusmn 67 2388 plusmn 153
Phosphate buffered saline (control)
1 1248 plusmn 68 2105 plusmn 172
38 + 15
Cremophor EL 17 008 1471 plusmn 115 2426 plusmn 186 169 plusmn 34 025 1316 plusmn 119 2180 plusmn 237 77 plusmn 24 05 1216 plusmn 155 2084 plusmn 237 74 plusmn 27 1 1315 plusmn 337 2210 plusmn 607 74 plusmn 28
(b)
Parameter Unit Control group Cremophor group
Blood Plasma Blood Plasma Body weight kg 0201 0199 Dose microg 81 80 C0 ngmL 1427 2373 1385 2296 V0 Lkg 028 017 029 017 AUC008-1h ngmL-1
h 1211 2068 1186 1998
42
Table 4-16 Comparison of tissue distribution of COM4 with and without CEL
Tissue concentrations and tissue-blood concentration ratios of radioactivity of [14C]COM4 after bolus injection to rats at 400 microgkg formulated either in buffer (control group) or in CEL (n=3 mean plusmn SD)
Time Tissue Drug concentration (ng-eqg) Tissue-blood distribution ratio
Control group Cremophor group Control group Cremophor group
008 h Lung 737 + 78 768 + 17 048 + 004 052 + 003 Muscle 222 + 6 243 + 12 015 + 002 017 + 002 Skin 276 + 63 254 + 46 019 + 008 017 + 002 025 h Lung 654 + 44 710 + 51 055 + 002 054 + 001 Muscle 209 + 5 211 + 6 018 + 002 016 + 002 Skin 363 + 70 395 + 41 030 + 004 030 + 004 05 h Lung 695 + 46 676 + 40 050 + 001 056 + 004 Muscle 202 + 4 204 + 1 015 + 0 017 + 002 Skin 408 + 39 372 + 25 030 + 004 031 + 004 1 h Lung 628 + 19 629 + 78 050 + 001 059 + 013 Muscle 212 + 10 196 + 13 017 + 001 019 + 008 Skin 409 + 24 391 + 45 033 + 001 037 + 009
Discussion
CEL lowered the binding of COM4 to plasma proteins in vitro and the higher free drug fraction was associated with enhanced partitioning into blood cells as compared to the excipient-free incubations Similar increases of unbound drug levels in plasma were observed after bolus injection of COM4 in CEL In contrast to the in vitro findings CEL induced no changes in the in vivo bloodplasma distribution of COM4 and no alterations in the tissue distribution were detected as well
Even though the plasma protein binding of COM4 is influenced by CEL in an analogous manner under in vitro and in vivo conditions a direct translation of the altered protein binding into blood and plasma concentrations is lacking in vivo Different to the in vitro investigations the in vivo situation involves not only distribution but also elimination processes which can initiate shifts in the systemic drug exposure Besides this the effective excipient concentration achieved in vivo in the circulation is usually unknown and can quite differ from concentrations applied in vitro Although excipient concentrations can be theoretically estimated using blood volume dose and application volume values are fairly arbitrary because excipient levels can decline fast in the body due to dilution (144) and degradation (126) within the blood compartment
48 The impact of Solutol HS 15 on COM5 in rat
In vitro results
The distribution of COM5 between whole blood and plasma was slightly concentration-dependent in rat regardless of incubations with or without excipients (Table 4-17) and the equilibrium conditions were rapidly reached for all solutions (lt5 min) except for CEL (equilibrium after 1-h incubation data not shown) The binding of COM5 to plasma proteins was moderate (lt90) with a high binding to albumin and α1-acid glycoprotein (Figure 4-2) and the bound fraction was reduced by the addition of CEL and Solutol Furthermore both excipients caused alterations in the blood-plasma and blood cell-plasma concentration ratios characterized by
43
enhanced drug partitioning into blood cells (Table 4-17 Figure 4-11) The higher cell uptake is consistent with decreased drug binding to plasma proteins in the presence of CEL and Solutol These effects were more prominent for COM5 with Solutol than with CEL Thus Solutol was selected for the in vivo study
Table 4-17 Effect of excipients on blood distribution and protein binding of COM5 in vitro
Partition parameters of [14C]COM5 obtained at equilibrium after incubation with and without excipients (05) in rat blood (pH 75 H 045 nge3 mean plusmn SD)
Excipient COM5 FP BPR BCPR fu ρ
(ngmL) () () None 10 857 plusmn 40 064 plusmn 003 021 plusmn 007 162 plusmn 11 14 plusmn 03 300 768 plusmn 16 072 plusmn 002 037 plusmn 003 119 plusmn 02 31 plusmn 02 Ethanol 10 812 plusmn 01 066 plusmn 005 023 plusmn 011 114 plusmn 04 22 plusmn 07 300 779 plusmn 09 072 plusmn 001 036 plusmn 002 116 plusmn 02 30 plusmn 02
10 660 plusmn 22 083 plusmn 003 063 plusmn 006 227 plusmn 18 28 plusmn 03 CELEtOH 6535 (vv) 300 577 plusmn 12 095 plusmn 002 090 plusmn 004 237 plusmn 04 38 plusmn 02 HP-β-CyD 10 803 plusmn 27 069 plusmn 002 030 plusmn 005 nd nd 300 754 plusmn 18 073 plusmn 002 040 plusmn 004 nd nd Solutol 10 550 plusmn 05 097 plusmn 006 100 plusmn 002 281 plusmn 10 33 plusmn 05 300 487 plusmn 09 113 plusmn 002 129 plusmn 004 277 plusmn 04 43 plusmn 04 PEG 200 10 769 plusmn 23 072 plusmn 002 037 plusmn 005 nd nd 300 736 plusmn 13 075 plusmn 001 044 plusmn 003 nd nd TPGS 10 832 plusmn 13 063 plusmn 005 018 plusmn 012 nd nd 300 785 plusmn 18 070 plusmn 002 033 plusmn 004 nd nd
(a)
00
02
04
06
08
10
12
10 ngmL 300 ngmL
BP
R
(b)
00
02
04
06
08
10
12
14
10 ngmL 300 ngmL
BC
PR
(c)
00
10
20
30
40
50
10 ngmL 300 ngmL
ρ
Figure 4-11 Excipient-mediated alterations of COM5 distribution in blood by CEL and Solutol
Blood-plasma (a) blood cell-plasma (b) and blood cell-unbound in plasma (c) concentration ratios of [14C]COM5 (10-300 ngmL) without excipients (black bars) and in the presence of Cremophor EL (white bars) and Solutol HS 15 (hatched bars) at 05 in rat blood (pH 75 H 045 nge3 mean plusmn SD)
In vivo results
In vitro studies demonstrated that the addition of ethanol to incubations had no impact on the blood partition of COM5 (Table 4-17) Therefore COM5 was dissolved in ethanol 10 for the administration in the control group thereby assuring sufficient solubility of the compound
Within the first 15 min post-dose higher blood concentrations accompanied by similar plasma concentrations were observed for COM5 in Solutol compared to concentrations for COM5 in ethanol 10 (control group) thereby increasing
44
concentration ratios of blood-plasma and blood cell-plasma in the Solutol group (Table 4-18) Subsequently similar ratios were obtained in both groups with a concomitant slower decline of circulation concentrations in animals treated with Solutol These changes in the Solutol group are in line with a reduced rate constant that resulted in a 2-fold higher half-life compared to that in the control group (Table 4-19) At 1 h post-dose concentrations of COM5 in the systemic circulation were 300 higher than those obtained after dosing the compound in the control formulation (Table 4-18 Figure 4-12) The doseAUC ratio was also decreased for COM5 in Solutol (Table 4-19) In agreement with the in vitro findings COM5 formulated in Solutol led to a permanent lower protein binding up to 1 h post-dose in addition to enhanced uptake into blood cells right after dosing (higher blood-plasma concentration ratio) (Table 4-18)
Table 4-18 Comparison of blood and plasma levels of COM5 with and without Solutol
Concentrations of compound-related radioactivity in the systemic circulation (a) and partition parameters (b) derived from these concentrations after iv administration of [14C]COM5 at 1 mgkg formulated in Solutol or in a Solutol-free solution (control group) to rats (n=3 mean plusmn SD LOQ=8 ng-eqmL assuming a hematocrit of 046(145) for calculations) significantly different from the control group at Plt005 and 001 respectively (a)
Time (h) Drug concentration (ng-eqmL)
Control group Solutol group Percentage of control value
Blood 008 1308 plusmn 178 1853 plusmn 155 142 025 895 plusmn 195 1243 plusmn 250 139 05 615 plusmn 193 976 plusmn 115 159 1 194 plusmn 24 585 plusmn 113 301 Plasma 008 2592 plusmn 558 2720 plusmn 266 105 025 1584 plusmn 168 1895 plusmn 337 120 05 1014 plusmn 385 1526 plusmn 112 150 1 311 plusmn 47 900 plusmn 165 289
(b)
Formulation Time (h) fu () FP () BPR BCPR ρ
Control 008 1062 plusmn 93 051 plusmn 004 -006 plusmn 01 -07 plusmn 11 (ethanol 10) 025 975 plusmn 148 056 plusmn 008 005 plusmn 017 19 plusmn 05 05 876 plusmn 125 062 plusmn 009 018 plusmn 019 42 plusmn 22 1
84 plusmn 14
862 plusmn 25 063 plusmn 002 019 plusmn 004 19 plusmn 04 Solutol 17 008 792 plusmn 18 068 plusmn 002 031 plusmn 003 22 plusmn 02 025 825 plusmn 18 065 plusmn 001 025 plusmn 003 19 plusmn 02 05 847 plusmn 51 064 plusmn 004 021 plusmn 008 14 plusmn 05 1
150 plusmn 23
832 plusmn 12 065 plusmn 001 024 plusmn 002 12 plusmn 01
Independent of the formulation brain levels ranged in concentrations corresponding
to the vascular contamination indicating no significant penetration of COM5 into brain (Table 4-20) A later increase in muscle and skin concentrations was detected for COM5 administered in Solutol (Table 4-20) The muscle concentration-time profile showed an analogous pattern to that in the systemic circulation with a longer persistence going along with higher concentrations at later post-dose times in the Solutol group (Table 4-21 Figure 4-12) However similar muscle-plasma concentration ratios between both groups pointed that Solutol did not affect the
45
muscle distribution pattern In contrast the higher skin concentrations of COM5 formulated in Solutol were associated with altered KP values (025 and 1 h post-dose) and same half-life compared to the control group (Tables 4-20 and 4-21)
Table 4-19 Comparative pharmacokinetics of COM5 with and without Solutol
Pharmacokinetic parameters of compound-related radioactivity after intravenous administration of [14C]COM5 in ethanol 10 (control group) or in Solutol 17 to rats (n=3)
Parameter Unit Control group Solutol group
Blood Plasma Blood Plasma Body weight kg 0214 0212 Dose microg 214 212 C0 ngmL 1562 2998 1840 2749 V0 Lkg 064 033 054 036 AUC008-1h ngmL-1
h 578 1011 931 1426 t12 h 033 032 069 069 DoseAUC008-1h mLh 369 211 228 149
Table 4-20 Comparison of tissue distribution of COM5 with and without Solutol
Tissue concentrations and tissue-plasma concentration ratios of radioactivity of [14C]COM5 after bolus injection at 1 mgkg to rats in ethanol 10 (control) or Solutol 17 (n=3 mean plusmn SD)
Time Tissue Concentration (ngg) Tissue-plasma ratio
Control Solutol Percentage of control value Control Solutol
008 h Muscle 400 + 53 476 + 69 119 016 plusmn 002 018 plusmn 004 Skin 248 + 26 240 + 48 97 010 plusmn 003 009 plusmn 003 Brain 27 + 3 40 + 2 150 001 plusmn 0 001 plusmn 0 025 h Muscle 311 + 43 424 + 21 137 020 plusmn 003 023 plusmn 004 Skin 243 + 15 413 + 62 170 015 plusmn 001 022 plusmn 002 Brain 16 + 2 26 + 4 161 001 plusmn 0 001 plusmn 0 05 h Muscle 228 + 25 333 + 15 146 025 plusmn 009 022 plusmn 001 Skin 235 + 33 384 + 11 163 025 plusmn 008 025 plusmn 001 Brain 10 + 2 18 + 3 188 001 plusmn 0 001 plusmn 0 1 h Muscle 57 + 2 174 + 30 307 019 plusmn 003 019 plusmn 0 Skin 152 + 11 246 + 46 162 050 plusmn 011 028 plusmn 004 Brain mdasha 11 + 1 nd 001 plusmn 0 001 plusmn 0 a below LOQ significantly different from the control at Plt005
Table 4-21 Comparison of muscle and skin kinetics of COM5 with and without Solutol
Pharmacokinetic parameters of compound-related radioactivity in tissues after intravenous administration of [14C]COM5 at 1 mgkg formulated in ethanol 10 (control group) or Solutol 17 to rats (n=3)
Parameter Unit Muscle Skin
Control group Solutol group Control group Solutol group AUC008-1h ngmL-1
h 199 298 198 313 C0 ngg 533 548 nd nd t12 h 030 058 104 097
46
Plasma Muscle Skin
100
1000
10000
0 025 05 075 1
Time (h)
Co
ncen
trati
on
(n
g-e
qm
L)
10
100
1000
0 025 05 075 1
Time (h)
Co
ncen
trati
on
(n
g-e
qm
L)
100
1000
0 025 05 075 1
Time (h)
Co
ncen
trati
on
(n
g-e
qm
L)
Figure 4-12 Influence of Solutol on plasma muscle and skin profiles of COM5
Concentration-time courses of compound-related radioactivity in plasma muscle and skin after intravenous administration of [14C]COM5 at 1 mgkg formulated in ethanol 10 (closed symbols black line) and as a solution containing Solutol 17 (open symbols dotted line) Symbols represent single values and lines mean values (n=3)
Discussion
In vitro and in vivo experiments showed that Solutol significantly modulated the disposition profile of COM5 in rats by drug-excipient interactions in blood COM5 formulated in Solutol decreased both the drug distribution into plasma (transient in vivo) and the binding to plasma proteins (prolonged in vivo) Furthermore animals treated with Solutol showed a later concentration increase in the circulation and tissues (muscle skin) (ge025 h post-dose)
Altered drug levels were related to prolonged half-lives in the circulation and muscle The longer blood persistence is consistent with the reduced clearance (doseAUC) which presumes a lower elimination of COM5 in the presence of Solutol In contrast to the muscle concentration-time profile similar to that in the circulation the skin profile exhibited no changes in the half-life potentially due to a lower vascularization in skin compared to that in muscle However the skin-plasma concentration ratio was affected by the Solutol formulation whereas no changes in KP values were observed for muscle This altered pharmacokinetic profile might relate to a lower clearance of COM5 in the presence of Solutol
Previous investigations in mice revealed an interaction between Solutol and a co-administered ketochlorine photosensitizer (C8KC) in plasma (127) Protein binding experiments indicated the formation of either a binary drug-excipient complex or a ternary complex involving drug excipient and plasma components This effect was correlated to similar half-lives of Solutol and C8KC in plasma suggesting the persistence of C8KC in the circulation associated with that of the excipient Likewise half-lives in the same range were also observed for C8KC and the excipient Cremophor EL going along with prolonged C8KC persistence in plasma and tissues in mice (85)
47
5 General discussion and conclusions
In vitro and in vivo experiments were carried out to investigate the potential of five excipients commonly used in formulations to modify the pharmacokinetics of co-administered model compounds at concentrations ranging from sub-therapeutic to pharmacological levels Conducted studies focused mainly on the impact of excipients in the blood compartment since such data have rarely been published up to now especially for intravenously low dosed compounds including highly active drug substances biomarkers PET ligands and microdoses
PEG 200 CEL HP-β-CyD and Solutol were chosen as excipients because of their use in intravenous formulations and their high solubilizing ability related to different molecular structures and solubilization principles by either a direct solvent effect or by formation of micelles or complexes TPGS known in oral formulations completed the set of selected excipients and is an interesting functional excipient in terms of its chemical properties (benzyl ring) and ability to alter metabolism andor transporter activities thereby potentially influencing cellular distribution
Five drug candidates in development at Novartis were selected as model compounds exhibiting different physicochemical and pharmacokinetic properties (Table 5-1) The two PET ligands COM1 (base) and COM2 are lipophilic and poorly water-soluble COM3 is characterized by its predominant location in the cellular fraction in blood whereas COM4 hardly penetrates into blood cells COM2 distributes equally between plasma and whole blood COM5 is a molecule with a high polar surface area and a low volume of distribution similar to that of COM4 Moreover COM2 COM1 and COM4 are very highly protein bound (gt95) and COM3 and COM5 are moderately protein bound (lt90) In addition binding studies using isolated plasma proteins showed that model compounds bind with different affinity to the three major drug-binding proteins in plasma (albumin α1-acid glycoprotein and lipoproteins)
Model compounds were used in low doses to achieve blood concentrations of lt5 ngmL for COM1 and COM2 and low-therapeutic levels for COM3 (5-50 ngmL) Due to the very low volume of distribution COM4 and COM5 were investigated at normal pharmacological concentrations (gt50 ngmL in blood) to guarantee detectable tissue levels
In order to analyze the in vitro-in vivo correlation the excipient was set at an excipient-blood ratio of 1200 This concentration was found to be non-hemolytic in vitro for selected excipients except TPGS which induced hemolysis after a longer contact time To rule out any changes caused by cell lysis TPGS investigations were carried out in the non-hemolytic range The excipient concentration of 05 also correlates to the normal dosing range estimated for an intravenous bolus injection in mice and rats assuming a blood volume of ~70 mLkg and an injection volume of lt3 mLkg However in humans according to the literature (54) excipient concentrations above 01 in blood are regarded as high and generally only obtained following intravenous infusions Considering marketed injectable formulations for example the amount of excipient in blood is up to 015 HP-β-CyD (Sporanox) and 03-05 CEL (Vumon and Taxol respectively)
48
Table 5-1 Overview of model compounds
Physicochemical (PC) and pharmacokinetic (PK) properties of model compounds selected for investigating drug-excipient interactions in blood
Compound COM1 COM2 COM3 COM4 COM5 PET ligand PET ligand NCE NCE NCE
Chemical structure
N
N
O
R1
R2
O
N
O
N
N
S
R1
R2
N
O
N
R
NN
R2
R1
N
NO
S O
NH
O
O
NH
OR1
R2
R3
PC properties MW (gmol) 240 410 295 lt400 533 LogD 68 34 45 23 17 37 pKa 38 57 41 87 32 46 106 H20 solubility pH 68 (mgL) 20 lt25 4000 lt500 100 PSA (Aring2) 35 50 25 63 166 H-bond acceptors 3 5 3 4 12 H-bond donors 0 0 0 1 3 Critical value(s) Solubility (base) Solubility MW PSA H-bond acc PK parameters Species Rat Mouse Rat Rat Rat In vitro Fraction in plasma () 75 45 20 ~100 80 Free in plasma () 21 18 12 24 11 Major binding protein Albumin gt AGP Albumin gt LP AGP gt Albumin Albumin gt AGP Albumin asymp AGP In vivo Matrix Plasma Blood Blood Plasma Plasma t12 (h) 008 11 11 10 04 CL (mLminkg) 202 10 142 04 72 Vss (Lkg) 11 14 10 03 03 funchanged () 14 49 14 98 94 AGP α1-acid glycoprotein CL Drug clearance funchanged Fraction of unchanged drug based on AUC ratio of parent drug and total radioactivity LogD Logarithm of octanol-water distribution coefficient LP Lipoproteins MW Molecular weight NCE New chemical entity pKa Negative logarithm of dissociation constant PSA Polar surface area t12 Main elimination half-life Vss Volume of distribution under steady-state conditions
49
In trying to evaluate the potential of excipients to affect partition parameters in blood selected excipients were screened in vitro for interactions with the model compounds using a blood distribution method and protein binding assays (ultrafiltrationultracentrifugation) The most interacting excipients were subsequently taken forward for in vivo studies in animals given a single iv dose to ascertain whether there was a change in pharmacokinetics and whether an in vitro-in vivo correlation existed
Amongst the excipients tested the excipient PEG 200 was not active as an interacting agent whereas the others were more or less active (Table 5-2) However there was no apparent relationship between the nature of interactions and the compound properties
TPGS was found in vitro to enhance the plasma fraction of COM1 and COM2 in blood and higher plasma concentrations were associated with a decrease of compound unbound in plasma A significant increase in plasma concentrations of parent drug (2-fold) and metabolites (4-fold) were observed following intravenous administration of COM2 in mice and t12 of COM2 remained unchanged whereas t12 of metabolites was 4-fold higher While TPGS led to similar trends of COM1-related metabolites after injection in rats values determined for parent drug were inconsistent with those obtained in vitro A very extensive metabolism coupled to fast elimination was detected for COM1 which led to a stop in additional investigations to understand the in vitro-in vivo discrepancy
The use of CEL and Solutol in rats reduced in vitro the binding of COM4 and COM5 to plasma proteins and the higher free drug fraction was accompanied by enhanced partitioning into blood cells Both excipients led to 2-fold higher unbound plasma concentrations following iv administration of COM4 formulated in CEL and COM5 in a Solutol-containing solution Systemic and tissue levels of COM4 remained unaffected In contrast dosing COM5 in Solutol resulted in an earlier increase of blood-plasma concentration ratios indicating enhanced uptake into blood cells Later on COM5 concentrations in blood and plasma were significantly enhanced to a similar extent (2-fold) yielding ratios equalized to control values The systemic accumulation was correlated to higher t12 (2-fold) The AUC of COM5 in muscle and skin increased going along with a raise of t12 in muscle and none in skin
In vitro HP-β-CyD increased the amount of COM3 distributed into rat plasma and lowered the binding to plasma proteins Concentration ratios were only about 12 for blood-plasma and 18 for blood cell-unbound in plasma as compared to reference values At earlier time points after iv dosing concentrations of COM3 in blood and plasma were lower in the presence of HP-β-CyD (~23 of control) whereas over 30-fold higher levels of COM3 in urine were found Subsequently tissue concentrations and tissue-blood concentration ratios of COM3 with HP-β-CyD were significantly decreased
50
Table 5-2 Qualitative impact of excipients on pharmacokinetic parameters
Excipient-compound interactions obtained after in vitro incubations and after intravenous administration in animals using excipients at ~05 in blood and compounds at a dose of either ~1 nmolkg (COM1 COM2) or ~1 micromolkg (COM3 COM4 COM5) Arrows indicate excipient-induced changes compared to the excipient-free group (harr no changes uarr increase darr decrease) Compound Excipient Species Changes Comments
In vitro In vivo COM1 Vit E TPGS Rat uarr Accumulation in plasma darr Plasma protein binding bull No changes in vitro at le05 TPGS darr Partitioning into blood cells darr AUC008-05h bull Similar AUCs of drug free in plasma uarr Plasma protein binding darr C0 bull Increase in AUC of metabolites
harr t12 bull Inappropriate model compound due harr Tissue distribution to rapid metabolismelimination COM2 Vit E TPGS Mice uarr Accumulation in plasma uarr AUC008-1h bull uarr AUC and uarr t12 of metabolites darr Partitioning into blood cells uarr C0 bull Ex vivo protein binding not available
uarr Plasma protein binding harr t12 due to values ltLOQ harr Tissue distribution
COM3 HP-β-cyclodextrin Rat uarr Accumulation in plasma darr Plasma protein binding
darr Partitioning into blood cells darr AUC008-1h
darr Plasma protein binding darr C0
harr t12
darr Skin concentrations
uarr Urinary excretion
COM4 Cremophor EL Rat darr Accumulation in plasma darr Plasma protein binding uarr Partitioning into blood cells harr AUC008-1h
darr Plasma protein binding harr C0
harr t12
harr Tissue distribution
COM5 Solutol HS 15 Rat darr Accumulation in plasma darr Plasma protein binding
uarr Partitioning into blood cells uarr AUC008-1h
darr Plasma protein binding harr C0
uarr t12
uarr Muscleskin concentrations
AUC Area under the plasma drug concentration-time curve C0 Initial plasma concentration at time zero LOQ Limit of quantification t12 Half-life in plasma using the last three data points
51
These results clearly show the role of excipients as a modulator of the protein binding and cellular partitioning of compounds in blood which can impact the overall drug disposition Excipient-induced changes in the free fraction and cell uptake of drugs within the blood compartment are explained by various mechanisms (Figure 5-1) An excipient is able to influence the fraction of a co-administered drug in plasma and blood cells by direct drug interactions andor interferences with blood components such as proteins and cell constituents particularly membranes Consequently bound and free concentrations in plasma and cellular concentrations may be shifted potentially contributing to a ldquonewrdquo steady state Altered plasma concentrations can be the result of changes in drug protein binding drug adsorption to excipients andor drug trapping into excipient micelles or complexes Whichever effect dominates more drug can be free or bound thereby accounting for the amount of drug available for cellular partitioning Excipients could also vary the uptake into blood cells due to alterations in membrane structure andor drug presentation both mechanisms either facilitating or hindering drug transport via membranes In the end most likely different interacting processes contribute to the final effect depending on the force and nature of each single interaction
Free drug Free drug
Bound drug
Protein-bound drug
Excipient-drug interactions
(solubilization adsorption incorporation)
(destruction adsorption integration penetration)
PLASMA BLOOD CELLS
Excipient-membrane interactionsExcipient-protein interactions
(destruction adsorption binding)
Figure 5-1 Mechanisms underlying alterations in drug partition parameters in blood
The presence of excipients in blood may influence drug levels in plasma (protein-bound and free fraction) and blood cells by interacting with the drug or blood components thereby either blocking or promoting the protein binding andor the drug available for cellular partitioning
Analyzing the in vitro with the in vivo situation the effect of selected excipients on
the protein binding showed a good in vitro-in vivo correlation whereas systemic concentrations after iv administration in animals could often not be predicted well from in vitro data In contrast to in vitro assays reflecting stationary conditions the in vivo situation entails processes running in an open and dynamic system thereby involving not only distribution but also elimination This can initiate shifts in the systemic drug exposure and be responsible for the absence of a direct correlation to bloodplasma concentrations and thus to pharmacokinetic parameters as well Apart from this the effective excipient concentration achieved in vivo in the circulation is usually unknown and may differ from concentrations applied in vitro Although excipient concentrations can be theoretically estimated using blood volume dose and application volume values are fairly arbitrary because excipient levels decline most likely fast in the body due to dilution and degradation within the blood
52
compartment This suggests that if alterations in blood partitioning occur following administration in vivo they should be best detectable at times shortly post-dose
Even though differences between the in vitro and in vivo results were found the in vitro test can serve as a straightforward tool for rapid detection of excipient-drug interactions in blood while requiring little amounts of drug As a result the determination of in vitro blood partition parameters is proposed as a rough estimator of a possible potential of excipients to contribute to pharmacokinetics of parenteral drugs In addition to the blood-to-plasma distribution ratio the protein binding provides useful information to elucidate excipient-induced alterations and allows the calculation of the blood cell-to-free in plasma distribution ratio These data help not only to optimize the proper evaluation of pharmacokinetics in animals but also to enable a more rational approach in the development of formulations for drug candidates Therefore the in vitro investigation of blood distribution and protein binding with and without excipient is recommended at a very early preclinical stage in cases where animal pharmacokinetics of lower dosed compounds (eg PET ligands) must be examined from excipient-containing solutions (eg surfactants complexing agents) The influence assessment of excipients may also be a promising formulation approach for iv solutions of non-ionizable lipophilic and nonpolar molecules which are very challenging to formulate appropriately due to poor water solubility (eg paclitaxel docetaxel cyclosporin)
Figure 5-2 illustrates a possible formulation procedure that integrates data generated by in vitro investigations in blood Cosolvents complexing agents surfactants and combinations of these excipients are frequently used to dissolve a compound for intravenous administration in animals Method(s) are chosen considering available compound characteristics such as physicochemical and pharmacokinetic properties doses and clinical objectives If an appropriate formulation in terms of solubility and stability is found blood distribution and protein binding studies are performed both in the presence and absence (reference) of excipient(s) using in vitro assays Protein binding studies should mainly be considered if the extent of binding can be appropriately determined by ultrafiltration dialysis or ultracentrifugation all three conventional and simple methods Next partition parameters (FP fu BPR BCPR and ρ) are evaluated and compared to those obtained for the reference formulation representing an excipient-free solution (eg glucose 5 or saline including pH adjustment buffer blank plasma) Formulations are ranked in order of changes relative to the reference As a result a formulation can be modified adapted or selected for intravenous administration in animals In cases where the in vivo administration requires the addition of excipient(s) to the reference formulation to solubilize the compound the formulation must be tested in vitro The formulation is an acceptable in vivo reference if the in vitro parameters are similar to those of the excipient-free solution ie the in vitro reference The outcome of the in vivo study triggers formulation optimization to minimize or abolish excipient effects further investigation to better interpret data or formulation acceptance for in vivo dosing and formulation development Finally it should be possible to exclude or at least be aware of a potential impact of excipient(s) on the drug disposition Data can also be applied to identify both the activity of a certain excipient with different compounds and the excipient sensitivity of compounds with similar properties
53
Compound characteristics
Formulation principle Excipients
Formulation properties
In vitro assays using blood plasma
Data analysis
Adapt formulation In vivo application
Assess in vitro-in vivo correlation
Candidate-tailored formulation
Figure 5-2 Suggested flow chart for an iv formulation development strategy
In conclusion substantial drug-excipient interactions in animals have been
identified for different excipients commonly used in drug formulation and pharmacologically active compounds with diverse properties These findings support the assumption that certain excipients are not ldquoinertrdquo but are ldquofunctionalrdquo excipients and are able to alter the disposition of co-administered drugs Such data need special attention since excipient-related changes may occur with similar or other drugexcipient formulations Identifying excipient-drug interactions and understanding how excipients affect the drug behavior will assist in the pharmacokinetic characterization and the formulation developmentoptimization of drug candidates in development Furthermore a better knowledge of the relationship between drug excipient and blood constituents suggests new approaches in drug development in terms of controlling the pharmacokinetic profile by the right choice of excipient and its amount This may enable to better anticipate the target of different blood and body compartments without extensive animal and human tests potentially resulting in modulated pharmacological responses
54
6 Outlook
The results of this work demonstrated the ability of commonly used injectable excipients especially CEL HP-β-CyD and SHS to influence pharmacokinetic parameters in blood consequently contributing to altered drug disposition following iv dosing However to increase the knowledge of drug-excipient interactions additional studies are required to confirm the above findings with further drugexcipient formulations and with an emphasis on the role of excipients per se in pharmacokinetics of parenteral drugs
The excipients were tested in vitro and in vivo at a fixed concentration of 05 in
blood being within the normal range for animal injections and higher for clinical ones Investigations by varying the excipient amount would give insight into the concentration-effect relationship and potency of excipients Examination of lower excipient levels should also give an indication about the relevance and impact of excipient-induced alterations on applications in humans
No direct correlation between the interacting excipient and the compound
properties were found and no trends could be apparently observed in changes regarding the excipient characteristics Continued investigations are necessary to elucidate whether observed phenomena are associated with certain drugs or more by some drug classes characterized by specific physicochemical properties Focusing on excipients it would be of interest to explore more in detail the frequency and significance of interactions and the excipient preference in terms of particular changes
The emphasis throughout the current work was placed on providing an insight into
excipient-triggered effects and their in vitro-in vivo correlation According to the literature little is known about mechanisms underlying these alterations taking into account in vitro-in vivo investigations (94110112) To explain findings and improve excipient characterization further investigations should focus on the mechanistic basis for the role of excipients in protein binding bloodplasma partitioning and cellular distribution using in vitro assays appropriate to understand the observed effects In addition modification of in vitro approaches could facilitate correlation of effects and mechanisms determined in vitro with in vivo situations increase the understanding of in vitro-in vivo relationships and enable extrapolation of in vitro results to in vivo pharmacokinetics A better in vitro-in vivo correlation could also reduce in vivo studies and may contribute to more efficient drug development
There are drug-drug interactions reported in the literature where drugs were
administered intravenously in conjunction with excipient-containing formulation of other drugs (eg valspodar formulated in CEL) (108109) Most likely the presence of excipient(s) in drug formulations contributed to observed pharmacokinetic interactions
55
The research into the potential of excipients to induce kinetic alterations of agents administered intravenously in conjunction with excipient-containing formulation of other compounds should lead to a deeper insight into drug-drug interactions These data may provide helpful information relevant for safety issues dosage planning and treatment optimization in clinical drug monitoring
Further studies could focus on the potential clinical significance of drug-excipient
interactions observed in animals Finally ongoing efforts for a proper understanding of excipients as biologically and
pharmacologically active compounds will allow a better control of designing formulations with optimal characteristics for a better drug therapy
56
7 References
References to external publications and books
(1) Values received from Charles River Laboratoires (2) In E Green (ed) The biology of the laboratory mouse McGraw-Hill Inc New York 1966 (3) In H Baker J Lindsey and S Weisbroth (eds) The laboratory rat Academic Press Inc
New York 1979 (4) H E Weimer D M Roberts P Villanuevo and H G Porter Genetic differences in
electrophoretic patterns during the phlogistic response in the albino rat Comp Biochem Physiol B 43965-973 (1972)
(5) Geigy Scientific Tables 8th ed Vol2 Ciba-Geigy Basel 1983 (6) M Lemaire Drug binding to leucocytes and platelets Symposia Medica Hoechst 79-93
(1986) (7) P H Hinderling Red blood cells a neglected compartment in pharmacokinetics and
pharmacodynamics Pharmacol Rev 49279-295 (1997) (8) J Tillement G Houin R Zini S Urien E Albengres J Barre M Lecomte P DAthis and
B Sebille The binding of drugs to blood plasma macromolecules recent advances and therapeutic significance Adv Drug Res 1359-94 (1984)
(9) Z H Israili and P G Dayton Human alpha-1-glycoprotein and its interactions with drugs Drug Metab Rev 33161-235 (2001)
(10) K M Wasan and S M Cassidy Role of plasma lipoproteins in modifying the biological activity of hydrophobic drugs J Pharm Sci 87411-424 (1998)
(11) P du Souich J Verges and S Erill Plasma protein binding and pharmacological response Clin Pharmacokinet 24435-440 (1993)
(12) F Akhlaghi and A K Trull Distribution of cyclosporin in organ transplant recipients Clin Pharmacokinet 41615-637 (2002)
(13) G M Pacifici and A Viani Methods of determining plasma and tissue binding of drugs Pharmacokinetic consequences Clin Pharmacokinet 23449-468 (1992)
(14) J Oravcova B Bohs and W Lindner Drug-protein binding sites New trends in analytical and experimental methodology J Chromatogr B Biomed Appl 6771-28 (1996)
(15) Z Liu F Li and Y Huang Determination of unbound drug concentration and protein-drug binding fraction in plasma Biomed Chromatogr 13262-266 (1999)
(16) A Lipinski Experimental and computational approaches to estimate solubility and permeability in drug discovery and development settings Adv Drug Deliv Rev 233-26 (1997)
(17) R Panchagnula N S Thomas Biopharmaceutics and pharmacokinetics in drug research Int J Pharm 201131-150 (2000)
(18) M S Lajiness M Vieth and J Erickson Molecular properties that influence oral drug-like behavior 16 Curr Opin Drug Discov Devel 7470-477 (2004)
(19) H van de Waterbeemd G Camenisch G Folkers J R Chretien and O A Raevsky Estimation of blood-brain barrier crossing of drugs using molecular size and shape and H-bonding descriptors J Drug Target 6151-165 (1998)
(20) B Testa P Crivori M Reist P Carrupt The influence of lipophilicity on the pharmacokinetic behavior of drugs concepts and examples Persp Drug Discov Design 19179-211 (2000)
(21) In V Pliska B Testa H van Waterbeemd (eds) Methods and Principles in Medicinal Chemistry Vol4 VCH Weinheim Germany 1996
(22) G L Amidon H Lennernas V P Shah and J R Crison A theoretical basis for a biopharmaceutic drug classification the correlation of in vitro drug product dissolution and in vivo bioavailability Pharm Res 12413-420 (1995)
(23) C A Lipinski Poor aqueous solubility - an industry-wide problem in ADME screening Capsugel Symposium Tokyo Japan 33-48 (2003)
(24) C A Lipinski Drug-like properties and the causes of poor solubility and poor permeability J Pharmacol Toxicol Methods 44235-249 (2000)
57
(25) K R Horspool and C A Lipinski Advancing new drug delivery concepts to gain the lead Drug Deliv Technol 334-46 (2003)
(26) M Kaushal Amorphous drug delivery systems molecular aspects design and performance Crit Rev Ther Drug Carrier Sys 21133-193 (2004)
(27) H Fischer Blood-brain barrier permeation molecular parameters governing passive diffusion J Membrane Biol 165201-211 (1998)
(28) A Seelig A general pattern for substrate recognition by P-glycoprotein Eur J Biochem 251252-261 (1998)
(29) A Seelig X L Blatter and F Wohnsland Substrate recognition by P-glycoprotein and the multidrug resistance-associated protein MRP1 a comparison Int J Clin Pharmacol Ther 38111-121 (2000)
(30) D E Clark Rapid calculation of polar molecular surface area and its application to the prediction of transport phenomena 2 Prediction of blood-brain barrier penetration J Pharm Sci 88815-821 (1999)
(31) J Kelder Polar molecular surface as a dominating determinant for oral absorption and brain penetration of drugs Pharm Res 161514-1519 (1999)
(32) K Palm K Luthman A L Ungell G Strandlund and P Artursson Correlation of drug absorption with molecular surface properties J Pharm Sci 8532-39 (1996)
(33) K Palm P Stenberg K Luthman and P Artursson Polar molecular surface properties predict the intestinal absorption of drugs in humans Pharm Res 14568-571 (1997)
(34) D E Clark Rapid calculation of polar molecular surface area and its application to the prediction of transport phenomena 1 Prediction of intestinal absorption J Pharm Sci 88807-814 (1999)
(35) H van der Waterbeemd G Camenisch G Folkers and O A Raevsky Estimation of Caco-2 cell permeability using calculated molecular descriptors Quant Struct Act Relat 15480-490 (1996)
(36) S Winiwarter N M Bonham F Ax A Hallberg H Lennernas and A Karlen Correlation of human jejunal permeability (in vivo) of drugs with experimentally and theoretically derived parameters A multivariate data analysis approach J Med Chem 414939-4949 (1998)
(37) A Bergstroem Absorption classification of oral drugs based on molecular surface properties J Med Chem 46558-570 (2003)
(38) D F Veber S R Johnson H Y Cheng B R Smith K W Ward and K D Kopple Molecular properties that influence the oral bioavailability of drug candidates J Med Chem 452615-2623 (2002)
(39) J F Pritchard M Jurima-Romet M L Reimer E Mortimer B Rolfe and M N Cayen Making better drugs Decision gates in non-clinical drug development Nat Rev Drug Discov 2542-553 (2003)
(40) P Preziosi Opinion science pharmacoeconomics and ethics in drug RampD a sustainable future scenario Nature Rev Drug Discov 3521-526 (2004)
(41) I Kola Opinion Can the pharmaceutical industry reduce attrition rates Nature Rev Drug Discov 3711-716 (2004)
(42) L J Lesko M Rowland C C Peck T F Blaschke D Breimer H J de Jong A Grahnen J J Kuhlmann and B Stewart Optimizing the science of drug development opportunities for better candidate selection and accelerated evaluation in humans Eur J Pharm Sci 10iv-xiv (2000)
(43) G Lappin and R C Garner Big physics small doses the use of AMS and PET in human microdosing of development drugs Nat Rev Drug Discov 2233-240 (2003)
(44) R D Combes T Berridge J Connelly M D Eve R C Garner S Toon and P Wilcox Early microdose drug studies in human volunteers can minimise animal testing proceedings of a workshop organised by volunteers in research and testing Eur J Pharm Sci 191-11 (2003)
(45) Biomarkers definitions working group Biomarkers and surrogate endpoints preferred definitions and conceptual framework Clin Pharmacol Ther 6989-95 (2001)
(46) J Lesko Use of biomarkers and surrogate endpoints in drug development and regulatory decision making criteria validation strategies Annu Rev Pharmacol Toxicol 41347-366 (2001)
58
(47) R Frank and R Hargreaves Clinical biomarkers in drug discovery and development Nat Rev Drug Discov 2566-580 (2003)
(48) M Bergstrom A Grahnen and B Langstrom Positron emission tomography microdosing a new concept with application in tracer and early clinical drug development Eur J Clin Pharmacol 59357-366 (2003)
(49) M Jagoda Experiment assessment of mass effects in the rat implications for small animal PET imaging Nucl Med Biol 31771-779 (2004)
(50) Y C Lee P D Zocharski and B Samas An intravenous formulation decision tree for discovery compound formulation development Int J Pharm 253111-119 (2003)
(51) B Bittner and R J Mountfield Intravenous administration of poorly soluble new drug entities in early drug discovery the potential impact of formulation on pharmacokinetic parameters Curr Opin Drug Discov Devel 559-71 (2002)
(52) A K Singla A Garg and D Aggarwal Paclitaxel and its formulations Int J Pharm 235179-192 (2002)
(53) N Maurer D B Fenske and P R Cullis Developments in liposomal drug delivery systems Expert Opin Biol Ther 1923-947 (2001)
(54) R G Strickley Solubilizing excipients in oral and injectable formulations Pharm Res 21201-230 (2004)
(55) A G Floyd Top ten considerations in the development of parenteral emulsions 4134-143 (1999)
(56) M J Lawrence and G D Rees Microemulsion-based media as novel drug delivery systems Adv Drug Deliv Rev 4589-121 (2000)
(57) E Merisko-Liversidge G G Liversidge and E R Cooper Nanosizing a formulation approach for poorly-water-soluble compounds Eur J Pharm Sci 18113-120 (2003)
(58) E B Rabinow Nanosuspensions in drug delivery Nature Rev Drug Discov 3785-796 (2004)
(59) H Karl A good practice guide to the administration of substances and removal of blood including routes and volumes J Appl Toxicol 2115-23 (2001)
(60) D M Woodcock S Jefferson M E Linsenmeyer P J Crowther G M Chojnowski B Williams and I Bertoncello Reversal of the multidrug resistance phenotype with Cremophor EL a common vehicle for water-insoluble vitamins and drugs Cancer Res 504199-4203 (1990)
(61) D M Woodcock M E Linsenmeyer G Chojnowski A B Kriegler V Nink L K Webster and W H Sawyer Reversal of multidrug resistance by surfactants Br J Cancer 6662-68 (1992)
(62) J M Dintaman and J A Silverman Inhibition of P-glycoprotein by D-alpha-tocopheryl polyethylene glycol 1000 succinate (TPGS) Pharm Res 161550-1556 (1999)
(63) K R W A S C Wandel C Inactive ingredients may alter bioavailability of drugs through effects on P-glycoprotein (PGP) and CYP3A Clin Pharmacol Ther 69P71 (2001)
(64) A N Abulrob M Mason R Bryce and M Gumbleton The effect of fatty acids and analogues upon intracellular levels of doxorubicin in cells displaying P-glycoprotein mediated multidrug resistance J Drug Target 8247-256 (2000)
(65) G Cornaire J F Woodley S Saivin J Y Legendre S Decourt A Cloarec and G Houin Effect of polyoxyl 35 castor oil and polysorbate 80 on the intestinal absorption of digoxin in vitro Arzneimittelforschung 50576-579 (2000)
(66) E D Hugger B L Novak P S Burton K L Audus and R T Borchardt A comparison of commonly used polyethoxylated pharmaceutical excipients on their ability to inhibit P-glycoprotein activity in vitro J Pharm Sci 911991-2002 (2002)
(67) J Zastre J Jackson M Bajwa R Liggins F Iqbal and H Burt Enhanced cellular accumulation of a P-glycoprotein substrate rhodamine-123 by Caco-2 cells using low molecular weight methoxypolyethylene glycol-block-polycaprolactone diblock copolymers Eur J Pharm Biopharm 54299-309 (2002)
(68) A V Kabanov E V Batrakova and D W Miller Pluronic block copolymers as modulators of drug efflux transporter activity in the blood-brain barrier Adv Drug Deliv Rev 55151-164 (2003)
59
(69) D W Miller E V Batrakova and A V Kabanov Inhibition of multidrug resistance-associated protein (MRP) functional activity with pluronic block copolymers Pharm Res 16396-401 (1999)
(70) K Yunomae H Arima F Hirayama and K Uekama Involvement of cholesterol in the inhibitory effect of dimethyl-beta-cyclodextrin on P-glycoprotein and MRP2 function in Caco-2 cells FEBS Lett 536225-231 (2003)
(71) M M Nerurkar P S Burton and R T Borchardt The use of surfactants to enhance the permeability of peptides through Caco-2 cells by inhibition of an apically polarized efflux system Pharm Res 13528-534 (1996)
(72) R J Mountfield S Senepin M Schleimer I Walter and B Bittner Potential inhibitory effects of formulation ingredients on intestinal cytochrome P450 Int J Pharm 21189-92 (2000)
(73) B M Johnson W N Charman and C J Porter An in vitro examination of the impact of polyethylene glycol 400 Pluronic P85 and vitamin E d-alpha-tocopheryl polyethylene glycol 1000 succinate on P-glycoprotein efflux and enterocyte-based metabolism in excised rat intestine AAPS PharmSci 4E40 (2002)
(74) R C Bravo Gonzalez J Huwyler F Boess I Walter and B Bittner In vitro investigation on the impact of the surface-active excipients Cremophor EL Tween 80 and Solutol HS 15 on the metabolism of midazolam Biopharm Drug Dispos 2537-49 (2004)
(75) A G Bagnarello L A Lewis M C McHenry A J Weinstein H K Naito A J McCullough R J Lederman and T L Gavan Unusual serum lipoprotein abnormality induced by the vehicle of miconazole N Engl J Med 296497-499 (1977)
(76) H K Naito and L A Lewis Induced hyperlipidemia and delipidation of serum alpha-lipoproteins by polyethoxylated castor oil Protides Biol Fluids 25COM2-398 (1978)
(77) H K Naito M C McHenry and L A Lewis Drug-induced dyslipoproteinemia a report of two cases Clin Chem 26163-168 (1980)
(78) M Hacker M Koeferl C B Hong and M A Fagan Cremophor and Emulphor induced alterations of serum lipids and lipoprotein electrophoretic patterns of dogs Res Commun Chem Pathol Pharmacol 31119-128 (1981)
(79) M Kongshaug L S Cheng J Moan and C Rimington Interaction of Cremophor EL with human plasma Int J Biochem 23473-478 (1991)
(80) K Woodburn and D Kessel The alteration of plasma lipoproteins by Cremophor EL J Photochem Photobiol B 22197-201 (1994)
(81) D Kessel K Woodburn D Decker and E Sykes Fractionation of Cremophor EL delineates components responsible for plasma lipoprotein alterations and multidrug resistance reversal Oncol Res 7207-212 (1995)
(82) E Sykes K Woodburn D Decker and D Kessel Effects of Cremophor EL on distribution of Taxol to serum lipoproteins Br J Cancer 70401-404 (1994)
(83) G M Garbo The use of liposomes emulsions or inclusion complexes may potentiate in vivo effects of SnET2 Proc SPIE 1203118-125 (1990)
(84) D Kessel A Morgan and G M Garbo Sites and efficacy of photodamage by tin etiopurpurin in vitro using different delivery systems Photochem Photobiol 54193-196 (1991)
(85) K Woodburn C K Chang S Lee B Henderson and D Kessel Biodistribution and PDT efficacy of a ketochlorin photosensitizer as a function of the delivery vehicle Photochem Photobiol 60154-159 (1994)
(86) L K Webster E J Cosson K H Stokes and M J Millward Effect of the paclitaxel vehicle Cremophor EL on the pharmacokinetics of doxorubicin and doxorubicinol in mice Br J Cancer 73522-524 (1996)
(87) T Colombo P O Gonzalez M Zucchetti A Maneo C Sessa A Goldhirsch M DIncalci and M Maneo Paclitaxel induces significant changes in epidoxorubicin distribution in mice Ann Oncol 7801-805 (1996)
(88) T Colombo I Parisi M Zucchetti C Sessa A Goldhirsch and M DIncalci Pharmacokinetic interactions of paclitaxel docetaxel and their vehicles with doxorubicin Ann Oncol 10391-395 (1999)
(89) M J Millward L K Webster D Rischin K H Stokes G C Toner J F Bishop I N Olver B M Linahan M E Linsenmeyer and D M Woodcock Phase I trial of cremophor EL with bolus doxorubicin Clin Cancer Res 42321-2329 (1998)
60
(90) J Liu E H Kraut S Balcerzak M Grever S DAmbrosio and K K Chan Dosing sequence-dependent pharmacokinetic interaction of oxaliplatin with paclitaxel in the rat Cancer Chemother Pharmacol 50445-453 (2002)
(91) A Sparreboom O van Tellingen W J Nooijen and J H Beijnen Nonlinear pharmacokinetics of paclitaxel in mice results from the pharmaceutical vehicle Cremophor EL Cancer Res 562112-2115 (1996)
(92) A G Ellis and L K Webster Inhibition of paclitaxel elimination in the isolated perfused rat liver by Cremophor EL Cancer Chemother Pharmacol 4313-18 (1999)
(93) L Gianni L Vigano A Locatelli G Capri A Giani E Tarenzi and G Bonadonna Human pharmacokinetic characterization and in vitro study of the interaction between doxorubicin and paclitaxel in patients with breast cancer J Clin Oncol 151906-1915 (1997)
(94) A Sparreboom L van Zuylen E Brouwer W J Loos P de Bruijn H Gelderblom M Pillay K Nooter G Stoter and J Verweij Cremophor EL-mediated alteration of paclitaxel distribution in human blood clinical pharmacokinetic implications Cancer Res 591454-1457 (1999)
(95) L van Zuylen J Verweij and A Sparreboom Role of formulation vehicles in taxane pharmacology Invest New Drugs 19125-141 (2001)
(96) D Kessel Properties of Cremophor EL micelles probed by fluorescence Photochem Photobiol 56447-451 (1992)
(97) W J Loos J Szebeni A J ten Tije J Verweij D M van Zomeren K N Chung K Nooter G Stoter and A Sparreboom Preclinical evaluation of alternative pharmaceutical delivery vehicles for paclitaxel Anticancer Drugs 13767-775 (2002)
(98) Dhanikula AB Singh DR and Panchagnula R In vivo pharmacokinetic and tissue distribution studies in mice of alternative formulations for local and systemic delivery of paclitaxel gel film prodrug liposomes and micelles Curr Drug Deliv 235-44 (2005)
(99) Solvent-free paclitaxel formulation better than taxol Scrip (S00825922 20031209) 2003 (100) L Vigano A Locatelli G Grasselli and L Gianni Drug interactions of paclitaxel and
docetaxel and their relevance for the design of combination therapy Invest New Drugs 19179-196 (2001)
(101) R Danesi F Innocenti S Fogli A Gennari E Baldini A Di Paolo B Salvadori G Bocci P F Conte and M Del Tacca Pharmacokinetics and pharmacodynamics of combination chemotherapy with paclitaxel and epirubicin in breast cancer patients Br J Clin Pharmacol 53508-518 (2002)
(102) S Fogli R Danesi A Gennari S Donati P F Conte and M Del Tacca Gemcitabine epirubicin and paclitaxel pharmacokinetic and pharmacodynamic interactions in advanced breast cancer Ann Oncol 13919-927 (2002)
(103) T Kasai M Oka H Soda J Tsurutani M Fukuda Y Nakamura S Kawabata K Nakatomi S Nagashima H Takatani M Fukuda A Kinoshita and S Kohno Phase I and pharmacokinetic study of paclitaxel and irinotecan for patients with advanced non-small cell lung cancer Eur J Cancer 381871-1878 (2002)
(104) B L Lum S Kaubisch A M Yahanda K M Adler L Jew M N Ehsan N A Brophy J Halsey M P Gosland and B I Sikic Alteration of etoposide pharmacokinetics and pharmacodynamics by cyclosporine in a phase I trial to modulate multidrug resistance J Clin Oncol 101635-1642 (1992)
(105) N J Lacayo B L Lum D L Becton H Weinstein Y Ravindranath M N Chang L Bomgaars S J Lauer B I Sikic and G V Dahl Pharmacokinetic interactions of cyclosporine with etoposide and mitoxantrone in children with acute myeloid leukemia Leukemia 16920-927 (2002)
(106) D A Rushing S R Raber K A Rodvold S C Piscitelli G S Plank and D A Tewksbury The effects of cyclosporine on the pharmacokinetics of doxorubicin in patients with small cell lung cancer Cancer 74834-841 (1994)
(107) B L Samuels R Mick N J Vogelzang S F Williams R L Schilsky A R Safa S M OBrien and M J Ratain Modulation of vinblastine resistance with cyclosporine a phase I study Clin Pharmacol Ther 54421-429 (1993)
61
(108) D J Boote I F Dennis P R Twentyman R J Osborne C Laburte S Hensel J F Smyth M H Brampton and N M Bleehen Phase I study of etoposide with SDZ PSC 833 as a modulator of multidrug resistance in patients with cancer J Clin Oncol 14610-618 (1996)
(109) H Minami T Ohtsu H Fujii T Igarashi K Itoh N Uchiyama-Kokubu T Aizawa T Watanabe Y Uda Y Tanigawara and Y Sasaki Phase I study of intravenous PSC-833 and doxorubicin reversal of multidrug resistance Jpn J Cancer Res 92220-230 (2001)
(110) M Jin T Shimada K Yokogawa M Nomura Y Mizuhara H Furukawa J Ishizaki and K Miyamoto Cremophor EL releases cyclosporin A adsorbed on blood cells and blood vessels and increases apparent plasma concentration of cyclosporin A Int J Pharm 293137-144 (2005)
(111) M E Davis and M E Brewster Cyclodextrin-based pharmaceutics past present and future Nat Rev Drug Discov 31023-1035 (2004)
(112) V J Stella V M Rao E A Zannou and V Zia V Mechanisms of drug release from cyclodextrin complexes Adv Drug Deliv Rev 363-16 (1999)
(113) H W Frijlink A C Eissens N R Hefting K Poelstra C F Lerk and D K Meijer The effect of parenterally administered cyclodextrins on cholesterol levels in the rat Pharm Res 89-16 (1991)
(114) H W Frijlink E J Franssen A C Eissens R Oosting C F Lerk and D K Meijer The effects of cyclodextrins on the disposition of intravenously injected drugs in the rat Pharm Res 8380-384 (1991)
(115) E E Sideris M A Koupparis and P E Macheras Effect of cyclodextrins on protein binding of drugs the diflunisalhydroxypropyl-beta-cyclodextrin model case Pharm Res 1190-95 (1994)
(116) P Y Grosse F Bressolle P Rouanet and J M Joulia Methyl-beta-cyclodextrin and doxorubicin pharmacokinetics and tissue concentrations following bolus injection of these drugs alone or together in the rabbit Int J Pharm 180215-223 (1999)
(117) T Shinoda S Kagatani A Maeda Y Konno H Hashimoto K Hara K Fujita and T Sonobe Sugar-branched-cyclodextrins as injectable drug carriers in mice Drug Dev Ind Pharm 251185-1192 (1999)
(118) B McCormack and G Gregoriadis Comparative studies of the fate of free and liposome-entrapped hydroxypropyl-beta-cyclodextrindrug complexes after intravenous injection into rats implications in drug delivery Biochim Biophys Acta 1291237-244 (1996)
(119) A Sharma K Anderson and J W Baker Flocculation of serum lipoproteins with cyclodextrins application to assay of hyperlipidemic serum Clin Chem 36529-532 (1990)
(120) A Sharma and L S Janis Lipoprotein-cyclodextrin interaction Clin Chim Acta 199129-137 (1991)
(121) T Irie M Otagiri M Sunada K Uekama Y Ohtani Y Yamada and Y Sugiyama Cyclodextrin-induced hemolysis and shape changes of human erythrocytes in vitro J Pharmacobiodyn 5741-744 (1982)
(122) M E Brewster W R Anderson D Meinsma D Moreno A I Webb L Pablo K S Estes H Derendorf N Bodor R Sawchuk B Cheung and E Pop Intravenous and oral pharmacokinetic evaluation of a 2-hydroxypropyl-beta-cyclodextrin-based formulation of carbamazepine in the dog comparison with commercially available tablets and suspensions J Pharm Sci 86335-339 (1997)
(123) K Dietzel K S Estes M E Brewster N S Bodor and H Derendorf The use of 2-hydroxypropyl-beta-cyclodextrin as a vehicle for intravenous administration of dexamethasone in dogs Int J Pharm 59225-230 (1990)
(124) J Cummings G J Forrest D Cunningham N L Gilchrist and M Soukop Influence of polysorbate 80 (Tween 80) and etoposide (VP-16-213) on the pharmacokinetics and urinary excretion of adriamycin and its metabolites in cancer patients Cancer Chemother Pharmacol 1780-84 (1986)
(125) W J Loos S D Baker J Verweij J G Boonstra and A Sparreboom Clinical pharmacokinetics of unbound docetaxel role of polysorbate 80 and serum proteins Clin Pharmacol Ther 74364-371 (2003)
62
(126) O van Tellingen J H Beijnen J Verweij E J Scherrenburg W J Nooijen and A Sparreboom Rapid esterase-sensitive breakdown of polysorbate 80 and its impact on the plasma pharmacokinetics of docetaxel and metabolites in mice Clin Cancer Res 52918-2924 (1999)
(127) K Woodburn E Sykes and D Kessel Interactions of Solutol HS 15 and Cremophor EL with plasma lipoproteins Int J Biochem Cell Biol 27693-699 (1995)
(128) J M Grindel T Jaworski R M Emanuele and P Culbreth Pharmacokinetics of a novel surface-active agent purified poloxamer 188 in rat rabbit dog and man Biopharm Drug Dispos 2387-103 (2002)
(129) T W Guentert S Oie L Paalzow B M Frey R Brandt L J Aarons and M Rowland Interaction of mixed micelles formed from glycocholic acid and lecithin with the protein binding of various drugs Br J Clin Pharmacol 23569-577 (1987)
(130) P R Cullis A Chonn and S C Semple Interactions of liposomes and lipid-based carrier systems with blood proteins Relation to clearance behaviour in vivo Adv Drug Deliv Rev 323-17 (1998)
(131) P Opanasopit M Nishikawa and M Hashida Factors affecting drug and gene delivery effects of interaction with blood components Crit Rev Ther Drug Carrier Syst 19191-233 (2002)
(132) L Araujo R Lobenberg and J Kreuter Influence of the surfactant concentration on the body distribution of nanoparticles J Drug Target 6373-385 (1999)
(133) S Stolnik B Daudali A Arien J Whetstone C R Heald M C Garnett S S Davis and L Illum The effect of surface coverage and conformation of poly(ethylene oxide) (PEO) chains of poloxamer 407 on the biological fate of model colloidal drug carriers Biochim Biophys acta 1514261-279 (2001)
(134) J F Krzyzaniak D M Raymond and S H Yalkowsky Lysis of human red blood cells 2 Effect of contact time on cosolvent induced hemolysis Int J Pharm 152193-200 (1997)
(135) F Mottu M J Stelling D A Rufenacht and E Doelker Comparative hemolytic activity of undiluted organic water-miscible solvents for intravenous and intra-arterial injection PDA J Pharm Sci Technol 5516-23 (2001)
(136) E Soderlind M Wollbratt and C von Corswant The usefulness of sugar surfactants as solubilizing agents in parenteral formulations Int J Pharm 25261-71 (2003)
(137) B Nuijen M Bouma C Manada J M Jimeno A Bult and J H Beijnen In vitro hemolysis and buffer capacity studies with the novel marine anticancer agent kahalalide F and its reconstitution vehicle Cremophor ELethanol PDA J Pharm Sci Technol 55223-229 (200)
(138) R A Rajewski G Traiger J Bresnahan P Jaberaboansari V J Stella and D O Thompson Preliminary safety evaluation of parenterally administered sulfoalkyl ether beta-cyclodextrin derivatives J Pharm Sci 84927-932 (1995)
(139) T M Florence and J L Stauber Hemolysis of human erythrocytes by alpha-tocopheryl succinate J Nutrit Environ Med 8345-347 (1998)
(140) J Neuzil M Zhao G Ostermann M Sticha N Gellert C Weber J W Eaton and U T Brunk Alpha-tocopheryl succinate an agent with in vivo anti-tumour activity induces apoptosis by causing lysosomal instability Biochem J 362709-715 (2002)
(141) S H Wu and W K Hopkins Characteristics of d-a-tocopheryl PEG 1000 succinate for applications as an absorption enhancer in drug delivery systems Pharm Technol 2352-68 (1999)
(142) H W Frijlink J Visser N R Hefting R Oosting D K Meijer and C F Lerk The pharmacokinetics of beta-cyclodextrin and hydroxypropyl-beta-cyclodextrin in the rat Pharm Res 71248-1252 (1990)
(143) V J Stella and R A Rajewski Cyclodextrins their future in drug formulation and delivery Pharm Res 14556-567 (1997)
(144) In P K Gupta and G A Brazeau (eds) Injectable drug development techniques to reduce pain and irritation Interpharm Press Denver Colorado 1999
(145) B Davies and T Morris Physiological parameters in laboratory animals and humans Pharm Res 101093-1095 (1993)
63
References to internal reports of Novartis Pharma AG
(146) In vitro blood distribution and plasma protein binding of [3H]COM1 including stability in blood and plasma for rat and human PCS(EU) R0400014 Preclinical Safety Novartis Pharma AG Basel Switzerland 14-May-2004
(147) In vitro blood distribution and stability of [3H]COM2 for mouse rat and human PCS(EU) R0201077 Preclinical Safety Novartis Pharma AG Basel Switzerland 07-May-2003
(148) In vitro blood distribution plasma protein binding and stability in blood and plasma of [3H]COM3 for mouse rat dog cynomolgus monkey and human DMPK R0400595 Drug Metabolism and Pharmacokinetics Novartis Pharma AG Basel Switzerland 01-Feb-2005
(149) In vitro blood distribution and plasma protein binding of [14C]COM4 and stability in blood and plasma for rat ferret dog monkey and human PCS(EU) R0201539 Preclinical Safety Novartis Pharma AG Basel Switzerland 24-Sep-2003
(150) In vitro blood distribution plasma protein binding and stability in blood of [14C]COM5 for mouse rat dog and human PCS(EU) R0201107 Preclinical Safety Novartis Pharma AG Basel Switzerland 14-May-2003
(151) Absorption distribution and excretion of [14C]COM5 after single intravenous (1 mLkg) and oral (3 mgkg) administration to rat PCS(EU) R0201108 Preclinical Safety Novartis Pharma AG Basel Switzerland 19-May-2003
(152) ADME in rat after oral (08 mgkg) and intravenous (04 mgkg) administration of [14C]COM4 PCS(EU) R0201540 Preclinical Safety Novartis Pharma AG Basel Switzerland 19-Dec-2003
(153) Blood pharmacokinetics tissue distribution and excretion of [3H]COM2 in OF1 normal male mice and brain penetration of [3H]COM2 in APP23 transgenic and wild-type female mice after single intravenous (4 microgkg) administration PCS(EU) R0201082 Preclinical Safety Novartis Pharma AG Basel Switzerland 08-May-2003
64
8 Appendix
Raw data of COM1 in rat
In vitro blood distribution of [3H]COM1 using blood pools with different hematocrits
Total radioactivity concentration determined in blood and plasma
Excipient Nominal COM1 H Incubation Actual values
in blood time (pg-eqmL mean plusmnSD n=3) in blood (pgmL) (min) Blood Plasma
None 60 048 0 53 plusmn 1 76 plusmn 1 (Glu) 5 53 plusmn 1 75 plusmn 0 10 52 plusmn 1 74 plusmn 1 20 52 plusmn 0 74 plusmn 1 6000 0 5335 plusmn 80 7835 plusmn 121 5 5637 plusmn 116 7784 plusmn 103 10 5576 plusmn 40 7598 plusmn 114 20 5502 plusmn 76 7502 plusmn 98 HP-β-CyD 05 60 048 0 62 plusmn 1 97 plusmn 0 5 62 plusmn 1 96 plusmn 1 10 62 plusmn 1 94 plusmn 1 20 62 plusmn 0 93 plusmn 1 6000 0 6564 plusmn 21 10052 plusmn 31 5 6550 plusmn 30 10057 plusmn 214 10 6434 plusmn 85 9896 plusmn 66 20 6280 plusmn 213 9918 plusmn 80 5 60 045 0 64 plusmn 0 102 plusmn 1 5 65 plusmn 1 102 plusmn 1 10 63 plusmn 1 102 plusmn 1 20 64 plusmn 1 101 plusmn 1 6000 0 6516 plusmn 132 10660 plusmn 26 5 6598 plusmn 273 10762 plusmn 382 10 6475 plusmn 288 10454 plusmn 163 20 6653 plusmn 79 10482 plusmn 130 SHS 05 60 048 0 60 plusmn 2 86 plusmn 2 5 60 plusmn 0 94 plusmn 19 10 60 plusmn 1 81 plusmn 1 20 60 plusmn 0 81 plusmn 1 6000 0 6265 plusmn 40 8845 plusmn 102 5 6240 plusmn 92 8562 plusmn 44 10 6127 plusmn 110 8432 plusmn 35 20 6104 plusmn 112 8109 plusmn 122 5 60 045 0 59 plusmn 1 93 plusmn 1 5 58 plusmn 1 92 plusmn 0 10 56 plusmn 1 91 plusmn 1 20 58 plusmn 1 91 plusmn 1 6000 0 6166 plusmn 65 9908 plusmn 44 5 6180 plusmn 162 9607 plusmn 123 10 6230 plusmn 99 9529 plusmn 119 20 6189 plusmn 104 9489 plusmn 211
65
In vitro blood distribution of [3H]COM1 continued
Excipient Nominal COM1 H Incubation Actual values
in blood time (pg-eqmL mean plusmnSD n=3) in blood (pgmL) (min) Blood Plasma
TPGS 05 60 048 0 59 plusmn 1 92 plusmn 1 5 58 plusmn 1 90 plusmn 1 10 58 plusmn 1 88 plusmn 2 20 58 plusmn 0 87 plusmn 1 6000 0 5494 plusmn 102 8949 plusmn 87 5 5518 plusmn 124 8549 plusmn 165 10 5552 plusmn 74 8387 plusmn 101 20 5431 plusmn 23 8286 plusmn 71 5 60 040 0 50 plusmn 1 81 plusmn 1 5 50 plusmn 1 80 plusmn 1 10 50 plusmn 0 79 plusmn 1 20 50 plusmn 1 72 plusmn 1 6000 0 5042 plusmn 20 8175 plusmn 148 5 5014 plusmn 34 7907 plusmn 136 10 5102 plusmn 59 7952 plusmn 77 20 5069 plusmn 68 7204 plusmn 35 Triplicate analyses were conducted on one aliquot for each time point
In vitro protein binding of [3H]COM1 using the same plasma pool
Total radioactivity concentration determined in plasma and ultrafiltrate samples
Excipient Nominal COM1 Actual values (pg-eqmL) in plasma (pgmL) Plasma Ultrafiltrate None 60 65 26 (Glu) 26 26 6000 6302 270 268 272 TPGS 05 60 62 27 21 29 6000 5708 171 230 133 5 60 67 12 13 11 6000 5886 187 103 68 Mean of duplicate determination of plasma spiked with different COM1 stock solutions
66
Tissue and plasma levels of parent drug and total radioactivity after iv administration of [3H]COM1 (4 microgkg) in the control group
Time Tissue Individual concentration values
(h) COM1 (pgg) Radioactivity (pg-eqg) 008 Plasma 866 381 958 2529 1871 2052 Lung 2012 1440 1867 3431 2224 2538 Heart 2366 973 1619 2593 1490 1808 Liver 1069 384 724 11805 9501 10699 Kidney 2263 995 1692 6350 5770 5281 Fat 2803 1982 4753 2638 2213 4859 Muscle 1405 811 1234 1312 882 1172 Skin 433 225 296 937 524 583 Brain 6229 4525 4712 5431 4004 4053 025 Plasma 275 257 178 1719 1482 1366 Lung 399 607 518 1491 1378 1374 Heart 517 645 285 1034 1023 778 Liver 274 511 238 7904 6502 6920 Kidney 557 664 321 5270 5046 5425 Fat 6508 5897 4206 5953 5307 4112 Muscle 565 574 306 659 686 463 Skin 228 213 219 581 702 570 Brain 3407 4085 3014 3033 3552 2719 05 Plasma 179 103 101 1525 1442 1379 Lung 622 367 335 1365 1089 1030 Heart 310 211 214 684 684 661 Liver 138 71 100 7090 5263 4993 Kidney 345 220 202 4924 4585 5053 Fat 8008 4790 4248 6586 4071 3649 Muscle 270 159 166 409 349 342 Skin 199 64 104 559 449 480 Brain 2676 2419 2123 2310 2180 1953 pgmL and pg-eqmL
67
Tissue and plasma levels of parent drug and total radioactivity after iv administration of [3H]COM1 (4 microgkg) in the TPGS group
Time Tissue Individual concentration values
(h) COM1 (pgg) Radioactivity (pg-eqg) 008 Plasma 312 297 278 2842 2939 3006 Lung 1370 1173 1560 2364 2057 2272 Heart 1190 971 912 1584 1262 1291 Liver 449 234 337 10459 8898 10720 Kidney 1012 768 806 5047 4767 4829 Fat 2182 1485 1860 2712 2380 1703 Muscle 845 726 1132 880 720 1046 Skin 100 45 53 665 351 343 Brain 4072 2765 3083 3816 2353 2709 025 Plasma 89 107 121 2040 2440 2368 Lung 531 688 546 1343 1488 1356 Heart 351 471 454 737 864 851 Liver 104 205 170 5354 6770 5184 Kidney 321 435 446 6931 4972 6603 Fat 1352 3916 1578 1456 4764 2035 Muscle 355 649 588 532 789 675 Skin 71 72 37 563 518 342 Brain 1811 2327 1955 1648 2017 1841 05 Plasma 35 65 61 2027 2054 2186 Lung 214 195 319 1172 1067 1115 Heart 167 207 250 539 566 650 Liver 75 70 117 4225 4417 4314 Kidney 197 209 215 6923 6364 5600 Fat 3406 2067 2295 3071 1625 2734 Muscle 191 226 256 343 394 368 Skin 120 52 41 515 389 398 Brain 1516 1332 1541 1413 1295 1480 pgmL and pg-eqmL
Ex vivo protein binding of [3H]COM1 in the control and TPGS group
Parent drug concentration determined in plasma and ultrafiltrate
Dose Time Individual values (pgmL)
(microgkg) (h) Plasma Ultrafiltrate Control group 4 008 794 169 169 025 249 55 51 050 137 27 26 TPGS group 27 008 331 127 120 025 120 41 44 050 60 25 24 Mean of duplicate determination of plasma pooled for each time point
68
Raw data of COM2 in mouse
In vitro blood distribution of [3H]COM2 using blood pools with different hematocrits
Total radioactivity concentration determined in blood and plasma
Excipient Nominal COM2 H Incubation Actual values
in blood time (pg-eqmL mean plusmnSD n=3) (pgmL) (min) Blood Plasma
None 100 045 5 115 plusmn 2 85 plusmn 3 (Glu) 60 115 plusmn 5 93 plusmn 4 240 112 plusmn 6 101 plusmn 2 CELEtOH 6535 100 045 5 104 plusmn 5 86 plusmn 4 60 105 plusmn 2 83 plusmn 1 240 102 plusmn 1 87 plusmn 6 100rsquo000 046 5 103797 plusmn 1430 83684 plusmn 1446 60 102979 plusmn 1547 81784 plusmn 896 240 105912 plusmn 2594 80887 plusmn 998 HP-β-CyD 100 045 5 103 plusmn 5 88 plusmn 2 60 104 plusmn 5 94 plusmn 1 240 99 plusmn 2 94 plusmn 7 100rsquo000 043 5 105176 plusmn 1165 92396 plusmn 1519 60 104609 plusmn 1238 95791 plusmn 668 240 107331 plusmn 880 96454 plusmn 1780 SHS 100 045 5 101 plusmn 1 86 plusmn 1 60 99 plusmn 4 85 plusmn 1 240 105 plusmn 3 84 plusmn 3 100rsquo000 044 5 118080 plusmn 891 99140 plusmn 1915 60 116422 plusmn 2822 93052 plusmn 1190 240 116363 plusmn 890 89790 plusmn 1735 PEG 200 100 045 5 124 plusmn 4 96 plusmn 1 60 125 plusmn 6 95 plusmn 2 240 122 plusmn 2 103 plusmn 5 100rsquo000 046 5 112001 plusmn 3923 87146 plusmn 1273 60 112161 plusmn 1189 89801 plusmn 1646 240 110680 plusmn 652 90561 plusmn 1883 TPGS 100 045 5 101 plusmn 2 115 plusmn 2 60 104 plusmn 2 101 plusmn 1 240 101 plusmn 3 95 plusmn 3 100rsquo000 043 5 100911 plusmn 1443 106192 plusmn 992 60 100608 plusmn 3207 88758 plusmn 1037 240 100236 plusmn 4088 81755 plusmn 810 Triplicate analyses were conducted on one aliquot for each time point similar to previous study
In vitro protein binding of [
3H]COM2 at 10 ngmL using the same plasma pool
Parent drug concentration determined in plasma and ultracentrifugate
Excipient Actual values (pgmL) in plasma Plasma Ultracentrifugate None 9649 166 (plasma) 9278 164 9162 164 9292 164 TPGS 05 8624 116 8651 124 8722 103 8739 99
69
Tissue and plasma levels of parent drug and total radioactivity after iv administration of [3H]COM2 (04 microgkg) in the control group
Time Tissue Individual concentration values
(h) COM2 (pgg) Radioactivity (pg-eqg) 008 Plasma 110 112 91 181 194 164 Lung 1964 1955 1504 2450 2199 1704 Heart 796 830 623 1074 950 741 Liver 2398 2387 1778 3112 3022 2360 Kidney 2083 1871 1327 2276 2024 1511 Fat 140 327 230 58 540 603 Muscle 124 170 203 160 218 234 Skin 0 35 10 14 76 32 Brain 1155 1112 1018 1097 1086 1046 025 Plasma 94 71 77 164 141 139 Lung 1344 908 1365 1648 1849 1759 Heart 495 465 433 622 593 580 Liver 1579 1214 1549 2218 2161 2381 Kidney 1194 1075 1259 1468 1445 1518 Fat 714 459 778 1103 977 1218 Muscle 201 217 227 251 268 258 Skin 113 16 59 160 73 114 Brain 1060 1191 1345 1064 1150 1287 05 Plasma 60 58 58 119 113 111 Lung 720 703 842 1192 1444 1350 Heart 295 262 331 454 447 447 Liver 978 861 1040 1918 2348 2129 Kidney 757 753 932 1017 1303 1336 Fat 1014 602 973 1836 1164 2203 Muscle 187 167 189 242 252 231 Skin 87 16 18 97 129 104 Brain 1209 1006 1044 1160 1003 1044 1 Plasma 32 41 28 60 79 49 Lung 369 478 468 1465 1274 1171 Heart 154 199 205 347 377 364 Liver 591 618 534 2077 1736 1383 Kidney 471 522 451 1088 1020 846 Fat 496 444 713 1066 1458 1253 Muscle 103 80 91 171 169 146 Skin 0 38 48 138 123 122 Brain 673 832 688 826 902 806 pgmL and pg-eqmL value below LOQ
70
Tissue and plasma levels of parent drug and total radioactivity after iv administration of [3H]COM2 (04 microgkg) in the TPGS group
Time Tissue Individual concentration values
(h) COM2 (pgg) Radioactivity (pg-eqg) 008 Plasma 223 248 268 506 549 606 Lung 1789 1913 1880 2036 2137 2116 Heart 661 711 724 766 890 924 Liver 2331 2252 2360 2593 2585 2656 Kidney 1697 1831 1677 1815 2014 1839 Fat 246 150 317 362 366 740 Muscle 108 190 272 144 246 330 Skin 0 20 60 39 36 77 Brain 913 1069 1133 904 1024 1080 025 Plasma 178 148 151 403 377 394 Lung 1522 1175 1133 1820 1412 1436 Heart 489 478 452 593 597 578 Liver 1636 1743 1500 2243 2293 2130 Kidney 1112 1114 1256 1387 1415 1513 Fat 932 915 1480 1742 1392 2239 Muscle 237 222 183 290 288 283 Skin 23 0 38 144 140 96 Brain 1088 1244 1207 1004 1150 1166 05 Plasma 111 118 143 330 359 421 Lung 890 911 968 1292 1728 1599 Heart 292 385 384 420 630 570 Liver 1086 1200 1128 1901 2342 2002 Kidney 864 996 1103 1124 1584 1452 Fat 1393 ― 765 1492 ― 1576 Muscle 156 181 173 232 273 269 Skin 44 73 114 106 131 192 Brain 1048 1272 1325 1003 1298 1237 1 Plasma 79 97 63 333 296 264 Lung 669 885 512 1672 1588 1769 Heart 231 285 143 519 483 423 Liver 774 1028 798 2073 1946 2394 Kidney 726 835 659 1431 1342 1374 Fat ― 320 688 ― 1036 1712 Muscle 143 137 76 210 240 221 Skin 30 147 52 158 220 194 Brain 1141 1188 889 1204 1202 1070 pgmL and pg-eqmL value below LOQ no fat dissectible
71
Raw data of COM3 in rat
In vitro blood distribution of [3H]COM3 using the same blood pool (H 044)
Total radioactivity concentration determined in blood and plasma
Excipient Nominal COM3 Incubation Actual values
in blood time (ng-eqmL mean plusmnSD n=3) (ngmL) (min) Blood Plasma
None 5 5 46 plusmn 03 17 plusmn 0 (Glu) 30 46 plusmn 02 17 plusmn 01 60 47 plusmn 04 17 plusmn 01 500 5 511 plusmn 2 179 plusmn 0 30 507 plusmn 6 178 plusmn 2 60 512 plusmn 9 176 plusmn 2 CELEtOH 6535 5 5 49 plusmn 04 18 plusmn 01 30 49 plusmn 03 17 plusmn 0 60 51 plusmn 02 17 plusmn 0 500 5 516 plusmn 6 161 plusmn 2 30 508 plusmn 2 160 plusmn 1 60 508 plusmn 9 156 plusmn 1 HP-β-CyD 5 5 53 plusmn 02 35 plusmn 01 30 52 plusmn 04 35 plusmn 01 60 51 plusmn 0 36 plusmn 01 500 5 516 plusmn 5 324 plusmn 2 30 510 plusmn 2 320 plusmn 5 60 512 plusmn 4 326 plusmn 2 SHS 5 5 49 plusmn 02 14 plusmn 0 30 47 plusmn 01 15 plusmn 0 60 49 plusmn 03 16 plusmn 0 500 5 498 plusmn 10 143 plusmn 0 30 506 plusmn 14 143 plusmn 3 60 498 plusmn 1 144 plusmn 1 PEG 200 5 5 49 plusmn 04 17 plusmn 01 30 51 plusmn 01 17 plusmn 01 60 48 plusmn 01 18 plusmn 01 500 5 520 plusmn 7 169 plusmn 1 30 510 plusmn 9 170 plusmn 2 60 518 plusmn 6 176 plusmn 3 EtOHPEG200Glu 5 5 46 plusmn 03 18 plusmn 01 5590 30 43 plusmn 02 18 plusmn 01 60 44 plusmn 01 18 plusmn 01 500 5 535 plusmn 10 188 plusmn 1 30 535 plusmn 10 194 plusmn 2 60 538 plusmn 8 192 plusmn 1 TPGS 5 5 52 plusmn 03 23 plusmn 0 30 51 plusmn 0 22 plusmn 01 60 51 plusmn 0 24 plusmn 03 500 5 546 plusmn 3 231 plusmn 3 30 542 plusmn 6 231 plusmn 2 60 551 plusmn 5 231 plusmn 2 Triplicate analyses were conducted on one aliquot for each time point
72
In vitro protein binding of [3H]COM3 using the same plasma pool
Excipient Nominal COM3 Actual values
in plasma (ng-eqmL) (ngmL) Plasma Ultrafiltrate None 5 58 067 (Glu) 076 068 500 512 63 63 62 HP-β-CyD 5 54 22 21 22 500 538 214 216 209 EtOHPEG200Glu 5 5590 5 52 066 067 065 500 552 66 66 64 Mean of duplicate determination of plasma spiked with different COM3 stock solutions
Ex vivo protein binding of [3H]COM3 in the control and HP-β-CyD group
Parent drug concentration determined in plasma amp ultrafiltrate
Time Individual values (pgmL)
(h) Plasma Ultrafiltrate Control group 008 168 11 13 05 46 04 1 35 03 HP-β-CyD group 008 97 25 23 05 54 08 07 1 34 02 03 Mean of duplicate determination of plasma pooled for each time point
73
Circulation and tissue levels of parent drug and total radioactivity after iv administration of [3H]COM3 (03 mgkg) in the control group
Time Tissue Individual concentration values
(h) COM3 (ngg) Radioactivity (ng-eqg) 008 Blood 39 42 57 60 63 81 Plasma 15 19 19 38 40 41 Liver 1196 1394 1645 2097 2517 2767 Kidney 1760 1646 2019 2354 2286 2677 Fat 152 137 95 193 176 97 Heart 536 534 722 668 676 927 Lung 5712 5711 7113 8073 7897 9688 Muscle 152 112 105 161 112 98 Skin 209 139 85 216 136 86 Brain 1048 1062 1382 1323 1334 1736 05 Blood 20 13 18 75 85 83 Plasma 8 5 6 89 115 104 Liver 644 419 700 2619 2716 2654 Kidney 671 400 692 1162 843 1144 Fat 66 45 59 89 80 83 Heart 210 125 199 296 201 278 Lung 2425 1317 2267 3403 1811 2947 Muscle 222 98 144 282 144 185 Skin 103 81 99 131 119 164 Brain 1002 803 909 1260 996 1164 1 Blood 11 11 10 80 70 60 Plasma 4 5 4 105 99 74 Liver 383 427 373 1866 2152 2030 Kidney 345 405 320 707 758 659 Fat 30 31 33 49 52 53 Heart 106 126 102 161 188 157 Lung 1158 1092 1340 1680 1539 1817 Muscle 96 109 92 154 167 149 Skin 55 85 63 118 148 129 Brain 647 691 622 811 875 775 pgmL and pg-eqmL
74
Circulation and tissue levels of parent drug and total radioactivity after iv administration of [3H]COM3 (03 mgkg) in the HP-β-CyD group
Time Tissue Individual concentration values
(h) COM3 (ngg) Radioactivity (ng-eqg) 008 Blood 34 31 32 53 52 48 Plasma 12 10 10 29 32 28 Liver 850 1052 1271 1181 1665 1901 Kidney 1413 1330 1474 1770 1611 1778 Fat 68 85 103 70 99 121 Heart 592 500 598 719 593 725 Lung 4669 4377 4739 6069 5352 5939 Muscle 151 147 129 159 157 129 Skin 84 64 nd 66 49 nd Brain 954 990 908 1125 1165 1087 05 Blood 19 18 17 74 70 82 Plasma 6 6 6 77 75 96 Liver 617 558 677 2110 2107 2159 Kidney 524 417 496 743 652 810 Fat 47 39 51 59 51 68 Heart 212 178 169 276 233 222 Lung 2355 2513 2258 2931 3032 2853 Muscle 137 137 116 172 169 143 Skin 32 37 50 52 65 135 Brain 733 743 822 895 864 958 1 Blood 11 10 10 65 69 71 Plasma 4 3 4 77 87 92 Liver 344 nd 336 1765 nd 1597 Kidney 300 251 328 515 454 617 Fat 28 19 20 41 43 44 Heart 106 98 94 143 153 143 Lung 1257 926 976 1582 1205 1237 Muscle 98 98 59 133 161 84 Skin 29 27 23 49 110 68 Brain 606 604 588 734 726 697 pgmL and pg-eqmL not determined due to glas vial broken by homogenization
In situ bladder catheterization of [14
C]COM3 in the control and HP-β-CyD group
Time Urinary concentration Urine excreted
(h) COM3 (ngmL) Radioactivity (ng-eqmL) (g) Control 05 190 331 7226 13857 0685 0350 group 1 721 339 17998 12039 0460 0439 15 88 151 2855 7869 1130 0477 2 64 134 2435 9293 0790 0261 HP-β-CyD 05 1911 5216 4903 3523 13028 12248 2635 0851 0784 group 1 7900 524 2965 44618 5086 27031 0119 1068 0265 15 4209 899 1268 40724 18439 19080 0111 0188 0267 2 1993 184 597 31856 7994 11100 0124 0412 0335 Rat Ndeg3 died during in situ experiment
75
Raw data of COM4 in rat
In vitro blood distribution of [14
C]COM4 at 100 ngmL using the same blood pool (H 044) Total radioactivity concentration determined in blood and plasma
Excipient Incubation Actual values
time (ng-eqmL mean plusmnSD n=3) in blood (min) Blood Plasma None 05 5 98 plusmn 2 169 plusmn 0 (saline) 30 98 plusmn 1 167 plusmn 1 60 98 plusmn 2 168 plusmn 3 CEL 05 5 99 plusmn 0 147 plusmn 0 30 99 plusmn 2 135 plusmn 2 60 98 plusmn 1 128 plusmn 1 1 5 103 plusmn 1 139 plusmn 1 30 104 plusmn 0 125 plusmn 1 60 104 plusmn 2 120 plusmn 2 HP-β-CyD 05 5 125 plusmn 2 202 plusmn 1 30 125 plusmn 1 201 plusmn 3 60 124 plusmn 0 199 plusmn 3 1 5 116 plusmn 2 171 plusmn 3 30 117 plusmn 3 171 plusmn 2 60 117 plusmn 2 170 plusmn 3 SHS 05 5 110 plusmn 2 165 plusmn 2 30 110 plusmn 1 155 plusmn 1 60 110 plusmn 1 153 plusmn 3 1 5 112 plusmn 1 150 plusmn 2 30 112 plusmn 3 150 plusmn 1 60 112 plusmn 0 148 plusmn 2 Triplicate analyses were conducted on one aliquot for each time point
76
In vitro protein binding of [14
C]COM4 at 100 ngmL using the same plasma pool Total radioactivity concentration determined in plasma and ultrafiltrate
Excipient Actual values
(pg-eqmL) in plasma Plasma Ultrafiltrate None 97 25 (saline) 23 22 CEL 001 105 25 24 23 01 117 36 38 35 05 102 115 109 113 1 97 254 250 249 HP-β-CyD 001 99 27 25 24 01 102 43 47 43 05 134 131 133 131 1 112 172 151 150 SHS 001 99 25 22 22 01 101 34 31 33 05 116 115 111 112 1 112 171 174 167 PEG 200 100 22 24 24 TPGS 114 23 24 22 Mean of duplicate determination of plasma spiked with different COM4 stock solutions
77
Circulation and tissue levels of total radioactivity after iv administration of [14
C]COM4
Time Tissue Individual concentration values (ng-eqg)
(h) Control group CEL group 008 Blood 1258 1855 1551 1340 1515 1556 Plasma 2047 2761 2640 2211 2548 2517 Plasma water 123 50 49 287 477 478 Lung 659 815 737 754 763 788 Muscle 216 228 222 251 230 250 Skin 348 229 253 229 227 307 025 Blood 1306 1202 1069 1350 1183 1414 Plasma 2343 1983 1893 2357 1910 2273 Plasma water 92 99 83 118 179 201 Lung 697 657 608 737 651 741 Muscle 206 215 205 204 212 216 Skin 443 317 330 351 402 432 05 Blood 1398 1431 1303 1394 1112 1142 Plasma 2382 2543 2238 2357 1969 1926 Plasma water 63 124 46 106 151 191 Lung 710 731 644 720 666 641 Muscle 202 206 197 204 203 204 Skin 363 426 436 384 389 343 1 Blood 1322 1189 1233 1329 732 1301 Plasma 2297 1967 2049 2361 1192 2059 Plasma water 35 101 99 99 106 186 Lung 649 618 616 674 539 674 Muscle 218 200 217 187 212 191 Skin 424 381 421 425 340 407 ng-eqmL
78
Raw data of COM5
In vitro blood distribution of [14
C]COM5 using blood pools with the same H 044 Total radioactivity concentration determined in blood and plasma
Excipient Nominal COM5 Incubation Actual values
in blood time (ng-eqmL mean plusmnSD n=3) (ngmL) (min) Blood Plasma
None 10 5 73 plusmn 06 115 plusmn 02 (saline) 30 78 plusmn 02 118 plusmn 02 60 76 plusmn 07 118 plusmn 07 300 5 278 plusmn 2 386 plusmn 4 30 277 plusmn 0 391 plusmn 4 60 275 plusmn 7 384 plusmn 2 EtOH 10 5 98 plusmn 06 138 plusmn 05 30 98 plusmn 06 135 plusmn 05 60 92 plusmn 06 139 plusmn 01 300 5 286 plusmn 2 404 plusmn 3 30 287 plusmn 6 400 plusmn 4 60 284 plusmn 5 395 plusmn 3 CELEtOH 6535 10 5 88 plusmn 03 129 plusmn 06 30 91 plusmn 05 128 plusmn 03 60 92 plusmn 03 11 plusmn 03 120 98 plusmn 03 109 plusmn 03 1 5 257 plusmn 4 322 plusmn 3 30 259 plusmn 3 313 plusmn 5 60 255 plusmn 5 267 plusmn 2 120 281 plusmn 3 279 plusmn 1 HP-β-CyD 05 5 93 plusmn 05 143 plusmn 03 30 95 plusmn 03 139 plusmn 03 60 96 plusmn 02 141 plusmn 07 1 5 293 plusmn 1 412 plusmn 10 30 297 plusmn 6 414 plusmn 6 60 296 plusmn 6 405 plusmn 1 SHS 05 5 106 plusmn 04 125 plusmn 04 30 107 plusmn 04 108 plusmn 03 60 108 plusmn 05 112 plusmn 03 1 5 256 plusmn 1 257 plusmn 1 30 257 plusmn 2 247 plusmn 4 60 260 plusmn 3 230 plusmn 1 PEG 200 05 5 101 plusmn 03 141 plusmn 03 30 99 plusmn 08 145 plusmn 02 60 102 plusmn 03 142 plusmn 02 1 5 304 plusmn 7 402 plusmn 3 30 304 plusmn 8 413 plusmn 4 60 307 plusmn 2 410 plusmn 4 TPGS 05 5 88 plusmn 03 146 plusmn 04 30 91 plusmn 06 145 plusmn 03 60 89 plusmn 02 133 plusmn 03 1 5 308 plusmn 5 448 plusmn 3 30 312 plusmn 7 446 plusmn 7 60 311 plusmn 3 390 plusmn 22 Triplicate analyses were conducted on one aliquot for each time point
79
In vitro protein binding of [14
C]COM5 using the same plasma pool Total radioactivity concentration determined in plasma and ultrafiltrate
Excipient Nominal COM5 Actual values
in plasma (ng-eqmL) (ngmL) Plasma Ultrafiltrate None 10 86 13 (saline) 15 300 292 35 35 34 EtOH 10 108 13 12 300 295 35 35 34 CELEtOH 6535 10 104 25 24 21 300 269 65 64 63 SHS 10 107 30 29 31 300 268 76 74 73 Mean of duplicate determination of plasma spiked with different COM5 stock solutions
80
Circulation and tissue levels of total radioactivity after iv dosing of [14
C]COM5 (1 mgkg)
Time Tissue Individual concentration values (ng-eqg)
(h) Control group SHS group 008 Blood 1109 1450 1365 1694 2005 1859 Plasma 2009 3120 2647 2486 3010 2665 Muscle 355 458 387 555 426 448 Skin 275 224 245 296 207 219 Brain 24 29 28 41 38 41 025 Blood 712 873 1100 1519 1179 1033 Plasma 1508 1468 1777 2265 1813 1606 Muscle 262 341 330 423 445 404 Skin 229 242 259 456 441 342 Brain 14 16 18 29 27 21 05 Blood 642 409 792 1096 867 965 Plasma 1194 572 1275 1655 1455 1467 Muscle 244 199 241 342 341 315 Skin 252 198 256 397 382 374 Brain 11 7 11 22 15 18 1 Blood 172 192 219 688 603 464 Plasma 269 304 361 1055 919 727 Muscle 59 55 57 203 176 144 Skin 164 146 145 299 217 223 Brain 3 3 3 12 11 9 ng-eqmL value below LOQ
Ex vivo protein binding of [14
C]COM5 in the control and SHS group Total radioactivity concentration determined in plasma amp ultrafiltrate
Time Individual values (pg-eqmL)
(h) Plasma Ultrafiltrate Control group 008 2465 217 221 025 1587 123 126 05 1031 69 67 1 305 31 31 SHS group 008 2679 378 372 025 1914 245 05 1524 230 230 1 864 167 Mean of duplicate determination of plasma pooled for each time point
81
9 Acknowledgments
I would like to thank Prof Hans Leuenberger for giving me the opportunity to accomplish a PhD thesis at the University of Basel in collaboration with Novartis Ltd I would also like to thank my advisor PD Dr Georgios Imanidis for his guidance support and advice I would like to thank Dr Bruno Galli for acting as a co-examiner and co-referee for my PhD thesis I would like to thank Dr Gerhard Gross and his group for allowing me to conduct my dissertation research in their laboratories In particular I would like to thank Mr Armin Bruumllisauer and Dr Markus Weiss for helpful comments and discussions I am also thankful for Pierrette Guntz Heidi Huumlgli Marcel Fresneau and Albert Spielmann for not only assisting with my training and sharing laboratory space but for their friendships I would like to thank Dr Ernst Ulrich Koelle and Dr Michel Lemaire for their scientific advice and discussions concerning kinetics and suggestions throughout my dissertation project I would like to thank the Isotope Laboratories of Novartis for providing me with radiolabeled compounds Finally this research was made possible by financial support of Novartis Pharma AG Basel
82
10 Curriculum Vitae
Name Barbara Egger-Heigold Address Lettenweg 8 4102 Binningen
1975 Born on October 30th in Lucerne
1982-1988 Primary school in ReussbuumlhlLU 1988-1995 Matura Typus B Gymnasium ReussbuumlhlLU
1995-1996 1Propedeuticum in Medicines University of Basel 1997-2002 Studies in Pharmaceutical Sciences University of Basel 2002 Diploma thesis at Novartis Pharma AG Basel Thesis title The effect of excipients commonly used for drug
formulation on the in vitro rat blood distribution and protein-binding of SAB 378
2003-2005 PhD student University of Basel Laboratory work conducted at Novartis Pharma AG Basel During my PhD thesis I attended following lectures and courses given by the following lecturers Prof Dr H Leuenberger PD Dr GImanidis Prof Dr J Drewe Prof Dr J Seelig PD Dr H Heerklotz PD Dr A Seelig Dr S Rogers

2
various parts of the body or aid in the transport of other substances The plasma proteins consist of albumin globulin and fibrinogen fractions which can be separated by electrophoresis Electrophoretic separation followed by immunoprecipitation (immunoelectrophoresis) results in a further division of the proteins If whole blood is allowed to clot and the clot is removed the remaining fluid is called serum and has essentially the same composition as plasma except for the removed fibrinogen and few clotting factors (II V and VIII) Table 1-2 lists the main protein fractions with their main characteristics The table also indicates that a large number of drugs associate with proteins within the bloodstream Albumin is the major drug-binding plasma protein (8) followed by alpha 1-acid glycoprotein as the next important one (9) In recent years studies have shown that lipoproteins are also substantially involved in the bindingtransport of drugs in the blood compartment (10) So far γ-globulins play only a marginal role in plasma binding of drugs
Table 1-2 Proteins in human plasma
Physiological Function
Albumin PrealbuminAlbumin
α1 globulin α1-acid glycoprotein Uncertain (acute phase protein)
α1-lipoprotein (high Transporter Lipidsdensity lipoproteins)
α2 globulin Ceruloplasmin Transporter Copperα2-Macroglobulin Enzyme inhibitor Serum endoproteasesα2-Haptoglobin Binding and carrier protein Cell-free hemoglobin
β globulin Transferrin Transporter Ironβ-lipoprotein (low Transporterdensity lipoproteins)Fibrinogen Precursor to fibrin in hemostasis
γ globulin IgG IgA IgM IgE Antigen Few basic compounds
Electro-phoresis
Immuno-electrophoresis
Protein fraction Binding characteristics
Drugs Endogenous entities
Lipoproteins mainly lipophilic neutral and basic compounds
Humoral immunity (antibodiesimmunoglobulins)
Lipids (mainly cholesterol)
Binding and carrier protein osmotic regulator
Hormones amino acids steroids vitamins fatty acids
Mainly basic and neutral compounds
Mainly acidic but also basic and neutral compounds
Lipoproteins mainly lipophilic neutral and basic compounds
12 In vitro methods to investigate blood binding parameters
The investigation of the partitioning of a drug in the blood compartment is essential in predicting its pharmacokinetic-dynamic profile In general the unbound concentration of a drug in blood reflects more accurately pharmacological effects of the drug than its total concentration in blood (bound + unbound) because only the drug unbound to blood components is able to diffuse through the membranes and then reach the target organ (11) Furthermore the binding to plasma proteins also relates to the volume of distribution and the clearance of the drug For instance many experimental and clinical studies have generated substantial evidence summarized by Akhlaghi (12) that the unbound fraction of cyclosporin in plasma correlates more closely with pharmacodynamic and pharmacokinetic characteristics of cyclosporin than its total blood concentration Therefore determination of extent and rate of bloodplasma distribution and plasma protein binding of a drug is important in both the discovery and clinical phases of drug development
3
121 Blood distribution method
The rate and extent of bloodplasma distribution of drugs is determined in vitro in spiked whole blood The experiments are performed under controlled physiological conditions (pH 74 37degC gently shaken) to reflect the in vivo situation over the entire clinically relevant concentration range of the drug Time samples are taken and centrifuged Subsequently drug concentrations in blood and plasma are determined to calculate the time required to reach equilibrium The extent of bloodplasma and blood cellplasma distribution derives from measured concentrations in blood and plasma and can be expressed with distribution parameters like FP BPR and BCPR BPR depends on the hematocrit of the whole blood used in the determination whereas BCPR is independent of the hematocrit value
122 Protein binding methods
Various methods are available for the determination of free drug concentration and protein-drug binding fraction in plasma (131415) including conventional separation methods summarized in Table 1-3 However the routinely used methods like ultrafiltration or equilibrium dialysis are limited in the case of lipophilic drugs due to their nonspecific adsorption to ultrafiltration device or to the dialysis membrane Along with a trend to more lipophilic compounds observed in the pharmaceutical industry in recent years (16) these adsorption problems are expected to increase As a result ongoing method modifications and new methods are needed to overcome these difficulties Overall the selection of the method of binding assay depends upon the aim of the study and the physicochemical properties of the particular test compound including its formulation
The ratio of bound and total drug concentrations in plasma expresses the degree of drug binding to plasma proteins and ranges between values of 0 and 1 Based on these values drugs can be classified into very highly bound (gt095) highly bound (gt090) poorly bound (lt09) and littlenot bound (lt02)
4
Table 1-3 Conventional methods for determination of plasma protein binding
Method Principle Advantages Disadvantages
Ultrafiltration
Ultracentrifugation
Gel filtration Adoptable for lipophilic drugs automatable binding differences detectable (eg affinity)
Complex handling time consuming
Time consuming expensive equipment false estimation of free fraction by physical phenomena (eg sedimentation back diffusion) protein contamination of free drug layer
Separation by size exclusion and affinity of column
Separation by centrifugation at high speed in absence of a membrane
No membrane effects natural environment no dilution problems adoptable for lipophilic and high MW drugs evaluation of lipoprotein binding
Equilibrium dialysis (reference method)
Sample dilution volume shifts Donnan effects nonspecific adsorption sieve effect time consuming unsuitable for unstable drugs
Separation by filtration through a semipermeable membrane with defined molecular weight cutoffs accelerated by centrifugation or positive pressure (N2 gas syringe)
Equilibrium establishment between two compartments separated by semipermeable membrane with defined molecular weight cutoffs
Physiological conditions universal binding method
Simply applicable short analysis time simple commercially available kits no volume shifts no dilution effects
Donnan effects nonspecific adsorption binding equilibrium changes during separation process small amount for analysis sieve effect
13 Characterization of drug candidates
Successful candidates in drug development must have proper physicochemical properties in addition to acceptable pharmacokinetics efficacy and safety profiles As a result a clear understanding of compound characteristics and their correlations are helpful to rank and sort out unsuitable compounds in drug research (1718)
131 Physicochemical properties
The chemical structure of a drug candidate is used in both predicting the pharmacology and selecting formulation strategies Table 1-4 shows physico-chemical parameters which are critical for in vivo drug action
The molecular weight (MW) indicates roughly the size of a chemical entity and is connected to its membrane permeability namely to the intestinal and brain penetration (1619)
LogP the octanol-water partition coefficient has been widely accepted as a measure of molecular lipophilicity Lipophilicity affects both the pharmacokinetic and pharmacodynamic behavior of drug molecules (2021) LogP considers the molecule in its neutral state (neutral substance or ionizable substance in its neutral form) whereas logD reflects the pH-dependent distribution coefficient consequently taking the ionization of molecules into account If logP and pKa of a compound are known logD can be calculated at any pH (21)
5
The aqueous solubility (LogS) is closely related to drug stability liberation and absorption by passive diffusion thereby playing a key role in its bioavailability (22) Causes for poor solubility are mainly excessive lipophilicity and crystal packing issue (23242526) The solubility of nonionic molecules is pH independent while molecules with ionizable groups show pH dependent solubility Acid drugs have higher solubility at pH higher than pKa and basic drugs at pH lower than pKa due to better solubility of ionic species as compared to the neutral species The acid-basic character accounts also for crossing the blood-brain barrier (27)
The polar surface area (PSA) of a molecule is a useful parameter for predicting drug transport properties PSA is the sum of the molecular surface (either van der Waals or solvent-accessible) that arises from polar atoms usually N O N-H and O-H atoms Some scientists also include sulphur and phosphor and attached hydrogens as polar atoms The PSA of a compound is also closely related to its hydrogen bond accepting and donating ability which can be responsible for interactions with active efflux pumps (2829) PSA has been shown to correlate well with blood-brain distribution (273031) intestinal absorption (323334353637) and oral bioavailability (38) of compounds
Table 1-4 Physicochemical parameters
Parameter Description Predictor Optimal value
MW Molecular weight Size Permeability lt 500lt 450 (BBP)
LogP lt 5
LogS Hydrophilicity gt 20 microgmL
pKa Acid-base character
PSA Polar surface area lt 140 Aringlt 80 Aring (BBP)
Negative logarithm of the acid-base dissociation constant
Acids gt4 and bases lt10 (BBP)
Permeability H-bonding capability
Logarithm of the octanol-water partition coefficient
Lipophilicity Permeability
Logarithm of the aqueous solubility
BBP blood brain penetration
132 Pharmacokinetic parameters
The pharmacokinetic profile is crucial for the clinical success of drug candidates and their development into marketable drugs Therefore today the contribution of pharmacokinetic investigations to the selection and optimization of promising drug candidates is well recognized The four most important parameters are clearance volume of distribution elimination half-life and bioavailability which is the fraction of drug absorbed as such into the systemic circulation (100 per definition for drugs given intravenously)
Drug clearance (CL) expresses the rate or efficiency of drug removal from the systemic circulation and is estimated as the ratio of dose to AUC following intravenous administration of the drug
AUC
DoseCL =
6
AUC is the total area under the curve that describes the concentration of drug in blood or plasma as a function of time AUC represents the drug exposure and is calculated by the trapezoidal rule
The volume of distribution (V0) relates the amount of drug in the body to the concentration of drug in the blood or plasma depending upon the fluid measured This volume does not necessarily refer to an identifiable physiological volume but merely to the fluid volume that would be required to contain all of the drug in the body at the same concentration as in the blood or plasma
o
iv
C
DoseV =0
C0 represents the blood or plasma concentration at time zero and is determined by extrapolation to zero time of the linear plot of concentration vs time in semilogarithmic scale
The half-life (t12) is the time it takes for the blood or plasma concentration or the amount of drug in the body to be reduced by 50
kkt
69302ln21 ==
where k is the elimination rate constant which can be calculated by the slope of the best-fit line to a semilogarithmic plot of the concentration over time The relationship of t12 to both clearance and volume of distribution is given by
V
CLk =
133 New trends in characterizing drug candidates
Before conducting clinical trials in humans preclinical testing is carried out to discover the pharmacology ADME (adsorption distribution metabolism and excretion) and toxicology of a new drug candidate (39) Appropriate pharmacokinetics and a good balance between drug efficacy and safety contribute mainly to an efficient and effective drug development However these factors are the major hurdles in development which primarily cause increased costs and failure rate of candidates Thus pharmaceutical industry needs new concepts able to speed and improve activities and decision-making in drug development (4041) In this context microdosing biomarkers and PET ligands can help to prioritize resources and optimize drug selection in development In many cases these approaches deal with compound concentrations ranging from sub-therapeutic to low pharmacological levels and thus information obtained from these techniques must reflect correctly the conditions at therapeutic doses including interactions with macromolecules like enzymes transporters and proteins In the end a successful integration requires a profound understanding of strengths and limitations of these new concepts
The administration of a low dosed (microdosed) drug candidate to humans was proposed to obtain human pharmacokinetic data before conducting Phase I trial (42) A microdose is one-hundredth of the proposed pharmacological dose determined from animal andor in vitro models or a dose up to 100 microg whichever is the smaller (43) Human microdosing uses labeled agents administered mostly intravenously and their fate in vivo is recorded by positron emission tomography combined with accelerator mass spectrometry or nuclear magnetic resonance (4344) With this new
7
strategy of microdosing drug information regarding human kinetics will be available along with preclinical data and can be useful for the acceptance or rejection of a candidate at an early stage
A biomarker is an indicator of a normal biological or pathophysiological process or a therapeutic response (45) Biomarkers help to select the most sensitive drugs in all phases of drug development (46) by providing data of pharmacological response dosing regimen and risk-benefit assessment Therefore efforts are moving rapidly forward to achieve strong predictive biomarkers which could be used for diagnostic and therapeutical purposes (47)
PET tracers labeled with short-lived radionuclides (eg 11C 18F 124I) are used as molecular probes of physiology and pathophysiology in animals and humans These labeled compounds are administered mostly intravenously at 600 MBq to humans which corresponds to 6-20 nmol (3-10 microg assuming a MW of 500) (48) To achieve the same imaging quality in animals roughly the same total amount of radiopharmaceutical must be given to animals as to a human subject (49)
14 Strategies and administration of intravenous formulations
In the pharmaceutical industry formulation scientists have faced growing challenges in recent years as a result of new drug candidates characterized as being more lipophilic hydrophobic and water-insoluble particularly candidates originated from leads associated with combinatorial chemistry and high-throughput screening (1624) In addition timelines and resources are very limited to develop an optimized formulation and thus the search for a suitable dosing vehicle intended for activities in preclinical research represents a challenging task for the formulators (50) Ideally it is best to select and use solubilizers that would maximize the solubility of the compound and could be applied for all preclinical settings Moreover the solubilizing agents should not influence the intrinsic pharmacokinetic characteristics of the compound being evaluated (except the interaction is well understood) which would lead to misinterpretation of the pharmacological response (51) Strategies for solubilization of intravenous drugs are summarized in Table 1-5 and well exemplified by the formulation approaches for the anticancer agent Paclitaxel (52)
Usually the first step is to check the solubility of the compound in an aqueous dosing vehicle at physiological pH and osmolarity If the target concentration cannot be achieved with this approach and the drug molecule is ionizable adjustment of the pH to non-physiological values can be suitable to increase water solubility (pKa must be sufficiently away from the formulation pH) Non-electrolytes are insensitive to pH modification The next approach most frequently tried is the addition of water-miscible organic solvents (cosolvents) and the use of surfactants or complexing agents To reach the required dose combination of these methods is often used Dispersal systems are other techniques but they may be difficult costly and time-consuming due to biological and technical complexity eg liposomes (53)
8
Table 1-5 Intravenous formulation approaches
Approach Examples Administered in commercial productsa Potential drawbacks
NaCl 09 (wv) pH 2-12 (bolus) pH 2-10 (infusion) PrecipitationGlucose 5 (wv) rarr preferred range pH 4-9 PainStrong acidsbases (HCl NaOH)Buffers (tartarte phosphate)
Cosolvents Propylene glycol le 68 (bolus) le 6 (infusion) Precipitation Ethanol le 20 (bolus) le 10 (infusion) IrritationPainPolyethylene glycol 300 le 50 (bolus) HemolysisPolyethylene glycol 400 le 9 (bolus) Impact on PK profile
Surfactants Cremophor EL le 10 (infusion) ditoTween 80 le 04 (bolus) le 2 (infusion)Solutol HS 15 50
Complexing agents Hydroxypropyl-β-cyclodextrin 20 (infusion) ditoDispersal systems Impact on PK profile
EmulsionbMicroemulsionc Water with 10-20 oil (fatty acids + lecithin + glycerol) Sustained releaseLiposomes Water with phospholipids (5-20 mgmL) + isotonicifier + buffer plusmn cholesterol Instability
Nanosuspensiond Water with stabilizer not yet marketede Slow dissolution
Aqueous solution at physiological osmolarity and pH or with pH adjustment
a(54) b(55) c(56) d(57) e(58)
For compounds administered intravenously to animals the dose volume viscosity
of injection material speed of injection and species are important factors to consider in addition to formulation properties including additives solubility and stability (Table 1-6) (59) A compound can be given over a short period of le1 min (bolus injection) 5-10 min (slow injection) and longer time period (intravenous infusion) Rapid injections require the dose to be compatible with blood and not too viscous and the rate of injection is suggested not to exceed 3 mLmin for rodents Depending on study objectives and compound solubility in an acceptable formulation a larger volume may be needed to be given to animals to accomplish requirements Regarding the formulation aqueous solutions or simple systems containing cosolvent surfactant or complexing agent are recommended for animal investigations at early stage in development due to easy handling and characterization For excipient selection consideration should be given for toxic and biological effects interferences with the drug compound and suitability for clinical use (Table 1-5) Injectable excipients preferred for dosing in animals are ethanol propylene glycol low molecular weight polyethylene glycols Cremophor EL Tween 80 and cyclodextrins
Table 1-6 Dose volumes and rates for intravenous administration(59)
Species Bolus injection Slow injection Infusion
Volume Rate Volume Rate Time Volume Rat
(mLkg) (mLmin) (mLkg) (mLmin) (h) (mLkgd) (mLkgh) Mouse 5 3 max 25 3 4
24 96 4 Rat 5 3 max 20 3 4 20 5 24 60 25
9
15 Effect of excipients on pharmacokinetic parameters in blood
Over the last years more attention has been paid to the extensive investigation of formulation vehicles as biologically and pharmacologically active compounds The main stages in which pharmaceutical excipients can interact and hence may modulate the properties of an administered drug-agent are transporter enzyme and distribution process in the systemic circulation (eg plasma protein binding) The effect of excipients on transporter activity has been studied intensively namely for P-glycoprotein (606162636465666768) multidrug resistance-associated protein (6970) and peptide transporter (71) It is interesting to say that particularly nonionic surfactants effectively inhibit transporters In contrast up to this day little is known about drug-excipient interactions at the level of cytochrome-mediated metabolism (63727374) and blood distribution (see below) The biological and pharmacological properties of excipients with a focus on the central blood compartment will be reviewed in the following paragraphs
151 Cremophor EL
The amphiphilic polyethoxylated castor oil derivative Cremophor EL (CEL) is one of the most frequently used surface-active formulation ingredients in parenteral dosage forms As early as 1977 lipoprotein alterations were observed in patients receiving miconazole therapy (75) which was caused only by CEL both in vitro and in vivo (767778) Extended studies revealed later on that CEL has a destructive effect on HDL resulting in a shift of the electrophoretic and density gradient HDL to LDL (79808182) Furthermore several hydrophobic anti-tumor agents tin etiopurpurin (8384) C8KC (85) and Taxol (8182) showed strong affinity for these lipoprotein dissociation products inducing changes in plasma protein binding potentially affecting pharmacokinetics
Various animal studies demonstrated (85868788899091110) that CEL modifies the pharmacokinetic behavior of drugs after intravenous administration like paclitaxel (Taxol) C8KC and cyclosporin The most common observation was a substantial increase in the area under the plasma concentration-time curve and in peak plasma concentration of studied agent with a reduction in the clearance as was first described for paclitaxel in a mouse model (91) The drug-CEL interactions were supposed to be caused not only by altered protein binding characteristics (82) but also by altered hepatobiliary secretion (92) and endogenous P-glycoprotein-mediated biliary excretion (93) However the very small volume of distribution of CEL approximately equal to the volume of the central blood compartment suggests that the observed interference occurs in the central blood compartment This hypothesis was confirmed by studies recently published (9495) The main finding was a profound alteration of cellular partitioning and bloodplasma concentration ratio of paclitaxel in a CEL concentration-dependent manner as a result of an entrapment of the compound into micelles formed by CEL (96) Consequently the free drug fraction available for distribution was reduced This effect was also observed in the absence of plasma proteins pointing at contributing factors other than altered protein binding and increased affinity of paclitaxel for CEL-induced lipoprotein degradation products (8182)
10
For the purpose of finding out a potential paclitaxel delivery vehicle with an ideal profile the investigation of several delivery vehicles based on the chemical structures of CEL and Tween 80 led to alteration of blood distribution of paclitaxel in presence of all tested vehicles (97) Different formulation approaches such as liposomes and poloxamer-micelles affected the pharmacokinetics of paclitaxel in mice as compared to the CEL-containing formulation (98) In contrast paclitaxel administered in a solvent-free formulation in a clinical study showed a higher efficacy combined with reduced adverse effects compared to the drug delivered in a solution of CEL (99)
Overall numerous investigations have shown that CEL can play a pivotal role in the pharmacological behavior of the formulated drugs In addition several drug-drug interactions are reported on agents administered intravenously in conjunction with CEL-containing formulation of other compounds namely paclitaxel (100101102103) cyclosporin (104105106107) and valspodar (108109) Most likely the presence of CEL in drug formulations contributes to the observed pharmacokinetic interactions Indeed recent experiments revealed a substantial increase of plasma concentrations of cyclosporin after an additional injection of another drug preparation containing CEL (110)
152 Cyclodextrins
Cyclodextrins are ring-shaped oligosaccharides with a hydrophilic exterior and a hydrophobic interior (111) The interior cavity is capable of forming water-soluble complexes with many drugs Due to the rapid release of a drug from the complex after administration in vivo it is assumed that drug-cyclodextrin complexes do not affect the drug pharmacokinetics (112) However if the drug is slowly or incompletely released from the complex drug dosing as complexes in cyclodextrin can be critical
The binding of drugs to plasma proteins was influenced in vitro in the presence of β-cyclodextrin (113) and hydroxypropyl-β-cyclodextrin (HP-β-CyD) (114115) The intravenous administration of flurbiprofen in HP-β-CyD led to transient higher tissue concentrations in rats (114) Alterations in tissue distribution were also found for other drugs injected as cyclodextrin complexes either free in solution (116117) or included into liposomes (118) Following iv dosing in HP-β-CyD a higher amount of carbamazepine appeared in the urine compared to oral preparations (122) A similar trend was observed in dogs treated iv with either dexamethasone formulated in HP-β-CyD or as its phosphate prodrug (123) In addition cyclodextrins interacts with endogenous lipids such as lipoproteins (119120) and cholesterol (113121)
153 Tween 80
As mentioned above for CEL lipoprotein alteration induced by Tween 80 was observed (80) However this effect was not confirmed in a further study (85) In patients receiving Tween 80 co-administered with etoposide an increase of the volume of distribution and the clearance of doxorubicin was detected due to reduced plasma concentrations of doxorubicin during the early phase of the concentration-time profile (124) Lately changes in the bloodplasma ratio of paclitaxel were described in the presence of Tween 80 and other solubilizers structurally related to Tween 80 (97) More recently it was shown that Tween 80 has a concentration-dependent influence on the normal binding of docetaxel to serum proteins leading to changes in pharmacokinetics of docetaxel in vivo (125) although Tween 80 is
11
degradated rapidly by esterases in plasma (126) The mechanistic basis for altered plasma binding of docetaxel in the presence of Tween 80 still needs to be clarified
154 Other excipients
To date little is reported in the literature about the impact of Solutol HS 15 and Poloxamer 188 on blood distribution of drugs An interference between Solutol HS 15 and the co-administered ketochlorin photosensitizer C8KC was suggested by Woodburn (127) The similar half-lives of Solutol HS 15 and the sensitizer found in mice indicate the correlation of the persistence of C8KC in plasma with that of the vehicle Further recent plasma protein binding interaction studies demonstrated an apparent increase in the unbound fraction of propranolol in combination with Poloxamer 188 (128) Also the administration of compounds formulated in mixed micelles can alter the protein binding (129) Most notably compounds binding with high affinity but low capacity to α1-acid glycoprotein showed free fractions increased by 50 to 85 Moreover blood protein interactions can occur with dosing vehicles like liposomes (130) thereby affecting maybe the fate of co-administered drugs in blood and body (131)
155 Nanoparticles
Methyl methacrylate nanoparticles of 130 nm in size suspended in different concentrations (01-5) of Tween 80 or poloxamine 908 exhibited prolonged circulation time with altered tissue concentrations as compared to uncoated nanoparticles (132) Extended blood circulation time was also found for polystyrene nanoparticels (40-137 nm) coated with poloxamer 407 (133)
12
16 Objectives and specific aims
The main purpose of this thesis was to investigate in vitro drug-excipient interactions in blood and to assess the implications of the in vitro findings both for the in vivo situation and the formulation strategy Compounds in drug development at Novartis were chosen as model substances and dosed at concentrations ranging from sub-therapeutic to low pharmacological levels Excipients commonly used in formulations were selected including CEL HP-β-CyD Solutol PEG 200 and TPGS The following specific aims of the thesis were 1 To collect and use available compound information including physicochemical
properties and pharmacokinetics to select appropriate model substances with as many different properties as possible
2 To determine the hemolytic activity of selected excipients to rule out any changes of blood distribution caused by hemolysis
3 To explore in vitro possible effects of selected excipients in the blood with special emphasis on the blood distribution and plasma protein binding of model compounds
4 To identify the pharmacokinetic profile and tissue distribution of model compounds following single intravenous dosing in the presence and absence of selected excipients
5 To compare and relate pharmacokinetic outcomes to the in vitro findings thereby assessing the impact of in vitro data for the in vivo situation and evaluating the in vitro-in vivo correlation
6 To generate criteria for optimizing delivery vehicle selection in drug research that allow reducing drug-excipient interactions and leading to more rational and selective drug formulations
7 To propose an intravenous formulation strategy based on the data generated by this research project to provide better candidate-tailored formulations in drug development
13
2 Selection and experimental procedure
21 Excipients and model compounds
Investigations involved five excipients along with five pharmacologically active compounds exhibiting different properties
The excipients CEL HP-β-CyD Solutol and PEG 200 were selected based upon their common use in intravenous formulations and their diversity of molecular structure and solubilization technique (Figure 2-1 and Table 2-1) CEL and Solutol are surface-active agents which increase the drug solubility by incorporation of the drug into a micellar structure Whereas CEL exhibit a highly variable composition with the major hydrophobic component (~87) identified as oxyethylated triglycerides of ricinoleic acid (Figure 2-1) Solutol consists of ~70 lipophilic polyglycol mono- and di-esters of 12-hydroxystearic acid and ~30 hydrophilic polyethylene glycol HP-β-CyD is a cyclic (α-14)-linked oligosaccharide containing seven α-D-gluco-pyranose units (Figure 2-1) which form a relatively hydrophobic central cavity and a hydrophilic outer surface The inclusion of a drug within the inner core of the complexing agent and the interaction of the outer core with water render the complex soluble PEG 200 is often used as a cosolvent for improving solubility of preclinical compounds by interrupting the hydrogen structure of water (eg water exclusion) and lowering the dielectric constant of the solution Although TPGS is exclusively known in oral formulations it was chosen due to its chemical structure (benzyl ring) and drug interaction potential at the level of active transporters and metabolizing enzyme systems
Cremophor EL
H2C(CH
2CH
2O)xOCO(CH
2)7CH CHCH
2CHOH(CH
2)5CH
3
HC(CH2CH
2O)yOCO(CH
2)7CH CHCHCH
2CHOH(CH
2)5CH
3
H2C(CH
2CH
2O)zOCO(CH
2)7CH CHCH
2CHOH(CH
2)5CH
3
primary constituent with x + y + z ~35
Solutol HS 15
CH3
(CH2)5
CH (CH2)10
C O CH2
CH2
OHn
OH O
Polyethylene glycol 200
O
HOH
n
Hydroxypropyl-β-cyclodextrin
O
ROCH2
O
ROOH
n
glucopyranose with R=CH2CH2OH or H and n=7
Vitamin E TPGS
O
O C CH2
CH2
C O
O O
CH3
CH3
OH n
CH3
CH3
CH (CH2)3
CH3
CH (CH2)3
CH(CH2)3
n=20-22
Figure 2-1 Chemical structures of selected excipients
14
Table 2-1 Properties of selected excipients
Excipient name Type Solubilization Use in iv Biological activity
approach formulation
Cremophor EL Non-ionic Micelles Yes bull Dyslipidaemia (polyoxyethylene surfactant (developmental bull Inhibition of active castor oil derivatives) amp commercial) transporters MW ~3000 CMC ge009 mgmL Hydroxypropyl-β- Oligomeric Complexation Yes bull Lipid interactions cyclodextrin substance (developmental MW ~1600 amp commercial) Solutol HS 15 Non-ionic Micelles Yes bull Dyslipidaemia (polyethyleneglycol 660 surfactant (developmental bull Inhibition of active 12-hydroxystearate) amp commercial) transporters MW 960 bull Inhibition of cyto- CMC ge02 mgmL chrome enzymes Polyethylene glycol 200 Oligomeric Cosolvent Yes MW ~200 substance (change of (developmental solution amp commercial) polarity) Vitamin E TPGS Non-ionic Micelles No bull Inhibition of active (D-α-tocopheryl surfactant (oral use transporters polyethylene glycol 1000 developmental bull Inhibition of cyto- succinate) amp commercial) chrome enzymes MW ~1513 CMC ge02 mgmL CMC Critical micelle concentration MW Molecular weight Higher molecular weight PEGs such as PEG 300 and 400
Drug candidates in development at Novartis were chosen as model compounds
regarding aqueous solubility lipophilicity membrane permeability and blood cellplasma distribution (Figure 2-2 and Table 2-2) COM2 and COM1 (base) are lipophilic and poorly water-soluble PET ligands which are used in sub-therapeutic doses and COM2 distributes equally between plasma and whole blood COM3 is much better water-soluble and is mainly located in the cellular fraction in blood In contrast COM4 with a low lipophilicity penetrates hardly into blood cells and distributes poorly into tissues COM5 is a bigger molecule characterized by a high polar surface area many H-bond acceptors and a very low volume of distribution similar to that obtained for COM4
COM1 COM2 COM3 COM4 COM5
N
N
O
R1
R2
O
N
O
N
N
S
R1
R2
N
O
N
R
NN
R2
R1
N
NO
S O
NH
O
O
NH
OR1
R2
R3
Figure 2-2 Chemical structures of model compounds
15
Table 2-2 Properties of model compounds
Physicochemical (PC) and pharmacokinetic (PK) data available at the time of selecting model compounds for investigating drug-excipient interactions in blood
COM1 COM2 COM3 COM4 COM5
PET ligand PET ligand NCE NCE NCE
PC properties MW (gmol) 240 410 295 lt400 533 LogD 68 34 45 23 17 37 pKa 38 57 41 87 32 46 106 H2O solubility pH 68 (mgL) 20 lt25 4000 lt500 100 PSA (Aring2) 35 50 25 63 166 H-bond acceptors 3 5 3 4 12 H-bond donors 0 0 0 1 3 PK properties Species Mouse Rat Rat Rat In vitro Fraction in plasma () 45 20 ~100 80 Free in plasma () 12 24 11 In vivo Matrix Blood Blood Plasma Plasma t12 (h) 11 11 10 04 CL (mLminkg) 10 142 04 72 Vss (Lkg) 14 10 03 03 funchanged () 49 14 98 94 Main selection criteria bull Active bull Active bull Blood bull Blood bull MW principle principle distribution distribution bull Polarity bull H2O sol bull H2O sol bull Vss bull Vss (base) bull Lipophilicity funchanged Fraction of unchanged drug based on AUC ratio of parent drug and total radioactivity LogD Logarithm of octanol-water distribution coefficient MW Molecular weight NCE New chemical entity pKa Negative logarithm of dissociation constant PSA Polar surface area CL Drug clearance t12 Main elimination half-life Vss Volume of distribution under steady-state conditions
22 Experimental setup
The effect of excipients on pharmacokinetic parameters was examined in rats except for COM2 which was investigated in mice due to available animal models appropriate to analyze drug target interactions if required Model compounds were used in their clinically relevant blood range as follows sub-therapeutic (lt5 ngmL) for COM1 and COM2 low-therapeutic (5-50 ngmL) for COM3 and therapeutic (gt50 ngmL) for COM4 and COM5 because of low distribution volumes to assure detectable tissue concentrations To allow in vitro and in vivo study comparisons the amount of excipient in blood was set at ~05 which is within the range after an iv bolus injection in mice and rats
Blood distribution and protein binding studies were done in vitro using model compounds in the appropriate concentration range with and without selected excipients fixed at 05 in the test system Since COM4 is almost completely located in the plasma fraction in blood (FP ~100) independent of the concentration (10-10rsquo000 ngmL) (149) the concentration of COM4 was kept constant (100 ngmL) whereas the excipient amount was varied between 001-1 Compounds formulated as excipient-free solution in glucose 5 or saline served as reference The excipient with the most prominent effect compared to the reference was selected for the in vivo
16
study where animals received intravenously a single dose as a control formulation or solution containing the selected excipient Control formulation were based on glucose 5 (COM1 COM3) saline (COM4 COM5) or blank plasma (COM2) To assure a fast and complete solubility of COM3 and COM5 in the control formulation convenient excipients were added with in vitro binding parameters similar to those obtained for the in vitro reference The concentration of model compounds in blood plasma and tissue were measured until 1 h after iv administration thereby including the scanning time of PET ligands Moreover it is assumed if excipient-induced changes occur they should be detectable in this time period
17
3 Materials and methods
31 Chemicals
COM1 and COM2 were supplied by the Neuroscience Research Department of Novartis (Basel Switzerland) COM3 was obtained from the Novartis Institutes for BioMedical Research (Basel Switzerland) 3H-radiolabeled COM1 (specific activity 11780 MBqmg gt99) COM2 (specific activity 2320 MBqmg gt98) and COM3 (base specific activity 311 MBqmg gt98) were provided by the Isotope Laboratories of Novartis (Basel Switzerland) 14C-radiolabeled COM3 used for investigation of renal excretion (2middotHCl salt specific activity 587 MBqmg gt98) COM4 (specific activity 585 MBqmg gt98) and COM5 (specific activity 33 MBqmg gt98) were provided by the Isotope Laboratories of Novartis (Basel Switzerland)
The excipients purchased by the Pharmaceutical and Analytical Development Department of Novartis (Basel Switzerland) were Cremophor EL (CEL BASF) hydroxypropyl-β-cyclodextrin (HP-β-CyD CERESTAR USA Inc) polyethylene glycol 200 (PEG 200 Fluka) Solutol HS 15 (Solutol BASF) and D-α-tocopheryl polyethylene glycol 1000 succinate (TPGS Eastman) All other chemicals and reagents were of analytical grade or will be described separately in the methods section
32 Blood and plasma sources
Fresh blood was obtained from healthy male species (nge3) as follows mice (albino OF1 Charles River Laboratories LrsquoArbresle France) rats (Wistar HAN IGS Charles River Laboratories Sulzfeld Germany) dogs (Marshall beagles Marshall Farm NY USA and Harlan France SARL Gannat France) and humans (drug-free blood donors Blutspendezentrum SRK Basel Switzerland) Pooled plasma (nge3) was defrosted from storage at -20degC Lithium heparin was used as an anticoagulant for all species
33 In vitro studies
Test compounds in the in vitro samples excluding protein binding samples of COM2 were quantified by LSC due to no major degradation (gt95) under investigated conditions (146147148149150) Protein binding samples of COM2 were quantified by LC-RID due to instability after longer incubation (gt2 h) and very low fraction unbound in plasma (lt2)
331 Preparation of test solutions
For in vitro blood distribution and protein binding studies test solutions were prepared by dissolving the radiolabeled test compound in ethanol Ethanol was evaporated and the residue was reconstituted in the appropriate formulation namely excipient-free solution as control (saline or glucose 5) and solutions containing CELEtOH 6535 (vv) CEL HP-β-CyD Solutol PEG 200 and TPGS Final compound concentrations in blood or plasma were 006-6 ngmL (COM1) 001-100 ngmL (COM2) 5-500 ngmL (COM3) 100 ngmL (COM4) and
18
10-300 ngmL (COM5) Excipient concentrations were kept constant at 05 in the test system except for COM1 (05-5 due to no alterations at 05) and COM4 (001-1 due to its plasma fraction see 22)
332 Hemolytic activity
The hemolytic activity of the excipients was assayed using a spectrophotometric method CELEtOH 6535 (vv) EtOH HP-β-CyD PEG 200 Solutol and TPGS were added to the appropriate volume of freshly prepared heparinised whole blood to obtain a final excipient concentration of 05 To avoid hemolysis due to higher concentrations during the adding the blood was partially centrifuged and the excipient was pipetted in the cell-free layer By tapping the test tubes the samples were immediately mixed Two control tubes were prepared one for spontaneous hemolysis (pure blood used as the reaction blank) and another for 100 hemolysis (total cell lysis induced by sodium dodecyl sulfate at a final blood concentration of 1) Samples were incubated at 37degC At certain points of time aliquots were removed and centrifuged for 10 min at 3100 x g (37degC) to obtain plasma The absorbance of hemoglobin in the supernatant (dilution with water 1200) was measured at 405 nm (Emax precision microplate reader Bucher Biotech Basel Switzerland) The degree of hemolysis due to the excipient activity was calculated according to
100()0100
0times
minus
minus
=
AA
AAHemoylsis e
where Ae is the absorbance of hemoglobin in the supernatant after incubation with excipient A0 is the absorbance of hemoglobin in the supernatant of the reaction blank and A100 is the absorbance of hemoglobin in the supernatant after total cell lysis with sodium dodecyl sulfate Hemolytic activity was considered to have started when mean values were greater than 2 of hemolysis
333 Blood distribution
Freshly prepared heparinised blood was used and experiments were performed in triplicate both in the presence and absence of excipients The hematocrit was determined using a hematocrit centrifuge and a hematocrit reader (Haemofuge Heraeus Sepatech Germany) In order to reduce hemolysis blood aliquots (1 mL) were partially centrifuged (500 x g for 2 min) before adding the test solution in the cell-free layer followed by mixing immediately Samples were incubated at 37degC Time aliquots (1 mL) were removed and prepared for measuring radioactivity of the test compound in whole blood before centrifugation and in plasma after centrifugation for 10 min at 3100 x g (37degC) by LSC
The fraction of the test compound in plasma (FP) was calculated according to
100)1(
() times
minustimes
=
B
P
PC
HCF
where CB and CP are the drug concentration in blood and plasma respectively and H is the hematocrit value The concentration in blood cells (CBC) was calculated as follows
19
H
HCCC PB
BC
)1( minustimesminus=
and used for calculations of blood cell to plasma concentration ratio (BCPR CBCCP) and blood cell to unbound in plasma concentration ratio (ρ CBC(CPfu)) fu is the drug fraction unbound in plasma determined by the appropriate protein binding method for each compound
334 Plasma protein binding
Control experiments in phosphate buffered saline (PBS Gibco Paisley Scotland) were carried out to assess the suitability of the methods described below for each test compound in the following order ultrafiltration gt dialysis gt ultracentrifugation with ultrafiltration being the first procedure Control experiments indicated that ultrafiltration is a suitable method for COM1 COM3 COM4 and COM5 (free-permeation gt075 recovery gt85) and ultracentrifugation for COM2 (no sedimentation after 6-h centrifugation recovery gt85 ultrafiltration and dialysis showed insufficient recovery and free-permeation) Therefore protein binding was determined by the ultrafiltration technique (COM1 COM3 COM4 and COM5) or the ultracentrifugation technique (COM2)
Ultrafiltration
Samples of spiked plasma were incubated at 37degC until binding equilibrium Aliquots of 1 mL were introduced in prewarmed (37degC) Centrifree micropartition tubes (Amicon Inc Beverly MA USA) and centrifuged for 10 min at 2000 x g (37degC) For the determination of the unbound drug fraction in plasma concentrations of the test compound in ultrafiltrate and plasma were measured The unbound fraction in plasma (fu) was calculated as follows fu()=(CUFCP)x100 where CUF and CP are the drug concentration in ultrafiltrate and in plasma respectively
Equilibrium dialysis
Test solution was added to plasma followed by mixing Dialysis was carried out with 150 microL of this sample against an equal volume of phosphate-buffered saline (pH 72) in a 96-well micro-equilibrium dialysis block (HTDialysis LLC Gales Ferry CT USA) Dialysis membranes with a 12000-14000 molecular weight cut-off were soaked in phosphate buffered saline (pH 72) before use After establishment of the equilibrium buffer solution aliquots containing only unbound drug and plasma aliquots containing both bound and unbound drug were analyzed for the test compound The ratio of drug concentrations measured in the buffer and plasma after dialysis was taken as an estimate of unbound drug fraction in plasma
Ultracentrifugation
Samples of spiked plasma were incubated at 37degC until binding equilibrium Aliquots of 1 mL were transferred to polycarbonate centrifuge tubes (Beckman) and either centrifuged in a TLA 1002 rotor in Beckman TL 100 centrifuge (200000 x g 6 h 37degC) or incubated for 6 h (37degC) After centrifugation samples were separated into three layers according to density A 80-microL aliquot of the middle layer (protein-free partplasma water) was taken and analyzed for the test compound representing the unbound concentration in plasma (CU) Total plasma concentration (CP) was
20
determined in incubated samples The unbound drug fraction in plasma was calculated using CUCP
Determination of major binding protein
The affinity of test compounds to different plasma proteins was determined using the appropriate method for each compound Purified human plasma proteins were dissolved in phosphate buffered saline (PBS Gibco Paisley Scotland) at physiological concentrations as follows albumin 40 gL (ge96 Sigma) α-acid glycoprotein 1 gL (from Cohn Fraction VI 99 Sigma) γ-globulins 12 gL (from Cohn Fraction II and III Sigma) high density lipoprotein 39 gL (gt95 Calbiochem) low density lipoprotein 36 gL (gt95 Calbiochem) and very low density lipoprotein 13 gL (gt95 Calbiochem) Test solution was added to protein solutions to obtain a compound concentration of 10 ngmL (COM1 COM2) or 1000 ngmL (COM3 COM4 COM5) After incubation at 37degC separation of bound and unbound compound was achieved according methods Ultrafiltration was performed by centrifugation for 10 min for samples containing albumin and γ-globulins and for 2 min for all other samples
335 Determination of protein concentration
Protein concentration was measured by the method of Bradford (Coomassie blue protein assay) at 595 nm by using a Bio-Rad protein assay (Bio-Rad Laboratories Muumlnchen Germany) The protein concentration was determined by using a calibration curve that was established with known concentrations of human serum albumin (ge96 Sigma) ranging from 0 to 05 mgmL 10-microL aliquots of plasma (1200 dilution) and plasma water were pipetted into microtiter plate wells 200 microL dye reagent were added and samples were mixed After 1-h incubation at room temperature absorbance was measured
34 In vivo studies
Samples collected after intravenous administration of COM1 COM2 and COM3 were assayed for radioactivity by LSC and parent drug by LC-RID COM4 and COM5 were quantified in all in vivo samples only by radioactivity measurements (LSC) since the radioactivity of both radiolabeled compounds reflects well the parent drug due to no major degradation at 1 h after intravenous administration in rats (151152)
341 Experimental animals
Male Wistar rats (~250 g) and male OF1 mice (~30 g) were obtained from Charles River (Sulzfeld Germany) All animals were housed in standard cages in a controlled environment maintained on an automatic 12-h lighting cycle at a temperature of 22degC according to institutional guidelines The animals were given a standard chow and water ad libitum The animals were used after having been starved overnight
342 Drug administration and sample collection
All dosing solutions were prepared within 1 h prior to injection and stored at room temperature until use Administration was performed by a single bolus injection into the femoral vein after animals had been lightly anesthetized by isoflurane (Forenereg) Rats received [3H]COM1 at 4 microgkg as solution (1 mLkg) in glucose 5 containing
21
ethanol 1 (vv) or TPGS 20 (wv) Mice were injected a dose of 400 ngkg of [3H]COM2 formulated as solution (5 mLkg) in blank plasma (obtained by centrifugation of freshly drawn mouse blood) or in glucose 5 containing TPGS 10 (wv) An iv dose of 1 micromolkg radiolabeled COM3 (3H 300 microgkg 14C 370 microgkg) in EtOHPEG200Glu 5590 (vvv) or 40 HP-β-CyD (wv) was injected to rats (1 mLkg) [14C]COM4 was administered at 400 microgkg in saline or 17 CEL (vv) to rats (2 mLkg) [14C]COM5 at 1 mgkg in saline containing either ethanol 10 (vv) or 17 Solutol (wv) were injected to rats (2 mLkg)
Using these injection preparations excipient concentrations in blood may be estimated as about 03 (COM1) 05 (COM3 COM4 COM5) and 07 (COM2) in animals (~70 mL bloodkg) These concentrations were similar to those used in the in vitro experiments
Samples were collected after drug administration at 008 025 and 05 h for COM1 and at 008 025 05 and 1 h for COM2 COM3 COM4 and COM5 Animals (n=3 per time point) were sacrificed by isoflurane inhalation for sample collection Blood samples were collected from the vena cava and transferred into tubes containing heparin (heparin-Na BBraun) as anticoagulant Plasma samples were obtained by immediate centrifugation of blood samples at 3000 x g for 10 min Tissues were excised blotted dry and weighed Collected tissue comprised lung heart liver kidney fat muscle skin and brain for COM1 COM2 COM3 and lung muscle and skin for COM4 and brain muscle and skin for COM5 All samples were immediately frozen and stored at -20degC until analysis Tissue samples were homogenized before quantification
343 Bladder catheterization and urine collection
The experiment was performed in situ under anesthetized rats Animals (n=3formulation) received im injections of ketamine hydrochloride at a dose of 50 mgkg (100 mgmL 05 mLkg) and are positioned on an isothermal heating pad prewarmed at 38degC The abdomen was opened through a mid-line incision A polyethylene tubing (Clay-Adams PE-50) was inserted into the dome of the bladder and held in place with a purse string suture The formulation was injected into the surgically exposed femoral vein and urine was collected at 05 1 15 and 2 h after dosing All samples were frozen and stored at -20degC until analysis
344 Ex vivo protein binding
Ex vivo protein binding was determined for COM1 COM3 COM4 and COM5 according to the in vitro procedure Briefly remaining plasma samples of each time point were pooled and the unbound drug concentration in plasma was quantified using the ultrafiltration technique (see 334) After centrifugation plasma and ultrafiltrate samples were assayed for radioactivity by LSC and parent drug by LC-RID
35 Measurement of the radioactivity
Aliquots of blood plasma urine (25-50 microL) and homogenates (250 microL) were introduced into counting vials and solubilized in Biolute-S (Zinsser Analytic) Samples obtained from in vivo studies containing tritium-labeled drug were dried and the residue was reconstituted in water before solubilization To the blood samples
22
hydrogen peroxide 30 was additionally added and vials were gently swirled for several seconds and let stand for 30 min After adjusting pH gt7 by addition of hydrochloric acid 2 N the vials were filled with scintillation cocktail (Irgasafe Plus Zinsser Analytic) kept in the dark for 16 h and measured in a Tri-Carb liquid scintillation spectrometer Model A2200 (Packard)
36 Determination of parent drug 3H-radiolabeled COM1 COM2 and COM3 were determined by a liquid
chromatography-reverse isotope dilution method (LC-RID) A sample aliquot (100-500 microL) and 200 microL water containing 5 microg (COM1 COM3) or 2 microg (COM2) non-radiolabeled test compound as internal standard was added to a glass tube After further addition of 1 mL water 100 microL Titrisol buffer (pH 4 COM1 COM2 pH 7 COM3) and 4 mL diethyl ether (COM1 COM2) or tert-butylmethylether (COM3) tubes were shaken for 30 min and centrifuged (3300 x g for 10 min) The organic layer was collected in another glass tube and evaporated in a vacuum centrifuge (Univapo 150H UniEquip Martinsried Germany) The residue was taken up in 250 microL of mobile phase-water (8020 vv) and 75 microL n-hexane and the mixture was transferred in an auto sampler glass vial After centrifugation (13000 x g for 2 min) the hexane layer was discarded and 200 microL of the remainder was injected into the HPLC system equipped with a Supelcosil LC-18 column (5 microm 46 mm x 150 mm) for COM1 or Waters XTerra RP 8 column (5 microm 39 x 150 mm) for COM2 and COM3 The column temperature was 40degC and the absorbance was detected at a wavelength of 312 nm (COM1) 441 nm (COM2) or 261 nm (COM3) The mobile phase (isocratic gradient) consisted of ammonium acetate 10 mM-acetonitrile (4555 COM1 5050 COM2) or ammonium acetate 10 mM-triethylamine 01 in acetonitrile (5842 COM3) and was pumped at a rate of 10 mLmin The peak corresponding to the unchanged compound was collected in a polyethylene vial by a fraction collector (Pharmacia LKB SuperFrac) and analyzed for radioactivity Concentrations of the test compound in samples were calculated from the ratio of the amount of radioactivity in the eluted fraction and the area of the absorbance of the non-radiolabeled test compound used as internal standard
37 Data analysis
Total radioactivity concentrations expressed as ng-eqmL or ng-eqg were estimated by dividing the radioactivity concentration in samples by the specific radioactivity of administered test compound using Microsoft Excel Concentrations of parent drug were determined by the principle of reverse isotope dilution using following equation in Microsoft Excel
ID
AD
IS
AS
A
A
A
A=
where AAS is the amount of analyte in the sample (unknown to be determined) AIS is the amount of internal standard added to the sample AAD is the amount of analyte detected and AID is the amount of internal standard detected AAD was calculated using R(SRxS) where R is the amount of radioactivity determined in the peak fraction SR is the specific radioactivity and S is the slope The amount of internal standard detected was calculated as AID=AreaRF-AAD where RF is the response factor (Areang) The level of quantification (LOQ) was set to 75 dpm LOQs of
23
radioactivity and test compound in blood plasma urine and tissues were calculated by dividing 75 dpm by the specific radioactivity of the administered test compound and by the sample amount P values were calculated with a two-sample t-test in Microsoft Excel assuming unequal variances The level of significance was set at P lt005
38 Pharmacokinetic analysis
Pharmacokinetic parameters were estimated as follows The area under the drug concentration-time curve (AUC) was determined by the linear trapezoidal rule using the mean data points The half-life (t12) was calculated using ln2k where k is the rate constant k was estimated by the slope of the regression line plotted through the three final data points of the semilogarithmic AUC taking into consideration a square of correlation coefficient of RSQ gt090 Volume of distribution (V0) was calculated by dividing the dose by the concentration at time zero (C0) C0 was obtained by extrapolation to zero time of the concentration-time plot in semilogarithmic scale
24
4 Results and discussions
41 Hemolytic activity of excipients
In vitro results
CELEtOH 6535 EtOH HP-β-CyD PEG 200 and Solutol did not induce hemolysis in dog and human blood at 05 and a contact time of 4 h (data not shown) In contrast TPGS at 05 incubated with blood of various species caused hemolysis in a time-dependent manner (Figure 4-1) Erythrocytes from rat and human were more sensitive than those of mouse and dog indicated by cell lysis at shorter contact times Reducing the TPGS concentration from 05 to 01 induced no hemolysis in all four species in the investigated time range (data not shown)
010
2030
4050
6070
1 h 2 h 4 h 6 h
Incubation time
Hem
oly
sis
(
)
Rat
Mouse
Dog
Human
Figure 4-1 Effect of incubation time on the hemolytic activity of TPGS
Induced hemolysis by 05 TPGS in blood of various species (n=3 mean plusmn SD) Hemolysis in rat blood after 6-h incubation was not determined
Discussion
Except for TPGS all tested excipients (CEL EtOH HP-β-CyD Solutol and PEG 200) were non-hemolytic which is consistent with data reported in the literature (134135136137138) and the fact that they are widely used in commercially available parenteralia (54) TPGS at 05 exhibited marked hemolysis after longer contact time (gt1 h) whereas TPGS at 01 showed no hemolysis under equal incubation conditions The detected hemolysis might possibly result not mainly from TPGS but from metabolites namely α-tocopheryl succinate and polyethylene glycols both being able to destruct erythrocytes (134139140) This phenomena could contribute to the extensively delayed onset of hemolysis For the investigations TPGS at 05 was used in the non-hemolytic time range
25
42 Impact of the hematocrit on blood partition parameters
In vitro results
Whole blood derived from three species was incubated with COM2 (100 ngmL) at varying hematocrit values Concentrations of COM2 in blood and plasma were measured at equilibrium and partition parameters calculated from these data are summarized in Table 4-1 Concentrations in blood plasma and blood cells remained unaffected by the hematocrit value (040-060) The partition parameter BPR was also similar over the investigated hematocrit range whereas BCPR changed slightly and FP distinctly both decreasing by increasing the hematocrit from 040 to 060
Table 4-1 Effect of hematocrit on the in vitro blood distribution of COM2
Blood cell concentrations and partition parameters (FP BPR and BCPR) derived from [3H]COM2 concentrations measured in blood and plasma using same blood pools at different hematocrit values (n=3 mean plusmn SD)
Species Hematocrit Concentration (ngmL) FP BPR BCPR
Blood Plasma Blood cells () Mouse 040 50 plusmn 1 121 plusmn 003 152 plusmn 007 045 46 plusmn 2 120 plusmn 006 144 plusmn 013 050 101 plusmn 3 87 plusmn 4 116 plusmn 8 43 plusmn 0 116 plusmn 001 132 plusmn 001 055 40 plusmn 1 113 plusmn 004 123 plusmn 006 060 36 plusmn 1 112 plusmn 003 119 plusmn 005 Dog 040 48 plusmn 2 126 plusmn 006 166 plusmn 014 045 44 plusmn 1 125 plusmn 004 157 plusmn 009 050 109 plusmn 4 90 plusmn 2 131 plusmn 15 41 plusmn 1 125 plusmn 003 151 plusmn 005 055 38 plusmn 1 119 plusmn 003 135 plusmn 006 060 35 plusmn 1 113 plusmn 002 122 plusmn 003 Human 040 70 plusmn 3 086 plusmn 003 066 plusmn 008 045 65 plusmn 2 084 plusmn 003 065 plusmn 007 050 101 plusmn 5 125 plusmn 10 78 plusmn 6 63 plusmn 2 080 plusmn 003 060 plusmn 006 055 55 plusmn 2 082 plusmn 003 068 plusmn 006 060 55 plusmn 1 073 plusmn 002 055 plusmn 003
Discussion
The in vitro method for investigating distribution of drugs in blood commonly uses whole blood freshly prepared and pooled Drug concentrations in blood and plasma are determined Based on these data further partition parameters including CBC FP BPR and BCPR can be estimated but they are partially dependent on the hematocrit Therefore it is important to know how the hematocrit affects these parameters thereby providing useful information for comparing results With this in mind present experiments were performed over the entire physiological hematocrit range in blood pools of three different species (mouse dog and human) COM2 was used as test compound due to sufficient availability
The rank order of hematocrit influences was FP gt BCPR gt BPR gt CB asymp CP asymp CBC with most pronounced changes for FP and none for CBCPCBC Parameters calculated from concentrations measured in samples decreased constantly with increasing the hematocrit (040-060) which was most distinct for FP But within a hematocrit variation of 005 none of the parameters was dependent on the
26
hematocrit Consequently blood partition data obtained from in vitro experiments with similar hematocrits are consistent and can be compared together For data comparison across studies hematocrit adjusting to values of previous studies is suggested taking into consideration a difference of le005 between the lowest and highest value
43 Major binding proteins of model compounds
In vitro results
Figure 4-2 illustrates the qualitative binding of model compounds to isolated proteins compared to the total fraction bound in plasma The following ranking was obtained with regard to decreasing order of protein binding
COM1 albumin gt α1-acid glycoprotein gt γ-globulins asymp lipoproteins COM2 albumin gt lipoproteins gt γ-globulins gtgt α1-acid glycoprotein COM3 α1-acid glycoprotein gt albumin gt γ-globulins gtgt lipoproteins COM4 albumin gt α1-acid glycoprotein gtgt γ-globulins asymp lipoproteins COM5 albumin asymp α1-acid glycoprotein gtgt γ-globulins asymp lipoproteins
0
10
20
30
40
50
60
70
80
90
100
COM1 COM2 COM3 COM4 COM5
Bo
un
d f
racti
on
(
)
Plasma Albumin AGP γ-globulins HDL LDL VLDL
Figure 4-2 Qualitative differences in protein binding patterns of model compounds in vitro
Total protein-bound fraction of compounds in human plasma compared to the qualitative extent of compound binding to various isolated human proteins (albumin AGP γ-globulins and lipoproteins such as HDL LDL and VLDL) Each bar represents mean plusmn SD (n=3)
Discussion
In vitro experiments showed the binding of model compounds with different degrees to the three major drug-binding proteins in plasma (albumin α1-acid glycoprotein lipoproteins) A high binding to albumin (A) and α1-acid glycoprotein (AGP) was found for COM1 and COM4 (AgtAGP) COM5 (AasympAGP) and COM3 (AltAGP) In contrast COM2 was highly bound to albumin and lipoproteins
27
44 The impact of Vitamin E TPGS on COM1 in rat
In vitro results
The equilibrium of COM1 between plasma and blood cells was reached within few minutes (lt5 min data not shown) and the fraction of COM1 distributed in plasma (~75) was independent of initial blood concentrations of COM1 (006-6 ngmL) and of excipients at 05 (Table 4-2) Enhancing the excipient concentration to 5 in blood resulted in decreased COM1 in blood cells especially in the presence of TPGS (Table 4-2) In plasma COM1 was highly protein bound with high contribution of albumin and α1-acid glycoprotein in binding (Figure 4-2) and a lower free fraction was found for COM1 in TPGS at 5 (Table 4-2) TPGS was taken for the in vivo study due to the most pronounced changes observed in the in vitro experiments
Table 4-2 Effect of excipients on blood distribution and protein binding of COM1 in vitro
Partition parameters of [3H]COM1 at 006-6 ngmL obtained at equilibrium after incubation with and without excipients in rat blood (pH 74 H 046 plusmn 003 n ge3 mean plusmn SD)
Excipient FP BPR BCPR fu ρ
() () ()
None 728 plusmn 22 071 plusmn 002 041 plusmn 004 41 plusmn 02 99 plusmn 1 HP-β-CyD 05 798 plusmn 17 065 plusmn 001 027 plusmn 002 nd nd 5 882 plusmn 24 063 plusmn 002 017 plusmn 004 nd nd Solutol 05 702 plusmn 24 073 plusmn 001 043 plusmn 001 nd nd 5 878 plusmn 23 064 plusmn 001 018 plusmn 002 nd nd TPGS 05 802 plusmn 24 064 plusmn 001 026 plusmn 001 39 plusmn 07 66 plusmn 03 5 956 plusmn 20 063 plusmn 001 008 plusmn 003 17 plusmn 03 53 plusmn 15
In vivo results
In contrast to the control group where a dose of 4 microgkg was applied COM1 was administered in the TPGS group at 27 microgkg due to little compound availability Data presented within this section are normalized to a dose of 1 microgkg
Independent of the formulation plasma levels declined very rapidly with an apparent half-life of 017 h and COM1 was rapidly metabolized (lt30 unchanged COM1 in plasma at 008 h post-dose) Metabolites were fast eliminated from body indicated by a low recovery of administered COM1 shortly after dosing (lt30 of administered dose recovered at 008 h post-dose)
Upon intravenous administration of COM1 as a TPGS-containing solution lower total plasma concentrations combined with an increase of COM1 unbound in plasma by 50 were found in contrast to the control group (Table 4-3 Figure 4-3) However free drug concentrations in plasma did not differ between both groups resulting in similar AUCs (Table 4-3) This is in line with identical tissue concentrations observed in both groups (data not shown) since only the unbound drug is supposed to pass across membranes Furthermore COM1 in TPGS led to a lower fraction of parent drug in plasma (funchanged Table 4-3) and higher metabolite-related concentrations in plasma (2-fold increase Figure 4-3) indicating alterations in the kinetic profile of metabolites
28
Table 4-3 Comparative plasma kinetics of COM1 with and without TPGS
Plasma concentrations and pharmacokinetic parameters of [3H]COM1 administered intravenously in formulations based on glucose 5 (control) or TPGS 20 to rats (LOQ=2 pgmL n=3 mean plusmn SD) Data are normalized to a dose of 1 microgkg AUC(u)008-05h relates to area under unbound drug plasma concentration-time curve
Time Control TPGS
(h) COM1 in plasma (pgmL) Percentage of control value
008 184 plusmn 77 110 plusmn 6 60 025 59 plusmn 13 39 plusmn 6 66 05 32 plusmn 11 20 plusmn 6 62 C0 (pgmL) 215 132 AUC008-05h (pgmiddotmL
-1middoth) 32 20
AUC(u)008-05h (pgmiddotmL-1
middoth) 067 076 t12 (h) 017 017 funchanged () 187 55 fu () 21 plusmn 01 38 plusmn 03
Parent drug Metabolites
10
100
1000
0 025 05
Time (h)
CO
M1
(p
gm
L)
100
1000
10000
0 025 05
Time (h)
Rad
ioacti
vit
y (
pg
-eq
mL
)
Figure 4-3 Influence of TPGS on the systemic exposure of COM1 and metabolites
Plasma concentration-time profiles of parent drug and metabolite-related radioactivity of [3H]COM1 after intravenous administration to rats COM1 was injected in glucose 5 (closed symbols black line) or TPGS 20 (open symbols dashed line) Data shown are normalized to a dose of 1 microgkg and symbols represent single values and lines mean values (n=3) Values of metabolite-related radioactivity were obtained by subtracting concentrations of parent drug from concentrations of total radioactivity
Discussion
Drug-excipient interaction studies showed no direct correlation between the in vitro results and the in vivo situation in rats Upon intravenous administration of COM1 in TPGS slightly lower plasma concentrations and binding to plasma proteins were observed in animals as compared to those received COM1 in a TPGS-free solution In contrast to these in vivo findings COM1 displayed in vitro no alterations in the presence of TPGS at 05 whereas a higher TPGS concentration (5) led to
29
enhanced distribution into plasma and a higher fraction bound in plasma Furthermore very rapid metabolism and elimination of COM1 under in vivo conditions contributed to a pharmacokinetic profile inappropriate for studying drug-excipient interactions
45 The impact of Vitamin E TPGS on COM2 in mouse
In vitro results
To assess whether the ultracentrifugation time could be shortened for minimizing the degradation of COM2 in plasma (147) blank plasma samples were centrifuged and time aliquots were analyzed for total protein concentrations in plasma and plasma water After 4-h centrifugation protein levels in the plasma water section were below 005 ngmL corresponding to ~01 of total plasma proteins adequate to assure a sufficient separation of plasma water and proteins Therefore samples were collected after 4-h centrifugation for analysis
COM2 (001-100 ngmL) distributed almost equally between whole blood and plasma (FP ~45) and was very highly bound to plasma proteins (gt98 mainly to albumin and lipoproteins) (Figure 4-2) The plasma fraction (63) was enhanced for COM2 in TPGS at the beginning (lt1-h incubation) followed by equalization to excipient-free incubations (Table 4-4 Figure 4-4) The presence of TPGS reduced also the free fraction in plasma by 30 (Table 4-4) Finally TPGS was selected for the in vivo study because of the most pronounced drug-excipient interactions detected in vitro
Table 4-4 Effect of excipients on blood distribution and protein binding of COM2 in vitro
Partition parameters of [3H]COM2 at 01 ngmL obtained at equilibrium after incubation with and without excipients (05) in mouse blood (pH 73 H 045 nge3 mean plusmn SD)
Excipient Time FP BPR BCPR fu ρ
(h) () ()
None 008 406 plusmn 07 136 plusmn 002 179 plusmn 005 102 plusmn 3 1 448 plusmn 24 123 plusmn 007 151 plusmn 015
176 plusmn 003 86 plusmn 8
CELEtOH 6535(vv) 008 455 plusmn 14 121 plusmn 004 146 plusmn 009 nd 1 438 plusmn 03 125 plusmn 001 157 plusmn 002
nd nd
HP-β-CyD 008 472 plusmn 14 117 plusmn 009 138 plusmn 019 nd 1 494 plusmn 16 111 plusmn 004 125 plusmn 008
nd nd
Solutol 008 468 plusmn 11 118 plusmn 003 139 plusmn 006 nd 1 472 plusmn 16 117 plusmn 004 137 plusmn 009
nd nd
PEG 200 008 425 plusmn 13 129 plusmn 004 165 plusmn 009 nd 1 418 plusmn 20 132 plusmn 006 171 plusmn 014
nd nd
TPGS 008 629 plusmn 23 087 plusmn 003 072 plusmn 007 58 plusmn 7 1 533 plusmn 07 103 plusmn 001 107 plusmn 003
122 plusmn 012 88 plusmn 3
30
(a)
00
05
10
15
008 h 1 h
BP
R(b)
00
05
10
15
20
008 h 1 h
BC
PR
(c)
0
20
40
60
80
100
008 h 1 h
ρ
Figure 4-4 TPGS-mediated alteration of COM2 distribution in blood
Blood-plasma (a) blood cell-plasma (b) and blood cell-unbound in plasma (c) concentration ratios of [3H]COM2 at 01 ngmL in the presence (white bars) and absence (black bars) of TGPS (05) after 008-h and 1-h incubation in mouse blood (pH 73 H 045 nge3 mean plusmn SD)
In vivo results
In a previous study (153) the disposition kinetics of COM2 was evaluated in mice after iv administration in a solution containing HP-β-CyD 10 (5 mLkg) To enable a comparison of former data with those in the current investigation for internal purposes only COM2 was injected at a volume of 5 mLkg dissolved in plasma or TPGS 10 The blood concentration of TPGS from this injection preparation was estimated as ~07 assuming a blood volume of 72 mLkg Thus the amount of TPGS in blood was higher in vivo compared to the amount used in vitro (05)
The administration of COM2 as TPGS-containing solution at the same dosage caused approximately 2-fold higher plasma concentrations as compared to COM2 formulated in plasma (control) (Table 4-5 Figure 4-5) These findings are in line with data obtained in blood distribution studies in vitro where partitioning into blood cells was reduced in the presence of TPGS resulting in a higher concentration in plasma at the same total blood concentration Furthermore in vivo a higher plasma exposure to metabolites and a slower elimination of metabolites from the systemic circulation were found for COM2 in TPGS indicated by 4-fold increased AUC and t12 of metabolite-related radioactivity in plasma (Table 4-6) Determination of unbound COM2 in plasma could not be performed on samples from mice due to concentrations below LOQ (3 pgmL)
No differences in tissue concentrations were observed between both groups although COM2 in TPGS resulted in a decrease of V0 (Table 4-5) and KP (Table 4-7) both suggesting altered tissue distribution and being in line with higher drug accumulation in the circulation Because the free drug fraction in plasma generally reflects more accurately distribution processes due to the ability of unbound drugs to pass through membranes and then reach the target organ the free drug fraction determined in vitro was considered Calculated tissue-unbound in plasma concentration ratios KP(u) were reduced in the TPGS group only within the first minutes after drug administration (Table 4-7)
31
Table 4-5 Comparative plasma kinetics of COM2 with and without TPGS
Plasma concentrations (a) and pharmacokinetic parameters (b) of [3H]COM2 after iv dosing at 400 ngkg in formulations based on blank plasma (control) or TPGS to mice (LOQ=3 pgmL n=3 mean plusmn SD) significantly different from the control at Plt005 and 001 respectively
(a)
Time COM2 in plasma (pgmL)
(h) Control TPGS Percentage of control value
008 104 plusmn 11 247 plusmn 23 238 025 81 plusmn 12 159 plusmn 16 196 05 59 plusmn 2 124 plusmn 17 210 1 34 plusmn 7 80 plusmn 17 235
(b)
Parameter Unit Formulation
Blank plasma TPGS 10 Body weight kg 0028 0027 Dose ng 110 107 C0 pgmL 111 237 tfrac12 h 057 061 V0 Lkg 36 17 AUC008-1h pgmiddotmL-1middoth 56 121 DoseAUC008-1h mLh 196 89 funchanged 54 35
Parent drug Metabolites
10
100
1000
0 025 05 075 1
Time (h)
CO
M2 (
pg
mL
)
10
100
1000
0 025 05 075 1
Time (h)
Rad
ioacti
vit
y (
pg
-eq
mL
)
Figure 4-5 Influence of TPGS on the systemic exposure of COM2 and metabolites
Plasma concentration-time profiles of parent drug and metabolite-related radioactivity of [3H]COM2 after intravenous administration to mice at 400 ngkg formulated in blank plasma (closed symbols black line) or as a solution containing TPGS 10 (open symbols dashed line) Symbols represent single values and lines mean values (n=3) Values of metabolite-related radioactivity were obtained by subtracting concentrations of parent drug from concentrations of total radioactivity
32
Table 4-6 Comparative plasma kinetics of metabolites of COM2 with and without TPGS
Plasma concentrations and pharmacokinetic parameters of metabolite-related radioactivity after iv administration of [3H]COM2 (400 ngkg) in blank plasma (control) or TPGS 10 to mice (n=3 mean plusmn SD) Values of metabolite-related radioactivity were obtained by subtracting concentrations of parent drug from concentrations of total radioactivity significantly different from the control at Plt001
Time Control TPGS
(h) Metabolites in plasma (pg-eqmL) Percentage of control value
008 75 plusmn 6 307 plusmn 28 408 025 67 plusmn 4 233 plusmn 9 346 05 56 plusmn 2 246 plusmn 30 441 1 29 plusmn 8 218 plusmn 31 744 AUC008-1h (pgmiddotmL
-1middoth) 49 222 453
t12 (h) 06 24 395
Table 4-7 Comparison of tissue distribution of COM2 with and without TPGS
Tissue concentrations and tissue-plasma concentration ratios (KP) of [3H]COM2 administered intravenously at 400 ngkg in blank plasma (control) or 10 TPGS solution to mice (n=3) KP(u) relates to the free compound concentration in plasma based on the free fraction determined in vitro Values represent mean plusmn SD
Time Tissue Concentration (pgg) KP KP(u)
(h) Control TPGS Control TPGS Control TPGS 008 Lung 1808 plusmn 263 1861 plusmn 64 173 plusmn 07 76 plusmn 05 981 plusmn 39 621 plusmn 42 Heart 750 plusmn 111 699 plusmn 33 72 plusmn 03 28 plusmn 01 407 plusmn 17 233 plusmn 11 Liver 2188 plusmn 355 2314 plusmn 56 209 plusmn 12 94 plusmn 09 1186 plusmn 69 773 plusmn 72 Kidney 1761 plusmn 390 1735 plusmn 84 167 plusmn 22 71 plusmn 07 951 plusmn 124 580 plusmn 59 Fat 232 plusmn 94 238 plusmn 83 22 plusmn 09 1 plusmn 03 127 plusmn 49 79 plusmn 25 Muscle 166 plusmn 40 190 plusmn 82 16 plusmn 06 08 plusmn 03 92 plusmn 32 62 plusmn 22 Brain 1095 plusmn 70 1038 plusmn 113 105 plusmn 06 42 plusmn 01 598 plusmn 35 345 plusmn 9 025 Lung 1206 plusmn 258 1277 plusmn 213 15 plusmn 26 8 plusmn 05 850 plusmn 148 657 plusmn 43 Heart 464 plusmn 31 473 plusmn 19 58 plusmn 06 3 plusmn 02 330 plusmn 37 246 plusmn 20 Liver 1447 plusmn 203 1626 plusmn 122 18 plusmn 19 103 plusmn 13 1024 plusmn 109 846 plusmn 109 Kidney 1176 plusmn 93 1161 plusmn 83 147 plusmn 19 74 plusmn 1 837 plusmn 108 605 plusmn 86 Fat 650 plusmn 169 1109 plusmn 321 81 plusmn 19 71 plusmn 24 458 plusmn 108 581 plusmn 198 Muscle 215 plusmn 13 214 plusmn 28 27 plusmn 05 14 plusmn 01 155 plusmn 28 111 plusmn 12 Brain 1199 plusmn 143 1180 plusmn 81 152 plusmn 34 75 plusmn 12 863 plusmn 194 616 plusmn 100 05 Lung 755 plusmn 76 923 plusmn 40 129 plusmn 15 75 plusmn 06 732 plusmn 83 615 plusmn 53 Heart 296 plusmn 34 354 plusmn 53 5 plusmn 06 29 plusmn 04 287 plusmn 34 234 plusmn 29 Liver 960 plusmn 91 1138 plusmn 58 163 plusmn 15 93 plusmn 12 929 plusmn 88 760 plusmn 100 Kidney 814 plusmn 102 987 plusmn 120 139 plusmn 19 8 plusmn 04 789 plusmn 110 654 plusmn 34 Fat 863 plusmn 227 1079 plusmn 444 147 plusmn 37 89 plusmn 51 834 plusmn 209 732 plusmn 416 Muscle 181 plusmn 12 170 plusmn 13 31 plusmn 02 14 plusmn 02 175 plusmn 11 113 plusmn 13 Brain 1086 plusmn 108 1215 plusmn 147 18 plusmn 18 98 plusmn 08 1050 plusmn 77 805 plusmn 69 1 Lung 439 plusmn 60 688 plusmn 187 133 plusmn 32 86 plusmn 05 758 plusmn 179 702 plusmn 43 Heart 186 plusmn 28 220 plusmn 72 57 plusmn 15 27 plusmn 04 322 plusmn 87 222 plusmn 31 Liver 581 plusmn 43 867 plusmn 140 176 plusmn 23 11 plusmn 15 998 plusmn 132 903 plusmn 123 Kidney 481 plusmn 37 740 plusmn 89 145 plusmn 19 94 plusmn 09 825 plusmn 105 771 plusmn 78 Fat 551 plusmn 143 504 plusmn 260 173 plusmn 77 71 plusmn 54 984 plusmn 439 584 plusmn 442 Muscle 91 plusmn 12 119 plusmn 37 28 plusmn 08 15 plusmn 03 159 plusmn 43 121 plusmn 25 Brain 731 plusmn 88 1073 plusmn 161 22 plusmn 26 136 plusmn 11 1249 plusmn 147 1114 plusmn 93
33
Discussion
Results signified the ability of the excipient TPGS to modify the blood distribution of COM2 in mouse under in vitro and in vivo conditions in a similar manner Plasma concentrations of COM2 and metabolites were significantly increased and the free fraction of drug in plasma (in vitro) decreased Concentrations in tissues were independent of the formulation whereas distribution ratios of drug in tissue to drug unbound in plasma were lower within the first minutes after dosing COM2 in TPGS Overall the altered pharmacokinetic profile of COM2 in plasma suggests drug inclusion in excipient-micelles andor promoted protein binding by excipient in plasma
The altered disposition of COM2 and metabolites in plasma is likely caused by the ability of TPGS to form micelles (141) Drug trapping by micelles in blood can be responsible for increased total plasma concentrations and decreased unbound fraction in plasma thereby influencing drug accumulation in plasma and blood cells (94) Changes in the free fraction could also be caused by altered protein binding There are different suggested mechanisms by which formulation vehicles can influence the free fraction of compounds such as vehicle-compound interactions (association andor micellar encapsulation) and vehicle-protein interactions The interaction either promotes or blocks the binding of the compound in plasma Most likely different interacting processes contribute to the effective free fraction (125)
The alteration in tissue distribution at the beginning may be induced by changes of the free drug fraction in the presence of TPGS and exists only for few minutes probably due to the excipient degradation in blood The phenomenon found after some minutes post-dose is reported in the literature for Paclitaxel formulated in Cremophor EL (94) The main characteristics are disproportionally increased plasma concentrations accompanied by unchanged tissue levels and tissue distribution processes
46 The impact of hydroxypropyl-β-cyclodextrin on COM3 in rat
In vitro results
COM3 was predominantly located in the cellular fraction (80) and was moderately bound to plasma proteins with high binding to α1-glycoprotein and albumin in a concentration-independent manner (Table 4-8 Figure 4-2) The drug partitioning into blood cells and the fraction bound to proteins were markedly reduced in incubations containing HP-β-CyD consequently lowering both the blood-plasma and blood cell-unbound in plasma concentration ratios (Table 4-8 Figure 4-6) Whereas HP-β-CyD decreased the protein binding suggesting more COM3 available for uptake into cells higher plasma levels associated with reduced concentrations in cells were observed for COM3 in HP-β-CyD In conclusion HP-β-CyD was selected for the in vivo study because of the most pronounced drug-excipient interactions detected in vitro
34
(a)
0
1
2
3
None HP-β-CyD
BP
R(b)
0
1
2
3
4
5
None HP-β-CyD
BC
PR
(c)
0
10
20
30
40
None HP-β-CyD
ρ
Figure 4-6 HP-β-CyD-mediated alteration of COM3 distribution in blood
Blood-plasma (a) blood cell-plasma (b) and blood cell-unbound in plasma (c) concentration ratios of [3H]COM3 at 5 (white bars) and 500 ngmL (black bars) in the presence and absence of HP-β-CyD (05) after incubation in rat blood (pH 76 H 044 nge3 mean plusmn SD)
Table 4-8 Effect of excipients on blood distribution and protein binding of COM3 in vitro
Partition parameters of [3H]COM3 obtained at equilibrium after incubation with and without excipients (05) in rat blood (pH 76 H 044 nge3 mean plusmn SD)
Excipient COM3 FP BPR BCPR fu ρ
(ngmL) () () None 5 209 plusmn 15 26 plusmn 01 46 plusmn 02 121 plusmn 09 399 plusmn 39 500 195 plusmn 03 29 plusmn 00 53 plusmn 01 122 plusmn 02 431 plusmn 08
5 194 plusmn 14 29 plusmn 02 56 plusmn 02 nd nd CELEtOH 6535 (vv) 500 175 plusmn 03 32 plusmn 01 60 plusmn 01 nd nd HP-β-CyD 5 385 plusmn 22 14 plusmn 01 21 plusmn 02 401 plusmn 18 51 plusmn 05 500 353 plusmn 04 16 plusmn 00 23 plusmn 00 396 plusmn 07 59 plusmn 01 Solutol 5 174 plusmn 14 32 plusmn 03 61 plusmn 04 nd nd 500 161 plusmn 03 35 plusmn 01 67 plusmn 01 nd nd PEG 200 5 197 plusmn 20 29 plusmn 03 51 plusmn 06 nd nd 500 186 plusmn 05 30 plusmn 01 56 plusmn 02 nd nd
5 227 plusmn 18 25 plusmn 02 44 plusmn 04 126 plusmn 01 346 plusmn 36 EtOHPEG200Glu 5590 (vvv) 500 200 plusmn 04 28 plusmn 01 51 plusmn 01 118 plusmn 02 432 plusmn 10 TPGS 5 249 plusmn 18 23 plusmn 02 40 plusmn 02 nd nd 500 237 plusmn 03 24 plusmn 00 41 plusmn 01 nd nd
In vivo results
Since COM3 dissolved in EtOHPEG200Glu (5590 vvv) showed similar distribution kinetics in vitro as compared to glucose 5 without additives (Table 4-8) the control formulation consisted of EtOHPEG200Glu This assured a sufficient solubility of COM3
Dosing COM3 in a HP-β-CyD-containing formulation resulted in decreased protein binding and blood cell partitioning as compared to the control group (Table 4-9) However these changes were transient and most pronounced after 5 min post-dosing followed by a decline At 60 min after drug administration differences in blood pharmacokinetics could not be longer detected between both groups anymore (Table 4-9) In contrast to the in vitro findings a lower plasma distribution was found at 5 min after applying COM3 in HP-β-CyD resulting in slightly enhanced blood-plasma and blood cell-plasma concentration ratios (Table 4-9 Figure 4-7)
35
The bolus injection of COM3 in HP-β-CyD led to an earlier decrease of kidney and lung concentrations and to a later decrease of skin liver and fat concentrations compared to tissue levels obtained after administration of COM3 alone (Table 4-11) The calculation of tissue-blood concentration ratios supported the lower distribution of COM3 formulated in HP-β-CyD (Table 4-11) especially at 1 h post-dose (Figure 4-8)
As a result of the difference in plasma pharmacokinetic parameters (Table 4-10) and tissue levels between both groups the renal elimination of COM3 was examined in addition More COM3 appeared in the urine of rats from the HP-β-CyD containing formulation (Table 4-12 Figure 4-9) especially within the first 30 minutes after drug administration (36-fold higher amount of unchanged COM3 in urine compared to the control group)
Table 4-9 Comparison of blood and plasma levels of COM3 with and without HP-β-CyD
[3H]COM3 concentrations in the systemic circulation (a) and partition parameters derived from these concentrations (b) after iv administration to rats at 300 microgkg formulated in HP-β-CyD or in a cyclodextrin-free solution (n=3 mean plusmn SD LOQ=008 ngmL assuming a hematocrit of 046(145) for calculations) significantly different from the control at Plt005 and 001 respectively
(a)
Formulation Time (h) Drug concentration (ngmL)
Blood Plasma EtOHPEG200Glu 5590 008 431 plusmn 68 175 plusmn 24 (control) 05 179 plusmn 40 61 plusmn 19 1 97 plusmn 09 41 plusmn 05 HP-β-CyD 40 008 327 plusmn 16 104 plusmn 11 025 263 plusmn 22 84 plusmn 09 05 180 plusmn 08 59 plusmn 01 1 104 plusmn 06 35 plusmn 02
(b)
Formulation Time (h) fu () FP () BPR BCPR ρ
008 225 plusmn 15 25 plusmn 02 42 plusmn 04 559 plusmn 48 EtOHPEG200Glu 5590 05 76 plusmn 08 187 plusmn 19 30 plusmn 03 54 plusmn 07 709 plusmn 89 (control) 1 233 plusmn 12 24 plusmn 01 40 plusmn 03 533 plusmn 37 HP-β-CyD 40 008 249 plusmn 12 174 plusmn 11 32 plusmn 02 58 plusmn 04 233 plusmn 17 025 177 plusmn 13 175 plusmn 06 31 plusmn 01 58 plusmn 02 325 plusmn 13 05 141 plusmn 06 180 plusmn 07 31 plusmn 01 56 plusmn 03 397 plusmn 18 1 78 plusmn 05 188 plusmn 12 29 plusmn 02 53 plusmn 04 681 plusmn 52
36
Table 4-10 Comparative pharmacokinetics of COM3 with and without HP-β-CyD
Pharmacokinetic parameters of [3H]COM3 administered intravenously in EtOHPEG 200Glu (control group) or in HP-β-CyD 40 to rats (n=3)
Parameter Unit Control group HP-β-CyD group
Blood Plasma Blood Plasma Body weight kg 0233 0221 Dose microg 70 66 C0 ngmL 46 17 35 11 V0 Lkg 66 174 85 271 AUC008-1h ngmL-1
h 197 75 177 58 funchanged 28 10 28 9
Blood Plasma
0
10
20
30
40
50
60
0 025 05 075 1Time (h)
CO
M3 (
ng
mL
)
0
5
10
15
20
25
0 025 05 075 1
Time (h)
CO
M3 (
ng
mL
)
Figure 4-7 Influence of HP-β-CyD on the systemic exposure of COM3
Blood and plasma concentration-time profiles of [3H]COM3 after intravenous administration to rats at 300 microgmL formulated in EtOHPEG 200Glu (open symbols black line) and as a solution containing HP-β-CyD (closed symbols dotted line) Symbols represent single values and lines mean values (n=3)
37
0
10
20
30
40
50
60
70
Liver Kidney Brain
0
5
10
15
Fat Muscle Skin Heart0
50
100
150
Lung
KP
Figure 4-8 Influence of HP-β-CyD on tissue distribution of COM3
Tissue to blood concentration ratio (KP) at 1 h after an iv injection of COM3 in EtOHPEG 200Glu (white bars) or in HP-β-CyD (black bars) in rats (dose 300 microgkg n=3 mean plusmn SD) significantly different from EtOHPEG 200Glu at Plt005
Table 4-11 Comparison of tissue distribution of COM3 with and without HP-β-CyD
Tissue concentrations and tissue-blood concentration ratios (KP) of [3H]COM3 after bolus injection to rats at 300 microgkg in EtOHPEG 200Glu (control) or HP-β-CyD (n=3 mean plusmn SD) significantly different from the control at Plt005
Time Tissue Concentration (ngmL) KP
(h) Control HP-β-CyD Percentage of control value Control HP-β-CyD
008 Liver 1412 plusmn 225 1058 plusmn 211 75 328 plusmn 01 326 plusmn 75 Kidney 1809 plusmn 191 1406 plusmn 72 78 424 plusmn 50 431 plusmn 24 Fat 128 plusmn 29 85 plusmn 18 67 31 plusmn 11 26 plusmn 06 Heart 597 plusmn 108 563 plusmn 55 94 139 plusmn 11 172 plusmn 13 Lung 6179 plusmn 809 4595 plusmn 192 74 1441 plusmn 110 1407 plusmn 6 Muscle 123 plusmn 25 142 plusmn 12 115 30 plusmn 11 44 plusmn 03 Skin 144 plusmn 62 74 plusmn 15 51 36 plusmn 20 22 plusmn 03 Brain 1164 plusmn 189 951 plusmn 41 82 271 plusmn 19 291 plusmn 21 05 Liver 588 plusmn 149 617 plusmn 60 105 329 plusmn 53 345 plusmn 42 Kidney 587 plusmn 163 479 plusmn 55 82 327 plusmn 51 267 plusmn 29 Fat 57 plusmn 10 46 plusmn 6 81 32 plusmn 02 26 plusmn 04 Heart 178 plusmn 46 187 plusmn 23 105 99 plusmn 10 104 plusmn 08 Lung 2003 plusmn 599 2376 plusmn 129 119 1108 plusmn 156 1324 plusmn 76 Muscle 155 plusmn 63 130 plusmn 12 84 84 plusmn 16 72 plusmn 05 Skin 94 plusmn 11 40 plusmn 9 42 54 plusmn 06 22 plusmn 06 Brain 905 plusmn 100 766 plusmn 49 85 515 plusmn 60 428 plusmn 44 1 Liver 394 plusmn 29 340 plusmn 6 86 407 plusmn 12 328 plusmn 19 Kidney 357 plusmn 44 293 plusmn 39 82 366 plusmn 12 283 plusmn 47 Fat 31 plusmn 1 22 plusmn 5 72 32 plusmn 04 21 plusmn 04 Heart 111 plusmn 13 99 plusmn 6 89 114 plusmn 04 95 plusmn 01 Lung 1197 plusmn 128 1053 plusmn 178 88 1247 plusmn 246 1011 plusmn 128 Muscle 99 plusmn 9 85 plusmn 23 86 102 plusmn 02 81 plusmn 19 Skin 68 plusmn 16 25 plusmn 3 37 69 plusmn 11 25 plusmn 02 Brain 653 plusmn 35 599 plusmn 10 92 674 plusmn 27 578 plusmn 22
38
Table 4-12 Comparison of COM3 excretion in urine with and without HP-β-CyD
[14C]COM3 (a) and its cumulative amount (b) appeared in the urine of rats following iv dosing at 370 microgkg in EtOHPEG 200Glu (control) or HP-β-CyD 40 (mean plusmn SD n=2 control n=3 HP-β-CyD) significantly different from the control at Plt005 and 001 respectively (a)
Time (h) COM3 in urine (ng) funchanged ()
Control HP-β-CyD Control HP-β-CyD 05 123 plusmn 10 4440 plusmn 594 25 plusmn 02 448 plusmn 82 1 240 plusmn 129 762 plusmn 191 34 plusmn 08 13 plusmn 41 15 85 plusmn 19 325 plusmn 150 25 plusmn 08 73 plusmn 28 2 43 plusmn 11 174 plusmn 89 2 plusmn 08 46 plusmn 21
(b)
Time Cumulative amount of COM3 in urine
(h) ng dose
Control HP-β-CyD Control HP-β-CyD 05 123 plusmn 10 4440 plusmn 594 013 plusmn 001 46 plusmn 09 1 363 plusmn 139 5202 plusmn 693 039 plusmn 014 54 plusmn 11 15 449 plusmn 159 5527 plusmn 799 048 plusmn 016 57 plusmn 12 2 491 plusmn 169 5702 plusmn 857 053 plusmn 017 59 plusmn 12
0
1000
2000
3000
4000
5000
6000
7000
05 1 15 2
Time (h)
Am
ou
nt
excre
ted
(n
g)
Figure 4-9 Effect of HP-β-CyD on the renal elimination of COM3
Cumulative amount of [14C]COM3 appeared in urine after iv administration of 370 microgkg either in EtOHPEG 200Glu (white bars) or as a solution in HP-β-CyD (black bars) Data are expressed as mean plusmn SD (n=2 EtOHPEG 200Glu n=3 HP-β-CyD) significantly different from the EtOHPEG 200Glu at Plt001
Discussion
In vitro and in vivo experiments demonstrated a strong influence of the excipient HP-β-CyD on the disposition kinetics of COM3 in rats There was a significant decrease in the plasma protein binding and in plasma and tissue concentrations of COM3 formulated in HP-β-CyD Changes in the systemic circulation were transient (le05 h post-dose) and most distinct shortly after dosing Alterations in tissue
39
concentrations and tissue-blood distribution ratios were tissue dependent and most pronounced for skin The amount of unchanged COM3 eliminated in the urine was significantly increased following drug administration in HP-β-CyD This alteration in the pharmacokinetic behavior of COM3 is most likely due to the elimination of COM3 included in cyclodextrin complexes
It is known (142) that HP-β-CyD forms drugcyclodextrin complexes in biological fluids is unable to cross biological membranes and is rapidly eliminated renally Even though the release of drugs from drugcyclodextrin complexes is expected to be fast (within seconds) (112) drug pharmacokinetics can be modified in the presence of cyclodextrins (143) Given that COM3 is included in complexes in the systemic circulation less COM3 is available for distribution which could have led to the lower protein binding and celltissue partitioning of COM3 formulated in HP-β-CyD compared to the cyclodextrin-free solution of COM3 Lower ρ-values of COM3 in HP-β-CyD support the possible existence of long-lasting complexes in vivo and indicate that unbound plasma concentrations obtained from ultrafiltration (30000 MW cut-off) are probably the sum of free and cyclodextrin-associated drug (MWHP-β-CyD
~1500) Furthermore blood partition parameters altered till 30 min post-dose indicate a slow dissociation of COM3 from complexes After total drug release COM3 formulated in HP-β-CyD seemed to assimilate the pharmacokinetic behavior in blood obtained in the control group (60 min post-dose)
The marked increase of unchanged COM3 in the urine occurred mainly in the first 30 min following drug administration in HP-β-CyD which is consistent with the decreased plasma levels right after dosing in the HP-β-CyD group Similar observations are reported for carbamazepine and dexamethasone where the renal excretion of unchanged drug applied intravenously in HP-β-CyD was increased most likely due to the renal clearance of the formulation vehicle (112) The faster elimination of COM3 associated to HP-β-CyD in contrast to COM3 alone might have attributed to less COM3 available for tissue distribution even after completed drug release from the vehicle being in line with decreased tissue levels and KP values at 60 min post-dose
47 The impact of Cremophor EL on COM4 in rat
In vitro results
In excipient-free incubations COM4 was highly bound to plasma proteins (gt97 bound predominantly to albumin) and penetrated hardly into blood cells (gt95 located in plasma) (Tables 4-13 and 4-14 Figure 4-2) The free fraction in plasma and the partitioning into blood cells of COM4 were enhanced in the presence of CEL HP-β-CyD and Solutol The protein binding decreased in an excipient concentration-dependent manner (Table 4-13 Figure 4-10) At excipient concentrations below 01 the protein binding was not altered At and above excipient concentrations of 01 the free fraction was markedly elevated with a maximal effect at 1 for all three formulations The addition of these excipients to incubations resulted to higher blood-plasma and blood cell-plasma concentration ratios both indicating increased uptake of COM4 into blood cells (Table 4-14) CEL was selected for the in vivo study because of the most pronounced drug-excipient interactions detected in vitro
40
Table 4-13 Effect of excipients on the in vitro protein binding of COM4
Protein binding of [14C]COM4 at 100 ngmL in the presence and absence of excipients in rat plasma using the ultrafiltration technique (pH 74 n=3 mean plusmn SD)
Excipient fu
() ()
Percentage of control value
None 24 plusmn 02 CEL 001 23 plusmn 01 96 01 31 plusmn 01 131 05 111 plusmn 03 464 1 260 plusmn 03 1089 HP-β-CyD 001 26 plusmn 02 109 01 43 plusmn 02 179 05 98 plusmn 01 412 1 141 plusmn 11 592 Solutol 001 23 plusmn 02 97 01 32 plusmn 02 134 05 97 plusmn 02 407 1 152 plusmn 03 638 PEG 200 05 24 plusmn 01 99 TPGS 05 2 plusmn 01 85
Table 4-14 Effect of excipients on the in vitro partition parameters of COM4 in blood
Plasma fraction (FP) and distribution ratios (BPR BCPR ρ) of [14C]COM4 at 100 ngmL in rat blood obtained at equilibrium after incubations with and without excipients at 05 and 1 (pH 75 H 044 37degC nge3 mean plusmn SD)
Excipient FP BPR BCPR ρ
() ()
None 959 plusmn 20 058 plusmn 001 005 plusmn 003 21 plusmn 06 CEL 05 739 plusmn 16 075 plusmn 002 043 plusmn 006 39 + 05 1 656 plusmn 17 085 plusmn 002 067 plusmn 005 26 + 02 HP-β-CyD 05 900 plusmn 13 062 plusmn 001 014 plusmn 002 15 plusmn 02 1 819 plusmn 14 068 plusmn 001 028 plusmn 003 20 plusmn 02 Solutol 05 786 plusmn 15 071 plusmn 001 035 plusmn 003 36 plusmn 03 1 749 plusmn 14 075 plusmn 001 043 plusmn 003 28 plusmn 03
In vivo results
Dosing COM4 in a CEL-containing formulation resulted in a decrease of the protein binding as compared to the control group (Table 4-15 Figure 4-10) This effect was time-dependent and most pronounced at 5 min after drug administration followed by a decline The increased fraction of COM4 unbound in plasma did not affect the drug levels in the systemic circulation resulting in similar pharmacokinetic parameters in both groups (Table 4-15) Identical tissue concentrations were observed independently of the formulation (Table 4-16)
41
In vitro Ex vivo
0
5
10
15
20
25
30
0 05 1
Excipient concentration ()
Fre
e f
racti
on
(
)
Cremophor EL
Hydroxypropyl-β-cyclodextrin
Solutol HS 15
0
5
10
15
20
25
0 025 05 075 1
Time (h)
Fre
e f
racti
on
(
)
Control group
Cremophor EL group
Figure 4-10 Excipient-mediated alterations of COM4 protein binding in plasma
Left Unbound fraction of [14C]COM4 (100 ngmL) incubated with different excipient concentrations in rat plasma (mean plusmn SD n=3) Right Unbound fraction of compound-related radioactivity in plasma after intravenous administration of [14C]COM4 at 400 microgkg formulated in buffer (control group closed symbols) or in CEL (open symbols) Symbols represent mean plusmn SD (n=3)
Table 4-15 Comparative blood and plasma kinetics of COM4 with and without CEL
Compound-related radioactivity concentrations in the systemic circulation (a) and pharmacokinetic parameters (b) after iv administration of [14C]COM4 at 400 microgkg formulated in buffer or in CEL to rats (n=3 mean plusmn SD LOQ=43 ng-eqmL assuming a hematocrit of 046(145) for calculations) significantly different from the control at Plt005 (a)
Formulation Time (h) Concentration (ng-eqmL)
Blood Plasma Unbound in plasma ()
008 1555 plusmn 299 2483 plusmn 382 025 1192 plusmn 119 2073 plusmn 238 05 1377 plusmn 67 2388 plusmn 153
Phosphate buffered saline (control)
1 1248 plusmn 68 2105 plusmn 172
38 + 15
Cremophor EL 17 008 1471 plusmn 115 2426 plusmn 186 169 plusmn 34 025 1316 plusmn 119 2180 plusmn 237 77 plusmn 24 05 1216 plusmn 155 2084 plusmn 237 74 plusmn 27 1 1315 plusmn 337 2210 plusmn 607 74 plusmn 28
(b)
Parameter Unit Control group Cremophor group
Blood Plasma Blood Plasma Body weight kg 0201 0199 Dose microg 81 80 C0 ngmL 1427 2373 1385 2296 V0 Lkg 028 017 029 017 AUC008-1h ngmL-1
h 1211 2068 1186 1998
42
Table 4-16 Comparison of tissue distribution of COM4 with and without CEL
Tissue concentrations and tissue-blood concentration ratios of radioactivity of [14C]COM4 after bolus injection to rats at 400 microgkg formulated either in buffer (control group) or in CEL (n=3 mean plusmn SD)
Time Tissue Drug concentration (ng-eqg) Tissue-blood distribution ratio
Control group Cremophor group Control group Cremophor group
008 h Lung 737 + 78 768 + 17 048 + 004 052 + 003 Muscle 222 + 6 243 + 12 015 + 002 017 + 002 Skin 276 + 63 254 + 46 019 + 008 017 + 002 025 h Lung 654 + 44 710 + 51 055 + 002 054 + 001 Muscle 209 + 5 211 + 6 018 + 002 016 + 002 Skin 363 + 70 395 + 41 030 + 004 030 + 004 05 h Lung 695 + 46 676 + 40 050 + 001 056 + 004 Muscle 202 + 4 204 + 1 015 + 0 017 + 002 Skin 408 + 39 372 + 25 030 + 004 031 + 004 1 h Lung 628 + 19 629 + 78 050 + 001 059 + 013 Muscle 212 + 10 196 + 13 017 + 001 019 + 008 Skin 409 + 24 391 + 45 033 + 001 037 + 009
Discussion
CEL lowered the binding of COM4 to plasma proteins in vitro and the higher free drug fraction was associated with enhanced partitioning into blood cells as compared to the excipient-free incubations Similar increases of unbound drug levels in plasma were observed after bolus injection of COM4 in CEL In contrast to the in vitro findings CEL induced no changes in the in vivo bloodplasma distribution of COM4 and no alterations in the tissue distribution were detected as well
Even though the plasma protein binding of COM4 is influenced by CEL in an analogous manner under in vitro and in vivo conditions a direct translation of the altered protein binding into blood and plasma concentrations is lacking in vivo Different to the in vitro investigations the in vivo situation involves not only distribution but also elimination processes which can initiate shifts in the systemic drug exposure Besides this the effective excipient concentration achieved in vivo in the circulation is usually unknown and can quite differ from concentrations applied in vitro Although excipient concentrations can be theoretically estimated using blood volume dose and application volume values are fairly arbitrary because excipient levels can decline fast in the body due to dilution (144) and degradation (126) within the blood compartment
48 The impact of Solutol HS 15 on COM5 in rat
In vitro results
The distribution of COM5 between whole blood and plasma was slightly concentration-dependent in rat regardless of incubations with or without excipients (Table 4-17) and the equilibrium conditions were rapidly reached for all solutions (lt5 min) except for CEL (equilibrium after 1-h incubation data not shown) The binding of COM5 to plasma proteins was moderate (lt90) with a high binding to albumin and α1-acid glycoprotein (Figure 4-2) and the bound fraction was reduced by the addition of CEL and Solutol Furthermore both excipients caused alterations in the blood-plasma and blood cell-plasma concentration ratios characterized by
43
enhanced drug partitioning into blood cells (Table 4-17 Figure 4-11) The higher cell uptake is consistent with decreased drug binding to plasma proteins in the presence of CEL and Solutol These effects were more prominent for COM5 with Solutol than with CEL Thus Solutol was selected for the in vivo study
Table 4-17 Effect of excipients on blood distribution and protein binding of COM5 in vitro
Partition parameters of [14C]COM5 obtained at equilibrium after incubation with and without excipients (05) in rat blood (pH 75 H 045 nge3 mean plusmn SD)
Excipient COM5 FP BPR BCPR fu ρ
(ngmL) () () None 10 857 plusmn 40 064 plusmn 003 021 plusmn 007 162 plusmn 11 14 plusmn 03 300 768 plusmn 16 072 plusmn 002 037 plusmn 003 119 plusmn 02 31 plusmn 02 Ethanol 10 812 plusmn 01 066 plusmn 005 023 plusmn 011 114 plusmn 04 22 plusmn 07 300 779 plusmn 09 072 plusmn 001 036 plusmn 002 116 plusmn 02 30 plusmn 02
10 660 plusmn 22 083 plusmn 003 063 plusmn 006 227 plusmn 18 28 plusmn 03 CELEtOH 6535 (vv) 300 577 plusmn 12 095 plusmn 002 090 plusmn 004 237 plusmn 04 38 plusmn 02 HP-β-CyD 10 803 plusmn 27 069 plusmn 002 030 plusmn 005 nd nd 300 754 plusmn 18 073 plusmn 002 040 plusmn 004 nd nd Solutol 10 550 plusmn 05 097 plusmn 006 100 plusmn 002 281 plusmn 10 33 plusmn 05 300 487 plusmn 09 113 plusmn 002 129 plusmn 004 277 plusmn 04 43 plusmn 04 PEG 200 10 769 plusmn 23 072 plusmn 002 037 plusmn 005 nd nd 300 736 plusmn 13 075 plusmn 001 044 plusmn 003 nd nd TPGS 10 832 plusmn 13 063 plusmn 005 018 plusmn 012 nd nd 300 785 plusmn 18 070 plusmn 002 033 plusmn 004 nd nd
(a)
00
02
04
06
08
10
12
10 ngmL 300 ngmL
BP
R
(b)
00
02
04
06
08
10
12
14
10 ngmL 300 ngmL
BC
PR
(c)
00
10
20
30
40
50
10 ngmL 300 ngmL
ρ
Figure 4-11 Excipient-mediated alterations of COM5 distribution in blood by CEL and Solutol
Blood-plasma (a) blood cell-plasma (b) and blood cell-unbound in plasma (c) concentration ratios of [14C]COM5 (10-300 ngmL) without excipients (black bars) and in the presence of Cremophor EL (white bars) and Solutol HS 15 (hatched bars) at 05 in rat blood (pH 75 H 045 nge3 mean plusmn SD)
In vivo results
In vitro studies demonstrated that the addition of ethanol to incubations had no impact on the blood partition of COM5 (Table 4-17) Therefore COM5 was dissolved in ethanol 10 for the administration in the control group thereby assuring sufficient solubility of the compound
Within the first 15 min post-dose higher blood concentrations accompanied by similar plasma concentrations were observed for COM5 in Solutol compared to concentrations for COM5 in ethanol 10 (control group) thereby increasing
44
concentration ratios of blood-plasma and blood cell-plasma in the Solutol group (Table 4-18) Subsequently similar ratios were obtained in both groups with a concomitant slower decline of circulation concentrations in animals treated with Solutol These changes in the Solutol group are in line with a reduced rate constant that resulted in a 2-fold higher half-life compared to that in the control group (Table 4-19) At 1 h post-dose concentrations of COM5 in the systemic circulation were 300 higher than those obtained after dosing the compound in the control formulation (Table 4-18 Figure 4-12) The doseAUC ratio was also decreased for COM5 in Solutol (Table 4-19) In agreement with the in vitro findings COM5 formulated in Solutol led to a permanent lower protein binding up to 1 h post-dose in addition to enhanced uptake into blood cells right after dosing (higher blood-plasma concentration ratio) (Table 4-18)
Table 4-18 Comparison of blood and plasma levels of COM5 with and without Solutol
Concentrations of compound-related radioactivity in the systemic circulation (a) and partition parameters (b) derived from these concentrations after iv administration of [14C]COM5 at 1 mgkg formulated in Solutol or in a Solutol-free solution (control group) to rats (n=3 mean plusmn SD LOQ=8 ng-eqmL assuming a hematocrit of 046(145) for calculations) significantly different from the control group at Plt005 and 001 respectively (a)
Time (h) Drug concentration (ng-eqmL)
Control group Solutol group Percentage of control value
Blood 008 1308 plusmn 178 1853 plusmn 155 142 025 895 plusmn 195 1243 plusmn 250 139 05 615 plusmn 193 976 plusmn 115 159 1 194 plusmn 24 585 plusmn 113 301 Plasma 008 2592 plusmn 558 2720 plusmn 266 105 025 1584 plusmn 168 1895 plusmn 337 120 05 1014 plusmn 385 1526 plusmn 112 150 1 311 plusmn 47 900 plusmn 165 289
(b)
Formulation Time (h) fu () FP () BPR BCPR ρ
Control 008 1062 plusmn 93 051 plusmn 004 -006 plusmn 01 -07 plusmn 11 (ethanol 10) 025 975 plusmn 148 056 plusmn 008 005 plusmn 017 19 plusmn 05 05 876 plusmn 125 062 plusmn 009 018 plusmn 019 42 plusmn 22 1
84 plusmn 14
862 plusmn 25 063 plusmn 002 019 plusmn 004 19 plusmn 04 Solutol 17 008 792 plusmn 18 068 plusmn 002 031 plusmn 003 22 plusmn 02 025 825 plusmn 18 065 plusmn 001 025 plusmn 003 19 plusmn 02 05 847 plusmn 51 064 plusmn 004 021 plusmn 008 14 plusmn 05 1
150 plusmn 23
832 plusmn 12 065 plusmn 001 024 plusmn 002 12 plusmn 01
Independent of the formulation brain levels ranged in concentrations corresponding
to the vascular contamination indicating no significant penetration of COM5 into brain (Table 4-20) A later increase in muscle and skin concentrations was detected for COM5 administered in Solutol (Table 4-20) The muscle concentration-time profile showed an analogous pattern to that in the systemic circulation with a longer persistence going along with higher concentrations at later post-dose times in the Solutol group (Table 4-21 Figure 4-12) However similar muscle-plasma concentration ratios between both groups pointed that Solutol did not affect the
45
muscle distribution pattern In contrast the higher skin concentrations of COM5 formulated in Solutol were associated with altered KP values (025 and 1 h post-dose) and same half-life compared to the control group (Tables 4-20 and 4-21)
Table 4-19 Comparative pharmacokinetics of COM5 with and without Solutol
Pharmacokinetic parameters of compound-related radioactivity after intravenous administration of [14C]COM5 in ethanol 10 (control group) or in Solutol 17 to rats (n=3)
Parameter Unit Control group Solutol group
Blood Plasma Blood Plasma Body weight kg 0214 0212 Dose microg 214 212 C0 ngmL 1562 2998 1840 2749 V0 Lkg 064 033 054 036 AUC008-1h ngmL-1
h 578 1011 931 1426 t12 h 033 032 069 069 DoseAUC008-1h mLh 369 211 228 149
Table 4-20 Comparison of tissue distribution of COM5 with and without Solutol
Tissue concentrations and tissue-plasma concentration ratios of radioactivity of [14C]COM5 after bolus injection at 1 mgkg to rats in ethanol 10 (control) or Solutol 17 (n=3 mean plusmn SD)
Time Tissue Concentration (ngg) Tissue-plasma ratio
Control Solutol Percentage of control value Control Solutol
008 h Muscle 400 + 53 476 + 69 119 016 plusmn 002 018 plusmn 004 Skin 248 + 26 240 + 48 97 010 plusmn 003 009 plusmn 003 Brain 27 + 3 40 + 2 150 001 plusmn 0 001 plusmn 0 025 h Muscle 311 + 43 424 + 21 137 020 plusmn 003 023 plusmn 004 Skin 243 + 15 413 + 62 170 015 plusmn 001 022 plusmn 002 Brain 16 + 2 26 + 4 161 001 plusmn 0 001 plusmn 0 05 h Muscle 228 + 25 333 + 15 146 025 plusmn 009 022 plusmn 001 Skin 235 + 33 384 + 11 163 025 plusmn 008 025 plusmn 001 Brain 10 + 2 18 + 3 188 001 plusmn 0 001 plusmn 0 1 h Muscle 57 + 2 174 + 30 307 019 plusmn 003 019 plusmn 0 Skin 152 + 11 246 + 46 162 050 plusmn 011 028 plusmn 004 Brain mdasha 11 + 1 nd 001 plusmn 0 001 plusmn 0 a below LOQ significantly different from the control at Plt005
Table 4-21 Comparison of muscle and skin kinetics of COM5 with and without Solutol
Pharmacokinetic parameters of compound-related radioactivity in tissues after intravenous administration of [14C]COM5 at 1 mgkg formulated in ethanol 10 (control group) or Solutol 17 to rats (n=3)
Parameter Unit Muscle Skin
Control group Solutol group Control group Solutol group AUC008-1h ngmL-1
h 199 298 198 313 C0 ngg 533 548 nd nd t12 h 030 058 104 097
46
Plasma Muscle Skin
100
1000
10000
0 025 05 075 1
Time (h)
Co
ncen
trati
on
(n
g-e
qm
L)
10
100
1000
0 025 05 075 1
Time (h)
Co
ncen
trati
on
(n
g-e
qm
L)
100
1000
0 025 05 075 1
Time (h)
Co
ncen
trati
on
(n
g-e
qm
L)
Figure 4-12 Influence of Solutol on plasma muscle and skin profiles of COM5
Concentration-time courses of compound-related radioactivity in plasma muscle and skin after intravenous administration of [14C]COM5 at 1 mgkg formulated in ethanol 10 (closed symbols black line) and as a solution containing Solutol 17 (open symbols dotted line) Symbols represent single values and lines mean values (n=3)
Discussion
In vitro and in vivo experiments showed that Solutol significantly modulated the disposition profile of COM5 in rats by drug-excipient interactions in blood COM5 formulated in Solutol decreased both the drug distribution into plasma (transient in vivo) and the binding to plasma proteins (prolonged in vivo) Furthermore animals treated with Solutol showed a later concentration increase in the circulation and tissues (muscle skin) (ge025 h post-dose)
Altered drug levels were related to prolonged half-lives in the circulation and muscle The longer blood persistence is consistent with the reduced clearance (doseAUC) which presumes a lower elimination of COM5 in the presence of Solutol In contrast to the muscle concentration-time profile similar to that in the circulation the skin profile exhibited no changes in the half-life potentially due to a lower vascularization in skin compared to that in muscle However the skin-plasma concentration ratio was affected by the Solutol formulation whereas no changes in KP values were observed for muscle This altered pharmacokinetic profile might relate to a lower clearance of COM5 in the presence of Solutol
Previous investigations in mice revealed an interaction between Solutol and a co-administered ketochlorine photosensitizer (C8KC) in plasma (127) Protein binding experiments indicated the formation of either a binary drug-excipient complex or a ternary complex involving drug excipient and plasma components This effect was correlated to similar half-lives of Solutol and C8KC in plasma suggesting the persistence of C8KC in the circulation associated with that of the excipient Likewise half-lives in the same range were also observed for C8KC and the excipient Cremophor EL going along with prolonged C8KC persistence in plasma and tissues in mice (85)
47
5 General discussion and conclusions
In vitro and in vivo experiments were carried out to investigate the potential of five excipients commonly used in formulations to modify the pharmacokinetics of co-administered model compounds at concentrations ranging from sub-therapeutic to pharmacological levels Conducted studies focused mainly on the impact of excipients in the blood compartment since such data have rarely been published up to now especially for intravenously low dosed compounds including highly active drug substances biomarkers PET ligands and microdoses
PEG 200 CEL HP-β-CyD and Solutol were chosen as excipients because of their use in intravenous formulations and their high solubilizing ability related to different molecular structures and solubilization principles by either a direct solvent effect or by formation of micelles or complexes TPGS known in oral formulations completed the set of selected excipients and is an interesting functional excipient in terms of its chemical properties (benzyl ring) and ability to alter metabolism andor transporter activities thereby potentially influencing cellular distribution
Five drug candidates in development at Novartis were selected as model compounds exhibiting different physicochemical and pharmacokinetic properties (Table 5-1) The two PET ligands COM1 (base) and COM2 are lipophilic and poorly water-soluble COM3 is characterized by its predominant location in the cellular fraction in blood whereas COM4 hardly penetrates into blood cells COM2 distributes equally between plasma and whole blood COM5 is a molecule with a high polar surface area and a low volume of distribution similar to that of COM4 Moreover COM2 COM1 and COM4 are very highly protein bound (gt95) and COM3 and COM5 are moderately protein bound (lt90) In addition binding studies using isolated plasma proteins showed that model compounds bind with different affinity to the three major drug-binding proteins in plasma (albumin α1-acid glycoprotein and lipoproteins)
Model compounds were used in low doses to achieve blood concentrations of lt5 ngmL for COM1 and COM2 and low-therapeutic levels for COM3 (5-50 ngmL) Due to the very low volume of distribution COM4 and COM5 were investigated at normal pharmacological concentrations (gt50 ngmL in blood) to guarantee detectable tissue levels
In order to analyze the in vitro-in vivo correlation the excipient was set at an excipient-blood ratio of 1200 This concentration was found to be non-hemolytic in vitro for selected excipients except TPGS which induced hemolysis after a longer contact time To rule out any changes caused by cell lysis TPGS investigations were carried out in the non-hemolytic range The excipient concentration of 05 also correlates to the normal dosing range estimated for an intravenous bolus injection in mice and rats assuming a blood volume of ~70 mLkg and an injection volume of lt3 mLkg However in humans according to the literature (54) excipient concentrations above 01 in blood are regarded as high and generally only obtained following intravenous infusions Considering marketed injectable formulations for example the amount of excipient in blood is up to 015 HP-β-CyD (Sporanox) and 03-05 CEL (Vumon and Taxol respectively)
48
Table 5-1 Overview of model compounds
Physicochemical (PC) and pharmacokinetic (PK) properties of model compounds selected for investigating drug-excipient interactions in blood
Compound COM1 COM2 COM3 COM4 COM5 PET ligand PET ligand NCE NCE NCE
Chemical structure
N
N
O
R1
R2
O
N
O
N
N
S
R1
R2
N
O
N
R
NN
R2
R1
N
NO
S O
NH
O
O
NH
OR1
R2
R3
PC properties MW (gmol) 240 410 295 lt400 533 LogD 68 34 45 23 17 37 pKa 38 57 41 87 32 46 106 H20 solubility pH 68 (mgL) 20 lt25 4000 lt500 100 PSA (Aring2) 35 50 25 63 166 H-bond acceptors 3 5 3 4 12 H-bond donors 0 0 0 1 3 Critical value(s) Solubility (base) Solubility MW PSA H-bond acc PK parameters Species Rat Mouse Rat Rat Rat In vitro Fraction in plasma () 75 45 20 ~100 80 Free in plasma () 21 18 12 24 11 Major binding protein Albumin gt AGP Albumin gt LP AGP gt Albumin Albumin gt AGP Albumin asymp AGP In vivo Matrix Plasma Blood Blood Plasma Plasma t12 (h) 008 11 11 10 04 CL (mLminkg) 202 10 142 04 72 Vss (Lkg) 11 14 10 03 03 funchanged () 14 49 14 98 94 AGP α1-acid glycoprotein CL Drug clearance funchanged Fraction of unchanged drug based on AUC ratio of parent drug and total radioactivity LogD Logarithm of octanol-water distribution coefficient LP Lipoproteins MW Molecular weight NCE New chemical entity pKa Negative logarithm of dissociation constant PSA Polar surface area t12 Main elimination half-life Vss Volume of distribution under steady-state conditions
49
In trying to evaluate the potential of excipients to affect partition parameters in blood selected excipients were screened in vitro for interactions with the model compounds using a blood distribution method and protein binding assays (ultrafiltrationultracentrifugation) The most interacting excipients were subsequently taken forward for in vivo studies in animals given a single iv dose to ascertain whether there was a change in pharmacokinetics and whether an in vitro-in vivo correlation existed
Amongst the excipients tested the excipient PEG 200 was not active as an interacting agent whereas the others were more or less active (Table 5-2) However there was no apparent relationship between the nature of interactions and the compound properties
TPGS was found in vitro to enhance the plasma fraction of COM1 and COM2 in blood and higher plasma concentrations were associated with a decrease of compound unbound in plasma A significant increase in plasma concentrations of parent drug (2-fold) and metabolites (4-fold) were observed following intravenous administration of COM2 in mice and t12 of COM2 remained unchanged whereas t12 of metabolites was 4-fold higher While TPGS led to similar trends of COM1-related metabolites after injection in rats values determined for parent drug were inconsistent with those obtained in vitro A very extensive metabolism coupled to fast elimination was detected for COM1 which led to a stop in additional investigations to understand the in vitro-in vivo discrepancy
The use of CEL and Solutol in rats reduced in vitro the binding of COM4 and COM5 to plasma proteins and the higher free drug fraction was accompanied by enhanced partitioning into blood cells Both excipients led to 2-fold higher unbound plasma concentrations following iv administration of COM4 formulated in CEL and COM5 in a Solutol-containing solution Systemic and tissue levels of COM4 remained unaffected In contrast dosing COM5 in Solutol resulted in an earlier increase of blood-plasma concentration ratios indicating enhanced uptake into blood cells Later on COM5 concentrations in blood and plasma were significantly enhanced to a similar extent (2-fold) yielding ratios equalized to control values The systemic accumulation was correlated to higher t12 (2-fold) The AUC of COM5 in muscle and skin increased going along with a raise of t12 in muscle and none in skin
In vitro HP-β-CyD increased the amount of COM3 distributed into rat plasma and lowered the binding to plasma proteins Concentration ratios were only about 12 for blood-plasma and 18 for blood cell-unbound in plasma as compared to reference values At earlier time points after iv dosing concentrations of COM3 in blood and plasma were lower in the presence of HP-β-CyD (~23 of control) whereas over 30-fold higher levels of COM3 in urine were found Subsequently tissue concentrations and tissue-blood concentration ratios of COM3 with HP-β-CyD were significantly decreased
50
Table 5-2 Qualitative impact of excipients on pharmacokinetic parameters
Excipient-compound interactions obtained after in vitro incubations and after intravenous administration in animals using excipients at ~05 in blood and compounds at a dose of either ~1 nmolkg (COM1 COM2) or ~1 micromolkg (COM3 COM4 COM5) Arrows indicate excipient-induced changes compared to the excipient-free group (harr no changes uarr increase darr decrease) Compound Excipient Species Changes Comments
In vitro In vivo COM1 Vit E TPGS Rat uarr Accumulation in plasma darr Plasma protein binding bull No changes in vitro at le05 TPGS darr Partitioning into blood cells darr AUC008-05h bull Similar AUCs of drug free in plasma uarr Plasma protein binding darr C0 bull Increase in AUC of metabolites
harr t12 bull Inappropriate model compound due harr Tissue distribution to rapid metabolismelimination COM2 Vit E TPGS Mice uarr Accumulation in plasma uarr AUC008-1h bull uarr AUC and uarr t12 of metabolites darr Partitioning into blood cells uarr C0 bull Ex vivo protein binding not available
uarr Plasma protein binding harr t12 due to values ltLOQ harr Tissue distribution
COM3 HP-β-cyclodextrin Rat uarr Accumulation in plasma darr Plasma protein binding
darr Partitioning into blood cells darr AUC008-1h
darr Plasma protein binding darr C0
harr t12
darr Skin concentrations
uarr Urinary excretion
COM4 Cremophor EL Rat darr Accumulation in plasma darr Plasma protein binding uarr Partitioning into blood cells harr AUC008-1h
darr Plasma protein binding harr C0
harr t12
harr Tissue distribution
COM5 Solutol HS 15 Rat darr Accumulation in plasma darr Plasma protein binding
uarr Partitioning into blood cells uarr AUC008-1h
darr Plasma protein binding harr C0
uarr t12
uarr Muscleskin concentrations
AUC Area under the plasma drug concentration-time curve C0 Initial plasma concentration at time zero LOQ Limit of quantification t12 Half-life in plasma using the last three data points
51
These results clearly show the role of excipients as a modulator of the protein binding and cellular partitioning of compounds in blood which can impact the overall drug disposition Excipient-induced changes in the free fraction and cell uptake of drugs within the blood compartment are explained by various mechanisms (Figure 5-1) An excipient is able to influence the fraction of a co-administered drug in plasma and blood cells by direct drug interactions andor interferences with blood components such as proteins and cell constituents particularly membranes Consequently bound and free concentrations in plasma and cellular concentrations may be shifted potentially contributing to a ldquonewrdquo steady state Altered plasma concentrations can be the result of changes in drug protein binding drug adsorption to excipients andor drug trapping into excipient micelles or complexes Whichever effect dominates more drug can be free or bound thereby accounting for the amount of drug available for cellular partitioning Excipients could also vary the uptake into blood cells due to alterations in membrane structure andor drug presentation both mechanisms either facilitating or hindering drug transport via membranes In the end most likely different interacting processes contribute to the final effect depending on the force and nature of each single interaction
Free drug Free drug
Bound drug
Protein-bound drug
Excipient-drug interactions
(solubilization adsorption incorporation)
(destruction adsorption integration penetration)
PLASMA BLOOD CELLS
Excipient-membrane interactionsExcipient-protein interactions
(destruction adsorption binding)
Figure 5-1 Mechanisms underlying alterations in drug partition parameters in blood
The presence of excipients in blood may influence drug levels in plasma (protein-bound and free fraction) and blood cells by interacting with the drug or blood components thereby either blocking or promoting the protein binding andor the drug available for cellular partitioning
Analyzing the in vitro with the in vivo situation the effect of selected excipients on
the protein binding showed a good in vitro-in vivo correlation whereas systemic concentrations after iv administration in animals could often not be predicted well from in vitro data In contrast to in vitro assays reflecting stationary conditions the in vivo situation entails processes running in an open and dynamic system thereby involving not only distribution but also elimination This can initiate shifts in the systemic drug exposure and be responsible for the absence of a direct correlation to bloodplasma concentrations and thus to pharmacokinetic parameters as well Apart from this the effective excipient concentration achieved in vivo in the circulation is usually unknown and may differ from concentrations applied in vitro Although excipient concentrations can be theoretically estimated using blood volume dose and application volume values are fairly arbitrary because excipient levels decline most likely fast in the body due to dilution and degradation within the blood
52
compartment This suggests that if alterations in blood partitioning occur following administration in vivo they should be best detectable at times shortly post-dose
Even though differences between the in vitro and in vivo results were found the in vitro test can serve as a straightforward tool for rapid detection of excipient-drug interactions in blood while requiring little amounts of drug As a result the determination of in vitro blood partition parameters is proposed as a rough estimator of a possible potential of excipients to contribute to pharmacokinetics of parenteral drugs In addition to the blood-to-plasma distribution ratio the protein binding provides useful information to elucidate excipient-induced alterations and allows the calculation of the blood cell-to-free in plasma distribution ratio These data help not only to optimize the proper evaluation of pharmacokinetics in animals but also to enable a more rational approach in the development of formulations for drug candidates Therefore the in vitro investigation of blood distribution and protein binding with and without excipient is recommended at a very early preclinical stage in cases where animal pharmacokinetics of lower dosed compounds (eg PET ligands) must be examined from excipient-containing solutions (eg surfactants complexing agents) The influence assessment of excipients may also be a promising formulation approach for iv solutions of non-ionizable lipophilic and nonpolar molecules which are very challenging to formulate appropriately due to poor water solubility (eg paclitaxel docetaxel cyclosporin)
Figure 5-2 illustrates a possible formulation procedure that integrates data generated by in vitro investigations in blood Cosolvents complexing agents surfactants and combinations of these excipients are frequently used to dissolve a compound for intravenous administration in animals Method(s) are chosen considering available compound characteristics such as physicochemical and pharmacokinetic properties doses and clinical objectives If an appropriate formulation in terms of solubility and stability is found blood distribution and protein binding studies are performed both in the presence and absence (reference) of excipient(s) using in vitro assays Protein binding studies should mainly be considered if the extent of binding can be appropriately determined by ultrafiltration dialysis or ultracentrifugation all three conventional and simple methods Next partition parameters (FP fu BPR BCPR and ρ) are evaluated and compared to those obtained for the reference formulation representing an excipient-free solution (eg glucose 5 or saline including pH adjustment buffer blank plasma) Formulations are ranked in order of changes relative to the reference As a result a formulation can be modified adapted or selected for intravenous administration in animals In cases where the in vivo administration requires the addition of excipient(s) to the reference formulation to solubilize the compound the formulation must be tested in vitro The formulation is an acceptable in vivo reference if the in vitro parameters are similar to those of the excipient-free solution ie the in vitro reference The outcome of the in vivo study triggers formulation optimization to minimize or abolish excipient effects further investigation to better interpret data or formulation acceptance for in vivo dosing and formulation development Finally it should be possible to exclude or at least be aware of a potential impact of excipient(s) on the drug disposition Data can also be applied to identify both the activity of a certain excipient with different compounds and the excipient sensitivity of compounds with similar properties
53
Compound characteristics
Formulation principle Excipients
Formulation properties
In vitro assays using blood plasma
Data analysis
Adapt formulation In vivo application
Assess in vitro-in vivo correlation
Candidate-tailored formulation
Figure 5-2 Suggested flow chart for an iv formulation development strategy
In conclusion substantial drug-excipient interactions in animals have been
identified for different excipients commonly used in drug formulation and pharmacologically active compounds with diverse properties These findings support the assumption that certain excipients are not ldquoinertrdquo but are ldquofunctionalrdquo excipients and are able to alter the disposition of co-administered drugs Such data need special attention since excipient-related changes may occur with similar or other drugexcipient formulations Identifying excipient-drug interactions and understanding how excipients affect the drug behavior will assist in the pharmacokinetic characterization and the formulation developmentoptimization of drug candidates in development Furthermore a better knowledge of the relationship between drug excipient and blood constituents suggests new approaches in drug development in terms of controlling the pharmacokinetic profile by the right choice of excipient and its amount This may enable to better anticipate the target of different blood and body compartments without extensive animal and human tests potentially resulting in modulated pharmacological responses
54
6 Outlook
The results of this work demonstrated the ability of commonly used injectable excipients especially CEL HP-β-CyD and SHS to influence pharmacokinetic parameters in blood consequently contributing to altered drug disposition following iv dosing However to increase the knowledge of drug-excipient interactions additional studies are required to confirm the above findings with further drugexcipient formulations and with an emphasis on the role of excipients per se in pharmacokinetics of parenteral drugs
The excipients were tested in vitro and in vivo at a fixed concentration of 05 in
blood being within the normal range for animal injections and higher for clinical ones Investigations by varying the excipient amount would give insight into the concentration-effect relationship and potency of excipients Examination of lower excipient levels should also give an indication about the relevance and impact of excipient-induced alterations on applications in humans
No direct correlation between the interacting excipient and the compound
properties were found and no trends could be apparently observed in changes regarding the excipient characteristics Continued investigations are necessary to elucidate whether observed phenomena are associated with certain drugs or more by some drug classes characterized by specific physicochemical properties Focusing on excipients it would be of interest to explore more in detail the frequency and significance of interactions and the excipient preference in terms of particular changes
The emphasis throughout the current work was placed on providing an insight into
excipient-triggered effects and their in vitro-in vivo correlation According to the literature little is known about mechanisms underlying these alterations taking into account in vitro-in vivo investigations (94110112) To explain findings and improve excipient characterization further investigations should focus on the mechanistic basis for the role of excipients in protein binding bloodplasma partitioning and cellular distribution using in vitro assays appropriate to understand the observed effects In addition modification of in vitro approaches could facilitate correlation of effects and mechanisms determined in vitro with in vivo situations increase the understanding of in vitro-in vivo relationships and enable extrapolation of in vitro results to in vivo pharmacokinetics A better in vitro-in vivo correlation could also reduce in vivo studies and may contribute to more efficient drug development
There are drug-drug interactions reported in the literature where drugs were
administered intravenously in conjunction with excipient-containing formulation of other drugs (eg valspodar formulated in CEL) (108109) Most likely the presence of excipient(s) in drug formulations contributed to observed pharmacokinetic interactions
55
The research into the potential of excipients to induce kinetic alterations of agents administered intravenously in conjunction with excipient-containing formulation of other compounds should lead to a deeper insight into drug-drug interactions These data may provide helpful information relevant for safety issues dosage planning and treatment optimization in clinical drug monitoring
Further studies could focus on the potential clinical significance of drug-excipient
interactions observed in animals Finally ongoing efforts for a proper understanding of excipients as biologically and
pharmacologically active compounds will allow a better control of designing formulations with optimal characteristics for a better drug therapy
56
7 References
References to external publications and books
(1) Values received from Charles River Laboratoires (2) In E Green (ed) The biology of the laboratory mouse McGraw-Hill Inc New York 1966 (3) In H Baker J Lindsey and S Weisbroth (eds) The laboratory rat Academic Press Inc
New York 1979 (4) H E Weimer D M Roberts P Villanuevo and H G Porter Genetic differences in
electrophoretic patterns during the phlogistic response in the albino rat Comp Biochem Physiol B 43965-973 (1972)
(5) Geigy Scientific Tables 8th ed Vol2 Ciba-Geigy Basel 1983 (6) M Lemaire Drug binding to leucocytes and platelets Symposia Medica Hoechst 79-93
(1986) (7) P H Hinderling Red blood cells a neglected compartment in pharmacokinetics and
pharmacodynamics Pharmacol Rev 49279-295 (1997) (8) J Tillement G Houin R Zini S Urien E Albengres J Barre M Lecomte P DAthis and
B Sebille The binding of drugs to blood plasma macromolecules recent advances and therapeutic significance Adv Drug Res 1359-94 (1984)
(9) Z H Israili and P G Dayton Human alpha-1-glycoprotein and its interactions with drugs Drug Metab Rev 33161-235 (2001)
(10) K M Wasan and S M Cassidy Role of plasma lipoproteins in modifying the biological activity of hydrophobic drugs J Pharm Sci 87411-424 (1998)
(11) P du Souich J Verges and S Erill Plasma protein binding and pharmacological response Clin Pharmacokinet 24435-440 (1993)
(12) F Akhlaghi and A K Trull Distribution of cyclosporin in organ transplant recipients Clin Pharmacokinet 41615-637 (2002)
(13) G M Pacifici and A Viani Methods of determining plasma and tissue binding of drugs Pharmacokinetic consequences Clin Pharmacokinet 23449-468 (1992)
(14) J Oravcova B Bohs and W Lindner Drug-protein binding sites New trends in analytical and experimental methodology J Chromatogr B Biomed Appl 6771-28 (1996)
(15) Z Liu F Li and Y Huang Determination of unbound drug concentration and protein-drug binding fraction in plasma Biomed Chromatogr 13262-266 (1999)
(16) A Lipinski Experimental and computational approaches to estimate solubility and permeability in drug discovery and development settings Adv Drug Deliv Rev 233-26 (1997)
(17) R Panchagnula N S Thomas Biopharmaceutics and pharmacokinetics in drug research Int J Pharm 201131-150 (2000)
(18) M S Lajiness M Vieth and J Erickson Molecular properties that influence oral drug-like behavior 16 Curr Opin Drug Discov Devel 7470-477 (2004)
(19) H van de Waterbeemd G Camenisch G Folkers J R Chretien and O A Raevsky Estimation of blood-brain barrier crossing of drugs using molecular size and shape and H-bonding descriptors J Drug Target 6151-165 (1998)
(20) B Testa P Crivori M Reist P Carrupt The influence of lipophilicity on the pharmacokinetic behavior of drugs concepts and examples Persp Drug Discov Design 19179-211 (2000)
(21) In V Pliska B Testa H van Waterbeemd (eds) Methods and Principles in Medicinal Chemistry Vol4 VCH Weinheim Germany 1996
(22) G L Amidon H Lennernas V P Shah and J R Crison A theoretical basis for a biopharmaceutic drug classification the correlation of in vitro drug product dissolution and in vivo bioavailability Pharm Res 12413-420 (1995)
(23) C A Lipinski Poor aqueous solubility - an industry-wide problem in ADME screening Capsugel Symposium Tokyo Japan 33-48 (2003)
(24) C A Lipinski Drug-like properties and the causes of poor solubility and poor permeability J Pharmacol Toxicol Methods 44235-249 (2000)
57
(25) K R Horspool and C A Lipinski Advancing new drug delivery concepts to gain the lead Drug Deliv Technol 334-46 (2003)
(26) M Kaushal Amorphous drug delivery systems molecular aspects design and performance Crit Rev Ther Drug Carrier Sys 21133-193 (2004)
(27) H Fischer Blood-brain barrier permeation molecular parameters governing passive diffusion J Membrane Biol 165201-211 (1998)
(28) A Seelig A general pattern for substrate recognition by P-glycoprotein Eur J Biochem 251252-261 (1998)
(29) A Seelig X L Blatter and F Wohnsland Substrate recognition by P-glycoprotein and the multidrug resistance-associated protein MRP1 a comparison Int J Clin Pharmacol Ther 38111-121 (2000)
(30) D E Clark Rapid calculation of polar molecular surface area and its application to the prediction of transport phenomena 2 Prediction of blood-brain barrier penetration J Pharm Sci 88815-821 (1999)
(31) J Kelder Polar molecular surface as a dominating determinant for oral absorption and brain penetration of drugs Pharm Res 161514-1519 (1999)
(32) K Palm K Luthman A L Ungell G Strandlund and P Artursson Correlation of drug absorption with molecular surface properties J Pharm Sci 8532-39 (1996)
(33) K Palm P Stenberg K Luthman and P Artursson Polar molecular surface properties predict the intestinal absorption of drugs in humans Pharm Res 14568-571 (1997)
(34) D E Clark Rapid calculation of polar molecular surface area and its application to the prediction of transport phenomena 1 Prediction of intestinal absorption J Pharm Sci 88807-814 (1999)
(35) H van der Waterbeemd G Camenisch G Folkers and O A Raevsky Estimation of Caco-2 cell permeability using calculated molecular descriptors Quant Struct Act Relat 15480-490 (1996)
(36) S Winiwarter N M Bonham F Ax A Hallberg H Lennernas and A Karlen Correlation of human jejunal permeability (in vivo) of drugs with experimentally and theoretically derived parameters A multivariate data analysis approach J Med Chem 414939-4949 (1998)
(37) A Bergstroem Absorption classification of oral drugs based on molecular surface properties J Med Chem 46558-570 (2003)
(38) D F Veber S R Johnson H Y Cheng B R Smith K W Ward and K D Kopple Molecular properties that influence the oral bioavailability of drug candidates J Med Chem 452615-2623 (2002)
(39) J F Pritchard M Jurima-Romet M L Reimer E Mortimer B Rolfe and M N Cayen Making better drugs Decision gates in non-clinical drug development Nat Rev Drug Discov 2542-553 (2003)
(40) P Preziosi Opinion science pharmacoeconomics and ethics in drug RampD a sustainable future scenario Nature Rev Drug Discov 3521-526 (2004)
(41) I Kola Opinion Can the pharmaceutical industry reduce attrition rates Nature Rev Drug Discov 3711-716 (2004)
(42) L J Lesko M Rowland C C Peck T F Blaschke D Breimer H J de Jong A Grahnen J J Kuhlmann and B Stewart Optimizing the science of drug development opportunities for better candidate selection and accelerated evaluation in humans Eur J Pharm Sci 10iv-xiv (2000)
(43) G Lappin and R C Garner Big physics small doses the use of AMS and PET in human microdosing of development drugs Nat Rev Drug Discov 2233-240 (2003)
(44) R D Combes T Berridge J Connelly M D Eve R C Garner S Toon and P Wilcox Early microdose drug studies in human volunteers can minimise animal testing proceedings of a workshop organised by volunteers in research and testing Eur J Pharm Sci 191-11 (2003)
(45) Biomarkers definitions working group Biomarkers and surrogate endpoints preferred definitions and conceptual framework Clin Pharmacol Ther 6989-95 (2001)
(46) J Lesko Use of biomarkers and surrogate endpoints in drug development and regulatory decision making criteria validation strategies Annu Rev Pharmacol Toxicol 41347-366 (2001)
58
(47) R Frank and R Hargreaves Clinical biomarkers in drug discovery and development Nat Rev Drug Discov 2566-580 (2003)
(48) M Bergstrom A Grahnen and B Langstrom Positron emission tomography microdosing a new concept with application in tracer and early clinical drug development Eur J Clin Pharmacol 59357-366 (2003)
(49) M Jagoda Experiment assessment of mass effects in the rat implications for small animal PET imaging Nucl Med Biol 31771-779 (2004)
(50) Y C Lee P D Zocharski and B Samas An intravenous formulation decision tree for discovery compound formulation development Int J Pharm 253111-119 (2003)
(51) B Bittner and R J Mountfield Intravenous administration of poorly soluble new drug entities in early drug discovery the potential impact of formulation on pharmacokinetic parameters Curr Opin Drug Discov Devel 559-71 (2002)
(52) A K Singla A Garg and D Aggarwal Paclitaxel and its formulations Int J Pharm 235179-192 (2002)
(53) N Maurer D B Fenske and P R Cullis Developments in liposomal drug delivery systems Expert Opin Biol Ther 1923-947 (2001)
(54) R G Strickley Solubilizing excipients in oral and injectable formulations Pharm Res 21201-230 (2004)
(55) A G Floyd Top ten considerations in the development of parenteral emulsions 4134-143 (1999)
(56) M J Lawrence and G D Rees Microemulsion-based media as novel drug delivery systems Adv Drug Deliv Rev 4589-121 (2000)
(57) E Merisko-Liversidge G G Liversidge and E R Cooper Nanosizing a formulation approach for poorly-water-soluble compounds Eur J Pharm Sci 18113-120 (2003)
(58) E B Rabinow Nanosuspensions in drug delivery Nature Rev Drug Discov 3785-796 (2004)
(59) H Karl A good practice guide to the administration of substances and removal of blood including routes and volumes J Appl Toxicol 2115-23 (2001)
(60) D M Woodcock S Jefferson M E Linsenmeyer P J Crowther G M Chojnowski B Williams and I Bertoncello Reversal of the multidrug resistance phenotype with Cremophor EL a common vehicle for water-insoluble vitamins and drugs Cancer Res 504199-4203 (1990)
(61) D M Woodcock M E Linsenmeyer G Chojnowski A B Kriegler V Nink L K Webster and W H Sawyer Reversal of multidrug resistance by surfactants Br J Cancer 6662-68 (1992)
(62) J M Dintaman and J A Silverman Inhibition of P-glycoprotein by D-alpha-tocopheryl polyethylene glycol 1000 succinate (TPGS) Pharm Res 161550-1556 (1999)
(63) K R W A S C Wandel C Inactive ingredients may alter bioavailability of drugs through effects on P-glycoprotein (PGP) and CYP3A Clin Pharmacol Ther 69P71 (2001)
(64) A N Abulrob M Mason R Bryce and M Gumbleton The effect of fatty acids and analogues upon intracellular levels of doxorubicin in cells displaying P-glycoprotein mediated multidrug resistance J Drug Target 8247-256 (2000)
(65) G Cornaire J F Woodley S Saivin J Y Legendre S Decourt A Cloarec and G Houin Effect of polyoxyl 35 castor oil and polysorbate 80 on the intestinal absorption of digoxin in vitro Arzneimittelforschung 50576-579 (2000)
(66) E D Hugger B L Novak P S Burton K L Audus and R T Borchardt A comparison of commonly used polyethoxylated pharmaceutical excipients on their ability to inhibit P-glycoprotein activity in vitro J Pharm Sci 911991-2002 (2002)
(67) J Zastre J Jackson M Bajwa R Liggins F Iqbal and H Burt Enhanced cellular accumulation of a P-glycoprotein substrate rhodamine-123 by Caco-2 cells using low molecular weight methoxypolyethylene glycol-block-polycaprolactone diblock copolymers Eur J Pharm Biopharm 54299-309 (2002)
(68) A V Kabanov E V Batrakova and D W Miller Pluronic block copolymers as modulators of drug efflux transporter activity in the blood-brain barrier Adv Drug Deliv Rev 55151-164 (2003)
59
(69) D W Miller E V Batrakova and A V Kabanov Inhibition of multidrug resistance-associated protein (MRP) functional activity with pluronic block copolymers Pharm Res 16396-401 (1999)
(70) K Yunomae H Arima F Hirayama and K Uekama Involvement of cholesterol in the inhibitory effect of dimethyl-beta-cyclodextrin on P-glycoprotein and MRP2 function in Caco-2 cells FEBS Lett 536225-231 (2003)
(71) M M Nerurkar P S Burton and R T Borchardt The use of surfactants to enhance the permeability of peptides through Caco-2 cells by inhibition of an apically polarized efflux system Pharm Res 13528-534 (1996)
(72) R J Mountfield S Senepin M Schleimer I Walter and B Bittner Potential inhibitory effects of formulation ingredients on intestinal cytochrome P450 Int J Pharm 21189-92 (2000)
(73) B M Johnson W N Charman and C J Porter An in vitro examination of the impact of polyethylene glycol 400 Pluronic P85 and vitamin E d-alpha-tocopheryl polyethylene glycol 1000 succinate on P-glycoprotein efflux and enterocyte-based metabolism in excised rat intestine AAPS PharmSci 4E40 (2002)
(74) R C Bravo Gonzalez J Huwyler F Boess I Walter and B Bittner In vitro investigation on the impact of the surface-active excipients Cremophor EL Tween 80 and Solutol HS 15 on the metabolism of midazolam Biopharm Drug Dispos 2537-49 (2004)
(75) A G Bagnarello L A Lewis M C McHenry A J Weinstein H K Naito A J McCullough R J Lederman and T L Gavan Unusual serum lipoprotein abnormality induced by the vehicle of miconazole N Engl J Med 296497-499 (1977)
(76) H K Naito and L A Lewis Induced hyperlipidemia and delipidation of serum alpha-lipoproteins by polyethoxylated castor oil Protides Biol Fluids 25COM2-398 (1978)
(77) H K Naito M C McHenry and L A Lewis Drug-induced dyslipoproteinemia a report of two cases Clin Chem 26163-168 (1980)
(78) M Hacker M Koeferl C B Hong and M A Fagan Cremophor and Emulphor induced alterations of serum lipids and lipoprotein electrophoretic patterns of dogs Res Commun Chem Pathol Pharmacol 31119-128 (1981)
(79) M Kongshaug L S Cheng J Moan and C Rimington Interaction of Cremophor EL with human plasma Int J Biochem 23473-478 (1991)
(80) K Woodburn and D Kessel The alteration of plasma lipoproteins by Cremophor EL J Photochem Photobiol B 22197-201 (1994)
(81) D Kessel K Woodburn D Decker and E Sykes Fractionation of Cremophor EL delineates components responsible for plasma lipoprotein alterations and multidrug resistance reversal Oncol Res 7207-212 (1995)
(82) E Sykes K Woodburn D Decker and D Kessel Effects of Cremophor EL on distribution of Taxol to serum lipoproteins Br J Cancer 70401-404 (1994)
(83) G M Garbo The use of liposomes emulsions or inclusion complexes may potentiate in vivo effects of SnET2 Proc SPIE 1203118-125 (1990)
(84) D Kessel A Morgan and G M Garbo Sites and efficacy of photodamage by tin etiopurpurin in vitro using different delivery systems Photochem Photobiol 54193-196 (1991)
(85) K Woodburn C K Chang S Lee B Henderson and D Kessel Biodistribution and PDT efficacy of a ketochlorin photosensitizer as a function of the delivery vehicle Photochem Photobiol 60154-159 (1994)
(86) L K Webster E J Cosson K H Stokes and M J Millward Effect of the paclitaxel vehicle Cremophor EL on the pharmacokinetics of doxorubicin and doxorubicinol in mice Br J Cancer 73522-524 (1996)
(87) T Colombo P O Gonzalez M Zucchetti A Maneo C Sessa A Goldhirsch M DIncalci and M Maneo Paclitaxel induces significant changes in epidoxorubicin distribution in mice Ann Oncol 7801-805 (1996)
(88) T Colombo I Parisi M Zucchetti C Sessa A Goldhirsch and M DIncalci Pharmacokinetic interactions of paclitaxel docetaxel and their vehicles with doxorubicin Ann Oncol 10391-395 (1999)
(89) M J Millward L K Webster D Rischin K H Stokes G C Toner J F Bishop I N Olver B M Linahan M E Linsenmeyer and D M Woodcock Phase I trial of cremophor EL with bolus doxorubicin Clin Cancer Res 42321-2329 (1998)
60
(90) J Liu E H Kraut S Balcerzak M Grever S DAmbrosio and K K Chan Dosing sequence-dependent pharmacokinetic interaction of oxaliplatin with paclitaxel in the rat Cancer Chemother Pharmacol 50445-453 (2002)
(91) A Sparreboom O van Tellingen W J Nooijen and J H Beijnen Nonlinear pharmacokinetics of paclitaxel in mice results from the pharmaceutical vehicle Cremophor EL Cancer Res 562112-2115 (1996)
(92) A G Ellis and L K Webster Inhibition of paclitaxel elimination in the isolated perfused rat liver by Cremophor EL Cancer Chemother Pharmacol 4313-18 (1999)
(93) L Gianni L Vigano A Locatelli G Capri A Giani E Tarenzi and G Bonadonna Human pharmacokinetic characterization and in vitro study of the interaction between doxorubicin and paclitaxel in patients with breast cancer J Clin Oncol 151906-1915 (1997)
(94) A Sparreboom L van Zuylen E Brouwer W J Loos P de Bruijn H Gelderblom M Pillay K Nooter G Stoter and J Verweij Cremophor EL-mediated alteration of paclitaxel distribution in human blood clinical pharmacokinetic implications Cancer Res 591454-1457 (1999)
(95) L van Zuylen J Verweij and A Sparreboom Role of formulation vehicles in taxane pharmacology Invest New Drugs 19125-141 (2001)
(96) D Kessel Properties of Cremophor EL micelles probed by fluorescence Photochem Photobiol 56447-451 (1992)
(97) W J Loos J Szebeni A J ten Tije J Verweij D M van Zomeren K N Chung K Nooter G Stoter and A Sparreboom Preclinical evaluation of alternative pharmaceutical delivery vehicles for paclitaxel Anticancer Drugs 13767-775 (2002)
(98) Dhanikula AB Singh DR and Panchagnula R In vivo pharmacokinetic and tissue distribution studies in mice of alternative formulations for local and systemic delivery of paclitaxel gel film prodrug liposomes and micelles Curr Drug Deliv 235-44 (2005)
(99) Solvent-free paclitaxel formulation better than taxol Scrip (S00825922 20031209) 2003 (100) L Vigano A Locatelli G Grasselli and L Gianni Drug interactions of paclitaxel and
docetaxel and their relevance for the design of combination therapy Invest New Drugs 19179-196 (2001)
(101) R Danesi F Innocenti S Fogli A Gennari E Baldini A Di Paolo B Salvadori G Bocci P F Conte and M Del Tacca Pharmacokinetics and pharmacodynamics of combination chemotherapy with paclitaxel and epirubicin in breast cancer patients Br J Clin Pharmacol 53508-518 (2002)
(102) S Fogli R Danesi A Gennari S Donati P F Conte and M Del Tacca Gemcitabine epirubicin and paclitaxel pharmacokinetic and pharmacodynamic interactions in advanced breast cancer Ann Oncol 13919-927 (2002)
(103) T Kasai M Oka H Soda J Tsurutani M Fukuda Y Nakamura S Kawabata K Nakatomi S Nagashima H Takatani M Fukuda A Kinoshita and S Kohno Phase I and pharmacokinetic study of paclitaxel and irinotecan for patients with advanced non-small cell lung cancer Eur J Cancer 381871-1878 (2002)
(104) B L Lum S Kaubisch A M Yahanda K M Adler L Jew M N Ehsan N A Brophy J Halsey M P Gosland and B I Sikic Alteration of etoposide pharmacokinetics and pharmacodynamics by cyclosporine in a phase I trial to modulate multidrug resistance J Clin Oncol 101635-1642 (1992)
(105) N J Lacayo B L Lum D L Becton H Weinstein Y Ravindranath M N Chang L Bomgaars S J Lauer B I Sikic and G V Dahl Pharmacokinetic interactions of cyclosporine with etoposide and mitoxantrone in children with acute myeloid leukemia Leukemia 16920-927 (2002)
(106) D A Rushing S R Raber K A Rodvold S C Piscitelli G S Plank and D A Tewksbury The effects of cyclosporine on the pharmacokinetics of doxorubicin in patients with small cell lung cancer Cancer 74834-841 (1994)
(107) B L Samuels R Mick N J Vogelzang S F Williams R L Schilsky A R Safa S M OBrien and M J Ratain Modulation of vinblastine resistance with cyclosporine a phase I study Clin Pharmacol Ther 54421-429 (1993)
61
(108) D J Boote I F Dennis P R Twentyman R J Osborne C Laburte S Hensel J F Smyth M H Brampton and N M Bleehen Phase I study of etoposide with SDZ PSC 833 as a modulator of multidrug resistance in patients with cancer J Clin Oncol 14610-618 (1996)
(109) H Minami T Ohtsu H Fujii T Igarashi K Itoh N Uchiyama-Kokubu T Aizawa T Watanabe Y Uda Y Tanigawara and Y Sasaki Phase I study of intravenous PSC-833 and doxorubicin reversal of multidrug resistance Jpn J Cancer Res 92220-230 (2001)
(110) M Jin T Shimada K Yokogawa M Nomura Y Mizuhara H Furukawa J Ishizaki and K Miyamoto Cremophor EL releases cyclosporin A adsorbed on blood cells and blood vessels and increases apparent plasma concentration of cyclosporin A Int J Pharm 293137-144 (2005)
(111) M E Davis and M E Brewster Cyclodextrin-based pharmaceutics past present and future Nat Rev Drug Discov 31023-1035 (2004)
(112) V J Stella V M Rao E A Zannou and V Zia V Mechanisms of drug release from cyclodextrin complexes Adv Drug Deliv Rev 363-16 (1999)
(113) H W Frijlink A C Eissens N R Hefting K Poelstra C F Lerk and D K Meijer The effect of parenterally administered cyclodextrins on cholesterol levels in the rat Pharm Res 89-16 (1991)
(114) H W Frijlink E J Franssen A C Eissens R Oosting C F Lerk and D K Meijer The effects of cyclodextrins on the disposition of intravenously injected drugs in the rat Pharm Res 8380-384 (1991)
(115) E E Sideris M A Koupparis and P E Macheras Effect of cyclodextrins on protein binding of drugs the diflunisalhydroxypropyl-beta-cyclodextrin model case Pharm Res 1190-95 (1994)
(116) P Y Grosse F Bressolle P Rouanet and J M Joulia Methyl-beta-cyclodextrin and doxorubicin pharmacokinetics and tissue concentrations following bolus injection of these drugs alone or together in the rabbit Int J Pharm 180215-223 (1999)
(117) T Shinoda S Kagatani A Maeda Y Konno H Hashimoto K Hara K Fujita and T Sonobe Sugar-branched-cyclodextrins as injectable drug carriers in mice Drug Dev Ind Pharm 251185-1192 (1999)
(118) B McCormack and G Gregoriadis Comparative studies of the fate of free and liposome-entrapped hydroxypropyl-beta-cyclodextrindrug complexes after intravenous injection into rats implications in drug delivery Biochim Biophys Acta 1291237-244 (1996)
(119) A Sharma K Anderson and J W Baker Flocculation of serum lipoproteins with cyclodextrins application to assay of hyperlipidemic serum Clin Chem 36529-532 (1990)
(120) A Sharma and L S Janis Lipoprotein-cyclodextrin interaction Clin Chim Acta 199129-137 (1991)
(121) T Irie M Otagiri M Sunada K Uekama Y Ohtani Y Yamada and Y Sugiyama Cyclodextrin-induced hemolysis and shape changes of human erythrocytes in vitro J Pharmacobiodyn 5741-744 (1982)
(122) M E Brewster W R Anderson D Meinsma D Moreno A I Webb L Pablo K S Estes H Derendorf N Bodor R Sawchuk B Cheung and E Pop Intravenous and oral pharmacokinetic evaluation of a 2-hydroxypropyl-beta-cyclodextrin-based formulation of carbamazepine in the dog comparison with commercially available tablets and suspensions J Pharm Sci 86335-339 (1997)
(123) K Dietzel K S Estes M E Brewster N S Bodor and H Derendorf The use of 2-hydroxypropyl-beta-cyclodextrin as a vehicle for intravenous administration of dexamethasone in dogs Int J Pharm 59225-230 (1990)
(124) J Cummings G J Forrest D Cunningham N L Gilchrist and M Soukop Influence of polysorbate 80 (Tween 80) and etoposide (VP-16-213) on the pharmacokinetics and urinary excretion of adriamycin and its metabolites in cancer patients Cancer Chemother Pharmacol 1780-84 (1986)
(125) W J Loos S D Baker J Verweij J G Boonstra and A Sparreboom Clinical pharmacokinetics of unbound docetaxel role of polysorbate 80 and serum proteins Clin Pharmacol Ther 74364-371 (2003)
62
(126) O van Tellingen J H Beijnen J Verweij E J Scherrenburg W J Nooijen and A Sparreboom Rapid esterase-sensitive breakdown of polysorbate 80 and its impact on the plasma pharmacokinetics of docetaxel and metabolites in mice Clin Cancer Res 52918-2924 (1999)
(127) K Woodburn E Sykes and D Kessel Interactions of Solutol HS 15 and Cremophor EL with plasma lipoproteins Int J Biochem Cell Biol 27693-699 (1995)
(128) J M Grindel T Jaworski R M Emanuele and P Culbreth Pharmacokinetics of a novel surface-active agent purified poloxamer 188 in rat rabbit dog and man Biopharm Drug Dispos 2387-103 (2002)
(129) T W Guentert S Oie L Paalzow B M Frey R Brandt L J Aarons and M Rowland Interaction of mixed micelles formed from glycocholic acid and lecithin with the protein binding of various drugs Br J Clin Pharmacol 23569-577 (1987)
(130) P R Cullis A Chonn and S C Semple Interactions of liposomes and lipid-based carrier systems with blood proteins Relation to clearance behaviour in vivo Adv Drug Deliv Rev 323-17 (1998)
(131) P Opanasopit M Nishikawa and M Hashida Factors affecting drug and gene delivery effects of interaction with blood components Crit Rev Ther Drug Carrier Syst 19191-233 (2002)
(132) L Araujo R Lobenberg and J Kreuter Influence of the surfactant concentration on the body distribution of nanoparticles J Drug Target 6373-385 (1999)
(133) S Stolnik B Daudali A Arien J Whetstone C R Heald M C Garnett S S Davis and L Illum The effect of surface coverage and conformation of poly(ethylene oxide) (PEO) chains of poloxamer 407 on the biological fate of model colloidal drug carriers Biochim Biophys acta 1514261-279 (2001)
(134) J F Krzyzaniak D M Raymond and S H Yalkowsky Lysis of human red blood cells 2 Effect of contact time on cosolvent induced hemolysis Int J Pharm 152193-200 (1997)
(135) F Mottu M J Stelling D A Rufenacht and E Doelker Comparative hemolytic activity of undiluted organic water-miscible solvents for intravenous and intra-arterial injection PDA J Pharm Sci Technol 5516-23 (2001)
(136) E Soderlind M Wollbratt and C von Corswant The usefulness of sugar surfactants as solubilizing agents in parenteral formulations Int J Pharm 25261-71 (2003)
(137) B Nuijen M Bouma C Manada J M Jimeno A Bult and J H Beijnen In vitro hemolysis and buffer capacity studies with the novel marine anticancer agent kahalalide F and its reconstitution vehicle Cremophor ELethanol PDA J Pharm Sci Technol 55223-229 (200)
(138) R A Rajewski G Traiger J Bresnahan P Jaberaboansari V J Stella and D O Thompson Preliminary safety evaluation of parenterally administered sulfoalkyl ether beta-cyclodextrin derivatives J Pharm Sci 84927-932 (1995)
(139) T M Florence and J L Stauber Hemolysis of human erythrocytes by alpha-tocopheryl succinate J Nutrit Environ Med 8345-347 (1998)
(140) J Neuzil M Zhao G Ostermann M Sticha N Gellert C Weber J W Eaton and U T Brunk Alpha-tocopheryl succinate an agent with in vivo anti-tumour activity induces apoptosis by causing lysosomal instability Biochem J 362709-715 (2002)
(141) S H Wu and W K Hopkins Characteristics of d-a-tocopheryl PEG 1000 succinate for applications as an absorption enhancer in drug delivery systems Pharm Technol 2352-68 (1999)
(142) H W Frijlink J Visser N R Hefting R Oosting D K Meijer and C F Lerk The pharmacokinetics of beta-cyclodextrin and hydroxypropyl-beta-cyclodextrin in the rat Pharm Res 71248-1252 (1990)
(143) V J Stella and R A Rajewski Cyclodextrins their future in drug formulation and delivery Pharm Res 14556-567 (1997)
(144) In P K Gupta and G A Brazeau (eds) Injectable drug development techniques to reduce pain and irritation Interpharm Press Denver Colorado 1999
(145) B Davies and T Morris Physiological parameters in laboratory animals and humans Pharm Res 101093-1095 (1993)
63
References to internal reports of Novartis Pharma AG
(146) In vitro blood distribution and plasma protein binding of [3H]COM1 including stability in blood and plasma for rat and human PCS(EU) R0400014 Preclinical Safety Novartis Pharma AG Basel Switzerland 14-May-2004
(147) In vitro blood distribution and stability of [3H]COM2 for mouse rat and human PCS(EU) R0201077 Preclinical Safety Novartis Pharma AG Basel Switzerland 07-May-2003
(148) In vitro blood distribution plasma protein binding and stability in blood and plasma of [3H]COM3 for mouse rat dog cynomolgus monkey and human DMPK R0400595 Drug Metabolism and Pharmacokinetics Novartis Pharma AG Basel Switzerland 01-Feb-2005
(149) In vitro blood distribution and plasma protein binding of [14C]COM4 and stability in blood and plasma for rat ferret dog monkey and human PCS(EU) R0201539 Preclinical Safety Novartis Pharma AG Basel Switzerland 24-Sep-2003
(150) In vitro blood distribution plasma protein binding and stability in blood of [14C]COM5 for mouse rat dog and human PCS(EU) R0201107 Preclinical Safety Novartis Pharma AG Basel Switzerland 14-May-2003
(151) Absorption distribution and excretion of [14C]COM5 after single intravenous (1 mLkg) and oral (3 mgkg) administration to rat PCS(EU) R0201108 Preclinical Safety Novartis Pharma AG Basel Switzerland 19-May-2003
(152) ADME in rat after oral (08 mgkg) and intravenous (04 mgkg) administration of [14C]COM4 PCS(EU) R0201540 Preclinical Safety Novartis Pharma AG Basel Switzerland 19-Dec-2003
(153) Blood pharmacokinetics tissue distribution and excretion of [3H]COM2 in OF1 normal male mice and brain penetration of [3H]COM2 in APP23 transgenic and wild-type female mice after single intravenous (4 microgkg) administration PCS(EU) R0201082 Preclinical Safety Novartis Pharma AG Basel Switzerland 08-May-2003
64
8 Appendix
Raw data of COM1 in rat
In vitro blood distribution of [3H]COM1 using blood pools with different hematocrits
Total radioactivity concentration determined in blood and plasma
Excipient Nominal COM1 H Incubation Actual values
in blood time (pg-eqmL mean plusmnSD n=3) in blood (pgmL) (min) Blood Plasma
None 60 048 0 53 plusmn 1 76 plusmn 1 (Glu) 5 53 plusmn 1 75 plusmn 0 10 52 plusmn 1 74 plusmn 1 20 52 plusmn 0 74 plusmn 1 6000 0 5335 plusmn 80 7835 plusmn 121 5 5637 plusmn 116 7784 plusmn 103 10 5576 plusmn 40 7598 plusmn 114 20 5502 plusmn 76 7502 plusmn 98 HP-β-CyD 05 60 048 0 62 plusmn 1 97 plusmn 0 5 62 plusmn 1 96 plusmn 1 10 62 plusmn 1 94 plusmn 1 20 62 plusmn 0 93 plusmn 1 6000 0 6564 plusmn 21 10052 plusmn 31 5 6550 plusmn 30 10057 plusmn 214 10 6434 plusmn 85 9896 plusmn 66 20 6280 plusmn 213 9918 plusmn 80 5 60 045 0 64 plusmn 0 102 plusmn 1 5 65 plusmn 1 102 plusmn 1 10 63 plusmn 1 102 plusmn 1 20 64 plusmn 1 101 plusmn 1 6000 0 6516 plusmn 132 10660 plusmn 26 5 6598 plusmn 273 10762 plusmn 382 10 6475 plusmn 288 10454 plusmn 163 20 6653 plusmn 79 10482 plusmn 130 SHS 05 60 048 0 60 plusmn 2 86 plusmn 2 5 60 plusmn 0 94 plusmn 19 10 60 plusmn 1 81 plusmn 1 20 60 plusmn 0 81 plusmn 1 6000 0 6265 plusmn 40 8845 plusmn 102 5 6240 plusmn 92 8562 plusmn 44 10 6127 plusmn 110 8432 plusmn 35 20 6104 plusmn 112 8109 plusmn 122 5 60 045 0 59 plusmn 1 93 plusmn 1 5 58 plusmn 1 92 plusmn 0 10 56 plusmn 1 91 plusmn 1 20 58 plusmn 1 91 plusmn 1 6000 0 6166 plusmn 65 9908 plusmn 44 5 6180 plusmn 162 9607 plusmn 123 10 6230 plusmn 99 9529 plusmn 119 20 6189 plusmn 104 9489 plusmn 211
65
In vitro blood distribution of [3H]COM1 continued
Excipient Nominal COM1 H Incubation Actual values
in blood time (pg-eqmL mean plusmnSD n=3) in blood (pgmL) (min) Blood Plasma
TPGS 05 60 048 0 59 plusmn 1 92 plusmn 1 5 58 plusmn 1 90 plusmn 1 10 58 plusmn 1 88 plusmn 2 20 58 plusmn 0 87 plusmn 1 6000 0 5494 plusmn 102 8949 plusmn 87 5 5518 plusmn 124 8549 plusmn 165 10 5552 plusmn 74 8387 plusmn 101 20 5431 plusmn 23 8286 plusmn 71 5 60 040 0 50 plusmn 1 81 plusmn 1 5 50 plusmn 1 80 plusmn 1 10 50 plusmn 0 79 plusmn 1 20 50 plusmn 1 72 plusmn 1 6000 0 5042 plusmn 20 8175 plusmn 148 5 5014 plusmn 34 7907 plusmn 136 10 5102 plusmn 59 7952 plusmn 77 20 5069 plusmn 68 7204 plusmn 35 Triplicate analyses were conducted on one aliquot for each time point
In vitro protein binding of [3H]COM1 using the same plasma pool
Total radioactivity concentration determined in plasma and ultrafiltrate samples
Excipient Nominal COM1 Actual values (pg-eqmL) in plasma (pgmL) Plasma Ultrafiltrate None 60 65 26 (Glu) 26 26 6000 6302 270 268 272 TPGS 05 60 62 27 21 29 6000 5708 171 230 133 5 60 67 12 13 11 6000 5886 187 103 68 Mean of duplicate determination of plasma spiked with different COM1 stock solutions
66
Tissue and plasma levels of parent drug and total radioactivity after iv administration of [3H]COM1 (4 microgkg) in the control group
Time Tissue Individual concentration values
(h) COM1 (pgg) Radioactivity (pg-eqg) 008 Plasma 866 381 958 2529 1871 2052 Lung 2012 1440 1867 3431 2224 2538 Heart 2366 973 1619 2593 1490 1808 Liver 1069 384 724 11805 9501 10699 Kidney 2263 995 1692 6350 5770 5281 Fat 2803 1982 4753 2638 2213 4859 Muscle 1405 811 1234 1312 882 1172 Skin 433 225 296 937 524 583 Brain 6229 4525 4712 5431 4004 4053 025 Plasma 275 257 178 1719 1482 1366 Lung 399 607 518 1491 1378 1374 Heart 517 645 285 1034 1023 778 Liver 274 511 238 7904 6502 6920 Kidney 557 664 321 5270 5046 5425 Fat 6508 5897 4206 5953 5307 4112 Muscle 565 574 306 659 686 463 Skin 228 213 219 581 702 570 Brain 3407 4085 3014 3033 3552 2719 05 Plasma 179 103 101 1525 1442 1379 Lung 622 367 335 1365 1089 1030 Heart 310 211 214 684 684 661 Liver 138 71 100 7090 5263 4993 Kidney 345 220 202 4924 4585 5053 Fat 8008 4790 4248 6586 4071 3649 Muscle 270 159 166 409 349 342 Skin 199 64 104 559 449 480 Brain 2676 2419 2123 2310 2180 1953 pgmL and pg-eqmL
67
Tissue and plasma levels of parent drug and total radioactivity after iv administration of [3H]COM1 (4 microgkg) in the TPGS group
Time Tissue Individual concentration values
(h) COM1 (pgg) Radioactivity (pg-eqg) 008 Plasma 312 297 278 2842 2939 3006 Lung 1370 1173 1560 2364 2057 2272 Heart 1190 971 912 1584 1262 1291 Liver 449 234 337 10459 8898 10720 Kidney 1012 768 806 5047 4767 4829 Fat 2182 1485 1860 2712 2380 1703 Muscle 845 726 1132 880 720 1046 Skin 100 45 53 665 351 343 Brain 4072 2765 3083 3816 2353 2709 025 Plasma 89 107 121 2040 2440 2368 Lung 531 688 546 1343 1488 1356 Heart 351 471 454 737 864 851 Liver 104 205 170 5354 6770 5184 Kidney 321 435 446 6931 4972 6603 Fat 1352 3916 1578 1456 4764 2035 Muscle 355 649 588 532 789 675 Skin 71 72 37 563 518 342 Brain 1811 2327 1955 1648 2017 1841 05 Plasma 35 65 61 2027 2054 2186 Lung 214 195 319 1172 1067 1115 Heart 167 207 250 539 566 650 Liver 75 70 117 4225 4417 4314 Kidney 197 209 215 6923 6364 5600 Fat 3406 2067 2295 3071 1625 2734 Muscle 191 226 256 343 394 368 Skin 120 52 41 515 389 398 Brain 1516 1332 1541 1413 1295 1480 pgmL and pg-eqmL
Ex vivo protein binding of [3H]COM1 in the control and TPGS group
Parent drug concentration determined in plasma and ultrafiltrate
Dose Time Individual values (pgmL)
(microgkg) (h) Plasma Ultrafiltrate Control group 4 008 794 169 169 025 249 55 51 050 137 27 26 TPGS group 27 008 331 127 120 025 120 41 44 050 60 25 24 Mean of duplicate determination of plasma pooled for each time point
68
Raw data of COM2 in mouse
In vitro blood distribution of [3H]COM2 using blood pools with different hematocrits
Total radioactivity concentration determined in blood and plasma
Excipient Nominal COM2 H Incubation Actual values
in blood time (pg-eqmL mean plusmnSD n=3) (pgmL) (min) Blood Plasma
None 100 045 5 115 plusmn 2 85 plusmn 3 (Glu) 60 115 plusmn 5 93 plusmn 4 240 112 plusmn 6 101 plusmn 2 CELEtOH 6535 100 045 5 104 plusmn 5 86 plusmn 4 60 105 plusmn 2 83 plusmn 1 240 102 plusmn 1 87 plusmn 6 100rsquo000 046 5 103797 plusmn 1430 83684 plusmn 1446 60 102979 plusmn 1547 81784 plusmn 896 240 105912 plusmn 2594 80887 plusmn 998 HP-β-CyD 100 045 5 103 plusmn 5 88 plusmn 2 60 104 plusmn 5 94 plusmn 1 240 99 plusmn 2 94 plusmn 7 100rsquo000 043 5 105176 plusmn 1165 92396 plusmn 1519 60 104609 plusmn 1238 95791 plusmn 668 240 107331 plusmn 880 96454 plusmn 1780 SHS 100 045 5 101 plusmn 1 86 plusmn 1 60 99 plusmn 4 85 plusmn 1 240 105 plusmn 3 84 plusmn 3 100rsquo000 044 5 118080 plusmn 891 99140 plusmn 1915 60 116422 plusmn 2822 93052 plusmn 1190 240 116363 plusmn 890 89790 plusmn 1735 PEG 200 100 045 5 124 plusmn 4 96 plusmn 1 60 125 plusmn 6 95 plusmn 2 240 122 plusmn 2 103 plusmn 5 100rsquo000 046 5 112001 plusmn 3923 87146 plusmn 1273 60 112161 plusmn 1189 89801 plusmn 1646 240 110680 plusmn 652 90561 plusmn 1883 TPGS 100 045 5 101 plusmn 2 115 plusmn 2 60 104 plusmn 2 101 plusmn 1 240 101 plusmn 3 95 plusmn 3 100rsquo000 043 5 100911 plusmn 1443 106192 plusmn 992 60 100608 plusmn 3207 88758 plusmn 1037 240 100236 plusmn 4088 81755 plusmn 810 Triplicate analyses were conducted on one aliquot for each time point similar to previous study
In vitro protein binding of [
3H]COM2 at 10 ngmL using the same plasma pool
Parent drug concentration determined in plasma and ultracentrifugate
Excipient Actual values (pgmL) in plasma Plasma Ultracentrifugate None 9649 166 (plasma) 9278 164 9162 164 9292 164 TPGS 05 8624 116 8651 124 8722 103 8739 99
69
Tissue and plasma levels of parent drug and total radioactivity after iv administration of [3H]COM2 (04 microgkg) in the control group
Time Tissue Individual concentration values
(h) COM2 (pgg) Radioactivity (pg-eqg) 008 Plasma 110 112 91 181 194 164 Lung 1964 1955 1504 2450 2199 1704 Heart 796 830 623 1074 950 741 Liver 2398 2387 1778 3112 3022 2360 Kidney 2083 1871 1327 2276 2024 1511 Fat 140 327 230 58 540 603 Muscle 124 170 203 160 218 234 Skin 0 35 10 14 76 32 Brain 1155 1112 1018 1097 1086 1046 025 Plasma 94 71 77 164 141 139 Lung 1344 908 1365 1648 1849 1759 Heart 495 465 433 622 593 580 Liver 1579 1214 1549 2218 2161 2381 Kidney 1194 1075 1259 1468 1445 1518 Fat 714 459 778 1103 977 1218 Muscle 201 217 227 251 268 258 Skin 113 16 59 160 73 114 Brain 1060 1191 1345 1064 1150 1287 05 Plasma 60 58 58 119 113 111 Lung 720 703 842 1192 1444 1350 Heart 295 262 331 454 447 447 Liver 978 861 1040 1918 2348 2129 Kidney 757 753 932 1017 1303 1336 Fat 1014 602 973 1836 1164 2203 Muscle 187 167 189 242 252 231 Skin 87 16 18 97 129 104 Brain 1209 1006 1044 1160 1003 1044 1 Plasma 32 41 28 60 79 49 Lung 369 478 468 1465 1274 1171 Heart 154 199 205 347 377 364 Liver 591 618 534 2077 1736 1383 Kidney 471 522 451 1088 1020 846 Fat 496 444 713 1066 1458 1253 Muscle 103 80 91 171 169 146 Skin 0 38 48 138 123 122 Brain 673 832 688 826 902 806 pgmL and pg-eqmL value below LOQ
70
Tissue and plasma levels of parent drug and total radioactivity after iv administration of [3H]COM2 (04 microgkg) in the TPGS group
Time Tissue Individual concentration values
(h) COM2 (pgg) Radioactivity (pg-eqg) 008 Plasma 223 248 268 506 549 606 Lung 1789 1913 1880 2036 2137 2116 Heart 661 711 724 766 890 924 Liver 2331 2252 2360 2593 2585 2656 Kidney 1697 1831 1677 1815 2014 1839 Fat 246 150 317 362 366 740 Muscle 108 190 272 144 246 330 Skin 0 20 60 39 36 77 Brain 913 1069 1133 904 1024 1080 025 Plasma 178 148 151 403 377 394 Lung 1522 1175 1133 1820 1412 1436 Heart 489 478 452 593 597 578 Liver 1636 1743 1500 2243 2293 2130 Kidney 1112 1114 1256 1387 1415 1513 Fat 932 915 1480 1742 1392 2239 Muscle 237 222 183 290 288 283 Skin 23 0 38 144 140 96 Brain 1088 1244 1207 1004 1150 1166 05 Plasma 111 118 143 330 359 421 Lung 890 911 968 1292 1728 1599 Heart 292 385 384 420 630 570 Liver 1086 1200 1128 1901 2342 2002 Kidney 864 996 1103 1124 1584 1452 Fat 1393 ― 765 1492 ― 1576 Muscle 156 181 173 232 273 269 Skin 44 73 114 106 131 192 Brain 1048 1272 1325 1003 1298 1237 1 Plasma 79 97 63 333 296 264 Lung 669 885 512 1672 1588 1769 Heart 231 285 143 519 483 423 Liver 774 1028 798 2073 1946 2394 Kidney 726 835 659 1431 1342 1374 Fat ― 320 688 ― 1036 1712 Muscle 143 137 76 210 240 221 Skin 30 147 52 158 220 194 Brain 1141 1188 889 1204 1202 1070 pgmL and pg-eqmL value below LOQ no fat dissectible
71
Raw data of COM3 in rat
In vitro blood distribution of [3H]COM3 using the same blood pool (H 044)
Total radioactivity concentration determined in blood and plasma
Excipient Nominal COM3 Incubation Actual values
in blood time (ng-eqmL mean plusmnSD n=3) (ngmL) (min) Blood Plasma
None 5 5 46 plusmn 03 17 plusmn 0 (Glu) 30 46 plusmn 02 17 plusmn 01 60 47 plusmn 04 17 plusmn 01 500 5 511 plusmn 2 179 plusmn 0 30 507 plusmn 6 178 plusmn 2 60 512 plusmn 9 176 plusmn 2 CELEtOH 6535 5 5 49 plusmn 04 18 plusmn 01 30 49 plusmn 03 17 plusmn 0 60 51 plusmn 02 17 plusmn 0 500 5 516 plusmn 6 161 plusmn 2 30 508 plusmn 2 160 plusmn 1 60 508 plusmn 9 156 plusmn 1 HP-β-CyD 5 5 53 plusmn 02 35 plusmn 01 30 52 plusmn 04 35 plusmn 01 60 51 plusmn 0 36 plusmn 01 500 5 516 plusmn 5 324 plusmn 2 30 510 plusmn 2 320 plusmn 5 60 512 plusmn 4 326 plusmn 2 SHS 5 5 49 plusmn 02 14 plusmn 0 30 47 plusmn 01 15 plusmn 0 60 49 plusmn 03 16 plusmn 0 500 5 498 plusmn 10 143 plusmn 0 30 506 plusmn 14 143 plusmn 3 60 498 plusmn 1 144 plusmn 1 PEG 200 5 5 49 plusmn 04 17 plusmn 01 30 51 plusmn 01 17 plusmn 01 60 48 plusmn 01 18 plusmn 01 500 5 520 plusmn 7 169 plusmn 1 30 510 plusmn 9 170 plusmn 2 60 518 plusmn 6 176 plusmn 3 EtOHPEG200Glu 5 5 46 plusmn 03 18 plusmn 01 5590 30 43 plusmn 02 18 plusmn 01 60 44 plusmn 01 18 plusmn 01 500 5 535 plusmn 10 188 plusmn 1 30 535 plusmn 10 194 plusmn 2 60 538 plusmn 8 192 plusmn 1 TPGS 5 5 52 plusmn 03 23 plusmn 0 30 51 plusmn 0 22 plusmn 01 60 51 plusmn 0 24 plusmn 03 500 5 546 plusmn 3 231 plusmn 3 30 542 plusmn 6 231 plusmn 2 60 551 plusmn 5 231 plusmn 2 Triplicate analyses were conducted on one aliquot for each time point
72
In vitro protein binding of [3H]COM3 using the same plasma pool
Excipient Nominal COM3 Actual values
in plasma (ng-eqmL) (ngmL) Plasma Ultrafiltrate None 5 58 067 (Glu) 076 068 500 512 63 63 62 HP-β-CyD 5 54 22 21 22 500 538 214 216 209 EtOHPEG200Glu 5 5590 5 52 066 067 065 500 552 66 66 64 Mean of duplicate determination of plasma spiked with different COM3 stock solutions
Ex vivo protein binding of [3H]COM3 in the control and HP-β-CyD group
Parent drug concentration determined in plasma amp ultrafiltrate
Time Individual values (pgmL)
(h) Plasma Ultrafiltrate Control group 008 168 11 13 05 46 04 1 35 03 HP-β-CyD group 008 97 25 23 05 54 08 07 1 34 02 03 Mean of duplicate determination of plasma pooled for each time point
73
Circulation and tissue levels of parent drug and total radioactivity after iv administration of [3H]COM3 (03 mgkg) in the control group
Time Tissue Individual concentration values
(h) COM3 (ngg) Radioactivity (ng-eqg) 008 Blood 39 42 57 60 63 81 Plasma 15 19 19 38 40 41 Liver 1196 1394 1645 2097 2517 2767 Kidney 1760 1646 2019 2354 2286 2677 Fat 152 137 95 193 176 97 Heart 536 534 722 668 676 927 Lung 5712 5711 7113 8073 7897 9688 Muscle 152 112 105 161 112 98 Skin 209 139 85 216 136 86 Brain 1048 1062 1382 1323 1334 1736 05 Blood 20 13 18 75 85 83 Plasma 8 5 6 89 115 104 Liver 644 419 700 2619 2716 2654 Kidney 671 400 692 1162 843 1144 Fat 66 45 59 89 80 83 Heart 210 125 199 296 201 278 Lung 2425 1317 2267 3403 1811 2947 Muscle 222 98 144 282 144 185 Skin 103 81 99 131 119 164 Brain 1002 803 909 1260 996 1164 1 Blood 11 11 10 80 70 60 Plasma 4 5 4 105 99 74 Liver 383 427 373 1866 2152 2030 Kidney 345 405 320 707 758 659 Fat 30 31 33 49 52 53 Heart 106 126 102 161 188 157 Lung 1158 1092 1340 1680 1539 1817 Muscle 96 109 92 154 167 149 Skin 55 85 63 118 148 129 Brain 647 691 622 811 875 775 pgmL and pg-eqmL
74
Circulation and tissue levels of parent drug and total radioactivity after iv administration of [3H]COM3 (03 mgkg) in the HP-β-CyD group
Time Tissue Individual concentration values
(h) COM3 (ngg) Radioactivity (ng-eqg) 008 Blood 34 31 32 53 52 48 Plasma 12 10 10 29 32 28 Liver 850 1052 1271 1181 1665 1901 Kidney 1413 1330 1474 1770 1611 1778 Fat 68 85 103 70 99 121 Heart 592 500 598 719 593 725 Lung 4669 4377 4739 6069 5352 5939 Muscle 151 147 129 159 157 129 Skin 84 64 nd 66 49 nd Brain 954 990 908 1125 1165 1087 05 Blood 19 18 17 74 70 82 Plasma 6 6 6 77 75 96 Liver 617 558 677 2110 2107 2159 Kidney 524 417 496 743 652 810 Fat 47 39 51 59 51 68 Heart 212 178 169 276 233 222 Lung 2355 2513 2258 2931 3032 2853 Muscle 137 137 116 172 169 143 Skin 32 37 50 52 65 135 Brain 733 743 822 895 864 958 1 Blood 11 10 10 65 69 71 Plasma 4 3 4 77 87 92 Liver 344 nd 336 1765 nd 1597 Kidney 300 251 328 515 454 617 Fat 28 19 20 41 43 44 Heart 106 98 94 143 153 143 Lung 1257 926 976 1582 1205 1237 Muscle 98 98 59 133 161 84 Skin 29 27 23 49 110 68 Brain 606 604 588 734 726 697 pgmL and pg-eqmL not determined due to glas vial broken by homogenization
In situ bladder catheterization of [14
C]COM3 in the control and HP-β-CyD group
Time Urinary concentration Urine excreted
(h) COM3 (ngmL) Radioactivity (ng-eqmL) (g) Control 05 190 331 7226 13857 0685 0350 group 1 721 339 17998 12039 0460 0439 15 88 151 2855 7869 1130 0477 2 64 134 2435 9293 0790 0261 HP-β-CyD 05 1911 5216 4903 3523 13028 12248 2635 0851 0784 group 1 7900 524 2965 44618 5086 27031 0119 1068 0265 15 4209 899 1268 40724 18439 19080 0111 0188 0267 2 1993 184 597 31856 7994 11100 0124 0412 0335 Rat Ndeg3 died during in situ experiment
75
Raw data of COM4 in rat
In vitro blood distribution of [14
C]COM4 at 100 ngmL using the same blood pool (H 044) Total radioactivity concentration determined in blood and plasma
Excipient Incubation Actual values
time (ng-eqmL mean plusmnSD n=3) in blood (min) Blood Plasma None 05 5 98 plusmn 2 169 plusmn 0 (saline) 30 98 plusmn 1 167 plusmn 1 60 98 plusmn 2 168 plusmn 3 CEL 05 5 99 plusmn 0 147 plusmn 0 30 99 plusmn 2 135 plusmn 2 60 98 plusmn 1 128 plusmn 1 1 5 103 plusmn 1 139 plusmn 1 30 104 plusmn 0 125 plusmn 1 60 104 plusmn 2 120 plusmn 2 HP-β-CyD 05 5 125 plusmn 2 202 plusmn 1 30 125 plusmn 1 201 plusmn 3 60 124 plusmn 0 199 plusmn 3 1 5 116 plusmn 2 171 plusmn 3 30 117 plusmn 3 171 plusmn 2 60 117 plusmn 2 170 plusmn 3 SHS 05 5 110 plusmn 2 165 plusmn 2 30 110 plusmn 1 155 plusmn 1 60 110 plusmn 1 153 plusmn 3 1 5 112 plusmn 1 150 plusmn 2 30 112 plusmn 3 150 plusmn 1 60 112 plusmn 0 148 plusmn 2 Triplicate analyses were conducted on one aliquot for each time point
76
In vitro protein binding of [14
C]COM4 at 100 ngmL using the same plasma pool Total radioactivity concentration determined in plasma and ultrafiltrate
Excipient Actual values
(pg-eqmL) in plasma Plasma Ultrafiltrate None 97 25 (saline) 23 22 CEL 001 105 25 24 23 01 117 36 38 35 05 102 115 109 113 1 97 254 250 249 HP-β-CyD 001 99 27 25 24 01 102 43 47 43 05 134 131 133 131 1 112 172 151 150 SHS 001 99 25 22 22 01 101 34 31 33 05 116 115 111 112 1 112 171 174 167 PEG 200 100 22 24 24 TPGS 114 23 24 22 Mean of duplicate determination of plasma spiked with different COM4 stock solutions
77
Circulation and tissue levels of total radioactivity after iv administration of [14
C]COM4
Time Tissue Individual concentration values (ng-eqg)
(h) Control group CEL group 008 Blood 1258 1855 1551 1340 1515 1556 Plasma 2047 2761 2640 2211 2548 2517 Plasma water 123 50 49 287 477 478 Lung 659 815 737 754 763 788 Muscle 216 228 222 251 230 250 Skin 348 229 253 229 227 307 025 Blood 1306 1202 1069 1350 1183 1414 Plasma 2343 1983 1893 2357 1910 2273 Plasma water 92 99 83 118 179 201 Lung 697 657 608 737 651 741 Muscle 206 215 205 204 212 216 Skin 443 317 330 351 402 432 05 Blood 1398 1431 1303 1394 1112 1142 Plasma 2382 2543 2238 2357 1969 1926 Plasma water 63 124 46 106 151 191 Lung 710 731 644 720 666 641 Muscle 202 206 197 204 203 204 Skin 363 426 436 384 389 343 1 Blood 1322 1189 1233 1329 732 1301 Plasma 2297 1967 2049 2361 1192 2059 Plasma water 35 101 99 99 106 186 Lung 649 618 616 674 539 674 Muscle 218 200 217 187 212 191 Skin 424 381 421 425 340 407 ng-eqmL
78
Raw data of COM5
In vitro blood distribution of [14
C]COM5 using blood pools with the same H 044 Total radioactivity concentration determined in blood and plasma
Excipient Nominal COM5 Incubation Actual values
in blood time (ng-eqmL mean plusmnSD n=3) (ngmL) (min) Blood Plasma
None 10 5 73 plusmn 06 115 plusmn 02 (saline) 30 78 plusmn 02 118 plusmn 02 60 76 plusmn 07 118 plusmn 07 300 5 278 plusmn 2 386 plusmn 4 30 277 plusmn 0 391 plusmn 4 60 275 plusmn 7 384 plusmn 2 EtOH 10 5 98 plusmn 06 138 plusmn 05 30 98 plusmn 06 135 plusmn 05 60 92 plusmn 06 139 plusmn 01 300 5 286 plusmn 2 404 plusmn 3 30 287 plusmn 6 400 plusmn 4 60 284 plusmn 5 395 plusmn 3 CELEtOH 6535 10 5 88 plusmn 03 129 plusmn 06 30 91 plusmn 05 128 plusmn 03 60 92 plusmn 03 11 plusmn 03 120 98 plusmn 03 109 plusmn 03 1 5 257 plusmn 4 322 plusmn 3 30 259 plusmn 3 313 plusmn 5 60 255 plusmn 5 267 plusmn 2 120 281 plusmn 3 279 plusmn 1 HP-β-CyD 05 5 93 plusmn 05 143 plusmn 03 30 95 plusmn 03 139 plusmn 03 60 96 plusmn 02 141 plusmn 07 1 5 293 plusmn 1 412 plusmn 10 30 297 plusmn 6 414 plusmn 6 60 296 plusmn 6 405 plusmn 1 SHS 05 5 106 plusmn 04 125 plusmn 04 30 107 plusmn 04 108 plusmn 03 60 108 plusmn 05 112 plusmn 03 1 5 256 plusmn 1 257 plusmn 1 30 257 plusmn 2 247 plusmn 4 60 260 plusmn 3 230 plusmn 1 PEG 200 05 5 101 plusmn 03 141 plusmn 03 30 99 plusmn 08 145 plusmn 02 60 102 plusmn 03 142 plusmn 02 1 5 304 plusmn 7 402 plusmn 3 30 304 plusmn 8 413 plusmn 4 60 307 plusmn 2 410 plusmn 4 TPGS 05 5 88 plusmn 03 146 plusmn 04 30 91 plusmn 06 145 plusmn 03 60 89 plusmn 02 133 plusmn 03 1 5 308 plusmn 5 448 plusmn 3 30 312 plusmn 7 446 plusmn 7 60 311 plusmn 3 390 plusmn 22 Triplicate analyses were conducted on one aliquot for each time point
79
In vitro protein binding of [14
C]COM5 using the same plasma pool Total radioactivity concentration determined in plasma and ultrafiltrate
Excipient Nominal COM5 Actual values
in plasma (ng-eqmL) (ngmL) Plasma Ultrafiltrate None 10 86 13 (saline) 15 300 292 35 35 34 EtOH 10 108 13 12 300 295 35 35 34 CELEtOH 6535 10 104 25 24 21 300 269 65 64 63 SHS 10 107 30 29 31 300 268 76 74 73 Mean of duplicate determination of plasma spiked with different COM5 stock solutions
80
Circulation and tissue levels of total radioactivity after iv dosing of [14
C]COM5 (1 mgkg)
Time Tissue Individual concentration values (ng-eqg)
(h) Control group SHS group 008 Blood 1109 1450 1365 1694 2005 1859 Plasma 2009 3120 2647 2486 3010 2665 Muscle 355 458 387 555 426 448 Skin 275 224 245 296 207 219 Brain 24 29 28 41 38 41 025 Blood 712 873 1100 1519 1179 1033 Plasma 1508 1468 1777 2265 1813 1606 Muscle 262 341 330 423 445 404 Skin 229 242 259 456 441 342 Brain 14 16 18 29 27 21 05 Blood 642 409 792 1096 867 965 Plasma 1194 572 1275 1655 1455 1467 Muscle 244 199 241 342 341 315 Skin 252 198 256 397 382 374 Brain 11 7 11 22 15 18 1 Blood 172 192 219 688 603 464 Plasma 269 304 361 1055 919 727 Muscle 59 55 57 203 176 144 Skin 164 146 145 299 217 223 Brain 3 3 3 12 11 9 ng-eqmL value below LOQ
Ex vivo protein binding of [14
C]COM5 in the control and SHS group Total radioactivity concentration determined in plasma amp ultrafiltrate
Time Individual values (pg-eqmL)
(h) Plasma Ultrafiltrate Control group 008 2465 217 221 025 1587 123 126 05 1031 69 67 1 305 31 31 SHS group 008 2679 378 372 025 1914 245 05 1524 230 230 1 864 167 Mean of duplicate determination of plasma pooled for each time point
81
9 Acknowledgments
I would like to thank Prof Hans Leuenberger for giving me the opportunity to accomplish a PhD thesis at the University of Basel in collaboration with Novartis Ltd I would also like to thank my advisor PD Dr Georgios Imanidis for his guidance support and advice I would like to thank Dr Bruno Galli for acting as a co-examiner and co-referee for my PhD thesis I would like to thank Dr Gerhard Gross and his group for allowing me to conduct my dissertation research in their laboratories In particular I would like to thank Mr Armin Bruumllisauer and Dr Markus Weiss for helpful comments and discussions I am also thankful for Pierrette Guntz Heidi Huumlgli Marcel Fresneau and Albert Spielmann for not only assisting with my training and sharing laboratory space but for their friendships I would like to thank Dr Ernst Ulrich Koelle and Dr Michel Lemaire for their scientific advice and discussions concerning kinetics and suggestions throughout my dissertation project I would like to thank the Isotope Laboratories of Novartis for providing me with radiolabeled compounds Finally this research was made possible by financial support of Novartis Pharma AG Basel
82
10 Curriculum Vitae
Name Barbara Egger-Heigold Address Lettenweg 8 4102 Binningen
1975 Born on October 30th in Lucerne
1982-1988 Primary school in ReussbuumlhlLU 1988-1995 Matura Typus B Gymnasium ReussbuumlhlLU
1995-1996 1Propedeuticum in Medicines University of Basel 1997-2002 Studies in Pharmaceutical Sciences University of Basel 2002 Diploma thesis at Novartis Pharma AG Basel Thesis title The effect of excipients commonly used for drug
formulation on the in vitro rat blood distribution and protein-binding of SAB 378
2003-2005 PhD student University of Basel Laboratory work conducted at Novartis Pharma AG Basel During my PhD thesis I attended following lectures and courses given by the following lecturers Prof Dr H Leuenberger PD Dr GImanidis Prof Dr J Drewe Prof Dr J Seelig PD Dr H Heerklotz PD Dr A Seelig Dr S Rogers

3
121 Blood distribution method
The rate and extent of bloodplasma distribution of drugs is determined in vitro in spiked whole blood The experiments are performed under controlled physiological conditions (pH 74 37degC gently shaken) to reflect the in vivo situation over the entire clinically relevant concentration range of the drug Time samples are taken and centrifuged Subsequently drug concentrations in blood and plasma are determined to calculate the time required to reach equilibrium The extent of bloodplasma and blood cellplasma distribution derives from measured concentrations in blood and plasma and can be expressed with distribution parameters like FP BPR and BCPR BPR depends on the hematocrit of the whole blood used in the determination whereas BCPR is independent of the hematocrit value
122 Protein binding methods
Various methods are available for the determination of free drug concentration and protein-drug binding fraction in plasma (131415) including conventional separation methods summarized in Table 1-3 However the routinely used methods like ultrafiltration or equilibrium dialysis are limited in the case of lipophilic drugs due to their nonspecific adsorption to ultrafiltration device or to the dialysis membrane Along with a trend to more lipophilic compounds observed in the pharmaceutical industry in recent years (16) these adsorption problems are expected to increase As a result ongoing method modifications and new methods are needed to overcome these difficulties Overall the selection of the method of binding assay depends upon the aim of the study and the physicochemical properties of the particular test compound including its formulation
The ratio of bound and total drug concentrations in plasma expresses the degree of drug binding to plasma proteins and ranges between values of 0 and 1 Based on these values drugs can be classified into very highly bound (gt095) highly bound (gt090) poorly bound (lt09) and littlenot bound (lt02)
4
Table 1-3 Conventional methods for determination of plasma protein binding
Method Principle Advantages Disadvantages
Ultrafiltration
Ultracentrifugation
Gel filtration Adoptable for lipophilic drugs automatable binding differences detectable (eg affinity)
Complex handling time consuming
Time consuming expensive equipment false estimation of free fraction by physical phenomena (eg sedimentation back diffusion) protein contamination of free drug layer
Separation by size exclusion and affinity of column
Separation by centrifugation at high speed in absence of a membrane
No membrane effects natural environment no dilution problems adoptable for lipophilic and high MW drugs evaluation of lipoprotein binding
Equilibrium dialysis (reference method)
Sample dilution volume shifts Donnan effects nonspecific adsorption sieve effect time consuming unsuitable for unstable drugs
Separation by filtration through a semipermeable membrane with defined molecular weight cutoffs accelerated by centrifugation or positive pressure (N2 gas syringe)
Equilibrium establishment between two compartments separated by semipermeable membrane with defined molecular weight cutoffs
Physiological conditions universal binding method
Simply applicable short analysis time simple commercially available kits no volume shifts no dilution effects
Donnan effects nonspecific adsorption binding equilibrium changes during separation process small amount for analysis sieve effect
13 Characterization of drug candidates
Successful candidates in drug development must have proper physicochemical properties in addition to acceptable pharmacokinetics efficacy and safety profiles As a result a clear understanding of compound characteristics and their correlations are helpful to rank and sort out unsuitable compounds in drug research (1718)
131 Physicochemical properties
The chemical structure of a drug candidate is used in both predicting the pharmacology and selecting formulation strategies Table 1-4 shows physico-chemical parameters which are critical for in vivo drug action
The molecular weight (MW) indicates roughly the size of a chemical entity and is connected to its membrane permeability namely to the intestinal and brain penetration (1619)
LogP the octanol-water partition coefficient has been widely accepted as a measure of molecular lipophilicity Lipophilicity affects both the pharmacokinetic and pharmacodynamic behavior of drug molecules (2021) LogP considers the molecule in its neutral state (neutral substance or ionizable substance in its neutral form) whereas logD reflects the pH-dependent distribution coefficient consequently taking the ionization of molecules into account If logP and pKa of a compound are known logD can be calculated at any pH (21)
5
The aqueous solubility (LogS) is closely related to drug stability liberation and absorption by passive diffusion thereby playing a key role in its bioavailability (22) Causes for poor solubility are mainly excessive lipophilicity and crystal packing issue (23242526) The solubility of nonionic molecules is pH independent while molecules with ionizable groups show pH dependent solubility Acid drugs have higher solubility at pH higher than pKa and basic drugs at pH lower than pKa due to better solubility of ionic species as compared to the neutral species The acid-basic character accounts also for crossing the blood-brain barrier (27)
The polar surface area (PSA) of a molecule is a useful parameter for predicting drug transport properties PSA is the sum of the molecular surface (either van der Waals or solvent-accessible) that arises from polar atoms usually N O N-H and O-H atoms Some scientists also include sulphur and phosphor and attached hydrogens as polar atoms The PSA of a compound is also closely related to its hydrogen bond accepting and donating ability which can be responsible for interactions with active efflux pumps (2829) PSA has been shown to correlate well with blood-brain distribution (273031) intestinal absorption (323334353637) and oral bioavailability (38) of compounds
Table 1-4 Physicochemical parameters
Parameter Description Predictor Optimal value
MW Molecular weight Size Permeability lt 500lt 450 (BBP)
LogP lt 5
LogS Hydrophilicity gt 20 microgmL
pKa Acid-base character
PSA Polar surface area lt 140 Aringlt 80 Aring (BBP)
Negative logarithm of the acid-base dissociation constant
Acids gt4 and bases lt10 (BBP)
Permeability H-bonding capability
Logarithm of the octanol-water partition coefficient
Lipophilicity Permeability
Logarithm of the aqueous solubility
BBP blood brain penetration
132 Pharmacokinetic parameters
The pharmacokinetic profile is crucial for the clinical success of drug candidates and their development into marketable drugs Therefore today the contribution of pharmacokinetic investigations to the selection and optimization of promising drug candidates is well recognized The four most important parameters are clearance volume of distribution elimination half-life and bioavailability which is the fraction of drug absorbed as such into the systemic circulation (100 per definition for drugs given intravenously)
Drug clearance (CL) expresses the rate or efficiency of drug removal from the systemic circulation and is estimated as the ratio of dose to AUC following intravenous administration of the drug
AUC
DoseCL =
6
AUC is the total area under the curve that describes the concentration of drug in blood or plasma as a function of time AUC represents the drug exposure and is calculated by the trapezoidal rule
The volume of distribution (V0) relates the amount of drug in the body to the concentration of drug in the blood or plasma depending upon the fluid measured This volume does not necessarily refer to an identifiable physiological volume but merely to the fluid volume that would be required to contain all of the drug in the body at the same concentration as in the blood or plasma
o
iv
C
DoseV =0
C0 represents the blood or plasma concentration at time zero and is determined by extrapolation to zero time of the linear plot of concentration vs time in semilogarithmic scale
The half-life (t12) is the time it takes for the blood or plasma concentration or the amount of drug in the body to be reduced by 50
kkt
69302ln21 ==
where k is the elimination rate constant which can be calculated by the slope of the best-fit line to a semilogarithmic plot of the concentration over time The relationship of t12 to both clearance and volume of distribution is given by
V
CLk =
133 New trends in characterizing drug candidates
Before conducting clinical trials in humans preclinical testing is carried out to discover the pharmacology ADME (adsorption distribution metabolism and excretion) and toxicology of a new drug candidate (39) Appropriate pharmacokinetics and a good balance between drug efficacy and safety contribute mainly to an efficient and effective drug development However these factors are the major hurdles in development which primarily cause increased costs and failure rate of candidates Thus pharmaceutical industry needs new concepts able to speed and improve activities and decision-making in drug development (4041) In this context microdosing biomarkers and PET ligands can help to prioritize resources and optimize drug selection in development In many cases these approaches deal with compound concentrations ranging from sub-therapeutic to low pharmacological levels and thus information obtained from these techniques must reflect correctly the conditions at therapeutic doses including interactions with macromolecules like enzymes transporters and proteins In the end a successful integration requires a profound understanding of strengths and limitations of these new concepts
The administration of a low dosed (microdosed) drug candidate to humans was proposed to obtain human pharmacokinetic data before conducting Phase I trial (42) A microdose is one-hundredth of the proposed pharmacological dose determined from animal andor in vitro models or a dose up to 100 microg whichever is the smaller (43) Human microdosing uses labeled agents administered mostly intravenously and their fate in vivo is recorded by positron emission tomography combined with accelerator mass spectrometry or nuclear magnetic resonance (4344) With this new
7
strategy of microdosing drug information regarding human kinetics will be available along with preclinical data and can be useful for the acceptance or rejection of a candidate at an early stage
A biomarker is an indicator of a normal biological or pathophysiological process or a therapeutic response (45) Biomarkers help to select the most sensitive drugs in all phases of drug development (46) by providing data of pharmacological response dosing regimen and risk-benefit assessment Therefore efforts are moving rapidly forward to achieve strong predictive biomarkers which could be used for diagnostic and therapeutical purposes (47)
PET tracers labeled with short-lived radionuclides (eg 11C 18F 124I) are used as molecular probes of physiology and pathophysiology in animals and humans These labeled compounds are administered mostly intravenously at 600 MBq to humans which corresponds to 6-20 nmol (3-10 microg assuming a MW of 500) (48) To achieve the same imaging quality in animals roughly the same total amount of radiopharmaceutical must be given to animals as to a human subject (49)
14 Strategies and administration of intravenous formulations
In the pharmaceutical industry formulation scientists have faced growing challenges in recent years as a result of new drug candidates characterized as being more lipophilic hydrophobic and water-insoluble particularly candidates originated from leads associated with combinatorial chemistry and high-throughput screening (1624) In addition timelines and resources are very limited to develop an optimized formulation and thus the search for a suitable dosing vehicle intended for activities in preclinical research represents a challenging task for the formulators (50) Ideally it is best to select and use solubilizers that would maximize the solubility of the compound and could be applied for all preclinical settings Moreover the solubilizing agents should not influence the intrinsic pharmacokinetic characteristics of the compound being evaluated (except the interaction is well understood) which would lead to misinterpretation of the pharmacological response (51) Strategies for solubilization of intravenous drugs are summarized in Table 1-5 and well exemplified by the formulation approaches for the anticancer agent Paclitaxel (52)
Usually the first step is to check the solubility of the compound in an aqueous dosing vehicle at physiological pH and osmolarity If the target concentration cannot be achieved with this approach and the drug molecule is ionizable adjustment of the pH to non-physiological values can be suitable to increase water solubility (pKa must be sufficiently away from the formulation pH) Non-electrolytes are insensitive to pH modification The next approach most frequently tried is the addition of water-miscible organic solvents (cosolvents) and the use of surfactants or complexing agents To reach the required dose combination of these methods is often used Dispersal systems are other techniques but they may be difficult costly and time-consuming due to biological and technical complexity eg liposomes (53)
8
Table 1-5 Intravenous formulation approaches
Approach Examples Administered in commercial productsa Potential drawbacks
NaCl 09 (wv) pH 2-12 (bolus) pH 2-10 (infusion) PrecipitationGlucose 5 (wv) rarr preferred range pH 4-9 PainStrong acidsbases (HCl NaOH)Buffers (tartarte phosphate)
Cosolvents Propylene glycol le 68 (bolus) le 6 (infusion) Precipitation Ethanol le 20 (bolus) le 10 (infusion) IrritationPainPolyethylene glycol 300 le 50 (bolus) HemolysisPolyethylene glycol 400 le 9 (bolus) Impact on PK profile
Surfactants Cremophor EL le 10 (infusion) ditoTween 80 le 04 (bolus) le 2 (infusion)Solutol HS 15 50
Complexing agents Hydroxypropyl-β-cyclodextrin 20 (infusion) ditoDispersal systems Impact on PK profile
EmulsionbMicroemulsionc Water with 10-20 oil (fatty acids + lecithin + glycerol) Sustained releaseLiposomes Water with phospholipids (5-20 mgmL) + isotonicifier + buffer plusmn cholesterol Instability
Nanosuspensiond Water with stabilizer not yet marketede Slow dissolution
Aqueous solution at physiological osmolarity and pH or with pH adjustment
a(54) b(55) c(56) d(57) e(58)
For compounds administered intravenously to animals the dose volume viscosity
of injection material speed of injection and species are important factors to consider in addition to formulation properties including additives solubility and stability (Table 1-6) (59) A compound can be given over a short period of le1 min (bolus injection) 5-10 min (slow injection) and longer time period (intravenous infusion) Rapid injections require the dose to be compatible with blood and not too viscous and the rate of injection is suggested not to exceed 3 mLmin for rodents Depending on study objectives and compound solubility in an acceptable formulation a larger volume may be needed to be given to animals to accomplish requirements Regarding the formulation aqueous solutions or simple systems containing cosolvent surfactant or complexing agent are recommended for animal investigations at early stage in development due to easy handling and characterization For excipient selection consideration should be given for toxic and biological effects interferences with the drug compound and suitability for clinical use (Table 1-5) Injectable excipients preferred for dosing in animals are ethanol propylene glycol low molecular weight polyethylene glycols Cremophor EL Tween 80 and cyclodextrins
Table 1-6 Dose volumes and rates for intravenous administration(59)
Species Bolus injection Slow injection Infusion
Volume Rate Volume Rate Time Volume Rat
(mLkg) (mLmin) (mLkg) (mLmin) (h) (mLkgd) (mLkgh) Mouse 5 3 max 25 3 4
24 96 4 Rat 5 3 max 20 3 4 20 5 24 60 25
9
15 Effect of excipients on pharmacokinetic parameters in blood
Over the last years more attention has been paid to the extensive investigation of formulation vehicles as biologically and pharmacologically active compounds The main stages in which pharmaceutical excipients can interact and hence may modulate the properties of an administered drug-agent are transporter enzyme and distribution process in the systemic circulation (eg plasma protein binding) The effect of excipients on transporter activity has been studied intensively namely for P-glycoprotein (606162636465666768) multidrug resistance-associated protein (6970) and peptide transporter (71) It is interesting to say that particularly nonionic surfactants effectively inhibit transporters In contrast up to this day little is known about drug-excipient interactions at the level of cytochrome-mediated metabolism (63727374) and blood distribution (see below) The biological and pharmacological properties of excipients with a focus on the central blood compartment will be reviewed in the following paragraphs
151 Cremophor EL
The amphiphilic polyethoxylated castor oil derivative Cremophor EL (CEL) is one of the most frequently used surface-active formulation ingredients in parenteral dosage forms As early as 1977 lipoprotein alterations were observed in patients receiving miconazole therapy (75) which was caused only by CEL both in vitro and in vivo (767778) Extended studies revealed later on that CEL has a destructive effect on HDL resulting in a shift of the electrophoretic and density gradient HDL to LDL (79808182) Furthermore several hydrophobic anti-tumor agents tin etiopurpurin (8384) C8KC (85) and Taxol (8182) showed strong affinity for these lipoprotein dissociation products inducing changes in plasma protein binding potentially affecting pharmacokinetics
Various animal studies demonstrated (85868788899091110) that CEL modifies the pharmacokinetic behavior of drugs after intravenous administration like paclitaxel (Taxol) C8KC and cyclosporin The most common observation was a substantial increase in the area under the plasma concentration-time curve and in peak plasma concentration of studied agent with a reduction in the clearance as was first described for paclitaxel in a mouse model (91) The drug-CEL interactions were supposed to be caused not only by altered protein binding characteristics (82) but also by altered hepatobiliary secretion (92) and endogenous P-glycoprotein-mediated biliary excretion (93) However the very small volume of distribution of CEL approximately equal to the volume of the central blood compartment suggests that the observed interference occurs in the central blood compartment This hypothesis was confirmed by studies recently published (9495) The main finding was a profound alteration of cellular partitioning and bloodplasma concentration ratio of paclitaxel in a CEL concentration-dependent manner as a result of an entrapment of the compound into micelles formed by CEL (96) Consequently the free drug fraction available for distribution was reduced This effect was also observed in the absence of plasma proteins pointing at contributing factors other than altered protein binding and increased affinity of paclitaxel for CEL-induced lipoprotein degradation products (8182)
10
For the purpose of finding out a potential paclitaxel delivery vehicle with an ideal profile the investigation of several delivery vehicles based on the chemical structures of CEL and Tween 80 led to alteration of blood distribution of paclitaxel in presence of all tested vehicles (97) Different formulation approaches such as liposomes and poloxamer-micelles affected the pharmacokinetics of paclitaxel in mice as compared to the CEL-containing formulation (98) In contrast paclitaxel administered in a solvent-free formulation in a clinical study showed a higher efficacy combined with reduced adverse effects compared to the drug delivered in a solution of CEL (99)
Overall numerous investigations have shown that CEL can play a pivotal role in the pharmacological behavior of the formulated drugs In addition several drug-drug interactions are reported on agents administered intravenously in conjunction with CEL-containing formulation of other compounds namely paclitaxel (100101102103) cyclosporin (104105106107) and valspodar (108109) Most likely the presence of CEL in drug formulations contributes to the observed pharmacokinetic interactions Indeed recent experiments revealed a substantial increase of plasma concentrations of cyclosporin after an additional injection of another drug preparation containing CEL (110)
152 Cyclodextrins
Cyclodextrins are ring-shaped oligosaccharides with a hydrophilic exterior and a hydrophobic interior (111) The interior cavity is capable of forming water-soluble complexes with many drugs Due to the rapid release of a drug from the complex after administration in vivo it is assumed that drug-cyclodextrin complexes do not affect the drug pharmacokinetics (112) However if the drug is slowly or incompletely released from the complex drug dosing as complexes in cyclodextrin can be critical
The binding of drugs to plasma proteins was influenced in vitro in the presence of β-cyclodextrin (113) and hydroxypropyl-β-cyclodextrin (HP-β-CyD) (114115) The intravenous administration of flurbiprofen in HP-β-CyD led to transient higher tissue concentrations in rats (114) Alterations in tissue distribution were also found for other drugs injected as cyclodextrin complexes either free in solution (116117) or included into liposomes (118) Following iv dosing in HP-β-CyD a higher amount of carbamazepine appeared in the urine compared to oral preparations (122) A similar trend was observed in dogs treated iv with either dexamethasone formulated in HP-β-CyD or as its phosphate prodrug (123) In addition cyclodextrins interacts with endogenous lipids such as lipoproteins (119120) and cholesterol (113121)
153 Tween 80
As mentioned above for CEL lipoprotein alteration induced by Tween 80 was observed (80) However this effect was not confirmed in a further study (85) In patients receiving Tween 80 co-administered with etoposide an increase of the volume of distribution and the clearance of doxorubicin was detected due to reduced plasma concentrations of doxorubicin during the early phase of the concentration-time profile (124) Lately changes in the bloodplasma ratio of paclitaxel were described in the presence of Tween 80 and other solubilizers structurally related to Tween 80 (97) More recently it was shown that Tween 80 has a concentration-dependent influence on the normal binding of docetaxel to serum proteins leading to changes in pharmacokinetics of docetaxel in vivo (125) although Tween 80 is
11
degradated rapidly by esterases in plasma (126) The mechanistic basis for altered plasma binding of docetaxel in the presence of Tween 80 still needs to be clarified
154 Other excipients
To date little is reported in the literature about the impact of Solutol HS 15 and Poloxamer 188 on blood distribution of drugs An interference between Solutol HS 15 and the co-administered ketochlorin photosensitizer C8KC was suggested by Woodburn (127) The similar half-lives of Solutol HS 15 and the sensitizer found in mice indicate the correlation of the persistence of C8KC in plasma with that of the vehicle Further recent plasma protein binding interaction studies demonstrated an apparent increase in the unbound fraction of propranolol in combination with Poloxamer 188 (128) Also the administration of compounds formulated in mixed micelles can alter the protein binding (129) Most notably compounds binding with high affinity but low capacity to α1-acid glycoprotein showed free fractions increased by 50 to 85 Moreover blood protein interactions can occur with dosing vehicles like liposomes (130) thereby affecting maybe the fate of co-administered drugs in blood and body (131)
155 Nanoparticles
Methyl methacrylate nanoparticles of 130 nm in size suspended in different concentrations (01-5) of Tween 80 or poloxamine 908 exhibited prolonged circulation time with altered tissue concentrations as compared to uncoated nanoparticles (132) Extended blood circulation time was also found for polystyrene nanoparticels (40-137 nm) coated with poloxamer 407 (133)
12
16 Objectives and specific aims
The main purpose of this thesis was to investigate in vitro drug-excipient interactions in blood and to assess the implications of the in vitro findings both for the in vivo situation and the formulation strategy Compounds in drug development at Novartis were chosen as model substances and dosed at concentrations ranging from sub-therapeutic to low pharmacological levels Excipients commonly used in formulations were selected including CEL HP-β-CyD Solutol PEG 200 and TPGS The following specific aims of the thesis were 1 To collect and use available compound information including physicochemical
properties and pharmacokinetics to select appropriate model substances with as many different properties as possible
2 To determine the hemolytic activity of selected excipients to rule out any changes of blood distribution caused by hemolysis
3 To explore in vitro possible effects of selected excipients in the blood with special emphasis on the blood distribution and plasma protein binding of model compounds
4 To identify the pharmacokinetic profile and tissue distribution of model compounds following single intravenous dosing in the presence and absence of selected excipients
5 To compare and relate pharmacokinetic outcomes to the in vitro findings thereby assessing the impact of in vitro data for the in vivo situation and evaluating the in vitro-in vivo correlation
6 To generate criteria for optimizing delivery vehicle selection in drug research that allow reducing drug-excipient interactions and leading to more rational and selective drug formulations
7 To propose an intravenous formulation strategy based on the data generated by this research project to provide better candidate-tailored formulations in drug development
13
2 Selection and experimental procedure
21 Excipients and model compounds
Investigations involved five excipients along with five pharmacologically active compounds exhibiting different properties
The excipients CEL HP-β-CyD Solutol and PEG 200 were selected based upon their common use in intravenous formulations and their diversity of molecular structure and solubilization technique (Figure 2-1 and Table 2-1) CEL and Solutol are surface-active agents which increase the drug solubility by incorporation of the drug into a micellar structure Whereas CEL exhibit a highly variable composition with the major hydrophobic component (~87) identified as oxyethylated triglycerides of ricinoleic acid (Figure 2-1) Solutol consists of ~70 lipophilic polyglycol mono- and di-esters of 12-hydroxystearic acid and ~30 hydrophilic polyethylene glycol HP-β-CyD is a cyclic (α-14)-linked oligosaccharide containing seven α-D-gluco-pyranose units (Figure 2-1) which form a relatively hydrophobic central cavity and a hydrophilic outer surface The inclusion of a drug within the inner core of the complexing agent and the interaction of the outer core with water render the complex soluble PEG 200 is often used as a cosolvent for improving solubility of preclinical compounds by interrupting the hydrogen structure of water (eg water exclusion) and lowering the dielectric constant of the solution Although TPGS is exclusively known in oral formulations it was chosen due to its chemical structure (benzyl ring) and drug interaction potential at the level of active transporters and metabolizing enzyme systems
Cremophor EL
H2C(CH
2CH
2O)xOCO(CH
2)7CH CHCH
2CHOH(CH
2)5CH
3
HC(CH2CH
2O)yOCO(CH
2)7CH CHCHCH
2CHOH(CH
2)5CH
3
H2C(CH
2CH
2O)zOCO(CH
2)7CH CHCH
2CHOH(CH
2)5CH
3
primary constituent with x + y + z ~35
Solutol HS 15
CH3
(CH2)5
CH (CH2)10
C O CH2
CH2
OHn
OH O
Polyethylene glycol 200
O
HOH
n
Hydroxypropyl-β-cyclodextrin
O
ROCH2
O
ROOH
n
glucopyranose with R=CH2CH2OH or H and n=7
Vitamin E TPGS
O
O C CH2
CH2
C O
O O
CH3
CH3
OH n
CH3
CH3
CH (CH2)3
CH3
CH (CH2)3
CH(CH2)3
n=20-22
Figure 2-1 Chemical structures of selected excipients
14
Table 2-1 Properties of selected excipients
Excipient name Type Solubilization Use in iv Biological activity
approach formulation
Cremophor EL Non-ionic Micelles Yes bull Dyslipidaemia (polyoxyethylene surfactant (developmental bull Inhibition of active castor oil derivatives) amp commercial) transporters MW ~3000 CMC ge009 mgmL Hydroxypropyl-β- Oligomeric Complexation Yes bull Lipid interactions cyclodextrin substance (developmental MW ~1600 amp commercial) Solutol HS 15 Non-ionic Micelles Yes bull Dyslipidaemia (polyethyleneglycol 660 surfactant (developmental bull Inhibition of active 12-hydroxystearate) amp commercial) transporters MW 960 bull Inhibition of cyto- CMC ge02 mgmL chrome enzymes Polyethylene glycol 200 Oligomeric Cosolvent Yes MW ~200 substance (change of (developmental solution amp commercial) polarity) Vitamin E TPGS Non-ionic Micelles No bull Inhibition of active (D-α-tocopheryl surfactant (oral use transporters polyethylene glycol 1000 developmental bull Inhibition of cyto- succinate) amp commercial) chrome enzymes MW ~1513 CMC ge02 mgmL CMC Critical micelle concentration MW Molecular weight Higher molecular weight PEGs such as PEG 300 and 400
Drug candidates in development at Novartis were chosen as model compounds
regarding aqueous solubility lipophilicity membrane permeability and blood cellplasma distribution (Figure 2-2 and Table 2-2) COM2 and COM1 (base) are lipophilic and poorly water-soluble PET ligands which are used in sub-therapeutic doses and COM2 distributes equally between plasma and whole blood COM3 is much better water-soluble and is mainly located in the cellular fraction in blood In contrast COM4 with a low lipophilicity penetrates hardly into blood cells and distributes poorly into tissues COM5 is a bigger molecule characterized by a high polar surface area many H-bond acceptors and a very low volume of distribution similar to that obtained for COM4
COM1 COM2 COM3 COM4 COM5
N
N
O
R1
R2
O
N
O
N
N
S
R1
R2
N
O
N
R
NN
R2
R1
N
NO
S O
NH
O
O
NH
OR1
R2
R3
Figure 2-2 Chemical structures of model compounds
15
Table 2-2 Properties of model compounds
Physicochemical (PC) and pharmacokinetic (PK) data available at the time of selecting model compounds for investigating drug-excipient interactions in blood
COM1 COM2 COM3 COM4 COM5
PET ligand PET ligand NCE NCE NCE
PC properties MW (gmol) 240 410 295 lt400 533 LogD 68 34 45 23 17 37 pKa 38 57 41 87 32 46 106 H2O solubility pH 68 (mgL) 20 lt25 4000 lt500 100 PSA (Aring2) 35 50 25 63 166 H-bond acceptors 3 5 3 4 12 H-bond donors 0 0 0 1 3 PK properties Species Mouse Rat Rat Rat In vitro Fraction in plasma () 45 20 ~100 80 Free in plasma () 12 24 11 In vivo Matrix Blood Blood Plasma Plasma t12 (h) 11 11 10 04 CL (mLminkg) 10 142 04 72 Vss (Lkg) 14 10 03 03 funchanged () 49 14 98 94 Main selection criteria bull Active bull Active bull Blood bull Blood bull MW principle principle distribution distribution bull Polarity bull H2O sol bull H2O sol bull Vss bull Vss (base) bull Lipophilicity funchanged Fraction of unchanged drug based on AUC ratio of parent drug and total radioactivity LogD Logarithm of octanol-water distribution coefficient MW Molecular weight NCE New chemical entity pKa Negative logarithm of dissociation constant PSA Polar surface area CL Drug clearance t12 Main elimination half-life Vss Volume of distribution under steady-state conditions
22 Experimental setup
The effect of excipients on pharmacokinetic parameters was examined in rats except for COM2 which was investigated in mice due to available animal models appropriate to analyze drug target interactions if required Model compounds were used in their clinically relevant blood range as follows sub-therapeutic (lt5 ngmL) for COM1 and COM2 low-therapeutic (5-50 ngmL) for COM3 and therapeutic (gt50 ngmL) for COM4 and COM5 because of low distribution volumes to assure detectable tissue concentrations To allow in vitro and in vivo study comparisons the amount of excipient in blood was set at ~05 which is within the range after an iv bolus injection in mice and rats
Blood distribution and protein binding studies were done in vitro using model compounds in the appropriate concentration range with and without selected excipients fixed at 05 in the test system Since COM4 is almost completely located in the plasma fraction in blood (FP ~100) independent of the concentration (10-10rsquo000 ngmL) (149) the concentration of COM4 was kept constant (100 ngmL) whereas the excipient amount was varied between 001-1 Compounds formulated as excipient-free solution in glucose 5 or saline served as reference The excipient with the most prominent effect compared to the reference was selected for the in vivo
16
study where animals received intravenously a single dose as a control formulation or solution containing the selected excipient Control formulation were based on glucose 5 (COM1 COM3) saline (COM4 COM5) or blank plasma (COM2) To assure a fast and complete solubility of COM3 and COM5 in the control formulation convenient excipients were added with in vitro binding parameters similar to those obtained for the in vitro reference The concentration of model compounds in blood plasma and tissue were measured until 1 h after iv administration thereby including the scanning time of PET ligands Moreover it is assumed if excipient-induced changes occur they should be detectable in this time period
17
3 Materials and methods
31 Chemicals
COM1 and COM2 were supplied by the Neuroscience Research Department of Novartis (Basel Switzerland) COM3 was obtained from the Novartis Institutes for BioMedical Research (Basel Switzerland) 3H-radiolabeled COM1 (specific activity 11780 MBqmg gt99) COM2 (specific activity 2320 MBqmg gt98) and COM3 (base specific activity 311 MBqmg gt98) were provided by the Isotope Laboratories of Novartis (Basel Switzerland) 14C-radiolabeled COM3 used for investigation of renal excretion (2middotHCl salt specific activity 587 MBqmg gt98) COM4 (specific activity 585 MBqmg gt98) and COM5 (specific activity 33 MBqmg gt98) were provided by the Isotope Laboratories of Novartis (Basel Switzerland)
The excipients purchased by the Pharmaceutical and Analytical Development Department of Novartis (Basel Switzerland) were Cremophor EL (CEL BASF) hydroxypropyl-β-cyclodextrin (HP-β-CyD CERESTAR USA Inc) polyethylene glycol 200 (PEG 200 Fluka) Solutol HS 15 (Solutol BASF) and D-α-tocopheryl polyethylene glycol 1000 succinate (TPGS Eastman) All other chemicals and reagents were of analytical grade or will be described separately in the methods section
32 Blood and plasma sources
Fresh blood was obtained from healthy male species (nge3) as follows mice (albino OF1 Charles River Laboratories LrsquoArbresle France) rats (Wistar HAN IGS Charles River Laboratories Sulzfeld Germany) dogs (Marshall beagles Marshall Farm NY USA and Harlan France SARL Gannat France) and humans (drug-free blood donors Blutspendezentrum SRK Basel Switzerland) Pooled plasma (nge3) was defrosted from storage at -20degC Lithium heparin was used as an anticoagulant for all species
33 In vitro studies
Test compounds in the in vitro samples excluding protein binding samples of COM2 were quantified by LSC due to no major degradation (gt95) under investigated conditions (146147148149150) Protein binding samples of COM2 were quantified by LC-RID due to instability after longer incubation (gt2 h) and very low fraction unbound in plasma (lt2)
331 Preparation of test solutions
For in vitro blood distribution and protein binding studies test solutions were prepared by dissolving the radiolabeled test compound in ethanol Ethanol was evaporated and the residue was reconstituted in the appropriate formulation namely excipient-free solution as control (saline or glucose 5) and solutions containing CELEtOH 6535 (vv) CEL HP-β-CyD Solutol PEG 200 and TPGS Final compound concentrations in blood or plasma were 006-6 ngmL (COM1) 001-100 ngmL (COM2) 5-500 ngmL (COM3) 100 ngmL (COM4) and
18
10-300 ngmL (COM5) Excipient concentrations were kept constant at 05 in the test system except for COM1 (05-5 due to no alterations at 05) and COM4 (001-1 due to its plasma fraction see 22)
332 Hemolytic activity
The hemolytic activity of the excipients was assayed using a spectrophotometric method CELEtOH 6535 (vv) EtOH HP-β-CyD PEG 200 Solutol and TPGS were added to the appropriate volume of freshly prepared heparinised whole blood to obtain a final excipient concentration of 05 To avoid hemolysis due to higher concentrations during the adding the blood was partially centrifuged and the excipient was pipetted in the cell-free layer By tapping the test tubes the samples were immediately mixed Two control tubes were prepared one for spontaneous hemolysis (pure blood used as the reaction blank) and another for 100 hemolysis (total cell lysis induced by sodium dodecyl sulfate at a final blood concentration of 1) Samples were incubated at 37degC At certain points of time aliquots were removed and centrifuged for 10 min at 3100 x g (37degC) to obtain plasma The absorbance of hemoglobin in the supernatant (dilution with water 1200) was measured at 405 nm (Emax precision microplate reader Bucher Biotech Basel Switzerland) The degree of hemolysis due to the excipient activity was calculated according to
100()0100
0times
minus
minus
=
AA
AAHemoylsis e
where Ae is the absorbance of hemoglobin in the supernatant after incubation with excipient A0 is the absorbance of hemoglobin in the supernatant of the reaction blank and A100 is the absorbance of hemoglobin in the supernatant after total cell lysis with sodium dodecyl sulfate Hemolytic activity was considered to have started when mean values were greater than 2 of hemolysis
333 Blood distribution
Freshly prepared heparinised blood was used and experiments were performed in triplicate both in the presence and absence of excipients The hematocrit was determined using a hematocrit centrifuge and a hematocrit reader (Haemofuge Heraeus Sepatech Germany) In order to reduce hemolysis blood aliquots (1 mL) were partially centrifuged (500 x g for 2 min) before adding the test solution in the cell-free layer followed by mixing immediately Samples were incubated at 37degC Time aliquots (1 mL) were removed and prepared for measuring radioactivity of the test compound in whole blood before centrifugation and in plasma after centrifugation for 10 min at 3100 x g (37degC) by LSC
The fraction of the test compound in plasma (FP) was calculated according to
100)1(
() times
minustimes
=
B
P
PC
HCF
where CB and CP are the drug concentration in blood and plasma respectively and H is the hematocrit value The concentration in blood cells (CBC) was calculated as follows
19
H
HCCC PB
BC
)1( minustimesminus=
and used for calculations of blood cell to plasma concentration ratio (BCPR CBCCP) and blood cell to unbound in plasma concentration ratio (ρ CBC(CPfu)) fu is the drug fraction unbound in plasma determined by the appropriate protein binding method for each compound
334 Plasma protein binding
Control experiments in phosphate buffered saline (PBS Gibco Paisley Scotland) were carried out to assess the suitability of the methods described below for each test compound in the following order ultrafiltration gt dialysis gt ultracentrifugation with ultrafiltration being the first procedure Control experiments indicated that ultrafiltration is a suitable method for COM1 COM3 COM4 and COM5 (free-permeation gt075 recovery gt85) and ultracentrifugation for COM2 (no sedimentation after 6-h centrifugation recovery gt85 ultrafiltration and dialysis showed insufficient recovery and free-permeation) Therefore protein binding was determined by the ultrafiltration technique (COM1 COM3 COM4 and COM5) or the ultracentrifugation technique (COM2)
Ultrafiltration
Samples of spiked plasma were incubated at 37degC until binding equilibrium Aliquots of 1 mL were introduced in prewarmed (37degC) Centrifree micropartition tubes (Amicon Inc Beverly MA USA) and centrifuged for 10 min at 2000 x g (37degC) For the determination of the unbound drug fraction in plasma concentrations of the test compound in ultrafiltrate and plasma were measured The unbound fraction in plasma (fu) was calculated as follows fu()=(CUFCP)x100 where CUF and CP are the drug concentration in ultrafiltrate and in plasma respectively
Equilibrium dialysis
Test solution was added to plasma followed by mixing Dialysis was carried out with 150 microL of this sample against an equal volume of phosphate-buffered saline (pH 72) in a 96-well micro-equilibrium dialysis block (HTDialysis LLC Gales Ferry CT USA) Dialysis membranes with a 12000-14000 molecular weight cut-off were soaked in phosphate buffered saline (pH 72) before use After establishment of the equilibrium buffer solution aliquots containing only unbound drug and plasma aliquots containing both bound and unbound drug were analyzed for the test compound The ratio of drug concentrations measured in the buffer and plasma after dialysis was taken as an estimate of unbound drug fraction in plasma
Ultracentrifugation
Samples of spiked plasma were incubated at 37degC until binding equilibrium Aliquots of 1 mL were transferred to polycarbonate centrifuge tubes (Beckman) and either centrifuged in a TLA 1002 rotor in Beckman TL 100 centrifuge (200000 x g 6 h 37degC) or incubated for 6 h (37degC) After centrifugation samples were separated into three layers according to density A 80-microL aliquot of the middle layer (protein-free partplasma water) was taken and analyzed for the test compound representing the unbound concentration in plasma (CU) Total plasma concentration (CP) was
20
determined in incubated samples The unbound drug fraction in plasma was calculated using CUCP
Determination of major binding protein
The affinity of test compounds to different plasma proteins was determined using the appropriate method for each compound Purified human plasma proteins were dissolved in phosphate buffered saline (PBS Gibco Paisley Scotland) at physiological concentrations as follows albumin 40 gL (ge96 Sigma) α-acid glycoprotein 1 gL (from Cohn Fraction VI 99 Sigma) γ-globulins 12 gL (from Cohn Fraction II and III Sigma) high density lipoprotein 39 gL (gt95 Calbiochem) low density lipoprotein 36 gL (gt95 Calbiochem) and very low density lipoprotein 13 gL (gt95 Calbiochem) Test solution was added to protein solutions to obtain a compound concentration of 10 ngmL (COM1 COM2) or 1000 ngmL (COM3 COM4 COM5) After incubation at 37degC separation of bound and unbound compound was achieved according methods Ultrafiltration was performed by centrifugation for 10 min for samples containing albumin and γ-globulins and for 2 min for all other samples
335 Determination of protein concentration
Protein concentration was measured by the method of Bradford (Coomassie blue protein assay) at 595 nm by using a Bio-Rad protein assay (Bio-Rad Laboratories Muumlnchen Germany) The protein concentration was determined by using a calibration curve that was established with known concentrations of human serum albumin (ge96 Sigma) ranging from 0 to 05 mgmL 10-microL aliquots of plasma (1200 dilution) and plasma water were pipetted into microtiter plate wells 200 microL dye reagent were added and samples were mixed After 1-h incubation at room temperature absorbance was measured
34 In vivo studies
Samples collected after intravenous administration of COM1 COM2 and COM3 were assayed for radioactivity by LSC and parent drug by LC-RID COM4 and COM5 were quantified in all in vivo samples only by radioactivity measurements (LSC) since the radioactivity of both radiolabeled compounds reflects well the parent drug due to no major degradation at 1 h after intravenous administration in rats (151152)
341 Experimental animals
Male Wistar rats (~250 g) and male OF1 mice (~30 g) were obtained from Charles River (Sulzfeld Germany) All animals were housed in standard cages in a controlled environment maintained on an automatic 12-h lighting cycle at a temperature of 22degC according to institutional guidelines The animals were given a standard chow and water ad libitum The animals were used after having been starved overnight
342 Drug administration and sample collection
All dosing solutions were prepared within 1 h prior to injection and stored at room temperature until use Administration was performed by a single bolus injection into the femoral vein after animals had been lightly anesthetized by isoflurane (Forenereg) Rats received [3H]COM1 at 4 microgkg as solution (1 mLkg) in glucose 5 containing
21
ethanol 1 (vv) or TPGS 20 (wv) Mice were injected a dose of 400 ngkg of [3H]COM2 formulated as solution (5 mLkg) in blank plasma (obtained by centrifugation of freshly drawn mouse blood) or in glucose 5 containing TPGS 10 (wv) An iv dose of 1 micromolkg radiolabeled COM3 (3H 300 microgkg 14C 370 microgkg) in EtOHPEG200Glu 5590 (vvv) or 40 HP-β-CyD (wv) was injected to rats (1 mLkg) [14C]COM4 was administered at 400 microgkg in saline or 17 CEL (vv) to rats (2 mLkg) [14C]COM5 at 1 mgkg in saline containing either ethanol 10 (vv) or 17 Solutol (wv) were injected to rats (2 mLkg)
Using these injection preparations excipient concentrations in blood may be estimated as about 03 (COM1) 05 (COM3 COM4 COM5) and 07 (COM2) in animals (~70 mL bloodkg) These concentrations were similar to those used in the in vitro experiments
Samples were collected after drug administration at 008 025 and 05 h for COM1 and at 008 025 05 and 1 h for COM2 COM3 COM4 and COM5 Animals (n=3 per time point) were sacrificed by isoflurane inhalation for sample collection Blood samples were collected from the vena cava and transferred into tubes containing heparin (heparin-Na BBraun) as anticoagulant Plasma samples were obtained by immediate centrifugation of blood samples at 3000 x g for 10 min Tissues were excised blotted dry and weighed Collected tissue comprised lung heart liver kidney fat muscle skin and brain for COM1 COM2 COM3 and lung muscle and skin for COM4 and brain muscle and skin for COM5 All samples were immediately frozen and stored at -20degC until analysis Tissue samples were homogenized before quantification
343 Bladder catheterization and urine collection
The experiment was performed in situ under anesthetized rats Animals (n=3formulation) received im injections of ketamine hydrochloride at a dose of 50 mgkg (100 mgmL 05 mLkg) and are positioned on an isothermal heating pad prewarmed at 38degC The abdomen was opened through a mid-line incision A polyethylene tubing (Clay-Adams PE-50) was inserted into the dome of the bladder and held in place with a purse string suture The formulation was injected into the surgically exposed femoral vein and urine was collected at 05 1 15 and 2 h after dosing All samples were frozen and stored at -20degC until analysis
344 Ex vivo protein binding
Ex vivo protein binding was determined for COM1 COM3 COM4 and COM5 according to the in vitro procedure Briefly remaining plasma samples of each time point were pooled and the unbound drug concentration in plasma was quantified using the ultrafiltration technique (see 334) After centrifugation plasma and ultrafiltrate samples were assayed for radioactivity by LSC and parent drug by LC-RID
35 Measurement of the radioactivity
Aliquots of blood plasma urine (25-50 microL) and homogenates (250 microL) were introduced into counting vials and solubilized in Biolute-S (Zinsser Analytic) Samples obtained from in vivo studies containing tritium-labeled drug were dried and the residue was reconstituted in water before solubilization To the blood samples
22
hydrogen peroxide 30 was additionally added and vials were gently swirled for several seconds and let stand for 30 min After adjusting pH gt7 by addition of hydrochloric acid 2 N the vials were filled with scintillation cocktail (Irgasafe Plus Zinsser Analytic) kept in the dark for 16 h and measured in a Tri-Carb liquid scintillation spectrometer Model A2200 (Packard)
36 Determination of parent drug 3H-radiolabeled COM1 COM2 and COM3 were determined by a liquid
chromatography-reverse isotope dilution method (LC-RID) A sample aliquot (100-500 microL) and 200 microL water containing 5 microg (COM1 COM3) or 2 microg (COM2) non-radiolabeled test compound as internal standard was added to a glass tube After further addition of 1 mL water 100 microL Titrisol buffer (pH 4 COM1 COM2 pH 7 COM3) and 4 mL diethyl ether (COM1 COM2) or tert-butylmethylether (COM3) tubes were shaken for 30 min and centrifuged (3300 x g for 10 min) The organic layer was collected in another glass tube and evaporated in a vacuum centrifuge (Univapo 150H UniEquip Martinsried Germany) The residue was taken up in 250 microL of mobile phase-water (8020 vv) and 75 microL n-hexane and the mixture was transferred in an auto sampler glass vial After centrifugation (13000 x g for 2 min) the hexane layer was discarded and 200 microL of the remainder was injected into the HPLC system equipped with a Supelcosil LC-18 column (5 microm 46 mm x 150 mm) for COM1 or Waters XTerra RP 8 column (5 microm 39 x 150 mm) for COM2 and COM3 The column temperature was 40degC and the absorbance was detected at a wavelength of 312 nm (COM1) 441 nm (COM2) or 261 nm (COM3) The mobile phase (isocratic gradient) consisted of ammonium acetate 10 mM-acetonitrile (4555 COM1 5050 COM2) or ammonium acetate 10 mM-triethylamine 01 in acetonitrile (5842 COM3) and was pumped at a rate of 10 mLmin The peak corresponding to the unchanged compound was collected in a polyethylene vial by a fraction collector (Pharmacia LKB SuperFrac) and analyzed for radioactivity Concentrations of the test compound in samples were calculated from the ratio of the amount of radioactivity in the eluted fraction and the area of the absorbance of the non-radiolabeled test compound used as internal standard
37 Data analysis
Total radioactivity concentrations expressed as ng-eqmL or ng-eqg were estimated by dividing the radioactivity concentration in samples by the specific radioactivity of administered test compound using Microsoft Excel Concentrations of parent drug were determined by the principle of reverse isotope dilution using following equation in Microsoft Excel
ID
AD
IS
AS
A
A
A
A=
where AAS is the amount of analyte in the sample (unknown to be determined) AIS is the amount of internal standard added to the sample AAD is the amount of analyte detected and AID is the amount of internal standard detected AAD was calculated using R(SRxS) where R is the amount of radioactivity determined in the peak fraction SR is the specific radioactivity and S is the slope The amount of internal standard detected was calculated as AID=AreaRF-AAD where RF is the response factor (Areang) The level of quantification (LOQ) was set to 75 dpm LOQs of
23
radioactivity and test compound in blood plasma urine and tissues were calculated by dividing 75 dpm by the specific radioactivity of the administered test compound and by the sample amount P values were calculated with a two-sample t-test in Microsoft Excel assuming unequal variances The level of significance was set at P lt005
38 Pharmacokinetic analysis
Pharmacokinetic parameters were estimated as follows The area under the drug concentration-time curve (AUC) was determined by the linear trapezoidal rule using the mean data points The half-life (t12) was calculated using ln2k where k is the rate constant k was estimated by the slope of the regression line plotted through the three final data points of the semilogarithmic AUC taking into consideration a square of correlation coefficient of RSQ gt090 Volume of distribution (V0) was calculated by dividing the dose by the concentration at time zero (C0) C0 was obtained by extrapolation to zero time of the concentration-time plot in semilogarithmic scale
24
4 Results and discussions
41 Hemolytic activity of excipients
In vitro results
CELEtOH 6535 EtOH HP-β-CyD PEG 200 and Solutol did not induce hemolysis in dog and human blood at 05 and a contact time of 4 h (data not shown) In contrast TPGS at 05 incubated with blood of various species caused hemolysis in a time-dependent manner (Figure 4-1) Erythrocytes from rat and human were more sensitive than those of mouse and dog indicated by cell lysis at shorter contact times Reducing the TPGS concentration from 05 to 01 induced no hemolysis in all four species in the investigated time range (data not shown)
010
2030
4050
6070
1 h 2 h 4 h 6 h
Incubation time
Hem
oly
sis
(
)
Rat
Mouse
Dog
Human
Figure 4-1 Effect of incubation time on the hemolytic activity of TPGS
Induced hemolysis by 05 TPGS in blood of various species (n=3 mean plusmn SD) Hemolysis in rat blood after 6-h incubation was not determined
Discussion
Except for TPGS all tested excipients (CEL EtOH HP-β-CyD Solutol and PEG 200) were non-hemolytic which is consistent with data reported in the literature (134135136137138) and the fact that they are widely used in commercially available parenteralia (54) TPGS at 05 exhibited marked hemolysis after longer contact time (gt1 h) whereas TPGS at 01 showed no hemolysis under equal incubation conditions The detected hemolysis might possibly result not mainly from TPGS but from metabolites namely α-tocopheryl succinate and polyethylene glycols both being able to destruct erythrocytes (134139140) This phenomena could contribute to the extensively delayed onset of hemolysis For the investigations TPGS at 05 was used in the non-hemolytic time range
25
42 Impact of the hematocrit on blood partition parameters
In vitro results
Whole blood derived from three species was incubated with COM2 (100 ngmL) at varying hematocrit values Concentrations of COM2 in blood and plasma were measured at equilibrium and partition parameters calculated from these data are summarized in Table 4-1 Concentrations in blood plasma and blood cells remained unaffected by the hematocrit value (040-060) The partition parameter BPR was also similar over the investigated hematocrit range whereas BCPR changed slightly and FP distinctly both decreasing by increasing the hematocrit from 040 to 060
Table 4-1 Effect of hematocrit on the in vitro blood distribution of COM2
Blood cell concentrations and partition parameters (FP BPR and BCPR) derived from [3H]COM2 concentrations measured in blood and plasma using same blood pools at different hematocrit values (n=3 mean plusmn SD)
Species Hematocrit Concentration (ngmL) FP BPR BCPR
Blood Plasma Blood cells () Mouse 040 50 plusmn 1 121 plusmn 003 152 plusmn 007 045 46 plusmn 2 120 plusmn 006 144 plusmn 013 050 101 plusmn 3 87 plusmn 4 116 plusmn 8 43 plusmn 0 116 plusmn 001 132 plusmn 001 055 40 plusmn 1 113 plusmn 004 123 plusmn 006 060 36 plusmn 1 112 plusmn 003 119 plusmn 005 Dog 040 48 plusmn 2 126 plusmn 006 166 plusmn 014 045 44 plusmn 1 125 plusmn 004 157 plusmn 009 050 109 plusmn 4 90 plusmn 2 131 plusmn 15 41 plusmn 1 125 plusmn 003 151 plusmn 005 055 38 plusmn 1 119 plusmn 003 135 plusmn 006 060 35 plusmn 1 113 plusmn 002 122 plusmn 003 Human 040 70 plusmn 3 086 plusmn 003 066 plusmn 008 045 65 plusmn 2 084 plusmn 003 065 plusmn 007 050 101 plusmn 5 125 plusmn 10 78 plusmn 6 63 plusmn 2 080 plusmn 003 060 plusmn 006 055 55 plusmn 2 082 plusmn 003 068 plusmn 006 060 55 plusmn 1 073 plusmn 002 055 plusmn 003
Discussion
The in vitro method for investigating distribution of drugs in blood commonly uses whole blood freshly prepared and pooled Drug concentrations in blood and plasma are determined Based on these data further partition parameters including CBC FP BPR and BCPR can be estimated but they are partially dependent on the hematocrit Therefore it is important to know how the hematocrit affects these parameters thereby providing useful information for comparing results With this in mind present experiments were performed over the entire physiological hematocrit range in blood pools of three different species (mouse dog and human) COM2 was used as test compound due to sufficient availability
The rank order of hematocrit influences was FP gt BCPR gt BPR gt CB asymp CP asymp CBC with most pronounced changes for FP and none for CBCPCBC Parameters calculated from concentrations measured in samples decreased constantly with increasing the hematocrit (040-060) which was most distinct for FP But within a hematocrit variation of 005 none of the parameters was dependent on the
26
hematocrit Consequently blood partition data obtained from in vitro experiments with similar hematocrits are consistent and can be compared together For data comparison across studies hematocrit adjusting to values of previous studies is suggested taking into consideration a difference of le005 between the lowest and highest value
43 Major binding proteins of model compounds
In vitro results
Figure 4-2 illustrates the qualitative binding of model compounds to isolated proteins compared to the total fraction bound in plasma The following ranking was obtained with regard to decreasing order of protein binding
COM1 albumin gt α1-acid glycoprotein gt γ-globulins asymp lipoproteins COM2 albumin gt lipoproteins gt γ-globulins gtgt α1-acid glycoprotein COM3 α1-acid glycoprotein gt albumin gt γ-globulins gtgt lipoproteins COM4 albumin gt α1-acid glycoprotein gtgt γ-globulins asymp lipoproteins COM5 albumin asymp α1-acid glycoprotein gtgt γ-globulins asymp lipoproteins
0
10
20
30
40
50
60
70
80
90
100
COM1 COM2 COM3 COM4 COM5
Bo
un
d f
racti
on
(
)
Plasma Albumin AGP γ-globulins HDL LDL VLDL
Figure 4-2 Qualitative differences in protein binding patterns of model compounds in vitro
Total protein-bound fraction of compounds in human plasma compared to the qualitative extent of compound binding to various isolated human proteins (albumin AGP γ-globulins and lipoproteins such as HDL LDL and VLDL) Each bar represents mean plusmn SD (n=3)
Discussion
In vitro experiments showed the binding of model compounds with different degrees to the three major drug-binding proteins in plasma (albumin α1-acid glycoprotein lipoproteins) A high binding to albumin (A) and α1-acid glycoprotein (AGP) was found for COM1 and COM4 (AgtAGP) COM5 (AasympAGP) and COM3 (AltAGP) In contrast COM2 was highly bound to albumin and lipoproteins
27
44 The impact of Vitamin E TPGS on COM1 in rat
In vitro results
The equilibrium of COM1 between plasma and blood cells was reached within few minutes (lt5 min data not shown) and the fraction of COM1 distributed in plasma (~75) was independent of initial blood concentrations of COM1 (006-6 ngmL) and of excipients at 05 (Table 4-2) Enhancing the excipient concentration to 5 in blood resulted in decreased COM1 in blood cells especially in the presence of TPGS (Table 4-2) In plasma COM1 was highly protein bound with high contribution of albumin and α1-acid glycoprotein in binding (Figure 4-2) and a lower free fraction was found for COM1 in TPGS at 5 (Table 4-2) TPGS was taken for the in vivo study due to the most pronounced changes observed in the in vitro experiments
Table 4-2 Effect of excipients on blood distribution and protein binding of COM1 in vitro
Partition parameters of [3H]COM1 at 006-6 ngmL obtained at equilibrium after incubation with and without excipients in rat blood (pH 74 H 046 plusmn 003 n ge3 mean plusmn SD)
Excipient FP BPR BCPR fu ρ
() () ()
None 728 plusmn 22 071 plusmn 002 041 plusmn 004 41 plusmn 02 99 plusmn 1 HP-β-CyD 05 798 plusmn 17 065 plusmn 001 027 plusmn 002 nd nd 5 882 plusmn 24 063 plusmn 002 017 plusmn 004 nd nd Solutol 05 702 plusmn 24 073 plusmn 001 043 plusmn 001 nd nd 5 878 plusmn 23 064 plusmn 001 018 plusmn 002 nd nd TPGS 05 802 plusmn 24 064 plusmn 001 026 plusmn 001 39 plusmn 07 66 plusmn 03 5 956 plusmn 20 063 plusmn 001 008 plusmn 003 17 plusmn 03 53 plusmn 15
In vivo results
In contrast to the control group where a dose of 4 microgkg was applied COM1 was administered in the TPGS group at 27 microgkg due to little compound availability Data presented within this section are normalized to a dose of 1 microgkg
Independent of the formulation plasma levels declined very rapidly with an apparent half-life of 017 h and COM1 was rapidly metabolized (lt30 unchanged COM1 in plasma at 008 h post-dose) Metabolites were fast eliminated from body indicated by a low recovery of administered COM1 shortly after dosing (lt30 of administered dose recovered at 008 h post-dose)
Upon intravenous administration of COM1 as a TPGS-containing solution lower total plasma concentrations combined with an increase of COM1 unbound in plasma by 50 were found in contrast to the control group (Table 4-3 Figure 4-3) However free drug concentrations in plasma did not differ between both groups resulting in similar AUCs (Table 4-3) This is in line with identical tissue concentrations observed in both groups (data not shown) since only the unbound drug is supposed to pass across membranes Furthermore COM1 in TPGS led to a lower fraction of parent drug in plasma (funchanged Table 4-3) and higher metabolite-related concentrations in plasma (2-fold increase Figure 4-3) indicating alterations in the kinetic profile of metabolites
28
Table 4-3 Comparative plasma kinetics of COM1 with and without TPGS
Plasma concentrations and pharmacokinetic parameters of [3H]COM1 administered intravenously in formulations based on glucose 5 (control) or TPGS 20 to rats (LOQ=2 pgmL n=3 mean plusmn SD) Data are normalized to a dose of 1 microgkg AUC(u)008-05h relates to area under unbound drug plasma concentration-time curve
Time Control TPGS
(h) COM1 in plasma (pgmL) Percentage of control value
008 184 plusmn 77 110 plusmn 6 60 025 59 plusmn 13 39 plusmn 6 66 05 32 plusmn 11 20 plusmn 6 62 C0 (pgmL) 215 132 AUC008-05h (pgmiddotmL
-1middoth) 32 20
AUC(u)008-05h (pgmiddotmL-1
middoth) 067 076 t12 (h) 017 017 funchanged () 187 55 fu () 21 plusmn 01 38 plusmn 03
Parent drug Metabolites
10
100
1000
0 025 05
Time (h)
CO
M1
(p
gm
L)
100
1000
10000
0 025 05
Time (h)
Rad
ioacti
vit
y (
pg
-eq
mL
)
Figure 4-3 Influence of TPGS on the systemic exposure of COM1 and metabolites
Plasma concentration-time profiles of parent drug and metabolite-related radioactivity of [3H]COM1 after intravenous administration to rats COM1 was injected in glucose 5 (closed symbols black line) or TPGS 20 (open symbols dashed line) Data shown are normalized to a dose of 1 microgkg and symbols represent single values and lines mean values (n=3) Values of metabolite-related radioactivity were obtained by subtracting concentrations of parent drug from concentrations of total radioactivity
Discussion
Drug-excipient interaction studies showed no direct correlation between the in vitro results and the in vivo situation in rats Upon intravenous administration of COM1 in TPGS slightly lower plasma concentrations and binding to plasma proteins were observed in animals as compared to those received COM1 in a TPGS-free solution In contrast to these in vivo findings COM1 displayed in vitro no alterations in the presence of TPGS at 05 whereas a higher TPGS concentration (5) led to
29
enhanced distribution into plasma and a higher fraction bound in plasma Furthermore very rapid metabolism and elimination of COM1 under in vivo conditions contributed to a pharmacokinetic profile inappropriate for studying drug-excipient interactions
45 The impact of Vitamin E TPGS on COM2 in mouse
In vitro results
To assess whether the ultracentrifugation time could be shortened for minimizing the degradation of COM2 in plasma (147) blank plasma samples were centrifuged and time aliquots were analyzed for total protein concentrations in plasma and plasma water After 4-h centrifugation protein levels in the plasma water section were below 005 ngmL corresponding to ~01 of total plasma proteins adequate to assure a sufficient separation of plasma water and proteins Therefore samples were collected after 4-h centrifugation for analysis
COM2 (001-100 ngmL) distributed almost equally between whole blood and plasma (FP ~45) and was very highly bound to plasma proteins (gt98 mainly to albumin and lipoproteins) (Figure 4-2) The plasma fraction (63) was enhanced for COM2 in TPGS at the beginning (lt1-h incubation) followed by equalization to excipient-free incubations (Table 4-4 Figure 4-4) The presence of TPGS reduced also the free fraction in plasma by 30 (Table 4-4) Finally TPGS was selected for the in vivo study because of the most pronounced drug-excipient interactions detected in vitro
Table 4-4 Effect of excipients on blood distribution and protein binding of COM2 in vitro
Partition parameters of [3H]COM2 at 01 ngmL obtained at equilibrium after incubation with and without excipients (05) in mouse blood (pH 73 H 045 nge3 mean plusmn SD)
Excipient Time FP BPR BCPR fu ρ
(h) () ()
None 008 406 plusmn 07 136 plusmn 002 179 plusmn 005 102 plusmn 3 1 448 plusmn 24 123 plusmn 007 151 plusmn 015
176 plusmn 003 86 plusmn 8
CELEtOH 6535(vv) 008 455 plusmn 14 121 plusmn 004 146 plusmn 009 nd 1 438 plusmn 03 125 plusmn 001 157 plusmn 002
nd nd
HP-β-CyD 008 472 plusmn 14 117 plusmn 009 138 plusmn 019 nd 1 494 plusmn 16 111 plusmn 004 125 plusmn 008
nd nd
Solutol 008 468 plusmn 11 118 plusmn 003 139 plusmn 006 nd 1 472 plusmn 16 117 plusmn 004 137 plusmn 009
nd nd
PEG 200 008 425 plusmn 13 129 plusmn 004 165 plusmn 009 nd 1 418 plusmn 20 132 plusmn 006 171 plusmn 014
nd nd
TPGS 008 629 plusmn 23 087 plusmn 003 072 plusmn 007 58 plusmn 7 1 533 plusmn 07 103 plusmn 001 107 plusmn 003
122 plusmn 012 88 plusmn 3
30
(a)
00
05
10
15
008 h 1 h
BP
R(b)
00
05
10
15
20
008 h 1 h
BC
PR
(c)
0
20
40
60
80
100
008 h 1 h
ρ
Figure 4-4 TPGS-mediated alteration of COM2 distribution in blood
Blood-plasma (a) blood cell-plasma (b) and blood cell-unbound in plasma (c) concentration ratios of [3H]COM2 at 01 ngmL in the presence (white bars) and absence (black bars) of TGPS (05) after 008-h and 1-h incubation in mouse blood (pH 73 H 045 nge3 mean plusmn SD)
In vivo results
In a previous study (153) the disposition kinetics of COM2 was evaluated in mice after iv administration in a solution containing HP-β-CyD 10 (5 mLkg) To enable a comparison of former data with those in the current investigation for internal purposes only COM2 was injected at a volume of 5 mLkg dissolved in plasma or TPGS 10 The blood concentration of TPGS from this injection preparation was estimated as ~07 assuming a blood volume of 72 mLkg Thus the amount of TPGS in blood was higher in vivo compared to the amount used in vitro (05)
The administration of COM2 as TPGS-containing solution at the same dosage caused approximately 2-fold higher plasma concentrations as compared to COM2 formulated in plasma (control) (Table 4-5 Figure 4-5) These findings are in line with data obtained in blood distribution studies in vitro where partitioning into blood cells was reduced in the presence of TPGS resulting in a higher concentration in plasma at the same total blood concentration Furthermore in vivo a higher plasma exposure to metabolites and a slower elimination of metabolites from the systemic circulation were found for COM2 in TPGS indicated by 4-fold increased AUC and t12 of metabolite-related radioactivity in plasma (Table 4-6) Determination of unbound COM2 in plasma could not be performed on samples from mice due to concentrations below LOQ (3 pgmL)
No differences in tissue concentrations were observed between both groups although COM2 in TPGS resulted in a decrease of V0 (Table 4-5) and KP (Table 4-7) both suggesting altered tissue distribution and being in line with higher drug accumulation in the circulation Because the free drug fraction in plasma generally reflects more accurately distribution processes due to the ability of unbound drugs to pass through membranes and then reach the target organ the free drug fraction determined in vitro was considered Calculated tissue-unbound in plasma concentration ratios KP(u) were reduced in the TPGS group only within the first minutes after drug administration (Table 4-7)
31
Table 4-5 Comparative plasma kinetics of COM2 with and without TPGS
Plasma concentrations (a) and pharmacokinetic parameters (b) of [3H]COM2 after iv dosing at 400 ngkg in formulations based on blank plasma (control) or TPGS to mice (LOQ=3 pgmL n=3 mean plusmn SD) significantly different from the control at Plt005 and 001 respectively
(a)
Time COM2 in plasma (pgmL)
(h) Control TPGS Percentage of control value
008 104 plusmn 11 247 plusmn 23 238 025 81 plusmn 12 159 plusmn 16 196 05 59 plusmn 2 124 plusmn 17 210 1 34 plusmn 7 80 plusmn 17 235
(b)
Parameter Unit Formulation
Blank plasma TPGS 10 Body weight kg 0028 0027 Dose ng 110 107 C0 pgmL 111 237 tfrac12 h 057 061 V0 Lkg 36 17 AUC008-1h pgmiddotmL-1middoth 56 121 DoseAUC008-1h mLh 196 89 funchanged 54 35
Parent drug Metabolites
10
100
1000
0 025 05 075 1
Time (h)
CO
M2 (
pg
mL
)
10
100
1000
0 025 05 075 1
Time (h)
Rad
ioacti
vit
y (
pg
-eq
mL
)
Figure 4-5 Influence of TPGS on the systemic exposure of COM2 and metabolites
Plasma concentration-time profiles of parent drug and metabolite-related radioactivity of [3H]COM2 after intravenous administration to mice at 400 ngkg formulated in blank plasma (closed symbols black line) or as a solution containing TPGS 10 (open symbols dashed line) Symbols represent single values and lines mean values (n=3) Values of metabolite-related radioactivity were obtained by subtracting concentrations of parent drug from concentrations of total radioactivity
32
Table 4-6 Comparative plasma kinetics of metabolites of COM2 with and without TPGS
Plasma concentrations and pharmacokinetic parameters of metabolite-related radioactivity after iv administration of [3H]COM2 (400 ngkg) in blank plasma (control) or TPGS 10 to mice (n=3 mean plusmn SD) Values of metabolite-related radioactivity were obtained by subtracting concentrations of parent drug from concentrations of total radioactivity significantly different from the control at Plt001
Time Control TPGS
(h) Metabolites in plasma (pg-eqmL) Percentage of control value
008 75 plusmn 6 307 plusmn 28 408 025 67 plusmn 4 233 plusmn 9 346 05 56 plusmn 2 246 plusmn 30 441 1 29 plusmn 8 218 plusmn 31 744 AUC008-1h (pgmiddotmL
-1middoth) 49 222 453
t12 (h) 06 24 395
Table 4-7 Comparison of tissue distribution of COM2 with and without TPGS
Tissue concentrations and tissue-plasma concentration ratios (KP) of [3H]COM2 administered intravenously at 400 ngkg in blank plasma (control) or 10 TPGS solution to mice (n=3) KP(u) relates to the free compound concentration in plasma based on the free fraction determined in vitro Values represent mean plusmn SD
Time Tissue Concentration (pgg) KP KP(u)
(h) Control TPGS Control TPGS Control TPGS 008 Lung 1808 plusmn 263 1861 plusmn 64 173 plusmn 07 76 plusmn 05 981 plusmn 39 621 plusmn 42 Heart 750 plusmn 111 699 plusmn 33 72 plusmn 03 28 plusmn 01 407 plusmn 17 233 plusmn 11 Liver 2188 plusmn 355 2314 plusmn 56 209 plusmn 12 94 plusmn 09 1186 plusmn 69 773 plusmn 72 Kidney 1761 plusmn 390 1735 plusmn 84 167 plusmn 22 71 plusmn 07 951 plusmn 124 580 plusmn 59 Fat 232 plusmn 94 238 plusmn 83 22 plusmn 09 1 plusmn 03 127 plusmn 49 79 plusmn 25 Muscle 166 plusmn 40 190 plusmn 82 16 plusmn 06 08 plusmn 03 92 plusmn 32 62 plusmn 22 Brain 1095 plusmn 70 1038 plusmn 113 105 plusmn 06 42 plusmn 01 598 plusmn 35 345 plusmn 9 025 Lung 1206 plusmn 258 1277 plusmn 213 15 plusmn 26 8 plusmn 05 850 plusmn 148 657 plusmn 43 Heart 464 plusmn 31 473 plusmn 19 58 plusmn 06 3 plusmn 02 330 plusmn 37 246 plusmn 20 Liver 1447 plusmn 203 1626 plusmn 122 18 plusmn 19 103 plusmn 13 1024 plusmn 109 846 plusmn 109 Kidney 1176 plusmn 93 1161 plusmn 83 147 plusmn 19 74 plusmn 1 837 plusmn 108 605 plusmn 86 Fat 650 plusmn 169 1109 plusmn 321 81 plusmn 19 71 plusmn 24 458 plusmn 108 581 plusmn 198 Muscle 215 plusmn 13 214 plusmn 28 27 plusmn 05 14 plusmn 01 155 plusmn 28 111 plusmn 12 Brain 1199 plusmn 143 1180 plusmn 81 152 plusmn 34 75 plusmn 12 863 plusmn 194 616 plusmn 100 05 Lung 755 plusmn 76 923 plusmn 40 129 plusmn 15 75 plusmn 06 732 plusmn 83 615 plusmn 53 Heart 296 plusmn 34 354 plusmn 53 5 plusmn 06 29 plusmn 04 287 plusmn 34 234 plusmn 29 Liver 960 plusmn 91 1138 plusmn 58 163 plusmn 15 93 plusmn 12 929 plusmn 88 760 plusmn 100 Kidney 814 plusmn 102 987 plusmn 120 139 plusmn 19 8 plusmn 04 789 plusmn 110 654 plusmn 34 Fat 863 plusmn 227 1079 plusmn 444 147 plusmn 37 89 plusmn 51 834 plusmn 209 732 plusmn 416 Muscle 181 plusmn 12 170 plusmn 13 31 plusmn 02 14 plusmn 02 175 plusmn 11 113 plusmn 13 Brain 1086 plusmn 108 1215 plusmn 147 18 plusmn 18 98 plusmn 08 1050 plusmn 77 805 plusmn 69 1 Lung 439 plusmn 60 688 plusmn 187 133 plusmn 32 86 plusmn 05 758 plusmn 179 702 plusmn 43 Heart 186 plusmn 28 220 plusmn 72 57 plusmn 15 27 plusmn 04 322 plusmn 87 222 plusmn 31 Liver 581 plusmn 43 867 plusmn 140 176 plusmn 23 11 plusmn 15 998 plusmn 132 903 plusmn 123 Kidney 481 plusmn 37 740 plusmn 89 145 plusmn 19 94 plusmn 09 825 plusmn 105 771 plusmn 78 Fat 551 plusmn 143 504 plusmn 260 173 plusmn 77 71 plusmn 54 984 plusmn 439 584 plusmn 442 Muscle 91 plusmn 12 119 plusmn 37 28 plusmn 08 15 plusmn 03 159 plusmn 43 121 plusmn 25 Brain 731 plusmn 88 1073 plusmn 161 22 plusmn 26 136 plusmn 11 1249 plusmn 147 1114 plusmn 93
33
Discussion
Results signified the ability of the excipient TPGS to modify the blood distribution of COM2 in mouse under in vitro and in vivo conditions in a similar manner Plasma concentrations of COM2 and metabolites were significantly increased and the free fraction of drug in plasma (in vitro) decreased Concentrations in tissues were independent of the formulation whereas distribution ratios of drug in tissue to drug unbound in plasma were lower within the first minutes after dosing COM2 in TPGS Overall the altered pharmacokinetic profile of COM2 in plasma suggests drug inclusion in excipient-micelles andor promoted protein binding by excipient in plasma
The altered disposition of COM2 and metabolites in plasma is likely caused by the ability of TPGS to form micelles (141) Drug trapping by micelles in blood can be responsible for increased total plasma concentrations and decreased unbound fraction in plasma thereby influencing drug accumulation in plasma and blood cells (94) Changes in the free fraction could also be caused by altered protein binding There are different suggested mechanisms by which formulation vehicles can influence the free fraction of compounds such as vehicle-compound interactions (association andor micellar encapsulation) and vehicle-protein interactions The interaction either promotes or blocks the binding of the compound in plasma Most likely different interacting processes contribute to the effective free fraction (125)
The alteration in tissue distribution at the beginning may be induced by changes of the free drug fraction in the presence of TPGS and exists only for few minutes probably due to the excipient degradation in blood The phenomenon found after some minutes post-dose is reported in the literature for Paclitaxel formulated in Cremophor EL (94) The main characteristics are disproportionally increased plasma concentrations accompanied by unchanged tissue levels and tissue distribution processes
46 The impact of hydroxypropyl-β-cyclodextrin on COM3 in rat
In vitro results
COM3 was predominantly located in the cellular fraction (80) and was moderately bound to plasma proteins with high binding to α1-glycoprotein and albumin in a concentration-independent manner (Table 4-8 Figure 4-2) The drug partitioning into blood cells and the fraction bound to proteins were markedly reduced in incubations containing HP-β-CyD consequently lowering both the blood-plasma and blood cell-unbound in plasma concentration ratios (Table 4-8 Figure 4-6) Whereas HP-β-CyD decreased the protein binding suggesting more COM3 available for uptake into cells higher plasma levels associated with reduced concentrations in cells were observed for COM3 in HP-β-CyD In conclusion HP-β-CyD was selected for the in vivo study because of the most pronounced drug-excipient interactions detected in vitro
34
(a)
0
1
2
3
None HP-β-CyD
BP
R(b)
0
1
2
3
4
5
None HP-β-CyD
BC
PR
(c)
0
10
20
30
40
None HP-β-CyD
ρ
Figure 4-6 HP-β-CyD-mediated alteration of COM3 distribution in blood
Blood-plasma (a) blood cell-plasma (b) and blood cell-unbound in plasma (c) concentration ratios of [3H]COM3 at 5 (white bars) and 500 ngmL (black bars) in the presence and absence of HP-β-CyD (05) after incubation in rat blood (pH 76 H 044 nge3 mean plusmn SD)
Table 4-8 Effect of excipients on blood distribution and protein binding of COM3 in vitro
Partition parameters of [3H]COM3 obtained at equilibrium after incubation with and without excipients (05) in rat blood (pH 76 H 044 nge3 mean plusmn SD)
Excipient COM3 FP BPR BCPR fu ρ
(ngmL) () () None 5 209 plusmn 15 26 plusmn 01 46 plusmn 02 121 plusmn 09 399 plusmn 39 500 195 plusmn 03 29 plusmn 00 53 plusmn 01 122 plusmn 02 431 plusmn 08
5 194 plusmn 14 29 plusmn 02 56 plusmn 02 nd nd CELEtOH 6535 (vv) 500 175 plusmn 03 32 plusmn 01 60 plusmn 01 nd nd HP-β-CyD 5 385 plusmn 22 14 plusmn 01 21 plusmn 02 401 plusmn 18 51 plusmn 05 500 353 plusmn 04 16 plusmn 00 23 plusmn 00 396 plusmn 07 59 plusmn 01 Solutol 5 174 plusmn 14 32 plusmn 03 61 plusmn 04 nd nd 500 161 plusmn 03 35 plusmn 01 67 plusmn 01 nd nd PEG 200 5 197 plusmn 20 29 plusmn 03 51 plusmn 06 nd nd 500 186 plusmn 05 30 plusmn 01 56 plusmn 02 nd nd
5 227 plusmn 18 25 plusmn 02 44 plusmn 04 126 plusmn 01 346 plusmn 36 EtOHPEG200Glu 5590 (vvv) 500 200 plusmn 04 28 plusmn 01 51 plusmn 01 118 plusmn 02 432 plusmn 10 TPGS 5 249 plusmn 18 23 plusmn 02 40 plusmn 02 nd nd 500 237 plusmn 03 24 plusmn 00 41 plusmn 01 nd nd
In vivo results
Since COM3 dissolved in EtOHPEG200Glu (5590 vvv) showed similar distribution kinetics in vitro as compared to glucose 5 without additives (Table 4-8) the control formulation consisted of EtOHPEG200Glu This assured a sufficient solubility of COM3
Dosing COM3 in a HP-β-CyD-containing formulation resulted in decreased protein binding and blood cell partitioning as compared to the control group (Table 4-9) However these changes were transient and most pronounced after 5 min post-dosing followed by a decline At 60 min after drug administration differences in blood pharmacokinetics could not be longer detected between both groups anymore (Table 4-9) In contrast to the in vitro findings a lower plasma distribution was found at 5 min after applying COM3 in HP-β-CyD resulting in slightly enhanced blood-plasma and blood cell-plasma concentration ratios (Table 4-9 Figure 4-7)
35
The bolus injection of COM3 in HP-β-CyD led to an earlier decrease of kidney and lung concentrations and to a later decrease of skin liver and fat concentrations compared to tissue levels obtained after administration of COM3 alone (Table 4-11) The calculation of tissue-blood concentration ratios supported the lower distribution of COM3 formulated in HP-β-CyD (Table 4-11) especially at 1 h post-dose (Figure 4-8)
As a result of the difference in plasma pharmacokinetic parameters (Table 4-10) and tissue levels between both groups the renal elimination of COM3 was examined in addition More COM3 appeared in the urine of rats from the HP-β-CyD containing formulation (Table 4-12 Figure 4-9) especially within the first 30 minutes after drug administration (36-fold higher amount of unchanged COM3 in urine compared to the control group)
Table 4-9 Comparison of blood and plasma levels of COM3 with and without HP-β-CyD
[3H]COM3 concentrations in the systemic circulation (a) and partition parameters derived from these concentrations (b) after iv administration to rats at 300 microgkg formulated in HP-β-CyD or in a cyclodextrin-free solution (n=3 mean plusmn SD LOQ=008 ngmL assuming a hematocrit of 046(145) for calculations) significantly different from the control at Plt005 and 001 respectively
(a)
Formulation Time (h) Drug concentration (ngmL)
Blood Plasma EtOHPEG200Glu 5590 008 431 plusmn 68 175 plusmn 24 (control) 05 179 plusmn 40 61 plusmn 19 1 97 plusmn 09 41 plusmn 05 HP-β-CyD 40 008 327 plusmn 16 104 plusmn 11 025 263 plusmn 22 84 plusmn 09 05 180 plusmn 08 59 plusmn 01 1 104 plusmn 06 35 plusmn 02
(b)
Formulation Time (h) fu () FP () BPR BCPR ρ
008 225 plusmn 15 25 plusmn 02 42 plusmn 04 559 plusmn 48 EtOHPEG200Glu 5590 05 76 plusmn 08 187 plusmn 19 30 plusmn 03 54 plusmn 07 709 plusmn 89 (control) 1 233 plusmn 12 24 plusmn 01 40 plusmn 03 533 plusmn 37 HP-β-CyD 40 008 249 plusmn 12 174 plusmn 11 32 plusmn 02 58 plusmn 04 233 plusmn 17 025 177 plusmn 13 175 plusmn 06 31 plusmn 01 58 plusmn 02 325 plusmn 13 05 141 plusmn 06 180 plusmn 07 31 plusmn 01 56 plusmn 03 397 plusmn 18 1 78 plusmn 05 188 plusmn 12 29 plusmn 02 53 plusmn 04 681 plusmn 52
36
Table 4-10 Comparative pharmacokinetics of COM3 with and without HP-β-CyD
Pharmacokinetic parameters of [3H]COM3 administered intravenously in EtOHPEG 200Glu (control group) or in HP-β-CyD 40 to rats (n=3)
Parameter Unit Control group HP-β-CyD group
Blood Plasma Blood Plasma Body weight kg 0233 0221 Dose microg 70 66 C0 ngmL 46 17 35 11 V0 Lkg 66 174 85 271 AUC008-1h ngmL-1
h 197 75 177 58 funchanged 28 10 28 9
Blood Plasma
0
10
20
30
40
50
60
0 025 05 075 1Time (h)
CO
M3 (
ng
mL
)
0
5
10
15
20
25
0 025 05 075 1
Time (h)
CO
M3 (
ng
mL
)
Figure 4-7 Influence of HP-β-CyD on the systemic exposure of COM3
Blood and plasma concentration-time profiles of [3H]COM3 after intravenous administration to rats at 300 microgmL formulated in EtOHPEG 200Glu (open symbols black line) and as a solution containing HP-β-CyD (closed symbols dotted line) Symbols represent single values and lines mean values (n=3)
37
0
10
20
30
40
50
60
70
Liver Kidney Brain
0
5
10
15
Fat Muscle Skin Heart0
50
100
150
Lung
KP
Figure 4-8 Influence of HP-β-CyD on tissue distribution of COM3
Tissue to blood concentration ratio (KP) at 1 h after an iv injection of COM3 in EtOHPEG 200Glu (white bars) or in HP-β-CyD (black bars) in rats (dose 300 microgkg n=3 mean plusmn SD) significantly different from EtOHPEG 200Glu at Plt005
Table 4-11 Comparison of tissue distribution of COM3 with and without HP-β-CyD
Tissue concentrations and tissue-blood concentration ratios (KP) of [3H]COM3 after bolus injection to rats at 300 microgkg in EtOHPEG 200Glu (control) or HP-β-CyD (n=3 mean plusmn SD) significantly different from the control at Plt005
Time Tissue Concentration (ngmL) KP
(h) Control HP-β-CyD Percentage of control value Control HP-β-CyD
008 Liver 1412 plusmn 225 1058 plusmn 211 75 328 plusmn 01 326 plusmn 75 Kidney 1809 plusmn 191 1406 plusmn 72 78 424 plusmn 50 431 plusmn 24 Fat 128 plusmn 29 85 plusmn 18 67 31 plusmn 11 26 plusmn 06 Heart 597 plusmn 108 563 plusmn 55 94 139 plusmn 11 172 plusmn 13 Lung 6179 plusmn 809 4595 plusmn 192 74 1441 plusmn 110 1407 plusmn 6 Muscle 123 plusmn 25 142 plusmn 12 115 30 plusmn 11 44 plusmn 03 Skin 144 plusmn 62 74 plusmn 15 51 36 plusmn 20 22 plusmn 03 Brain 1164 plusmn 189 951 plusmn 41 82 271 plusmn 19 291 plusmn 21 05 Liver 588 plusmn 149 617 plusmn 60 105 329 plusmn 53 345 plusmn 42 Kidney 587 plusmn 163 479 plusmn 55 82 327 plusmn 51 267 plusmn 29 Fat 57 plusmn 10 46 plusmn 6 81 32 plusmn 02 26 plusmn 04 Heart 178 plusmn 46 187 plusmn 23 105 99 plusmn 10 104 plusmn 08 Lung 2003 plusmn 599 2376 plusmn 129 119 1108 plusmn 156 1324 plusmn 76 Muscle 155 plusmn 63 130 plusmn 12 84 84 plusmn 16 72 plusmn 05 Skin 94 plusmn 11 40 plusmn 9 42 54 plusmn 06 22 plusmn 06 Brain 905 plusmn 100 766 plusmn 49 85 515 plusmn 60 428 plusmn 44 1 Liver 394 plusmn 29 340 plusmn 6 86 407 plusmn 12 328 plusmn 19 Kidney 357 plusmn 44 293 plusmn 39 82 366 plusmn 12 283 plusmn 47 Fat 31 plusmn 1 22 plusmn 5 72 32 plusmn 04 21 plusmn 04 Heart 111 plusmn 13 99 plusmn 6 89 114 plusmn 04 95 plusmn 01 Lung 1197 plusmn 128 1053 plusmn 178 88 1247 plusmn 246 1011 plusmn 128 Muscle 99 plusmn 9 85 plusmn 23 86 102 plusmn 02 81 plusmn 19 Skin 68 plusmn 16 25 plusmn 3 37 69 plusmn 11 25 plusmn 02 Brain 653 plusmn 35 599 plusmn 10 92 674 plusmn 27 578 plusmn 22
38
Table 4-12 Comparison of COM3 excretion in urine with and without HP-β-CyD
[14C]COM3 (a) and its cumulative amount (b) appeared in the urine of rats following iv dosing at 370 microgkg in EtOHPEG 200Glu (control) or HP-β-CyD 40 (mean plusmn SD n=2 control n=3 HP-β-CyD) significantly different from the control at Plt005 and 001 respectively (a)
Time (h) COM3 in urine (ng) funchanged ()
Control HP-β-CyD Control HP-β-CyD 05 123 plusmn 10 4440 plusmn 594 25 plusmn 02 448 plusmn 82 1 240 plusmn 129 762 plusmn 191 34 plusmn 08 13 plusmn 41 15 85 plusmn 19 325 plusmn 150 25 plusmn 08 73 plusmn 28 2 43 plusmn 11 174 plusmn 89 2 plusmn 08 46 plusmn 21
(b)
Time Cumulative amount of COM3 in urine
(h) ng dose
Control HP-β-CyD Control HP-β-CyD 05 123 plusmn 10 4440 plusmn 594 013 plusmn 001 46 plusmn 09 1 363 plusmn 139 5202 plusmn 693 039 plusmn 014 54 plusmn 11 15 449 plusmn 159 5527 plusmn 799 048 plusmn 016 57 plusmn 12 2 491 plusmn 169 5702 plusmn 857 053 plusmn 017 59 plusmn 12
0
1000
2000
3000
4000
5000
6000
7000
05 1 15 2
Time (h)
Am
ou
nt
excre
ted
(n
g)
Figure 4-9 Effect of HP-β-CyD on the renal elimination of COM3
Cumulative amount of [14C]COM3 appeared in urine after iv administration of 370 microgkg either in EtOHPEG 200Glu (white bars) or as a solution in HP-β-CyD (black bars) Data are expressed as mean plusmn SD (n=2 EtOHPEG 200Glu n=3 HP-β-CyD) significantly different from the EtOHPEG 200Glu at Plt001
Discussion
In vitro and in vivo experiments demonstrated a strong influence of the excipient HP-β-CyD on the disposition kinetics of COM3 in rats There was a significant decrease in the plasma protein binding and in plasma and tissue concentrations of COM3 formulated in HP-β-CyD Changes in the systemic circulation were transient (le05 h post-dose) and most distinct shortly after dosing Alterations in tissue
39
concentrations and tissue-blood distribution ratios were tissue dependent and most pronounced for skin The amount of unchanged COM3 eliminated in the urine was significantly increased following drug administration in HP-β-CyD This alteration in the pharmacokinetic behavior of COM3 is most likely due to the elimination of COM3 included in cyclodextrin complexes
It is known (142) that HP-β-CyD forms drugcyclodextrin complexes in biological fluids is unable to cross biological membranes and is rapidly eliminated renally Even though the release of drugs from drugcyclodextrin complexes is expected to be fast (within seconds) (112) drug pharmacokinetics can be modified in the presence of cyclodextrins (143) Given that COM3 is included in complexes in the systemic circulation less COM3 is available for distribution which could have led to the lower protein binding and celltissue partitioning of COM3 formulated in HP-β-CyD compared to the cyclodextrin-free solution of COM3 Lower ρ-values of COM3 in HP-β-CyD support the possible existence of long-lasting complexes in vivo and indicate that unbound plasma concentrations obtained from ultrafiltration (30000 MW cut-off) are probably the sum of free and cyclodextrin-associated drug (MWHP-β-CyD
~1500) Furthermore blood partition parameters altered till 30 min post-dose indicate a slow dissociation of COM3 from complexes After total drug release COM3 formulated in HP-β-CyD seemed to assimilate the pharmacokinetic behavior in blood obtained in the control group (60 min post-dose)
The marked increase of unchanged COM3 in the urine occurred mainly in the first 30 min following drug administration in HP-β-CyD which is consistent with the decreased plasma levels right after dosing in the HP-β-CyD group Similar observations are reported for carbamazepine and dexamethasone where the renal excretion of unchanged drug applied intravenously in HP-β-CyD was increased most likely due to the renal clearance of the formulation vehicle (112) The faster elimination of COM3 associated to HP-β-CyD in contrast to COM3 alone might have attributed to less COM3 available for tissue distribution even after completed drug release from the vehicle being in line with decreased tissue levels and KP values at 60 min post-dose
47 The impact of Cremophor EL on COM4 in rat
In vitro results
In excipient-free incubations COM4 was highly bound to plasma proteins (gt97 bound predominantly to albumin) and penetrated hardly into blood cells (gt95 located in plasma) (Tables 4-13 and 4-14 Figure 4-2) The free fraction in plasma and the partitioning into blood cells of COM4 were enhanced in the presence of CEL HP-β-CyD and Solutol The protein binding decreased in an excipient concentration-dependent manner (Table 4-13 Figure 4-10) At excipient concentrations below 01 the protein binding was not altered At and above excipient concentrations of 01 the free fraction was markedly elevated with a maximal effect at 1 for all three formulations The addition of these excipients to incubations resulted to higher blood-plasma and blood cell-plasma concentration ratios both indicating increased uptake of COM4 into blood cells (Table 4-14) CEL was selected for the in vivo study because of the most pronounced drug-excipient interactions detected in vitro
40
Table 4-13 Effect of excipients on the in vitro protein binding of COM4
Protein binding of [14C]COM4 at 100 ngmL in the presence and absence of excipients in rat plasma using the ultrafiltration technique (pH 74 n=3 mean plusmn SD)
Excipient fu
() ()
Percentage of control value
None 24 plusmn 02 CEL 001 23 plusmn 01 96 01 31 plusmn 01 131 05 111 plusmn 03 464 1 260 plusmn 03 1089 HP-β-CyD 001 26 plusmn 02 109 01 43 plusmn 02 179 05 98 plusmn 01 412 1 141 plusmn 11 592 Solutol 001 23 plusmn 02 97 01 32 plusmn 02 134 05 97 plusmn 02 407 1 152 plusmn 03 638 PEG 200 05 24 plusmn 01 99 TPGS 05 2 plusmn 01 85
Table 4-14 Effect of excipients on the in vitro partition parameters of COM4 in blood
Plasma fraction (FP) and distribution ratios (BPR BCPR ρ) of [14C]COM4 at 100 ngmL in rat blood obtained at equilibrium after incubations with and without excipients at 05 and 1 (pH 75 H 044 37degC nge3 mean plusmn SD)
Excipient FP BPR BCPR ρ
() ()
None 959 plusmn 20 058 plusmn 001 005 plusmn 003 21 plusmn 06 CEL 05 739 plusmn 16 075 plusmn 002 043 plusmn 006 39 + 05 1 656 plusmn 17 085 plusmn 002 067 plusmn 005 26 + 02 HP-β-CyD 05 900 plusmn 13 062 plusmn 001 014 plusmn 002 15 plusmn 02 1 819 plusmn 14 068 plusmn 001 028 plusmn 003 20 plusmn 02 Solutol 05 786 plusmn 15 071 plusmn 001 035 plusmn 003 36 plusmn 03 1 749 plusmn 14 075 plusmn 001 043 plusmn 003 28 plusmn 03
In vivo results
Dosing COM4 in a CEL-containing formulation resulted in a decrease of the protein binding as compared to the control group (Table 4-15 Figure 4-10) This effect was time-dependent and most pronounced at 5 min after drug administration followed by a decline The increased fraction of COM4 unbound in plasma did not affect the drug levels in the systemic circulation resulting in similar pharmacokinetic parameters in both groups (Table 4-15) Identical tissue concentrations were observed independently of the formulation (Table 4-16)
41
In vitro Ex vivo
0
5
10
15
20
25
30
0 05 1
Excipient concentration ()
Fre
e f
racti
on
(
)
Cremophor EL
Hydroxypropyl-β-cyclodextrin
Solutol HS 15
0
5
10
15
20
25
0 025 05 075 1
Time (h)
Fre
e f
racti
on
(
)
Control group
Cremophor EL group
Figure 4-10 Excipient-mediated alterations of COM4 protein binding in plasma
Left Unbound fraction of [14C]COM4 (100 ngmL) incubated with different excipient concentrations in rat plasma (mean plusmn SD n=3) Right Unbound fraction of compound-related radioactivity in plasma after intravenous administration of [14C]COM4 at 400 microgkg formulated in buffer (control group closed symbols) or in CEL (open symbols) Symbols represent mean plusmn SD (n=3)
Table 4-15 Comparative blood and plasma kinetics of COM4 with and without CEL
Compound-related radioactivity concentrations in the systemic circulation (a) and pharmacokinetic parameters (b) after iv administration of [14C]COM4 at 400 microgkg formulated in buffer or in CEL to rats (n=3 mean plusmn SD LOQ=43 ng-eqmL assuming a hematocrit of 046(145) for calculations) significantly different from the control at Plt005 (a)
Formulation Time (h) Concentration (ng-eqmL)
Blood Plasma Unbound in plasma ()
008 1555 plusmn 299 2483 plusmn 382 025 1192 plusmn 119 2073 plusmn 238 05 1377 plusmn 67 2388 plusmn 153
Phosphate buffered saline (control)
1 1248 plusmn 68 2105 plusmn 172
38 + 15
Cremophor EL 17 008 1471 plusmn 115 2426 plusmn 186 169 plusmn 34 025 1316 plusmn 119 2180 plusmn 237 77 plusmn 24 05 1216 plusmn 155 2084 plusmn 237 74 plusmn 27 1 1315 plusmn 337 2210 plusmn 607 74 plusmn 28
(b)
Parameter Unit Control group Cremophor group
Blood Plasma Blood Plasma Body weight kg 0201 0199 Dose microg 81 80 C0 ngmL 1427 2373 1385 2296 V0 Lkg 028 017 029 017 AUC008-1h ngmL-1
h 1211 2068 1186 1998
42
Table 4-16 Comparison of tissue distribution of COM4 with and without CEL
Tissue concentrations and tissue-blood concentration ratios of radioactivity of [14C]COM4 after bolus injection to rats at 400 microgkg formulated either in buffer (control group) or in CEL (n=3 mean plusmn SD)
Time Tissue Drug concentration (ng-eqg) Tissue-blood distribution ratio
Control group Cremophor group Control group Cremophor group
008 h Lung 737 + 78 768 + 17 048 + 004 052 + 003 Muscle 222 + 6 243 + 12 015 + 002 017 + 002 Skin 276 + 63 254 + 46 019 + 008 017 + 002 025 h Lung 654 + 44 710 + 51 055 + 002 054 + 001 Muscle 209 + 5 211 + 6 018 + 002 016 + 002 Skin 363 + 70 395 + 41 030 + 004 030 + 004 05 h Lung 695 + 46 676 + 40 050 + 001 056 + 004 Muscle 202 + 4 204 + 1 015 + 0 017 + 002 Skin 408 + 39 372 + 25 030 + 004 031 + 004 1 h Lung 628 + 19 629 + 78 050 + 001 059 + 013 Muscle 212 + 10 196 + 13 017 + 001 019 + 008 Skin 409 + 24 391 + 45 033 + 001 037 + 009
Discussion
CEL lowered the binding of COM4 to plasma proteins in vitro and the higher free drug fraction was associated with enhanced partitioning into blood cells as compared to the excipient-free incubations Similar increases of unbound drug levels in plasma were observed after bolus injection of COM4 in CEL In contrast to the in vitro findings CEL induced no changes in the in vivo bloodplasma distribution of COM4 and no alterations in the tissue distribution were detected as well
Even though the plasma protein binding of COM4 is influenced by CEL in an analogous manner under in vitro and in vivo conditions a direct translation of the altered protein binding into blood and plasma concentrations is lacking in vivo Different to the in vitro investigations the in vivo situation involves not only distribution but also elimination processes which can initiate shifts in the systemic drug exposure Besides this the effective excipient concentration achieved in vivo in the circulation is usually unknown and can quite differ from concentrations applied in vitro Although excipient concentrations can be theoretically estimated using blood volume dose and application volume values are fairly arbitrary because excipient levels can decline fast in the body due to dilution (144) and degradation (126) within the blood compartment
48 The impact of Solutol HS 15 on COM5 in rat
In vitro results
The distribution of COM5 between whole blood and plasma was slightly concentration-dependent in rat regardless of incubations with or without excipients (Table 4-17) and the equilibrium conditions were rapidly reached for all solutions (lt5 min) except for CEL (equilibrium after 1-h incubation data not shown) The binding of COM5 to plasma proteins was moderate (lt90) with a high binding to albumin and α1-acid glycoprotein (Figure 4-2) and the bound fraction was reduced by the addition of CEL and Solutol Furthermore both excipients caused alterations in the blood-plasma and blood cell-plasma concentration ratios characterized by
43
enhanced drug partitioning into blood cells (Table 4-17 Figure 4-11) The higher cell uptake is consistent with decreased drug binding to plasma proteins in the presence of CEL and Solutol These effects were more prominent for COM5 with Solutol than with CEL Thus Solutol was selected for the in vivo study
Table 4-17 Effect of excipients on blood distribution and protein binding of COM5 in vitro
Partition parameters of [14C]COM5 obtained at equilibrium after incubation with and without excipients (05) in rat blood (pH 75 H 045 nge3 mean plusmn SD)
Excipient COM5 FP BPR BCPR fu ρ
(ngmL) () () None 10 857 plusmn 40 064 plusmn 003 021 plusmn 007 162 plusmn 11 14 plusmn 03 300 768 plusmn 16 072 plusmn 002 037 plusmn 003 119 plusmn 02 31 plusmn 02 Ethanol 10 812 plusmn 01 066 plusmn 005 023 plusmn 011 114 plusmn 04 22 plusmn 07 300 779 plusmn 09 072 plusmn 001 036 plusmn 002 116 plusmn 02 30 plusmn 02
10 660 plusmn 22 083 plusmn 003 063 plusmn 006 227 plusmn 18 28 plusmn 03 CELEtOH 6535 (vv) 300 577 plusmn 12 095 plusmn 002 090 plusmn 004 237 plusmn 04 38 plusmn 02 HP-β-CyD 10 803 plusmn 27 069 plusmn 002 030 plusmn 005 nd nd 300 754 plusmn 18 073 plusmn 002 040 plusmn 004 nd nd Solutol 10 550 plusmn 05 097 plusmn 006 100 plusmn 002 281 plusmn 10 33 plusmn 05 300 487 plusmn 09 113 plusmn 002 129 plusmn 004 277 plusmn 04 43 plusmn 04 PEG 200 10 769 plusmn 23 072 plusmn 002 037 plusmn 005 nd nd 300 736 plusmn 13 075 plusmn 001 044 plusmn 003 nd nd TPGS 10 832 plusmn 13 063 plusmn 005 018 plusmn 012 nd nd 300 785 plusmn 18 070 plusmn 002 033 plusmn 004 nd nd
(a)
00
02
04
06
08
10
12
10 ngmL 300 ngmL
BP
R
(b)
00
02
04
06
08
10
12
14
10 ngmL 300 ngmL
BC
PR
(c)
00
10
20
30
40
50
10 ngmL 300 ngmL
ρ
Figure 4-11 Excipient-mediated alterations of COM5 distribution in blood by CEL and Solutol
Blood-plasma (a) blood cell-plasma (b) and blood cell-unbound in plasma (c) concentration ratios of [14C]COM5 (10-300 ngmL) without excipients (black bars) and in the presence of Cremophor EL (white bars) and Solutol HS 15 (hatched bars) at 05 in rat blood (pH 75 H 045 nge3 mean plusmn SD)
In vivo results
In vitro studies demonstrated that the addition of ethanol to incubations had no impact on the blood partition of COM5 (Table 4-17) Therefore COM5 was dissolved in ethanol 10 for the administration in the control group thereby assuring sufficient solubility of the compound
Within the first 15 min post-dose higher blood concentrations accompanied by similar plasma concentrations were observed for COM5 in Solutol compared to concentrations for COM5 in ethanol 10 (control group) thereby increasing
44
concentration ratios of blood-plasma and blood cell-plasma in the Solutol group (Table 4-18) Subsequently similar ratios were obtained in both groups with a concomitant slower decline of circulation concentrations in animals treated with Solutol These changes in the Solutol group are in line with a reduced rate constant that resulted in a 2-fold higher half-life compared to that in the control group (Table 4-19) At 1 h post-dose concentrations of COM5 in the systemic circulation were 300 higher than those obtained after dosing the compound in the control formulation (Table 4-18 Figure 4-12) The doseAUC ratio was also decreased for COM5 in Solutol (Table 4-19) In agreement with the in vitro findings COM5 formulated in Solutol led to a permanent lower protein binding up to 1 h post-dose in addition to enhanced uptake into blood cells right after dosing (higher blood-plasma concentration ratio) (Table 4-18)
Table 4-18 Comparison of blood and plasma levels of COM5 with and without Solutol
Concentrations of compound-related radioactivity in the systemic circulation (a) and partition parameters (b) derived from these concentrations after iv administration of [14C]COM5 at 1 mgkg formulated in Solutol or in a Solutol-free solution (control group) to rats (n=3 mean plusmn SD LOQ=8 ng-eqmL assuming a hematocrit of 046(145) for calculations) significantly different from the control group at Plt005 and 001 respectively (a)
Time (h) Drug concentration (ng-eqmL)
Control group Solutol group Percentage of control value
Blood 008 1308 plusmn 178 1853 plusmn 155 142 025 895 plusmn 195 1243 plusmn 250 139 05 615 plusmn 193 976 plusmn 115 159 1 194 plusmn 24 585 plusmn 113 301 Plasma 008 2592 plusmn 558 2720 plusmn 266 105 025 1584 plusmn 168 1895 plusmn 337 120 05 1014 plusmn 385 1526 plusmn 112 150 1 311 plusmn 47 900 plusmn 165 289
(b)
Formulation Time (h) fu () FP () BPR BCPR ρ
Control 008 1062 plusmn 93 051 plusmn 004 -006 plusmn 01 -07 plusmn 11 (ethanol 10) 025 975 plusmn 148 056 plusmn 008 005 plusmn 017 19 plusmn 05 05 876 plusmn 125 062 plusmn 009 018 plusmn 019 42 plusmn 22 1
84 plusmn 14
862 plusmn 25 063 plusmn 002 019 plusmn 004 19 plusmn 04 Solutol 17 008 792 plusmn 18 068 plusmn 002 031 plusmn 003 22 plusmn 02 025 825 plusmn 18 065 plusmn 001 025 plusmn 003 19 plusmn 02 05 847 plusmn 51 064 plusmn 004 021 plusmn 008 14 plusmn 05 1
150 plusmn 23
832 plusmn 12 065 plusmn 001 024 plusmn 002 12 plusmn 01
Independent of the formulation brain levels ranged in concentrations corresponding
to the vascular contamination indicating no significant penetration of COM5 into brain (Table 4-20) A later increase in muscle and skin concentrations was detected for COM5 administered in Solutol (Table 4-20) The muscle concentration-time profile showed an analogous pattern to that in the systemic circulation with a longer persistence going along with higher concentrations at later post-dose times in the Solutol group (Table 4-21 Figure 4-12) However similar muscle-plasma concentration ratios between both groups pointed that Solutol did not affect the
45
muscle distribution pattern In contrast the higher skin concentrations of COM5 formulated in Solutol were associated with altered KP values (025 and 1 h post-dose) and same half-life compared to the control group (Tables 4-20 and 4-21)
Table 4-19 Comparative pharmacokinetics of COM5 with and without Solutol
Pharmacokinetic parameters of compound-related radioactivity after intravenous administration of [14C]COM5 in ethanol 10 (control group) or in Solutol 17 to rats (n=3)
Parameter Unit Control group Solutol group
Blood Plasma Blood Plasma Body weight kg 0214 0212 Dose microg 214 212 C0 ngmL 1562 2998 1840 2749 V0 Lkg 064 033 054 036 AUC008-1h ngmL-1
h 578 1011 931 1426 t12 h 033 032 069 069 DoseAUC008-1h mLh 369 211 228 149
Table 4-20 Comparison of tissue distribution of COM5 with and without Solutol
Tissue concentrations and tissue-plasma concentration ratios of radioactivity of [14C]COM5 after bolus injection at 1 mgkg to rats in ethanol 10 (control) or Solutol 17 (n=3 mean plusmn SD)
Time Tissue Concentration (ngg) Tissue-plasma ratio
Control Solutol Percentage of control value Control Solutol
008 h Muscle 400 + 53 476 + 69 119 016 plusmn 002 018 plusmn 004 Skin 248 + 26 240 + 48 97 010 plusmn 003 009 plusmn 003 Brain 27 + 3 40 + 2 150 001 plusmn 0 001 plusmn 0 025 h Muscle 311 + 43 424 + 21 137 020 plusmn 003 023 plusmn 004 Skin 243 + 15 413 + 62 170 015 plusmn 001 022 plusmn 002 Brain 16 + 2 26 + 4 161 001 plusmn 0 001 plusmn 0 05 h Muscle 228 + 25 333 + 15 146 025 plusmn 009 022 plusmn 001 Skin 235 + 33 384 + 11 163 025 plusmn 008 025 plusmn 001 Brain 10 + 2 18 + 3 188 001 plusmn 0 001 plusmn 0 1 h Muscle 57 + 2 174 + 30 307 019 plusmn 003 019 plusmn 0 Skin 152 + 11 246 + 46 162 050 plusmn 011 028 plusmn 004 Brain mdasha 11 + 1 nd 001 plusmn 0 001 plusmn 0 a below LOQ significantly different from the control at Plt005
Table 4-21 Comparison of muscle and skin kinetics of COM5 with and without Solutol
Pharmacokinetic parameters of compound-related radioactivity in tissues after intravenous administration of [14C]COM5 at 1 mgkg formulated in ethanol 10 (control group) or Solutol 17 to rats (n=3)
Parameter Unit Muscle Skin
Control group Solutol group Control group Solutol group AUC008-1h ngmL-1
h 199 298 198 313 C0 ngg 533 548 nd nd t12 h 030 058 104 097
46
Plasma Muscle Skin
100
1000
10000
0 025 05 075 1
Time (h)
Co
ncen
trati
on
(n
g-e
qm
L)
10
100
1000
0 025 05 075 1
Time (h)
Co
ncen
trati
on
(n
g-e
qm
L)
100
1000
0 025 05 075 1
Time (h)
Co
ncen
trati
on
(n
g-e
qm
L)
Figure 4-12 Influence of Solutol on plasma muscle and skin profiles of COM5
Concentration-time courses of compound-related radioactivity in plasma muscle and skin after intravenous administration of [14C]COM5 at 1 mgkg formulated in ethanol 10 (closed symbols black line) and as a solution containing Solutol 17 (open symbols dotted line) Symbols represent single values and lines mean values (n=3)
Discussion
In vitro and in vivo experiments showed that Solutol significantly modulated the disposition profile of COM5 in rats by drug-excipient interactions in blood COM5 formulated in Solutol decreased both the drug distribution into plasma (transient in vivo) and the binding to plasma proteins (prolonged in vivo) Furthermore animals treated with Solutol showed a later concentration increase in the circulation and tissues (muscle skin) (ge025 h post-dose)
Altered drug levels were related to prolonged half-lives in the circulation and muscle The longer blood persistence is consistent with the reduced clearance (doseAUC) which presumes a lower elimination of COM5 in the presence of Solutol In contrast to the muscle concentration-time profile similar to that in the circulation the skin profile exhibited no changes in the half-life potentially due to a lower vascularization in skin compared to that in muscle However the skin-plasma concentration ratio was affected by the Solutol formulation whereas no changes in KP values were observed for muscle This altered pharmacokinetic profile might relate to a lower clearance of COM5 in the presence of Solutol
Previous investigations in mice revealed an interaction between Solutol and a co-administered ketochlorine photosensitizer (C8KC) in plasma (127) Protein binding experiments indicated the formation of either a binary drug-excipient complex or a ternary complex involving drug excipient and plasma components This effect was correlated to similar half-lives of Solutol and C8KC in plasma suggesting the persistence of C8KC in the circulation associated with that of the excipient Likewise half-lives in the same range were also observed for C8KC and the excipient Cremophor EL going along with prolonged C8KC persistence in plasma and tissues in mice (85)
47
5 General discussion and conclusions
In vitro and in vivo experiments were carried out to investigate the potential of five excipients commonly used in formulations to modify the pharmacokinetics of co-administered model compounds at concentrations ranging from sub-therapeutic to pharmacological levels Conducted studies focused mainly on the impact of excipients in the blood compartment since such data have rarely been published up to now especially for intravenously low dosed compounds including highly active drug substances biomarkers PET ligands and microdoses
PEG 200 CEL HP-β-CyD and Solutol were chosen as excipients because of their use in intravenous formulations and their high solubilizing ability related to different molecular structures and solubilization principles by either a direct solvent effect or by formation of micelles or complexes TPGS known in oral formulations completed the set of selected excipients and is an interesting functional excipient in terms of its chemical properties (benzyl ring) and ability to alter metabolism andor transporter activities thereby potentially influencing cellular distribution
Five drug candidates in development at Novartis were selected as model compounds exhibiting different physicochemical and pharmacokinetic properties (Table 5-1) The two PET ligands COM1 (base) and COM2 are lipophilic and poorly water-soluble COM3 is characterized by its predominant location in the cellular fraction in blood whereas COM4 hardly penetrates into blood cells COM2 distributes equally between plasma and whole blood COM5 is a molecule with a high polar surface area and a low volume of distribution similar to that of COM4 Moreover COM2 COM1 and COM4 are very highly protein bound (gt95) and COM3 and COM5 are moderately protein bound (lt90) In addition binding studies using isolated plasma proteins showed that model compounds bind with different affinity to the three major drug-binding proteins in plasma (albumin α1-acid glycoprotein and lipoproteins)
Model compounds were used in low doses to achieve blood concentrations of lt5 ngmL for COM1 and COM2 and low-therapeutic levels for COM3 (5-50 ngmL) Due to the very low volume of distribution COM4 and COM5 were investigated at normal pharmacological concentrations (gt50 ngmL in blood) to guarantee detectable tissue levels
In order to analyze the in vitro-in vivo correlation the excipient was set at an excipient-blood ratio of 1200 This concentration was found to be non-hemolytic in vitro for selected excipients except TPGS which induced hemolysis after a longer contact time To rule out any changes caused by cell lysis TPGS investigations were carried out in the non-hemolytic range The excipient concentration of 05 also correlates to the normal dosing range estimated for an intravenous bolus injection in mice and rats assuming a blood volume of ~70 mLkg and an injection volume of lt3 mLkg However in humans according to the literature (54) excipient concentrations above 01 in blood are regarded as high and generally only obtained following intravenous infusions Considering marketed injectable formulations for example the amount of excipient in blood is up to 015 HP-β-CyD (Sporanox) and 03-05 CEL (Vumon and Taxol respectively)
48
Table 5-1 Overview of model compounds
Physicochemical (PC) and pharmacokinetic (PK) properties of model compounds selected for investigating drug-excipient interactions in blood
Compound COM1 COM2 COM3 COM4 COM5 PET ligand PET ligand NCE NCE NCE
Chemical structure
N
N
O
R1
R2
O
N
O
N
N
S
R1
R2
N
O
N
R
NN
R2
R1
N
NO
S O
NH
O
O
NH
OR1
R2
R3
PC properties MW (gmol) 240 410 295 lt400 533 LogD 68 34 45 23 17 37 pKa 38 57 41 87 32 46 106 H20 solubility pH 68 (mgL) 20 lt25 4000 lt500 100 PSA (Aring2) 35 50 25 63 166 H-bond acceptors 3 5 3 4 12 H-bond donors 0 0 0 1 3 Critical value(s) Solubility (base) Solubility MW PSA H-bond acc PK parameters Species Rat Mouse Rat Rat Rat In vitro Fraction in plasma () 75 45 20 ~100 80 Free in plasma () 21 18 12 24 11 Major binding protein Albumin gt AGP Albumin gt LP AGP gt Albumin Albumin gt AGP Albumin asymp AGP In vivo Matrix Plasma Blood Blood Plasma Plasma t12 (h) 008 11 11 10 04 CL (mLminkg) 202 10 142 04 72 Vss (Lkg) 11 14 10 03 03 funchanged () 14 49 14 98 94 AGP α1-acid glycoprotein CL Drug clearance funchanged Fraction of unchanged drug based on AUC ratio of parent drug and total radioactivity LogD Logarithm of octanol-water distribution coefficient LP Lipoproteins MW Molecular weight NCE New chemical entity pKa Negative logarithm of dissociation constant PSA Polar surface area t12 Main elimination half-life Vss Volume of distribution under steady-state conditions
49
In trying to evaluate the potential of excipients to affect partition parameters in blood selected excipients were screened in vitro for interactions with the model compounds using a blood distribution method and protein binding assays (ultrafiltrationultracentrifugation) The most interacting excipients were subsequently taken forward for in vivo studies in animals given a single iv dose to ascertain whether there was a change in pharmacokinetics and whether an in vitro-in vivo correlation existed
Amongst the excipients tested the excipient PEG 200 was not active as an interacting agent whereas the others were more or less active (Table 5-2) However there was no apparent relationship between the nature of interactions and the compound properties
TPGS was found in vitro to enhance the plasma fraction of COM1 and COM2 in blood and higher plasma concentrations were associated with a decrease of compound unbound in plasma A significant increase in plasma concentrations of parent drug (2-fold) and metabolites (4-fold) were observed following intravenous administration of COM2 in mice and t12 of COM2 remained unchanged whereas t12 of metabolites was 4-fold higher While TPGS led to similar trends of COM1-related metabolites after injection in rats values determined for parent drug were inconsistent with those obtained in vitro A very extensive metabolism coupled to fast elimination was detected for COM1 which led to a stop in additional investigations to understand the in vitro-in vivo discrepancy
The use of CEL and Solutol in rats reduced in vitro the binding of COM4 and COM5 to plasma proteins and the higher free drug fraction was accompanied by enhanced partitioning into blood cells Both excipients led to 2-fold higher unbound plasma concentrations following iv administration of COM4 formulated in CEL and COM5 in a Solutol-containing solution Systemic and tissue levels of COM4 remained unaffected In contrast dosing COM5 in Solutol resulted in an earlier increase of blood-plasma concentration ratios indicating enhanced uptake into blood cells Later on COM5 concentrations in blood and plasma were significantly enhanced to a similar extent (2-fold) yielding ratios equalized to control values The systemic accumulation was correlated to higher t12 (2-fold) The AUC of COM5 in muscle and skin increased going along with a raise of t12 in muscle and none in skin
In vitro HP-β-CyD increased the amount of COM3 distributed into rat plasma and lowered the binding to plasma proteins Concentration ratios were only about 12 for blood-plasma and 18 for blood cell-unbound in plasma as compared to reference values At earlier time points after iv dosing concentrations of COM3 in blood and plasma were lower in the presence of HP-β-CyD (~23 of control) whereas over 30-fold higher levels of COM3 in urine were found Subsequently tissue concentrations and tissue-blood concentration ratios of COM3 with HP-β-CyD were significantly decreased
50
Table 5-2 Qualitative impact of excipients on pharmacokinetic parameters
Excipient-compound interactions obtained after in vitro incubations and after intravenous administration in animals using excipients at ~05 in blood and compounds at a dose of either ~1 nmolkg (COM1 COM2) or ~1 micromolkg (COM3 COM4 COM5) Arrows indicate excipient-induced changes compared to the excipient-free group (harr no changes uarr increase darr decrease) Compound Excipient Species Changes Comments
In vitro In vivo COM1 Vit E TPGS Rat uarr Accumulation in plasma darr Plasma protein binding bull No changes in vitro at le05 TPGS darr Partitioning into blood cells darr AUC008-05h bull Similar AUCs of drug free in plasma uarr Plasma protein binding darr C0 bull Increase in AUC of metabolites
harr t12 bull Inappropriate model compound due harr Tissue distribution to rapid metabolismelimination COM2 Vit E TPGS Mice uarr Accumulation in plasma uarr AUC008-1h bull uarr AUC and uarr t12 of metabolites darr Partitioning into blood cells uarr C0 bull Ex vivo protein binding not available
uarr Plasma protein binding harr t12 due to values ltLOQ harr Tissue distribution
COM3 HP-β-cyclodextrin Rat uarr Accumulation in plasma darr Plasma protein binding
darr Partitioning into blood cells darr AUC008-1h
darr Plasma protein binding darr C0
harr t12
darr Skin concentrations
uarr Urinary excretion
COM4 Cremophor EL Rat darr Accumulation in plasma darr Plasma protein binding uarr Partitioning into blood cells harr AUC008-1h
darr Plasma protein binding harr C0
harr t12
harr Tissue distribution
COM5 Solutol HS 15 Rat darr Accumulation in plasma darr Plasma protein binding
uarr Partitioning into blood cells uarr AUC008-1h
darr Plasma protein binding harr C0
uarr t12
uarr Muscleskin concentrations
AUC Area under the plasma drug concentration-time curve C0 Initial plasma concentration at time zero LOQ Limit of quantification t12 Half-life in plasma using the last three data points
51
These results clearly show the role of excipients as a modulator of the protein binding and cellular partitioning of compounds in blood which can impact the overall drug disposition Excipient-induced changes in the free fraction and cell uptake of drugs within the blood compartment are explained by various mechanisms (Figure 5-1) An excipient is able to influence the fraction of a co-administered drug in plasma and blood cells by direct drug interactions andor interferences with blood components such as proteins and cell constituents particularly membranes Consequently bound and free concentrations in plasma and cellular concentrations may be shifted potentially contributing to a ldquonewrdquo steady state Altered plasma concentrations can be the result of changes in drug protein binding drug adsorption to excipients andor drug trapping into excipient micelles or complexes Whichever effect dominates more drug can be free or bound thereby accounting for the amount of drug available for cellular partitioning Excipients could also vary the uptake into blood cells due to alterations in membrane structure andor drug presentation both mechanisms either facilitating or hindering drug transport via membranes In the end most likely different interacting processes contribute to the final effect depending on the force and nature of each single interaction
Free drug Free drug
Bound drug
Protein-bound drug
Excipient-drug interactions
(solubilization adsorption incorporation)
(destruction adsorption integration penetration)
PLASMA BLOOD CELLS
Excipient-membrane interactionsExcipient-protein interactions
(destruction adsorption binding)
Figure 5-1 Mechanisms underlying alterations in drug partition parameters in blood
The presence of excipients in blood may influence drug levels in plasma (protein-bound and free fraction) and blood cells by interacting with the drug or blood components thereby either blocking or promoting the protein binding andor the drug available for cellular partitioning
Analyzing the in vitro with the in vivo situation the effect of selected excipients on
the protein binding showed a good in vitro-in vivo correlation whereas systemic concentrations after iv administration in animals could often not be predicted well from in vitro data In contrast to in vitro assays reflecting stationary conditions the in vivo situation entails processes running in an open and dynamic system thereby involving not only distribution but also elimination This can initiate shifts in the systemic drug exposure and be responsible for the absence of a direct correlation to bloodplasma concentrations and thus to pharmacokinetic parameters as well Apart from this the effective excipient concentration achieved in vivo in the circulation is usually unknown and may differ from concentrations applied in vitro Although excipient concentrations can be theoretically estimated using blood volume dose and application volume values are fairly arbitrary because excipient levels decline most likely fast in the body due to dilution and degradation within the blood
52
compartment This suggests that if alterations in blood partitioning occur following administration in vivo they should be best detectable at times shortly post-dose
Even though differences between the in vitro and in vivo results were found the in vitro test can serve as a straightforward tool for rapid detection of excipient-drug interactions in blood while requiring little amounts of drug As a result the determination of in vitro blood partition parameters is proposed as a rough estimator of a possible potential of excipients to contribute to pharmacokinetics of parenteral drugs In addition to the blood-to-plasma distribution ratio the protein binding provides useful information to elucidate excipient-induced alterations and allows the calculation of the blood cell-to-free in plasma distribution ratio These data help not only to optimize the proper evaluation of pharmacokinetics in animals but also to enable a more rational approach in the development of formulations for drug candidates Therefore the in vitro investigation of blood distribution and protein binding with and without excipient is recommended at a very early preclinical stage in cases where animal pharmacokinetics of lower dosed compounds (eg PET ligands) must be examined from excipient-containing solutions (eg surfactants complexing agents) The influence assessment of excipients may also be a promising formulation approach for iv solutions of non-ionizable lipophilic and nonpolar molecules which are very challenging to formulate appropriately due to poor water solubility (eg paclitaxel docetaxel cyclosporin)
Figure 5-2 illustrates a possible formulation procedure that integrates data generated by in vitro investigations in blood Cosolvents complexing agents surfactants and combinations of these excipients are frequently used to dissolve a compound for intravenous administration in animals Method(s) are chosen considering available compound characteristics such as physicochemical and pharmacokinetic properties doses and clinical objectives If an appropriate formulation in terms of solubility and stability is found blood distribution and protein binding studies are performed both in the presence and absence (reference) of excipient(s) using in vitro assays Protein binding studies should mainly be considered if the extent of binding can be appropriately determined by ultrafiltration dialysis or ultracentrifugation all three conventional and simple methods Next partition parameters (FP fu BPR BCPR and ρ) are evaluated and compared to those obtained for the reference formulation representing an excipient-free solution (eg glucose 5 or saline including pH adjustment buffer blank plasma) Formulations are ranked in order of changes relative to the reference As a result a formulation can be modified adapted or selected for intravenous administration in animals In cases where the in vivo administration requires the addition of excipient(s) to the reference formulation to solubilize the compound the formulation must be tested in vitro The formulation is an acceptable in vivo reference if the in vitro parameters are similar to those of the excipient-free solution ie the in vitro reference The outcome of the in vivo study triggers formulation optimization to minimize or abolish excipient effects further investigation to better interpret data or formulation acceptance for in vivo dosing and formulation development Finally it should be possible to exclude or at least be aware of a potential impact of excipient(s) on the drug disposition Data can also be applied to identify both the activity of a certain excipient with different compounds and the excipient sensitivity of compounds with similar properties
53
Compound characteristics
Formulation principle Excipients
Formulation properties
In vitro assays using blood plasma
Data analysis
Adapt formulation In vivo application
Assess in vitro-in vivo correlation
Candidate-tailored formulation
Figure 5-2 Suggested flow chart for an iv formulation development strategy
In conclusion substantial drug-excipient interactions in animals have been
identified for different excipients commonly used in drug formulation and pharmacologically active compounds with diverse properties These findings support the assumption that certain excipients are not ldquoinertrdquo but are ldquofunctionalrdquo excipients and are able to alter the disposition of co-administered drugs Such data need special attention since excipient-related changes may occur with similar or other drugexcipient formulations Identifying excipient-drug interactions and understanding how excipients affect the drug behavior will assist in the pharmacokinetic characterization and the formulation developmentoptimization of drug candidates in development Furthermore a better knowledge of the relationship between drug excipient and blood constituents suggests new approaches in drug development in terms of controlling the pharmacokinetic profile by the right choice of excipient and its amount This may enable to better anticipate the target of different blood and body compartments without extensive animal and human tests potentially resulting in modulated pharmacological responses
54
6 Outlook
The results of this work demonstrated the ability of commonly used injectable excipients especially CEL HP-β-CyD and SHS to influence pharmacokinetic parameters in blood consequently contributing to altered drug disposition following iv dosing However to increase the knowledge of drug-excipient interactions additional studies are required to confirm the above findings with further drugexcipient formulations and with an emphasis on the role of excipients per se in pharmacokinetics of parenteral drugs
The excipients were tested in vitro and in vivo at a fixed concentration of 05 in
blood being within the normal range for animal injections and higher for clinical ones Investigations by varying the excipient amount would give insight into the concentration-effect relationship and potency of excipients Examination of lower excipient levels should also give an indication about the relevance and impact of excipient-induced alterations on applications in humans
No direct correlation between the interacting excipient and the compound
properties were found and no trends could be apparently observed in changes regarding the excipient characteristics Continued investigations are necessary to elucidate whether observed phenomena are associated with certain drugs or more by some drug classes characterized by specific physicochemical properties Focusing on excipients it would be of interest to explore more in detail the frequency and significance of interactions and the excipient preference in terms of particular changes
The emphasis throughout the current work was placed on providing an insight into
excipient-triggered effects and their in vitro-in vivo correlation According to the literature little is known about mechanisms underlying these alterations taking into account in vitro-in vivo investigations (94110112) To explain findings and improve excipient characterization further investigations should focus on the mechanistic basis for the role of excipients in protein binding bloodplasma partitioning and cellular distribution using in vitro assays appropriate to understand the observed effects In addition modification of in vitro approaches could facilitate correlation of effects and mechanisms determined in vitro with in vivo situations increase the understanding of in vitro-in vivo relationships and enable extrapolation of in vitro results to in vivo pharmacokinetics A better in vitro-in vivo correlation could also reduce in vivo studies and may contribute to more efficient drug development
There are drug-drug interactions reported in the literature where drugs were
administered intravenously in conjunction with excipient-containing formulation of other drugs (eg valspodar formulated in CEL) (108109) Most likely the presence of excipient(s) in drug formulations contributed to observed pharmacokinetic interactions
55
The research into the potential of excipients to induce kinetic alterations of agents administered intravenously in conjunction with excipient-containing formulation of other compounds should lead to a deeper insight into drug-drug interactions These data may provide helpful information relevant for safety issues dosage planning and treatment optimization in clinical drug monitoring
Further studies could focus on the potential clinical significance of drug-excipient
interactions observed in animals Finally ongoing efforts for a proper understanding of excipients as biologically and
pharmacologically active compounds will allow a better control of designing formulations with optimal characteristics for a better drug therapy
56
7 References
References to external publications and books
(1) Values received from Charles River Laboratoires (2) In E Green (ed) The biology of the laboratory mouse McGraw-Hill Inc New York 1966 (3) In H Baker J Lindsey and S Weisbroth (eds) The laboratory rat Academic Press Inc
New York 1979 (4) H E Weimer D M Roberts P Villanuevo and H G Porter Genetic differences in
electrophoretic patterns during the phlogistic response in the albino rat Comp Biochem Physiol B 43965-973 (1972)
(5) Geigy Scientific Tables 8th ed Vol2 Ciba-Geigy Basel 1983 (6) M Lemaire Drug binding to leucocytes and platelets Symposia Medica Hoechst 79-93
(1986) (7) P H Hinderling Red blood cells a neglected compartment in pharmacokinetics and
pharmacodynamics Pharmacol Rev 49279-295 (1997) (8) J Tillement G Houin R Zini S Urien E Albengres J Barre M Lecomte P DAthis and
B Sebille The binding of drugs to blood plasma macromolecules recent advances and therapeutic significance Adv Drug Res 1359-94 (1984)
(9) Z H Israili and P G Dayton Human alpha-1-glycoprotein and its interactions with drugs Drug Metab Rev 33161-235 (2001)
(10) K M Wasan and S M Cassidy Role of plasma lipoproteins in modifying the biological activity of hydrophobic drugs J Pharm Sci 87411-424 (1998)
(11) P du Souich J Verges and S Erill Plasma protein binding and pharmacological response Clin Pharmacokinet 24435-440 (1993)
(12) F Akhlaghi and A K Trull Distribution of cyclosporin in organ transplant recipients Clin Pharmacokinet 41615-637 (2002)
(13) G M Pacifici and A Viani Methods of determining plasma and tissue binding of drugs Pharmacokinetic consequences Clin Pharmacokinet 23449-468 (1992)
(14) J Oravcova B Bohs and W Lindner Drug-protein binding sites New trends in analytical and experimental methodology J Chromatogr B Biomed Appl 6771-28 (1996)
(15) Z Liu F Li and Y Huang Determination of unbound drug concentration and protein-drug binding fraction in plasma Biomed Chromatogr 13262-266 (1999)
(16) A Lipinski Experimental and computational approaches to estimate solubility and permeability in drug discovery and development settings Adv Drug Deliv Rev 233-26 (1997)
(17) R Panchagnula N S Thomas Biopharmaceutics and pharmacokinetics in drug research Int J Pharm 201131-150 (2000)
(18) M S Lajiness M Vieth and J Erickson Molecular properties that influence oral drug-like behavior 16 Curr Opin Drug Discov Devel 7470-477 (2004)
(19) H van de Waterbeemd G Camenisch G Folkers J R Chretien and O A Raevsky Estimation of blood-brain barrier crossing of drugs using molecular size and shape and H-bonding descriptors J Drug Target 6151-165 (1998)
(20) B Testa P Crivori M Reist P Carrupt The influence of lipophilicity on the pharmacokinetic behavior of drugs concepts and examples Persp Drug Discov Design 19179-211 (2000)
(21) In V Pliska B Testa H van Waterbeemd (eds) Methods and Principles in Medicinal Chemistry Vol4 VCH Weinheim Germany 1996
(22) G L Amidon H Lennernas V P Shah and J R Crison A theoretical basis for a biopharmaceutic drug classification the correlation of in vitro drug product dissolution and in vivo bioavailability Pharm Res 12413-420 (1995)
(23) C A Lipinski Poor aqueous solubility - an industry-wide problem in ADME screening Capsugel Symposium Tokyo Japan 33-48 (2003)
(24) C A Lipinski Drug-like properties and the causes of poor solubility and poor permeability J Pharmacol Toxicol Methods 44235-249 (2000)
57
(25) K R Horspool and C A Lipinski Advancing new drug delivery concepts to gain the lead Drug Deliv Technol 334-46 (2003)
(26) M Kaushal Amorphous drug delivery systems molecular aspects design and performance Crit Rev Ther Drug Carrier Sys 21133-193 (2004)
(27) H Fischer Blood-brain barrier permeation molecular parameters governing passive diffusion J Membrane Biol 165201-211 (1998)
(28) A Seelig A general pattern for substrate recognition by P-glycoprotein Eur J Biochem 251252-261 (1998)
(29) A Seelig X L Blatter and F Wohnsland Substrate recognition by P-glycoprotein and the multidrug resistance-associated protein MRP1 a comparison Int J Clin Pharmacol Ther 38111-121 (2000)
(30) D E Clark Rapid calculation of polar molecular surface area and its application to the prediction of transport phenomena 2 Prediction of blood-brain barrier penetration J Pharm Sci 88815-821 (1999)
(31) J Kelder Polar molecular surface as a dominating determinant for oral absorption and brain penetration of drugs Pharm Res 161514-1519 (1999)
(32) K Palm K Luthman A L Ungell G Strandlund and P Artursson Correlation of drug absorption with molecular surface properties J Pharm Sci 8532-39 (1996)
(33) K Palm P Stenberg K Luthman and P Artursson Polar molecular surface properties predict the intestinal absorption of drugs in humans Pharm Res 14568-571 (1997)
(34) D E Clark Rapid calculation of polar molecular surface area and its application to the prediction of transport phenomena 1 Prediction of intestinal absorption J Pharm Sci 88807-814 (1999)
(35) H van der Waterbeemd G Camenisch G Folkers and O A Raevsky Estimation of Caco-2 cell permeability using calculated molecular descriptors Quant Struct Act Relat 15480-490 (1996)
(36) S Winiwarter N M Bonham F Ax A Hallberg H Lennernas and A Karlen Correlation of human jejunal permeability (in vivo) of drugs with experimentally and theoretically derived parameters A multivariate data analysis approach J Med Chem 414939-4949 (1998)
(37) A Bergstroem Absorption classification of oral drugs based on molecular surface properties J Med Chem 46558-570 (2003)
(38) D F Veber S R Johnson H Y Cheng B R Smith K W Ward and K D Kopple Molecular properties that influence the oral bioavailability of drug candidates J Med Chem 452615-2623 (2002)
(39) J F Pritchard M Jurima-Romet M L Reimer E Mortimer B Rolfe and M N Cayen Making better drugs Decision gates in non-clinical drug development Nat Rev Drug Discov 2542-553 (2003)
(40) P Preziosi Opinion science pharmacoeconomics and ethics in drug RampD a sustainable future scenario Nature Rev Drug Discov 3521-526 (2004)
(41) I Kola Opinion Can the pharmaceutical industry reduce attrition rates Nature Rev Drug Discov 3711-716 (2004)
(42) L J Lesko M Rowland C C Peck T F Blaschke D Breimer H J de Jong A Grahnen J J Kuhlmann and B Stewart Optimizing the science of drug development opportunities for better candidate selection and accelerated evaluation in humans Eur J Pharm Sci 10iv-xiv (2000)
(43) G Lappin and R C Garner Big physics small doses the use of AMS and PET in human microdosing of development drugs Nat Rev Drug Discov 2233-240 (2003)
(44) R D Combes T Berridge J Connelly M D Eve R C Garner S Toon and P Wilcox Early microdose drug studies in human volunteers can minimise animal testing proceedings of a workshop organised by volunteers in research and testing Eur J Pharm Sci 191-11 (2003)
(45) Biomarkers definitions working group Biomarkers and surrogate endpoints preferred definitions and conceptual framework Clin Pharmacol Ther 6989-95 (2001)
(46) J Lesko Use of biomarkers and surrogate endpoints in drug development and regulatory decision making criteria validation strategies Annu Rev Pharmacol Toxicol 41347-366 (2001)
58
(47) R Frank and R Hargreaves Clinical biomarkers in drug discovery and development Nat Rev Drug Discov 2566-580 (2003)
(48) M Bergstrom A Grahnen and B Langstrom Positron emission tomography microdosing a new concept with application in tracer and early clinical drug development Eur J Clin Pharmacol 59357-366 (2003)
(49) M Jagoda Experiment assessment of mass effects in the rat implications for small animal PET imaging Nucl Med Biol 31771-779 (2004)
(50) Y C Lee P D Zocharski and B Samas An intravenous formulation decision tree for discovery compound formulation development Int J Pharm 253111-119 (2003)
(51) B Bittner and R J Mountfield Intravenous administration of poorly soluble new drug entities in early drug discovery the potential impact of formulation on pharmacokinetic parameters Curr Opin Drug Discov Devel 559-71 (2002)
(52) A K Singla A Garg and D Aggarwal Paclitaxel and its formulations Int J Pharm 235179-192 (2002)
(53) N Maurer D B Fenske and P R Cullis Developments in liposomal drug delivery systems Expert Opin Biol Ther 1923-947 (2001)
(54) R G Strickley Solubilizing excipients in oral and injectable formulations Pharm Res 21201-230 (2004)
(55) A G Floyd Top ten considerations in the development of parenteral emulsions 4134-143 (1999)
(56) M J Lawrence and G D Rees Microemulsion-based media as novel drug delivery systems Adv Drug Deliv Rev 4589-121 (2000)
(57) E Merisko-Liversidge G G Liversidge and E R Cooper Nanosizing a formulation approach for poorly-water-soluble compounds Eur J Pharm Sci 18113-120 (2003)
(58) E B Rabinow Nanosuspensions in drug delivery Nature Rev Drug Discov 3785-796 (2004)
(59) H Karl A good practice guide to the administration of substances and removal of blood including routes and volumes J Appl Toxicol 2115-23 (2001)
(60) D M Woodcock S Jefferson M E Linsenmeyer P J Crowther G M Chojnowski B Williams and I Bertoncello Reversal of the multidrug resistance phenotype with Cremophor EL a common vehicle for water-insoluble vitamins and drugs Cancer Res 504199-4203 (1990)
(61) D M Woodcock M E Linsenmeyer G Chojnowski A B Kriegler V Nink L K Webster and W H Sawyer Reversal of multidrug resistance by surfactants Br J Cancer 6662-68 (1992)
(62) J M Dintaman and J A Silverman Inhibition of P-glycoprotein by D-alpha-tocopheryl polyethylene glycol 1000 succinate (TPGS) Pharm Res 161550-1556 (1999)
(63) K R W A S C Wandel C Inactive ingredients may alter bioavailability of drugs through effects on P-glycoprotein (PGP) and CYP3A Clin Pharmacol Ther 69P71 (2001)
(64) A N Abulrob M Mason R Bryce and M Gumbleton The effect of fatty acids and analogues upon intracellular levels of doxorubicin in cells displaying P-glycoprotein mediated multidrug resistance J Drug Target 8247-256 (2000)
(65) G Cornaire J F Woodley S Saivin J Y Legendre S Decourt A Cloarec and G Houin Effect of polyoxyl 35 castor oil and polysorbate 80 on the intestinal absorption of digoxin in vitro Arzneimittelforschung 50576-579 (2000)
(66) E D Hugger B L Novak P S Burton K L Audus and R T Borchardt A comparison of commonly used polyethoxylated pharmaceutical excipients on their ability to inhibit P-glycoprotein activity in vitro J Pharm Sci 911991-2002 (2002)
(67) J Zastre J Jackson M Bajwa R Liggins F Iqbal and H Burt Enhanced cellular accumulation of a P-glycoprotein substrate rhodamine-123 by Caco-2 cells using low molecular weight methoxypolyethylene glycol-block-polycaprolactone diblock copolymers Eur J Pharm Biopharm 54299-309 (2002)
(68) A V Kabanov E V Batrakova and D W Miller Pluronic block copolymers as modulators of drug efflux transporter activity in the blood-brain barrier Adv Drug Deliv Rev 55151-164 (2003)
59
(69) D W Miller E V Batrakova and A V Kabanov Inhibition of multidrug resistance-associated protein (MRP) functional activity with pluronic block copolymers Pharm Res 16396-401 (1999)
(70) K Yunomae H Arima F Hirayama and K Uekama Involvement of cholesterol in the inhibitory effect of dimethyl-beta-cyclodextrin on P-glycoprotein and MRP2 function in Caco-2 cells FEBS Lett 536225-231 (2003)
(71) M M Nerurkar P S Burton and R T Borchardt The use of surfactants to enhance the permeability of peptides through Caco-2 cells by inhibition of an apically polarized efflux system Pharm Res 13528-534 (1996)
(72) R J Mountfield S Senepin M Schleimer I Walter and B Bittner Potential inhibitory effects of formulation ingredients on intestinal cytochrome P450 Int J Pharm 21189-92 (2000)
(73) B M Johnson W N Charman and C J Porter An in vitro examination of the impact of polyethylene glycol 400 Pluronic P85 and vitamin E d-alpha-tocopheryl polyethylene glycol 1000 succinate on P-glycoprotein efflux and enterocyte-based metabolism in excised rat intestine AAPS PharmSci 4E40 (2002)
(74) R C Bravo Gonzalez J Huwyler F Boess I Walter and B Bittner In vitro investigation on the impact of the surface-active excipients Cremophor EL Tween 80 and Solutol HS 15 on the metabolism of midazolam Biopharm Drug Dispos 2537-49 (2004)
(75) A G Bagnarello L A Lewis M C McHenry A J Weinstein H K Naito A J McCullough R J Lederman and T L Gavan Unusual serum lipoprotein abnormality induced by the vehicle of miconazole N Engl J Med 296497-499 (1977)
(76) H K Naito and L A Lewis Induced hyperlipidemia and delipidation of serum alpha-lipoproteins by polyethoxylated castor oil Protides Biol Fluids 25COM2-398 (1978)
(77) H K Naito M C McHenry and L A Lewis Drug-induced dyslipoproteinemia a report of two cases Clin Chem 26163-168 (1980)
(78) M Hacker M Koeferl C B Hong and M A Fagan Cremophor and Emulphor induced alterations of serum lipids and lipoprotein electrophoretic patterns of dogs Res Commun Chem Pathol Pharmacol 31119-128 (1981)
(79) M Kongshaug L S Cheng J Moan and C Rimington Interaction of Cremophor EL with human plasma Int J Biochem 23473-478 (1991)
(80) K Woodburn and D Kessel The alteration of plasma lipoproteins by Cremophor EL J Photochem Photobiol B 22197-201 (1994)
(81) D Kessel K Woodburn D Decker and E Sykes Fractionation of Cremophor EL delineates components responsible for plasma lipoprotein alterations and multidrug resistance reversal Oncol Res 7207-212 (1995)
(82) E Sykes K Woodburn D Decker and D Kessel Effects of Cremophor EL on distribution of Taxol to serum lipoproteins Br J Cancer 70401-404 (1994)
(83) G M Garbo The use of liposomes emulsions or inclusion complexes may potentiate in vivo effects of SnET2 Proc SPIE 1203118-125 (1990)
(84) D Kessel A Morgan and G M Garbo Sites and efficacy of photodamage by tin etiopurpurin in vitro using different delivery systems Photochem Photobiol 54193-196 (1991)
(85) K Woodburn C K Chang S Lee B Henderson and D Kessel Biodistribution and PDT efficacy of a ketochlorin photosensitizer as a function of the delivery vehicle Photochem Photobiol 60154-159 (1994)
(86) L K Webster E J Cosson K H Stokes and M J Millward Effect of the paclitaxel vehicle Cremophor EL on the pharmacokinetics of doxorubicin and doxorubicinol in mice Br J Cancer 73522-524 (1996)
(87) T Colombo P O Gonzalez M Zucchetti A Maneo C Sessa A Goldhirsch M DIncalci and M Maneo Paclitaxel induces significant changes in epidoxorubicin distribution in mice Ann Oncol 7801-805 (1996)
(88) T Colombo I Parisi M Zucchetti C Sessa A Goldhirsch and M DIncalci Pharmacokinetic interactions of paclitaxel docetaxel and their vehicles with doxorubicin Ann Oncol 10391-395 (1999)
(89) M J Millward L K Webster D Rischin K H Stokes G C Toner J F Bishop I N Olver B M Linahan M E Linsenmeyer and D M Woodcock Phase I trial of cremophor EL with bolus doxorubicin Clin Cancer Res 42321-2329 (1998)
60
(90) J Liu E H Kraut S Balcerzak M Grever S DAmbrosio and K K Chan Dosing sequence-dependent pharmacokinetic interaction of oxaliplatin with paclitaxel in the rat Cancer Chemother Pharmacol 50445-453 (2002)
(91) A Sparreboom O van Tellingen W J Nooijen and J H Beijnen Nonlinear pharmacokinetics of paclitaxel in mice results from the pharmaceutical vehicle Cremophor EL Cancer Res 562112-2115 (1996)
(92) A G Ellis and L K Webster Inhibition of paclitaxel elimination in the isolated perfused rat liver by Cremophor EL Cancer Chemother Pharmacol 4313-18 (1999)
(93) L Gianni L Vigano A Locatelli G Capri A Giani E Tarenzi and G Bonadonna Human pharmacokinetic characterization and in vitro study of the interaction between doxorubicin and paclitaxel in patients with breast cancer J Clin Oncol 151906-1915 (1997)
(94) A Sparreboom L van Zuylen E Brouwer W J Loos P de Bruijn H Gelderblom M Pillay K Nooter G Stoter and J Verweij Cremophor EL-mediated alteration of paclitaxel distribution in human blood clinical pharmacokinetic implications Cancer Res 591454-1457 (1999)
(95) L van Zuylen J Verweij and A Sparreboom Role of formulation vehicles in taxane pharmacology Invest New Drugs 19125-141 (2001)
(96) D Kessel Properties of Cremophor EL micelles probed by fluorescence Photochem Photobiol 56447-451 (1992)
(97) W J Loos J Szebeni A J ten Tije J Verweij D M van Zomeren K N Chung K Nooter G Stoter and A Sparreboom Preclinical evaluation of alternative pharmaceutical delivery vehicles for paclitaxel Anticancer Drugs 13767-775 (2002)
(98) Dhanikula AB Singh DR and Panchagnula R In vivo pharmacokinetic and tissue distribution studies in mice of alternative formulations for local and systemic delivery of paclitaxel gel film prodrug liposomes and micelles Curr Drug Deliv 235-44 (2005)
(99) Solvent-free paclitaxel formulation better than taxol Scrip (S00825922 20031209) 2003 (100) L Vigano A Locatelli G Grasselli and L Gianni Drug interactions of paclitaxel and
docetaxel and their relevance for the design of combination therapy Invest New Drugs 19179-196 (2001)
(101) R Danesi F Innocenti S Fogli A Gennari E Baldini A Di Paolo B Salvadori G Bocci P F Conte and M Del Tacca Pharmacokinetics and pharmacodynamics of combination chemotherapy with paclitaxel and epirubicin in breast cancer patients Br J Clin Pharmacol 53508-518 (2002)
(102) S Fogli R Danesi A Gennari S Donati P F Conte and M Del Tacca Gemcitabine epirubicin and paclitaxel pharmacokinetic and pharmacodynamic interactions in advanced breast cancer Ann Oncol 13919-927 (2002)
(103) T Kasai M Oka H Soda J Tsurutani M Fukuda Y Nakamura S Kawabata K Nakatomi S Nagashima H Takatani M Fukuda A Kinoshita and S Kohno Phase I and pharmacokinetic study of paclitaxel and irinotecan for patients with advanced non-small cell lung cancer Eur J Cancer 381871-1878 (2002)
(104) B L Lum S Kaubisch A M Yahanda K M Adler L Jew M N Ehsan N A Brophy J Halsey M P Gosland and B I Sikic Alteration of etoposide pharmacokinetics and pharmacodynamics by cyclosporine in a phase I trial to modulate multidrug resistance J Clin Oncol 101635-1642 (1992)
(105) N J Lacayo B L Lum D L Becton H Weinstein Y Ravindranath M N Chang L Bomgaars S J Lauer B I Sikic and G V Dahl Pharmacokinetic interactions of cyclosporine with etoposide and mitoxantrone in children with acute myeloid leukemia Leukemia 16920-927 (2002)
(106) D A Rushing S R Raber K A Rodvold S C Piscitelli G S Plank and D A Tewksbury The effects of cyclosporine on the pharmacokinetics of doxorubicin in patients with small cell lung cancer Cancer 74834-841 (1994)
(107) B L Samuels R Mick N J Vogelzang S F Williams R L Schilsky A R Safa S M OBrien and M J Ratain Modulation of vinblastine resistance with cyclosporine a phase I study Clin Pharmacol Ther 54421-429 (1993)
61
(108) D J Boote I F Dennis P R Twentyman R J Osborne C Laburte S Hensel J F Smyth M H Brampton and N M Bleehen Phase I study of etoposide with SDZ PSC 833 as a modulator of multidrug resistance in patients with cancer J Clin Oncol 14610-618 (1996)
(109) H Minami T Ohtsu H Fujii T Igarashi K Itoh N Uchiyama-Kokubu T Aizawa T Watanabe Y Uda Y Tanigawara and Y Sasaki Phase I study of intravenous PSC-833 and doxorubicin reversal of multidrug resistance Jpn J Cancer Res 92220-230 (2001)
(110) M Jin T Shimada K Yokogawa M Nomura Y Mizuhara H Furukawa J Ishizaki and K Miyamoto Cremophor EL releases cyclosporin A adsorbed on blood cells and blood vessels and increases apparent plasma concentration of cyclosporin A Int J Pharm 293137-144 (2005)
(111) M E Davis and M E Brewster Cyclodextrin-based pharmaceutics past present and future Nat Rev Drug Discov 31023-1035 (2004)
(112) V J Stella V M Rao E A Zannou and V Zia V Mechanisms of drug release from cyclodextrin complexes Adv Drug Deliv Rev 363-16 (1999)
(113) H W Frijlink A C Eissens N R Hefting K Poelstra C F Lerk and D K Meijer The effect of parenterally administered cyclodextrins on cholesterol levels in the rat Pharm Res 89-16 (1991)
(114) H W Frijlink E J Franssen A C Eissens R Oosting C F Lerk and D K Meijer The effects of cyclodextrins on the disposition of intravenously injected drugs in the rat Pharm Res 8380-384 (1991)
(115) E E Sideris M A Koupparis and P E Macheras Effect of cyclodextrins on protein binding of drugs the diflunisalhydroxypropyl-beta-cyclodextrin model case Pharm Res 1190-95 (1994)
(116) P Y Grosse F Bressolle P Rouanet and J M Joulia Methyl-beta-cyclodextrin and doxorubicin pharmacokinetics and tissue concentrations following bolus injection of these drugs alone or together in the rabbit Int J Pharm 180215-223 (1999)
(117) T Shinoda S Kagatani A Maeda Y Konno H Hashimoto K Hara K Fujita and T Sonobe Sugar-branched-cyclodextrins as injectable drug carriers in mice Drug Dev Ind Pharm 251185-1192 (1999)
(118) B McCormack and G Gregoriadis Comparative studies of the fate of free and liposome-entrapped hydroxypropyl-beta-cyclodextrindrug complexes after intravenous injection into rats implications in drug delivery Biochim Biophys Acta 1291237-244 (1996)
(119) A Sharma K Anderson and J W Baker Flocculation of serum lipoproteins with cyclodextrins application to assay of hyperlipidemic serum Clin Chem 36529-532 (1990)
(120) A Sharma and L S Janis Lipoprotein-cyclodextrin interaction Clin Chim Acta 199129-137 (1991)
(121) T Irie M Otagiri M Sunada K Uekama Y Ohtani Y Yamada and Y Sugiyama Cyclodextrin-induced hemolysis and shape changes of human erythrocytes in vitro J Pharmacobiodyn 5741-744 (1982)
(122) M E Brewster W R Anderson D Meinsma D Moreno A I Webb L Pablo K S Estes H Derendorf N Bodor R Sawchuk B Cheung and E Pop Intravenous and oral pharmacokinetic evaluation of a 2-hydroxypropyl-beta-cyclodextrin-based formulation of carbamazepine in the dog comparison with commercially available tablets and suspensions J Pharm Sci 86335-339 (1997)
(123) K Dietzel K S Estes M E Brewster N S Bodor and H Derendorf The use of 2-hydroxypropyl-beta-cyclodextrin as a vehicle for intravenous administration of dexamethasone in dogs Int J Pharm 59225-230 (1990)
(124) J Cummings G J Forrest D Cunningham N L Gilchrist and M Soukop Influence of polysorbate 80 (Tween 80) and etoposide (VP-16-213) on the pharmacokinetics and urinary excretion of adriamycin and its metabolites in cancer patients Cancer Chemother Pharmacol 1780-84 (1986)
(125) W J Loos S D Baker J Verweij J G Boonstra and A Sparreboom Clinical pharmacokinetics of unbound docetaxel role of polysorbate 80 and serum proteins Clin Pharmacol Ther 74364-371 (2003)
62
(126) O van Tellingen J H Beijnen J Verweij E J Scherrenburg W J Nooijen and A Sparreboom Rapid esterase-sensitive breakdown of polysorbate 80 and its impact on the plasma pharmacokinetics of docetaxel and metabolites in mice Clin Cancer Res 52918-2924 (1999)
(127) K Woodburn E Sykes and D Kessel Interactions of Solutol HS 15 and Cremophor EL with plasma lipoproteins Int J Biochem Cell Biol 27693-699 (1995)
(128) J M Grindel T Jaworski R M Emanuele and P Culbreth Pharmacokinetics of a novel surface-active agent purified poloxamer 188 in rat rabbit dog and man Biopharm Drug Dispos 2387-103 (2002)
(129) T W Guentert S Oie L Paalzow B M Frey R Brandt L J Aarons and M Rowland Interaction of mixed micelles formed from glycocholic acid and lecithin with the protein binding of various drugs Br J Clin Pharmacol 23569-577 (1987)
(130) P R Cullis A Chonn and S C Semple Interactions of liposomes and lipid-based carrier systems with blood proteins Relation to clearance behaviour in vivo Adv Drug Deliv Rev 323-17 (1998)
(131) P Opanasopit M Nishikawa and M Hashida Factors affecting drug and gene delivery effects of interaction with blood components Crit Rev Ther Drug Carrier Syst 19191-233 (2002)
(132) L Araujo R Lobenberg and J Kreuter Influence of the surfactant concentration on the body distribution of nanoparticles J Drug Target 6373-385 (1999)
(133) S Stolnik B Daudali A Arien J Whetstone C R Heald M C Garnett S S Davis and L Illum The effect of surface coverage and conformation of poly(ethylene oxide) (PEO) chains of poloxamer 407 on the biological fate of model colloidal drug carriers Biochim Biophys acta 1514261-279 (2001)
(134) J F Krzyzaniak D M Raymond and S H Yalkowsky Lysis of human red blood cells 2 Effect of contact time on cosolvent induced hemolysis Int J Pharm 152193-200 (1997)
(135) F Mottu M J Stelling D A Rufenacht and E Doelker Comparative hemolytic activity of undiluted organic water-miscible solvents for intravenous and intra-arterial injection PDA J Pharm Sci Technol 5516-23 (2001)
(136) E Soderlind M Wollbratt and C von Corswant The usefulness of sugar surfactants as solubilizing agents in parenteral formulations Int J Pharm 25261-71 (2003)
(137) B Nuijen M Bouma C Manada J M Jimeno A Bult and J H Beijnen In vitro hemolysis and buffer capacity studies with the novel marine anticancer agent kahalalide F and its reconstitution vehicle Cremophor ELethanol PDA J Pharm Sci Technol 55223-229 (200)
(138) R A Rajewski G Traiger J Bresnahan P Jaberaboansari V J Stella and D O Thompson Preliminary safety evaluation of parenterally administered sulfoalkyl ether beta-cyclodextrin derivatives J Pharm Sci 84927-932 (1995)
(139) T M Florence and J L Stauber Hemolysis of human erythrocytes by alpha-tocopheryl succinate J Nutrit Environ Med 8345-347 (1998)
(140) J Neuzil M Zhao G Ostermann M Sticha N Gellert C Weber J W Eaton and U T Brunk Alpha-tocopheryl succinate an agent with in vivo anti-tumour activity induces apoptosis by causing lysosomal instability Biochem J 362709-715 (2002)
(141) S H Wu and W K Hopkins Characteristics of d-a-tocopheryl PEG 1000 succinate for applications as an absorption enhancer in drug delivery systems Pharm Technol 2352-68 (1999)
(142) H W Frijlink J Visser N R Hefting R Oosting D K Meijer and C F Lerk The pharmacokinetics of beta-cyclodextrin and hydroxypropyl-beta-cyclodextrin in the rat Pharm Res 71248-1252 (1990)
(143) V J Stella and R A Rajewski Cyclodextrins their future in drug formulation and delivery Pharm Res 14556-567 (1997)
(144) In P K Gupta and G A Brazeau (eds) Injectable drug development techniques to reduce pain and irritation Interpharm Press Denver Colorado 1999
(145) B Davies and T Morris Physiological parameters in laboratory animals and humans Pharm Res 101093-1095 (1993)
63
References to internal reports of Novartis Pharma AG
(146) In vitro blood distribution and plasma protein binding of [3H]COM1 including stability in blood and plasma for rat and human PCS(EU) R0400014 Preclinical Safety Novartis Pharma AG Basel Switzerland 14-May-2004
(147) In vitro blood distribution and stability of [3H]COM2 for mouse rat and human PCS(EU) R0201077 Preclinical Safety Novartis Pharma AG Basel Switzerland 07-May-2003
(148) In vitro blood distribution plasma protein binding and stability in blood and plasma of [3H]COM3 for mouse rat dog cynomolgus monkey and human DMPK R0400595 Drug Metabolism and Pharmacokinetics Novartis Pharma AG Basel Switzerland 01-Feb-2005
(149) In vitro blood distribution and plasma protein binding of [14C]COM4 and stability in blood and plasma for rat ferret dog monkey and human PCS(EU) R0201539 Preclinical Safety Novartis Pharma AG Basel Switzerland 24-Sep-2003
(150) In vitro blood distribution plasma protein binding and stability in blood of [14C]COM5 for mouse rat dog and human PCS(EU) R0201107 Preclinical Safety Novartis Pharma AG Basel Switzerland 14-May-2003
(151) Absorption distribution and excretion of [14C]COM5 after single intravenous (1 mLkg) and oral (3 mgkg) administration to rat PCS(EU) R0201108 Preclinical Safety Novartis Pharma AG Basel Switzerland 19-May-2003
(152) ADME in rat after oral (08 mgkg) and intravenous (04 mgkg) administration of [14C]COM4 PCS(EU) R0201540 Preclinical Safety Novartis Pharma AG Basel Switzerland 19-Dec-2003
(153) Blood pharmacokinetics tissue distribution and excretion of [3H]COM2 in OF1 normal male mice and brain penetration of [3H]COM2 in APP23 transgenic and wild-type female mice after single intravenous (4 microgkg) administration PCS(EU) R0201082 Preclinical Safety Novartis Pharma AG Basel Switzerland 08-May-2003
64
8 Appendix
Raw data of COM1 in rat
In vitro blood distribution of [3H]COM1 using blood pools with different hematocrits
Total radioactivity concentration determined in blood and plasma
Excipient Nominal COM1 H Incubation Actual values
in blood time (pg-eqmL mean plusmnSD n=3) in blood (pgmL) (min) Blood Plasma
None 60 048 0 53 plusmn 1 76 plusmn 1 (Glu) 5 53 plusmn 1 75 plusmn 0 10 52 plusmn 1 74 plusmn 1 20 52 plusmn 0 74 plusmn 1 6000 0 5335 plusmn 80 7835 plusmn 121 5 5637 plusmn 116 7784 plusmn 103 10 5576 plusmn 40 7598 plusmn 114 20 5502 plusmn 76 7502 plusmn 98 HP-β-CyD 05 60 048 0 62 plusmn 1 97 plusmn 0 5 62 plusmn 1 96 plusmn 1 10 62 plusmn 1 94 plusmn 1 20 62 plusmn 0 93 plusmn 1 6000 0 6564 plusmn 21 10052 plusmn 31 5 6550 plusmn 30 10057 plusmn 214 10 6434 plusmn 85 9896 plusmn 66 20 6280 plusmn 213 9918 plusmn 80 5 60 045 0 64 plusmn 0 102 plusmn 1 5 65 plusmn 1 102 plusmn 1 10 63 plusmn 1 102 plusmn 1 20 64 plusmn 1 101 plusmn 1 6000 0 6516 plusmn 132 10660 plusmn 26 5 6598 plusmn 273 10762 plusmn 382 10 6475 plusmn 288 10454 plusmn 163 20 6653 plusmn 79 10482 plusmn 130 SHS 05 60 048 0 60 plusmn 2 86 plusmn 2 5 60 plusmn 0 94 plusmn 19 10 60 plusmn 1 81 plusmn 1 20 60 plusmn 0 81 plusmn 1 6000 0 6265 plusmn 40 8845 plusmn 102 5 6240 plusmn 92 8562 plusmn 44 10 6127 plusmn 110 8432 plusmn 35 20 6104 plusmn 112 8109 plusmn 122 5 60 045 0 59 plusmn 1 93 plusmn 1 5 58 plusmn 1 92 plusmn 0 10 56 plusmn 1 91 plusmn 1 20 58 plusmn 1 91 plusmn 1 6000 0 6166 plusmn 65 9908 plusmn 44 5 6180 plusmn 162 9607 plusmn 123 10 6230 plusmn 99 9529 plusmn 119 20 6189 plusmn 104 9489 plusmn 211
65
In vitro blood distribution of [3H]COM1 continued
Excipient Nominal COM1 H Incubation Actual values
in blood time (pg-eqmL mean plusmnSD n=3) in blood (pgmL) (min) Blood Plasma
TPGS 05 60 048 0 59 plusmn 1 92 plusmn 1 5 58 plusmn 1 90 plusmn 1 10 58 plusmn 1 88 plusmn 2 20 58 plusmn 0 87 plusmn 1 6000 0 5494 plusmn 102 8949 plusmn 87 5 5518 plusmn 124 8549 plusmn 165 10 5552 plusmn 74 8387 plusmn 101 20 5431 plusmn 23 8286 plusmn 71 5 60 040 0 50 plusmn 1 81 plusmn 1 5 50 plusmn 1 80 plusmn 1 10 50 plusmn 0 79 plusmn 1 20 50 plusmn 1 72 plusmn 1 6000 0 5042 plusmn 20 8175 plusmn 148 5 5014 plusmn 34 7907 plusmn 136 10 5102 plusmn 59 7952 plusmn 77 20 5069 plusmn 68 7204 plusmn 35 Triplicate analyses were conducted on one aliquot for each time point
In vitro protein binding of [3H]COM1 using the same plasma pool
Total radioactivity concentration determined in plasma and ultrafiltrate samples
Excipient Nominal COM1 Actual values (pg-eqmL) in plasma (pgmL) Plasma Ultrafiltrate None 60 65 26 (Glu) 26 26 6000 6302 270 268 272 TPGS 05 60 62 27 21 29 6000 5708 171 230 133 5 60 67 12 13 11 6000 5886 187 103 68 Mean of duplicate determination of plasma spiked with different COM1 stock solutions
66
Tissue and plasma levels of parent drug and total radioactivity after iv administration of [3H]COM1 (4 microgkg) in the control group
Time Tissue Individual concentration values
(h) COM1 (pgg) Radioactivity (pg-eqg) 008 Plasma 866 381 958 2529 1871 2052 Lung 2012 1440 1867 3431 2224 2538 Heart 2366 973 1619 2593 1490 1808 Liver 1069 384 724 11805 9501 10699 Kidney 2263 995 1692 6350 5770 5281 Fat 2803 1982 4753 2638 2213 4859 Muscle 1405 811 1234 1312 882 1172 Skin 433 225 296 937 524 583 Brain 6229 4525 4712 5431 4004 4053 025 Plasma 275 257 178 1719 1482 1366 Lung 399 607 518 1491 1378 1374 Heart 517 645 285 1034 1023 778 Liver 274 511 238 7904 6502 6920 Kidney 557 664 321 5270 5046 5425 Fat 6508 5897 4206 5953 5307 4112 Muscle 565 574 306 659 686 463 Skin 228 213 219 581 702 570 Brain 3407 4085 3014 3033 3552 2719 05 Plasma 179 103 101 1525 1442 1379 Lung 622 367 335 1365 1089 1030 Heart 310 211 214 684 684 661 Liver 138 71 100 7090 5263 4993 Kidney 345 220 202 4924 4585 5053 Fat 8008 4790 4248 6586 4071 3649 Muscle 270 159 166 409 349 342 Skin 199 64 104 559 449 480 Brain 2676 2419 2123 2310 2180 1953 pgmL and pg-eqmL
67
Tissue and plasma levels of parent drug and total radioactivity after iv administration of [3H]COM1 (4 microgkg) in the TPGS group
Time Tissue Individual concentration values
(h) COM1 (pgg) Radioactivity (pg-eqg) 008 Plasma 312 297 278 2842 2939 3006 Lung 1370 1173 1560 2364 2057 2272 Heart 1190 971 912 1584 1262 1291 Liver 449 234 337 10459 8898 10720 Kidney 1012 768 806 5047 4767 4829 Fat 2182 1485 1860 2712 2380 1703 Muscle 845 726 1132 880 720 1046 Skin 100 45 53 665 351 343 Brain 4072 2765 3083 3816 2353 2709 025 Plasma 89 107 121 2040 2440 2368 Lung 531 688 546 1343 1488 1356 Heart 351 471 454 737 864 851 Liver 104 205 170 5354 6770 5184 Kidney 321 435 446 6931 4972 6603 Fat 1352 3916 1578 1456 4764 2035 Muscle 355 649 588 532 789 675 Skin 71 72 37 563 518 342 Brain 1811 2327 1955 1648 2017 1841 05 Plasma 35 65 61 2027 2054 2186 Lung 214 195 319 1172 1067 1115 Heart 167 207 250 539 566 650 Liver 75 70 117 4225 4417 4314 Kidney 197 209 215 6923 6364 5600 Fat 3406 2067 2295 3071 1625 2734 Muscle 191 226 256 343 394 368 Skin 120 52 41 515 389 398 Brain 1516 1332 1541 1413 1295 1480 pgmL and pg-eqmL
Ex vivo protein binding of [3H]COM1 in the control and TPGS group
Parent drug concentration determined in plasma and ultrafiltrate
Dose Time Individual values (pgmL)
(microgkg) (h) Plasma Ultrafiltrate Control group 4 008 794 169 169 025 249 55 51 050 137 27 26 TPGS group 27 008 331 127 120 025 120 41 44 050 60 25 24 Mean of duplicate determination of plasma pooled for each time point
68
Raw data of COM2 in mouse
In vitro blood distribution of [3H]COM2 using blood pools with different hematocrits
Total radioactivity concentration determined in blood and plasma
Excipient Nominal COM2 H Incubation Actual values
in blood time (pg-eqmL mean plusmnSD n=3) (pgmL) (min) Blood Plasma
None 100 045 5 115 plusmn 2 85 plusmn 3 (Glu) 60 115 plusmn 5 93 plusmn 4 240 112 plusmn 6 101 plusmn 2 CELEtOH 6535 100 045 5 104 plusmn 5 86 plusmn 4 60 105 plusmn 2 83 plusmn 1 240 102 plusmn 1 87 plusmn 6 100rsquo000 046 5 103797 plusmn 1430 83684 plusmn 1446 60 102979 plusmn 1547 81784 plusmn 896 240 105912 plusmn 2594 80887 plusmn 998 HP-β-CyD 100 045 5 103 plusmn 5 88 plusmn 2 60 104 plusmn 5 94 plusmn 1 240 99 plusmn 2 94 plusmn 7 100rsquo000 043 5 105176 plusmn 1165 92396 plusmn 1519 60 104609 plusmn 1238 95791 plusmn 668 240 107331 plusmn 880 96454 plusmn 1780 SHS 100 045 5 101 plusmn 1 86 plusmn 1 60 99 plusmn 4 85 plusmn 1 240 105 plusmn 3 84 plusmn 3 100rsquo000 044 5 118080 plusmn 891 99140 plusmn 1915 60 116422 plusmn 2822 93052 plusmn 1190 240 116363 plusmn 890 89790 plusmn 1735 PEG 200 100 045 5 124 plusmn 4 96 plusmn 1 60 125 plusmn 6 95 plusmn 2 240 122 plusmn 2 103 plusmn 5 100rsquo000 046 5 112001 plusmn 3923 87146 plusmn 1273 60 112161 plusmn 1189 89801 plusmn 1646 240 110680 plusmn 652 90561 plusmn 1883 TPGS 100 045 5 101 plusmn 2 115 plusmn 2 60 104 plusmn 2 101 plusmn 1 240 101 plusmn 3 95 plusmn 3 100rsquo000 043 5 100911 plusmn 1443 106192 plusmn 992 60 100608 plusmn 3207 88758 plusmn 1037 240 100236 plusmn 4088 81755 plusmn 810 Triplicate analyses were conducted on one aliquot for each time point similar to previous study
In vitro protein binding of [
3H]COM2 at 10 ngmL using the same plasma pool
Parent drug concentration determined in plasma and ultracentrifugate
Excipient Actual values (pgmL) in plasma Plasma Ultracentrifugate None 9649 166 (plasma) 9278 164 9162 164 9292 164 TPGS 05 8624 116 8651 124 8722 103 8739 99
69
Tissue and plasma levels of parent drug and total radioactivity after iv administration of [3H]COM2 (04 microgkg) in the control group
Time Tissue Individual concentration values
(h) COM2 (pgg) Radioactivity (pg-eqg) 008 Plasma 110 112 91 181 194 164 Lung 1964 1955 1504 2450 2199 1704 Heart 796 830 623 1074 950 741 Liver 2398 2387 1778 3112 3022 2360 Kidney 2083 1871 1327 2276 2024 1511 Fat 140 327 230 58 540 603 Muscle 124 170 203 160 218 234 Skin 0 35 10 14 76 32 Brain 1155 1112 1018 1097 1086 1046 025 Plasma 94 71 77 164 141 139 Lung 1344 908 1365 1648 1849 1759 Heart 495 465 433 622 593 580 Liver 1579 1214 1549 2218 2161 2381 Kidney 1194 1075 1259 1468 1445 1518 Fat 714 459 778 1103 977 1218 Muscle 201 217 227 251 268 258 Skin 113 16 59 160 73 114 Brain 1060 1191 1345 1064 1150 1287 05 Plasma 60 58 58 119 113 111 Lung 720 703 842 1192 1444 1350 Heart 295 262 331 454 447 447 Liver 978 861 1040 1918 2348 2129 Kidney 757 753 932 1017 1303 1336 Fat 1014 602 973 1836 1164 2203 Muscle 187 167 189 242 252 231 Skin 87 16 18 97 129 104 Brain 1209 1006 1044 1160 1003 1044 1 Plasma 32 41 28 60 79 49 Lung 369 478 468 1465 1274 1171 Heart 154 199 205 347 377 364 Liver 591 618 534 2077 1736 1383 Kidney 471 522 451 1088 1020 846 Fat 496 444 713 1066 1458 1253 Muscle 103 80 91 171 169 146 Skin 0 38 48 138 123 122 Brain 673 832 688 826 902 806 pgmL and pg-eqmL value below LOQ
70
Tissue and plasma levels of parent drug and total radioactivity after iv administration of [3H]COM2 (04 microgkg) in the TPGS group
Time Tissue Individual concentration values
(h) COM2 (pgg) Radioactivity (pg-eqg) 008 Plasma 223 248 268 506 549 606 Lung 1789 1913 1880 2036 2137 2116 Heart 661 711 724 766 890 924 Liver 2331 2252 2360 2593 2585 2656 Kidney 1697 1831 1677 1815 2014 1839 Fat 246 150 317 362 366 740 Muscle 108 190 272 144 246 330 Skin 0 20 60 39 36 77 Brain 913 1069 1133 904 1024 1080 025 Plasma 178 148 151 403 377 394 Lung 1522 1175 1133 1820 1412 1436 Heart 489 478 452 593 597 578 Liver 1636 1743 1500 2243 2293 2130 Kidney 1112 1114 1256 1387 1415 1513 Fat 932 915 1480 1742 1392 2239 Muscle 237 222 183 290 288 283 Skin 23 0 38 144 140 96 Brain 1088 1244 1207 1004 1150 1166 05 Plasma 111 118 143 330 359 421 Lung 890 911 968 1292 1728 1599 Heart 292 385 384 420 630 570 Liver 1086 1200 1128 1901 2342 2002 Kidney 864 996 1103 1124 1584 1452 Fat 1393 ― 765 1492 ― 1576 Muscle 156 181 173 232 273 269 Skin 44 73 114 106 131 192 Brain 1048 1272 1325 1003 1298 1237 1 Plasma 79 97 63 333 296 264 Lung 669 885 512 1672 1588 1769 Heart 231 285 143 519 483 423 Liver 774 1028 798 2073 1946 2394 Kidney 726 835 659 1431 1342 1374 Fat ― 320 688 ― 1036 1712 Muscle 143 137 76 210 240 221 Skin 30 147 52 158 220 194 Brain 1141 1188 889 1204 1202 1070 pgmL and pg-eqmL value below LOQ no fat dissectible
71
Raw data of COM3 in rat
In vitro blood distribution of [3H]COM3 using the same blood pool (H 044)
Total radioactivity concentration determined in blood and plasma
Excipient Nominal COM3 Incubation Actual values
in blood time (ng-eqmL mean plusmnSD n=3) (ngmL) (min) Blood Plasma
None 5 5 46 plusmn 03 17 plusmn 0 (Glu) 30 46 plusmn 02 17 plusmn 01 60 47 plusmn 04 17 plusmn 01 500 5 511 plusmn 2 179 plusmn 0 30 507 plusmn 6 178 plusmn 2 60 512 plusmn 9 176 plusmn 2 CELEtOH 6535 5 5 49 plusmn 04 18 plusmn 01 30 49 plusmn 03 17 plusmn 0 60 51 plusmn 02 17 plusmn 0 500 5 516 plusmn 6 161 plusmn 2 30 508 plusmn 2 160 plusmn 1 60 508 plusmn 9 156 plusmn 1 HP-β-CyD 5 5 53 plusmn 02 35 plusmn 01 30 52 plusmn 04 35 plusmn 01 60 51 plusmn 0 36 plusmn 01 500 5 516 plusmn 5 324 plusmn 2 30 510 plusmn 2 320 plusmn 5 60 512 plusmn 4 326 plusmn 2 SHS 5 5 49 plusmn 02 14 plusmn 0 30 47 plusmn 01 15 plusmn 0 60 49 plusmn 03 16 plusmn 0 500 5 498 plusmn 10 143 plusmn 0 30 506 plusmn 14 143 plusmn 3 60 498 plusmn 1 144 plusmn 1 PEG 200 5 5 49 plusmn 04 17 plusmn 01 30 51 plusmn 01 17 plusmn 01 60 48 plusmn 01 18 plusmn 01 500 5 520 plusmn 7 169 plusmn 1 30 510 plusmn 9 170 plusmn 2 60 518 plusmn 6 176 plusmn 3 EtOHPEG200Glu 5 5 46 plusmn 03 18 plusmn 01 5590 30 43 plusmn 02 18 plusmn 01 60 44 plusmn 01 18 plusmn 01 500 5 535 plusmn 10 188 plusmn 1 30 535 plusmn 10 194 plusmn 2 60 538 plusmn 8 192 plusmn 1 TPGS 5 5 52 plusmn 03 23 plusmn 0 30 51 plusmn 0 22 plusmn 01 60 51 plusmn 0 24 plusmn 03 500 5 546 plusmn 3 231 plusmn 3 30 542 plusmn 6 231 plusmn 2 60 551 plusmn 5 231 plusmn 2 Triplicate analyses were conducted on one aliquot for each time point
72
In vitro protein binding of [3H]COM3 using the same plasma pool
Excipient Nominal COM3 Actual values
in plasma (ng-eqmL) (ngmL) Plasma Ultrafiltrate None 5 58 067 (Glu) 076 068 500 512 63 63 62 HP-β-CyD 5 54 22 21 22 500 538 214 216 209 EtOHPEG200Glu 5 5590 5 52 066 067 065 500 552 66 66 64 Mean of duplicate determination of plasma spiked with different COM3 stock solutions
Ex vivo protein binding of [3H]COM3 in the control and HP-β-CyD group
Parent drug concentration determined in plasma amp ultrafiltrate
Time Individual values (pgmL)
(h) Plasma Ultrafiltrate Control group 008 168 11 13 05 46 04 1 35 03 HP-β-CyD group 008 97 25 23 05 54 08 07 1 34 02 03 Mean of duplicate determination of plasma pooled for each time point
73
Circulation and tissue levels of parent drug and total radioactivity after iv administration of [3H]COM3 (03 mgkg) in the control group
Time Tissue Individual concentration values
(h) COM3 (ngg) Radioactivity (ng-eqg) 008 Blood 39 42 57 60 63 81 Plasma 15 19 19 38 40 41 Liver 1196 1394 1645 2097 2517 2767 Kidney 1760 1646 2019 2354 2286 2677 Fat 152 137 95 193 176 97 Heart 536 534 722 668 676 927 Lung 5712 5711 7113 8073 7897 9688 Muscle 152 112 105 161 112 98 Skin 209 139 85 216 136 86 Brain 1048 1062 1382 1323 1334 1736 05 Blood 20 13 18 75 85 83 Plasma 8 5 6 89 115 104 Liver 644 419 700 2619 2716 2654 Kidney 671 400 692 1162 843 1144 Fat 66 45 59 89 80 83 Heart 210 125 199 296 201 278 Lung 2425 1317 2267 3403 1811 2947 Muscle 222 98 144 282 144 185 Skin 103 81 99 131 119 164 Brain 1002 803 909 1260 996 1164 1 Blood 11 11 10 80 70 60 Plasma 4 5 4 105 99 74 Liver 383 427 373 1866 2152 2030 Kidney 345 405 320 707 758 659 Fat 30 31 33 49 52 53 Heart 106 126 102 161 188 157 Lung 1158 1092 1340 1680 1539 1817 Muscle 96 109 92 154 167 149 Skin 55 85 63 118 148 129 Brain 647 691 622 811 875 775 pgmL and pg-eqmL
74
Circulation and tissue levels of parent drug and total radioactivity after iv administration of [3H]COM3 (03 mgkg) in the HP-β-CyD group
Time Tissue Individual concentration values
(h) COM3 (ngg) Radioactivity (ng-eqg) 008 Blood 34 31 32 53 52 48 Plasma 12 10 10 29 32 28 Liver 850 1052 1271 1181 1665 1901 Kidney 1413 1330 1474 1770 1611 1778 Fat 68 85 103 70 99 121 Heart 592 500 598 719 593 725 Lung 4669 4377 4739 6069 5352 5939 Muscle 151 147 129 159 157 129 Skin 84 64 nd 66 49 nd Brain 954 990 908 1125 1165 1087 05 Blood 19 18 17 74 70 82 Plasma 6 6 6 77 75 96 Liver 617 558 677 2110 2107 2159 Kidney 524 417 496 743 652 810 Fat 47 39 51 59 51 68 Heart 212 178 169 276 233 222 Lung 2355 2513 2258 2931 3032 2853 Muscle 137 137 116 172 169 143 Skin 32 37 50 52 65 135 Brain 733 743 822 895 864 958 1 Blood 11 10 10 65 69 71 Plasma 4 3 4 77 87 92 Liver 344 nd 336 1765 nd 1597 Kidney 300 251 328 515 454 617 Fat 28 19 20 41 43 44 Heart 106 98 94 143 153 143 Lung 1257 926 976 1582 1205 1237 Muscle 98 98 59 133 161 84 Skin 29 27 23 49 110 68 Brain 606 604 588 734 726 697 pgmL and pg-eqmL not determined due to glas vial broken by homogenization
In situ bladder catheterization of [14
C]COM3 in the control and HP-β-CyD group
Time Urinary concentration Urine excreted
(h) COM3 (ngmL) Radioactivity (ng-eqmL) (g) Control 05 190 331 7226 13857 0685 0350 group 1 721 339 17998 12039 0460 0439 15 88 151 2855 7869 1130 0477 2 64 134 2435 9293 0790 0261 HP-β-CyD 05 1911 5216 4903 3523 13028 12248 2635 0851 0784 group 1 7900 524 2965 44618 5086 27031 0119 1068 0265 15 4209 899 1268 40724 18439 19080 0111 0188 0267 2 1993 184 597 31856 7994 11100 0124 0412 0335 Rat Ndeg3 died during in situ experiment
75
Raw data of COM4 in rat
In vitro blood distribution of [14
C]COM4 at 100 ngmL using the same blood pool (H 044) Total radioactivity concentration determined in blood and plasma
Excipient Incubation Actual values
time (ng-eqmL mean plusmnSD n=3) in blood (min) Blood Plasma None 05 5 98 plusmn 2 169 plusmn 0 (saline) 30 98 plusmn 1 167 plusmn 1 60 98 plusmn 2 168 plusmn 3 CEL 05 5 99 plusmn 0 147 plusmn 0 30 99 plusmn 2 135 plusmn 2 60 98 plusmn 1 128 plusmn 1 1 5 103 plusmn 1 139 plusmn 1 30 104 plusmn 0 125 plusmn 1 60 104 plusmn 2 120 plusmn 2 HP-β-CyD 05 5 125 plusmn 2 202 plusmn 1 30 125 plusmn 1 201 plusmn 3 60 124 plusmn 0 199 plusmn 3 1 5 116 plusmn 2 171 plusmn 3 30 117 plusmn 3 171 plusmn 2 60 117 plusmn 2 170 plusmn 3 SHS 05 5 110 plusmn 2 165 plusmn 2 30 110 plusmn 1 155 plusmn 1 60 110 plusmn 1 153 plusmn 3 1 5 112 plusmn 1 150 plusmn 2 30 112 plusmn 3 150 plusmn 1 60 112 plusmn 0 148 plusmn 2 Triplicate analyses were conducted on one aliquot for each time point
76
In vitro protein binding of [14
C]COM4 at 100 ngmL using the same plasma pool Total radioactivity concentration determined in plasma and ultrafiltrate
Excipient Actual values
(pg-eqmL) in plasma Plasma Ultrafiltrate None 97 25 (saline) 23 22 CEL 001 105 25 24 23 01 117 36 38 35 05 102 115 109 113 1 97 254 250 249 HP-β-CyD 001 99 27 25 24 01 102 43 47 43 05 134 131 133 131 1 112 172 151 150 SHS 001 99 25 22 22 01 101 34 31 33 05 116 115 111 112 1 112 171 174 167 PEG 200 100 22 24 24 TPGS 114 23 24 22 Mean of duplicate determination of plasma spiked with different COM4 stock solutions
77
Circulation and tissue levels of total radioactivity after iv administration of [14
C]COM4
Time Tissue Individual concentration values (ng-eqg)
(h) Control group CEL group 008 Blood 1258 1855 1551 1340 1515 1556 Plasma 2047 2761 2640 2211 2548 2517 Plasma water 123 50 49 287 477 478 Lung 659 815 737 754 763 788 Muscle 216 228 222 251 230 250 Skin 348 229 253 229 227 307 025 Blood 1306 1202 1069 1350 1183 1414 Plasma 2343 1983 1893 2357 1910 2273 Plasma water 92 99 83 118 179 201 Lung 697 657 608 737 651 741 Muscle 206 215 205 204 212 216 Skin 443 317 330 351 402 432 05 Blood 1398 1431 1303 1394 1112 1142 Plasma 2382 2543 2238 2357 1969 1926 Plasma water 63 124 46 106 151 191 Lung 710 731 644 720 666 641 Muscle 202 206 197 204 203 204 Skin 363 426 436 384 389 343 1 Blood 1322 1189 1233 1329 732 1301 Plasma 2297 1967 2049 2361 1192 2059 Plasma water 35 101 99 99 106 186 Lung 649 618 616 674 539 674 Muscle 218 200 217 187 212 191 Skin 424 381 421 425 340 407 ng-eqmL
78
Raw data of COM5
In vitro blood distribution of [14
C]COM5 using blood pools with the same H 044 Total radioactivity concentration determined in blood and plasma
Excipient Nominal COM5 Incubation Actual values
in blood time (ng-eqmL mean plusmnSD n=3) (ngmL) (min) Blood Plasma
None 10 5 73 plusmn 06 115 plusmn 02 (saline) 30 78 plusmn 02 118 plusmn 02 60 76 plusmn 07 118 plusmn 07 300 5 278 plusmn 2 386 plusmn 4 30 277 plusmn 0 391 plusmn 4 60 275 plusmn 7 384 plusmn 2 EtOH 10 5 98 plusmn 06 138 plusmn 05 30 98 plusmn 06 135 plusmn 05 60 92 plusmn 06 139 plusmn 01 300 5 286 plusmn 2 404 plusmn 3 30 287 plusmn 6 400 plusmn 4 60 284 plusmn 5 395 plusmn 3 CELEtOH 6535 10 5 88 plusmn 03 129 plusmn 06 30 91 plusmn 05 128 plusmn 03 60 92 plusmn 03 11 plusmn 03 120 98 plusmn 03 109 plusmn 03 1 5 257 plusmn 4 322 plusmn 3 30 259 plusmn 3 313 plusmn 5 60 255 plusmn 5 267 plusmn 2 120 281 plusmn 3 279 plusmn 1 HP-β-CyD 05 5 93 plusmn 05 143 plusmn 03 30 95 plusmn 03 139 plusmn 03 60 96 plusmn 02 141 plusmn 07 1 5 293 plusmn 1 412 plusmn 10 30 297 plusmn 6 414 plusmn 6 60 296 plusmn 6 405 plusmn 1 SHS 05 5 106 plusmn 04 125 plusmn 04 30 107 plusmn 04 108 plusmn 03 60 108 plusmn 05 112 plusmn 03 1 5 256 plusmn 1 257 plusmn 1 30 257 plusmn 2 247 plusmn 4 60 260 plusmn 3 230 plusmn 1 PEG 200 05 5 101 plusmn 03 141 plusmn 03 30 99 plusmn 08 145 plusmn 02 60 102 plusmn 03 142 plusmn 02 1 5 304 plusmn 7 402 plusmn 3 30 304 plusmn 8 413 plusmn 4 60 307 plusmn 2 410 plusmn 4 TPGS 05 5 88 plusmn 03 146 plusmn 04 30 91 plusmn 06 145 plusmn 03 60 89 plusmn 02 133 plusmn 03 1 5 308 plusmn 5 448 plusmn 3 30 312 plusmn 7 446 plusmn 7 60 311 plusmn 3 390 plusmn 22 Triplicate analyses were conducted on one aliquot for each time point
79
In vitro protein binding of [14
C]COM5 using the same plasma pool Total radioactivity concentration determined in plasma and ultrafiltrate
Excipient Nominal COM5 Actual values
in plasma (ng-eqmL) (ngmL) Plasma Ultrafiltrate None 10 86 13 (saline) 15 300 292 35 35 34 EtOH 10 108 13 12 300 295 35 35 34 CELEtOH 6535 10 104 25 24 21 300 269 65 64 63 SHS 10 107 30 29 31 300 268 76 74 73 Mean of duplicate determination of plasma spiked with different COM5 stock solutions
80
Circulation and tissue levels of total radioactivity after iv dosing of [14
C]COM5 (1 mgkg)
Time Tissue Individual concentration values (ng-eqg)
(h) Control group SHS group 008 Blood 1109 1450 1365 1694 2005 1859 Plasma 2009 3120 2647 2486 3010 2665 Muscle 355 458 387 555 426 448 Skin 275 224 245 296 207 219 Brain 24 29 28 41 38 41 025 Blood 712 873 1100 1519 1179 1033 Plasma 1508 1468 1777 2265 1813 1606 Muscle 262 341 330 423 445 404 Skin 229 242 259 456 441 342 Brain 14 16 18 29 27 21 05 Blood 642 409 792 1096 867 965 Plasma 1194 572 1275 1655 1455 1467 Muscle 244 199 241 342 341 315 Skin 252 198 256 397 382 374 Brain 11 7 11 22 15 18 1 Blood 172 192 219 688 603 464 Plasma 269 304 361 1055 919 727 Muscle 59 55 57 203 176 144 Skin 164 146 145 299 217 223 Brain 3 3 3 12 11 9 ng-eqmL value below LOQ
Ex vivo protein binding of [14
C]COM5 in the control and SHS group Total radioactivity concentration determined in plasma amp ultrafiltrate
Time Individual values (pg-eqmL)
(h) Plasma Ultrafiltrate Control group 008 2465 217 221 025 1587 123 126 05 1031 69 67 1 305 31 31 SHS group 008 2679 378 372 025 1914 245 05 1524 230 230 1 864 167 Mean of duplicate determination of plasma pooled for each time point
81
9 Acknowledgments
I would like to thank Prof Hans Leuenberger for giving me the opportunity to accomplish a PhD thesis at the University of Basel in collaboration with Novartis Ltd I would also like to thank my advisor PD Dr Georgios Imanidis for his guidance support and advice I would like to thank Dr Bruno Galli for acting as a co-examiner and co-referee for my PhD thesis I would like to thank Dr Gerhard Gross and his group for allowing me to conduct my dissertation research in their laboratories In particular I would like to thank Mr Armin Bruumllisauer and Dr Markus Weiss for helpful comments and discussions I am also thankful for Pierrette Guntz Heidi Huumlgli Marcel Fresneau and Albert Spielmann for not only assisting with my training and sharing laboratory space but for their friendships I would like to thank Dr Ernst Ulrich Koelle and Dr Michel Lemaire for their scientific advice and discussions concerning kinetics and suggestions throughout my dissertation project I would like to thank the Isotope Laboratories of Novartis for providing me with radiolabeled compounds Finally this research was made possible by financial support of Novartis Pharma AG Basel
82
10 Curriculum Vitae
Name Barbara Egger-Heigold Address Lettenweg 8 4102 Binningen
1975 Born on October 30th in Lucerne
1982-1988 Primary school in ReussbuumlhlLU 1988-1995 Matura Typus B Gymnasium ReussbuumlhlLU
1995-1996 1Propedeuticum in Medicines University of Basel 1997-2002 Studies in Pharmaceutical Sciences University of Basel 2002 Diploma thesis at Novartis Pharma AG Basel Thesis title The effect of excipients commonly used for drug
formulation on the in vitro rat blood distribution and protein-binding of SAB 378
2003-2005 PhD student University of Basel Laboratory work conducted at Novartis Pharma AG Basel During my PhD thesis I attended following lectures and courses given by the following lecturers Prof Dr H Leuenberger PD Dr GImanidis Prof Dr J Drewe Prof Dr J Seelig PD Dr H Heerklotz PD Dr A Seelig Dr S Rogers