the effect of executive compensation on financial
TRANSCRIPT

i
THE EFFECT OF EXECUTIVE COMPENSATION ON FINANCIAL
PERFORMANCE OF LISTED COMMERCIAL BANKS IN KENYA
ANNE WAMUHU KAHUKO
D63/88555/2016
A RESEARCH PROJECT PRESENTED IN PARTIAL FULFILMENT OF THE
REQUIREMENTS FOR THE AWARD OF THE DEGREE OF A MASTER OF
SCIENCE IN FINANCE, SCHOOL OF BUSINESS, UNIVERSITY OF NAIROBI
NOVEMBER, 2018

ii
DECLARATION
This project is my original work and has not been presented for a degree in any other
university.
Signed…………………….…………………
Date……….................……………………...
ANNE WAMUHU KAHUKO
D63/88555/2016
This project has been submitted for examination with our approval as university
supervisors.
DR. WINNIE NYAMUTE
DEPARTMENT OF FINANCE AND ACCOUNTING
Signed ………………………………….…. Date……………………………………

iii
DEDICATION
I dedicate this project to God, my parents Mr. and Mrs. Mutua, my sister Esther
Kahuko and my niece Silantoi for their encouragement and support throughout the
study period and in this project.

iv
ACKNOWLEDGEMENT
I thank my supervisor Dr. Winnie Nyamute, for her unabridged attention, guidance and
patience throughout the study.

v
LIST OF ABBREVIATIONS
CBK Central bank of Kenya
CEO Chief Executive Officer
CMA Capital Markets Authority
NSE Nairobi Securities Exchange
ROA Return on Asset
ROE Return on Equity

vi
TABLE OF CONTENTS
DECLARATION............................................................................................................... ii DEDICATION.................................................................................................................. iii ACKNOWLEDGEMENT ............................................................................................... iv LIST OF ABBREVIATIONS .......................................................................................... v
LIST OF TABLES ......................................................................................................... viii ABSTRACT ...................................................................................................................... ix CHAPTER ONE: INTRODUCTION ............................................................................. 1
1.1 Background of the Study ........................................................................................... 1 1.1.1 Executive Compensation .................................................................................... 2 “1.1.3 Financial Performance and Executive Compensation ...................................... 3
1.1.4 Listed Commercial Banks in Kenya ................................................................... 4 1.2 Research Problem ...................................................................................................... 5
“1.3 Research Objective .................................................................................................. 8 1.4 Value of the Study ..................................................................................................... 8
CHAPTER TWO: LITERATURE REVIEW ................................................................ 9 2.1 Introduction ............................................................................................................... 9
“2.2 Theoretical framework ............................................................................................ 9 2.2.1 The Agency Theory ............................................................................................ 9
2.2.2 The Stakeholder Theory ................................................................................... 11 2.2.3 Tournament Theory .......................................................................................... 12
2.3 Determinants of Financial Performance .................................................................. 14
2.3.1 Firm Size........................................................................................................... 14 2.3.2 Liquidity ........................................................................................................... 14
2.3.3 Capital Structure ............................................................................................... 15
2.4 Empirical Review .................................................................................................... 15
2.5 Summary and Gap ................................................................................................... 18 2.6 The Conceptual Framework .................................................................................... 19 ....................................................................................................................................... 19
....................................................................................................................................... 19 ....................................................................................................................................... 19
CHAPTER THREE: RESEARCH METHODOLOGY ............................................. 20 3.1 Introduction ............................................................................................................. 20 3.2 Research Design ...................................................................................................... 20
3.3 Population................................................................................................................ 20 3.4 Sample ..................................................................................................................... 20 3.5 Data Collection ........................................................................................................ 21 3.6 Data Analysis .......................................................................................................... 21
3.7 Diagnostic Test ........................................................................................................ 22 3.7.1 Normality Test .................................................................................................. 23 3.7.2 Heteroscedasticity Test ..................................................................................... 23 3.7.3 Multicollinearity ............................................................................................... 23 3.7.4 Serial Correlation .............................................................................................. 24
3.7.5 Unit Root Test .................................................................................................. 24
CHAPTER FOUR: RESULTS AND DISCUSSION ................................................... 25 4.1 Introduction ............................................................................................................. 25

vii
4.2 Descriptive Results .................................................................................................. 25
4.3 Panel Data Specification Tests ................................................................................ 27 4.3.1 Multicollinearity Test ....................................................................................... 27 4.4.2 Panel Unit Root Tests ....................................................................................... 28
4.4.3 Heteroscedasticy Test ....................................................................................... 28 4.4.4 Normality Tests ................................................................................................ 29 4.4.5 Autocorrelation ................................................................................................. 30 4.4.6 The Hausman Test for Model Effect Estimation .............................................. 31
4.5 Panel Regression Analysis ...................................................................................... 31
CHAPTER FIVE: SUMMARY, CONCLUSIONS AND RECOMMENDATIONS 39 5.1 Introduction ............................................................................................................. 39 5.2 Summary of Findings .............................................................................................. 39 5.3 Conclusion of the Study .......................................................................................... 41
5.4 Recommendations ................................................................................................... 42 5.5 Areas of Further Research ....................................................................................... 43
5.6 Limitations of the study........................................................................................... 44
APPENDICES ................................................................................................................. 50 Appendix i: Data Collection Sheet ................................................................................ 50 Appendix II: List of Listed Commercial Banks ............................................................ 51 Appendix III: Raw data ................................................................................................. 52

viii
LIST OF TABLES
Table 4. 1: Summary Statistics ..........................................................................................27
Table 4. 2: Variance Inflation Factor .................................................................................28
Table 4. 3: Unit Root Test..................................................................................................28
Table 4. 4: Heteroskedastic Test ........................................................................................29
Table 4. 5: Jarque-Bera test ...............................................................................................30
Table 4. 6: Autocorrelation Tests.......................................................................................30
Table 4. 7: Hausman Test ..................................................................................................31
Table 4. 8: Random Effect Model ......................................................................................32

ix
ABSTRACT
Economic theory of executive pay has focused on the design of optimal compensation
schemes to align the interests of managers and shareholders. Agency theory has identified
several factors by which these interests may differ; including the level of effort exerted by
the manager and problems resulting from the unobservabilty of the agent's relevant skills.
This study examined the relationship between executive compensation and firm
performance among the commercial banks listed at the Nairobi Stock Exchange. The study
considered functional form relationship between the level of executive remuneration and
accounting performance measures by using a regression model that relates pay and
performance. The main objective of this study was to determine the effect of executive
compensation on financial performance among listed commercial banks in Kenya. The
study adopted descriptive research design. The target population comprised of the eleven
commercial banks listed at the Nairobi securities exchange as at December 2017 as
indicated in CMA bulletin 2017. The study employed secondary data extracted from
audited financial statements and annual reports of individual listed commercial banks over
the 6-year period, 2012 to 2017. STATA was used to tabulate and analyze the data.
Percentages, means and frequency distribution tables were used to describe the data.
Relationships between the independent and dependent variables were established by means
of regression. The study established that executive annual bonuses, executive fixed
salaries, executive allowances had a positive effect on financial performance of listed
commercial banks while executive share ownership had a negative effect on the financial
performance of the listed commercial banks in Kenya. Annual fixed salaries, firm size and
capital structure has statistically significant effect on financial performance. Annual
bonuses, executive allowances and executive share ownership did not show statistically
significant influence on financial performance of listed commercial banks in Kenya. The
study recommends that top management of listed commercial banks in Kenya should
improve on executive compensation even though some of the variant of compensation may
not improve financial performance that much.

1
CHAPTER ONE: INTRODUCTION
1.1 Background of the Study
Executive compensation has been an ever-ending highly controversial issue in most parts
of the world especially Europe and USA. In Kenya it is just a matter of time before the new
rules on disclosure of executive remuneration components by CMA and also the CBK rules
to cap salaries of the executives to the size of their operations become a reality and opens
up otherwise outrageous compensations earned by listed corporation’s executives to the
general investing public and to the increasingly watchful financial press (Gerakos, Ittner,
& Moers, 2012).
Various theoretical foundations support executive compensation and financial
performance. The current study is based on three theories including Agency Theory,
Stakeholder Theory and Tournament Theory. The First theory to be considered was
Agency Theory proposed by (Jensen & Meckling, 1976). Theory argues that Pay levels for
executives are majorly founded on available estimation of executives' management skills.
The second theory was Stakeholder Theory that argues that managers in firms have a web of
groups they are serving (Clarkson, 1995). Finally, the study is based on Tournament
Theory that demonstrates progresses pay gap between employees (players) in one rank and
the following higher rank would be expansive and more noteworthy than their marginal
product, therefore, giving the incentives to the challengers in the game to give a valiant
effort in the company (Milgrom & Roberts, 1988).
This study was informed by otherwise outrageous benefits management takes home at the
expense of creating shareholder wealth that is the most important and widely accepted goal
of the firm in finance literature. As indicated by Crystal (2011), pay paid to the best officials

2
of traded on an open market enterprise is a politically touchy region with commentators
asserting that sums paid to administrators are too high. The levels of pay in the sum total
of what nations have been rising drastically over the previous decades. In addition to the
fact that it is increasing in supreme terms, yet in addition in relative terms. Gabaix &
Landier (2008) established that the compensation of other senior executives has risen more
rapidly than that of rank and file workers but has not kept pace with CEO pay.
1.1.1 Executive Compensation
Executive compensation is pay gotten by an officer of a firm, frequently as a blend of pay,
rewards, and offers of as well as call alternatives on the organization stock (Bebchuk &
Grinstein, 2015), paid costs (advantages) or protection. It alludes to the advantages and
compensation collecting to top administration of a partnership generally the Board of
Directors including the CEO. The different segments of executive compensation
incorporate an essential pay, reward, investment opportunities, and allow of offers, annuity,
severance pay and perquisites however the last three have not been covered extensively in
literature and have been camouflaged in most executive compensation contracts (Kuhnen
& Zwiebel 2012).
Adeoti & Isiaka (2016) noted that the goal of executive compensation is to hold, attract
and maintain highly qualified executives in the organization. Executive compensation that
is utilized together with executive pay or compensation involves pay and motivator pay.
Motivating force pay could comprise of money and non-money bundles, and is a viewpoint
in back and bookkeeping that is yet to pick up domination in research particularly in
creating nations like Kenya.

3
1.1.1 Financial Performance
This is a proportion of the degree the enterprise has achieved its objectives and targets
subsequently addressing the necessities everything being equal and particularly investors.
As per Dunegan, Uhl-Bien & Duchon (2012) financial performance is the monetary related
state of a firm in a given time, which is otherwise called financial stability. The factors
against which financial performance can be estimated could be accounting based or market
based. These may appear as outright figures, proportions and portrayals of different
conditions among the execution parameters (Ongore & Kusa, 2013).
Accounting based measures are effectively figured and gotten from the money related
announcing process like the profit before assessment, income after expense, income per
share, return on resources, return on equity etc., however caution should be applied to guard
against manipulation of the financial statements by management in a bid to overstate their
earnings (Jha & Hui, 2012). Executive compensation consultant with Towers Perin,
Canada, accounting based measures is result based, considers both revenue, expenses and
determine the investments needed to generate profits. Market based measures are premised
on facts and information released to the market by the corporation and other market players
like analysts. It tends to be less susceptible to manipulation though it depends to some
extent on the accounting-based measures e.g. share prices, dividends (Dutta & Bose, 2007).
“1.1.3 Financial Performance and Executive Compensation
Affiliated investigations on executive compensation and performance have yielded
blended outcomes. The executives who oversee operations in the organization ought to be
paid literally well so as persuade such talented directors to stay with the firm who was in
turn empower the firm to accomplish its targets and objectives in the long haul. Murphy

4
(2011) gives a general review of the philosophy behind compensation of executives,
beginning from the compelling empirical investigation by Jensen & Murphy (1990), that
initially recognized that the relationship between compensation and firm performance
baffles and noted that their minimal connection if any on the association between
employee’s performance and executive pay.”
A study by Izan, Sidhu & Taylor (2011) has confirmed the low pay performance
sensitivities. Most empirical studies have discovered a direct association between
performance and money compensation as far as productivity measures is concerned. The
motivation behind executive compensation is to draw in and hold talented work. It likewise
urges workers to act as per every one of the partners' wants and along these lines lessen
conceivable irreconcilable circumstances inside the association. Executive compensation
ought to be composed in a way that influences workers decidedly and ought to satisfy three
criteria as indicated by Dechow, Huson & Sloan (2014). The executive compensation ought
to be focused as far as size to pull in and keep the best workers; Incentive projects conveyed
and reinforce the principle goals of the organization by joining adaptable compensation to
performance; Flexible compensation supported a performance situated corporate
atmosphere by watching and remunerating great performance.
1.1.4 Listed Commercial Banks in Kenya
Annual report by Central Bank of Kenya (2017) shows that there are some forty-three
licensed commercial banks in Kenya. Three of the banks are public financial institutions
with majority shareholding being the Government and state corporations. The rest are
private financial institutions. Of the private banks, 27 are local commercial banks while 13

5
are foreign commercial banks (CBK, 2012). However, our study adopted 11 banks that are
listed at the Nairobi Securities Exchange.
On a wider scale using a cross industry comparison the financial sector and specifically the
listed banks have the highest cash compensation to its executives among the listed
companies at the NSE and also across the whole economy due to the specialized skills
required and also the high risk as a result of operating in a highly regulated environment
and this is according to PWC CEO Survey, 2013; Grant Thornton Financial Executive
,Compensation Survey, 2012 and Central Bank of Kenya report, 2012.
Further, as indicated on the yearly reports of listed firms, CEO pay in the Kenyan listed
banks can be partitioned into pay rates, recompenses, money rewards and charges for
administrations as executives. Another key benefit accorded to bank executives is the
access to credits with commercial banks making advances to their executives in what is
referred to as insider loans. The report also details the participation of executives in stock
ownerships plans that is aimed at making the executive part and parcel of the ownership of
the firm such that they take on projects that promises to improve the net worth of the
shareholder and in turn improve their own incomes and wealth inform of dividends and
appreciation in share prices from retained earnings (Muriuki, 2015).
1.2 Research Problem
Executive compensation is one of the central points that can affect firm performance
(Ayodele, 2012). Frequently, studies have not really been done to disentangle how best
executives that direct the issues of an organization ought to get compensated and different
types of compensations they deserve. Henceforth Adeoti & Isiaka (2006) contended that

6
the goal of executive compensation is to draw in, persuade and hold great individuals for
fulfillment of the hierarchical performance. Executive compensation that is conversely
utilized with executive pay or compensation involves pay and motivating force pay.
Motivating force pay could comprise of money and non-money bundles, and is an angle in
finance and accounting that is yet to pick pace in research literature particularly in
developing nations like Kenya.
From the reporting by the Central bank of Kenya after extended audit of the operations of
Chase Bank that collapsed on the 7 of April 2016, the Audit pointed towards poor
governance of the bank. To illustrate the severity of these governance issues, the bank
made large amount of loans to its directors, an average of ksh 1.35 billion per director.
Therefore in this case a question arised as to how could a SME bank, allow its directors to
lend tens of millions of shilling to themselves? It can therefore be said that some of this
bank failures is as a result of executive staff behaviour like giving themselves high loans
which they never repay or even giving themselves very high salaries of even been involved
in some fraud activities.
Several studies exist globally on the association between performance and compensation
of executive directors of a company. Westman (2014) found that managerial ownership
had an inverse association with banks’ performance. Armstrong & Vashishtha (2012)
showed that the improved bonuses to the executive managers leads to improved financial
performance of the companies demonstrating managerial effectiveness. Fahlenbrach &
Stulz (2011) demonstrated that banks offering higher compensation and that have a larger
proportion of their remuneration in monetary form to their chief executive officers did not

7
perform more awful amid the global meltdown experienced in the United States and other
countries globally.
Locally, a number of studies also exist on the issue of the nexus between performance and
executive remuneration. Ongore & K'Obonyo, (2011) established a direct association
between stock ownership and financial performance of firms. Lishenga (2011) noted that
insider stock ownership reduces with deteriorating firm financial performance as CEO
compensation is insensitive to firm performance. Gathua, Ngumi & Kiragu (2013)
established that directors pay has statistically insignificant association with Kenyan
commercial banks financial performance. Ongore (2011) carried out a study using
quantitative method about share ownership in Kenya and in his study the stockholders have
the power and motivation to nearly screen the performances of the management while
noting that executive staff should be allowed to own some number of shares for themselves
so that they can feel as part of the company and make decisions that increases the value of
the company.
“However, even with studies already done both globally and locally, scholars failed to
produce conclusive evidence on relationship between financial performance and executive
compensation. Additionally, few researches exist in Kenya devoted to association between
financial performance and executive compensation of commercial banks that are listed at
the NSE in Kenya. This study therefore sought answers to the question: what is the effect
of executive compensation on financial performance of listed commercial banks in Kenya?

8
“1.3 Research Objective
The objective of the study was to determine the effect of executive compensation on the
financial performance of listed commercial banks in Kenya.
1.4 Value of the Study
The study will assist in determining the components of the various executive compensation
packages and their impact on financial performance for the listed commercial banks in
Kenya. The study will highlight other beneficial components of executive compensation
packages which have worked and have been successfully implemented in other parts of the
world to varying degrees of success but with special reference to the unique circumstances
and characteristics of our Kenyan banking sector and capital markets.
This study will also be of great help to other researchers who may also decide to make
more studies in regard to how executive compensation positively or negatively affect the
financial performance of listed commercial banks in Kenya, and thus this study will
provide a gap in which other researchers may take on the research and do further
researchers by providing information that the study may not have provided. Moreover, in
this regard the study will provide a bases on which other research’s may be carried out.”
The findings of this study will help the board remuneration committees and compensation
consultants in Kenya to be able to formulate executive compensation packages consistent
with shareholder wealth maximization for the benefit of both management and
shareholders. This study through its findings will compare with other findings from other
studies and help narrow the existing research gaps still existing in the area of executive
compensation and financial performance.

9
CHAPTER TWO: LITERATURE REVIEW
2.1 Introduction
The chapter elaborates on the theoretical review, determinants of financial performance,
empirical review and theoretical framework.
“2.2 Theoretical framework
A number of theories exist in the finance literature to that underpins the concept of
executive compensation. The theories include; Agency Theory, Stakeholder Theory and
Tournament Theory. The theories and their relevance for the current study is elaborate in
following sub sections.”
2.2.1 The Agency Theory
Agency Theory was proposed by Jensen & Meckling (1976). The central issue in the
Agency Theory is the manner by which it explains how to pay chief executives such that
agency problem (Jensen & Murphy, 1990). Pay levels for executives are majorly founded
on available estimation of executives' management skills. As remuneration is viewed as an
outcome of agency issues, the subject of how to pay the executive is the principle issue
tended to in these speculations. Agency issues exist in any circumstance where one group
endowed with duty of undertakings to another’s resource. In this agency theory, a
consideration is made between two groups that is the principal and the agent. The principal
is the shareholders who are concerned with their welfare and wealth maximization while
the agent who are the executive managers charged with the duty taking care of the
shareholders wealth (Jensen & Meckling, 1976).”

10
Issues of agency are focal in the corporate governance writing. Chandra (2008) had
perceived, insightfully, the agency issue in a traditional work titled the Wealth of Nations
by contextualizing that like the stewards of a rich man, the directors are well-suited to
consider regard for little issues as not their lord's respect, and effectively give themselves
an administration from having it. Carelessness and abundance, accordingly, should
dependably win, in the administration of the general population constrained organization
that is possessed by various investors secured with restricted risk (Mackling, 1976).
Moldoveanu & Martin (2001) noted that agency issues result from unique organizational
structures connected to disappointment with managerial skills and managerial integrity.
Disappointment with managerial skill alludes to accidental missteps made in executing
administrative obligations. These can originate from antagonistic choice in a circumstance
where the principle cannot discover if the agent precisely speaks to his capacity to take
every necessary action they are contracted to do. The disappointment with the integrity of
the managerial staff that alludes to their tenacious conduct that lowers the value of the
assets of the business. Alchian & Demsetz (1972) noted that agency theory is based on
established radical Lockean idea that managers concentrates on their own personal self-
interest and ignoring the well-being of the shareholders and their wealth.
As refered to by Jensen (1994), Brennan discredit the utilization of executive pay in the
public eye. In this contention, economists see rational behaviour as self-intrigued, however,
this proportion is not right both in a normative and positive sense. Jensen (1994) agrees
that Brennan (1994) is right that individuals do not generally act to their greatest advantage
yet this gives no backing for the call for suppression of incentives. Denis, Denis & Sarin

11
(1999) recommend that the expectations of agency theory are unsupported in occasions
when management interests’ conflict with those of stockholders (Lee & O'Neill, 2001).
Agency theory underpins the current study on the relationship between executive
compensation and financial performance of listed commercial banks in Kenya. Agency
theory argues that the relationship between the principal and the agent where the principal
is the shareholders and the agent is the executive directors. To help reduce agency problem
where the managers pursue their own interest different from those of the shareholders, the
shareholders can use executive compensation to motivate managers to act in their own
interest of wealth maximization through methods of compensation like executive stock
ownership.
2.2.2 The Stakeholder Theory
Stakeholder Theory proponents argue that managers in firms have a web of groups they
are serving. The stakeholders are a group of people that influences the business and are in
turn influenced by business activities. The groups have interest in the business that they
need satisfied by the business. The groups may include the owners, the customers,
suppliers, government and local society (Harrison & Freeman, 1999). Study by the
Sundaram & Inkpen (2004) noted that stakeholder theory enables a manager to evaluate
different stakeholders to establish the interests of the stakeholders in the business and
identify the stakeholders that are critical to the performance and long-term survival of the
firm (Donaldson & Preston, 1995).
Clarkson (1995) proposed that the company has different stakeholders with interest of
wealth maximization. Harrison & Freeman, (1999) holds that the management should be

12
in a position to evaluate different stakeholders in the business together with their interests
and how they affect and are affected by the business. Donaldson & Preston (1995) argued
that the management of the firm is charged with leadership and while applying their
management skills, they are responsible for managing the various interests of the
stakeholders such that the conflicts are reduced in the web of relationships with the
company.
The Stakeholder Theory underpins the current study on the relationship between executive
compensation and performance of listed commercial banks in Kenya in that the executive
is expected to act in the best interest of the various stakeholders whose action determines
the survival of the organization in the long run. The executive must ensure it meets the
goals and interest of all stakeholders.
2.2.3 Tournament Theory
Tournament Theory advance that compensation distribution has beneficial outcomes since
it advances intra team rivalry and gives an economic incentive that urges the cream to
ascend to the best' of the rank-arrange tournament. The tournament theory demonstrates
progresses pay gap between employees (players) in one rank and the following higher rank
would be expansive and more noteworthy than their marginal product, therefore, giving
the incentives to the challengers in the game to give a valiant effort in the company. The
compensation gap is the prize of the tournament, which is expected to increase the higher
the level of the tournament (Rosen, 1986).
Unlike the position held by defenders of Tournament Theory that compensation
distribution advances intrateam rivalry and gives an economic incentive that empowers the
opposition, Social Comparison Theory hold that people routinely contrast themselves and

13
referent others and henceforth pay distribution and equity will on the contrarily negatively
influence basic decision making and cooperation. Fundamentally, these theories appear to
connect varying implications to the impacts of pay distribution of the executive teams.
However, many scholars over time in the span of utilization of the theory have opposed the
Tournament model as encouraging unproductiveness within the organization (Milgrom &
Roberts, 1988)
Inadequacies of tournament theory when connected to executive compensation is referred
to by Dye (1984) & McLaughlin (1988) as; it is hard to inspire the those who have lost and
the impact could be unsettling, notwithstanding it could be troublesome to executives if
their performance levels are multidimensional, job advancement may not be the suitable
motivation tool in light of the fact that there may not be a coordination of the abilities in
one position and the other after advancement. Milgrom & Roberts (1988) refer to collusion
and sabotages by the competitors as an issue when using the Tournament Theory.
Competition energizes non – helpful practices, for example, overinvestment in self-
advancement through office politics by the executives (Lazear, 1989).
The Tournament Theory also underpins the current study on the relationship between
executive compensation and financial performance of listed commercial banks in Kenya.
The Tournament Theory is relevant in that it shows that executive compensation as it
inspires the those who have lost and the impact could be unsettling, notwithstanding it
could be troublesome to executives if their performance levels are multidimensional, job
advancement may not be the suitable motivation tool in light of the fact that there may not
be a coordination of the abilities in one position and the other after advancement.

14
2.3 Determinants of Financial Performance
The section presents and elaborates on factors that influence financial performance in
organizations. These factors are discussed in following sub sections.
2.3.1 Firm Size
Firm size has become such a routine to use as a control variable in empirical corporate
finance studies that it receives little to no discussion in most research papers even though
not uncommonly it is among the most significant variables. Firms of different size
distinguish themselves along different observable and unobservable dimensions (Doğan,
2013). In the determination of firm, a critical element in the classification of firm size
categories is the ownership structure of firms. It is necessary to treat subsidiaries of large
companies that fall into the micro firm or SME categories according to their turnover or
number of employees differently from independent micro firms or SMEs. In this study on
effect of firm size on financial performance in the Kenyan banking industry, the bank size
criterion used by Central Bank of Kenya (CBK) was be applied (He, Fayman & Casey,
2014).
2.3.2 Liquidity
Liquidity is one of the key financial stability indicators given that its shortage in one bank
causes systemic crisis in the banking sub-sector due to interconnectedness. Liquidity held
by listed commercial banks reflects their ability to fund increases in assets and meet their
obligations (CBK, 2015). Mwangi, Makau & Kosimbei (2014) noted that liquidity is a
bank’s capacity to fund increase in assets and meet both expected and unexpected cash and
collateral obligations at reasonable cost and without incurring unacceptable losses. Meeme
(2015) suggested that liquidity an important factor of financial performance. Liquidity

15
measures have a significant impact on improving cost efficiency; firms with larger
expenditures on purchased inputs relative to capital were less likely to improve efficiency
when liquidity and solvency were considered.
2.3.3 Capital Structure
Capital structure alludes to the proportion of debt and equity financing. On the basis, that
if more debt financing is used by the organization, it needs to confront liquidation risks,
yet there are additional tax advantages by a firm when it finances its activities through debt
financing due to tax shield that they enjoy as the business is taxed after allowance for
interest charged on debt finance (Su & Vo, 2010). It additionally the firm can reduce the
agency problem by decreasing the free income of the firm (Abu-Rub, 2012). If there should
arise an occurrence of inside created funds, it is said that these have the most astounding
open-door cost (Akbar & Baig, 2010).
2.4 Empirical Review
There exists prior research on this topic, such as the paper by Omoregie & Kelikume (2017)
that analyzed whether there was a connection between executive pay and banking
performnace. It attempted to add more observational proof to the relationship between
executive pay and performance. The findings are that a few elements, other than the banks
performance factors, determines the executive remuneration. Additionally, Mehran &
Rosenberg (2016) demonstrated that executive remuneration diminishes bank leverage and
found that the execution of banks performance objectives was poor when executive pay
was more line up with the shareholders interest.

16
Croonen (2012) also examined CEO compensation and performance in banking. The
results showed that both prices of share and commercial banks net income are positively
associated to remuneration awarded to CEOs in banking industry. The findings indicated
that compensation of CEO has an effect on performance by having a positive association
to stock prices. Mutuma, (2016) was interested in establishing the association between
financial performance and executive compensation of listed firms in Nairobi securities
exchange in Kenya. Using 66 listed firms for a period of between 2010 to 2014. The result
established that the association between director’s remuneration and firm’s financial
performance was not statistically significant.
Westman (2014) also carried out a similar study in Europe for a period 2001 to 2002
whereby he uses quantitative method and he found that managerial stock ownership has
inverse relationship with financial performance during the financial crisis in the recent
time. In particular, he found a positive effect of manager’s stock ownership in small-
differentiated banks and non-conventional banks. K'obonyo (2011) in an evaluation
contemplated in Kenya examined the interrelations among shareholders structure and firm
performance level estimated utilizing bookkeeping-based measures among all
organizations listed at the NSE for a period between 1998-2010. The examination finds a
positive connection between insider stock ownership and firm performance.
“Ongore (2011) carried out a study using quantitative method about share ownership in
Kenya and in his study, the stockholders have the power and incentive to screen the
performance of the firm’s administration. Close monitoring of the management can
diminish agency cost and upgrade firm performance. Then again, concentrated stock
ownership by management can lead to problems in connection to ignoring the privilege of

17
the minority stockholders and furthermore influence the creativity and innovativeness of
the management. The study suggest that executive staff should be allowed to own some
number of shares for themselves so that they can fell as part of the company the work for,
and that was make them make decisions that positively increase the value of the company
the work for. Armstrong & Vashishtha (2012), carried out a study in the United States for
a period 2007-2008 using quantitative method and there is empirical evidence on the
impact of bonus of top organizational leadership on financial performance, their study
shows that the higher the bonus the higher the performance which demonstrate managerial
effectiveness.”
A study by Fahlenbrach & Stulz (2011), demonstrated that banks with higher executive
pay and a bigger part of remuneration in money form for their CEOs did not perform
terribly amid the financial crisis in the United States. Further, banks with higher
remuneration for executives and with a bigger part of pay given as money rewards did not
have more awful performance amid the emergency. The motivating factor for non-CEO
top directors are not connected to bank performance amid the emergency. Bank CEOs did
not reduce their stock ownership when they expected economic meltdown or amid the
financial crisis. There is additionally no proof that they supported their value presentation.
Study thus suggest that executive staffs should be offered better and good bonuses that was
make them more motivated to perform better for the company that offers them those good
bonuses they enjoy, and that lead to an increase in the value of the company they manage.”

18
2.5 Summary and Gap
This chapter is made of both the theoretical and empirical views. Under the theoretical
perspective, much emphasis has been given on avoidance of risk, measuring performance
and the role of the executive in decision-making. One major contribution of the theory is
agency conflicts that emanates from failure by the management to consider the interest of
the stakeholder and how compensation schemes influences performance of the firm.
Empirical findings show reactions in different directions in that while some scholars
indicate that executive pay has an association with performance of the firm. Other scholars
find no connection between the two variables in the study. Rita & Njuguna (2016)
established there is no association between financial compensation and financial
performance of the business organization. Kutum, (2015) & Croonen, (2012) stated an
existence of a positive connection between firm performance and executive compensation.
Going by the findings put by various researchers, executive compensation and other
benefits are considered crucial in influencing firm performance.
19
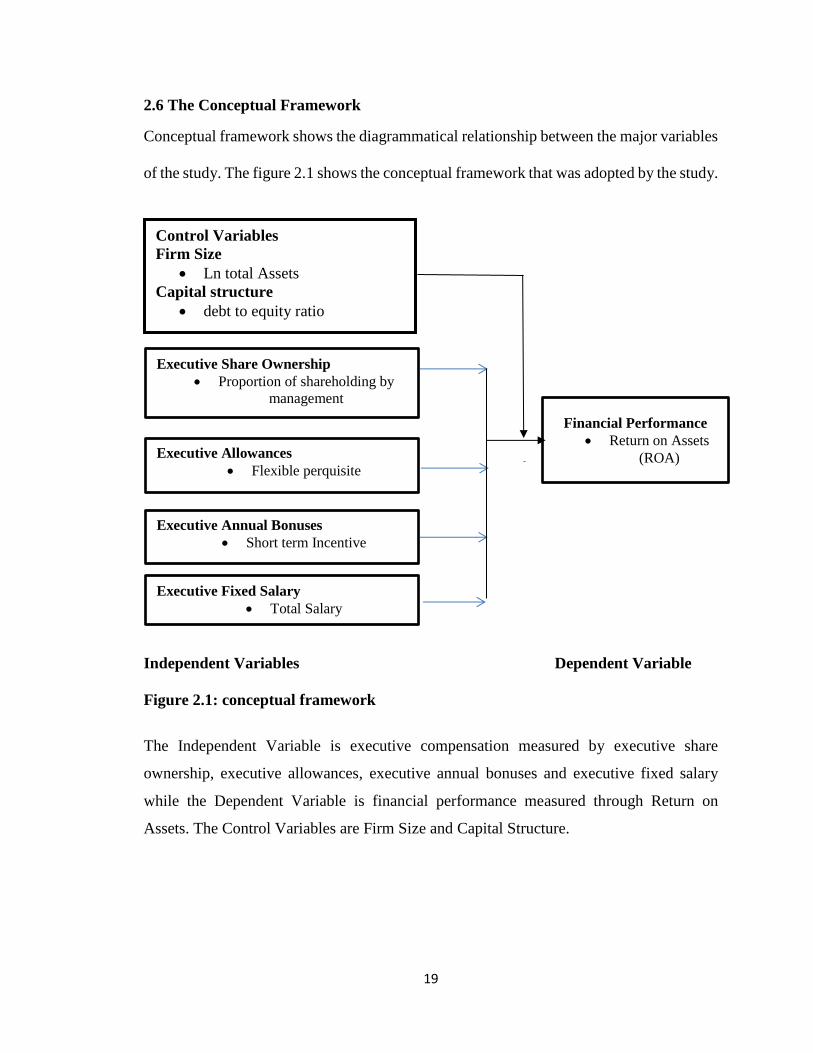
2.6 The Conceptual Framework
Conceptual framework shows the diagrammatical relationship between the major variables
of the study. The figure 2.1 shows the conceptual framework that was adopted by the study.
Independent Variables Dependent Variable
Figure 2.1: conceptual framework
The Independent Variable is executive compensation measured by executive share
ownership, executive allowances, executive annual bonuses and executive fixed salary
while the Dependent Variable is financial performance measured through Return on
Assets. The Control Variables are Firm Size and Capital Structure.
Executive Share Ownership
Proportion of shareholding by
management
Executive Allowances
Flexible perquisite
Executive Annual Bonuses
Short term Incentive
Executive Fixed Salary
Total Salary
Financial Performance
Return on Assets
(ROA)
Control Variables
Firm Size
Ln total Assets
Capital structure
debt to equity ratio

20
CHAPTER THREE: RESEARCH METHODOLOGY
3.1 Introduction
This chapter specifically elaborates on the research design, target population, sampling,
data collection and data analysis to be adopted in the process of carrying out the study. The
chapter expounds on how the researcher went about in carrying out the study and how the
data was collected and analyzed. The design is a road map of how the study progressed
from start to completion.
3.2 Research Design
This examination embraced a descriptive research design. As reported by Mugenda &
Mugenda, (2003), descriptive research is a kind of research design that is used when the
researcher mealy wants to present facts as they are without manipulation of the facts.
3.3 Population
The population of the current study contained the eleven listed commercial banks that have
floated shares at the Nairobi securities exchange as at December 2018 as indicated in CMA
bulletin 2018. The eleven listed commercial banks chosen as the unit of study due to nature
of their operations as they tend to offer new product in the market. In addition, the same
banks were chosen because of ease of getting information.”
3.4 Sample
“Kothari (2004) characterized sample as a subset of the population. The sample size for
this empirical examination contained all the 11 listed commercial banks in Kenya as at 31st
December 2017 (NSE, 2017). The study used a census that in this case the method used
because it involves an exhaustive enumeration of the units constituting the target

21
population according to (Kothari, 2004). Since the target population comprised 11
commercial banks listed in NSE, a census of all the firm’s study was conducted for the
study.”
3.5 Data Collection
The study employed secondary data that was extracted from audited financial statements
and annual reports of individual listed commercial banks over the 6-year period, 2012 to
2017. Collection of data was accomplished by means of the secondary data collection
instrument. The instrument aided in collection of data relating to executive share
ownership, executive fixed salary, executive allowances, and executive annual bonuses
was collected. Using the data collection instrument, the information on specific
components were keyed in for each firm for every year.
3.6 Data Analysis
Data collected was sorted, classified and collated. The data was then entered into excel
2016 and exported to STATA 14 computer software. Statistical analysis generated by the
aid of the software included Descriptive and inferential statistics. Descriptive statistics
involved measure of central tendency and dispersion while inferential statistics took the
form of regression and correlation analysis. Regression analysis was used to test the impact
of executive compensation on financial performance of listed commercial banks in Kenya.
The effect was examined at 95% confidence level while employing student t test.

22
3.6.1 Model Specification
Model specification involved coming up with a combination of study variables represented
the empirical relationship between the dependent and explanatory variables.
Yit = α + β1X1it +β2X2it + β3X3it + β4X4it+ β5X5it + β6X6it+ it..................................... (1)
Where: Yit =financial performance
α = the Y intercept;
X1- X4 Independent Variables
X5-X6 Control Variables
X1it= executive share ownership measured by Executive Share Ownership/total
number of shares of the bank.
X2it= executive allowance measured by executive allowance/ total operating
expenses of the bank.
X3it= executive annual bonuses measured by executive annual bonuses/ total
operating expenses of the bank.
X4it= executive fixed salary Measured by executive fixed salaries/ total operating
expenses of the bank.
X5it = capital structure measured by ratio of debt to equity of the bank
X6it = Firm size measured by Natural Logarithm of total Assets.
it= error term which is assumed to be normal in distribution with mean zero and
variance.
3.7 Diagnostic Test
The data was subjected to diagnostic tests to evaluate conformity with multiple regression
model assumptions. This would ensure validity of the results. The study employed

23
normality, heteroscedasticity, multicollinearity, serial correlation and unit root diagnostic
tests.
3.7.1 Normality Test
The test is conducted to test whether data exhibits a normal distribution. Non-normal
distributed data may not display the correct relationship between variables studied (Garson,
2012). The study employed Shapiro-Wilk test of normality. Fifty or less sample size are
not suitable for the test. The choice of this test was informed by the small number of
samples to be studied. Normal data have p-value greater than the Shapiro-Wilk test
significance value in the statistical test (0.05). On the other hand, data with significance
value less than 0.05 are not normally distributed.
3.7.2 Heteroscedasticity Test
Gujarati (2003) described heteroscedasticity as lack constant error variance. The study used
Modified wald test was used to test for heteroscedasticity. The null hypothesis in the test
is that error terms have a constant variance (i.e. should be Homoscedastic). There is no
heteroscedasticity if the significance values are greater than the P-value statistics test of
0.05.
3.7.3 Multicollinearity
Kothari (2004) postulates that multicollinearity exists if there is an association of
independent variables. Therefore, independent variables ought to be linearly independent
of each other. Cooper & Schindler (2006) asserts the existence of multicollinearity leads
to invalid significance tests due to the distorted regression coefficients. The study
employed Variance Inflation Factor (VIF) to test the existence of multicollinearity. If VIF
is less than 5, then there is no existence of multicollinearity (Gujarati, 2003).

24
3.7.4 Serial Correlation
Gujarati (2003) posit that serial correlation exists if an error term of one period is correlated
with that of subsequent periods. The study used Wooldridge Drukker test to test existence
of autocorrelation. Data has no serial correlation if P value is greater than the 5% level of
significance.
3.7.5 Unit Root Test
Unit root test is conducted to ensure that the variables are stationary. Gujarati (2003) posit
that a data has no unit roots if the variance, autocorrelation and mean of the data structure
do not vary with different time periods. Wooldridge (2012) asserted that stationarity
ensures that the regression results are not spurious thereby guaranteeing robust regression
results. The study employed Augmented Dickey Fuller (ADF) unit root test to evaluate the
availability of unit roots in the data. If P-Value is greater than 5% level of significance, it
implies the data is not stationary i.e. availability of unit roots.

25
CHAPTER FOUR: RESULTS AND DISCUSSION
4.1 Introduction
This chapter presented the results from analysis and the findings with regard to the study
objectives. In addition, the following were presented in the chapter; data analysis and
presentation, descriptive statistics, diagnostics tests; Multicollinearity test, panel unit root
tests, normality tests, Heteroskedasticity, Autocorrelation and Hausman test. Secondary
data was obtained from financial statements. To achieve this, the study employed a panel
data approach and analyzed the effect of executive compensation on financial performance
of listed commercial banks at the Nairobi Securities Exchange during the period 2012 to
2017
4.2 Descriptive Results
Results in table 4.1 below indicate the summary descriptive statistics of executive
compensation and financial performance of listed commercial banks in Kenya. The mean
for Financial performance was Mean of .04505, executive share ownership in relation to
total shareholding had a mean of .0411811 while executive fixed salary in relation to total
operating expense posted a mean of .01227, results also indicated that executive allowance
in relation to total operating expense had a mean of .0417974, mean firm size was
18.39876, mean capital structure was .529697 and finally executive annual bonus to total
operating expense mean was 0.0418.
The Std. Dev. for Financial Performance was .0171271, the standard deviation for
executive share ownership to total shareholding was .0712863, executive fixed salary to
total operating expense had a standard deviation of .0077563, standard deviation for

26
Executive Allowance to total operating expense was .0153824 and finally, standard
deviation for firm size was .5820746, standard deviation for capital structure was .1775298
and finally the standard deviation for Executive annual bonuses to total operating expense
was .0327412.
Executive allowance to total operating expense posted minimum of .000641, Executive
share ownership to total shareholding had a minimum of 8.37e-06, Executive Fixed salary
to total operating expense had a minimum of .000754, Financial Performance had a
minimum of -.0134 and results for executive annual bonus to total operating expense had
a minimum of .003974, minimum for firm size was 17.04326 and the minimum for capital
structure was .13.
The maximum for financial performance was .077, executive share ownership to total
shareholding had maximum of .2056566 while executive fixed salary to total operating
expense posted a maximum of .038119, results also indicated that executive allowance to
total operating expense maximum was .097318, Maximum for firm size was 19.55877,
maximum for capital structure was .86 and finally executive annual bonus to total operating
expense maximum was .13797

27
Table 4. 1: Summary Statistics
4.3 Panel Data Specification Tests
To determine the suitability of the panel data for statistical analysis, various tests were
conducted. The tests that aimed at establishing if the panel data fulfilled the cardinal
requirements of classical linear regression analysis included: normality test, panel unit root
test, multicollinearity test, panel-level heteroscedasticity test, hausman test as well as serial
correlation test. Where violation to these assumptions were detected, appropriate remedies
were applied. This section therefore presents the results of various diagnostic tests carried
out on the data together with the relevant remedial treatment undertaken to ensure
suitability of the data.
4.3.1 Multicollinearity Test
According to Field (2009) VIF values in excess of 10 is an indication of the presence of
Multicollinearity. The results in Table 4.2 present variance inflation factors results and
were established to be 1.23 which is less than 10 and thus according to Field (2009)
indicates that there is no Multicollinearity.
ROA 66 .04505 .0171271 -.0134 .077
CapitalStr~e 66 .529697 .1775298 .13 .86
FirmSize 66 18.39876 .5820746 17.04326 19.55877
fixedSalary 66 .0056266 .0077563 .000754 .038119
bonuses 66 .0417974 .0327412 .003974 .13797
Allowances 66 .01227 .0153824 .000641 .097318
stockowner~p 66 .0411811 .0712863 8.37e-06 .2056566
Variable Obs Mean Std. Dev. Min Max

28
Table 4. 2: Variance Inflation Factor
4.4.2 Panel Unit Root Tests
Most economic variables are usually non-stationary in nature and prior to running a
regression analysis. Unit root tests were thus conducted using the LLC test to establish
whether the variables were stationary or non-stationary. The purpose of this is to avoid
spurious regression results being obtained by using non-stationary series. Results in Table
4.3 indicated that all variables are stationary (i.e. absence of unit roots) at 5% level of
significance
Table 4. 3: Unit Root Test
Variable Name Statistic(Adjusted) P-Value Comment
Financial
Performance
-9.1936 0.000 Stationary
Executive Share
Ownership
-25.2806 0.000 Stationary
Executive fixed
Salary
-14.6408 0.000 Stationary
Executive
Allowances
-18.2333 0.000 Stationary
Executive Bonus -32.3135 0.000 Stationary
Firm size -24.1200 0.000 Stationary
Capital Structure -20.0034 0.000 Stationary
4.4.3 Heteroscedasticy Test
Modified wald test was used to test for heteroscedasticity. The null hypothesis in the test
is that error terms have a constant variance (i.e. should be Homoscedastic). The results in
Mean VIF 1.23
FirmSize 1.10 0.908186
fixedSalary 1.19 0.839473
bonuses 1.19 0.837850
Allowances 1.20 0.834676
CapitalStr~e 1.31 0.761426
stockowner~p 1.41 0.709089
Variable VIF 1/VIF

29
the Table 4.4 below indicate that the error terms are homoscedastic, given that the p-value
is less than the 5% (0.000),hence the null hypothesis of constant variance was rejected.
Table 4. 4: Heteroscedasticity Test
4.4.4 Normality Tests
Shapiro-Walk W test test which is a more conclusive test than the graphical method was
conducted. The results are as presented in table 4.5. The null hypothesis under this test is
that the disturbances are not normally distributed. If the p-value is less than 0.05, the null
.
------------------------------------------------------------------------------
- Wald Test: LogE2 = X = 25.1200 P-Value > Chi2(1) 0.0000
Ho: Panel Homoscedasticity - Ha: Panel Heteroscedasticity
==============================================================================
*** Panel Data Heteroscedasticity Wald Test
==============================================================================
_cons -.2772156 .0436475 -6.35 0.000 -.364554 -.1898772
FirmSize .0177009 .0023616 7.50 0.000 .0129753 .0224265
CapitalStructure -.0168076 .0084565 -1.99 0.052 -.033729 .0001137
fixedSalary .7040124 .1843396 3.82 0.000 .3351496 1.072875
bonuses .0447372 .0437116 1.02 0.310 -.0427294 .1322039
Allowances .1268043 .0932158 1.36 0.179 -.05972 .3133287
stockownership -.045973 .0218231 -2.11 0.039 -.089641 -.0023051
ROA Coef. Std. Err. t P>|t| [95% Conf. Interval]
- R2v= 0.6548 R2v Adj= 0.6197 F-Test = 18.66 P-Value > F(6 , 59) 0.0000
- R2h= 0.6548 R2h Adj= 0.6197 F-Test = 18.66 P-Value > F(6 , 59) 0.0000
------------------------------------------------------------------------------
Root MSE (Sigma) = 0.0106 | Log Likelihood Function = 210.3848
(Buse 1973) R2 Adj = 0.6197 | Raw Moments R2 Adj = 0.9526
(Buse 1973) R2 = 0.6548 | Raw Moments R2 = 0.9570
F-Test = 18.6552 | P-Value > F(6 , 59) = 0.0000
Wald Test = 111.9314 | P-Value > Chi2(6) = 0.0000
Sample Size = 66 | Cross Sections Number = 11
ROA = stockownership + Allowances + bonuses + fixedSalary + CapitalStructure + FirmSize
==============================================================================
* Ordinary Least Squares (OLS) Regression
==============================================================================

30
of normality at the 5% level was to be rejected. Given that the majority of p-value were
less than 5% for the residual, the null hypothesis is rejected and thus the conclusion that
the residuals are normally distributed.
Table 4. 5: Shapiro-Wilk W test for normal Data
4.4.5 Autocorrelation
To establish whether the residual is serially correlated over time, Wooldridge test for
autocorrelation was conducted. The null hypothesis is that no first order serial /auto
correlation exists. The results are as indicated in Table 4.6 below and therefore the null
hypothesis of no autocorrelation is accepted and therefore residuals are not auto correlated
(p-value=0.0018).
Table 4. 6: Autocorrelation Tests
FirmSize 66 0.97939 1.209 0.412 0.34015
ROA 66 0.96528 2.038 1.543 0.06142
CapitalStr~e 66 0.96840 1.855 1.339 0.09031
fixedSalary 66 0.58415 24.405 6.924 0.00000
bonuses 66 0.89759 6.010 3.887 0.00005
Allowances 66 0.65459 20.272 6.522 0.00000
stockowner~p 66 0.58220 24.520 6.934 0.00000
Variable Obs W V z Prob>z
Shapiro-Wilk W test for normal data
Prob > F = 0.0018
F( 1, 10) = 17.705
H0: no first order autocorrelation
Wooldridge test for autocorrelation in panel data
. xtserial ROA stockownership Allowances bonuses fixedSalary CapitalStructure FirmSize

31
4.4.6 The Hausman Test for Model Effect Estimation
The Hausman test was employed to determine the most suitable model for this study. The
null hypothesis is that the fixed effect model is appropriate and the alternative hypothesis
is that Random effect estimation models is suitable tested at 5% significance level. The
Chi-square test statistic is 2.93 with an insignificant probability of 0.5697 which means
that the null hypothesis is rejected in favor of the. Random effects model. Therefore, we
accept the random effects model as suitable for this study. The Hausman test result was
presented in table 4.7
Table 4. 7: Hausman Test
4.5 Panel Regression Analysis
The regression model helps to explain the magnitude and direction of relationship between
the variables of the study through the use of coefficients like the beta coefficient and the
level of significance. Based on the diagnostic tests carried out the study adopted a random
(V_b-V_B is not positive definite)
Prob>chi2 = 0.0002
= 26.41
chi2(6) = (b-B)'[(V_b-V_B)^(-1)](b-B)
Test: Ho: difference in coefficients not systematic
B = inconsistent under Ha, efficient under Ho; obtained from xtreg
b = consistent under Ho and Ha; obtained from xtreg
FirmSize -.0016327 .0177009 -.0193336 .003807
CapitalStr~e -.0150836 -.0168076 .001724 .0028216
fixedSalary .1345881 .7040124 -.5694242 .4512678
bonuses .1452636 .0447372 .1005264 .0792214
Allowances .1107253 .1268043 -.016079 .0442296
stockowner~p -.205357 -.045973 -.159384 .232715
FEM REM Difference S.E.
(b) (B) (b-B) sqrt(diag(V_b-V_B))
Coefficients
. hausman FEM .

32
effect model and the result presented was to show the fitness of model used of the
regression model in explaining the study phenomena.
Table 4. 8: Random Effect Model (Without Control Variable)
Tables 4.8 indicate that the model explains 18.93% of the total variations in financial
performance of listed commercial banks as shown by the coefficient of determination (R2)
value of 0.1893. The remaining 81.07% Variations financial performance is explained by
other factors not included in the model. The overall significance of the model was 0.2531
with an F value of 5.35. The level of significance was greater than 0.05 and this means that
executive compensation does not show statistically significant effect on financial
performance of listed commercial banks.
corr(u_i, X) = 0 (assumed) Prob > chi2 = 0.2531
Wald chi2(4) = 5.35
overall = 0.1893 max = 6
between = 0.2293 avg = 6.0
within = 0.0505 min = 6
R-sq: Obs per group:
Group variable: ID Number of groups = 11
Random-effects GLS regression Number of obs = 66

33
Table 4. 9: Random Effect Model (With Control Variable)
Table 4.9 shows the effect of executive share ownership on financial performance. Using
random effect model. It was established that Executive share ownership had a statistically
significant effect on financial performance (β1= -.04597, p = .035 and α = 0.05). The value
of β1 measures the elasticity of financial performance to changes in stock ownership and
that for every one-unit change in stock ownership, financial performance changes by .045
units in the opposite direction. The negative effect of stock ownership could be explained
by the fact that share ownership by management may lead to greater risk taking that may
plunge the bank into financial performance problems since the mangers loses their
objectivity in chase of risky projects that may translate to poor performance.
rho 0 (fraction of variance due to u_i)
sigma_e .00876539
sigma_u 0
_cons -.2772156 .0436475 -6.35 0.000 -.3627631 -.1916681
X6 -.0168076 .0084565 -1.99 0.047 -.033382 -.0002332
X5 .0177009 .0023616 7.50 0.000 .0130722 .0223296
X4 .7040124 .1843396 3.82 0.000 .3427133 1.065311
X3 .0447372 .0437116 1.02 0.306 -.0409359 .1304103
x2 .1268043 .0932158 1.36 0.174 -.0558952 .3095039
x1 -.045973 .0218231 -2.11 0.035 -.0887456 -.0032005
Y Coef. Std. Err. z P>|z| [95% Conf. Interval]
corr(u_i, X) = 0 (assumed) Prob > chi2 = 0.0000
Wald chi2(6) = 111.93
overall = 0.6548 max = 6
between = 0.9519 avg = 6.0
within = 0.0030 min = 6
R-sq: Obs per group:
Group variable: ID Number of groups = 11
Random-effects GLS regression Number of obs = 66

34
The significant relationship should be expected since studies done by other researchers
reveal similar results. Westman (2014) also carried out a similar study in Europe for a
period 2001 to 2002 whereby he uses quantitative method and he found that managerial
ownership had a negative impact on the banks’ performance during the recent financial
crisis. however K‘obonyo (2011) finds contrary results in a census study in Kenya examine
the interrelations among ownership structure and firm performance measured using
accounting based measures amongst all firms listed at the NSE for a period between 1998-
2010. The study is informed by the proposition that insider ownership is actualized through
executive share options. The findings suggest a positive relationship between insider
ownership and firm performance thereby affirming the proposition that when managers
own shares, they become more committed to the organization since they have a stake in
the residual income of the firm and they are likely to bear the costs of mismanagement.
Results show that executive allowance had a statistically insignificant effect on financial
performance of listed commercial banks (β2 = .1268043, p = 0.174 and α = 0.05). The
value of β2 measures the elasticity of financial performance to changes in executive
allowance and that for every one-unit change in executive allowance, financial
performance changes by .1268 units in the same direction. The insignificant effect could
be attributed to that fact that financial compensation like allowances may not motivate the
executive directors to improve their over sight role in prudential management of
commercial banks since their motivating effect is short lived. The study is in agreement
with prior studies.

35
Doucouliagos (2007), examine the relationship between director allowances given and
performance within Australian banking using panel data covering the periods of 1992 -
2005. The outcome of their work revealed the existence of a positive relationship between
CEO remuneration and bank performance he used quantitative method in his study. Haid
(2006) in his study carried out an investigation by analyzing the relationship between
financial perfomance and executive compensation in Germany using a sample of large
listed German firms between the periods of 1987 to 2003 using both qualitative and
quantitative method. The results of his findings indicate that level of executive
compensation in terms of allowances allocated and financial performance is weaker in
firms. Ampuero, (2009) in his research examines the relationship between allowances
compensation and company performance within the banking sector, using a sample of
twelve banks involving Swedish and foreign banks in Sweden covering 2006 to 2008 and
adopting a combination of qualitative and quantitative method, the outcome of his findings
shows variables like bonuses and allowances and also salaries are not related to financial
performance.
The findings show that Executive annual bonuses had a statistically insignificant effect on
financial performance of listed commercial banks in Kenya (β3 = .0447372 , p = 0.306 and
α = 0.05). The value of β3 measures the elasticity of financial performance to changes in
executive annual bonuses and that for every one-unit change in executive annual bonuses,
financial performance changes by .0447 units in the same direction. The possible
explanation for this insignificant effect is that improved annual bonuses being related to
annual performance of the bank and being tied to performance of the bank may motivate

36
the top management of the respective banks to be prudent enough and mange efficiently to
improve performance such that they can receive higher allowances at the end of financial
year. However, the effect was not statistically significant meaning there are other major
determinants of financial performance of commercial banks and that financial
compensation may not necessary motivate executive much.
The finding is in agreement with other studies like Bruce, Skovoroda, Fattorusso and Buck
(2007), carried out a study on executive bonuses and firm performance in the U.K. by
investigating executive bonuses for the period 2001 to 2003 using quantitative method.
Their main finding demonstrated that executive bonuses are related to higher total
shareholder returns. Crumley (2008) examined the relationship between firm performance
and CEO compensation in the U.S. commercial banking industry using quantitative
method. The sample of his study covered 36 firms in the U.S commercial banking industry
for the period between 2002-2003. His results exhibited a weak relationship between CEO
remuneration and firm performance. Armstrong and Vashishtha (2012), carried out a study
in the United States for a period 2007-2008 using quantitative method and there is
empirical evidence on the impact of bonus of top organizational leadership on financial
performance, their study show that the higher the bonus the higher the performance which
demonstrate managerial effectiveness. However study by Fahlenbrach and Stulz (2011),
finds contrary results that banks with larger fraction of compensation in cash bonuses for
their CEOs did not perform worse during the crisis in the United States. Further, banks
with higher option compensation and with a larger fraction of compensation given in the
form of cash bonuses did not have worse performance during the crisis.

37
Using panel regression analysis, it was established that executive fixed salaries had a
statistically significant effect on financial performance (β4 = .7040124, p = .000 and α =
0.05). The value of β4 measures the elasticity of financial performance to changes in
executive fixed salaries and that for every one-unit change in executive fixed salaries,
financial performance changes by .7040124 units in the same direction. The effect can be
attributed to the fact that when banks offer more absolute fixed salaries to executive at any
particular time, they are motivated to be practice prudential management however; the
effect was statistically significant due to the fact that increase in fixed salaries necessarily
mean the bank will translate such heavy payment as shown by fact that when directors get
higher fixed salaries, they may increase time to board meetings to attend personal
investments.
Other studies also show similar results. study by Conyon, Main, Bruce and Benito (2000),
carried out a study regarding executive salaries in a UK firm for a period 1996-1998 using
quantitative method and they realized that there is a little relationship between these
variables and thus confirmed low pay-performance sensitivities. Study by Lishenga (2011)
concludes that CEO remuneration is insensitive to firm performance. In Kenya, Gathua,
Ngumi and Kiragu (2013) found that executive compensation has insignificant relationship
with financial performance among commercial banks in Kenya. Conyon and He (2016)
examined the relationship between CEO compensation and corporate fraud in China, the
study found a correlation between executive compensation and fraud, the lower the
executive compensation the higher the incidences of fraud. Conyon and He (2016), studied

38
the effect of executive remuneration, the study found that fixed pay tend to decrease after
enforcement action by China Securities and Regulatory Commission.

39
CHAPTER FIVE: SUMMARY, CONCLUSIONS AND RECOMMENDATIONS
5.1 Introduction
This chapter deals with the summary of the findings, the conclusion and recommendations.
This was done in line with the objectives of the study. Areas of further research were
suggested and limitations of the study were taken into account.
5.2 Summary of Findings
The study was to assess the effect of executive share ownership financial performance
among the listed commercial banks in Kenya. Executive Share Ownership and financial
performance are negative and significantly related. It was established that Executive share
ownership had a negative statistically insignificant effect on financial performance (β1= -
.04597, p = .035 and α = 0.05). The value β1 was negative showing that executive share
ownership has a negative effect on financial performance of listed commercial banks in
Kenya hence when executive share ownership changes by one unit, financial performance
changes by .04597 in the reverse direction
The study was to assess the effect of executive allowance on financial performance among
the listed commercial banks in Kenya. Results show that executive allowance had a
statistically insignificant effect on financial performance of listed commercial banks (β2 =
.1268043, p = 0.174 and α = 0.05). The value of β2 measures the elasticity of financial
performance to changes in executive allowance and that for every one-unit change in
executive allowance, financial performance changes by .1268 units in the same direction.
However the insignificant effect could be attributed to that fact that financial compensation

40
like allowances may not motivate the executive directors to improve their over sight role
in prudential management of commercial banks since their motivating effect is short lived.
The study was to assess the effect of Executive annual bonuses on financial performance
among the listed commercial banks in Kenya. The findings show that Executive annual
bonuses had a statistically insignificant effect on financial performance of listed
commercial banks in Kenya (β3 = .0447372, p = 0.306 and α = 0.05). The value of β3
measures the elasticity of financial performance to changes in executive annual bonuses
and that for every one-unit change in executive annual bonuses, financial performance
changes by .0447 units in the same direction. The possible explanation for this positive
effect is that improved annual bonuses being related to annual performance of the bank and
being tied to performance of the bank may motivate the top management of the respective
banks to be prudent enough and mange efficiently to improve performance such that they
can receive higher allowances at the end of financial year. However, the effect was not
statistically significant meaning there are other major determinants of financial
performance of commercial banks and that financial compensation may not necessary
motivate executive much.
The study was to assess the effect of executive fixed salaries on financial performance
among the listed commercial banks in Kenya. Using panel regression analysis, it was
established that executive fixed salaries had a statistically significant effect on financial
performance (β4 = .7040124, p = .000 and α = 0.05). The value of β4 measures the elasticity
of financial performance to changes in executive fixed salaries and that for every one-unit

41
change in executive fixed salaries, financial performance changes by .7040124 units in the
same direction. The positive effect can be attributed to the fact that when banks offer more
absolute fixed salaries to executive at any particular time, they are motivated to be practice
prudential management.
5.3 Conclusion of the Study
The study concludes that Executive Share Ownership has a significant influence on
financial performance of listed commercial banks in Kenya. The study finds a negative
significant relationship between financial performance and executive share ownership.
That means even if banks increase directors share ownership it will not have any effect on
financial performance. The study therefore concludes that the effect of executive share
ownership was strong. The study therefore concludes that executive share ownership may
lead to improved financial performance of listed commercial banks in Kenya.
Based on the findings that the effect of Executive annual bonuses had a statistically
insignificant positive effect on financial performance of listed commercial banks in Kenya.
The study concludes that that executive annual bonus contributes marginally to financial
performance. Any improvement of executive annual bonuses should lead to improved
financial performance. However, the insignificant effect could be attributed to that fact that
financial compensation like allowances may not motivate the executive directors to
improve their performance level and that of the company.
Based on finding that executive allowance had a statistically insignificant positive effect
on financial performance of listed commercial banks. The study concludes that any
improvement in executive allowance to executive directors may translate to financial

42
performance of listed commercial banks. However, the effect was too marginal as
evidenced by the statistically insignificant influence. The management may decide to
improve the allowances of the executive directors to protect them from the economic
challenges hence make them motivated in their oversight role of the operations of the banks
through various committees if the banks management. However, the increase in the annual
allowances may not necessarily lead to major improvement in profits of the listed
commercial banks.
Based on the finding that executive fixed salaries had a statistically significant positive
effect on financial performance of listed commercial banks, the study concludes that any
improvement in fixed salaries offered to executive directors leads to increased financial
performance through improved oversight and supervisory role. The bank management may
decide to improve the fixed salaries of executive managers.
Finally, the effect of executive compensation on financial performance with the effect of
control variables was statistically significant however without the effect of control
variables, the effect of executive compensation is statistically insignificant hence, and the
study concludes that the effect of executive compensation on financial performance may
not be statistically significant.
5.4 Recommendations
Based on the conclusions, a number of recommendations are made. The management of
listed commercial banks in Kenya should not increase the stock ownership of executive
managers as this may lead to greater risk taking that may plunge the bank into financial
performance problems since the mangers loses their objectivity in chase of risky projects

43
that may translate to poor performance. The increase in executive share ownership should
thus be controlled. Secondly, based on the conclusion that executive annual bonuses have
positive effect on financial performance. The study recommends to the top management of
the listed commercial banks to consider improving the annual bonuses given to executive
managers. However, the bonuses should not be given much weight, as their effect on
financial performance is a weak one. Thirdly, based on the findings that executive annual
allowances have a positive effect on financial performance of listed commercial banks in
Kenya, The study wishes to recommend to top management of the listed commercial banks
to improve the annual allowances offering to executive directors. The top management of
the listed commercial banks should consider improving the annual allowances to enhance
financial performance of the listed commercial banks. Finally, the study wishes to
recommend to the top management of listed commercial banks to consider improving the
fixed salaries of executive directors of the bank. The study this may lead to major increase
in financial performance of the listed commercial banks in Kenya.
5.5 Areas of Further Research
The current study sought to establish the effect of executive compensation on financial
performance of listed commercial banks. The study was successfully carried out, however
a number of gaps were identified that should form gap for future studies. First, a similar
study should be done with improved model. Additionally, another study should be carried
that considers all the commercial banks in Kenya. Lastly, the same study could also be
carried out in the deposit taking Sacco’s to observe if the results are holding.

44
5.6 Limitations of the study
The limitations of this study included first, the study relied solely on secondary data and
as such, some aspects of executive compensation could not be measured adequately.
Secondary data are also general and tends to be historical. The study used the most current
information on executive compensation to minimize the problem of information being out
dated.
Secondly, listed commercial banks do not apply similar accounting policies hence the
executive compensation figures may be exposed to variances across entities is expected
based on the accounting policy including accrual policy of a firm. The study only relied on
published data and made use of notes to the accountant to get additional information not
presented exclusively in the financial statements.
Thirdly, Performance of a firm is affected by numerous factors that was not part of this
study. Although the study examined the effect of executive compensation on financial
performance of listed banks, other factors also affect financial performance. To capture the
effect of other variables apart from executive compensation, the study introduced two
control variables to capture the effect of the other variables that might also affect financial
performance.
Finally, the research was limited to listed commercial banks at NSE, which are only 11 in
number. The number was not large enough for selection of sample for the study. The
researcher used a census of all listed commercial banks in Kenya since the number was
small for sampling. Additionally, the study used six years of data collection to generate
more observation that would enable data analysis to proceed.

45
REFERENCES
Abu-Rub, N. (2012). Capital structure and firm performance: Evidence from Palestine
stock exchange. Journal of Money, Investment and Banking, 23(1), 109-117.
Alchian, A. A., & Demsetz, H. (1972). Production, information costs, and economic
organization. The American Economic Review, 62(5), 777-795.
Adeoti, J. A., & Isiaka, S. B. (2006). Non-financial compensation and its impact on
employee performance in selected Nigerian Firms. Ilorin Journal of Business
Studies and Social Sciences, 11(5), 23-35.
Armstrong, C. S., & Vashishtha, R. (2012). Executive stock options, differential risk
taking incentives, and firm value. Journal of Financial Economics, 104(1), 70
88.
Bebchuk, L., & Grinstein, Y. (2015). The growth of executive pay. Oxford Review of
Economic Policy, 21(2), 283-303.
Boyd, B. K. (1995). CEO duality and firm performance: A contingency model. Strategic
Management Journal, 16(4), 301-312.
Brennan, M. J. (1994). Incentives, rationality, and society. Journal of Applied Corporate
Finance, 7(2), 31-39.
Clark, J. K., Parrillo, A. V., & Wood, M. L. (1998). Attitudes and perceptions about
health education credentialing: A national study of top agency executives in local
health departments. Journal of Health Education, 29(4), 244-249.
Clarkson, M. E. (1995). A stakeholder framework for analyzing and evaluating corporate
social performance. Academy of Management Review, 20(1), 92-117.
Crystal, G. S. (2011). Why CEO compensation is so high. California Management
Review, 34(1), 9.
Dechow, P. M., Huson, M. R., & Sloan, R. G. (2014). The effect of restructuring charges
on executives' cash compensation. Accounting Review, 138-156.
Denis, D. J., Denis, D. K., & Sarin, A. (1999). Agency theory and the influence of equity
ownership structure on corporate diversification strategies. Strategic Management
Journal, 20(11), 1071-1076.
Doğan, M. (2013). Does firm size affect the firm profitability? Evidence from
Turkey. Research Journal of Finance and Accounting, 4(4), 53-59.

46
Donaldson, T., & Preston, L. E. (1995). The stakeholder theory of the corporation:
Concepts, evidence, and implications. Academy of Management Review, 20(1),
65-91.
Dunegan, K. J., Uhl-Bien, M., & Duchon, D. (2012). LMX and subordinate performance:
The moderating effects of task characteristics. Journal of Business and
Psychology, 17(2), 275-285.
Dutta, P., & Bose, S. (2007). Gender diversity in the boardroom and financial
performance of commercial banks: Evidence from Bangladesh. Journal of
Financial Economics.6 (2), 56-77.
Dye, R.A. 1984. The trouble with tournaments. Journal of Economic Iniquity, 20 (3) 147
– 149.
Fahlenbrach, R., & Stulz, R. M. (2011). Bank CEO Incentives and the credit crisis.
Journal of Financial Economics, 99(1), 11-26.
Fahlenbrach, R., & Stulz, R. M. (2011). Bank CEO Incentives and the credit
crisis. Journal of Financial Economics, 99(1), 11-26.
Fletcher, J., & Forbes, D. (2002). UK unit trust performance: does it matter which
benchmark or measure is used? Journal of Financial Services
Research, 21(3), 195-218.
Gabaix, X., & Landier, A. (2008). Why has CEO pay increased so much? The Quarterly
Journal of Economics, 123(1), 49-100.
Gathua, P.K., Ngumi, P., & Kiragu, D.N., (2013). The Relationship between Executive
Compensation and risk among Commercial Banks in Kenya. Prime Journal of
Social Sciences, 2(2), 204-212.
Gerakos, J. J., Ittner, C. D., & Moers, F. (2012). Compensation objectives and business
unit pay strategy. Journal of Management Accounting Research.3 (1), 350-343
Harrison, J. S., & Freeman, R. E. (1999). Stakeholders, social responsibility, and
performance: Empirical evidence and theoretical perspectives. Academy of
Management Journal, 42(5), 479-485.
He, L. T., Fayman, A., & Casey, K. M. (2014). Bank profitability: the impact of foreign
currency fluctuations. Journal of Applied Business and Economics, 16(2), 98-104.
Izan, H. Y., Sidhu, B., & Taylor, S. (1998). Does CEO pay reflect performance? Some
Australian evidence. Corporate Governance: An International Review, 6(1), 39
47.

47
Jha, S., & Hui, X. (2012). A comparison of financial performance of commercial banks:
A case study of Nepal. African Journal of Business Management, 6(25), 7601
7611.
Jensen, M. C., & Meckling, W. H. (1976). Theory of the firm: Managerial behaviour,
agency costs and ownership structure. Journal of Financial Economics, 3(4),
305-360.
Jensen, M. C., & Murphy, K. J. (1990). Performance pay and top-management
incentives. Journal of Political Economy, 98(2), 225-264.
Jensen, M. C. (1994). Self‐interest, altruism, incentives, and agency theory. Journal of
Applied Corporate Finance, 7(2), 40-45.
Kuhnen, C. M., & Niessen, A. (2012). Public opinion and executive
compensation. Management Science, 58(7), 1249-1272.
Kutum, I. (2015). Is there a Relation between CEO Remuneration and Banks' Size and
performance? International Journal of Accounting and Financial Reporting, 5(1),
272- 285.
Lazear, E. P. (1989). Pay equality and industrial politics. Journal of Political
Economy, 97(3), 561-580.
Lee, P. M., & O'neill, H. M. (2003). Ownership structures and R&D investments of US
and Japanese firms: Agency and stewardship perspectives. Academy of
Management Journal, 46(2), 212-225.
Maher, M., & Andersson, T. (2002). Corporate governance: effects on firm performance
and economic growth. Convergence and Diversity in Corporate Governance
Regimes and Capital Markets, Oxford University Press, Oxford, 386-420.
Meeme, M. A. R. I. O. (2015). The Relationship between Adherence to BASEL III Accord
and Financial Distress Status of Commercial Banks in Kenya (Doctoral dissertation,
Doctoral dissertation, University of Nairobi).
McLaughlin, K. J. (1994). Individual compensation and firm performance: The
economics of team incentives (No. 104). Chicago-Center for Study of Economy
and State.
Mehran, H., Rosenberg, J.V., 2007. The effect of employee stock options on bank
investment choice, borrowing, and capital. Federal Reserve Bank of New York
Staff Report. 3(5), 45-51
Milgrom, P., & Roberts, J. (1990). The economics of modern manufacturing:
Technology, strategy, and organization. The American Economic Review, 511-
528.

48
Moldoveanu, M., & Martin, R. (2001). Agency theory and the design of efficient
governance mechanisms. Joint Committee on Corporate Governance.3 (5)430
4555.
Muriuki, A. K. (2015). The relationship between board activity and firm performance: A
study of firms quoted on the Nairobi Stock Exchange. Unpublished PhD thesis,
Nairobi: University of Nairobi.
Murphy, K. J. (2011). Executive compensation. Handbook of Labour Economics, 3,
2485-2563.
Mutuma, I. (2016). The Relationship Between Executive Compensation and Financial
Performance Of Companies Listed In Nairobi Securities Exchange In Kenya
(Unpublished MSc. Thesis, University of Nairobi).
Mwangi, L. W., Makau, M. S., & Kosimbei, G. (2014). Effects of working capital
management on performance of non-financial companies listed in NSE,
Kenya. European Journal of Business and Management, 6(11), 195-205.
Ntim, C. G. (2009). Internal Corporate Governance Structures and Firm Financial
Performance: Evidence from South African Listed Firms (Doctoral dissertation,
University of Glasgow).
Omoregie, O. K., & Kelikume, I. (2017). Executive Compensation and Banking Sector
Performance: Evidence from Nigeria. The Journal of Developing Areas, 51(2), 1-
15.
Ongore, V. O., & Kusa, G. B. (2013). Determinants of financial performance of
commercial banks in Kenya. International Journal of Economics and Financial
Issues, 3(1), 237-252.
Ongore, V. O., & K'Obonyo, P. O. (2011). Effects of selected corporate governance
characteristics on firm performance: Empirical evidence from Kenya. International
Journal of Economics and Financial Issues, 1(3), 99-122.
Reddy, K., Locke, S., & Scrimgeour, F. (2010). The efficacy of principle-based corporate
governance practices and firm financial performance: An empirical
investigation. International Journal of Managerial Finance, 6(3), 190-219.
Rosen, S.1986. Prize and incentives in elimination tournaments, American Economic
Review, 76, 701- 715.
Ruparelia, R., & Njuguna, A. (2016). Relationship between Board Remuneration and
Financial Performance in the Kenyan Financial Services Industry. International
Journal of Financial Research, 7(2), 247.

49
Su, G. S., & VO, H. T. (2010). The relationship between corporate strategy, capital
structure and firm performance: An empirical study of the listed companies in
Vietnam. International Research Journal of Finance and Economics, 50, 62-71.
Sundaram, A. K., & Inkpen, A. C. (2004). The corporate objective
revisited. Organization Science, 15(3), 350-363.
Westman, H., (2014). Crisis performance of European banks- does management
ownership matter? Bank of Finland Discussion Paper.5 (2) 45-57
Yasser, Q. R. (2011). Corporate governance and performance: An Analysis of Pakistani
listed firms. Global Journal of Management and Business Research, 11(10).56
66

50
APPENDICES
Appendix i: Data Collection Sheet
2012 2013 2014 2015 2016 2017
Executive
fixed
salaries
Executive
share
ownership
Executive
bonuses
Executive
allowance
Capital
structure
Total
assets
Equity
EBIT

51
Appendix II: List of Listed Commercial Banks
i KCB bank
ii Equity bank
iii Barclays bank
iv Standard chartered bank
v HF group
vi Co-Operative Bank
vii Commercial Bank of Africa
viii Stanbic bank
ix NIC bank
x DTB bank
xi National bank
Source :( NSE, 2018)

52
Appendix III: Raw data
ID Time Stock ownership
Allowances
bonuses fixed Salary
Capital Structure
ROA Firm Size
1 2012 0.014 0.004 0.022 0.008 0.360 0.036 18.411
1 2013 0.013 0.006 0.025 0.001 0.280 0.037 18.462
1 2014 0.014 0.007 0.023 0.001 0.250 0.070 18.589
1 2015 0.014 0.008 0.025 0.001 0.290 0.058 18.647
1 2016 0.014 0.002 0.018 0.008 0.280 0.054 18.795
1 2017 0.013 0.001 0.021 0.007 0.300 0.050 18.690
2 2012 0.002 0.010 0.035 0.001 0.650 0.020 17.978
2 2013 0.001 0.008 0.040 0.001 0.620 0.022 18.007
2 2014 0.001 0.008 0.052 0.001 0.640 0.035 18.052
2 2015 0.001 0.010 0.042 0.001 0.650 0.041 18.297
2 2016 0.001 0.010 0.046 0.001 0.560 0.043 18.469
2 2017 0.002 0.012 0.052 0.001 0.440 0.036 18.364
3 2012 0.031 0.001 0.087 0.009 0.380 0.062 18.553
3 2013 0.032 0.001 0.062 0.008 0.310 0.072 18.634
3 2014 0.032 0.001 0.045 0.005 0.460 0.048 18.769
3 2015 0.031 0.002 0.037 0.006 0.600 0.047 19.030
3 2016 0.031 0.003 0.053 0.006 0.590 0.044 19.190
3 2017 0.031 0.001 0.031 0.006 0.710 0.041 19.084
4 2012 0.001 0.014 0.098 0.002 0.700 0.049 17.746
4 2013 0.001 0.012 0.103 0.002 0.750 0.042 17.909
4 2014 0.001 0.014 0.090 0.001 0.310 0.049 18.137
4 2015 0.001 0.010 0.075 0.001 0.310 0.049 18.359
4 2016 0.001 0.010 0.075 0.001 0.280 0.045 18.650
4 2017 0.014 0.012 0.077 0.001 0.390 0.037 18.545
5 2012 0.004 0.002 0.020 0.037 0.390 0.070 18.484
5 2013 0.004 0.002 0.016 0.031 0.320 0.068 18.623
5 2014 0.004 0.001 0.025 0.038 0.700 0.074 18.840
5 2015 0.004 0.001 0.115 0.016 0.740 0.077 19.182
5 2016 0.004 0.001 0.095 0.022 0.720 0.073 19.414
5 2017 0.045 0.001 0.066 0.019 0.520 0.066 19.308
6 2012 0.004 0.010 0.037 0.004 0.480 0.025 17.043
6 2013 0.004 0.021 0.042 0.003 0.540 0.016 17.226
6 2014 0.004 0.010 0.046 0.003 0.520 0.022 17.377
6 2015 0.004 0.004 0.027 0.001 0.480 0.026 17.628
6 2016 0.004 0.005 0.042 0.002 0.540 0.021 17.786
6 2017 0.004 0.001 0.043 0.002 0.540 0.025 17.681
7 2012 0.001 0.006 0.091 0.004 0.530 0.044 18.011
7 2013 0.001 0.006 0.138 0.007 0.550 0.046 18.291

53
7 2014 0.001 0.005 0.107 0.013 0.580 0.052 18.336
7 2015 0.002 0.005 0.084 0.006 0.670 0.055 18.437
7 2016 0.001 0.007 0.086 0.006 0.560 0.056 18.560
7 2017 0.001 0.097 0.080 0.004 0.570 0.057 19.008
8 2012 0.176 0.003 0.011 0.002 0.570 0.052 19.008
8 2013 0.174 0.003 0.010 0.003 0.610 0.050 19.047
8 2014 0.182 0.030 0.008 0.003 0.750 0.052 19.106
8 2015 0.173 0.003 0.008 0.003 0.800 0.055 19.332
8 2016 0.172 0.005 0.007 0.004 0.760 0.059 19.559
8 2017 0.169 0.004 0.022 0.003 0.670 0.050 19.453
9 2012 0.205 0.015 0.038 0.003 0.680 0.024 17.180
9 2013 0.206 0.010 0.033 0.004 0.730 0.031 17.214
9 2014 0.200 0.014 0.033 0.004 0.740 0.017 17.494
9 2015 0.203 0.018 0.033 0.003 0.570 0.019 18.000
9 2016 0.206 0.008 0.040 0.003 0.620 0.019 18.032
9 2017 0.205 0.008 0.026 0.003 0.530 -0.013 17.927
10 2012 0.000 0.014 0.012 0.001 0.530 0.054 18.381
10 2013 0.000 0.016 0.010 0.001 0.550 0.050 18.540
10 2014 0.000 0.014 0.010 0.001 0.160 0.059 18.681
10 2015 0.000 0.014 0.009 0.001 0.180 0.060 18.626
10 2016 0.000 0.015 0.008 0.001 0.130 0.064 18.562
10 2017 0.000 0.016 0.009 0.001 0.350 0.038 18.456
11 2012 0.009 0.043 0.010 0.004 0.380 0.057 17.767
11 2013 0.009 0.040 0.009 0.003 0.460 0.046 18.011
11 2014 0.009 0.042 0.006 0.004 0.840 0.042 18.134
11 2015 0.009 0.045 0.005 0.005 0.860 0.046 18.348
11 2016 0.009 0.038 0.005 0.006 0.730 0.044 18.484
11 2017 0.008 0.038 0.004 0.006 0.700 0.040 18.378