the effect of financial compensation and motivation …
TRANSCRIPT

118
THE EFFECT OF FINANCIAL COMPENSATION AND
MOTIVATION ON PERFORMANCE WITH GENDER EQUALITY
AS THE MODERATING VARIABLE IN THE REGIONAL
SECRETARIAT OF EAST JAVA PROVINCE: THE STUDY OF NON-
PERMANENT EMPLOYEES WITH WORK AGREEMENTS
Arum Dwi Rachma
Master Study Program of Human Resource Development. Postgraduate School of Universitas
Airlangga. Surabaya. Indonesia.
E-mail : [email protected]
Abstract
The Role of Non-Permanent Employees with Work Agreements was very important to support the achievement of
the vision and mission of an organization. Performance evaluation of Non- Permanent Employees with Work Agreements assessed by the direct supervisor consisted of several aspects, namely integrity, discipline. service
orientation, cooperation, and coordination and the performance results of some employees were still relatively low.
The low performance could be caused by several factors one of which was financial compensation and motivation
owned by employees. Besides, to improved employee performance, gender equality in an organization also needs to
be considered. This was because, in the absence of gender differences in an organization, it was easier to achieve high
levels of performance. The purpose of this study was to identifying and analyzing the effect of financial compensation
and motivation on the performance of Non-Permanent Employees with Work Agreements with gender equality as a
moderating variable in the Regional Secretariat of East Java Province. This research used a quantitative approach
combined with an explanatory method design. The results of this study concluded that: 1.) Financial compensation
had a positive and significant effect on performance;
2.) Motivation had a positive and significant effect on performance; 3.) Gender equality had a positive and significant
effect on performance; 4.) Financial compensation and motivation had a positive and significant effect on the performance of Non-Permanent Employees with Work Agreements with gender as a moderating variable in the
Regional Secretariat of East Java Province.
Keywords: Financial Compensation, Motivation, Performance, Gender Equality
A. INTRODUCTION
The Regional Secretariat of the Province of East Java is a staff element that is under and
is responsible to the Governor of East Java. The Regional Secretariat is led by the Regional
Secretary who is domiciled and is responsible to the Governor. It consists of 9 (nine) bureaus. To
support organizational performance, each bureau employs temporary workers called Non-
Permanent Employees with Work Agreements. Non-Permanent Employees with Work
Sekolah Pascasarjana Universitas Airlangga
Jalan Airlangga No. 4-6, Surabaya - 60286 Telp. : (031) 5041566, 5041536
Email : [email protected]
Website : https://e-journal.unair.ac.id/ADJ

119
Agreements are non-permanent employees who are appointed by the Regional Secretary of East
Java Province by drawing up work contracts to carry out certain tasks in an organization and
performance evaluations are carried out annually by direct superiors as a basis for recommending
the extension of contracts for the following year. The age limit of Non-Permanent Employees with
Work Agreements is at least 18 years and a maximum of 56 years and may not be extended
for any reason. The Role of Non- Permanent Employees with Work Agreements is very
important to support the achievement of the vision and mission of an organization. In achieving
the vision and mission by these Agencies, it is expected that employee performance will increase
each year (Ogunleye and Osekita, 2016)1. But the performance in the Regional Secretariat of
East Java Province experienced ups and downs. The problem of performance degradation occurs
in several bureaus in the East Java Provincial Secretariat. This is shown in the following
recapitulation of performance appraisal in
2017-2018:
Table 1. Recapitulation of Non-Permanent Employee with Work Agreements Performance
Assessment Results for 2017-2018
No Field of Work Number Employees whose Number Employees whose
Performance Upgrade Performance Downgrade Total
1. Bureau of Public 12 2 14
Relations and Protocol
2. Organization Bureau 2 2 4
3. General Bureau 44 12 56
4. Social Welfare 12 - 12
Administration Bureau
5. Government
Administration and
Regional Autonomy
Bureau
5 - 5
6. Legal Bureau 3 - 3
7. Development 29 1 30
Administration Bureau
8. Economic Administration
Bureau
9. Natural Resources
4 - 4
- 7 7
Administration Bureau
Amount 111 24 135

120
(Source: e-Master of Regional Civil Service Agency of East Java Province, 2019)
Performance appraisal by the direct supervisor consists of several aspects, namely
integrity, discipline. service orientation, cooperation, and coordination (Siahaan, 2017)2.
Researchers conducted data processing on aspects of performance appraisal in 2017 and 2018,
obtained the number of performance which decreased and increased. Furthermore, the
researchers conducted interviews about the performance of Non-Permanent Employees with
Work Agreements to the Head of Divisions, Heads of Subdivisions and Civil Servants staff in
several bureaus, it is known that the performance of several Non-Permanent Employees with
Work Agreements is still relatively low.
According to Ghaffari, et. al. (2017)3, this is indicated by work that was not completed on time,
late for coming to the office and unsatisfactory work results. The low performance of Non-
Permanent Employees with Work Agreements at the Regional Secretariat of East Java Province
can be caused by several factors. The following are the results of the pre-survey conducted to 18
respondents regarding the factors that support employee performance.
Table 2. Pre-Survey Results Regarding Factors Affecting the Performance of Non-
Permanent Employees with Work Agreements No. Factors Affecting Performance Number of Answers Percentage (%)
1 Workload 8 22
2 Financial Compensation 12 33
3 Work Motivation 10 28
4 Leadership Style 6 17
Amount 36 100
(Source: Primary Data, 2019)
From the pre-survey results, it appears that the highest factor is financial compensation
of 33%. Furthermore, the second factor affecting work motivation is 28%. The smallest factor is
the boss's leadership style by 17%. Then the researchers conducted interviews and observations
of respondents Non-Permanent Employees with Work Agreements in each bureau to determine
the main causes that affect performance, namely financial compensation. Based on interviews
conducted the salaries of Non-Permanent Employees with Work Agreements differ in each
bureau. Some apply the same salary without looking at the level of education, but some
differentiate salaries from the level of education.
However, the difference in salary payments does not look at the burden of performance
and tenure, so that those who have heavier or lighter workloads or who serve longer are all equal
(Kee, Ahmad, and Abdullah, 2016)4. This has caused dissatisfaction with Non-Permanent

121
Employees with Work Agreements. The following is the list of Non-Permanent Employees with
Work Agreements in bureaus at the Regional Secretariat of East Java Province:
1 Ogunleye, A. J. & Osekita, D. A. (2016). Effect of job status, gender, and employees’ achievement motivation behavior on work performance: A case study of selected local government employees in Ekiti State, Nigeria. European Scientific Journal, 12(26), pp. 235-248. DOI: http://dx.doi.org/10.19044/esj.2016.v12n26p235
2 Siahaan, E. (2017). Antecedents of employee performance and the influence on employee job satisfaction in banking service sector in Indonesia. Banks and Bank Systems, 12(4), pp. 75-89. DOI: http://dx.doi.org/10.21511/bbs
3 Ghaffari, S., Shah, I. M., Burgoyne, J., Nazri, M. & Salleh, J. R. (2017). The influence of motivation on job performance: A case study at Universiti Teknologi Malaysia. Australian Journal of Basic and Applied Science, 11(4), pp. 92-99.

122
Table 3. Salary List of Non-Permanent Employees with Work Agreements No Field of Work The Amount of Salary
1. Government Administration and Regional Autonomy
Bureau IDR 3.500.000,00
2. Development Administration Bureau IDR 3.800.000,00
3. Economic Administration Bureau IDR 3.800.000,00
4. Social Welfare Administration Bureau IDR 3.800.000,00
5. Natural Resources Administration Bureau IDR 3.800.000,00
6. Legal Bureau IDR 3.300.000,00
7. Organization Bureau IDR 3.800.000,00
8. General Bureau IDR 3.800.000,00
9. Bureau of Public Relations and Protocol IDR 3.000.000,00
(Source: Bureau Budget Work Plan for Fiscal Year 2019)
With the provision of compensation to employees, the institution can motivate employees to
further improve employee performance (Gunawan and Amalia, 2015)5. Furthermore according to
Cainarca, Delfino, and Ponta (2019)6 where the purpose of giving compensation is as a bond of
cooperation, job satisfaction, effective procurement, motivation, employee stability,
discipline, and the influence of trade unions and the government. Thus, motivating employees
through the provision of compensation, especially financially, can be said to influence the
performance generated by employees (Ghafoor, Ansari, and Moazzam, 2017)7. Evelyne, Muathe,
and Kilika (2018)8 stated that motivation is a willingness to spend a high level of effort toward
organizational goals conditioned by the ability of the effort to meet individual needs if
motivation and compensation have been achieved, it will create high levels of employee
performance.
Also, to improve employee performance, gender equality in an organization needs to be
considered. This is because in the absence of gender differences in an organization, it is easier to
achieve high levels of performance. Meanwhile, the concept of gender is inherent in men and
women socially and culturally constructed (Hoque and Awang, 2019)9. For example, according
to Bae and Skaggs (2019)10 women are known to be gentle, beautiful, emotional, or motherly
while men are considered strong, rational, male, and mighty. The characteristics of the traits
themselves are interchangeable traits. This means that there are men who are emotional, gentle,
motherly, while there are also women who are strong, rational, and mighty.
The Government of East Java Province has implemented gender mainstreaming with the
issuance of East Java Province Regulation Number 3 of 2014 concerning the Medium-Term
Ghafoor, S., Ansari, N. & Moazzam, A. (2017). The effect of financial compensation and perceived career progression on employee turnover intentions with self actualization as a mediator. Governance & Management Review, 1(2), pp. 67-91 progression on employee turnover intentions with self actualization as a mediator. Governance & Management Review, 1(2), pp. 67-91 7

123
Development Plan of East Java Province in 2014-2019, one of the East Java development
strategies is Gender Mainstreaming, and observing East Java Governor Regulation Number 66 of
2013 concerning Guidelines for Implementing Gender Mainstreaming in the Development of
East Java Province and the issuance of East Java Governor Decree Number:
188/305/KPTS/013/2017 concerning the East Java Province Gender Mainstreaming Working
Group.
Thus regional development that considers gender can optimize the roles and functions of
women and men to be able to participate and enjoy the results of development in all fields. Every
year the agency in the Provincial Government of East Java reports the implementation of Gender
Mainstreaming. Based on these problems, the purpose of this study is to identify and analyze the
effect of financial compensation and motivation on the performance of Non-Permanent Employees
with Work Agreements with gender as a moderating variable in the Regional Secretariat of East
Java Province.
4 Kee, L. B., Ahmad, R. B. & Abdullah, S. M. (2016). Relationship between financial compensation and organizational
commitment among Malaysian bank workers. Asian Business Research, 1(1), pp. 75-85. 5 Gunawan, H. & Amalia, R. (2015). Wages and employees performance: The quality of work life as moderator.
International Journal of Economic and Financial Issues, 5, pp. 349-353. 6 Cainarca, G. C., Delfino, F. & Ponta, L. (2019). The effect of monetary incentives on individual and organizational
performance in an Italian Public Institution. Administrative Science, 9(72), pp. 1-19. DOI: http://dx.doi.org/10.3390/admsci9030072

124
B. LITERATURES
1. Financial Compensation
According to Cainarca, Delfino, and Ponta (2019)11 compensation is all income in the
form of money, direct or indirect goods received by employees in return for services rendered
to the institution. Kee, Ahmad, and Abdullah (2016)12 suggested that compensation can be
defined as any form of appreciation given to employees as a remuneration for the contribution
they make to the organization. Ghafoor, Ansari, and Moazzam (2017)13 explained that
compensation is something that employees receive as a substitute for their service contribution
8 Evelyne, N., Muathe, S. & Kilika, J. (2018). Mediating effect of motivation on employees performance in private
equity firms, Kenya. Journal of Human Resource Management, 6(2), pp. 78-84. DOI:
http://dx.doi.org/10.11648/j.jhrm.20180602.15
9 Hoque, A. S. M. M. & Awang, Z. B. (2019). Does gender difference play moderating role in the relationship between
entrepreneurial marketing and Bangladeshi SME performance?. Accounting, 5, pp. 35-52. DOI:
http://dx.doi.org/10.5267/j.ac.2018.06.001
10 Bae, K. & Skaggs, S. (2019). The impact of gender diversity on performance: The moderating role of industry,
alliance network, and family-friendly policies – Evidence from Korea. Journal of Management & Organization, 25(6), pp. 896-
913. DOI: http://dx.doi.org/10.1017/jmo.2017.45
11 Cainarca, G. C., Delfino, F. & Ponta, L. (2019). The effect of monetary incentives on individual and organizational
performance in an Italian Public Institution. Administrative Science, 9(72), pp. 1-19. DOI:
http://dx.doi.org/10.3390/admsci9030072
12 Kee, L. B., Ahmad, R. B. & Abdullah, S. M. (2016). Relationship between financial compensation and
organizational commitment among Malaysian bank workers. Asian Business Research, 1(1), pp. 75-85.
13 Ghafoor, S., Ansari, N. & Moazzam, A. (2017). The effect of financial compensation and perceived career
progression on employee turnover intentions with self actualization as a mediator. Governance & Management Review, 1(2), pp.
67-91

125
to Institutional organizations. Gunawan and Amalia (2015)14 stated that compensation is output
and the benefits that employees receive in the form of pay, wages and also the same rewards as
a monetary exchange for the employees to increase the performance.
Compensation is the segment of the transition between the employee and the owner that
results in the employee contract (Khan, et. al., 2019)15. As the prospective employee pay is the
necessity of life. The payment receives from work done on behalf of people getting
employment. From the prospective employee one of the most important parts of cash flow.
Compensation is mostly equal to half of the cash flow of the organizations but in the service
sector, it is more than half (Shah and Asad, 2018)16. It is the major to attract the employee and
motivate the employee to increase the performance. According to Ghafoor, Ansari, and
Moazzam (2017)17, there are several indicators of compensation, namely: 1.) The Payment
Rate Can Be Given High; 2.) Payment Structure; 3.) Determination of Individual Payments; 4.)
Payment Method; 5.) Payment Control.
2. Motivation
Work motivation can be interpreted as a desire or need that lies behind an individual
so that he is motivated to work (Ogunleye and Osekita, 2016)18. Besides, according to
Evelyne, Muathe, and Kilika (2018)19, motivation can be interpreted as an individual's
encouragement to take action because they want to do it. If the individual is motivated, the
individual will make a positive choice to do something, because it can satisfy his desires
(Ghaffari, et. al., 2017)20. Motivation is the willingness to spend a high level of effort toward
organizational goals which is conditioned by the ability of the effort to meet individual needs
(Shah and Asad, 2018)21.
From the limits that have been stated simply can be said that motivation is the
emergence of behavior that leads to certain goals with full commitment to the achievement of
the intended goals (Kee, Ahmad, and Abdullah, 2016)22. Work motivation as the most vital
driving force in performance achievement. While the theory according to Maslow in Shah
and Asad (2018)23 suggested that the hierarchy of employee needs are as follows: 1.)
Physiological Needs; 2.) Security Needs; 3.) Social Needs or Ownership; 4.) Need for Self-
Esteem; 5.) Self Actualization Needs.
14 Gunawan, H. & Amalia, R. (2015). Wages and employees performance: The quality of work life as moderator. International Journal of Economic and Financial Issues, 5, pp. 349-353.
15 Khan, M. A., Yusoff, R. M., Hussain, A. & Ismail, F. B. (2019). The mediating effect of job satisfaction on the relationship of HR practices and employee job performance: Empirical evidence from higher education sector. International Journal of Organizational Leadership, 8, pp. 78-94.

126
16 Shah, M. & Asad, M. (2018). Effect of motivation on employee retention: Mediating role of perceived organizational support. European Online Journal of Natural and Social Science, 7(2), pp. 511-520.
17 Ghafoor, S., Ansari, N. & Moazzam, A. (2017). The effect of financial compensation and perceived career progression on employee turnover intentions with self actualization as a mediator. Governance & Management Review, 1(2), pp.
67-91 18 Ogunleye, A. J. & Osekita, D. A. (2016). Effect of job status, gender, and employees’ achievement motivation
behavior on work performance: A case study of selected local government employees in Ekiti State, Nigeria. European Scientific Journal, 12(26), pp. 235-248. DOI: http://dx.doi.org/10.19044/esj.2016.v12n26p235
19 Evelyne, N., Muathe, S. & Kilika, J. (2018). Mediating effect of motivation on employees performance in private equity firms, Kenya. Journal of Human Resource Management, 6(2), pp. 78-84. DOI: http://dx.doi.org/10.11648/j.jhrm.20180602.15
20 Ghaffari, S., Shah, I. M., Burgoyne, J., Nazri, M. & Salleh, J. R. (2017). The influence of motivation on job performance: A case study at Universiti Teknologi Malaysia. Australian Journal of Basic and Applied Science, 11(4), pp. 92-99.
21 Shah, M. & Asad, M. (2018). Effect of motivation on employee retention: Mediating role of perceived organizational support. European Online Journal of Natural and Social Science, 7(2), pp. 511-520.
22 Kee, L. B., Ahmad, R. B. & Abdullah, S. M. (2016). Relationship between financial compensation and organizational commitment among Malaysian bank workers. Asian Business Research, 1(1), pp. 75-85.
23 Shah, M. & Asad, M. (2018). Effect of motivation on employee retention: Mediating role of perceived organizational support. European Online Journal of Natural and Social Science, 7(2), pp. 511-520.

127
3. Performance
Abbas and Waheed (2011)24 provided an opinion that the performance of the
employee is considered as what the employee does and what he doesn't do. Employee
performance involves quality and quantity of output, presence at work, accommodative and
helpful nature and timeliness of output. With the increase in employee performance is expected
to make a positive contribution to overall company performance (Jarboui, Saad, and Riguen,
2019)25. Siahaan (2017)26 stated that positive feedback will show that employees feel valued
from their work and can tell what needs to be improved from them so that employees will
improve their performance.
Measuring performance is of great importance to an incentive plan because it
communicates the importance of established organizational goals, what gets measured and
rewarded gets attention (Soomo, Soomro, and Memon, 2015)27. Factors affecting employee
performance are education, skills, work discipline, culture, and work ethics, management,
income level, the opportunity for achievement, workload, work environment and technology
(Cainarca, Delfino, and Ponta, 2019)28. According to Bae and Skaggs (2019)29, performance
indicators include: 1.) Quality; 2.) Quantity; 3.) Timelines; 4.) Cost-Effectiveness; 5.) Need for
Supervision; 6.) Interpersonal Impact.
4. Gender Equality
Hoque and Awang (2019)30 argued that gender is a social and cultural structure which
in turn differentiates between masculine and feminine characteristics. Masculine and
feminine are relative, depending on the socio-cultural context of the community concerned
(Khalid and Aroosh, 2014)31. The concept of gender equality arises because social scientists
see that women's subordination is common and runs for years with advantages on the part of
men so that it almost becomes an ideology, where gender ideology is an ideology that divides
the roles and ideal positions of women in the home ladder and society (Nakagawa, 2015)32.
This ideal role has finally become standard and stereotyped as the concept of gender equality,
which is inherent in both men and women that are socially and culturally constructed (Abbas
24 Abbas, A. & Waheed, A. (2011). Gender discrimination & Its effect on employee performance/productivity.
International Journal of Humanities and Social Science, 1(15), pp. 170-176. 25 Jarboui, A., Saad, M. K. B. & Riguen, R. (2019). Tax avoidance: Do board gender diversity and sustainability
performance make a difference?. Journal of Financial Crime, 1(3), pp. 1-20. DOI: http://dx.doi.org/10.1108/JFC-09-2019-0122 26 Siahaan, E. (2017). Antecedents of employee performance and the influence on employee job satisfaction in banking
service sector in Indonesia. Banks and Bank Systems, 12(4), pp. 75-89. DOI: http://dx.doi.org/10.21511/bbs 27 Soomo, P., Soomro, F. & Memon, M. S. (2015). Gender discrimination and Its impact on employee
productivity/performance: A study on government universities of Upper Sindh. International Journal of Management Science and Business Research, 4(6), pp. 36-40.
28 Cainarca, G. C., Delfino, F. & Ponta, L. (2019). The effect of monetary incentives on individual and organizational performance in an Italian Public Institution. Administrative Science, 9(72), pp. 1-19. DOI:

128
No Field of Work Population Percentage of Sam
Proportion (%) ple
Samp
1 General Bureau 64 41% 46
2 Bureau of Public Relations and Protocol 17 11% 12
3 Organization Bureau 4 3% 3
4 Social Welfare Administration Bureau 21 13% 15
http://dx.doi.org/10.3390/admsci9030072 29 Bae, K. & Skaggs, S. (2019). The impact of gender diversity on performance: The moderating role of industry,
alliance network, and family-friendly policies – Evidence from Korea. Journal of Management & Organization, 25(6), pp. 896- 913. DOI: http://dx.doi.org/10.1017/jmo.2017.45
30 Hoque, A. S. M. M. & Awang, Z. B. (2019). Does gender difference play moderating role in the relationship between entrepreneurial marketing and Bangladeshi SME performance?. Accounting, 5, pp. 35-52. DOI: http://dx.doi.org/10.5267/j.ac.2018.06.001
31 Khalid, M. & Aroosh, R. (2014). Outcomes of gender discrimination: A study of female workers in banking sector of Pakistan. Journal of Business and Management, 16(7), pp. 38-48.
32 Nakagawa, Y. (2015). The gender diversity – firm performance relationship by industry type, working hours, and inclusiveness: An empirical study of Japanese firms. Journal of Diversity Management, 10(1), pp. 61-78.
and Waheed, 2011)33. According to Ngao and Mwangi (2013)34 identifying indicators of
gender equality are as follows: 1.) Access; 2.) Participation; 3.) Control; 4.) Benefits.
C. METHODS
1. Research Approach and Design
This research uses a quantitative approach combined with explanatory method design.
Explanatory research is research conducted by researchers to determine the level of
relationship between two or more variables, without making changes, additions, or
manipulation of data that already exists (Capraro, 201635; Rahi, 2017)36. Where this research
variable consists of 2 independent variables namely financial compensation (X1) and
motivation (X2), the dependent variable is performance (Y), and the moderating variable is
gender equality (Z).
2. Sampling Technique
The population in this study is Non-Permanent Employees with Work Agreements at
the Regional Secretariat of East Java Province. The sampling technique used in this study
uses a proportional sampling technique, where every subject in the population has the same
opportunity to be elected or not selected as a respondent. The sample size calculation uses the
Slovin formula which is formulated as follows:
n = N/1(d)2
Obtained sample of respondents as follows:
Table 4. The Result of Proportional Sampling
le
5 Government Administration and Regional
Autonomy Bureau 5 4% 4
6 Legal Bureau 3 2% 2
7 Development Administration Bureau 30 20% 22

129
8 Economic Administration Bureau 4 3% 3
9 Natural Resources Administration Bureau 7 4% 5
Amount 155 100% 112
(Source: Primary Data, 2019)
3. Collecting and Data Analysis
In the use of data collection techniques, researchers need instruments that are tools to
make the process of collecting data easier, including 1.) Questionnaire; 2.) Literature Study;
3.) Documentation Study; 4.) Observation Study (Rahi, 2017). Where the test instruments
used are validity test, reliability test, and analysis test of Partial Least Square (Hair, et. al.,
201137; Henseler, et. al., 2014).38
D. RESULT AND DISCUSSION
The results of the interpretation of quantitative data in this study explain the validity
test, reliability test, and the Partial Least Square analysis test.
1. Validity Test and Reliability Test
Before further analysis, an instrument test was conducted using a
questionnaire consisting of validity and reliability tests.
1.) Validity Test
Validity test shows how well an instrument can measure a particular concept. Validity test is carried out on each statement item that forms the research variable. To determine the calculated value, assisted with the analysis of the Partial Least Square (PLS) program which is stated by the value of the Coorrected Item Total Correlation. If Pearson product moment correlation between each statement with a total score produces a positive correlation value (rcount) and rcount > 0,186 (rtable), then the statement item is declared valid. Following are the results of testing the validity of each statement item on the research
33 Abbas, A. & Waheed, A. (2011). Gender discrimination & Its effect on employee performance/productivity.
International Journal of Humanities and Social Science, 1(15), pp. 170-176. 34 Ngao, E. & Mwangi, C. (2013). Effects of managing gender of employees in enhancing organizational performance:
A case study of Kenya ports authority. European Journal of Business and Management, 5(21), pp. 1-8. 35 Capraro, K. L. (2016). An explanatory case study of the implementation of co-teaching as a student teaching method.
Dissertation. University of Rhode Island. 36 Rahi, S. (2017). Research design and methods: A systematic review of research paradigms, sampling issues and
instruments development. International Journal of Economy and Management Science, 6(2), pp. 1-6. DOI: http://dx.doi.org/10.4172/2162-6359.1000403
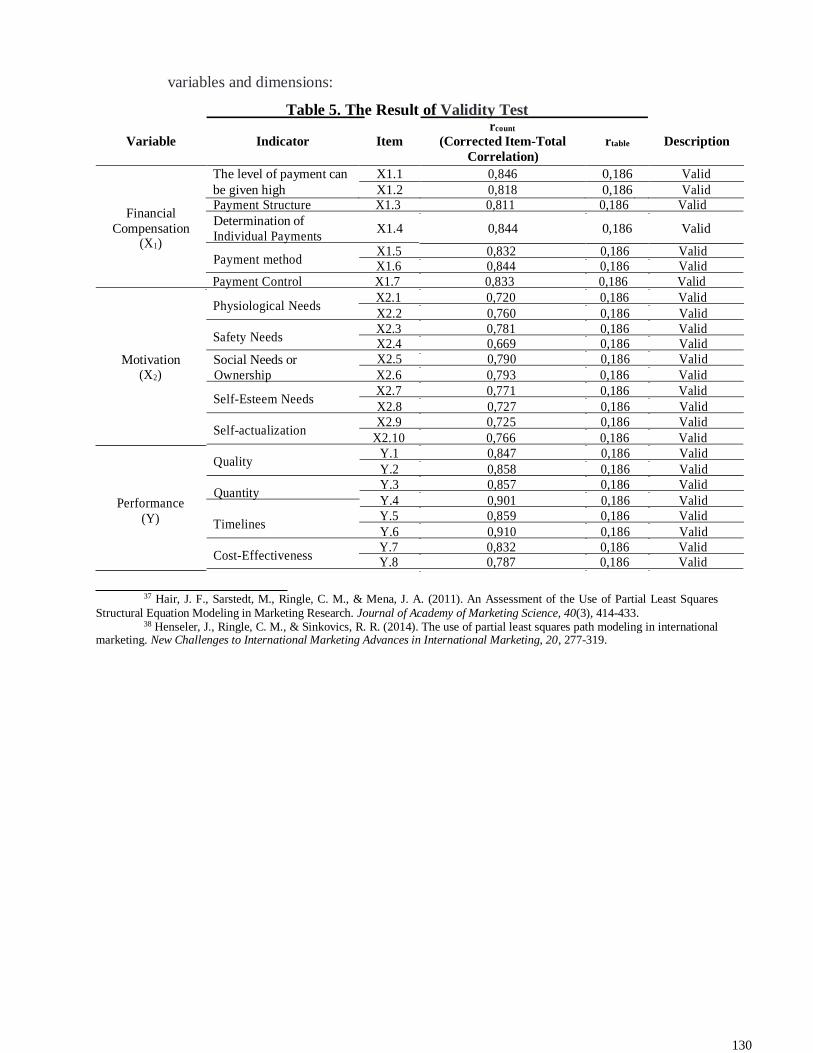
130
variables and dimensions:
Table 5. The Result of Validity Test
rcount Variable Indicator Item (Corrected Item-Total rtable Description
Correlation)
The level of payment can X1.1 0,846 0,186 Valid
be given high X1.2 0,818 0,186 Valid
Financial Payment Structure X1.3 0,811 0,186 Valid
Compensation Determination of X1.4 0,844 0,186 Valid
(X1) Individual Payments
Payment method X1.5 0,832 0,186 Valid
X1.6 0,844 0,186 Valid
Payment Control X1.7 0,833 0,186 Valid
Physiological Needs X2.1 0,720 0,186 Valid
X2.2 0,760 0,186 Valid
Safety Needs X2.3 0,781 0,186 Valid
X2.4 0,669 0,186 Valid
Motivation Social Needs or X2.5 0,790 0,186 Valid
(X2)
Performance
(Y)
Ownership X2.6 0,793 0,186 Valid
Self-Esteem Needs X2.7 0,771 0,186 Valid
X2.8 0,727 0,186 Valid
Self-actualization X2.9 0,725 0,186 Valid
X2.10 0,766 0,186 Valid
Quality Y.1 0,847 0,186 Valid
Y.2 0,858 0,186 Valid
Quantity Y.3 0,857 0,186 Valid Y.4 0,901 0,186 Valid
Timelines Y.5 0,859 0,186 Valid
Y.6 0,910 0,186 Valid
Cost-Effectiveness Y.7 0,832 0,186 Valid
Y.8 0,787 0,186 Valid
37 Hair, J. F., Sarstedt, M., Ringle, C. M., & Mena, J. A. (2011). An Assessment of the Use of Partial Least Squares
Structural Equation Modeling in Marketing Research. Journal of Academy of Marketing Science, 40(3), 414-433. 38 Henseler, J., Ringle, C. M., & Sinkovics, R. R. (2014). The use of partial least squares path modeling in international
marketing. New Challenges to International Marketing Advances in International Marketing, 20, 277-319.

131
Variable Indicator Item
rcount (Corrected Item-
Total Correlation)
rtable Description
Need for Supervision Y.9 0,906 0,186 Valid
Y.10 0,832 0,186 Valid
Interpersonal Impact Y.11 0,879 0,186 Valid
Y.12 0,877 0,186 Valid z1.1 0,779 0,186 Valid
Access z1.2 0,745 0,186 Valid z1.3 0,768 0,186 Valid
Z1.4 0,766 0,186 Valid
Gender Equality Participation Z1.5 0,835 0,186 Valid
(Z) Z1.6 0,783 0,186 Valid
Control Z1.7 0,771 0,186 Valid
Z1.8 0,774 0,186 Valid
Benefits Z1.9 0,790 0,186 Valid
Z1.10 0,812 0,186 Valid
(Source: Primary Data, 2020)
Based on table 5 it is known that all the question items on the research variable have a
calculated rcount greater than rtable of 0,186 so that all question items on the research
variable are declared valid and can be used for further analysis processes.
2.) Reliability Test
Reliability test shows the extent to which the gauges are reliable. To measure the
reliability used Cronbach alpha value. If the Cronbach alpha value > 0,600, then the
statement items that make up the research variable are declared reliable. Here are the
results of testing the reliability of research variables:
Table 6. The Result of Reliability Test
Variable Cronbach Alpha Critical Value Description
Financial Compensation (X1) 0,951 0,600 Reliabel Motivation (X2) 0,938 0,600 Reliabel Performance (Y) 0,974 0,600 Reliabel
Gender Equality (Z) 0,948 0,600 Reliabel
(Source: Primary Data, 2020)
Based on table 6 it shows that the magnitude of the Cronbach alpha value on the
research variable is greater than 0,600, thus the question items that measure the research
variable are declared reliable and the research questionnaire can be said to be a consistent
measuring tool.
2. Partial Least Square Analysis Test
To test the research hypothesis the following Partial Least Square analysis test is
used:
1.) Evaluation of the Outer Model (Measurement Model)

132
a.) Convergent Validity
The first evaluation of the outer model is convergent validity. Convergent validity
is measured by looking at the outer loading value of each indicator. An indicator is
said to meet convergent validity if it has an outer loading value ≥ of 0,500. The
following is the outer loading value of each indicator in the research variable:
Table 7. Value of Outer Loading Model
Item Financial Compensation
(X1) Motivation
(X2)
Performance
(Y)
Gender Equality
(Z)

133
Item Financial Compensation Motivation Performance Gender Equality
(X1) (X2) (Y) (Z)
X1.1 0,883
X1.2 0,863
X1.3 0,861
X1.4 0,886
X1.5 0,891
X1.6 0,887
X1.7 0,881
X2.1 0,807
X2.2 0,793
X2.3 0,806
X2.4 0,712
X2.5 0,808
X2.6 0,850
X2.7 0,816
X2.8 0,784
X2.9 0,798
X2.10 0,821
Y.1 0,875
Y.2 0,882
Y.3 0,883
Y.4 0,917
Y.5 0,885
Y.6 0,926
Y.7 0,858
Y.8 0,818
Y.9 0,924
Y.10 0,859
Y.11 0,899
Y.12 0,898
Z.1 0,851
Z.2 0,806
Z.3 0,837
Z.4 0,784
Z.5 0,868
Z.6 0,810
Z.7 0,811
Z.8 0,807
Z.9 0,831
Z.10 0,842 (Source: Primary Data, 2020)
Based on table 7 above, it is known that the outer loading value for each indicator
on the research variables all has values of more than 0,500. This means that the
indicators used in this study have fulfilled convergent validity.
b.) Discriminate Validity
The second evaluation of the outer model is discriminant validity. Discriminant
validity is measured using cross-loading. An indicator is said to meet discriminant
validity if the cross-loading indicator value of the variable is the largest compared to
other variables:

134
Table 8. Value of Cross-Loading
Item Financial Compensation Motivation Performance Gender Equality

135
(X1) (X2) (Y) (Z)
X1.1 0,883 0,017 0,351 0,347
X1.2 0,863 -0,018 0,349 0,254
X1.3 0,861 -0,071 0,372 0,271
X1.4 0,886 -0,140 0,395 0,312
X1.5 0,891 0,101 0,512 0,341
X1.6 0,887 0,054 0,400 0,343
X1.7 0,881 -0,045 0,411 0,200
X2.1 0,128 0,807 0,369 0,235
X2.2 -0,046 0,793 0,203 0,182
X2.3 -0,075 0,806 0,158 0,165
X2.4 -0,031 0,712 0,170 0,138
X2.5 -0,075 0,808 0,150 0,220
X2.6 0,003 0,850 0,274 0,129
X2.7 -0,077 0,816 0,242 0,251
X2.8 0,010 0,784 0,251 0,104
X2.9 0,051 0,798 0,307 0,193
X2.10 -0,122 0,821 0,256 0,221
Y.1 0,405 0,332 0,875 0,374
Y.2 0,398 0,231 0,882 0,358
Y.3 0,417 0,284 0,883 0,429
Y.4 0,405 0,322 0,917 0,385
Y.5 0,497 0,244 0,885 0,424
Y.6 0,364 0,336 0,926 0,358
Y.7 0,370 0,298 0,858 0,425
Y.8 0,356 0,206 0,818 0,317
Y.9 0,405 0,334 0,924 0,457
Y.10 0,424 0,268 0,859 0,380
Y.11 0,464 0,237 0,899 0,423
Y.12 0,383 0,287 0,898 0,436
Z.1 0,251 0,297 0,508 0,851
Z.2 0,316 0,159 0,427 0,806
Z.3 0,350 0,216 0,457 0,837
Z.4 0,201 0,125 0,169 0,784
Z.5 0,252 0,167 0,341 0,868
Z.6 0,263 0,101 0,249 0,810
Z.7 0,195 0,226 0,306 0,811
Z.8 0,320 0,087 0,319 0,807
Z.9 0,257 0,203 0,365 0,831
Z.10 0,326 0,236 0,328 0,842
(Source: Primary Data, 2020)
Based on table 8, it is known that the cross-loading value of all indicators that
make up each variable in this study (the value in bold) has fulfilled discriminant
validity because it has the largest cross-loading value for the variable it forms and not
the other variables. Thus all indicators in each variable in this study have met
discriminant validity.
c.) Average Variance Extract (AVE)
Average Variance Extract (AVE) illustrates the average variance or discriminant
extracted on each indicator so that the ability of each item to share measurements

136
with the others can be known. AVE value equal to or above 0,5 indicates a good
convergent as shown in the following table:
Table 9. Value of Average Variance Extract
Variable AVE
Financial Compensation (X1) 0,772 Motivation (X2) 0,640 Performance (Y) 0,785
Gender Equality (Z) 0,681
(Source: Primary Data, 2020)
Based on table 9 above it is known that the average variance extract (AVE) value
of each variable is above the critical limit, then the indicators on each variable have
converged.
d.) Composite Reliability
The last evaluation of the outer model is composite reliability. Composite
reliability tests the consistency of indicators in measuring a construct. A constructor
variable is said to meet composite reliability if it has a composite reliability value ≥ of
0,700. Here are the composite reliability values of each variable:
Table 10. Value of Composite Reliability Variable Composite Reliability
Financial Compensation (X1) 0,960 Motivation (X2) 0,947 Performance (Y) 0,978
Gender Equality (Z) 0,955
(Source: Primary Data, 2020)
Based on table 10 above shows that the composite reliability value of each study
variable has a value of more than 0,700. Thus it can be concluded that each variable
meets the composite reliability.
The following is a measurement model to visualize the relationship effect between the
variables of this study presented in the figure below:

137
Figure 1. The Result of Partial Least Square Measurement Model Analysis
(Source: Primary Data, 2020)
2.) Evaluation of the Inner Model (Structural Model)
a.) R-Square Value
The first evaluation of the inner model is seen from the R-Square value or the coefficient
of determination. Based on data processing with Partial Least Square, the resulting R-Square
values are as follows:
Table 11. Value of R-Square
Dependent Variable R-Square
Performance (Y) 0,516 (Source:
Primary Data, 2020)
From table 11 above it is known that the R-Square value for purchase intention is
0.516 which means that the percentage of the effect of financial compensation and motivation
on performance with gender as a moderating variable is 51.6% while the remaining 48.4% is
explained by other variables. In the Partial Least Square model, the assessment of the
goodness of fit is known from the Q2 value. Q2 value has the same meaning as the
coefficient of determination (R-Square) in the regression analysis, where the higher the
R-Square, the model can be said to be more fit with the data. From the research model, it is
known that the Q2 value is the same as the R- Square value of 0.516, meaning that the

138
magnitude of the diversity of research data that can be explained by the structural model
developed in this study is 51.6%.
3.) Hypothesis Testing with Inner Weight
Testing of research hypothesis using Partial Least Square analysis is done using an inner
weight table. The research hypothesis can be accepted if the value of the tcount (t- statistic) ≥
ttable at an error rate (α) of 5% is 1.96. Here are the path coefficient values (original sample
estimate) and calculated values (t-statistics) on the inner model:
Table 12. The Result of Path Coefficient and tcount
Variable Effect Original
Sample Standard
Deviation Standard
Error
t-statistics

139
Sample (O) Mean (M) (STDEV) (STERR)
(|O/STERR|)
Financial Compensation (X1) →
Performance (Y) 0,315 0,309 0,070 0,070 4,514
Motivation (X2) → Performance (Y) 0,301 0,290 0,070 0,070 4,301 Gender Equality (Z) → Performance (Y) 0,404 0,374 0,113 0,113 3,585
Financial Compensation (X1) & Gender
Equality (Z) → Performance (Y) 0,005 0,001 0,121 0,121 0,042
Motivation (X2) & Gender Equality (Z)
→ Performance (Y) 0,405 0,399 0,162 0,162 2,494
(Source: Primary Data, 2020)
The path coefficient value of the effect of financial compensation on performance is
0,315 with a t-statistic value of 4,514 which is greater than 1,96. This shows that
there is a positive and significant effect between financial compensation on
performance, so the greater the value of compensation received, the more
performance will improve. Based on these results the first hypothesis (H1) of the
study which suggests that there is an effect of financial compensation on
performance of Non-Permanent Employees with Work Agreements in the
Regional Secretariat of East Java Province can be accepted and proven true.
The path coefficient value of the effect of motivation on performance is 0,301
with a t-statistic value of 4,301 which is greater than 1,96. This shows that there is
a positive and significant effect between motivation on performance, so the higher
the perceived motivation, the more performance will improve. Based on these results
the second hypothesis (H2) of the study which suggests that there is an effect
motivational on performance of Non-Permanent Employees with Work Agreements
in the Regional Secretariat of East Java Province can be accepted and proven true.
The path coefficient value of the effect of gender equality on performance is
0,404 with a t-statistic value of 3,585 which is greater than 1,96. This shows that
there is a positive and significant effect between gender equality on performance, so
the higher the perceived gender equality, the more performance will improve. Based
on these results the third hypothesis (H3) of the research which suggests that there is
an effect of gender equality on performance of Non-Permanent Employees with Work
Agreements in the Regional Secretariat of East Java Province can be accept ed and
proven true.
The path coefficient value of the effect of financial compensation on
performance with gender equality as a moderating variable is 0,005 with a t-statistic
value of 0,042 which is smaller than 1,96. This shows that the existence of gender
equality does not strengthen or weaken the effect of compensation on performance.

140
Based on these results the fourth(a) hypothesis (H4a) of the study that suggests that
there is an effect of financial compensation on performance of Non-Permanent
Employees with Work Agreements with gender equality as a moderating variable in
the Regional Secretariat of East Java Province can not be accepted and unproven.
The path coefficient value of the effect of motivation on performance with gender
equality as a moderating variable is 0,405 with a t-statistic value of 2,494 that is
greater than 1,96. This shows that gender equality strengthens the effect of motivation
on performance, the more it recognizes gender equality the more it will strengthen the
influence of motivation on performance. Based on these results the fourth(b)
hypothesis (H4b) of the study which suggests that there is an effect motivation on
performance ofNon-Permanent Employees with Work Agreements with gender
equality as a moderating variable in the Regional Secretariat of East Java Province
can be accepted and proven.
Overall this shows that there is an effect of financial compensation and motivation on
performance of Non-Permanent Employees with Work Agreements with gender equality
as a moderating variable in the Regional Secretariat of East Java Province on the fourth
hypothesis (H4) can be accepted and proven. The following is a structural model to
visualize the relationship effect between the variables of this study presented in the figure
below:
Figure 2. The Result of Partial Least Square Structural Model Analysis
(Source: Primary Data, 2020)

141
E. CONCLUSION AND RECOMMENDATION
This study uses an explanatory quantitative research method approach regarding the
effect of financial compensation and motivation on the performance of Non-Permanent
Employees with Work Agreements with gender equality as a moderating variable in the Regional
Secretariat of the East Java Province using Partial Least Square analysis:
1.) Financial compensation has a positive and significant effect on performance, with a path
coefficient value of 0,315 and a t-statistic value of 4,514 greater than 1,96 where the
greater the value of financial compensation received will further improve employee
performance. Based on these results the first hypothesis of the study which allegedly had
the effect of financial compensation (X1) on performance (Y) of Non-Permanent
Employees with Work Agreements at the Regional Secretariat of the East Java Province
can be accepted and proven.
2.) Motivation has a positive and significant effect on performance, with a path coefficient
value of 0,301 and a t-statistic value of 4,301 greater than 1,96 where the higher the
perceived motivation, the more performance will improve. Based on these results, the
second hypothesis of the study which suggests that there is an effect of motivation (X2)

142
on performance (Z) of Non-Permanent Employees with Work Agreements at the
Regional Secretariat of the East Java Province can be accepted and proven.
3.) Gender equality has a positive and significant effect on performance, with a path
coefficient value of 0,404 with a t-statistic value of 3,585 which is greater than 1,96
where the higher the perceived gender equality, the more performance will improve.
Based on these results the third hypothesis of the research which suspects that there is an
effect of gender equality (Z) on performance (Y) of Non-Permanent Employees with
Work Agreements at the Regional Secretariat of the East Java Province can be accepted
and proven.
4.) Financial compensation and motivation have positive and significant effect on
performance of Non-Permanent Employees with Work Agreements with gender equality
as a moderating variable in the fourth hypothesis (H4) that can be accepted and proven,
with the path coefficient value of compensation effect on performance with gender
equality as a moderating variable is 0,005 with a t-statistic value of 0,042 which is less
than 1,96 which shows that gender equality does not strengthen or weaken the effect of
compensation on performance. Based on these results the fourth(a) hypothesis (H4a) of
research suggesting that there is an effect of financial compensation on performance of
Non-Permanent Employees with Work Agreements with gender as a moderating variable
in the Regional Secretariat of East Java Province is unacceptable and unproven. While
the path coefficient value of the effect of motivation on performance with gender equality
as a moderating variable is 0,405 with a t-statistic value of 2,494 greater than 1,96 where
this shows that with gender equality reinforcing the effect of motivation on performance,
the more recognized gender equality will increasingly strengthen the influence of
motivation on performance. Based on these results the fourth(b) hypothesis (H4b) of the
study which suggests that there is a motivational effect on performance of Non-
Permanent Employees with Work Agreements with gender as a moderating variable in
the Regional Secretariat of the Province of East Java can be accepted and proven.
Based on the results of the analysis and discussion of this study, the researcher proposes
the following recommendations:
1.) There needs to be monitoring and evaluation related to the provision of financial
compensation obtained by Non-Permanent Employees with Work Agreements at the
Regional Secretariat of East Java Province by looking at the results of the performance
appraisal obtained.

143
2.) The motivation given to Non-Permanent Employees with Work Agreements at the
Regional Secretariat of the Province of East Java needs to be improved in all aspects so
that they can participate in increasing the performance achieved following individual and
institutional goals.
3.) The pattern of gender equality is needed concretely to improve the performance of Non-
permanent Employees with Work Agreements at the Regional Secretariat of East Java
Province based on the Regional Regulation of East Java Province Number 3 of 2014
concerning the Regional Medium-Term Development Plan (RPJMD) of East Java
Province in 2014 - 2019, one of the East Java development strategies is Gender
Mainstreaming, and observing the East Java Governor's Regulation Number 66 the Year
2013 concerning Guidelines for Implementing Gender Mainstreaming in the
Development of the East Java Province and the East Java Governor's Decree issued:
188/305 / KPTS / 013/2017 concerning Working Groups Gender Mainstreaming of East
Java Province can optimize the roles and functions of women and men to be able to
participate and enjoy the results of development in all fields.
ACKNOWLEDGMENT
Researchers give thanks to God Almighty God because of His blessings and grace we can
complete this research well. Not to forget, we also thank the Chairman of the Regional
Secretariat of East Java Province and the Non-Permanent Employees with Work Agreements
who are willing to be respondents in this study.
REFERENCES
Abbas, A. & Waheed, A. (2011). Gender discrimination & Its effect on employee
performance/productivity. International Journal of Humanities and Social Science, 1(15),
pp. 170-176.
Bae, K. & Skaggs, S. (2019). The impact of gender diversity on performance: The moderating
role of industry, alliance network, and family-friendly policies – Evidence from Korea.
Journal of Management & Organization, 25(6), pp. 896-913. DOI:
http://dx.doi.org/10.1017/jmo.2017.45
Cainarca, G. C., Delfino, F. & Ponta, L. (2019). The effect of monetary incentives on individual and organizational performance in an Italian Public Institution. Administrative Science, 9(72), pp. 1-19. DOI: http://dx.doi.org/10.3390/admsci9030072
Capraro, K. L. (2016). An explanatory case study of the implementation of co-teaching as a
student teaching method. Dissertation. University of Rhode Island.
Evelyne, N., Muathe, S. & Kilika, J. (2018). Mediating effect of motivation on employees
performance in private equity firms, Kenya. Journal of Human Resource Management,
6(2), pp. 78-84. DOI: http://dx.doi.org/10.11648/j.jhrm.20180602.15

144
Ghaffari, S., Shah, I. M., Burgoyne, J., Nazri, M. & Salleh, J. R. (2017). The influence of
motivation on job performance: A case study at Universiti Teknologi Malaysia.
Australian Journal of Basic and Applied Science, 11(4), pp. 92-99.
Ghafoor, S., Ansari, N. & Moazzam, A. (2017). The effect of financial compensation and perceived career progression on employee turnover intentions with self actualization as a mediator. Governance & Management Review, 1(2), pp. 67-91
Gunawan, H. & Amalia, R. (2015). Wages and employees performance: The quality of work life as moderator. International Journal of Economic and Financial Issues, 5, pp. 349-353.
Hair, J. F., Sarstedt, M., Ringle, C. M., & Mena, J. A. (2011). An Assessment of the Use of Partial Least Squares Structural Equation Modeling in Marketing Research. Journal of Academy of Marketing Science, 40(3), 414-433.
Henseler, J., Ringle, C. M., & Sinkovics, R. R. (2014). The use of partial least squares path modeling in international marketing. New Challenges to International Marketing Advances in International Marketing, 20, 277-319.
Hermawan, S. & Sari, L. N. I. (2018). Motivation as moderating variable on the effect of moral reasoning and ethical sensitivity toward the ethical behavior of accounting students.
Journal of Accounting and Business Education, 3(1), pp. 72-92.
Hoque, A. S. M. M. & Awang, Z. B. (2019). Does gender difference play moderating role in the
relationship between entrepreneurial marketing and Bangladeshi SME performance?.
Accounting, 5, pp. 35-52. DOI: http://dx.doi.org/10.5267/j.ac.2018.06.001
Jarboui, A., Saad, M. K. B. & Riguen, R. (2019). Tax avoidance: Do board gender diversity and
sustainability performance make a difference?. Journal of Financial Crime, 1(3), pp. 1-
20. DOI: http://dx.doi.org/10.1108/JFC-09-2019-0122
Kee, L. B., Ahmad, R. B. & Abdullah, S. M. (2016). Relationship between financial
compensation and organizational commitment among Malaysian bank workers. Asian
Business Research, 1(1), pp. 75-85.

145
Khalid, M. & Aroosh, R. (2014). Outcomes of gender discrimination: A study of female workers
in banking sector of Pakistan. Journal of Business and Management, 16(7), pp. 38-48.
Khan, M. A., Yusoff, R. M., Hussain, A. & Ismail, F. B. (2019). The mediating effect of job satisfaction on the relationship of HR practices and employee job performance: Empirical evidence from higher education sector. International Journal of Organizational Leadership, 8, pp. 78-94.
Nakagawa, Y. (2015). The gender diversity – firm performance relationship by industry type, working hours, and inclusiveness: An empirical study of Japanese firms. Journal of Diversity Management, 10(1), pp. 61-78.
Ngao, E. & Mwangi, C. (2013). Effects of managing gender of employees in enhancing organizational performance: A case study of Kenya ports authority. European Journal of Business and Management, 5(21), pp. 1-8.
Ogunleye, A. J. & Osekita, D. A. (2016). Effect of job status, gender, and employees’ achievement motivation behavior on work performance: A case study of selected local
government employees in Ekiti State, Nigeria. European Scientific Journal, 12(26), pp.
235-248. DOI: http://dx.doi.org/10.19044/esj.2016.v12n26p235
Rahi, S. (2017). Research design and methods: A systematic review of research paradigms,
sampling issues and instruments development. International Journal of Economy and
Management Science, 6(2), pp. 1-6. DOI: http://dx.doi.org/10.4172/2162-6359.1000403
Shah, M. & Asad, M. (2018). Effect of motivation on employee retention: Mediating role of
perceived organizational support. European Online Journal of Natural and Social
Science, 7(2), pp. 511-520.
Siahaan, E. (2017). Antecedents of employee performance and the influence on employee job
satisfaction in banking service sector in Indonesia. Banks and Bank Systems, 12(4), pp.
75-89. DOI: http://dx.doi.org/10.21511/bbs
Soomo, P., Soomro, F. & Memon, M. S. (2015). Gender discrimination and Its impact on
employee productivity/performance: A study on government universities of Upper Sindh.
International Journal of Management Science and Business Research, 4(6), pp. 36-40.