the effect of financial restructuring on …chss.uonbi.ac.ke/sites/default/files/chss/osoro peter...
TRANSCRIPT

THE EFFECT OF FINANCIAL RESTRUCTURING ON THE
FINANCIAL PERFORMANCE OF COMMERCIAL BANKS IN
KENYA
BY
OSORO PETER MASENO
D63/60677/2013
A RESEARCH PROJECT SUBMITTED IN PARTIAL
FULFILLMENT OF THE REQUIREMENT FOR THE AWARD OF
THE DEGREE IN MASTER OF SCIENCE IN FINANCE,
UNIVERSITY OF NAIROBI
NOVEMBER 2014

ii
DECLARATION
This research proposal is my own work, and has never been submitted by anyone to any
institution for any award. Any other author’s work has been clearly acknowledged.
Signed………………………………… Date……………………………
Osoro Peter Maseno
D63/60677/2013
This research project has been submitted for examination with my approval as the
university supervisor.
Signed………………………………. Date……………………………
DR. Josiah Aduda,
Dean, School of Business, University of Nairobi

iii
DEDICATION
To my family, friends and lecturers, may this work be a living proof that
hard work, patience, persistence, and prayers can make you actualize your
dreams.

iv
ACKNOWLEDGEMENT
I thank God for giving me the wisdom and guidance throughout my life for without Him I
would not have come this far. I also would like to acknowledge the following for their
selfless contributions which facilitated the completion of this project.
Special thanks go to my supervisor Dr. Josiah Aduda, for providing invaluable and active
guidance throughout the study. His immense command and knowledge of the subject
matter enabled me to shape this research project to the product that it is now.
I also thank my family for their financial and moral support towards the achievement of
this requirement. It is my hope that their sacrifice has finally paid off.
Finally, I wish to thank a number of people who in own way contributed towards
completion of this project especially Jackie Watuka, Bade Kwanya and Patience Njue for
their time and support.

v
ABSTRACT
The objective of this study was to determine the effect of financial restructuring on the
financial performance of commercial banks in Kenya. Generally, the expectation is that
financial restructuring when employed by the management of a firm; it should have some
effects on the performance of the firm, in this case the performance of the commercial
banks.
The study was conducted on 11 commercial banks in Kenya, all of which are listed in the
Nairobi Securities Exchange and which were in operation in Kenya during the six-year
period of the study that is from 2008 to 2013. The various ratios that make the variables
under consideration, namely debt ratio, dividend payout ratio and equity ratio of these
commercial banks were computed from the various data collected and extracted from the
annual financial statements of the said listed commercial banks for the period of study.
The data was then analyzed using a multiple linear regression model using SPSS
version 20, to establish if there was any effect of financial restructuring on the
financial performance of these commercial banks and if existent; how significant the said
effect would be.
The finding of the analysis concluded that there exists a positive effect of financial
restructuring of the financial performance of commercial banks in Kenya. However, the
analysis further showed that the effect was very minimal and could only explain 26.7% of
financial performance leaving the other more than 70% unexplained, at least not in the
findings of the analysis of this study. The commercial banks in Kenya therefore, need to
consider other factors even as they employ financial restructuring to enhance financial
performance of their firms with a view to ensure survival in a competitive market while
meeting their social objective.

vi
Table Of contents
DECLARATION ...................................................................................................................................... ii
DEDICATION ......................................................................................................................................... iii
ACKNOWLEDGEMENT ....................................................................................................................... iv
ABSTRACT .............................................................................................................................................. v
LIST OF TABLES ................................................................................................................................. viii
LIST OF ABBREVIATIONS .................................................................................................................. ix
CHAPTER ONE ....................................................................................................................................... 1
INTRODUCTION .................................................................................................................................... 1
1.1 Background to the Study ................................................................................................ 1
1.1.1 Financial restructuring .................................................................................................... 5
1.1.2 Financial Performance of Commercial Banks ................................................................ 6
1.1.3 Financial Restructuring and Financial Performance ....................................................... 8
1.1.4 Commercial banks in Kenya .......................................................................................... 9
1.2 Research Problem......................................................................................................... 10
1.3 Objectives of the study ................................................................................................. 12
1.4 Value of the Study ........................................................................................................ 12
CHAPTER TWO .................................................................................................................................... 14
LITERATURE REVIEW....................................................................................................................... 14
2.1 Introduction .................................................................................................................. 14
2.2 Review of theories ........................................................................................................ 14
2.2.1 Agency Theory ............................................................................................................. 15
2.2.2 Lifecycle Theory .......................................................................................................... 17
2.2.3 The Trade-Off Theory .................................................................................................. 18
2.2.4 The Static trade-off theory ........................................................................................... 19
2.3 Determinants of Financial Performance of Commercial banks .................................... 20
2.3.1 Bank Specific Factors................................................................................................... 21
2.3.2 External Factors ........................................................................................................... 22
2.4 Review of Empirical studies ......................................................................................... 22
2.5 Chapter Summary......................................................................................................... 25
CHAPTER THREE ................................................................................................................................ 27

vii
RESEARCH METHODOLOGY ........................................................................................................... 27
3.1 Introduction .................................................................................................................. 27
3.2 Research Design ........................................................................................................... 27
3.3 Population of the Study ................................................................................................ 28
3.4 Sample ......................................................................................................................... 28
3.5 Data Collection ............................................................................................................ 29
3.6 Data Analysis ............................................................................................................... 29
CHAPTER FOUR .................................................................................................................................. 31
DATA ANALYSIS AND FINDINGS ..................................................................................................... 31
4.1 Introduction ........................................................................................................................ 31
4.2 Descriptive Statistics .......................................................................................................... 31
4.3 Pearson’s Correlation ......................................................................................................... 32
4.4 Regression Model .............................................................................................................. 34
4.4.1 Estimated Model Coefficients ......................................................................................... 34
4.4.2 Models Analysis .............................................................................................................. 35
4.5 Statistical significance of the model ................................................................................... 36
4.6 Interpretation of Findings ................................................................................................... 37
CHAPTER FIVE .................................................................................................................................... 40
SUMMARY CONCLUSIONAND RECOMMEDATIONS .................................................................. 40
5.1 Summary ............................................................................................................................ 40
5.2 Conclusion ......................................................................................................................... 41
5.3 Policy Recommendations ................................................................................................... 42
5.4 Limitations of the Study ..................................................................................................... 43
5.5 Suggestions for Further Studies ......................................................................................... 45
REFERENCES ....................................................................................................................................... 47
APPENDICES ........................................................................................................................................ 54
Appendix I: List of Commercial Banks in Kenya as at 31st December 2013 ........................... 54
Appendix II: NSE-Listed commercial Banks in Kenya as at 31st December 2013 .................. 56
Appendix III: Data Collection .................................................................................................. 57

viii
LIST OF TABLES
4.1 Descriptive statistics
4.2 Bivariate Pearson’s correlation
4.3 Independent variables coefficients table
4.4 Model summary
4.5 ANOVA table

ix
LIST OF ABBREVIATIONS
CAMEL Capital Adequacy, Asset Quality, Management Efficiency, Earnings
Ability and Liquidity
CAR Capital adequacy ratio
CBK Central Bank of Kenya
EPS Earnings per Share
GDP Gross Domestic Product
KPI Key Performance Indicator
NSE Nairobi Securities Exchange
PWC PricewaterhouseCoopers
ROA Return on Assets
ROE Return on Equity
SPSS Statistical Package for Social Sciences

1
CHAPTER ONE
INTRODUCTION
1.1 Background to the Study
Developed and developing countries have had restructuring being widely used. While in
most cases restructuring is employed when a given structure becomes dysfunctional,
companies and economies restructure to also achieve a higher level of performance or to
survive.
Growing competition and globalization along with tightened fiscal policies are causing
both private and public sector organizations to strive for greater efficiency and higher
cost effectiveness. In many cases the desired results cannot be achieved without
subjecting the corporate strategy and structure to some transformation. In this context,
restructuring is no longer just an option; it is a necessity for survival and growth
(Rogovsky, Ozoux, Esser, Marpe, & Broughton, 2005).
Restructuring takes place at different levels. At the level of the whole economy, it is a
long-term response to market trends, technological change, and macroeconomic policies.
At the sector level, restructuring causes change in the production structure and new
arrangements across enterprises. At the enterprise level, firms restructure through new
business strategies and internal reorganisation in order to adapt to new market
requirements.

2
Restructuring is usually perceived as a change of a certain organism structure. We can
therefore distinguish changes at macro and micro levels, as informed by the definition of
restructuring as the change of a particular economic area structure, change of production
programmes and enterprising activities. When dealing with a structural change of a
national economy particular field we then use the term of a macroeconomic restructuring.
If a change is being witnessed in an enterprise structure, we then use the term
microeconomic restructuring.
Restructuring involves diverse activities such as divestiture of underperforming business,
spin-offs, acquisitions, stock repurchases and debt swaps, which are all a one- time
transaction, but also structural changes introduced in day-to-day management of the
business. Rappaport (1986) classified the above listed one time transactions as Phase I
restructuring and those changes that bring continuous value improvement through day-to-
day management of the business as Phase II restructuring.
Rappaport (1986) argues that companies need to move from Phase I restructuring to
Phase II because in Phase II, the shareholder value approach is employed not only when
buying and selling a business or changing the company’s capital structure, but also in the
planning and performance monitoring of all business strategies on an on-going basis.
A successful implementation of Phase II restructuring not only ensures that management
has met its responsibilities to develop corporate performance evaluation systems
consistent with the parameters investors use to value the company, but also minimises the
Phase I concern of managers that a hostile takeover is imminent.

3
In recent decades, a large number of countries have experienced financial distress of
varying degrees of severity, and some have suffered repeated bouts of distress (Hardy,
1998). Pazarbacsiouglu, (1999) believes that the best warning signs of financial crises are
proxies for the vulnerability of the banking and corporate sector. He showed that full-
blown banking crises are associated more with external developments, and domestic
variables are the main leading indicators of severe but contained banking distress. He
adds that the most obvious indicators that can be used to predict banking crises are those
that relate directly to the soundness of the banking system.
Restructuring, reengineering, transformation, renewal, and reorientation are words that
describe the same general phenomenon - a change in how business is conducted. Only the
firms which are ready and able to realize continuous changes - the firms which approach
actively to a process of restructuring and (or) reengineering can be successful in the
present world. Financial Restructuring involves re-organisation of capital, buy-back,
corporate debt restructuring, acquisitions, mergers, joint ventures and strategic alliances.
Financial restructuring therefore involves effecting change in capital structure to achieve
balanced operative results. The financial reorganization is resorted to bring balance in
debts and equity funds, short term and long term financing, to achieve reduction in
finance charges, to reduce loss of capital, to increase EPS, to improve market value of
shares, to reduce the control of financiers on the management of company etc.
The first objective of financial restructuring is to take measures that avert the impending
insolvency and that ensure the short-term survival of the business. This is the prerequisite
for a sustainable restructuring process. The medium and long-term goal of financial

4
restructuring is reestablishment of a healthy and solid capital structure. Financial
restructuring, which often goes hand in hand with active recapitalization, puts the final
prerequisites in place for adequate equity capital and cash flow to fund future profitable
growth.
Financial restructuring is the reorganizing of a business' assets and liabilities. The process
is often associated with corporate restructuring where an organization's overall structure
and its processes are revamped. Most businesses hold liabilities, which are debts or other
obligations that arise as a result of past transactions. These economic factors will often
have the most significant impact on the success or failure of that business, so financial
restructuring is likely to focus on effectively managing assets and reducing liabilities.
Financial restructuring involves the infusion of debt to either finance leveraged buyouts
or to buy back stocks from equity investors, or to pay dividends. (Fox & Marcus, 1992)
argue that changes in capital structure can be achieved by recapitalization, conversion of
debt into equity and stock purchase.
According to Bowman, Singh, Useem & Badhury (1999), this type of restructuring is
identified by changes are in the firm's capital structure. Changes can include debt for
equity swaps, leverage buyouts, or some form of recapitalization. The largest returns in
financial restructuring come from leveraged and management buyouts. Increased
emphasis on cash flows and changes in managerial incentives can be the intermediate
effects of financial restructuring.

5
1.1.1 Financial restructuring
The significance of the financial sector in the economic growth cannot be denied, and the
banking sector, in its capacity of intermediation between the borrower and the lender,
facilitates the economic activities as a part of the financial sector. Evaluating the financial
conditions and the performance of banks has been an issue of considerable importance in
recent years, particularly in the developing countries. To establish a better internal
control, and thereby increase the performance of the banks, various financial
restructuring reforms have been developed (Nazir & Alam, 2010).
Financial restructuring generally refers to changes in the firm’s capital structure in terms
of leverage. This seeks to reduce payment pressures through equity-based and debt-based
strategies. Where equity-based strategies may involve dividend cuts or issuance of shares
as a means to retain or generate funds, debt-based strategies involve the adjustment of
interest, maturity, or debt/equity ratio (Koh, Dai, & Chang, 2012).
Rapid advances in information technology and acute resources constraints across the
globe, has made the business world to become more complex and fluid in recent times.
To survive and compete the present day organizations should do away with their existing
culture, policies, structure and start with a clean sheet. Restructuring starts with its very
purpose .It began with the redefining or researching of the purpose of doing business.
Once the purpose is adequately redefined, scope for restructuring surfaces. Sometimes it
also happens that realization of the scope for restructuring may bring you back to the
purpose and you start rethinking about the purpose (Srivastava & Mushtaq, 2011).

6
Financial Restructuring is focused on the capital structure of the corporate entity, in this
case a bank. In any of the capital structure whenever the proportion of equity is more than
debt, then there will be lower EPS. In time of prosperity and when the debts are more
than equity then it will be very difficult to maintain an optimal capital due to high cost of
debt. Therefore in order to maintain a proper balance in the capital structure, financial
reorganization is introduced.
According to Srivastava & Mushtaq (2011), financial restructuring of the debt ratio can
be achieved by reduction of fixed charge burden, by the introduction of new equity and
preference share capital. When equity is more, the cost of servicing to equity will also be
more which can be reduced by relying on debt whenever further funds are raised for
expansion and diversification proposals. The company has to strengthen its financial
position.
1.1.2 Financial Performance of Commercial Banks
According to Nimalathasan (2009), Performance measurement and reporting is now
widespread across the private sector as well as public sector of many industrialized and
industrializing countries. The common tool that is used for this process, key performance
indicators (KPIs), have been argued to provide intelligence in the form of useful
information about a public and private agency’s performance (Williams, 2003).
KPIs are viewed as a good management device and a socially constructed tool that makes
sense (DeKool, 2004). The fact that KPIs tend to be quantitative has helped to promote
their image of objectiveness and rationality. The image of KPIs is further enhanced by
7
their widespread application across the many sectors of many countries. The importance
of performance measurement is that it is important to expect that citizens see and
understand the results of organisational programs.
Cicea & Hincu (2009) state that commercial banks represent the core of the credit for any
national economy. In turn, the credit is the engine that put in motion the financial flows
that determine growth and economic development of a nation. As a result, any efficiency
in the activities of commercial banks has special implications on the entire economy. The
management of every commercial bank must establish a system for assessing investment
performance which suits its circumstances and needs and this evaluation must be done at
consecutive intervals to ensure the achievement of the Bank's investment objectives and
to know the general direction of the behavior of investment activity in the past and
therefore predict the future.
Profitability offers clues about the ability of the bank to undertake risks and to expand its
activity. The main indicators used in the appreciation of the bank profitability are: Return
on equity, ROE (Net income / Average Equity), Return on Asset, ROA (Net income
/Total assets) and the indicator of financial leverage or (Equity / Total Assets). The
indicators are submitted to observation along a period of time in order to detect the
tendencies of profitability. The analysis of the modification of the various indicators in
time shows the changes of the policies and strategies of banks and/or of its business
environment (Greuning & Bratanovic, 2004)
A commonly used measure of bank performance is the level of bank profits (Ceylan,
Emre & Asl, 2008). Bank profitability can be measured by the return on a bank’s assets

8
(ROA), a ratio of a bank’s profits to its total assets. The income statements of commercial
banks report profits before and after taxes. Another good measure on bank performance is
the ratio of pre-tax profits to equity (ROE) rather than total assets since banks with higher
equity ratio should also have a higher return on assets (Ceylan, Emre & Asl, 2008).
1.1.3 Financial Restructuring and Financial Performance
The effects of financial restructuring can be positive but sometimes negative too. In the
case of financial restructuring, these intermediate effects could be an emphasis on cash
flows and changes in managerial incentives (Bowman, Singh, Useem & Badhury, (1999).
Further the restructuring effects could last for a long time or just a short stint.
Bowman, Singh, Useem & Badhury (1999) posit that the question as to when
restructuring works is therefore composed of many intermediate effects, but the total or
derivative economic effect is captured by the operating profit changes and/or stock
market changes. The said market performance are evident in the abnormal movements in
the firm’s stock price in the days following a restructuring announcement. On the other
hand, accounting performance is evident in the changes in financial measures of the
company’s performance including return on equity and return on investment as calculated
over a several-year window surrounding the restructuring event, allowing comparison of
post-restructuring accounting performance with the pre-restructuring record (Bowman,
Singh, Useem & Badhury, 1999).
Smart & Waldfogel (1994) hold that post-buyout corporations have increases in operating
income. After the leveraged buyout, long-term operating performance improves not only

9
as compared to pre-buyout records but also in comparison to those of other firms in the
industry. Further; shareholder wealth increases to the extent that according to Kaplan
(1989) both pre-buyout shareholders and post-buyout investors gain.
1.1.4 Commercial banks in Kenya
The Banking industry in Kenya is governed by the Companies Act, the Banking Act, the
Central Bank of Kenya Act and the various prudential guidelines issued by the Central
Bank of Kenya (CBK). The banking sector was liberalised in 1995 and exchange controls
lifted. The CBK is responsible for formulating and implementing monetary policy
and fostering the liquidity, solvency and proper functioning of the financial system.
The financial performances of banks have been increasing and this is attributed to
proper management, formulation and implementation of strategies.
According to (CBK Bank Supervision Report, 2013) there were 43 commercial
banks and 1 Mortgage finance Company. Over the last few years, the banking sector in
Kenya has continued to grow in assets, deposits, profitability and products offering. The
growth has been mainly underpinned by; an industry wide branch network
expansion strategy both in Kenya and in the East African community region.
Automation of a large number of services and a move towards emphasis on the
complex customer needs rather than traditional ‘off-the-shelf’ banking products.
Players in this sector have experienced increased competition over the last few
years resulting from increased innovations among the players and new entrants into the
market (PWC Report, 2012). The banking industry in Kenya has also involved

10
itself in automation, moving from the traditional banking to better meet the
growing complex needs of their customer and globalization challenges. Some key
challenges for the banking industry in Kenya include; New regulations; for
instance, the Finance Act 2008, which took effect on 1 January 2009 requiring banks
and mortgage firms to build a minimum core capital of KSh 1 billion by December 2012.
1.2 Research Problem
Modigliani & Miller (1958) assert in their capital structure irrelevance proposition that
the leverage of the firm has no effect on the market value of the firm. They assume that
the firm has a particular set of expected cash flows such that when it chooses a certain
proportion of debt and equity to finance its assets, all that it does is to divide up the cash
flows among investors. The investor can therefore create any leverage that was wanted
but not offered, or the investor can get rid of any leverage that the firm took on but was
not wanted.
In contrast Myers & Majluf (1984), hold that outside investors rationally discount the
firm's stock price when managers issue equity instead of riskless debt. To avoid this
discount, managers avoid equity whenever possible. This therefore points to the
restructuring option adopted by managers as having an impact on the firm’s value.
Roe (2004) noted due to liberalization, globalization, and technological advancement and
more enlightened customers; the banking industry in Kenya has been faced with huge
non-performing loans, high overhead costs, and difficult operating environment. Banks
have therefore had to restructure their business operations by downsizing, focusing on
11
customer care, through tailored products and restructuring of non-performing loans in
order to improve their financial performance and shareholder value (Kithinji, 2000).
Most Local studies on restructuring focused on mergers and acquisition strategy. Ireri
(2011) in his study in case of the oil industry found that mergers improved performance
of listed companies. His findings are in tandem to those by Kiplangat (2006). Both
authors however, recommend further studies into other industries on the real effect of
restructuring while considering industry-specific factors. In his study, Airo (2009) found
restructuring to be resulting into improved performance. He however warns that
improvement was not sustainable and therefore recommended more studies. Wanguru
(2011) found that returns in some firms were positive while some firms showed negative
returns. Rono (2011) focused on outsourcing as a restructuring strategy and
recommended longer studies to establish the impact of outsourcing on performance.
In all the mentioned studies, none considered the role and implication of financial
restructuring strategies adopted by Kenyan organizations more so in the banking industry.
Most studies focused on general restructuring modes yet some firms might just have
undertaken a single restructuring strategy, say financial restructuring. Also, the studies
recommended further studies given the mixed and inconclusive results gathered.
Much research effort has been targeted particularly on corporate restructuring. To date
however, there is no comprehensive theory to explain how firms in Kenya ensure survival
especially in relation to capital structure. This study seeks to address the inherent gap on
what are the implications of Financial restructuring on firm performance? And what
impact does this restructuring strategy have on the Kenyan commercial banking industry?

12
1.3 Objectives of the study
The objective of this study is to determine to what extent financial restructuring
impacts on the financial performance of commercial banks in Kenya.
1.4 Value of the Study
The research findings will to contribute to a better understanding of financial
restructuring in Kenya. This will enable the formulation of focused intervention strategies
and coordinate efforts aimed at facilitating performance and growth in banks. The
performance and growth of the sector will go a long way in helping solve problems of
inflation and unstable financial markets. The study will be useful to the following groups:
The government can use the research findings to understand the extent to which the
policies affect financial restructuring in the banking industry. The rules and regulations
set by the Central Bank of Kenya affect the sustainable growth and development of the
nation and the role that banks play in achieving Vision 2030 cannot be overemphasized.
The findings of this study can also be invaluable to the banking industry as they will be
able to understand vividly financial restructuring on banks performance. It is notable that
like any other firms, banks in Kenya and indeed worldwide find themselves in a position
that a change in the capital structure for instance may be key to its continued positive
growth and business survival.
The development partners who are usually interested at stability of the banks can have an
understanding of a variety of the impact of financial restructuring on the performance of

13
banks and the extent to which the identified impact affect banks performance. This will
therefore serve to guide such partners into making informed decisions.
The scholars and researchers who would like to debate or carry out more studies on
financial restructuring and its impact on the performance of banks in Kenya will find this
study useful as a basis of carrying out more studies in Kenya.

14
CHAPTER TWO
LITERATURE REVIEW
2.1 Introduction
Several theories exist that explain the concept of financial restructuring and how it affects
the performance of firms and by extension the value of the said firms. This chapter
provides a general review of literature that is based on the theories of Financial
Restructuring and how it impacts on the performance of firms generally, and more
specifically on that of Kenyan banks. The review will include theoretical review of
previous studies on the impact of financial restructuring on the performance of banks and
eventually a chapter summary on the same.
2.2 Review of theories
This section discusses general theories that guided the topic of study. The theories
reviewed here have been tested extensively by a various researchers in the financial
fields, indicating that corporate restructuring and indeed financial restructuring, offers an
opportunity for companies to improve their performance and increase shareholder value.
For instance, Bowman, Singh, Useem & Badhury (1999) give a summary of studies
which find positive effects of financial restructuring based management buyouts and
Leveraged buyouts as employed by different corporations.

15
2.2.1 Agency Theory
Don Goldstein (2010) argues that there is a variety of basically neoclassical theories of
the firm, in that they utilize a well-defined production function, and envisage decision-
makers’ maximizing choices leading firms to equilibrium in key variables. In Financial
restructuring, Agency theory features greatly, and was widely accepted in the 1980s. The
agency theory focuses on the firm as a profit-maximizing one. Separation of ownership
and control in the corporation is therefore key.
The Fathers of Agency theory Jensen & Meckling (1976) posit the agency-theoretic firm
as a 'nexus of contracts’. The agency relationships are achieved through internal and
external market transactions that are governed by either explicit contracts or implicit
ones. It is through these contracts that providers of managerial expertise, employees,
intermediate goods and risk capital are interlinked. The Shareholders are therefore
thought of as principals by virtue of their role as residual risk-bearers, and their contracts
convey ownership. Agency contracts are however likely to be imperfect due to
informational problems, but an optimal balance between accuracy and contracting costs is
achieved designed to base each provider’s compensation on its marginal product.
The company’s stock is an effective contractual payment in this model because its price
is seen as reflecting not only the (prospective) performance of the firm, but also the
manager’s marginal contribution to that performance (Fama, 1980). The managerial
contracts are therefore key under Agency theory as they seek to align the interests of the
managers (agents) to those of the firm and by extension to those of the shareholders (the
16
principals). Of importance is therefore a focus on the incentives provided in the
managerial contracts. This is because the firm’s profit opportunities and how they are to
be achieved, for instance through technological intervention is assumed to be known. To
maximize shareholders’ value therefore remains a question of how well the managers
motivated to make the right choices to that respect.
The basic framework employed by 1980s financial restructuring participants is very
much a Principal-agent one, in which asymmetric information and managerial
opportunism figure strongly (Don Goldstein, 2010). To them; resolving the agency
problem was in itself financial restructuring especially when faced with contractual
breakdowns resulting from slowing growth and stress from competition. To achieve this,
changes in the capital structure, plus managerial replacement coupled in some instances
with new forms of organization, are seen to bring about efficiency by effecting changes
in the terms of agents’ contracts throughout the organization. It is notable that the said
changes in the contracts need to be both explicit and implicit.
Michael Jensen (1989) states that the key result in these scenarios, with the pressures of
debt servicing being the chief instrument, is reduced agent discretion. No longer will free
cash flow be diverted to empire-building and waste, and hence effort and efficiency will
rise. Profitability and market value will rise because the new incentive environment
causes managers to do the right thing.

17
2.2.2 Lifecycle Theory
A firm grows and eventually matures while moving through different stages of the
corporate lifecycle (Miller & Friesen, 1984). Each of the stages differs from the other in
terms of characteristics and firm structure. Lifecycle theory suggests the unique firm
lifecycle characteristics of birth, growth, maturity, and decline and how these
characteristics affect the decisions a firm makes, especially in situations such as financial
distress and the threat of bankruptcy (Koh, Dai, & Chang, 2012).
At birth phase a firm is in the initial stage of starting up business operations. The firm is
therefore more geared towards expansion and is mostly action oriented. As it progresses
into growth stage, the firm is more or less successful and experiencing growth in terms of
strong business and cash flows. The firm then enters maturity. Here, the firm is cash rich,
financially oriented, and focuses more on low risk projects. Eventually, at decline stage a
firm has limited investment opportunities and generally are incapable of generating
sufficient resources. Given that at different lifecycle stage a firm is faced with different
challenges, management must have adjusted decisions that account for these differences.
According to Koh, Dai, & Chang, (2012), Lifecycle characteristics present limited
options for restructuring to managers, this especially when firms are faced with distress.
Depending on the stage in the Lifecycle in which the firm is, the specific lifecycle
characteristics will affect the restructuring strategies that the firm may employ if in
financial distress, namely; managerial, operational, asset and financial strategies. For

18
example, mature firms replace top level management while growth, mature and decline
firms reduce dividend payments and raise funds from external sources.
Corporate finance theory, on the other hand, argues that states of financial distress,
default and bankruptcy present a fundamental stage in the lifecycle of firms (Wruck,
1990). The survival of a firm is therefore not only dependent on its ability to remain
profitable, to maximise shareholder wealth and to avoid financial distress but also on its
ability to make decisions which take into consideration its stage in the lifecycle, (Koh,
Dai, & Chang 2012). There is therefore a need to effectively deal with financial distress
and immediately so, especially given that it precedes bankruptcy. How effectively a firm
responds when it is in financial distress is crucial when it comes to recovery.
Restructuring strategies available to a firm when in distress is limited by the lifecycle
stage it is in. For instance, it is more likely for mature firms in distress to replace their
managers if incompetent. Firms at birth while open to this option my not choose to do so.
Distress firms at decline stage are also more likely to employ operational and asset
restructuring strategies as compared to birth firms. Growth, mature and decline firms are
more likely to reduce dividend payments to preserve investments and resources due to
increased creditor pressure. Consistent with the pecking order hypothesis, distress firms
will raise external funding through the issuance of common shares.
2.2.3 The Trade-Off Theory
The term trade-off theory is used by different authors to describe a family of related
theories. In all of these theories, a decision maker running a firm evaluates the various

19
costs and benefits of alternative leverage plans. Often it is assumed that an interior
solution is obtained so that marginal costs and marginal benefits are balanced (Luigi &
Visinescu, 2009).
The trade-off theory is progressed over the Modigliani-Miller theorem which holds that
when the firm chooses a certain proportion of debt and equity to finance its assets, all that
it does is to divide up the cash flows among investors. Investors and firms are then
assumed to have equal access to financial markets, which allows for homemade leverage.
To them, investors can create any leverage that was wanted but not offered, or the
investor can get rid of any leverage that the firm took on but was not wanted. As a result,
the leverage of the firm has no effect on the market value of the firm, (Luigi & Visinescu,
2009).
When corporate income tax was added to the original irrelevance, this created a benefit
for debt in that it served to shield earnings from taxes.
2.2.4 The Static trade-off theory
The static trade-off theory affirms that firms have optimal capital structures, which they
determine by trading off the costs against the benefits of the use of debt and equity. One
of the benefits of the use of debt is the advantage of a debt tax shield. One of the
disadvantages of debt is the cost of potential financial distress, especially when the firm
relies on too much debt.
This leads to a trade-off between the tax benefit and the disadvantage of higher risk of
financial distress. But there are more cost and benefits involved with the use of debt and

20
equity. One other major cost factor consists of agency costs. Agency costs stem from
conflicts of interest between the different stakeholders of the firm and because of ex post
asymmetric information (Jensen & Meckling, 1976) and (Jensen, 1986)).
Incorporating agency costs into the static trade-off theory means that a firm determines
its capital structure by trading off the tax advantage of debt against the costs of financial
distress of too much debt and the agency costs of debt against the agency cost of equity.
Many other cost factors have been suggested under the trade-off theory, an important
prediction of the static trade-off theory is therefore that firms target their capital
structures in a way that if the actual leverage ratio deviates from the optimal one, the firm
will adapt its financing behaviour in a way that brings the leverage ratio back to the
optimal level (Luigi & Visinescu, 2009).
2.3 Determinants of Financial Performance of Commercial banks
The determinants of bank performances can be classified into bank specific (internal) and
macroeconomic (external) factors (Al-Tamimi, 2010; Aburime, 2005). Internal factors
are individual bank characteristics which affect the banks performance as influenced by
internal decisions of management and the board. On the other hand, the external factors
are sector-wide or country-wide factors and while they affect the profitability of banks
the same are beyond the control of the company. Bank specific and macroeconomic
factors affect the performance of commercial banks (Flamini, McDonald and
Schumacher, 2009).

21
2.3.1 Bank Specific Factors
Bank specific variables are the internal factors which influence the profitability of a given
bank. As such they are within the scope of the bank’s manipulation and differ from bank
to bank. CAMEL (Capital Adequacy, Asset Quality, Management Efficiency, Earnings
Ability and Liquidity) framework is often used by scholars to proxy the bank specific
factors (Dang et al., 2011).
Capital adequacy is the level of capital required by the banks to enable them withstand
the risks such as credit, market and operational risks. According to Dang et al., (2011),
the adequacy of capital is judged on the basis of capital adequacy ratio (CAR). This is the
internal strength of the bank to withstand losses during crisis. As such it is directly
proportional to the resilience of the bank in situations of crises. According to Diamond &
Raghuram (2000), greater bank capital reduces the chance of distress. It has also a direct
effect on the profitability of banks by determining its expansion to risky but profitable
ventures or areas (Sangmi & Tabassum, 2010).
Loans are the major income generating asset of commercial banks. The loan portfolio
quality has a direct bearing on bank profitability. The highest risk facing a bank is the
losses derived from delinquent loans (Dang et al., 2011). Thus, nonperforming loan ratios
are the best proxies for asset quality. The lower the ratio the better the bank is performing
(Sangmi & Tabassum, 2010).
Liquidity refers to the ability of the bank to fulfill its obligations, mainly of depositors.
Adequate level of liquidity is positively related with bank profitability (Dang et al.,

22
2011). Customer deposit to total asset and total loan to customer deposits are the most
common financial ratios that reflect the liquidity position of a bank. Ilhomovich (2009)
used cash to deposit ratio to measure the liquidity level of banks in Malaysia.
2.3.2 External Factors
These are macroeconomic variables such as Gross Domestic Product, Inflation, Interest
Rate and Political instability; all which affect the performances of banks. The trend of
GDP For instance affects the demand for banks asset. In a declining GDP; credit uptake
falls hence affecting negatively the profitability of banks. The opposite is true for a
positive GDP in which demand for credit is high as occasioned by the nature of business
cycle. During boom the demand for credit is high compared to recession (Athanasoglou
et al., 2008).
2.4 Review of Empirical studies
Financial crises, either as a result of large shocks to foreign exchange and interest rates,
and a general economic slowdown, leads the financial sector into experiencing a large
number of defaults and difficulties to repay contracts on time and non-performing loans
will increase sharply. Save for countries with longer-term financial distress and other
structural problems, this situation is often accompanied by generally depressed asset
prices, such as equity and real estate prices. This follows typical run ups before the crisis,
sharp real interest rate increases, and a slowdown in capital flows. In Financial crisis, the
financial sectors need restructuring with actions affecting both the liquidity and solvency
situation of the bank.

23
Riany, Musa, Odera & Okaka (2012) in their study on the effects of restructuring on
organization performance of mobile phone service providers in Kenya conclude that the
three methods of restructuring have a favorable effect on the companies’ market share
and market growth. Their results indicate that financial restructuring had the greatest
impact on a company’s market share followed by portfolio restructuring and organization
restructuring. It is distinct that organizational restructuring had the greatest impact on
market growth rate.
Mbogo & Waweru (2014) in their study on the corporate turnaround response by
financially distressed companies listed on the NSE, surveyed companies that were listed
for the entire period of the study (2002-2008). The survey found out that employee layoff
was the most preferred course of action being carried out by 63% by the companies.
Asset restructuring was the second most preferred turnaround strategy being carried out
by 50% of the companies. Debt restructuring and top management change were the least
preferred turn around strategies each one of them being taken by one company each.
Dong, Putterman, & Unel (2004), the implications of restructuring on financial
performance in Chinese context assert that performance improvements is realized
upon restructuring. This is supported by inconclusive evidence from Wen (2002) study
which shows restructuring results in better profitability. Bowman, Singh, Useem &
Badhury (1999) comparative studies found contradictory results; positive change in
performance for firms that adopted portfolio and financial restructuring and negative
results for firms that adopted organization restructuring.

24
Similarly, Padilla and Raquejo (2000), in their study, ‘financial distress, bank
restructuring, and layoffs’, developed a model of a financially distressed firm to analyze
the implications of a bank restructuring when the operational characteristics of the firms
project for the post-distress period are endogenously determined as part of the work out.
The study establishes a formal link between the debt restructuring and operational actions
such as employee layoffs. In this study however, the focus was only firms with simple
capital structures, where a single bank provides the outside funds needed by the firm.
Ngige (2012) studied the implication of restructuring on the performance and long-
term competitiveness within the Kenyan banking sector and further, the significance
of different modes of restructuring adopted by the banks in influencing performance.
Findings revealed that generally, restructuring resulted to improvement in performance
in terms of market share growth, competitiveness, growth in quality of products,
geographical spread and customer retention. Further findings revealed that banks
used different strategies of restructuring which had different motives in influencing
performance. The study found mixed and inconclusive results as performance in
some cases improved after financial restructuring whereas in other cases it declined. In
the case of organisational and portfolio restructuring the study showed an increase in the
year of restructuring and the year after though it was at a greater magnitude in the
organisation mode of restructuring.
Suka (2012) studied the impact of capital adequacy on the financial performance of
commercial banks Quoted at the NSE. In his study he showed that capital adequacy has
impact on the profitability of the banks and further that, capital adequacy contributes
25
positively to the profitability of commercial banks. Hence, banks must have a sound
capital base in order to remain competitive and maintain the confidence of customers. In
a similar study, Odinga (2003) found that a bank that is undercapitalized is not stable.
Omondi (1996) studied the relationship between debt ratios and firm specific variables
that influence capital structure such as asset structure such as firm size, level of
interest rates, profitability, cash flow variability, age of industry, industry class,
growth and ownership for all companies listed at the NSE for the period 1987 to 1996.
The findings were that asset structure and profitability were positively related to debt
ratios. Firm’s growth was positively related to capital structure.
Siro (2013) in his study on effects of capital structure on the financial performance of
firms listed on the NSE found that there was an inverse relationship between capital
structure and financial performance of listed firms in securities exchange in Kenya. The
finding indicate that the higher the debt ratio, the less the return on equity which
therefore supports the need for more equity injection rather than borrowing, as the
benefits of debt financing are less than its cost of funding.
2.5 Chapter Summary
Financial Restructuring is evidently therefore, key in any corporate firm especially in
times of financial distress. Kenyan banks are consequently not an exception when in
times of such financial crisis. The banks need to revisit their capital structure and review
it with an interest to ensure it is in its optimal level. To achieve the optimal capital
structure, financial restructuring may mean the bank issues new debt or equity. It may

26
also call for the total opposite in which the corporate institution buys back its shares from
the security markets or avoids debt in total.

27
CHAPTER THREE
RESEARCH METHODOLOGY
3.1 Introduction
This chapter presents the research methodology that was used to carry out the study. It
also gives an explanation of the research design that was applied. Further, the chapter
explains the data collection methods that were applied and how the data collected was
analyzed to produce the desired information for this study.
3.2 Research Design
A research design is defined as a set of guidelines and instructions to be followed in
addressing the research problem. That is, a programme to guide the researcher in
collecting, analyzing and interpreting observed facts (Orodho, 2003). The study was
carried out through a cross sectional research aimed at establishing first, the financial
restructuring strategies employed by banks in Kenya and secondly, how much the said
financial restructuring strategies influence the performance of commercial banks in
Kenya. The study adopted descriptive study for a research design. According to Sekaran
(2003), a descriptive study is undertaken in order to ascertain and describe characteristics
of the variables of interest in a situation.
This approach draws its credit from the fact that it allows analysis of the relations of
variables under study using linear regression as long as the sampling units for the study
are many. Further, it allows greater flexibility in terms of money and time while avoiding

28
the hardship of hunting for respondents. Quantitative research is as a formal, objective,
systematic process to describe and test relationships and examine cause and effect
relationships among variables.
Through cross-sectional studies, data is collected to make inferences about a population
of interest at one point in time. Thus annual financial reports were used to determine the
variables for three years before the restructuring and three years after the restructuring.
As a result, the unaudited reports given in January of every year were the basis of the
study. This design is appropriate because it has the ability of providing the critical
success factors of restructuring that the various banks have adopted. It is also appropriate
considering the sensitivity of the information being sought.
3.3 Population of the Study
Target population in a study is the specific population about which information is desired.
According to Ngechu (2004), a population is a well-defined set of people, services,
elements, events, group of things or households that are being investigated. The
population of interest for this study comprised of 43 registered commercial banks
operating in Kenya as per the Kenya Bankers Association records.
3.4 Sample
Ngechu (2004) underscores the importance of selecting a representative sample through
making a sampling frame. From the population frame the required number of subjects,
respondents, elements or firms were selected in order to make a sample. The sampling
plan describes the sampling unit, sampling frame, sampling procedures and the sample

29
size for the study. The sampling frame describes the list of all population units from
which the sample was selected (Cooper & Schindler, 2003). This study used secondary
data for the 11 commercial banks listed in the Nairobi Securities Exchange (NSE). This
was informed first because the said banks undertook restructuring during the six years
under study; but also because of the readily availability of their data. The data was for the
six-year period beginning 2008 to 2013.
3.5 Data Collection
The data for the study was collected from secondary sources. The secondary data was
obtained from the yearly financial reports to derive the Net income, Earnings Per Share,
Return on Assets (ROA), dividends per share and the shareholders’ equity also known as
the shareholders’ funds for each of the intervals in the event window and which were
analyzed to isolate trends in the variables. The secondary data were largely quantitative
and descriptive in nature and were obtained from individual banks’ annual financial
reports and the Central Bank of Kenya (CBK’s) banking sector outlook reports. These
were extracted or computed where need be from the unaudited financial reports issued in
January for the six-year period beginning 2008 to 2013.
3.6 Data Analysis
Data analysis is the process which starts immediately after data collection and ends at the
point of interpretation and processing (Mugenda & Mugenda, 2003). Data analysis was
carried out as regression and correlation analysis by use of Statistical Package for Social
Sciences (SPSS) Version 20 and presented using descriptive statistics.

30
Regression analysis was used to come up with the model expressing the relationship
between the dependent variable in the study (Financial Performance) and independent
variables: Debt ratio, dividend payout ratio and Equity ratio. The listed independent
variables have a huge effect in the capital structure of a corporation and which in turn is
key in the process of financial restructuring. The Multiple Regression equation for this
study was computed as follows:
Y = α + β1X1 + β2X2 + β3X3 +ε
Whereby Y = Financial performance which was measured as ROA, α = constant term,
X1= Debt ratio (Debt/Total assets), X2= Dividend Payout which was measured as the
dividend payout ratio (Annual Dividends per Share/Earnings per Share) and X3= Equity
Ratio (Total Equity/Total Assets), while β1, β2, and β3 are coefficients of determination,
and ε is the error term.
The multiple regression function above was used to investigate the effect of each of the
independent variable on the dependent variable at the same time and of the same set of
analysis. The change in value of β was the degree of effects on Y (financial performance)
and the positive (or negative) sign of the value was to imply the direction of effects. The
higher the value β for a particular variable, the higher the effects of that variable on the
dependent variable Y.

31
CHAPTER FOUR
DATA ANALYSIS AND FINDINGS
4.1 Introduction
This chapter discusses the output of the analysis as carried out for the six-year period
from the year 2008 to 2013. All the variables for the six years were taken and then
analyzed using SPSS version 20. This chapter therefore, will discuss the findings of this
analysis.
4.2 Descriptive Statistics
This section discusses the descriptive statistics of the data analyzed for the five year
duration. This is summarized in the table below;
Table 4.1 Descriptive Statistics
Descriptive Statistics
Statistic
Bootstrapa
Bias Std. Error 95% Confidence Interval
Lower Upper
Financial Performance
Mean 0.030 0.000 0.001 0.027 0.032
Std. Deviation 0.012 0.000 0.001 0.010 0.014
N 65 0 0 65 65
Debt Ratio
Mean 0.016 0.000 0.002 0.011 0.021
Std. Deviation 0.019 0.000 0.002 0.015 0.022
N 65 0 0 65 65
Dividend Payout
Mean 0.316 -0.001 0.028 0.259 0.372
Std. Deviation 0.222 -0.004 0.021 0.181 0.262
N 65 0 0 65 65
Equity Ratio
Mean 0.151 0.000 0.004 0.144 0.159
Std. Deviation 0.031 0.000 0.004 0.024 0.039
N 65 0 0 65 65
a. Unless otherwise noted, bootstrap results are based on 1000 bootstrap samples
Source: Researcher 2014

32
The descriptive statistics in table 4.3.1 show that the total number of data analyzed (n) is
65. That is, the six-year data for the 11 listed commercial banks in Kenya for which each
of the four variables was incorporated in the analysis. The standard deviation of the
variables which is measure of the dispersion from the mean, that is, the volatility of the
respective variables can also be observed from the descriptive statistics. The table further
shows the maximum and minimum values for each of the variables. The mean of the data
is also shown in the mean column. The mean for financial performance is 0.03 with a
standard deviation of 0.012 and which being a small value, means that the data is
clustered around the mean. The same applies for the other variables under analysis with
the highest value of standard deviation being that of dividend payout ratio whose
standard deviation is 0.222. This is also relatively small and indicates that the dividend
payout ratio is closely clustered to the mean.
4.3 Pearson’s Correlation
Table 4.4.1 presents Pearson’s Bivariate Correlation which shows that debt ratio had a
strong positive correlation of 0.134 and a probability value of 0.288. This shows that the
debt ratio is statistically insignificant in its effect on the financial performance of
commercial banks in Kenya. Dividend payout ratio had a weak positive correlation of
0.476 and a high statistically significant value of 0.000. This showed that the dividend
payout determined the financial performance of commercial banks in Kenya. The equity
ratio of the banks had a moderate correlation of 0.211 and a statistically insignificant
probability value of 0.091. On a general perspective it can be concluded that each of the

33
variables under study had a positive correlation to the financial performance of
commercial banks in Kenya, with the correlation ranging from weak to strong.
Table 4.2: Bivariate Pearson’s Correlation
Correlations
Financial
Performance
Debt
Ratio
Dividend
Payout
Equity
Ratio Financial
Performance
Pearson Correlation 1.000 0.134 .476**
0.211
Sig. (2-tailed) 0.288 0.000 0.091
N 65 65 65 65
Bootstrapc Bias 0.000 -0.003 -0.004 0.019
Std. Error 0.000 0.142 0.085 0.162
95%
Confidence
Interval
Lower 1.000 -0.162 0.293 -0.102
Upper 1.000 0.413 0.624 0.529
Debt Ratio Pearson Correlation 0.134 1.000 0.015 .351**
Sig. (2-tailed) 0.288 0.903 0.004
N 65 65 65 65
Bootstrapc Bias -0.003 0.000 0.003 0.001
Std. Error 0.142 0.000 0.094 0.137
95%
Confidence
Interval
Lower -0.162 1.000 -0.166 0.063
Upper 0.413 1.000 0.204 0.599
Dividend
Payout
Pearson Correlation 0.476**
0.015 1.000 0.044
Sig. (2-tailed) 0.000 0.903 0.726
N 65 65 65 65
Bootstrapc Bias -0.004 0.003 0.000 -0.001
Std. Error 0.085 0.094 0.000 0.109
95%
Confidence
Interval
Lower 0.293 -0.166 1.000 -0.169
Upper 0.624 0.204 1.000 0.252
Equity Ratio Pearson Correlation 0.211 0.351**
0.044 1.000
Sig. (2-tailed) 0.091 0.004 0.726
N 65 65 65 65
Bootstrapc Bias 0.019 0.001 -0.001 0.000
Std. Error 0.162 0.137 0.109 0.000
95%
Confidence
Interval
Lower -0.102 0.063 -0.169 1.000
Upper 0.529 0.599 0.252 1.000
**. Correlation is significant at the 0.01 level (2-tailed).
*. Correlation is significant at the 0.05 level (2-tailed).
c. Unless otherwise noted, bootstrap results are based on 1000 bootstrap samples
Source: Researcher 2014

34
4.4 Regression Model
4.4.1 Estimated Model Coefficients
The regression model coefficients derived from the analysis are shown in the below
equation
Y = 0.011 + 0.044X1 + 0.026X2 + 0.064X3
Where:
Y = Return on Assets
X1 = Debt Ratio
X2 = Dividend Payout Ratio
X3 = Equity Ratio
From the regression model, it can be observed that there exists a positive relationship
between the financial performance and the debt ratio. This means that as the ratio of debt
increases, the ROA ratio will tend to increase by 0.044. Further, there is a positive
relationship between the dividend payout ratio and the financial performance of
commercial banks in Kenya as can be observed in the coefficient of the dividend payout
ratio which is 0.026. This means that as the dividend payout ratio increases, the ROA
ratio will tend to increase by 0.026. As regards the equity ratio, there is also a positive
relationship between the equity ratio and the financial performance of commercial banks
in Kenya as indicated by its coefficient which is 0.064. This means that when the equity
ratio increases by 0.064 units, the ROA ratio will tend to increase by approximately
0.064. These coefficients can be summarized in the coefficients table 4.5.3.

35
Table 4.3 Independent Variables Coefficient Table
Coefficientsa
Model Unstandardized
Coefficients
Standardized
Coefficients
t Sig.
B Std. Error Beta
1
(Constant) .011 .007 1.628 .109
Debt Ratio .044 .076 .068 .581 .563
Dividend Payout .026 .006 .467 4.258 .000
Equity Ratio .064 .045 .167 1.422 .160
a. Dependent Variable: Financial Performance
Source: Researcher 2014
It can further be observed that as is the case with the dependent variable Y, the
independent variables save for the dividend payout ratio; are not significant. This can be
seen as represented in the “sig” column in table 4.5.3. It is also notable that the
standardized and the unstandardized coefficients are both not statistically significant as
presented by their t and sig column. The unstandardized coefficients take into account
other variables that are not under study, whereas the standardized coefficients do not.
However, the difference in these coefficients is minimal.
4.4.2 Models Analysis
Having analyzed the data, the model summary below was established.
Table 4.4 Model Summary
Model Summary
Model R R Square Adjusted R Square Std. Error of the Estimate
1 .516a .267 .231 .0106222247328
a. Predictors: (Constant), Equity Ratio, Dividend Payout, Debt Ratio
Source: Researcher 2014

36
Table 4.2.1 provides the summary of the regression model. In the model summary, the
values of R, R2, adjusted R
2 and the standard error are given. These values explain how
well the regression model fits the analyzed data. The value of R represents the multiple
correlation coefficients which measure the quality of the prediction of the dependent
variable. In this case the value of R is 0.516 and which shows a weak level of prediction.
However, the value of R2 which is the coefficient of determination is 0.267 indicating
that only 26.7% of the debt ratio, dividend payout ratio and the total equity ratio explain
the variability of financial performance, the other 73.3% is not explained by the model.
This indicates that the financial performance of commercial banks in Kenya is not
affected much by said factors under consideration.
4.5 Statistical significance of the model
The significance of the estimated model can be summarized in the following ANOVA
table.
Table 4.5: ANOVA Table
ANOVAa
Model Sum of
Squares
df Mean Square F Sig.
1
Regression .003 3 .001 7.392 .000b
Residual .007 61 .000
Total .009 64
a. Dependent Variable: Financial Performance
b. Predictors: (Constant), Equity Ratio, Dividend Payout, Debt Ratio
Source: Researcher 2014
37
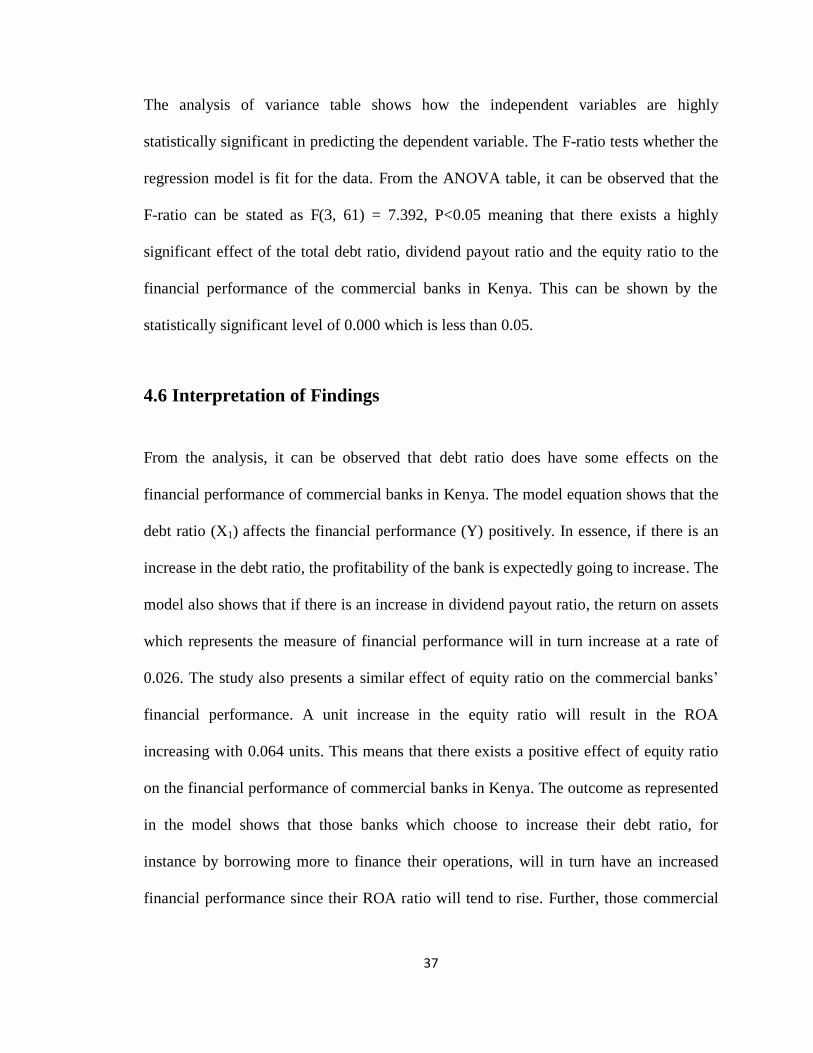
The analysis of variance table shows how the independent variables are highly
statistically significant in predicting the dependent variable. The F-ratio tests whether the
regression model is fit for the data. From the ANOVA table, it can be observed that the
F-ratio can be stated as F(3, 61) = 7.392, P<0.05 meaning that there exists a highly
significant effect of the total debt ratio, dividend payout ratio and the equity ratio to the
financial performance of the commercial banks in Kenya. This can be shown by the
statistically significant level of 0.000 which is less than 0.05.
4.6 Interpretation of Findings
From the analysis, it can be observed that debt ratio does have some effects on the
financial performance of commercial banks in Kenya. The model equation shows that the
debt ratio (X1) affects the financial performance (Y) positively. In essence, if there is an
increase in the debt ratio, the profitability of the bank is expectedly going to increase. The
model also shows that if there is an increase in dividend payout ratio, the return on assets
which represents the measure of financial performance will in turn increase at a rate of
0.026. The study also presents a similar effect of equity ratio on the commercial banks’
financial performance. A unit increase in the equity ratio will result in the ROA
increasing with 0.064 units. This means that there exists a positive effect of equity ratio
on the financial performance of commercial banks in Kenya. The outcome as represented
in the model shows that those banks which choose to increase their debt ratio, for
instance by borrowing more to finance their operations, will in turn have an increased
financial performance since their ROA ratio will tend to rise. Further, those commercial

38
banks that on the other hand choose on dividend payout, will also tend to increase their
ROA and consequently increase their profitability.
However, a further analysis of the various variables under consideration and their
respective coefficients indicate that, the effects of financial restructuring on the financial
performance of commercial banks is very significant. The summary model’s multiple
correlation factor (R) is only 0.516 which is greater than 0.5 hence, indicating a strong
level of prediction of the independent variables. Similarly, the coefficient of
determination of the model which is only 26.7% indicates that financial restructuring
variables used in the model can only explain 26.7% of the independent variable which is
financial performance. The remaining 73.3% can only be explained by other variables not
under consideration in this model. This therefore means that it cannot conclusively be
said that financial restructuring does have a significant impact on the financial
performance of commercial banks in Kenya.
An analysis into the coefficients of the independent variables namely debt ratio, dividend
payout ratio and equity ratio; indicate that the coefficients of the three variables used save
for that of dividend payout are not statistically significant in determining the rate of
change of the financial performance of commercial banks in Kenya. This shows that they are
not significant in affecting the financial performance of commercial banks. Consequently,
there exists other major factors that affect the financial performance of commercial banks.
Therefore, financial restructuring while affecting the financial performance of commercial
banks in Kenya, plays a very minimal role.

39
These findings differ with those of Siro (2013) in his study on effects of capital structure
on the financial performance of firms listed on the NSE in which he found that there was
an inverse relationship between capital structure and financial performance of listed firms
in securities exchange in Kenya. His finding indicate that the higher the debt ratio,
the less the return on equity which he used to measure financial performance of
commercial banks in Kenya. However, the findings tend to agree with Bowman, Singh,
Useem & Badhury (1999) comparative studies which found positive change in
performance for firms that adopted portfolio and financial restructuring and negative
results for firms that adopted organization restructuring. Therefore it can be concluded
that financial restructuring does affect the financial performance of commercial banks but
not significantly. The performance of the commercial banks is influenced majorly by
other factors other than financial restructuring. In other words, the effect of financial
restructuring on the financial performance of commercial banks in Kenya cannot be rated
as major since its significance is very low.
40
CHAPTER FIVE
SUMMARY CONCLUSIONAND RECOMMEDATIONS
5.1 Summary
The world over, firms seek to enhance their financial performance and given their major
role as the backbone of the economy, commercial banks in Kenya are not an exception.
In so doing firms end up employing different strategies up to and including financial
restructuring as a financial strategy aimed at enhancing the profitability of the firm and
therefore the firm’s financial performance. If not keen in their financial performance, a
firm or a bank in this case could enter into financial distress and could further suffer
closure which is very detrimental to any given country as this could dent the economy of
a country in turn.
This research therefore sought to establish the effect of financial restructuring on the
performance of commercial banks in Kenya with the aim of ensuring that banks know
how significant this strategy is in their financial performance both as a corrective
measure or a preventive measure, especially but not limited to when faced by financial
distress. A sample of 11 commercial banks was used, being the total number of all the
listed commercial banks in Kenya. This sample was from a population of 43 commercial
banks. Data was collected from the annual financial reports for a six-year period of 2008
to 2013. Linear regression was then conducted to establish the effect and significance of
financial restructuring with the ROA being the measure of financial performance.

41
The analysis of the study found that there exists an effect of financial restructuring on the
financial performance of commercial banks in Kenya but which is very insignificant.
This is evident in the model in which the independent factors that have been considered
in the analysis can only explain 26.7% of the financial performance of commercial banks
in Kenya. However, it can also be observed that the model is a very strong predictor of
financial performance since it is only 0.516 which is considered strong since it is more
than 0.5.
5.2 Conclusion
The findings of this study indicate that financial restructuring as a strategy has been used
adopted by generally all the commercial banks in Kenya. Different banks however,
employed different ways of financial restructuring. While some resorted into more debt
for instance by borrowing, others resorted into dividend payouts and others still into
enhancing shareholders equity. All of these however, were geared towards enhancing the
financial performance of the different commercial banks. This is what informed this
study, namely, to establish how effective this financial strategy is in enhancing the
financial performance.
The study concluded that, financial restructuring does have a positive relationship with
financial performance of commercial banks in Kenya although the effect is very minimal.
The said minimal significance of financial restructuring as found in this study
consequently leads into the conclusion that there exists other major factors which affect
the financial performance of commercial banks more than does financial restructuring as
a strategy. These major factors and which may have equally major effects on the financial

42
performance of commercial banks in Kenya should therefore be included in the study.
These factors may include but not limited to the level of marketing and marketing
strategies being implemented by these commercial banks, the product offering by the
banks but also, customer service and customer experience. These factors should be
considered in other studies on the financial performance of commercial banks in Kenya.
It should however not be forgotten that depending on the situation at hand, for instance in
the wake of financial distress, financial restructuring is still a positive strategy in
enhancing financial performance but also one that could be adopted to avert financial
distress itself. The positive effect of this strategy is as observed in the findings of this
study which showed that financial restructuring has a positive effect on the financial
performance of commercial banks albeit to a minimal extent.
5.3 Policy Recommendations
This study shows that financial restructuring has very minimal effect on the financial
performance of commercial banks in Kenya. Stakeholders in this industry should
therefore endeavor in researches into other areas or variables in order to identify those
that could be major factors in presenting significant effect on the financial performance
of this industry. Such studies and or findings will enable the stakeholders to control these
factors and ensure maximum profitability is achieved and therefore see sustained growth
of the industry.
Having observed however that all the variables under consideration in this study, namely
the debt ratio, dividend payout ratio and the equity ratio all have a positive effect on the

43
financial performance of commercial banks in Kenya; it is recommended that managers
of commercial banks should use either or all of the said variables to help them improve
on the profitability of their firms. The managers should consider increasing any of the
said ratios as doing so would result into increased financial performance. There is need
however for the managers to ensure that they only do so as per the statutory requirements
of capital by the regulator. Therefore, the managers of commercial banks should ensure
that they meet the required capital regulations.
The study further shows that, the effect of financial restructuring on the financial
performance of commercial banks is very minimal and therefore, it is recommended that
concentration should be on other areas which have major effects on their performance.
These areas may include new products offerings or increased marketing or better
marketing strategies and customer service and or customer experience.
5.4 Limitations of the Study
This study saw various limitations being experienced and which limitations need to be
mentioned and discussed to ensure that other researchers put them into consideration
when planning and or conducting a similar research project.
The research suffers limitations based on the composition of the sample. While the
banking industry in Kenya comprises of 43 commercial banks as documented in the
CBK’s bank supervision report, the study used a sample of 11 banks all of which are

44
listed in the NSE. The findings of the study may therefore not be generalized for banks
not listed in the NSE since they may have entirely different factors based on their size
and the fact that they are not listed in the NSE.
The research was also limited to the period of the study. The researcher used a 6-year
period from 2008 to 2013. Given the nature of competition in the banking industry and
the growth that has been evident in the banking industry in Kenya over the years, it is
possible that a research focused on a longer period would yield different findings from
those observed by the researcher. A longer duration of study would also have captured
various economic significances such as booms and recessions; hence a broader dimension
to the problem.
The study used secondary data as collected from the commercial bank’s annual financial
reports. The study was therefore limited to the degree of precision of the data obtained
from the said secondary source. While the data was verifiable from the NSE’s
publications, it however could still be prone to shortcomings such as falsification of the
statements commonly referred to as cooking the books.
Time constraints were also experienced whereby the time required in both collection and
analyzing of the data needs to be created to ensure that one is able to carry out an
effective study yet most of the time official duties meant limited time for conducting the
study and analysis of the collected data.

45
5.5 Suggestions for Further Studies
This study advocates for further studies to be carried out in other areas. Such studies may
include identifying various other factors which have effects on the financial performance
of commercial banks. Such studies may be carried out using various other measures of
financial performance such as return on equity as opposed to return on assets which
measure was used in this study.
Other areas for consideration into research studies may include researching on the effects
of other factors such as marketing and new product offering on the financial performance
of commercial banks. Such studies may enable various stakeholders in the banking
industry to understand the existence of major factors which exhibit major effects on the
financial performance of their firms given that the effects of financial restructuring are
minimal.
The study period for this research was a six-year period from 2008 to 2013. Further
studies on this topic could be carried out over a longer period of time than what was used
in this study. Such a longer period could be helpful given that significant effects of
financial restructuring on the financial performance of commercial banks could be taking
longer to be realized than the six year period considered in this study.
The study used a sample size of 11 commercial banks all of which are listed in the
Nairobi Securities Exchange. Further studies on this topic could therefore be carried out
using a bigger sample size. Such a bigger sample size could mean inclusion of banks that
are not listed in the NSE, and given that some of the banks not yet listed are those

46
considered to be small, it would be important to see how financial restructuring relates to
the size of the firm.

47
REFERENCES
Aburime, T. (2008). Determinants of bank profitability: Company-level evidence from
Nigeria. Available At SSRN 1106825.
Airo, P. (2009). Impact of restructuring on performance of development finance
institutions: A case study on ICDC. Unpublished MBA project: School of Business,
University of Nairobi.
Al-Tamimi, H., & Hassan, A. (2010) Factors Influencing Performance of the UAE
Islamic and Conventional National Banks. Department of Accounting, Finance and
Economics, College of Business Administration, University of Sharjah.
Athanasoglou, P., Brissimis, S., & Delis, M. (2008). Bank-specific, industry-specific and
macroeconomic determinants of bank profitability. Journal Of International
Financial Markets, Institutions And Money, 18(2), 121--136.
Bowman, E. H., Singh, H., Useem, H., & Badhury, R. (1999). When Does Restructuring
Improve Economic Performance? California Management Review.
Central Bank of Kenya, (CBK) (2013). Bank Supervision report; Kenyan banking Sector
for the period ended December 2013.
Cicea, C., & Hincu, D. (2009). Performance evaluation methods in commercial banks and
associated risks for managing assets and liabilities. Communications of the IBIMA,7,
ISSN:1943-7765

48
Cooper, D., Schindler, P., et al, (2003). Business research methods. Mcgraw-Hill/Irwin
New York, NY.
Dang, U., et al, (2011). The CAMEL rating system in banking supervision. A case study.
Arcada-Nylands svenska yrkesh
DeKool, D. (2004). Monitoring and utilization: surveillance, struggle, symbol or source
of inspiration? Conference of the European Group of Public Administration. 1-4
September, Ljubljana, Slovenia.
Diamond, D.W., Raghuram, A. (2000) A Theory of Bank Capital. The Journal of Finance
52(6), 12-23.
Dong, X., Putterman, L., & Unel, B. (2004). Enterprise restructuring and firm
performance: A comparison of rural and urban enterprises in Jiangsu Province.
Fama, E. (1980). Agency Problems and the Theory of the Firm. The Journal of Political
Economy, 288--307.
Flamini, V., McDonald, C., & Schumacher, L. (2009). The determinants of commercial
bank profitability in Sub-Saharan Africa (1st ed.). [Washington, D.C.]: International
Monetary Fund.
Fox, I., & Marcus, A. (1992). The causes and consequences of leveraged management
buyouts. Academy Of Management Review, 17(1), 62--85.
Goldstein, D. (1997). Clashing paradigms? Total quality, financial restructuring and

49
theories of the firm. Industrial and Corporate Change, 6(3), 665--700.
Greuning, H., Brajovic Bratanovic, S., & Greuning, H. (2003). Analyzing and Managing
Banking Risk (1st ed.). Washington, DC: World Bank.
Hardy, D. (1998). Are Banking Crisis Predictable? (Finance & Development, IMF
Quarterly Magazine)
Hardy, D., & Pazarbacsiouglu, C. (1999). Determinants and leading indicators of banking
crises: Further evidence. IMF Staff Papers, 247--258.
http://www.pwc.com/ke/en/industries/banking.jhtml. Retrieved on 20-07-2012
Ilhomovich, S. (2009). Factors affecting the performance of foreign banks in
Malaysia. Malaysia: A thesis submitted to the fulfillment of the requirements for the
degree Master of Science (Banking) College of Business (Finance and Banking.).
Ireri, J.K. (2011). Effect of mergers and Acquisition on performance of oil companies in
Kenya. Unpublished MBA Project: School of Business, University of Nairobi.
Jensen, M. C., & Meckling, W. H. (1976). Theory of the Firm: Managerial Behavior
Agency Costs and Ownership Structure. Journal of Financial Economics.
Kaplan, S. (1989). The effects of management buyouts on operating performance and
value. Journal of Financial Economics, 24(2), 217--254.
Kiplagat, E. (2006). Effect of mergers on financial performance of companies listed at

50
NSE. Unpublished MBA Project: School of Business, University of Nairobi
Kithinji, A.M., & Waweru, M.N. (2000). Merger Restructuring and Financial
Performance of Commercial Banks in Kenya. University of Nairobi Small
Enterprise Development Journal (SED), 13.
Koh, S., Dai, L., & Chang, M. (2012). Financial Distress: Lifecycle and Corporate
Restructuring. The University of Western Australia.
Luigi, P., & Sorin, V. (2009). A review of the capital structure theories. Annals of Faculty
of Economics, 3(1), 315--320.
Majluf, N., & Myers, S. (1984). Corporate Financing and Investment Decisions When
Firms Have InformationThat Investors Do Not Have (1st ed.). Cambridge, Mass.:
National Bureau of Economic Research.
Mbogo, J., & Waweru, G. (2014). Corporate Turn Around Strategies By Financially
Distressed Companies Quoted At The Nairobi Securities Exchange. Research
Journal of Finance and Accounting, 5(2), 137--147.
Miller, D., & Friesen, P. (1984). A longitudinal study of the corporate life cycle.
Management Science, 30(10), 1161--1183.
Modigliani, F., & Miller, M. (1958). The cost of capital, corporation finance and the
theory of investment. The American Economic Review, 261--297.
Mugenda, O. M., & Mugenda, A. G. (2003). Research Methods: Quantitative and
Qualitative Approaches. Nairobi: Acts Press.

51
Nazir, M., & Alam, A. (2010). The Impact of Financial Restructuring on the Performance
of Pakistani Banks: A DEA Approach. The IUP Journal Of Applied Finance, 16(1),
71--86.
Ngechu. M. (2004). Understanding the research process and methods. An introduction to
Research methods. Acts Press, Nairobi.
Ngige, A.W. (2012). Corporate restructuring and firm performance in the banking sector
of Kenya. Unpublished MBA project: School of Business, University of Nairobi.
Nimalathasan, B. (2009). Determinants of key performance indicators (KPIs) of private
sector banks in Sri Lanka: an application of exploratory factor analysis. The USV
Annals Of Economics And Public Administration, 9(2), 9--17.
Odinga, G.O (2003). Determinants of Capital Structure for companies listed at the NSE,
Unpublished MBA project, University of Nairobi.
Omondi. O (1996). Firm specific determinants of Capital Structure for companies listed
at the NSE. Unpublished MBA project, University of Nairobi.
Orodho, A. J. (2003). Essentials of Educational and Social Sciences Research Method.
Nairobi: Masola Publishers.
Padilla, A., & Requejo, A. (2000). Financial distress, bank debt restructurings, and
layoffs. Spanish Economic Review, 2(2), 73--103.
Rappaport, A. (1986). Creating shareholder value (1st ed.). New York: Free Press.

52
Riany, C., Musa, G., Odera, O., & Okaka, O. (2012). Effects of restructuring on
organization performance of mobile phone service providers. International Review
of Social Sciences and Humanities, 4(1), 198--204.
Roe A. (2004) Key Issues in the Future Development of Kenyan Banking, Paper on
stakeholders’ forum on financial sector reforms, Mombasa, Oxford Policy
Management and University of Warwick.
Rogovsky, N., Ozoux, P., Esser, D., & Broughton, A. (2005). Restructuring for
Corporate Success: A socially sensitive approach. Geneva: International Labour
Office.
Rono, K. (2011). Impact of outsourcing practices on performance of commercial banks
in Kenya. Unpublished MBA Project: School of Business, University of Nairobi.
Sangmi, M., Tabassum, N. (2010). Analyzing Financial Performance of Commercial
Banks in India: Application of CAMEL Model. Pakistan Journal Commercial Social
Sciences.
Sekaran, U. (1992). Research methods for business (1st ed.). New York: Wiley.
Smart, S., & Waldfogel, J. (1994). Measuring the effect of restructuring on corporate
performance: the case of management buyouts. The Review of Economics and
Statistics, 503--511.
Siro, R.O. (2013). Effects of capital structure on the financial performance of firms listed
on the NSE. Unpublished MBA Project: School of Business, University of Nairobi.

53
Srivastava, V., & Mushtaq, G. (2011). Corporate Restructuring - A Financial Strategy.
Asian Journal of Technology & Management Research.
Suka, J.N. (2012). The impact of capital adequacy on the financial performance of
commercial banks quoted at the Nairobi Stock Exchange. Unpublished MBA
Project: School of Business, University of Nairobi.
Wanguru, P.N. (2011). Effect of mergers on Profitability of firms in Kenya. Unpublished
MBA Project: School of Business, University of Nairobi
Wen, M. (2002). Corporate Governance and Firm Performance. The China Boom and its
Discontents
Williams, D. 2003. Measuring government in the early twentieth century. Public
Administration Review 63(6): 643-659.
Wruck, K. (1990). Financial distress, reorganization, and organizational efficiency.
Journal of Financial Economics, 27(2), 419--444.

54
APPENDICES
Appendix I: List of Commercial Banks in Kenya as at 31st December 2013
1. African Banking Corporation Ltd.
2. Bank of Africa Kenya Ltd.
3. Bank of Baroda (K) Ltd.
4. Bank of India
5. Barclays Bank of Kenya Ltd.
6. CFC Stanbic Bank Ltd.
7. Charterhouse Bank Ltd
8. Chase Bank (K) Ltd.
9. Citibank N.A Kenya
10. Commercial Bank of Africa Ltd.
11. Consolidated Bank of Kenya Ltd.
12. Co-operative Bank of Kenya Ltd.
13. Credit Bank Ltd.
14. Development Bank of Kenya Ltd.
15. Diamond Trust Bank (K) Ltd.
16. Dubai Bank Kenya Ltd.
17. Ecobank Kenya Ltd
18. Equatorial Commercial Bank Ltd.
19. Equity Bank Ltd.
20. Family Bank Ltd

55
21. Fidelity Commercial Bank Ltd
22. Fina Bank Ltd
23. First community Bank Limited
24. Giro Commercial Bank Ltd.
25. Guardian Bank Ltd
26. Gulf African Bank Limited
27. Habib Bank A.G Zurich
28. Habib Bank Ltd.
29. I & M Bank Ltd
30. Imperial Bank Ltd 55
31. Jamii Bora Bank Ltd.
32. Kenya Commercial Bank Ltd
33. K-Rep Bank Ltd
34. Middle East Bank (K) Ltd
35. National Bank of Kenya Ltd
36. NIC Bank Ltd
37. Oriental Commercial Bank Ltd
38. Paramount Universal Bank Ltd
39. Prime Bank Ltd
40. Standard Chartered Bank (K) Ltd
41. Trans-National Bank Ltd
42. UBA Kenya Bank Ltd.
43. Victoria Commercial Bank Ltd

56
Source: CBK Supervision Annual Report (2013)
Appendix II: NSE-Listed commercial Banks in Kenya as at 31st December 2013
1. Barclays Bank Ltd,
2. CFC-Stanbic Holdings Ltd,
3. Co-operative Bank of Kenya Ltd,
4. Diamond Trust Bank Kenya Ltd,
5. Equity Bank Ltd,
6. Housing Finance Ltd,
7. I & M Bank Ltd,
8. Kenya Commercial Bank Ltd,
9. National Bank of Kenya Ltd,
10. NIC Bank Ltd, and
11. Standard Chartered Bank Ltd.

57
Appendix III: Data Collection
BANK YEAR Y(ROA) X1(DEBT
RATIO)
X2(DIVIDEND
PAYOUT
RATIO)
X3(EQUITY
RATIO)
KCB 2008 0.023986334
-
0.5076142
0.1206958
CFC 2008 0.007618124
-
-
0.173204184
COOP 2008 0.028435905
0.0018682
0.1250000
0.163009367
DTB 2008 0.018246973
0.0209263
0.2229299
0.105181952
EQUITY 2008 0.049569594
0.0686621
0.2808989
0.248228299
HF 2008 0.009544109
0.0069332
0.3797468
0.25551434
BARCLAYS 2008 0.032787372
0.0074239
0.4878049
0.12143493
NBK 2008 0.029057024
-
-
0.145397429
NIC 2008 0.024347782
-
0.1572327
0.130592798
STANCHART 2008 0.032830005
-
0.8818342
0.116126609
KCB 2009 0.020966816
-
0.5434783
0.115876696
CFC 2009 0.000281367
0.0263959
-
0.159303396
COOP 2009 0.026816531
0.0018429
0.2352941
0.141455393
DTB 2009 0.018750259
0.0170328
0.2020860
0.104952903
EQUITY 2009 0.041998968
0.0530691
0.3508772
0.227234853
HF 2009 0.012839048
0.0089395
0.4901961
0.223328901
I&M 2009 0.02220391
0.0110224
0.3511510
0.13709915
BARCLAYS 2009 0.036942915
0.0073692
0.5555556
0.146837623
NBK 2009 0.028459719
-
-
0.153832955
NIC 2009 0.02282899
-
0.1510574
0.142818205
STANCHART 2009 0.038235525
-
0.7151371
0.112438848
KCB 2010 0.028556976 0.155674581

58
BANK YEAR Y(ROA) X1(DEBT
RATIO)
X2(DIVIDEND
PAYOUT
RATIO)
X3(EQUITY
RATIO)
- 0.4528986
CFC 2010 0.012759605
0.0282533
0.1623277
0.176817385
COOP 2010 0.029674936
0.0008977
0.3053435
0.12945529
DTB 2010 0.027330373
0.0144998
0.1142041
0.106931628
EQUITY 2010 0.049867849
0.0350166
0.4145078
0.190213819
HF 2010 0.012962834
0.0582501
0.4242424
0.14541121
I&M 2010 0.024370943
0.0052658
0.2490040
0.159416353
BARCLAYS 2010 0.06147377
0.0074993
0.6987179
0.182495723
NBK 2010 0.033683664
-
0.1435407
0.165419921
NIC 2010 0.031584378
-
0.1086957
0.141546752
STANCHART 2010 0.037662573
-
0.7265877
0.142428415
KCB 2011 0.033203839
0.0257774
0.4973118
0.13414835
CFC 2011 0.012245985
0.0338099
-
0.1287141
COOP 2011 0.031881268
0.0013520
0.2597403
0.124477161
DTB 2011 0.024653602
0.0118614
0.1251841
0.10757941
EQUITY 2011 0.052599672
0.0388397
0.3584229
0.174661477
HF 2011 0.019524949
0.0619017
0.4444444
0.148014698
I&M 2011 0.032135885
0.0031232
0.2208631
0.140349334
BARCLAYS 2011 0.048332924
0.0081483
1.0067114
0.174957642
NBK 2011 0.022516914
-
0.1253918
0.152283517
NIC 2011 0.034274496
-
0.0744048
0.133228911
STANCHART 2011 0.035580257
0.0103720
0.5569620
0.126149844
KCB 2012 0.033217798
0.0242891
0.4622871
0.145189348

59
BANK YEAR Y(ROA) X1(DEBT
RATIO)
X2(DIVIDEND
PAYOUT
RATIO)
X3(EQUITY
RATIO)
CFC 2012 0.021017008
0.0370506
0.0737374
0.190213519
COOP 2012 0.03850679
0.0227930
0.2717391
0.146404571
DTB 2012 0.026780808
0.0095460
0.1089450
0.12196951
EQUITY 2012 0.049677181
0.0607065
0.3834356
0.176485586
HF 2012 0.018149319
0.0467519
0.4347826
0.125431478
I&M 2012 0.028464709
0.0015028
0.1939864
0.134158434
BARCLAYS 2012 0.047293386
0.0074557
0.6211180
0.160075747
NBK 2012 0.010961317
-
0.1315789
0.15581115
NIC 2012 0.028027997
-
0.1658375
0.142887153
STANCHART 2012 0.041307495
0.0088103
0.4699248
0.157421961
KCB 2013 0.036692655
0.0197508
0.4149378
0.162094694
CFC 2013 0.02840344
0.0308690
0.0485736
0.179632531
COOP 2013 0.039391908
0.0443414
0.2272727
0.158225029
DTB 2013 0.028564887
0.0173045
0.0971772
0.125815583
EQUITY 2013 0.047809195
0.0317360
0.4178273
0.185630597
HF 2013 0.021000403
0.0401244
0.4069767
0.123646002
I&M 2013 0.035237772
0.0265449
0.2183134
0.168756916
BARCLAYS 2013 0.036872578
0.0019348
0.5000000
0.156583905
NBK 2013 0.012023061
-
0.1422414
0.128445864
NIC 2013 0.026740689
-
0.1633987
0.145122324
STANCHART 2013 0.042029454
0.0156726
0.4928620
0.164282441