the effect of light intensity on blood pressure, heart … · physics department, faculty of...
TRANSCRIPT

An - Najah Univ. J. Res. (N. Sc.) Vol. 29, 2015
The Effect of Light Intensity on Blood Pressure, Heart Pulse Rate, Blood Oxygen Saturation and Temperature of Children in Jenin-
City Schools تأثير شدة االضاءة على ضغط الدم ودقات القلب وتركيز األكسجين في الدم ودرجة حرارة
فلسطين - االطفال في مدارس مدينة جنين
Hadeel Abo-Ras, Issam Abdelraziq*, & Musa El-Hasan ھديل أبو راس، وعصام عبد الرازق، وموسى الحسن
Physics Department, Faculty of Science, An-Najah National University, Nablus, Palestine
*Corresponding Author, E-mail: [email protected] Received: (29/7/2013), Accepted: (17/9/2014)
Abstract
The study population consisted of 237 children aged 5-6 years in Jenin city. The arterial blood pressure (systolic and diastolic), heart pulse rate, oxygen saturation in blood and tympanic temperature were measured before and after exposure to light intensity levels for four hours continuously. The light intensity levels were (0 - 60), (400 - 600) and (1320 - 1500) lux. The background light was (400 - 600) lux for all selected schools, which is considered to be normal or accepted light intensity level. Strong positive correlation (Pearson Correlation Coefficient) was found to be R > 0.659 between light intensity levels and all of the arterial blood pressure (systolic and diastolic), heart pulse rate, blood oxygen saturation and tympanic temperature in the selected school. In addition, P-value between the dependent and independent variables was found to be zero. Finally, the study concludes that there is an effect of the light intensity levels on arterial blood pressure (systolic and diastolic), heart pulse rate, oxygen saturation in blood and tympanic temperature of schools’ children.
Keywords: Light Intensity, Blood Pressure, Heart Pulse Rate, Oxygen Saturation, Tympanic Temperature.

ـــــــــــــــــــــــــــــــــــــــــــــــــــــــــــــــــــــــــــــــــــــــــ 26 “The Effect of Light Intensity on ......”
An - Najah Univ. J. Res. (N. Sc.) Vol. 29, 2015 ــــــــــــــــــــــــــــــــــــــــــــــــــــــــــــــــــــــــــــ
ملخصھدفت ھذه الدراسة الى التعرف على تاثير شدة األضاءة على كل من ضغط الدم
حيث شملت . لحرارةكسجين في الدم ودرجة ا، نبض القلب، نسبة األ)واالنبساطياالنقباضي (وقد تمت القياسات . سنوات في مدينة جنين) 6- 5(طفل تتراوح اعمارھم 237عينة الدراسة
وتم دراسة ذلك . على العوامل المذكورة قبل وبعد التعرض لالضاءة لمدة اربع ساعات متواصلة-lux )0-60( ،)400 قيمةتحت مستويات مختلفة من شدة األضاءة حيث كانت المستويات ب
وقد خلصت الدراسة الى ان ھناك تاثير لمستوى شدة األضاءة على ). 1320-1500(، )600حيث ، دقات القلب، نسبة األكسجين في الدم ودرجة الحرارة)األنقباضى واألنبساطى(ضغط الدم
.0.659اكبر من R وجد ان معامل بيرسون I. Introduction
The electromagnetic spectrum is the range of all possible frequencies which extends from long-wavelength used for radio to gamma radiation at the short-wavelength. The visible light contains approximately between 380 and 780 nm which helps us to see things and do our daily activities in many places including offices, hospitals, institution and schools. When a cell in the human retina captures light which can disrupt the body's production of melatonin (hormone produced by pineal gland in the brain) it helps regulate other hormones and maintains the body's circadian rhythm (Guyton, 2000).
It has been found that the daylight in factories can affect the physiological and psychological health of workers in windowless factories where workers have more headaches, faintness, sickness, decrease white cell activity, an absenteeism problems and depression compared to workers in factories with windows (Edwards et al., 2002).
The Occupational Safety and Health Administration (OSHA, 1965) plays an essential role where it sets the occupational light standard which guarantees the human health, such as the minimum illumination intensities in lux unit.
More common lighting systems in schools to acknowledge the use of neon which provides a cost effective, has a high and a long life, good color and low noise levels. However, there is an effect of light intensity on the human physiology and behavior (Webb, 2006).
Hadeel Abo-Ras & et al. ـــــــــــــــــــــــــــــــــــــــــــــــــــــــــــــــــــــــــــــــــــــــــــــــــــــــــــــــــــــــ 27
An - Najah Univ. J. Res. (N. Sc.) Vol. 29, 2015 ــــــــــــــــــــــــــــــــــــــــــــــــــــــــــــــــــــــــــــ
When the body is exposed to less intensity light the body produces a hormone called melatonin which is produced at night by the pineal gland in the brain. It has a role in regulating the sleep – wake cycle. Melatonin has also been shown to lower blood pressure and lower body temperature. It has also been explored as a treatment option for insomnia hypertension and cancer (Pandi-Perumal et al., 2006).
In modern society, people are routinely exposed to electrical lighting during evening hours to partake in work and social activities. A study carried out by Joshua in 2011, of Brigham and Women's Hospital and Harvard Medical School in Boston showed that exposure to indoor light has a strong suppressive effect on melatonin. This could have effects on sleep quality and the body's ability to regulate body temperature, blood pressure and glucose level (Joshua, 2011).
A study was conducted in China in Jen Junior college of Medicine on the effects of high intensity of light on the physiological parameters of the premature relationship with the premature infants’ physiological parameters and the heart pulse rate respiration. The study showed that pulse rate increased and the blood oxygen saturation decreased as the intensity of light increased (Peng et al., 2001).
A study carried on nurses working in a newborn intensive care unit (NICU) showed that tympanic temperature were consistently higher when nurses were exposed to bright light during their shifts and their sense of well-being was improved (Figueir et al., 2001).
Exposure to early morning room light can significantly advance the timing of the human circadian pacemaker. The resulting response to such light has a non- linear relationship to illuminance and affected plasma melatonin concentrations (Jamie et al, 2000).
Badia in his study showed that exposure to bright light of 5000 lux elevates body temperature and light exerts a powerful, immediate effect on physiology and behavior in addition to its powerful influence on circadian organization (Badia et al., 1991).

ـــــــــــــــــــــــــــــــــــــــــــــــــــــــــــــــــــــــــــــــــــــــــ 28 “The Effect of Light Intensity on ......”
An - Najah Univ. J. Res. (N. Sc.) Vol. 29, 2015 ــــــــــــــــــــــــــــــــــــــــــــــــــــــــــــــــــــــــــــ
Exposure to light affects both men and woman. However the effect is different through the level of the absolute values of melatonin plasma levels. After bright light exposure, the suppression of plasma melatonin was 40% greater in women than in men. These findings suggest that, in human there is a sex difference in the nocturnal sensitivity of the pineal to light (Monteleone et al., 1997).
In this research, our objective is to study the effects of light intensity on the blood pressure, heart pulse rate, blood oxygen saturation, and tympanic temperature of children in schools in Jenin-city.
II. Methodology
The study population This study was done in April 2012, the population consists of
children of three schools in Jenin city. The population of the study was 237 children. The children aged between 5 - 6 years (1st grade), with the male constituting 50.3% and the female constituting 49.7%. The sample size was determined according to Cochran formula (Cochran, 1977). The children were examined without participating in the morning activities and before being exposed to the level of light intensity.
The noise pressure level was (50.5 - 55.6) dB which is considered to be quiet place where the schools are located.
The examined children in the three schools were exposed to the three different levels of light intensity. These three different levels of light intensity were (0 - 60), (400 - 600) and (1320 - 1500) lux. The background light was (400 - 600) lux for all selected schools, which is considered to be normal or accepted level. The systolic and diastolic blood pressure, heart pulse rate, blood oxygen saturation and tympanic temperature were measured for children before being exposed to the different light intensity levels and after four hours of exposure to different light intensity levels.
Hadeel Abo-Ras & et al. ـــــــــــــــــــــــــــــــــــــــــــــــــــــــــــــــــــــــــــــــــــــــــــــــــــــــــــــــــــــــ 29
An - Najah Univ. J. Res. (N. Sc.) Vol. 29, 2015 ــــــــــــــــــــــــــــــــــــــــــــــــــــــــــــــــــــــــــــ
Instrumentation Hioki 3423 lux Hitester Digital illumination meter was used to
measure the light intensity. It measures a broad range of luminosities, from the low light provided by induction lighting up to a maximum intensity of 199,900 lux.
Arterial blood pressure (systolic, diastolic and pulse rate) were measured by using Automatic Blood Pressure Monitor (Microlife AG, Modno. BP 2BHO, Measuring range: (30-280mmHg) with accuracy + 2% mm-Hg, and + 2% for reading heart pulse rate with operating temperature range of +10 °C to +40 °C( Instruction Manual, 2009).
Pulse Oximeter LM-800(Finger Oximeter) with accuracy + 1%, was used to measure the blood oxygen saturation.
The GT-302/GT-302-1 Ear Thermometer was used to measure human body temperature through the tympanic temperature of the ear. The display temperature range is 32.0 to 42.9 °C with accurancy range + 0.01°C.
Quest Technologies U.S.A, Model 2900 type 2 with accuracy of + 0.5 dB at 25 °C is used as sound pressure level meter (Instruction Manual for Models 2900, 1998a).
The data was analyzed by using SPSS program. Pearson correlation factor (R) and the P-value were used as a measure of the strength of the correlation between light intensity and the systolic, diastolic blood pressure, heart pulse rate, blood oxygen saturation and tympanic temperature.
III. Results The average values of the background light intensity levels to all
selected schools were 409 lux for school (1), 585 lux for school (2), and 423 lux for school (3). These background measured values are accepted (normal) according to JIS (200 to 750) lux. The schools were chosen in quiet (50 - 60) dB area to minimize the effect from the noise.
a- Measurements of blood pressure (SPB and DPB)

ـــــــــــــــــــــــــــــــــــــــــــــــــــــــــــــــــــــــــــــــــــــــــ 30 “The Effect of Light Intensity on ......”
An - Najah Univ. J. Res. (N. Sc.) Vol. 29, 2015 ــــــــــــــــــــــــــــــــــــــــــــــــــــــــــــــــــــــــــــ
Blood pressures (SBP and DBP) were measured to all children before and after exposure to different light intensity levels. The relationship between the light intensity and average values of the SBP and DBP for examined children of each school are plotted in the following Figs. (1-6).
Fig. (1): The relationship between average values of systolic blood pressure (SBP) versus the light intensity levels in school (1) (b: before, a: after).

Hadeel Abo-Ras & et al. ـــــــــــــــــــــــــــــــــــــــــــــــــــــــــــــــــــــــــــــــــــــــــــــــــــــــــــــــــــــــ 31
An - Najah Univ. J. Res. (N. Sc.) Vol. 29, 2015 ــــــــــــــــــــــــــــــــــــــــــــــــــــــــــــــــــــــــــــ
Fig. (2): The relationship between average values of systolic blood pressure (SBP) versus the light intensity levels in school (2). (b: before, a: after).

ـــــــــــــــــــــــــــــــــــــــــــــــــــــــــــــــــــــــــــــــــــــــــ 32 “The Effect of Light Intensity on ......”
An - Najah Univ. J. Res. (N. Sc.) Vol. 29, 2015 ــــــــــــــــــــــــــــــــــــــــــــــــــــــــــــــــــــــــــــ
Fig. (3): The relationship between average values of systolic blood pressure (SBP) versus the light intensity levels in school (3). (b: before, a: after).
Figures (1-3) show that the systolic blood pressure (after exposure to light intensity) decreases when the light intensity has been changed from normal (409-585) lux to low intensity (39-55) lux, and when the light intensity has been changed from normal to high intensity (1320-1500) lux the systolic blood pressure (after exposure to light intensity) increases.

Hadeel Abo-Ras & et al. ـــــــــــــــــــــــــــــــــــــــــــــــــــــــــــــــــــــــــــــــــــــــــــــــــــــــــــــــــــــــ 33
An - Najah Univ. J. Res. (N. Sc.) Vol. 29, 2015 ــــــــــــــــــــــــــــــــــــــــــــــــــــــــــــــــــــــــــــ
Fig. (4): The relation between average values of diastolic blood pressure (DBP) versus the light intensity levels in school (1). (b: before, a: after).
Fig. (5): The relation between average values of diastolic blood pressure (DBP) versus the light intensity levels in school (2). (b: before, a: after).

ـــــــــــــــــــــــــــــــــــــــــــــــــــــــــــــــــــــــــــــــــــــــــ 34 “The Effect of Light Intensity on ......”
An - Najah Univ. J. Res. (N. Sc.) Vol. 29, 2015 ــــــــــــــــــــــــــــــــــــــــــــــــــــــــــــــــــــــــــــ
Fig. (6): The relation between average values of diastolic blood pressure (DBP) versus the light intensity levels in school (3). (b: before, a: after).
Figures (4-6) show that there is an increase in the diastolic blood pressure when the light intensity has been changed from normal light intensity to high light intensity due to the exposure to light intensity for four hours.
b- Measurements of Heart Pulse Rate (HPR) Heart pulse rate was measured to all children before and after
exposure to different light intensity levels.
The relation between the light intensity levels and average values of the HPR for examined children are plotted and shown in Figs. (7-9).

Hadeel Abo-Ras & et al. ـــــــــــــــــــــــــــــــــــــــــــــــــــــــــــــــــــــــــــــــــــــــــــــــــــــــــــــــــــــــ 35
An - Najah Univ. J. Res. (N. Sc.) Vol. 29, 2015 ــــــــــــــــــــــــــــــــــــــــــــــــــــــــــــــــــــــــــــ
Fig. (7): The relationship between average values of heart pulse rate (HPR) versus the light intensity levels in school (1). (b: before, a: after).
Fig. (8): The relationship between average values of heart pulse rate (HPR) versus the light intensity levels in school (2). (b: before, a: after).

ـــــــــــــــــــــــــــــــــــــــــــــــــــــــــــــــــــــــــــــــــــــــــ 36 “The Effect of Light Intensity on ......”
An - Najah Univ. J. Res. (N. Sc.) Vol. 29, 2015 ــــــــــــــــــــــــــــــــــــــــــــــــــــــــــــــــــــــــــــ
Fig. (9): The relationship between average values of heart pulse rate (HPR) versus the light intensity levels school (3). (b: before, a: after).
Figures (7-9) show that when the light intensity has been changed from normal (409-585) lux to high intensity (1320-1500) lux, the heart pulse rate (after exposure to light intensity) increases, and when the light intensity has been changed from normal light intensity to low intensity (39-55) lux, the heart pulse rate (after exposure to light intensity) decreases.
c- Measurements of blood oxygen saturation SPO2% Blood oxygen saturation was measured for the examined
children of the three selected schools before and after exposure to different light intensity levels. The relationship between the light intensity level and average values of the SPO2% for examined children are plotted for each school in the following Figs. (10-12).

Hadeel Abo-Ras & et al. ـــــــــــــــــــــــــــــــــــــــــــــــــــــــــــــــــــــــــــــــــــــــــــــــــــــــــــــــــــــــ 37
An - Najah Univ. J. Res. (N. Sc.) Vol. 29, 2015 ــــــــــــــــــــــــــــــــــــــــــــــــــــــــــــــــــــــــــــ
Fig. (10): The relationship between average values of blood oxygen saturation (SPO2%) versus the light intensity levels in school (1). (b : before, a: after).
Fig. (11): The relationship between average values of blood oxygen saturation (SPO2%) versus the light intensity levels in school (2). (b: before, a: after).

ـــــــــــــــــــــــــــــــــــــــــــــــــــــــــــــــــــــــــــــــــــــــــ 38 “The Effect of Light Intensity on ......”
An - Najah Univ. J. Res. (N. Sc.) Vol. 29, 2015 ــــــــــــــــــــــــــــــــــــــــــــــــــــــــــــــــــــــــــــ
Fig. (12): The relationship between average values of blood oxygen saturation (SPO2%) versus the light intensity levels in school (3). (b: before, a: after).
Figures (10-12) show that for all schools as light intensity increases from normal range or decreases from normal range, the average of SPO2% (after exposure to light intensity) decreases.
d- Measurements of Tympanic Temperature (T). Tympanic temperature was measured before and after exposure to
different light intensity levels for each child. The relationship between the light intensity level and average values of the tympanic temperature for examined children are plotted for each school in the following Figs. (13-15).

Hadeel Abo-Ras & et al. ـــــــــــــــــــــــــــــــــــــــــــــــــــــــــــــــــــــــــــــــــــــــــــــــــــــــــــــــــــــــ 39
An - Najah Univ. J. Res. (N. Sc.) Vol. 29, 2015 ــــــــــــــــــــــــــــــــــــــــــــــــــــــــــــــــــــــــــــ
Fig. (13): The relationship between average values of tympanic temperature (T) versus the light intensity levels in school (1). (b : before, a: after).
Fig. (14): The relationship between average values of tympanic temperature (T) versus the light intensity levels in school (2). (b: before, a: after).
ـــــــــــــــــــــــــــــــــــــــــــــــــــــــــــــــــــــــــــــــــــــــــ 40 “The Effect of Light Intensity on ......”
An - Najah Univ. J. Res. (N. Sc.) Vol. 29, 2015 ــــــــــــــــــــــــــــــــــــــــــــــــــــــــــــــــــــــــــــ
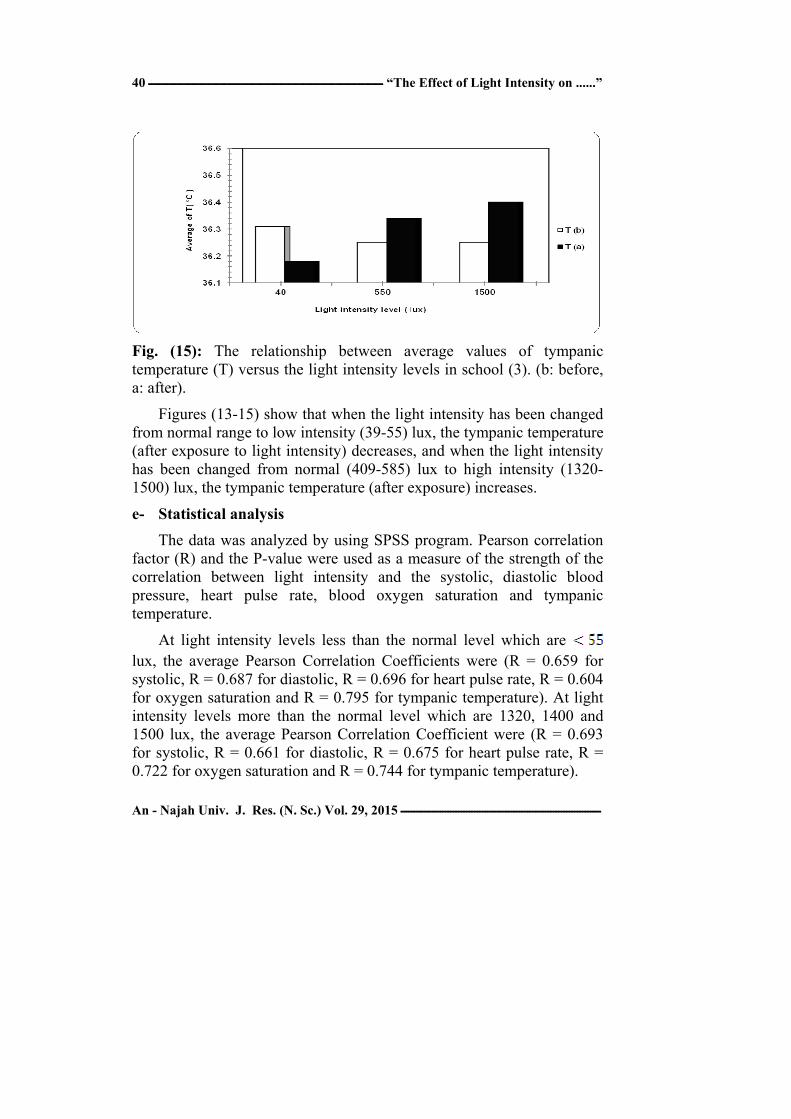
Fig. (15): The relationship between average values of tympanic temperature (T) versus the light intensity levels in school (3). (b: before, a: after).
Figures (13-15) show that when the light intensity has been changed from normal range to low intensity (39-55) lux, the tympanic temperature (after exposure to light intensity) decreases, and when the light intensity has been changed from normal (409-585) lux to high intensity (1320-1500) lux, the tympanic temperature (after exposure) increases.
e- Statistical analysis The data was analyzed by using SPSS program. Pearson correlation
factor (R) and the P-value were used as a measure of the strength of the correlation between light intensity and the systolic, diastolic blood pressure, heart pulse rate, blood oxygen saturation and tympanic temperature.
At light intensity levels less than the normal level which are lux, the average Pearson Correlation Coefficients were (R = 0.659 for systolic, R = 0.687 for diastolic, R = 0.696 for heart pulse rate, R = 0.604 for oxygen saturation and R = 0.795 for tympanic temperature). At light intensity levels more than the normal level which are 1320, 1400 and 1500 lux, the average Pearson Correlation Coefficient were (R = 0.693 for systolic, R = 0.661 for diastolic, R = 0.675 for heart pulse rate, R = 0.722 for oxygen saturation and R = 0.744 for tympanic temperature).

Hadeel Abo-Ras & et al. ـــــــــــــــــــــــــــــــــــــــــــــــــــــــــــــــــــــــــــــــــــــــــــــــــــــــــــــــــــــــ 41
An - Najah Univ. J. Res. (N. Sc.) Vol. 29, 2015 ــــــــــــــــــــــــــــــــــــــــــــــــــــــــــــــــــــــــــــ
In addition, the P-value was found to be zero for all mentioned health dependent variables.
IV-Discussion Our results showed an increase on arterial blood pressure (systolic
and diastolic) and tympanic temperature for children after four hours of exposure to high light intensity levels Figs. 1-6 and Figs. 13-15. It is noticed that the arterial blood pressure (systolic and diastolic) and tympanic temperature decrease after four hours of exposure to low light intensity levels Figs. 1-6 and Figs. 13-15. These results agree with the work of Joshua (Joshua, 2011), since the melatonin hormone increases at night (low light intensity), so the melatonin has been shown to lower blood pressure and tympanic temperature. This increment on arterial blood pressure and tympanic temperature is due to decreasing of melatonin hormone because of an increment in light intensity levels. There is positive Correlation (R ) between the independent variable (light intensity level) and the dependent variables (SBP, DBP). This relation between the dependent and independent variables is significant.
In addition, the heart pulse rate increases after exposure to different light intensity levels, this increment is due to the four hours exposure to light intensity levels Figs. 7-9.
It is noticed that there is a strong correlation between the light intensity and HPR since the Pearson Correlation Coefficient (R) is > 0.892 and this relation is significant considering P-value which is zero.
In this work, the blood oxygen saturation decreased after the exposure to low and high light intensity levels Figs. 10-12. This result is in good agreement with Peng et al study (Peng et al, 2001). The decrement of blood oxygen saturation is due to decrease of melatonin hormone. The Pearson Correlation Coefficient R for blood oxygen saturation is > 0.687. Also, this correlation is significant since the P-value equals zero.

ـــــــــــــــــــــــــــــــــــــــــــــــــــــــــــــــــــــــــــــــــــــــــ 42 “The Effect of Light Intensity on ......”
An - Najah Univ. J. Res. (N. Sc.) Vol. 29, 2015 ــــــــــــــــــــــــــــــــــــــــــــــــــــــــــــــــــــــــــــ
The temperature shows a significant positive correlation with light intensity levels, since Person Correlation R is > 0.686, and P-value = 0.000.
Our results of tympanic temperature, systolic and diastolic arterial blood pressures and heart pulse rate showed consistently increase as light intensity increase. The blood oxygen saturation decreases as the intensity of light increase or decrease. All the parameters which have been measured were not exceeding the pathologic levels.
V- Conclusion Our study had shown that there is no significant difference between
female and male, may be because our sample is children 5-6 years old.
The normal average values of the light intensity inside classrooms to all selected school are accepted according to JIS recommendations (Instruction Manual for JIS standard, 1979).
As a conclusion, exposures to light intensity is similar to exposures to noise pollution which both have affected arterial blood pressure (systolic and diastolic), heart pulse rate, oxygen saturation in blood and tympanic temperature (Abdelraziq et al, 2003)(Abdel-Ali et al, 2003)(Qamhieh et al., 2000)(Sadeq et al., 2013)(Dana et al., 2013)(Noorhan et al., 2013). References
− Abdel-Ali M. M. Abdel-Raziq I. R. & Qamhieh Z. N. (2003). Noise Pollution in Factories in Nablus City, Acta Acustica, 89, 913-916.
− Abdel-Raziq I. R. Ali-Shtayeh M. S. & Abdel-Raziq H. R. (2003). Effects of noise pollution on Arterial Blood Pressure, Pulse Rate and Hearing Threshold in School Children, Pakistan Journal of Applied Science, 3, 717-723.
− Badia P. Myers B. Boecker M. Culpepper J. & Harsh J. (1991). Bright light effects on body temperature, alertness, EEG and behavior, Physiology and Behavior Journal, 50(3), 583-588.

Hadeel Abo-Ras & et al. ـــــــــــــــــــــــــــــــــــــــــــــــــــــــــــــــــــــــــــــــــــــــــــــــــــــــــــــــــــــــ 43
An - Najah Univ. J. Res. (N. Sc.) Vol. 29, 2015 ــــــــــــــــــــــــــــــــــــــــــــــــــــــــــــــــــــــــــــ
− Cochran, (1977). Sampling techniques, third edition, New York: John Wiley and Son.
− Dana F. M. Zaid N. Qamhieh & Issam R. Abdelraziq, (2013). Health effects of occupational noise exposure in the range (90-110)dB(A) especially on blood oxygen saturation of workers in selected industrial plants. Environmental Science Journal. 8(11), 419-424.
− Edwards L. & Torcllini P. (2002). A literaure review of the effects of natural light on building occupants, NREL, 35-36.
− Figueiro G. Rea S. Boyce P. White R. & kolberg K. (2001). The effects of bright light on day and night shift nurses performance and wellbeing in the NICU. Neonatal Intensive Care, 14(1), 29-32.
− Guyton A. (2000). Medical physiology, W.B.Saunders Company, tenth edition, 927-928.
− Instruction Manual for Automatic Blood Pressure. (2009). Microlife AG Monitor Model, Mod No. BP 2BHO, Germany.
− Instruction Manual for JIS standard, (1979).
− Instruction Manual for Models. 2900 Integrating and Logging Sound Level Meter, (1998)a. Quest Technology.
− Jamie M. Derek-Jan D. Richard E. Emery N. & Charles A. (2000). Sensitivity of the human circadian pacemaker to nocturnal light: melatonin phase resetting and suppression, Physiology Journal, 695-702.
− Joshua J. Gooley, Kyle Chamberlain, Kurt A. Smith, Sat Bir S. Khalsa, Shantha M. W. Rajaratnam, Eliza Van Reem, Jamie M. Zeitzer, Charles A. Czeisler, & Steven W. Lockley. (2011). Exposure to room light bedtime suppresses melatonin onset and shortens melatonin duration in humans, JCEM, 96(3): 463-472.
− Monteleone P. Esposite G. La Rocca A. & Maj M. (1997). Does bright light suppress nocturnal melatonin secretion more in women than men?", Neural Transmission, 102(1), 75-80.

ـــــــــــــــــــــــــــــــــــــــــــــــــــــــــــــــــــــــــــــــــــــــــ 44 “The Effect of Light Intensity on ......”
An - Najah Univ. J. Res. (N. Sc.) Vol. 29, 2015 ــــــــــــــــــــــــــــــــــــــــــــــــــــــــــــــــــــــــــــ
− Noorhan F. Mohammad, Sharif M. Musameh, & Issam R. Abdelraziq. (2013). The effects of light intensity on day and night shift nurses’ health performance. Environmental Science Journal, 8(12), 460-466.
− OSHA, 1965. electronic publication at: http://www.osha.gov/index.html.
− Pandi-Perumal S. Sirnivasan V. M.Maestroni G. Cardinali D. Poeggleler B. & Hardeland R. (2006). Melatonin Natures Most Versatile Biological Signal? FEBS.
− Peng Nh. Mao Hc. ChenYc. & Chang Yc. (2001). Effect of light intensity on the physiological parameters of the premature infant, PubMed, 9(3), 43-333.
− Qamhieh Z. N. M. Suh. & I. R. Abdelraziq, (2000). Measurment of noise pollution in the community of Arraba, Acustica Acta Acustica, 86, 376-378.
− Sadeq R. M. Qamhieh Z. N. & Abdelraziq I. R. (2013). Effect of noise pollution on arterial blood pressure and heart pulse rate of workers in the hospitals of Nablus City-West Bank, J. Med. Sci., 13(2), 136-140.
− Webb A. (2006). Considerations for lighting in the built environment: Non- visual effects of light, Energy and Buildings, 38(7), 721-727.