the effect of micro-structure on fatigue behaviour of...
TRANSCRIPT

International Journal of Geosciences, 2011, 2, 240-247 doi:10.4236/ijg.2011.23026 Published Online August 2011 (http://www.SciRP.org/journal/ijg)
Copyright © 2011 SciRes. IJG
The Effect of Micro-Structure on Fatigue Behaviour of Intact Sandstone
Manoj N. Bagde1*, Vladimir Petroš2 1Central Institute of Mining and Fuel Research, Regional Centre, MECL Complex, Nagpur, India
2Faculty of Mining and Geology, VŠB-TU, Ostrava, Czech Republic E-mail: *[email protected]
Received January 4, 2011; revised May 8, 2011; accepted June 11, 2011
Abstract With advent of servo-controlled stiff testing machines, it is now possible to conduct tests on a rock in the laboratory under different variable controlled conditions. In this paper, cyclic fatigue behaviour of intact sandstone obtained from the rock burst prone coal mine in the Czech Republic were presented. Tests were conducted on MTS- 816 rock test system in the laboratory on intact rock samples of L/D ratio 2 under cyclic loading frequency of 0.1, 1, 3, 5, 7 and 10 Hz at amplitude of 0.1 mm under displacement control mode until failure of the samples in uni-axial compression. From, the primary results it was observed that at low loading frequency range of 0.1 to 3 Hz, there was degradation of the rock samples in terms of fatigue strength and modulus. While, at higher frequency rose-up in strength and deformation properties were observed. It was observed that the machine behaviour in terms of amplitude at higher loading frequencies might be affecting the results. It seemed that machine behaviour of servo-hydraulic testing system was also dependent on rock type under investigation. Keywords: Cyclic Loading, Fatigue, Micro-Structure, Machine Behaviour, Rock Memory
1. Introduction During different mining operations such as excavation, blasting, drilling and cutting, surrounding rock or rock mass subjected to alternating or cyclic stresses. Different researchers studied this type of rock behaviour generally referred as “Fatigue” under cyclic conditions in the labo- ratory. From the reported literature, it was found that intact and failed models of jointed rock were extremely susceptible to cyclic fatigue failure. Fatigue strength was typically between 50 and 70 per cent of the static strength of rock [1-4]. It were reported that different materials showed different responses in cyclic loading conditions and cyclic fatigue behaviour in rock was a complex phenomena. For the detailed literature review on the subject refers to author’s paper [5-6].
We have investigated the fatigue behaviour of sand- stone samples from a rock burst prone coal mine in Czech Republic. Laboratory tests were conducted using MTS-816 rock test system at cyclic loading frequencies from 0.1 to 10 Hz. The tests were carried out at displace- ment control mode until sample failure. The machine behaviour in terms of amplitude at higher loading fre-
quencies might have affected the results. It seemed that machine behaviour of servo-hydraulic testing system was also dependent on rock type under testing. The fatigue behaviour of sandstone samples and effect of machine behaviour on obtained results were also discussed and presented herewith. This study is the continuation of our previous investigations [5-8] on the fatigue properties of sandstones. We have discussed the fatigue properties of sandstones in terms of rock microstructure and stress memory effects. 2. Testing Programme In Czech Republic hard coal underground mines, the highest safety risk evolves from the anomalous geo- mechanical events, especially rock bursts. Thus, enginee- ring interest in the Czech Republic is related to the desire and need to predict and control such phenomena as a means of ensuring safety. Problems of the genesis of occurring rock bursts and influencing parameters are under settlement through various organized research in the laboratory and through seismic monitoring etc. The work presented herein extends consideration to dynamic
M. N. BAGDE ET AL. 241 cyclic load in the laboratory to improve the understand-ing of damage mechanisms of rock subjected to severe dynamic fatigue loads. Dynamic cyclic loading influence fatigue in rock and has great significance in predicting rock behaviour in excavation systems prone to rock burst loading. With this aim, the testing programme were de-signed and discussed in the following.
The tested sandstone samples were from borehole C 62-01 (then referred as C1) obtained from the rock burst prone CSA-Jan-Karel coalmine from Ostrava-Karvina coal basin in Czech Republic. Sandstone from borehole C1, were light to medium coarse grained with small par- ticles of the coal detritus and small amounts of muscovite on the jointing surfaces. The test specimen contained small amounts organic detritus, coal clasts, muscovite and pyrite etc. The samples were of 1:2 diameter to length ratio with average diameter of 47.6 mm.
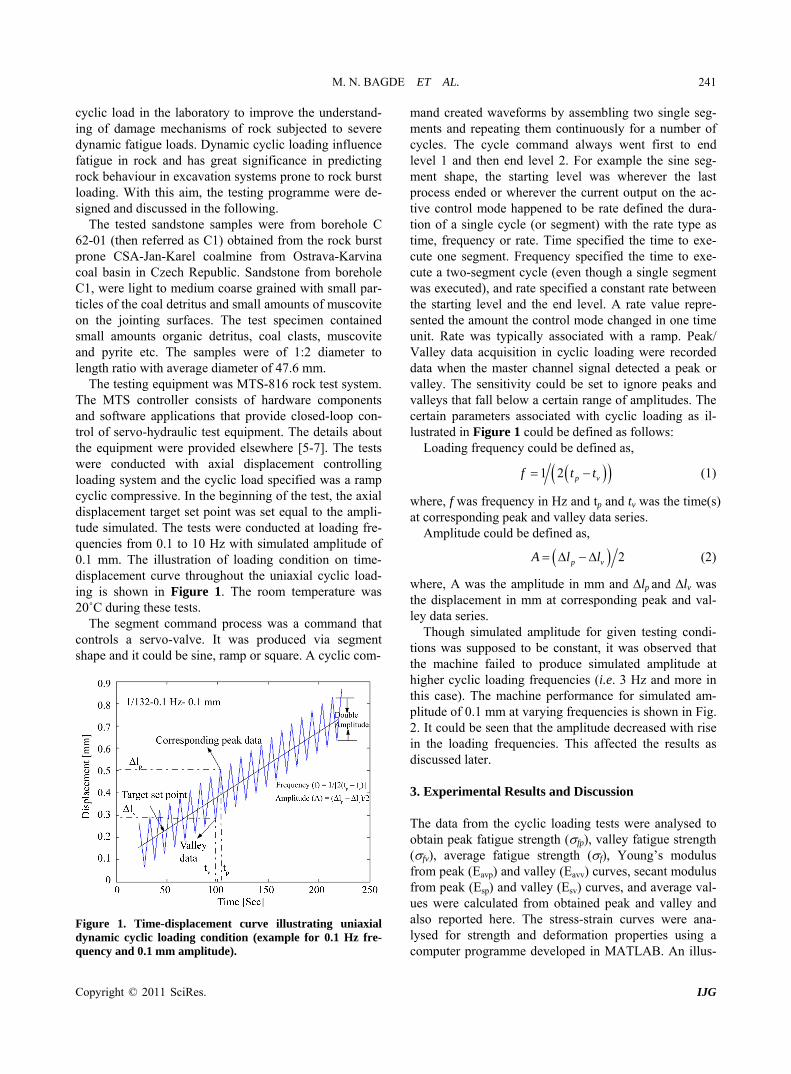
The testing equipment was MTS-816 rock test system. The MTS controller consists of hardware components and software applications that provide closed-loop con- trol of servo-hydraulic test equipment. The details about the equipment were provided elsewhere [5-7]. The tests were conducted with axial displacement controlling loading system and the cyclic load specified was a ramp cyclic compressive. In the beginning of the test, the axial displacement target set point was set equal to the ampli- tude simulated. The tests were conducted at loading fre- quencies from 0.1 to 10 Hz with simulated amplitude of 0.1 mm. The illustration of loading condition on time- displacement curve throughout the uniaxial cyclic load- ing is shown in Figure 1. The room temperature was 20˚C during these tests.
The segment command process was a command that controls a servo-valve. It was produced via segment shape and it could be sine, ramp or square. A cyclic com-
Figure 1. Time-displacement curve illustrating uniaxial dynamic cyclic loading condition (example for 0.1 Hz fre-quency and 0.1 mm amplitude).
mand created waveforms by assembling two single seg- ments and repeating them continuously for a number of cycles. The cycle command always went first to end level 1 and then end level 2. For example the sine seg-ment shape, the starting level was wherever the last process ended or wherever the current output on the ac-tive control mode happened to be rate defined the dura-tion of a single cycle (or segment) with the rate type as time, frequency or rate. Time specified the time to exe-cute one segment. Frequency specified the time to exe-cute a two-segment cycle (even though a single segment was executed), and rate specified a constant rate between the starting level and the end level. A rate value repre-sented the amount the control mode changed in one time unit. Rate was typically associated with a ramp. Peak/ Valley data acquisition in cyclic loading were recorded data when the master channel signal detected a peak or valley. The sensitivity could be set to ignore peaks and valleys that fall below a certain range of amplitudes. The certain parameters associated with cyclic loading as il-lustrated in Figure 1 could be defined as follows:
Loading frequency could be defined as,
1 2 p vf t t (1)
where, f was frequency in Hz and tp and tv was the time(s) at corresponding peak and valley data series.
Amplitude could be defined as,
2p vA l l (2)
where, A was the amplitude in mm and ∆lp and ∆lv was the displacement in mm at corresponding peak and val-ley data series.
Though simulated amplitude for given testing condi-tions was supposed to be constant, it was observed that the machine failed to produce simulated amplitude at higher cyclic loading frequencies (i.e. 3 Hz and more in this case). The machine performance for simulated am-plitude of 0.1 mm at varying frequencies is shown in Fig. 2. It could be seen that the amplitude decreased with rise in the loading frequencies. This affected the results as discussed later.
3. Experimental Results and Discussion
The data from the cyclic loading tests were analysed to obtain peak fatigue strength (fp), valley fatigue strength (fv), average fatigue strength (f), Young’s modulus from peak (Eavp) and valley (Eavv) curves, secant modulus from peak (Esp) and valley (Esv) curves, and average val- ues were calculated from obtained peak and valley and also reported here. The stress-strain curves were ana- lysed for strength and deformation properties using a computer programme developed in MATLAB. An illus-
Copyright © 2011 SciRes. IJG

M. N. BAGDE ET AL. 242
tration of stress and modulus computation from peak- valley data is shown in Figure 3. Since the data were recorded in peak-valley mode in dynamic cyclic loading, peak and valley curves were obtained separately and analysed independently using MATLAB programme to calculate strength and modulus values as shown in Fig-ure 3.
Peak fatigue strength (fp) was the maximum stress sustained by the rock specimen and obtained from the peak curve. Valley fatigue strength (fv) was the maxi-mum stress obtained from valley curve. The average fa-tigue strength (f) was the average obtained from the peak fatigue strength (fp) and valley fatigue strength (fv). Thus, it could be defined as:
2f fp fv (3)
where, f was the average fatigue strength, fp was the peak fatigue strength obtained from the peak curve and fv was the valley fatigue strength from the valley curve.
The different modulus parameters were obtained from peak-valley data using MATLAB software and could be defined as:
av avp avvE E E 2
(4)
where, Eav was the average Young’s modulus and Eavp and Eavv was the average Young’s modulus obtained from peak and valley curve respectively.
The secant modulus were obtained from peak (Esp) and valley (Esv) curves, and average secant values (Es) were calculated from obtained peak and valley and also re-ported here. Thus, it could be defined as:
s sp svE E E 2 (5)
where, Es was the average secant modulus and Esp and Esv was the secant modulus obtained at 50% of the maximum stress sustained in the case of peak and valley curve respectively.
3.1. Strength and Deformation Behaviour of the
Rock
The uniaxial compressive strength determined from static tests of sandstone rock was 148 MPa and average Young’s modulus was 20 GPa.
The peak, valley and average fatigue strength was plotted against loading frequencies as shown in Figure 4. Results showed a general trend of decrease in fatigue strength till 3 Hz loading frequency. Then sudden rose- up in values were observed at 5 and 7 Hz loading fre- quency. Drop in fatigue strength was observed at 10 Hz loading frequency.
In the case of the Young’s modulus (Figure 5) and secant modulus (Figure 6) of the rock, also showed
similar trend as discussed in the case of fatigue strength. It showed first decreasing trend with increase in fre-quency till 3 Hz and then rose-up at 5 and 7 Hz loading frequencies and then dropped at 10 Hz loading fre-quency.
The drop in values at 10 Hz loading frequency could be related to sample disturbance since this particular tested sample was having coal intrusion. But rose-up in values at 5 and 7 Hz loading frequencies were mostly related to machine behaviour as discussed earlier and as shown in Figure 2, where machine failed to produce simulated amplitude at these frequencies. Another ex- planation could be given as at higher loading frequencies crack propagation might not be allowed to develop in the rock specimen, thus increase in strength of the rock. The optical microscopic observation made on thin sections prepared from failed samples suggested that at higher loading frequencies propagation of cracks were not al- lowed to develop compared to that at low loading fre- quencies and thus rock specimen at higher frequencies continued to support increased in load up until its final
Figure 2. Machine performance behaviour in cyclic loading condition.
Figure 3. Typical stress-strain curve with illustrating com- putation of fatigue strength and modulus from peak valley data in uniaxial dynamic cyclic loading condition and vio-lent failure of the rock samples as soon as peak fatigue strength is reached.
Copyright © 2011 SciRes. IJG

M. N. BAGDE ET AL. 243
Figure 4. Fatigue strength with cyclic loading frequency.
Figure 5. Young’s modulus with cyclic loading frequency.
Figure 6. Secant modulus with cyclic loading frequency. failure. At low loading frequency the development of shear and axial cracks lead to a violent-explosive brittle failure (refer Figure 3). It was found that sandstone samples failed violently and even thrown away from the loading platen basement at high velocity.
According to Martin and Chandler [9], both the loads and stable crack length were increased up to the critical moment at which the strain-energy release rate equalled or exceeded that of energy absorption. At this stage crack propagation becomed unstable, and the material reached its peak strength. For heterogeneous materials such as rock, the propagating crack would most likely encounter material that was stronger or weaker (an area of pre-ex- isting stable cracks) than the mean strength. In either case, after the propagating crack advanced through the softer or harder material, there was an excess energy released that was converted to kinetic energy that was available to do work against the remaining uncracked material. It was here that the volume of the sample and
the stiffness of the testing machine played a critical role because the stored energy in the total system dictated the energy release rate. Peng [10] questioned the view that a violent fracture was characteristic property of a material. He had suggested that such a phenomenon could be caused by the in-ability of the servo-machine to follow the certain rock fracture. According to him, there exists a critical crack propagation velocity such that within the particular machine response time, it reduces the load- carrying capacity of the fractured specimen to extent that the machine cannot follow. According to Peng [10] al- though closed-loop servo-controlled testing machine is a versatile tool for studying rock fracture, the testing ma- chine has a finite response time, which is often slow for extremely brittle rocks. Li et al. [11] also reported that cracks were initiated with a low velocity and the rate of increase of the loading rate depended primarily on the rock type. They were of the opinioned that the softer rocks were more sensitive to the rate effect.
From the presented results, it seemed that machine performance behaviour had a markedly different effect on fatigue properties of the rock tested than higher load-ing frequencies and sample disturbance. The system performance was affected by the hydraulic power supply, servo-valve, actuator and load frame type and specimen compliances to name only the most critical components. It was found that when original simulated amplitude dropped well below to its 2 %, the machine performance behaviour started affecting the behaviour of the tested rock. According to Helešic [12], whenever the feedback was felled lower than the command value, it caused a phase lag between them and thus distorting the feedback wave-shape. This was a typical appearance of “pseudo- control” condition and the system would not be able to fulfil the demands. According to him whenever the feed- back falls below 2% of the command amplitude, the sys- tem goes in “pseudo-control” mode.
From the presented and discussed results it was ob-served that machine performance behaviour in terms of drop in amplitude, affected the obtained results and found to depend on rock type under investigation. The stiffer the rock would be, the earlier sensitivity to the machine behaviour would be. From this it could be con-cluded that cyclic loading was very susceptible to rock type and particularly to microstructure of the rock. From this it was put forward that machine sensitivity to rock type could be used as a basis in identification of the rock burst prone rocks. Earlier the sensitivity of machine to rock type in terms of dropped in amplitude and affected the results; more prone would be the rock-to-rock burst. The effect of machine behaviour and mechanical proper-ties of intact sandstone under static and dynamic uni- axial cyclic loading was discussed in detailed in authors’
Copyright © 2011 SciRes. IJG

M. N. BAGDE ET AL. 244
paper [7]. The difference between two studies was that in earlier one tested samples were from different mine and of L/D ratio 1 and results presented therein were at higher loading frequencies ranging from 10 to 100 Hz.
According to Stavorgin and Tarasov [13], the reason for sharp rise in strength lies in the mechanics of energy transmission to the tip of the rupture crack; at high rates, not all of the energy reaches the crack tip. Giving an example of BP sandstone and NBP sandstone, where BP sandstone was having higher total porosity compared to that NBP sandstone, they were of the opinioned that the mechanical characteristics of these sandstones could not serve as dependable criteria in defining the “burst pro- neness”. According to them in such cases, petrographic indices and permeability characteristics are the depend- able criteria. According to Braunner [14] as to the petro- graphic composition, a high percentage of durain seems to be somewhat conductive to bursting. According to him most of the seams overlain by strong and massive strata also could be considered potentially burst-prone.
3.2. Effect of Loading and Unloading Path in
Cyclic Loading on Fatigue Strength of Sandstone
To study the effect of cyclic loading on rock in terms of change in its microstructure, it was decided to conduct a test using loading-unloading path. First identical rock specimen were tested at 1 Hz and 0.1 mm amplitude loading condition till failure of the sample to know num- ber of cycles and peak fatigue strength at failure. The obtained peak fatigue strength for this tested sample was 130 MPa and number of cycles required to caused failure was approximately 230. Then another test was under-taken on another sample of similar kind at same loading conditions with difference that deformation was cycled in stages and after each stage load was completely unloaded. It was decided to load the sample in four stages of 50 cycles each and unload it completely after each stage subsequently. In very stage-I cycled deforma- tion was for total number of 50 cycles and unloaded completely, then in stage II sample loaded and cycled for another 50 number of cycles (i.e. cumulative number of cycles were 100 in this case) and unloaded again com- pletely, so in similar way in stage III (cumulative cycles 150) and stage IV (cumulative number of cycles 200) procedure was repeated. In final stage V, specimen was loaded till failure (stage V) and in this case total numbers of cycles were 210 at failure (actual number of cycles). The load history illustration of this type of test on stress- strain curve is shown in Figure 7. The obtained results peak, valley and average fatigue strength is plotted against different loading stages used and is shown in Figure 8.
Figure 7. Stress-strain curve showing load history in load- ing and unloading stages in cyclic loading (stage II and III overlapped).
Figure 8. Fatigue strength with loading and unloading stages in cyclic loading.
The peak fatigue stresses for the 1st, 2nd , 3rd and 4th loading stages were 18, 41, 42, and 60 MPa, respectively. The peak fatigue strength was 125 MPa and number of cycles at failure was approximately 210 (last stage till failure). From stress-strain curve (in case of stage V) presented in Figure 7, it could be seen that failure of the rock after experiencing such loading path also, had failed in sudden and violent manner after reaching its ultimate strength. Also it was found that peak fatigue strength and average Young’s modulus of this specimen after cycled in stages and then allowed to fail for given loading con-dition were 125 MPa and 18 GPa respectively and that of specimen without such loading stages were 130 MPa and 18.5 GPa. Thus, it could be concluded that first two stages were had a significant effect and here restructur- ing of the grain of the rock specimen took place chang- ing original geometry of the rock specimen thus making it more compact. During third stage of loading it had just re-produced stress it had experienced through in second stage of loading. This suggested that rock had a stress memory it had sustained during earlier loading history and needed to overcome it when reloaded and cycled again. This phenomenon is called as Kaiser Effect (KE) in the rock and studied extensively using Acoustic Emis- sions (AE) methods [15-17].
Memory properties of rocks are the ability of rocks to accumulate, to keep and to reproduce information about
Copyright © 2011 SciRes. IJG
M. N. BAGDE ET AL. 245 the stresses, which they experienced earlier. The best studied memory effects are the memory effect in AE, known as Kaiser Effect, and the deformation memory effects, or memory effects in strain, which make a phy- sical basis of the Deformation Rate Analysis (DRA) stress measurement method. Both kinds of effects take place while the rock is cyclically loaded to stress levels, increasing from cycle to cycle [15]. Both deformation and acoustic emission memory effects are due to the de- velopment of irreversible micro-fractures in rock sub- jected to cyclic loading [9,18]. According to Filimonov et al., [15] this leads to the absence of crack growth and sliding processes (dislocation movements) at stress val- ues smaller than the maximum previously applied stress. As soon as this “memorized” stress value is attained, crack propagation is again initiated, which is accompa- nied with AE pulses and non-linear inelastic strain de- velopment. Memory effects are related to irreversible, stress-induced changes in the rock’s structure occurring in the first cycle loading. Therefore, the elastic limit pre- sents a natural threshold for memory formation. This is confirmed by the tests in which the first stage cycle axial stress was smaller than the elastic limit for the given loading condition. In second stage cycle stress and defor- mation of such specimen were similar to those of “fresh” specimen, which did not undergo any first cycle loading. This was due to the absence of micro-fracture damage below the elastic limit, which could form a stress mem- ory. Distinct memory effects in the third stage cycle took place where the maximum axial stress exceeded the elas- tic limit took place in the second stage cycle. From the Figure 7, it can be seen that in final stage of cycling and loading, rock has followed the same path experienced in stage II and III loading path. A more detailed study of the stress memory effect under dynamic cyclic loading could be carried out in the future.
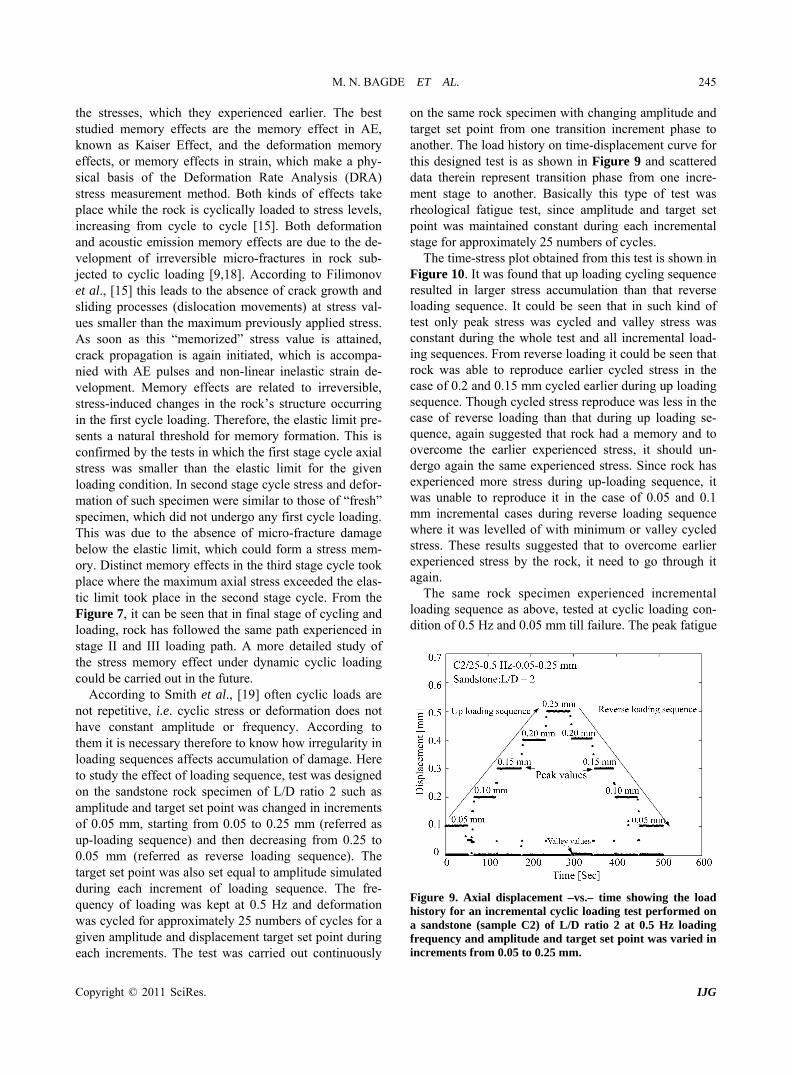
According to Smith et al., [19] often cyclic loads are not repetitive, i.e. cyclic stress or deformation does not have constant amplitude or frequency. According to them it is necessary therefore to know how irregularity in loading sequences affects accumulation of damage. Here to study the effect of loading sequence, test was designed on the sandstone rock specimen of L/D ratio 2 such as amplitude and target set point was changed in increments of 0.05 mm, starting from 0.05 to 0.25 mm (referred as up-loading sequence) and then decreasing from 0.25 to 0.05 mm (referred as reverse loading sequence). The target set point was also set equal to amplitude simulated during each increment of loading sequence. The fre-quency of loading was kept at 0.5 Hz and deformation was cycled for approximately 25 numbers of cycles for a given amplitude and displacement target set point during each increments. The test was carried out continuously
on the same rock specimen with changing amplitude and target set point from one transition increment phase to another. The load history on time-displacement curve for this designed test is as shown in Figure 9 and scattered data therein represent transition phase from one incre-ment stage to another. Basically this type of test was rheological fatigue test, since amplitude and target set point was maintained constant during each incremental stage for approximately 25 numbers of cycles.
The time-stress plot obtained from this test is shown in Figure 10. It was found that up loading cycling sequence resulted in larger stress accumulation than that reverse loading sequence. It could be seen that in such kind of test only peak stress was cycled and valley stress was constant during the whole test and all incremental load-ing sequences. From reverse loading it could be seen that rock was able to reproduce earlier cycled stress in the case of 0.2 and 0.15 mm cycled earlier during up loading sequence. Though cycled stress reproduce was less in the case of reverse loading than that during up loading se-quence, again suggested that rock had a memory and to overcome the earlier experienced stress, it should un-dergo again the same experienced stress. Since rock has experienced more stress during up-loading sequence, it was unable to reproduce it in the case of 0.05 and 0.1 mm incremental cases during reverse loading sequence where it was levelled of with minimum or valley cycled stress. These results suggested that to overcome earlier experienced stress by the rock, it need to go through it again.
The same rock specimen experienced incremental loading sequence as above, tested at cyclic loading con- dition of 0.5 Hz and 0.05 mm till failure. The peak fatigue
Figure 9. Axial displacement –vs.– time showing the load history for an incremental cyclic loading test performed on a sandstone (sample C2) of L/D ratio 2 at 0.5 Hz loading frequency and amplitude and target set point was varied in increments from 0.05 to 0.25 mm.
Copyright © 2011 SciRes. IJG

M. N. BAGDE ET AL. 246
Figure 10. Axial stress –vs.– time showing the stress accu- mulated during an incremental cyclic loading test per- formed on a sandstone (sample C2) of L/D ratio 2 at 0.5 Hz loading frequency and amplitude and target set point was varied in increments from 0.05 to 0.25 mm. strength and average Young’s modulus obtained was 151 MPa and 19 GPa respectively, while rock specimen tested without experiencing such loading condition pro- duced peak fatigue strength of 164 MPa and average Young’s modulus 21 GPa. The difference in values was very negligible and might be related to sample distur- bance, thus it could be concluded that any stress cycling made the rock compact, restructure its geometry in the form of grain re-distribution and thus made it more stiffer. Hence, it could be concluded that cyclic loading was very susceptible to rock geometry in terms of its mineralogy, structure and texture etc. Eberhardt [18] revealed through his cyclic loading tests study that the rate at which damage accumulates in the sample could be controlled through the load path used.
4. Conclusions
In this paper, cyclic fatigue behaviour of intact sandstone rock samples obtained from the rock burst prone coal mine in the Czech Republic were discussed. Tests were conducted under cyclic loading frequencies of 0.1, 1, 3, 5, 7 and 10 Hz at amplitude of 0.1 mm under displacement control mode untill failure of the sample in uniaxial compression. From the presented results, it was observed that at low loading frequency range of 0.1 to 3 Hz, there was degradation of the rock properties in terms of fatigue strength and modulus. At higher frequency, rock had showed increase in strength and deformation properties under investigation. It was observed that machine be- haviour in terms of amplitude at higher loading fre- quencies might be affecting the results. It seemed that machine behaviour of servo-hydraulic testing system was
also dependent on rock type under testing and found to be very susceptible to microstructure of the rock. This was also confirmed through studies conducted to study effect of loading and unloading path in cyclic loading on fatigue strength of sandstone. During stress cycling the re-distribution of grains makes the rock more compact. Hence, the specimen becomed stiffer. The cyclic loading response of the rock appeared to be sensitive to sample geometry and mineralogy. More in-depth studies were suggested before drawing any final conclusions. 5. Acknowledgements This work has been performed with financial grant No. 105/01/0042 from Grant Agency of the Czech Republic.
The first author would like to take this opportunity to thank the Czech Government for providing a scholarship to pursue his doctoral study in the Czech Republic. Also, he takes this opportunity to thank all his teachers and friends for their continuous encouragement. Particular thanks go to Dr. Alexander Lavrov; Dr. Erik Eberhardt; and others who provided literature and suggestions. Thanks are due to Doc. Ing. P. Konečný from Institute of Geonics, ASCR, Ostrava for his valuable criticism and suggestions and Dr. J. L. Jethwa for his editing help and suggestions. Thanks are due to the libarary staff who were of great help. Thanks are also due to my friend Ing. Miloš Daniel for his programming help and to Ing. P. Michalčík and Ing. O. Špinka for their help in carrying out experiments. I also wish to thank my wife Shaila and son Anurag for living without me and taking pain in their stride and for their encouragement throughout this study. 6. References [1] N. T. Burdine, “Rock Failure under Dynamic Loading
Conditions,” Society of Petroleum Engineers, Vol. 3, No. 1, 1963, pp. 1-8. doi:10.2118/481-PA
[2] H. R. Hardy and Y. P., Chugh “Failure of Geologic Ma-terials under Low-Cycle Fatigue,” Proceeding of 6th Ca-nadian Symposium on Rock Mechanics, Montreal, 1970, pp. 33-47.
[3] B. C. Haimson and C. M. Kim, “Mechanical Behaviour of Rock under Cyclic Fatigue. Stability of Rock Slopes,” Proceeding of 13th Symposium on Rock Mechanics, Ur-bana, 30 August-1 September 1971, pp. 845-863.
[4] P. B. Attewell and I. W. Farmer, “Fatigue Behaviour of Rock.” International Journal of Rock Mechanics and Mining Sciences & Geomechanics Abstracts, Vol. 10, No. 1, 1973, pp. 1-9. doi:10.1016/0148-9062(73)90055-7
[5] M. N. Bagde and V. Petros, “Fatigue Properties of Intact Sandstone Samples Subjected to Dynamic Uniaxial Cy-clical Loading,” International Journal of Rock Mechanics and Mining Sciences, Vol. 42, No. 2, 2005, pp. 237-250. doi:10.1016/j.ijrmms.2004.08.008
Copyright © 2011 SciRes. IJG
M. N. BAGDE ET AL.
Copyright © 2011 SciRes. IJG
247
[6] M. N. Bagde and V. Petros, “Waveform Effect on Fatigue Properties of Intact Sandstone in Uniaxial Cyclic Load-ing,” Rock Mechanics and Rock Engineering, Vol. 38, No. 3, 2005, pp. 169-196. doi:10.1007/s00603-005-0045-
[7] M. N. Bagde and V. Petros, “The Effect of Machine Be-haviour and Mechanical Properties of Intact Sandstone under Static and Dynamic Uniaxial Cyclic Loading,” Rock Mechanics and Rock Engineering, Vol. 38, No. 1, 2005, pp. 59-67. doi:10.1007/s00603-004-0038-z
[8] M. N. Bagde and V. Petros, “Fatigue and Dynamic En-ergy Behavior of Rock Subjected to Cyclical Loading,” International Journal of Rock Mechanics and Mining Sciences, Vol. 46, No. 1, 2009, pp. 200-209. doi:10.1016/j.ijrmms.2008.05.002
[9] C. D. Martin and N. A. Chandler, “The Progressive Frac-ture of Lac du Bonnet Granite,” International Journal of Rock Mechanics and Mining Sciences & Geomechanics Abstracts, Vol. 31, No. 6, 1994, pp. 643-659. doi:10.1016/0148-9062(94)90005-1
[10] S. S. Peng, “Time Dependent Aspects of Rock Behaviour as Measured by a Servocontrolled Hydraulic Testing Machine,” International Journal of Rock Mechanics and Mining Sciences & Geomechanics Abstracts, Vol. 10, No. 3, 1973, pp. 235-246. doi:10.1016/0148-9062(73)90033-8
[11] N. Li, P. Zhang, Y. Chen and G. Swoboda, “Fatigue Properties of a Cracked, Saturated and Frozen Sandstone Samples under Cyclic Loading,” International Journal of Rock Mechanics and Mining Sciences, Vol. 40, No. 1, 2003, pp. 145-150. doi:10.1016/S1365-1609(02)00111-9
[12] J. Helešic, Personnel Communication. 2003.
[13] A. N. Stavrogin and B. G. Tarasov, “Experimental Phys-ics and Rock Mechanics,” Balkema, Rotterdam. 2001, 356p.
[14] G. Brauner, “Rockbursts in Coal Mines and Their Pre-vention,” Balkema, Rotterdam, 1994, p. 144.
[15] Y. L. Filimonov, A. V. Lavrov, Y. M. Shafarenko and V. L. Shkuratnik, “Memory Effects in Rock Salt under Triax-ial Stress State and Their Use for Stress Measurement in a Rock Mass,” Rock Mechanics and Rock Engineering, Vol. 34, No. 4, 2001,pp. 275-291. doi:10.1007/s006030170002
[16] L. Lavrov, “Kaiser Effect Observation in Brittle Rock Cycli-Cally Loaded with Different Loading Rates,” Me-chanics of Materials, Vol. 33, 2001, pp. 669-677. doi:10.1016/S0167-6636(01)00081-3
[17] C. Li and E. Nordlund, “Experimental Verification of the Kaiser Effect in Rocks,” Rock Mechanics and Rock En-gineering, Vol. 26, No. 4, 1993, pp. 333-351. doi:10.1007/BF01027116
[18] E. Eberhardt, “Brittle Rock Fracture and Progressive Damage in Uniaxial Compression,” Ph. D. Thesis. Col-lege of Studies and Research, Department of Geological Sciences, University of Saskatchewan, Saskatoon, 1998, p. 334.
[19] I. Smith, E. Landis and M. Gong, “Fracture and Fatigue in Wood,” John Wiley and Sons Ltd., New York, 2003, p. 242.