the effect of noise data in qa and qc to determine ... · the effect of noise data in qa and qc to...
TRANSCRIPT
PROCEEDINGS, 43rd Workshop on Geothermal Reservoir Engineering
Stanford University, Stanford, California, February 12-14, 2018
SGP-TR-213
1
The Effect of Noise Data in QA and QC to Determine Deliverability Curve
Hendra Ardi Kurniawan1, Clinton Sihombing1, Muhammad Thasril2, Ermawan Isyahtoro2, Achmad Djumarma
Wirakusumah1
1STEM Akamigas, Jalan Gajah Mada 38, Blora, Central Java, Indonesia
2PT Geo Dipa Energi, Recapital Building 8 floor, Jalan Adityawarman Kav 55, South Jakarta, Indonesia
[email protected], [email protected], [email protected], [email protected], [email protected]
Keywords: production test, total mass flow rate, enthalpy, gas content, noise data, deliverability curve, lesson learn
ABSTRACT
A production test is one of the most important and crucial thing that necessary to do before the well is produced. The production test
will be represented the well flow characteristic in form of total mass flow rate, fluid enthalpy, heat flow, and dryness. Furthermore, the
reservoir characteristic and well capacity also will be known. The result of production test will be used as a source to develop the
geothermal field. Therefore, the measurement accuracy of production test must be corrected carefully. Geothermal fluid in Indonesia is
commonly in the form of steam phase, water phase or both of them. There are some impurities that follow carried produce such as gas
content. Gas content that participates in the production along with the geothermal fluid in the steam. The gas content may affect the
result of mass flow measurement that will have implications relating to the total mass flow and enthalpy. It is necessary to calculate the
gas content, so the accurate total mass flow rate and enthalpy can be obtained. In the production test, noise data is a common thing to be
happened, the noise data will affect the accuracy of the total mass and enthalpy. Although it can be minimized, its existence will always
occur in the production process. To minimize the effect of the noise data, processing data is needed to get accurate results. This study
aims to provide sample cases of geothermal well production test in Indonesia. This case study illustrates the existence of noise data on
the accuracy level based on the Russel James equation. In addition, to give lesson learn of production tests in the future related to the
obstacles that occur in the field so as to give the best results to be interpreted.
1. INTRODUCTION
Dieng geothermal field is a volcanic geothermal reservoir located in Dieng Plateau, Central Java, Indonesia, located about 120 km from
Semarang the capital city of Central Java Province. Dieng geothermal filed is a water-dominated geothermal field that developed around
2000 meters above sea level. Sirait (2015) describe that Dieng geothermal field is located in the volcanic arc which is corresponding to
the active andesitic volcanism related to the subduction along the Java Trench of the Indo-Australian Plate below the South-East Asian
Plate.
The Dieng geothermal field started its development in the 1990s and started operation in 1998. In general Layman (2002) divided Dieng
into two prospect areas: Sileri and Sikidang. The Sileri area is characterized by relatively deep and high temperature production. The
reservoir temperature is ranging from 300-335°C then the Sikidang is relatively shallow and has a lower temperature than Sileri. The
reservoir temperature is ranging from 240-300°C. Currently, Dieng geothermal field is operated by PT Geo Dipa Energi with 60 MWe
installed power plant capacity that supported by seven production wells and four injection wells.
This study will discuss the effect of noise (scatter) data on the deliverability curve based on the calculation of total rate and enthalpy
using Russel James equation. Well test has been done in Dieng geothermal field in 1997s and 1998s by using two methods: Lip pressure
and Orifice plate, where only the lip pressure method is discussed in this study.
2. THEORY
2.1 Noise Data
Field data often have a great deal of scatter in them which can cause difficulties in analyzing the data. In general, the noise data can be
divided into two types: reservoir related and operations related. Reservoir related noise data can be caused by rainfall, recharge,
earthquake, and subsidence. While, the production related noise data can be caused by change in production schedules, bad well
completions, workovers, poor calibration techniques, and poor data gathering techniques.
It is hard to prevent reservoir related noise data, but the operations related can be reduced. Zais and Bodvarsson (2008) explained the
way to analyze the noise data with following method:
1) Averaging the data
2) Least square fitting
3) Decreasing known effect and trends, and
Hendra, Clinton, Thasril, and Ermawan
2
4) Using knowledge and experience/engineering sense
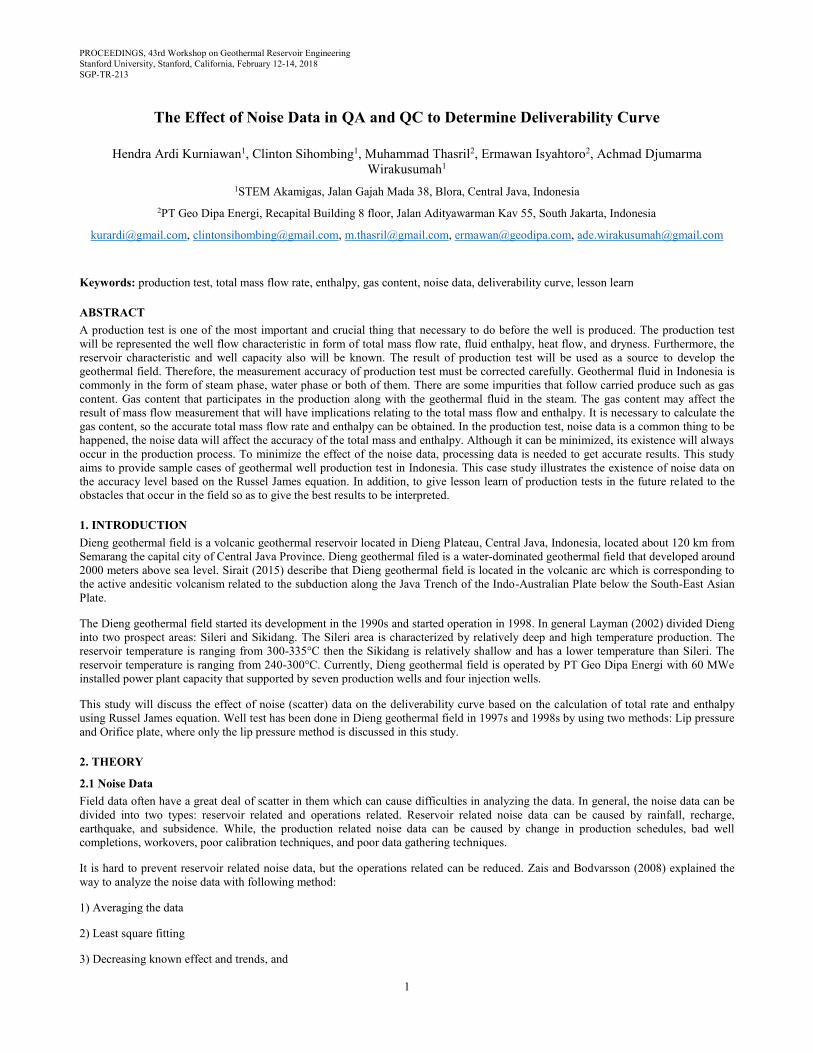
2.2 James Lip Pressure Method
Malcolm and Paul (2011) described in their book that James lip pressure method is the most versatile and economical method of testing
for highly productive two-phase geothermal wells. The lip pressure has some advantages of simplicity in both hardware and
instrumentation and the ability to accommodate relatively large flow with less expensive test equipment. In this method, the reservoir
fluid will be flowed horizontally from the well through a lip pipe with a certain diameter to the silencer. James lip pressure method
correlates total rate, flowing enthalpy, the area of the pipe, and lip pressure. Here is equation of James lip pressure method that written
in Aris and Thasril (2015) previous study. A few modification of the equation has been done in this study to simplify the calculation.
102.196.0
3600184.0
Hh
Hh
PA
W
atmfg
atmgatm
(1)
Hh
hWM
atmg
atmfgatm
(2)
where Watm, H, P, A, hf, hg, and M are water total mass flow rate fluid enthalpy (kJ/kg), lip pressure (bara), enthalpy of liquid-phase
(kJ/kg), enthalpy of vapor-phase (kJ/kg), latent heat (kJ/kg), and total total mass flow rate (ton/hour).
Figure 1: Lip Pressure Method (Duardi, Dudi., 1997)
2.3 Lip Pressure Correction
Calibrating the lip pressure is important to get the accurate calculation. California Energy Company (CEC) made an equation to
calibrate lip pressure equation based on measured lip pressure, atmospheric pressure, calibration correction factor, and corrected lip
pressure.
4333.0
12
correctionPPPCorrectedP
lip
atmliplip
(3)
where Plip, Patm, Plipcorrection, and CorrectedPlip are measured lip pressure (psig), atmospheric pressure (psia), calibration correction
factor (inch), and corrected lip pressure (psia).
2.4 Gas Correction for Lip Pressure Method
Grant and colleagues (1982) have suggested the method that providing a correction for the gas content. Where these are present in
significant amounts, the effect of the gas on the flow measurements must be allowed for to obtain accurate mass flow and enthalpy data.
Aris and Thasril (2015) explained the effect can be very significant on certain conditions, so that the previous results need to be
corrected.
Hendra, Clinton, Thasril, and Ermawan
3
Hh
HhHfH
atmg
atmg
lip
11.096.0
102.1
(4)
HHH ' (5)
where ΔH, H, flip, and H’ are enthalpy correction (kJ/kg), initial enthalpy (kJ/kg), gas mass fraction at lip pressure, and corrected
enthalpy value (kJ/kg).
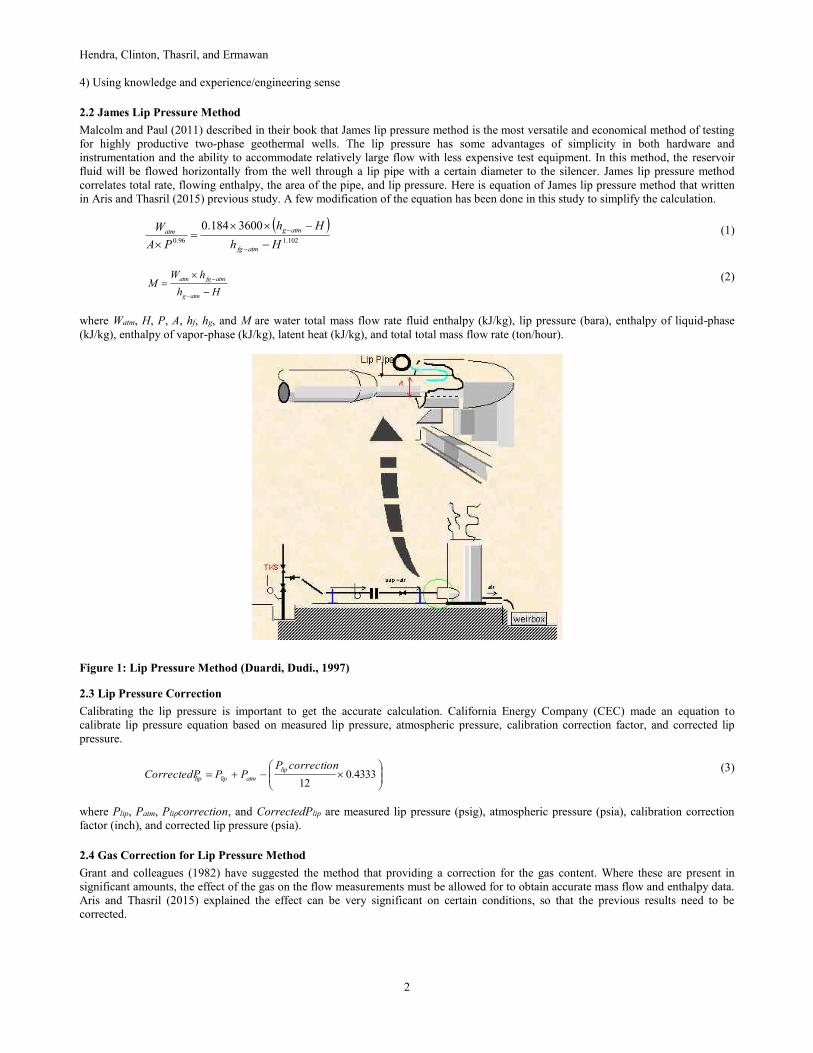
2.5 Weir Box Equation
Weir box is used to determine the water total mass flow rate. There are many types of weir box that commonly used in geothermal well
test, in this study only explained about rectangular weir box. Here is the correlation can be applied to estimate the water total mass flow
rate:
5.12
3
2eee hbgCQ (6)
bce Kbb (7)
001.0 le hh (8)
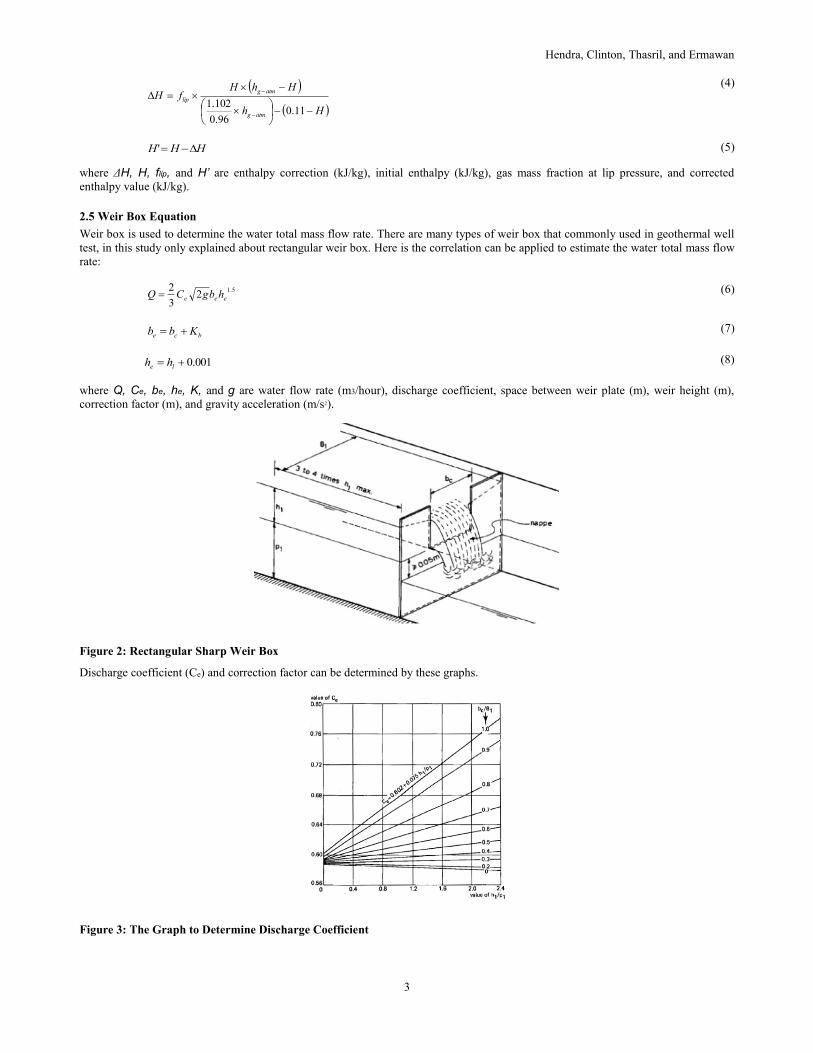
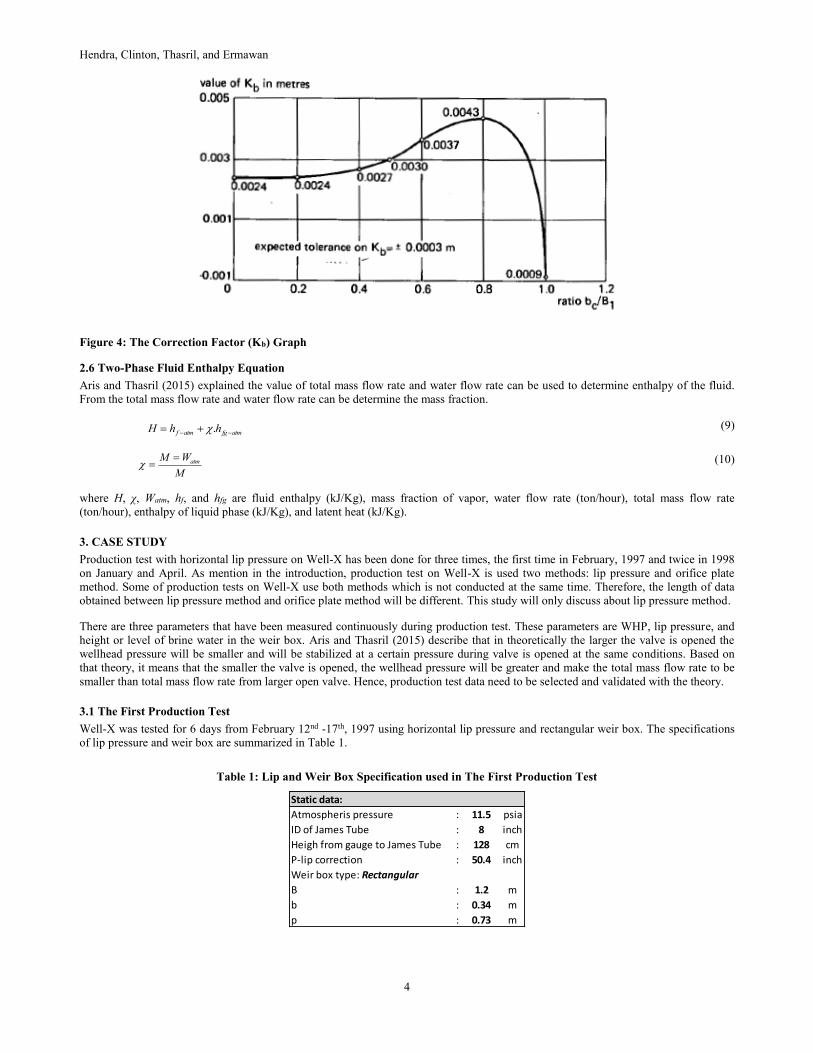
where Q, Ce, be, he, K, and g are water flow rate (m3/hour), discharge coefficient, space between weir plate (m), weir height (m),
correction factor (m), and gravity acceleration (m/s2).
Figure 2: Rectangular Sharp Weir Box
Discharge coefficient (Ce) and correction factor can be determined by these graphs.
Figure 3: The Graph to Determine Discharge Coefficient
Hendra, Clinton, Thasril, and Ermawan
4
Figure 4: The Correction Factor (Kb) Graph
2.6 Two-Phase Fluid Enthalpy Equation
Aris and Thasril (2015) explained the value of total mass flow rate and water flow rate can be used to determine enthalpy of the fluid.
From the total mass flow rate and water flow rate can be determine the mass fraction.
atmfgatmf hhH . (9)
M
WM atm (10)
where H, χ, Watm, hf, and hfg are fluid enthalpy (kJ/Kg), mass fraction of vapor, water flow rate (ton/hour), total mass flow rate
(ton/hour), enthalpy of liquid phase (kJ/Kg), and latent heat (kJ/Kg).
3. CASE STUDY
Production test with horizontal lip pressure on Well-X has been done for three times, the first time in February, 1997 and twice in 1998
on January and April. As mention in the introduction, production test on Well-X is used two methods: lip pressure and orifice plate
method. Some of production tests on Well-X use both methods which is not conducted at the same time. Therefore, the length of data
obtained between lip pressure method and orifice plate method will be different. This study will only discuss about lip pressure method.
There are three parameters that have been measured continuously during production test. These parameters are WHP, lip pressure, and
height or level of brine water in the weir box. Aris and Thasril (2015) describe that in theoretically the larger the valve is opened the
wellhead pressure will be smaller and will be stabilized at a certain pressure during valve is opened at the same conditions. Based on
that theory, it means that the smaller the valve is opened, the wellhead pressure will be greater and make the total mass flow rate to be
smaller than total mass flow rate from larger open valve. Hence, production test data need to be selected and validated with the theory.
3.1 The First Production Test
Well-X was tested for 6 days from February 12nd -17th, 1997 using horizontal lip pressure and rectangular weir box. The specifications
of lip pressure and weir box are summarized in Table 1.
Table 1: Lip and Weir Box Specification used in The First Production Test
Atmospheris pressure : 11.5 psia
ID of James Tube : 8 inch
Heigh from gauge to James Tube : 128 cm
P-lip correction : 50.4 inch
B : 1.2 m
b : 0.34 m
p : 0.73 m
Weir box type: Rectangular
Static data:
Hendra, Clinton, Thasril, and Ermawan
5
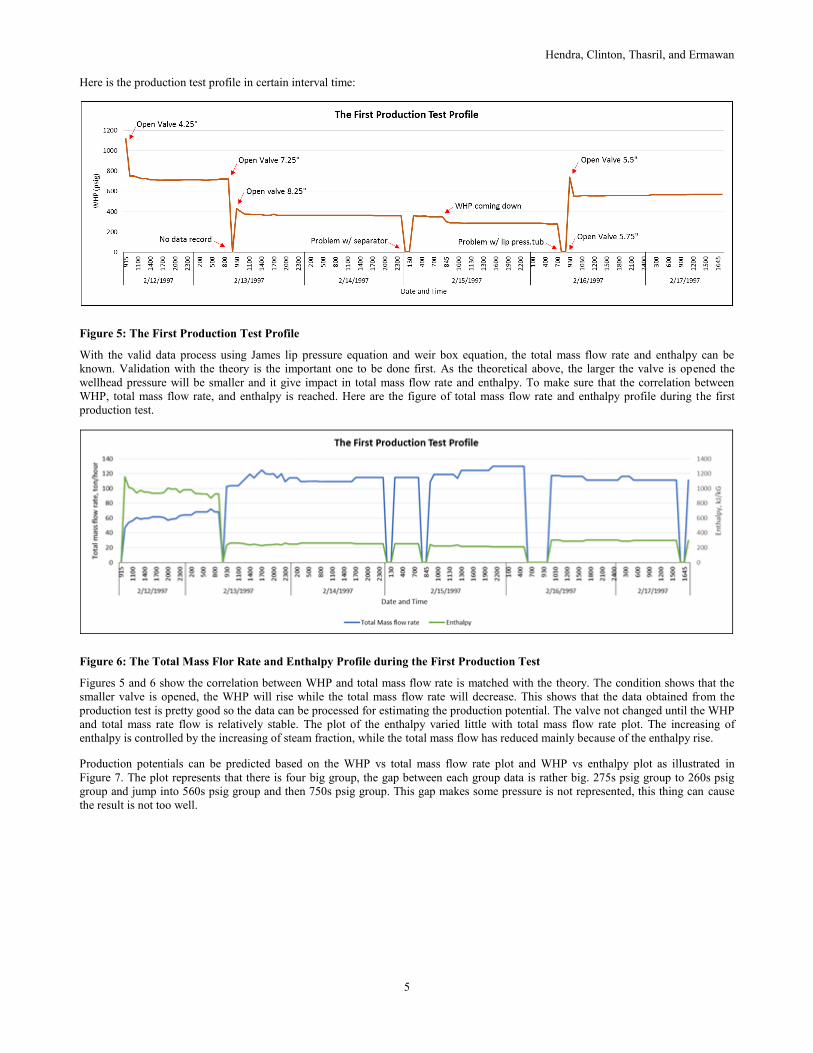
Here is the production test profile in certain interval time:
Figure 5: The First Production Test Profile
With the valid data process using James lip pressure equation and weir box equation, the total mass flow rate and enthalpy can be
known. Validation with the theory is the important one to be done first. As the theoretical above, the larger the valve is opened the
wellhead pressure will be smaller and it give impact in total mass flow rate and enthalpy. To make sure that the correlation between
WHP, total mass flow rate, and enthalpy is reached. Here are the figure of total mass flow rate and enthalpy profile during the first
production test.
Figure 6: The Total Mass Flor Rate and Enthalpy Profile during the First Production Test
Figures 5 and 6 show the correlation between WHP and total mass flow rate is matched with the theory. The condition shows that the
smaller valve is opened, the WHP will rise while the total mass flow rate will decrease. This shows that the data obtained from the
production test is pretty good so the data can be processed for estimating the production potential. The valve not changed until the WHP
and total mass rate flow is relatively stable. The plot of the enthalpy varied little with total mass flow rate plot. The increasing of
enthalpy is controlled by the increasing of steam fraction, while the total mass flow has reduced mainly because of the enthalpy rise.
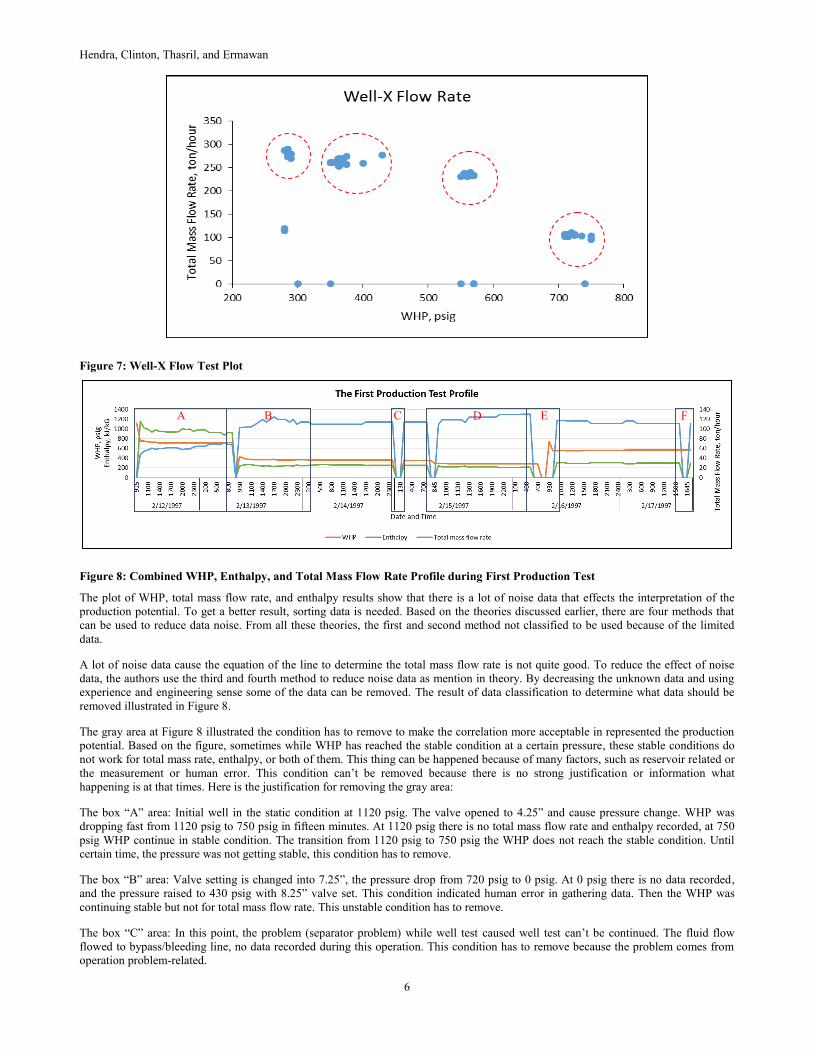
Production potentials can be predicted based on the WHP vs total mass flow rate plot and WHP vs enthalpy plot as illustrated in
Figure 7. The plot represents that there is four big group, the gap between each group data is rather big. 275s psig group to 260s psig
group and jump into 560s psig group and then 750s psig group. This gap makes some pressure is not represented, this thing can cause
the result is not too well.
Hendra, Clinton, Thasril, and Ermawan
6
Figure 7: Well-X Flow Test Plot
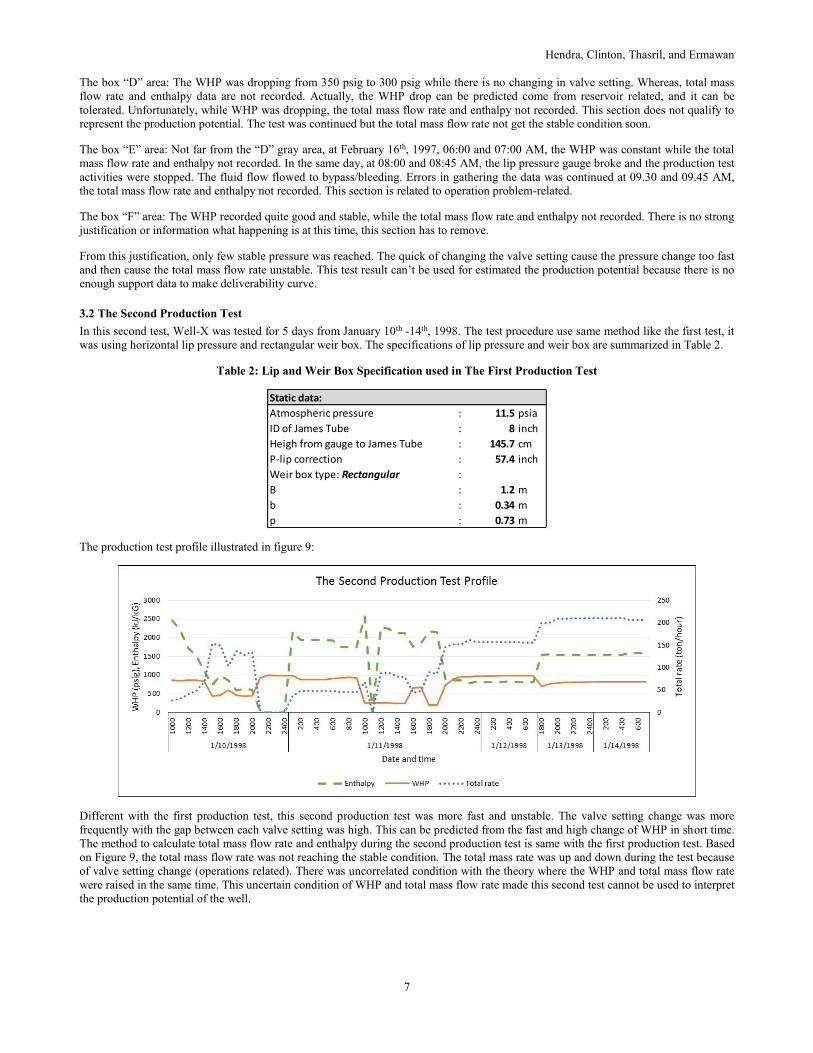
Figure 8: Combined WHP, Enthalpy, and Total Mass Flow Rate Profile during First Production Test
The plot of WHP, total mass flow rate, and enthalpy results show that there is a lot of noise data that effects the interpretation of the
production potential. To get a better result, sorting data is needed. Based on the theories discussed earlier, there are four methods that
can be used to reduce data noise. From all these theories, the first and second method not classified to be used because of the limited
data.
A lot of noise data cause the equation of the line to determine the total mass flow rate is not quite good. To reduce the effect of noise
data, the authors use the third and fourth method to reduce noise data as mention in theory. By decreasing the unknown data and using
experience and engineering sense some of the data can be removed. The result of data classification to determine what data should be
removed illustrated in Figure 8.
The gray area at Figure 8 illustrated the condition has to remove to make the correlation more acceptable in represented the production
potential. Based on the figure, sometimes while WHP has reached the stable condition at a certain pressure, these stable conditions do
not work for total mass rate, enthalpy, or both of them. This thing can be happened because of many factors, such as reservoir related or
the measurement or human error. This condition can’t be removed because there is no strong justification or information what
happening is at that times. Here is the justification for removing the gray area:
The box “A” area: Initial well in the static condition at 1120 psig. The valve opened to 4.25” and cause pressure change. WHP was
dropping fast from 1120 psig to 750 psig in fifteen minutes. At 1120 psig there is no total mass flow rate and enthalpy recorded, at 750
psig WHP continue in stable condition. The transition from 1120 psig to 750 psig the WHP does not reach the stable condition. Until
certain time, the pressure was not getting stable, this condition has to remove.
The box “B” area: Valve setting is changed into 7.25”, the pressure drop from 720 psig to 0 psig. At 0 psig there is no data recorded,
and the pressure raised to 430 psig with 8.25” valve set. This condition indicated human error in gathering data. Then the WHP was
continuing stable but not for total mass flow rate. This unstable condition has to remove.
The box “C” area: In this point, the problem (separator problem) while well test caused well test can’t be continued. The fluid flow
flowed to bypass/bleeding line, no data recorded during this operation. This condition has to remove because the problem comes from
operation problem-related.
A B C D E F
Hendra, Clinton, Thasril, and Ermawan
7
The box “D” area: The WHP was dropping from 350 psig to 300 psig while there is no changing in valve setting. Whereas, total mass
flow rate and enthalpy data are not recorded. Actually, the WHP drop can be predicted come from reservoir related, and it can be
tolerated. Unfortunately, while WHP was dropping, the total mass flow rate and enthalpy not recorded. This section does not qualify to
represent the production potential. The test was continued but the total mass flow rate not get the stable condition soon.
The box “E” area: Not far from the “D” gray area, at February 16th, 1997, 06:00 and 07:00 AM, the WHP was constant while the total
mass flow rate and enthalpy not recorded. In the same day, at 08:00 and 08:45 AM, the lip pressure gauge broke and the production test
activities were stopped. The fluid flow flowed to bypass/bleeding. Errors in gathering the data was continued at 09.30 and 09.45 AM,
the total mass flow rate and enthalpy not recorded. This section is related to operation problem-related.
The box “F” area: The WHP recorded quite good and stable, while the total mass flow rate and enthalpy not recorded. There is no strong
justification or information what happening is at this time, this section has to remove.
From this justification, only few stable pressure was reached. The quick of changing the valve setting cause the pressure change too fast
and then cause the total mass flow rate unstable. This test result can’t be used for estimated the production potential because there is no
enough support data to make deliverability curve.
3.2 The Second Production Test
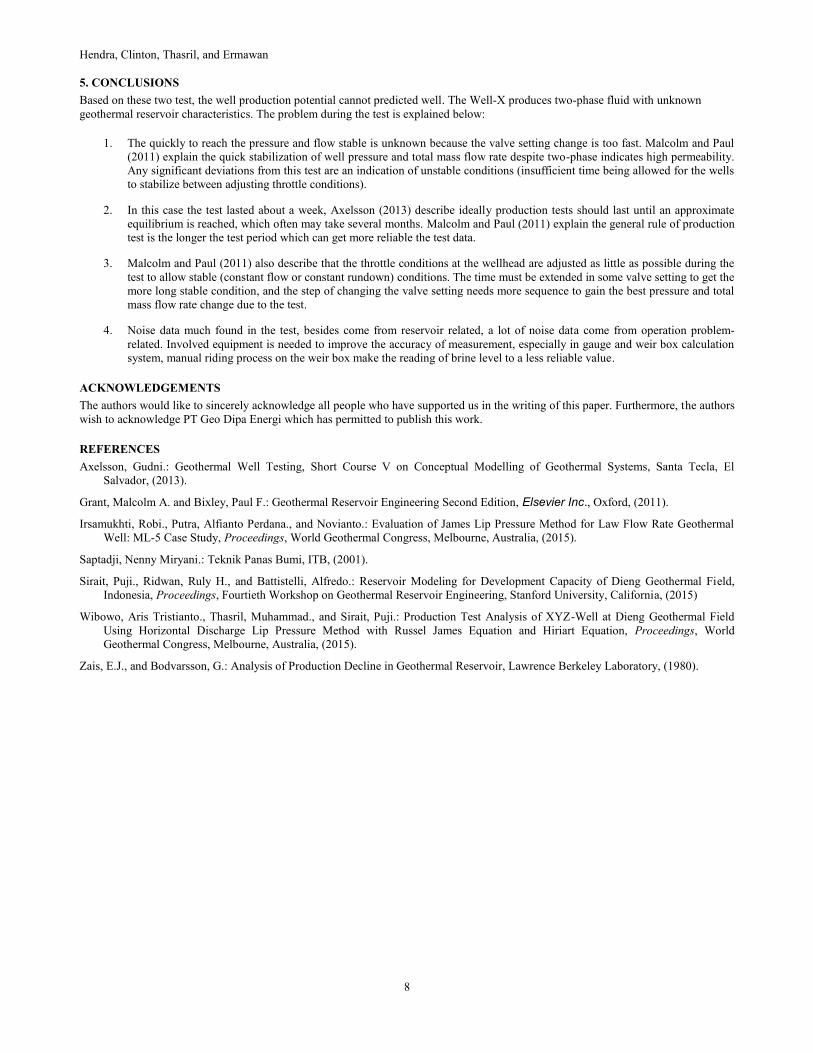
In this second test, Well-X was tested for 5 days from January 10th -14th, 1998. The test procedure use same method like the first test, it
was using horizontal lip pressure and rectangular weir box. The specifications of lip pressure and weir box are summarized in Table 2.
Table 2: Lip and Weir Box Specification used in The First Production Test
Static data:
Atmospheric pressure : 11.5 psia
ID of James Tube : 8 inch
Heigh from gauge to James Tube : 145.7 cm
P-lip correction : 57.4 inch
Weir box type: Rectangular :
B : 1.2 m
b : 0.34 m
p : 0.73 m
The production test profile illustrated in figure 9:
Different with the first production test, this second production test was more fast and unstable. The valve setting change was more
frequently with the gap between each valve setting was high. This can be predicted from the fast and high change of WHP in short time.
The method to calculate total mass flow rate and enthalpy during the second production test is same with the first production test. Based
on Figure 9, the total mass flow rate was not reaching the stable condition. The total mass rate was up and down during the test because
of valve setting change (operations related). There was uncorrelated condition with the theory where the WHP and total mass flow rate
were raised in the same time. This uncertain condition of WHP and total mass flow rate made this second test cannot be used to interpret
the production potential of the well.
Hendra, Clinton, Thasril, and Ermawan
8
5. CONCLUSIONS
Based on these two test, the well production potential cannot predicted well. The Well-X produces two-phase fluid with unknown
geothermal reservoir characteristics. The problem during the test is explained below:
1. The quickly to reach the pressure and flow stable is unknown because the valve setting change is too fast. Malcolm and Paul
(2011) explain the quick stabilization of well pressure and total mass flow rate despite two-phase indicates high permeability.
Any significant deviations from this test are an indication of unstable conditions (insufficient time being allowed for the wells
to stabilize between adjusting throttle conditions).
2. In this case the test lasted about a week, Axelsson (2013) describe ideally production tests should last until an approximate
equilibrium is reached, which often may take several months. Malcolm and Paul (2011) explain the general rule of production
test is the longer the test period which can get more reliable the test data.
3. Malcolm and Paul (2011) also describe that the throttle conditions at the wellhead are adjusted as little as possible during the
test to allow stable (constant flow or constant rundown) conditions. The time must be extended in some valve setting to get the
more long stable condition, and the step of changing the valve setting needs more sequence to gain the best pressure and total
mass flow rate change due to the test.
4. Noise data much found in the test, besides come from reservoir related, a lot of noise data come from operation problem-
related. Involved equipment is needed to improve the accuracy of measurement, especially in gauge and weir box calculation
system, manual riding process on the weir box make the reading of brine level to a less reliable value.
ACKNOWLEDGEMENTS
The authors would like to sincerely acknowledge all people who have supported us in the writing of this paper. Furthermore, the authors
wish to acknowledge PT Geo Dipa Energi which has permitted to publish this work.
REFERENCES
Axelsson, Gudni.: Geothermal Well Testing, Short Course V on Conceptual Modelling of Geothermal Systems, Santa Tecla, El
Salvador, (2013).
Grant, Malcolm A. and Bixley, Paul F.: Geothermal Reservoir Engineering Second Edition, Elsevier Inc., Oxford, (2011).
Irsamukhti, Robi., Putra, Alfianto Perdana., and Novianto.: Evaluation of James Lip Pressure Method for Law Flow Rate Geothermal
Well: ML-5 Case Study, Proceedings, World Geothermal Congress, Melbourne, Australia, (2015).
Saptadji, Nenny Miryani.: Teknik Panas Bumi, ITB, (2001).
Sirait, Puji., Ridwan, Ruly H., and Battistelli, Alfredo.: Reservoir Modeling for Development Capacity of Dieng Geothermal Field,
Indonesia, Proceedings, Fourtieth Workshop on Geothermal Reservoir Engineering, Stanford University, California, (2015)
Wibowo, Aris Tristianto., Thasril, Muhammad., and Sirait, Puji.: Production Test Analysis of XYZ-Well at Dieng Geothermal Field
Using Horizontal Discharge Lip Pressure Method with Russel James Equation and Hiriart Equation, Proceedings, World
Geothermal Congress, Melbourne, Australia, (2015).
Zais, E.J., and Bodvarsson, G.: Analysis of Production Decline in Geothermal Reservoir, Lawrence Berkeley Laboratory, (1980).