the effect of phased array parameters on the detecting
TRANSCRIPT

Abd Elrahman Mohamed Moussa /et al /Engineering Research Journal 163 (September 2019) M20- M35
02M
The Effect of Phased Array Parameters on the Detecting
Accuracy of Welding Discontinuities and 3D Measurement
, , ,
(a) Mechanical Engineering Department, Helwan University, Helwan, Egypt.
(b) Edison Welding Institute, EWI, Ohio, USA
Abstract
The reliable detection of defects is one of the most important tasks in nondestructive
tests, mainly in the radiography test (RT) and ultrasonic test (UT). Non-Destructive
Testing (NDT) is the most efficient as internal and external discontinuities are
inspected while maintaining the target’s original structure (form and function).
Therefore, in this paper, the Phased Array Ultrasonic Testing (PAUT) method was
applied to propose inspection method that can address certain key PAUT Parameters
and image processing to enhance the precision of discontinuities and the reliability of
calculations of discontinuity size and characterization and also transfer 2D S-Scan
images into 3D images (volumetric scan) which is more reliable and easily
interpretation.
Keywords : Welding discontinuities, Phased Array, Image Processing.
1. Introduction & Problem Description
Phased Array Ultrasonic Test (PAUT) has gone from being a simple laboratory
curiosity to an essential tool in industry. With the considerable increase in competition
among industries, the quality control of equipment and materials has become a basic
requisite to remain competitive in national and international markets. Although it is
one of the new techniques of Ultrasonic method. PAUT is still accepted as essential
for the control of welded joints in many industries such as the nuclear, naval, chemical
or Oil and Gas. Most of welded joints failures are due to inaccurate interpretation
(determination, sizing, measuring and evaluation) of their defects. So, the objective of
this paper to increase the accuracy of detecting welding discontinuities measurement
and interpret the S-scan images into 3D (volumetric scan) which is more reliable than
2D (S-scan).

Abd Elrahman Mohamed Moussa /et al /Engineering Research Journal 163 (September 2019) M20- M35
02M
2. Previous Work Phased array has developed well in the last several years, particularly for weld
inspections to overcome the limitations of radiography inspections, and the importance
of ultrasonic is rapidly replacing radiography worldwide especially automatic
ultrasonic test (AUT) used phased arrays technique as the latest development in AUT
and present major improvements over conventional multiprobe ultrasonics for gas
pipeline girth weld & pressure vessel inspection respectively as reported by Michael
and Ginzel [1], Moles and Noel [2].
In 2008, Poirier and Ward [3] used the same device for research here “Phasor-XS” and
proposed to use Performance Demonstration Initiative (PDI) process where a
technique and technician is verified to be capable of finding and characterizing target
defects with a very small margin of error and increasing Probability of Detection
(POD). Bokaba and Mabuza [4] used also “Phasor-XS” to ensure the accuracy depths
and sizes of defects in thick section welds of 25 mm. According to Marefat and
Faghedi [5] researches reported that there would be no defect on radiographic images
which it is not be able to be detected by Phased Array ultrasonic technique. In most
cases especially in detection of subtle welding defects the Phased Array ultrasonic
technique is more reliable than RT. Also, it can be concluded that Phased Array
Ultrasonic has no limitation to detection of surface longitudinal cracks in comparison
with conventional Ultrasonic test while same frequency transducer can be used for
dissimilar joint containing stainless steel 304 and simple carbon steel.
The geometry of a weld is an important factor for determining which angle to use for
inspection in ultrasonic testing. The phased array sectorial scan makes it possible to
scan areas with restricted access and also enables angles to be changed according to
the geometry of the weld under inspection. Phased array systems allow inspection
angles to be adjusted accurately and modified easily so as to obtain better response
from defects [6].
So, the objective of this paper to develop :
Phased Array results in 3D instead of 2D, to improve the characterization of
welding discontinuities (Volumetric Scanning).
An artificial intelligent model ANN to characterize arc welding discontinuities.
Automatic system for detecting discontinuity type to eliminate Human error.
3. Proposed System
Fig.1 shows the equipment and instrumentation, that are used in the experiment, and it
consists of the following :

Abd Elrahman Mohamed Moussa /et al /Engineering Research Journal 163 (September 2019) M20- M35
00M
3.1 For radiography test (RT) X-Ray BHGE-Generator - Eresco MF4 160kv,
Computerized Radiography (CR) System : CRxFlex,
CR Phosphor image plates IPC2, IPS with different sizes 10×24 & 10×40cm &
10×48cm,
Rhythm Software.
3.2 For ultrasonic test (UT)
Phased Array KRAUTKRAMER “Phasor-XS” unit (BHGE Inspection
Technologies),
Different Probes/wedges 2-4MHz (35°-75°) with 8-64 elements,
RotoArray probes (5MHz/64 element/0.8mm pith×6.4mm width),
RotoArray probes (5MHz/64 element/1.27mm pith×8mm width),
PATH Scanner and Alstom Inspection robotics,
V1, V2, Stepped, AWS Resolution and PA-DM METRED Calibration blocks,
Gel and Water is used as a couplant.
3.3 Welding joints
Figs.(2 and 3) show a photograph for the different specimens used. And all listed in
table contains the profile and number of defects. The program of this research work
was conducted in two different laboratories, i.e. two groups A and B. The first group
(A) was chosen from PETROJET and MASSA workshops and different projects sites,
representing a wide range of welding defects. The second group (B), was prepared at
Abdullah-Fouad Application center. In this group the welding parameters were
monitored, for several welding defects.
Fig.(1). Photo RT&UT Equipment used.

Abd Elrahman Mohamed Moussa /et al /Engineering Research Journal 163 (September 2019) M20- M35
02M
Fig.(2) Photograph of group(A): PETROJET&MASSA butt welded joints with standard
& Practical Discontinuities.
Fig.(3) Photograph of group (B): Abdullah Fouad’s butt welded joints.
The welding joint direction was determined by measuring horizontally along the X-
axis from the starting point (left end) of the material to the starting point of the
discontinuity and then by measuring vertically along the Y-axis from the center of the
weld bead (either positively or negatively). The discontinuity length was then
measured from the beginning to the end point in the X-axis direction and the width
from the same points but in the Y-axis direction. The defect depth was measured from
the top surface towards the beginning of the discontinuity in the Z-direction. As shown
in Fig.(4).

Abd Elrahman Mohamed Moussa /et al /Engineering Research Journal 163 (September 2019) M20- M35
02M
Fig.(4). Measuring length, width and depth of welding
discontinuity in X, Y and Z directions.
4. Experimental Work
4.1 Analysis of method for the calculation of discontinuity length using
acoustic pressure drop
Using signals from a PAUT probe, the length of the discontinuity was measured by
moving from the point yielding the maximum echo amplitude to 50% or ½ (6 dB). The
length of each defect was additionally calculated for each drop method (6 dB, 12 dB or
overall) as shown in table (1). By using the results, the method used to assess the
discontinuity length of the welds was analyzed.
The 6 dB drop yielded the most accurate results, and is therefore the most reliable. The
12 dB and the overall drop resulted in greater variances as a result of including the
lengths of nearby discontinuities.
Table (1) Measuring results of defect length.
Discontinuity
Type
Real
Measurements
6 dB
(mm)
Deviation
(±mm)
12 dB
(mm)
Deviation
(±mm) Fully (mm)
Deviation
(±mm)
Incomplete
Penetration 6.5 6.0 -0.5 7.0 +0.5 11.0 +4
Crack 23 24.0 +1.0 26.0 +3.0 28.0 +5
Porosity 10.5 11.0 +0.5 13.0 +2.5 15.0 +4.5
Lack of Fusion 161 162.0 +1.0 164.0 +3.0 168.0 +6.0
Porosity 23 24.0 +1.0 28.0 +4.0 30.0 +7.0
Slag 19 20.0 +1.0 24.0 +5.0 26.0 +7.0
Discontinuity Length
Dis
con
tin
uit
y D
epth

Abd Elrahman Mohamed Moussa /et al /Engineering Research Journal 163 (September 2019) M20- M35
02M
4.2 Effect of frequency (F)
In the experiments of discontinuities measurements (length and width), four
experiments (2, 2.25, 4 and 5) MHz were carried out, at Thickness = 20mm, velocity =
5920 m/s, n (number of elements) = 16 piezoelectric element, e (element width) =
0.5mm, ρ (pitch) = 0.5mm, g (element gap) = 0.1mm. The length/depth readings are
listed in Table (2):
Table (2) The length readings for F = (2, 2.25, 4 and 5) MHz.
Discontinuity Type 2 MHz 2.25 MHz 4 MHz 5 MHz
(2) Crack
Length Reading (9mm) 9.7 9.5 9.3 9.2
Error L +0.7 +0.5 +0.3 +0.2
Depth Reading (6.5mm) 6.2 6.3 6.4 6.5
Error D -0.3 -0.2 -0.1 0
(3) Porosity
Length Reading (24mm) 23 23.5 24.2 24.1
Error L -1.0 -0.5 +0.2 +0.1
Depth Reading (6.6mm) 6.2 6.3 6.4 6.5
Error D -0.4 -0.3 -0.2 -0.1
(5) Slag
Length Reading (162mm) 160.2 160.6 161.7 161.9
Error L -1.8 -1.4 -0.3 -0.1
Depth Reading (5mm) 5.5 5.4 5.2 5.1
Error D +0.5 +0.4 +0.2 +0.1
(17) Lack of
Penetration
Length Reading (162mm) 163.7 163.2 162 162.5
Error L +1.7 +1.2 +1.0 +0.5
Depth Reading (7.1mm) 6.5 6.6 6.9 7.3
Error D -0.6 -0.5 -0.2 +0.2
Results and Discussion
Figs. (5 and 6) show the effect of frequency (F) on the percentage error in detecting
the length and depth respectively of different discontinuities. From the results; the
length and depth measuring accuracy improved by increasing frequency.
Fig.(5) Relation between Frequency readings vs. Discontinuities error Length.
0
0.5
1
1.5
2
2 2.25 4 5
Err
or
Len
gth
%
Frequency (MHz)
LOP
Crack

Abd Elrahman Mohamed Moussa /et al /Engineering Research Journal 163 (September 2019) M20- M35
02M
Fig.(6) Relation between Frequency readings vs. Discontinuities error Depth.
4.3 Effect of number of elements (n)
In the experiments of discontinuities measurements (length and depth), four
experiments (8, 16, 32 & 64) piezoelectric elements were carried out, at thickness =
20mm, frequency = 4MHz, velocity = 5920 m/s, e (element width) = 0.5mm, ρ (pitch)
= 0.5mm, g (element gap) = 0.1mm.
The length/depth readings are listed in Table (3) :
Table (3) The length readings for N (number of elements) = (8, 16, 32 and 64)
piezoelectric elements.
Discontinuity Type 8 16 32 64
(2) Crack
Length Reading (9mm) 9.5 9.4 9.4 9.1
Error L +0.5 +0.4 +0.4 +0.1
Depth Reading (6.5mm) 7.1 7 6.7 6.6
Error D +0.6 +0.5 +0.2 +0.1
(3) Porosity
Length Reading (24mm) 25.2 24.9 24.5 24.4
Error L +1.2 +0.9 +0.5 +0.4
Depth Reading (6.6mm) 6.2 6.2 6.3 6.5
Error D -0.4 -0.4 -0.3 -0.1
(5) Slag
Length Reading (162mm) 163.3 163.1 162.7 162.3
Error L +1.3 +1.1 +0.7 +0.3
Depth Reading (5mm) 4.4 4.4 4.7 4.8
Error D -0.6 -0.6 -0.3 -0.2
(17) Lack of
Penetration
Length Reading (162mm) 160.9 161.2 161.4 161.7
Error L -1.1 -0.8 -0.6 -0.3
Depth Reading (7.1mm) 7.5 7.5 7.3 7.1
Error D +0.4 +0.4 +0.2 0
0
0.1
0.2
0.3
0.4
0.5
0.6
0.7
2 2.25 4 5
Err
or
Dep
th %
Frequency (MHz)
LOPCrackPorositySlag

Abd Elrahman Mohamed Moussa /et al /Engineering Research Journal 163 (September 2019) M20- M35
02M
Results and Discussion
Figs.(7 and 8) show the effect of the number of piezoelectric elements on the
percentage error in detecting the length and depth respectively of different
discontinuities. From the results; the length and depth measuring accuracy improved
by increasing the number of piezoelectric elements.
Fig.(7) Relation between number of elements (N) readings vs. Discontinuities error
Length.
Fig.(8) Relation between number of elements (N) readings vs. Discontinuities error
Width.
4.4 Effect of pitch (ρ) In the experiments of discontinuities measurements (length and depth), Four
experiments (0.5, 1, 1.5 and 2) mm were carried out, at thickness = 20mm, frequency
= 4MHz, N (number of elements) = 16 piezoelectric element, velocity = 5920 m/s, e
(element width) = 0.5mm, g (element gap) = 0.1mm.
The length/depth readings are listed in Table (4) :
0
0.1
0.2
0.3
0.4
0.5
0.6
0.7
8 16 32 64
Err
or
Len
gth
%
Number of elements
LOP
Crack
Porosity
Slag
0
0.1
0.2
0.3
0.4
0.5
0.6
0.7
8 16 32 64
Err
or
Dep
th %
Number of elements
LOP
Crack
Porosity
Slag

Abd Elrahman Mohamed Moussa /et al /Engineering Research Journal 163 (September 2019) M20- M35
02M
Table (4) The length readings for ρ (Pitch) = (0.5, 1, 1.5 and 2) mm.
Discontinuity Type 0.5 mm 1 mm 1.5 mm 2 mm
(2) Crack
Length Reading (9mm) 8.3 8.5 8.5 8.8
Error L -0.7 -0.5 -0.5 -0.2
Depth Reading (6.5mm) 5.9 6 6.2 6.3
Error D -0.6 -0.5 -0.3 -0.2
(3) Porosity
Length Reading (24mm) 25.3 24.9 24.8 23.8
Error L +1.3 +0.9 +0.8 -0.2
Depth Reading (6.6mm) 6.2 6.3 6.5 6.7
Error D -0.4 -0.3 -0.1 +0.1
(5) Slag
Length Reading (162mm) 162.9 162.9 162.5 162.2
Error L +0.9 +0.9 +0.5 +0.2
Depth Reading (5mm) 4.3 4.5 4.5 4.6
Error D -0.7 -0.5 -0.5 -0.4
(17) Lack of
Penetration
Length Reading (162mm) 161.1 161.3 161.6 161.9
Error L -0.9 -0.7 -0.4 -0.1
Depth Reading (7.1mm) 6.6 6.7 6.9 7.2
Error D -0.5 -0.4 -0.2 +0.1
Results and Discussion
Figs. (9 and 10) show the effect of the Pitch (ρ) on the percentage error in detecting the
length and depth of different discontinuities. From the results; the length and depth
measuring accuracy improved by increasing the Pitch (ρ).
Fig.(9) Relation between Pitch (ρ) readings vs. Discontinuities error Length.
0
0.2
0.4
0.6
0.8
1
1.2
1.4
0.5 1 1.5 2
Err
or
Len
gth
%
Pitch (mm)
LOP
Crack
Porosity
Slag
Abd Elrahman Mohamed Moussa /et al /Engineering Research Journal 163 (September 2019) M20- M35
02M
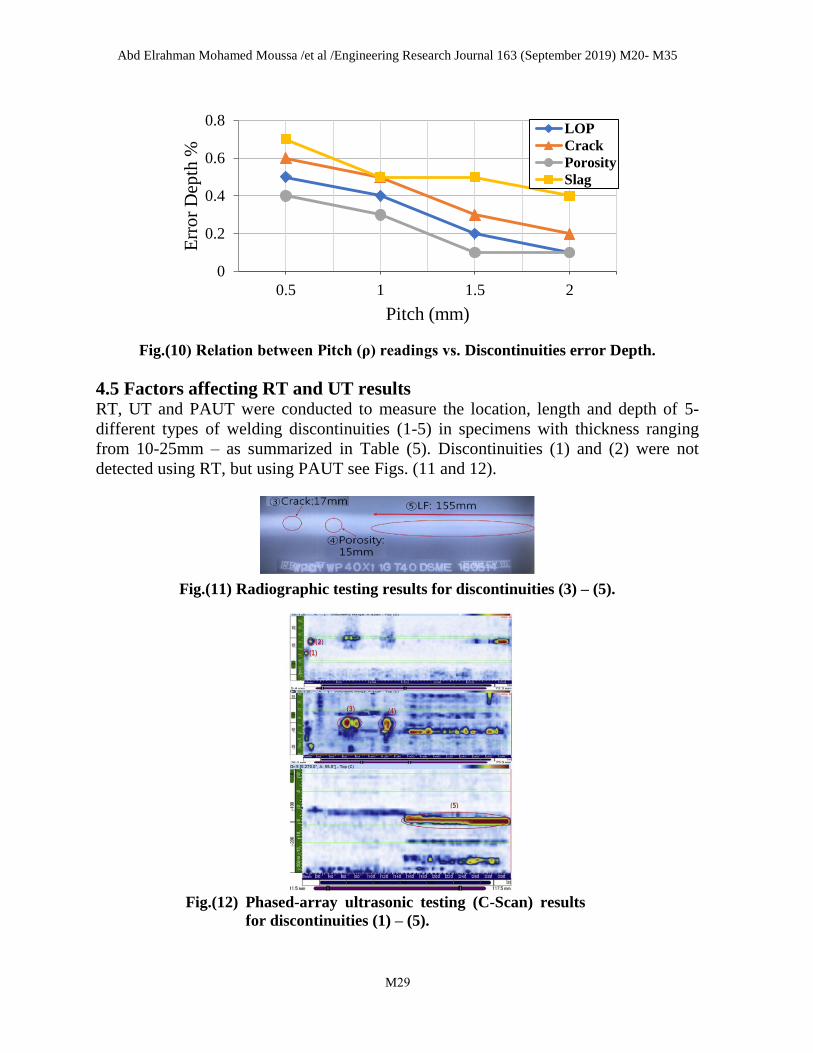
Fig.(10) Relation between Pitch (ρ) readings vs. Discontinuities error Depth.
4.5 Factors affecting RT and UT results RT, UT and PAUT were conducted to measure the location, length and depth of 5-
different types of welding discontinuities (1-5) in specimens with thickness ranging
from 10-25mm – as summarized in Table (5). Discontinuities (1) and (2) were not
detected using RT, but using PAUT see Figs. (11 and 12).
Fig.(11) Radiographic testing results for discontinuities (3) – (5).
Fig.(12) Phased-array ultrasonic testing (C-Scan) results
for discontinuities (1) – (5).
0
0.2
0.4
0.6
0.8
0.5 1 1.5 2
Err
or
Dep
th %
Pitch (mm)
LOP
Crack
Porosity
Slag

Abd Elrahman Mohamed Moussa /et al /Engineering Research Journal 163 (September 2019) M20- M35
22M
Table (5) Experimental results of discontinuities (1) – (5) obtained using RT, UT and
PAUT. Discontinuity
Type NDT
Discontinuity
Length (mm)
Discontinuity Location (mm) Discontinuity
Depth (mm) X-axis Y-axis
(1) IP
RT undeteceted
PAUT 6.0 0.0 -3.4 4.5
UT 4.0-5.0 0.0 -3.0 4.5-5.5
(2) IP
RT undeteceted
PAUT 9.0 6.0 4.4 6.5
UT 4.0-5.0 6.2 4.2 4.5-5.5
(3) Crack
RT 17.0 65.0 unknown
PAUT 24.0 58.0 2.2 6.6
UT 22.0 57.0 2.5 4.5
(4) Porosity
RT 15.0 118.0 unknown
PAUT 11.0 122.0 2.2 7.0
UT 10.0 122.5 2.5 4.5
(5) LoF
RT 155.0 165.0 unknown
PAUT 162.0 155.0 -4.0 5.0
UT 160.0 155.0 -4.5 4.5
5. Image Processing
The union of pictures from different S-scans is materialized as 3D images (volumetric
scans). Taken two types of discontinuities [Lack of Pen. (LOP) & Long. Crack] as an
example of applying 3-D images from different types of views (Top, Front & Side).
5.1 Lack of penetration (LOP) As shown in Fig.(13) that LOP considering as longitudinal discontinuity at the middle
of the weld root and Fig.(14) shows different S-Scan images taken from X-Axis
direction every 1mm length position.
Fig.(13). Photo of LOP standard Discontinuity.

Abd Elrahman Mohamed Moussa /et al /Engineering Research Journal 163 (September 2019) M20- M35
22M
LOP can be found exactly at the middle of weld root, and it can be characterize as
longitudinal and rectangular shape, but the standard division of discontinuity width
was low, the echo width was low and the echo height was large (Sharp).
Fig.(14). LOP S-Scans taken respectively to be input to MATLAB Program.

Abd Elrahman Mohamed Moussa /et al /Engineering Research Journal 163 (September 2019) M20- M35
20M
Front View
3D Estimation Top View Side View
Fig.(15) MATLAP Program output of Lack of Pen. (LOP).
As shown into Fig. (15) above that MATLAP can characterize the LOP into 3D
estimation as the photo taken above Fig.(13) at the same location and length.
5.2 Longitudinal crack
As shown in Fig.(16) that crack is considered as longitudinal discontinuity at the weld
filling and Fig.(17) shows different S-Scan images taken from X-Axis direction every
1mm length position.
Fig.(16). Photo of LOP standard Discontinuity.
Longitudinal Crack can be found even weld filling or sides, and we it characterize as
longitudinal and rectangular shape, the standard division of discontinuity width was
low, the echo width and height were large.

Abd Elrahman Mohamed Moussa /et al /Engineering Research Journal 163 (September 2019) M20- M35
22M
Fig.(17). Crack S-Scans taken respectively to be input to MATLAB Program.
Abd Elrahman Mohamed Moussa /et al /Engineering Research Journal 163 (September 2019) M20- M35
22M
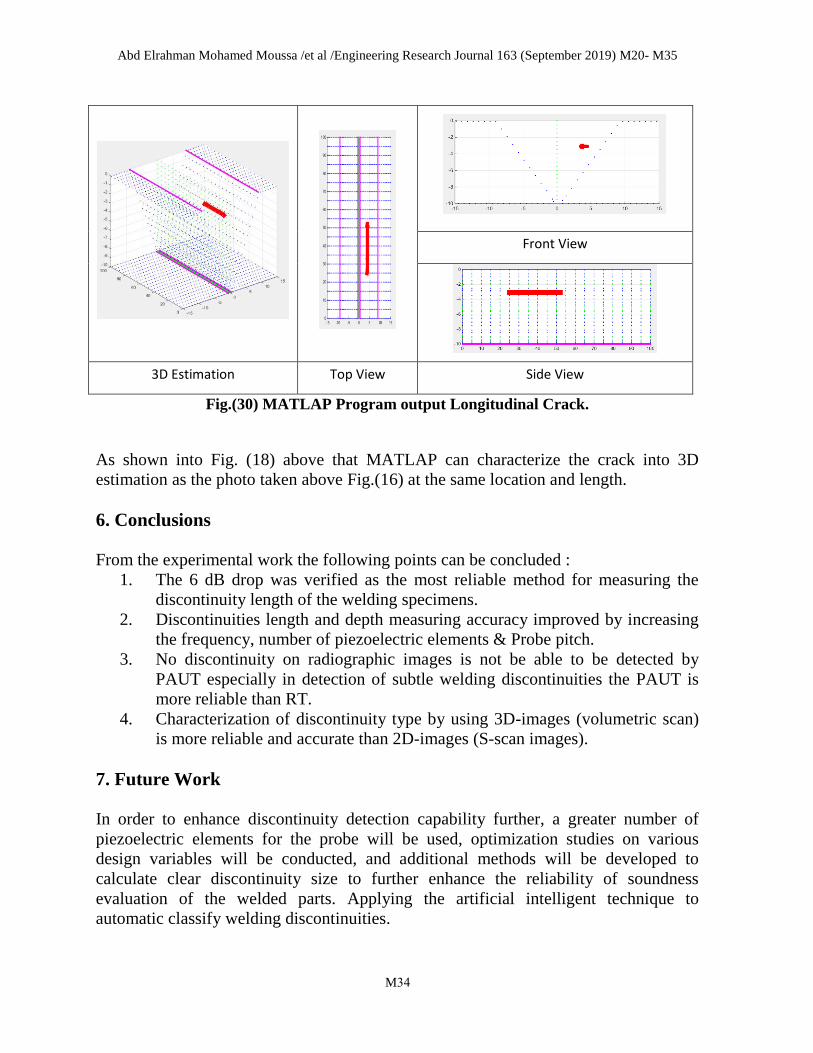
Front View
3D Estimation Top View Side View
Fig.(30) MATLAP Program output Longitudinal Crack.
As shown into Fig. (18) above that MATLAP can characterize the crack into 3D
estimation as the photo taken above Fig.(16) at the same location and length.
6. Conclusions From the experimental work the following points can be concluded :
1. The 6 dB drop was verified as the most reliable method for measuring the
discontinuity length of the welding specimens.
2. Discontinuities length and depth measuring accuracy improved by increasing
the frequency, number of piezoelectric elements & Probe pitch.
3. No discontinuity on radiographic images is not be able to be detected by
PAUT especially in detection of subtle welding discontinuities the PAUT is
more reliable than RT.
4. Characterization of discontinuity type by using 3D-images (volumetric scan)
is more reliable and accurate than 2D-images (S-scan images).
7. Future Work In order to enhance discontinuity detection capability further, a greater number of
piezoelectric elements for the probe will be used, optimization studies on various
design variables will be conducted, and additional methods will be developed to
calculate clear discontinuity size to further enhance the reliability of soundness
evaluation of the welded parts. Applying the artificial intelligent technique to
automatic classify welding discontinuities.

Abd Elrahman Mohamed Moussa /et al /Engineering Research Journal 163 (September 2019) M20- M35
22M
Reference
(1) Michael Moles, Noel Dube and Ed Ginzel, “Pipeline Girth Weld Inspections Using
Ultrasonic Phased Arrays”, PANNDT, Rio De Janeiro – Brazil, June (2003).
(2) Michael Moles, Noel Dube and Frederic Jacques "Pressure Vessel Inspections
Using Ultrasonic Phased Arrays", 16th World Conference on NDT, Rio de Janeiro,
Brazil, June (2003).
(3) Jerome Poirier, Robert Ward, “Qualification of Manual Phased Array Ultrasonic
Techniques for Pipe Weld Inspection in Nuclear Power Plants”, 17th World
Conference on Nondestructive Testing, Shanghai-China, October (2008).
(4) Mmabatho Bokaba, Ngeletshedzo Netshidavhini, Raymond B. Mabuza,
“Demonstration of the Capability of Phased Array Technique for Detecting
Defects in Thick-Section Welds”, 18th World Conference on Nondestructive
Testing, Durban, South-Africa, April (2012).
(5) Fereidoon Marefat, M. Reza Faghedi, A. Reza Khodabandeh, “Capabilities and
Limitations of Radiography and Phased Array Ultrasonic Test in the Detection of
Subtle Welding Defects”, Singapore International NDT Conference & Exhibition,
November (2011).
(6) Min-jae Jung, Byeong-cheol Park, Jeong-hoon Bae, “PAUT Based Defect
Detection Method for Submarine Pressure Hulls”, International Journal for Naval
Architecture and Ocean Engineering, Vol.(10), pp; 153-169, (2018).