the effect of rating scale format on · pdf file2 the effect of rating scale format on...
TRANSCRIPT
D/2010/6482/10
Vlerick Leuven Gent Working Paper Series 2010/07
THE EFFECT OF RATING SCALE FORMAT ON RESPONSE STYLES: THE NUMBER OF
RESPONSE CATEGORIES AND RESPONSE CATEGORY LABELS
BERT WEIJTERS
ELKE CABOOTER
NIELS SCHILLEWAERT

2
THE EFFECT OF RATING SCALE FORMAT ON RESPONSE STYLES: THE NUMBER OF
RESPONSE CATEGORIES AND RESPONSE CATEGORY LABELS
BERT WEIJTERS
Vlerick Leuven Gent Management School
ELKE CABOOTER
Ghent University
NIELS SCHILLEWAERT
Vlerick Leuven Gent Management School
Contact:
Bert Weijters
Vlerick Leuven Gent Management School
Tel: +32 09 210 98 76
Fax: +32 09 210 98 75
Email: [email protected]
3
ABSTRACT
Questionnaires using Likert-type rating scales are an important source of data in
marketing research. Researchers use different rating scale formats with varying
numbers of response categories and varying label formats (e.g., 7-point rating scales
labeled at the endpoints, fully labeled 5-point scales, etc.) but have few guidelines
when selecting a specific format. Drawing from the literature on response styles, we
formulate hypotheses on the effect of the labeling of response categories and the
number of response categories on the net acquiescence response style, extreme
response style and misresponse to reversed items. We test the hypotheses in an
online survey (N=1207) with eight experimental conditions and a follow-up study
with two experimental conditions (N = 226). We find evidence of strong effects of
scale format on response distributions and misresponse to reversed items, and we
formulate recommendations on the choice of a scale format.
Keywords: Rating scale format; Response styles; Number of response categories;
Response category labels.

4
1. INTRODUCTION
A great deal of what we know about consumers is based on questionnaire
data. When creating questionnaires, researchers face several design-related choices.
One such choice concerns the format of rating scales used to administer Likert items
(e.g., a five point rating scale where 1 = “strongly disagree” and 5 = “strongly agree”).
The choice for a particular rating scale format can be broken down into two major
components: the number of response categories to be offered, including the choice
for an odd or even number of categories, and the labeling of response categories.
Marketing researchers use different Likert formats to administer marketing scales.
Commonly used formats include those with five, six or seven categories, either fully
labeled (i.e., all response categories are explicitly labeled) or labeled at the extremes
(e.g., labeling the first category with “strongly disagree” and the last category with
“strongly agree”) (Bearden & Netemeyer, 1999; Bruner, James, & Hensel, 2001).
Table 1 provides an overview of formats that are regularly used in marketing
research, based on an analysis of the scale formats used in the marketing scale
inventory by Bruner et al. (2001) and research published in the International Journal
of Research in Marketing between 2004 and 2009.
Insert Table 1
Self-report measurement quality remains an ongoing concern (e.g., Rossiter,
2002; Sharma & Weathers, 2003; Strizhakova, Coulter, & Price, 2008), but the choice
of a specific format appears to receive relatively little attention in marketing
research. However, the rating scale format might affect the quality of questionnaire
data. Greenleaf (1992a) suggested that response category labels and the number of
response categories may influence the level of response bias and called for further
research on the matter. However, specific evidence of response bias due to the scale
format remains scarce in the marketing literature (see Weathers, Sharma & Niedrich
2005 for a notable exception). An important reason for this gap is that most research
5
on response styles has focused on only a single response scale format. For example,
Arce-Ferrer (2006) use 7-point Likert scales with endpoint labels; Baumgartner and
Steenkamp (2001) and De Jong, Steenkamp, Fox, and Baumgartner (2008) use 5-
point fully labeled Likert scales; Greenleaf (1992a) uses 6-point Likert scales with
endpoint labels. As a consequence, it is not clear how response styles differ across
the response scale formats used in these studies. This issue is of importance, as
there is no complete standardization in terms of response scale formats across
studies in marketing research (although two formats are dominant; cf. Table 1) and
cross-study comparability and generalizability are at stake.
To address this issue, the current study compares some of the most
commonly used response scale formats in terms of three key response biases: net
acquiescence response style (NARS), extreme response style (ERS), and misresponse
to reversed items (MR)1. We focus on NARS, ERS, and MR because they bias
observed means, variances and internal consistencies of scales, three parameters
that are generally of interest in marketing research.
2. CONCEPTUAL BACKGROUND
2.1. RESPONSE STYLES
The central tendency of rating scale measures is directly influenced by a
directional bias called Net Acquiescence Response Style (NARS; Greenleaf 1992a;
Baumgartner & Steenkamp, 2001; Rossi, Gilula, & Allenby, 2001). This response style
concerns the extent to which respondents tend to show greater acquiescence
(tendency to agree) rather than disacquiescence (tendency to disagree) with items,
irrespective of content. Extreme response style (ERS) is defined as the tendency to
disproportionately use the extreme response categories in a rating scale (Greenleaf
1992a, b; Baumgartner & Steenkamp, 2001). ERS affects the spread in observed data
(Baumgartner & Steenkamp, 2001; Greenleaf 1992a; Rossi, Gilula, & Allenby, 2001).
1 In the current article, we do not include Midpoint Response Style (e.g., Weijters, Schillewaert &
Geuens 2008) because we study the effect of including (or omitting) a midpoint.
6
To counter the effect of NARS, the use of balanced scales has been suggested
(Paulhus, 1991)2. A balanced scale contains reversed items, that is, items that are
coded in the opposite direction of their non-reversed counterparts (e.g., “I feel sad”
would be a reversed item measuring happiness). Unfortunately, respondents often
show a particular bias when responding to such items, in that they often respond in
the same direction to two items that are opposite in meaning, that is, agree to an
item and its reversal or disagree to an item and its reversal. This bias is labeled as a
misresponse to reversed items (MR). A growing body of evidence indicates that MR
cannot be equated with NARS (Wong, Rindfleisch, & Burroughs, 2003; Swain,
Weathers, & Niedrich, 2008; Weijters, Geuens, & Schillewaert, 2009).
2.2. RESPONSE STYLES AND SCALE FORMAT
Exploratory research suggests that the scale format influences response
styles. For example, Hui and Triandis (1989) illustrate how different formats yield
response distributions that are substantially different in shape irrespective of
content. Though intriguing in many respects, previous studies on the relationship
between response styles and response formats are limited for one or several of the
following reasons.
First, some studies use secondary data in which content and format are
confounded to an unknown extent (e.g., Alwin & Krosnick, 1991; Andrews, 1984).
Furthermore, we are not aware of studies that have related different formats to a
broad set of response styles that capture biases in terms of central tendency (NARS),
spread (ERS), and internal consistency (MR). Finally, student samples may be
inappropriate for studying response styles, as young adults with a high level of
education typically show lower levels of several response styles (Narayan & Krosnick,
2 Contrary to NARS, ERS cannot be corrected for in advance (i.e., during scale construction). However,
techniques have been developed to correct for response styles statistically, e.g., the procedures by Baumgartner and Steenkamp (2001) or Greenleaf (1992a), and the new improved technique to convert ERS by De Jong et al. (2008).
7
1996; Greenleaf, 1992a; Marín, Gamba, & Marín, 1992; Knauper, 1999; Mirowsky &
Ross, 1991).
In summary, evidence on the relation between scale formats and response
styles is far from conclusive. Nevertheless, there are good theoretical reasons to
expect such a relation. Most research on response styles has focused on differences
between individuals or groups of individuals (e.g., Baumgartner & Steenkamp 2001;
De Jong et al., 2008; Greenleaf, 1992a, b; Rossi et al., 2001). There is consensus,
however, that response styles are a function not only of individual characteristics but
also of the stimuli, that is, the questionnaire items and format (Baumgartner &
Steenkamp, 2001; Paulhus, 1991). In previous work, researchers have made
conjectures about such effects (e.g., Greenleaf, 1992a) and Arce-Ferrer (2006)
recently provided evidence that the perceived meaning of response categories plays
a key role in response styles.
3. HYPOTHESIS DEVELOPMENT
According to Tourangeau, Rips, and Rasinski (2000), respondents perform a
set of cognitive processes when answering questionnaire items: (1) comprehension
(they attend to the question and interpret it), (2) retrieval (they generate a retrieval
strategy and then retrieve relevant beliefs from memory), (3) judgment (they
integrate the beliefs into a conclusive judgment), and (4) response (they map the
judgment onto the available response categories and answer the question).
Response-style bias can occur as a result of problems during one or more of these
processes (Krosnick, 1991; Swain et al., 2008). In the current study, we focus on the
response process because the translation of a judgment into an answer clearly
depends on the response categories provided, that is, the format of the scale
(Tourangeau et al., 2000).
We construct our hypotheses around two main mechanisms through which
formats affect response styles. First, different response scale formats imply
differences in the perceived meaning and salience of response categories, thus

8
changing the chance of their being selected (Arce-Ferrer, 2006; Schaeffer & Presser,
2003). Second, response scale formats vary in the extent to which they force
ambivalent and indifferent or truly neutral respondents to choose sides when
responding; this has an effect on response distributions (Nowlis, Khan, & Dhar,
2002).
We study the labeling of response categories and the number of response
categories offered. As for labeling, we center our attention on the two most
common approaches (cf. Table 1): labeling all response categories versus labeling the
endpoints only (Hippler & Schwarz, 1987, p. 111). As for the number of response
categories, we include the two most popular formats, 5- and 7-point scales (cf. Table
1). To assess the impact of a midpoint, we also include 4-point and 6-point scales in
our study. Accordingly, and in line with recent methodological research in this area
(Lozano, Garcia-Cueto, & Muñiz, 2008), we limit the current study to scale formats
using 4 points to 7 points3. For conceptual and analytical reasons, we classify the
different numbers of response categories along two orthogonal dimensions,
“midpoint inclusion” and “gradations of (dis)agreement” as follows: 4-point scale =
no midpoint, 2 gradations of (dis)agreement; 5-point scale = midpoint, 2 gradations
of (dis)agreement; 6-point scale = no midpoint, 3 gradations of (dis)agreement; and
7-point scale = midpoint, 3 gradations of (dis)agreement. In what follows, we
formulate hypotheses concerning the effect of the scale format characteristics on
NARS, ERS, and MR.
3.1. LABELING OF RESPONSE CATEGORIES (ALL OR ENDPOINTS ONLY)
Using endpoint labels without intermediary labels makes it easier to
construct a rating scale, as only two labels have to be formulated. Also, this format
seems intuitively more in line with an interval scale assumption. On the other hand,
formats with all categories labeled facilitate interpretation both by respondents and
3 We note that binary response formats may also be common, especially in (psychological) research
using Item Response Theory. However, the focus of the current article is on Likert scales.
9
researchers (Wildt & Mazis, 1978). A fully labeled format is also associated with
higher reliability (Alwin & Krosnick, 1991; Krosnick, 1991; Weng, 2004). However,
this increase in reliability may be partially due to response style bias (Greenleaf,
1992a).
When all response options are verbally labeled, the intermediate options are
more salient. Respondents use the meaning of the labels that are provided to them
when mapping judgments to response scales (Rohrmann, 2003; Wegner, Faulbaum,
& Maag, 1982; Wildt & Mazis, 1978). Salient options will attract more responses due
to their increased accessibility (Posavac, Sanbonmatsu, & Fazio, 1997; Posavac,
Herzenstein, & Sanbonmatsu, 2003); as a result, respondents tend to be attracted to
labeled points (Krosnick & Fabrigar, 1997).
Labels denoting (dis)agreement make the valence of a negative/positive
response more explicit. As respondents have a desire to show agreeableness
(Schuman & Presser, 1981; McClendon, 1991), the clarity and salience of full labeling
is likely to reinforce the felt pressure to agree. As a result, the response distribution
may shift to the positive side as a result of full labeling.
H1: Labeling all response categories leads to higher levels of NARS.
In line with this, when the intermediate options become more salient through
full labeling, we expect a shift towards those intermediate categories at the expense
of the extreme categories (Simonson, 1989). In contrast, using verbal labels only for
the endpoints attracts respondents to the endpoint categories (Krosnick & Fabrigar,
1997). Hence, we hypothesize:
H2: Labeling all response categories leads to lower levels of ERS.
When all response categories are verbally labeled, the meaning of each
response category to the respondent is less ambiguous than in situations where only
end labels are provided (Lazovik & Gibson, 1984). For the latter, respondents need to
figure out the meaning of the intermediate response categories to determine the

10
option that comes closest to expressing their opinion. In doing so, respondents can
attach different meanings to the same response option (Arce-Ferrer, 2006; Schaeffer
& Presser, 2003; Schwarz et al., 1991). For instance, with a 4-point scale with the end
labels fully disagree/fully agree, the second option in the row can get the meanings
“slightly disagree”, “disagree”, or even “agree”. With labels for the end points only,
selecting the right response option will be more challenging when respondents need
to make up the right meaning for each response category (Krosnick, 1991). Because
reversed items are generally more difficult to answer (Steenkamp & Burgess, 2002;
Swain et al., 2008), this extra amount of cognitive difficulty at the response phase
will increase the level of MR. Conversely, a fully labeled version enhances
interpretation and facilitates response (Rohrmann, 2003); as a result, it will be
clearer to respondents that two same direction responses to reversed items are
inconsistent.
H3: Labeling all response categories leads to lower levels of MR.
3.2. MIDPOINT
The issue of whether or not to offer a midpoint has been disputed for
decades (e.g., Converse & Presser, 1986; Garland, 1991; Moser & Kalton, 1972;
O’Muircheartaigh et al., 2000). The major argument in favor of offering a midpoint
simply states that respondents with a truly neutral stance need to have the
possibility of choosing the middle option and not to be forced to choose a polar
alternative (Schuman & Presser, 1981). Offering a midpoint allows respondents to
indicate neutrality or ambivalence and makes people more comfortable when
selecting a response option (Nunnally, 1967). Opponents argue that the midpoint is
an easy way out for respondents, leaving them the possibility to avoid thinking about
the issue (Converse & Presser, 1986). Following this line of reasoning, omitting the
midpoint would increase data quality (Klopfer & Madden, 1980).

11
The midpoint attracts truly neutral/indifferent respondents on the one hand
and ambivalent respondents on the other hand (Nowlis et al., 2002). Both types of
respondents will be forced to choose an option when no midpoint is offered
(Schuman & Presser, 1981). Because neutral or indifferent respondents do not hold
strong positive or negative evaluations, they are unlikely to experience task-related
distress when they are forced to choose. As a result, when no midpoint is offered,
these respondents will randomly shift their response in either direction to the
closest category. For these respondents the omission of a midpoint will leave the
distribution unaffected (Parducci, 1965; Presser & Schuman, 1980).
Ambivalent respondents, on the other hand, do hold strong beliefs at both
ends of the scale. For them, the midpoint response is the result of their inability or
unwillingness to make the required trade-offs to choose sides (Nowlis et al., 2002).
According to Nowlis et al. (2002), respondents who are forced to choose sides will
make use of heuristics in order to reduce the conflict. Consequently, ambivalent
respondents will focus on the most important attribute of the evaluation object. This
means that the direction of the distribution can be either positive or negative or
remain unaffected.
However, both Velez and Ashworth (2007) and O’Muircheartaigh (2000) have
found a disproportional movement of negative answers to the midpoint when it was
provided. This phenomenon can be explained by the negative affect induced by the
task. When the midpoint is omitted, the frustration for being forced to choose may
bring along task-related negative affect. It is noted that these negative affective
reactions to conflicting situations often produce negativity dominance, meaning that
when thoughts are conflicting, negative thoughts tend to become more salient and
dominant (Dhar, 1997; Rozin & Royzman, 2001; Schimmack & Colcombe, 2002). As a
result, unless evaluation objects have a dominant attribute that is positively or
negatively evaluated and that can be easily used for heuristic processing, ambivalent
respondents will tend to react negatively in the absence of a midpoint. We thus
hypothesize that when no midpoint is offered, ambivalent respondents (and
approximately half of the indifferent respondents) will tend to express
disagreement, whereas they would have selected the midpoint if it had been
12
offered. As a consequence, we expect a higher level of NARS when a midpoint has
been added because of the disproportional decrease in negative answers compared
to positive answers. We also expect a decrease in ERS, as ambivalent respondents
who would have selected the extreme alternatives when the midpoint is omitted
(Nowlis et al., 2002) will opt for the midpoint if it is provided.
H4: NARS increases when adding a midpoint.
H5: ERS decreases when adding a midpoint.
In the case of an even-numbered format, truly neutral respondents will
randomly shift between positive and negative response options. They will probably
do so for nonreversed items as well as for reversed items related to the same topic.
Consequently, there is more chance that these respondents will contribute to a
higher level of MR. As stated earlier, ambivalent respondents experience negative
affect in absence of a midpoint and consequently tend to respond negatively. If this
happens in response to both a nonreversed item and a reversed item related to the
same topic, MR will result. We thus hypothesize:
H6: MR decreases when adding a midpoint.
Note that we expect ambivalent respondents to disagree to both an item and
its reversal; we will refer to this as negative MR.
3.3. GRADATIONS OF (DIS)AGREEMENT
Previous research has provided recommendations on the optimal number of
response categories drawing from a diversity of theories. From an information
theory perspective, it has been suggested that a scale range must be refined enough
to allow for maximal information transmission (Cox, 1980; Garner, 1960). In this
13
tradition, Green and Rao (1970) dismiss the use of two to three response categories,
favoring the use of six or 7-point scales instead, as these formats perform well in
recovering continuous latent variables.
Subject-centered research has demonstrated that respondents may not
optimally use some response formats for reasons that are mainly cognitive and/or
motivational in nature (Krosnick, 1991; Hippler & Schwarz, 1987; Weathers et al.,
2005). Studies in the subject-centered tradition with a focus on cognitive limitations
have tried to identify the optimal number of response categories based on reliability
measures, often finding higher reliability with an increasing number of response
alternatives (e.g., Chang, 1994; Matell & Jacoby, 1971; Preston & Colman, 2000).
However, the increase in reliability might be merely due to response styles
(Cronbach, 1950; Greenleaf, 1992a; Peabody, 1962).
From a motivational perspective, respondents want to meet expectations set
by the survey situation and provide information to the researcher. The availability of
extra response categories allows respondents to differentiate their responses within
the range of responses that express agreement or disagreement (Krosnick, 1991). By
doing so, respondents can qualify the strength of their opinion (Ghiselli, 1939).
Respondents will consequently bring more variation in their answers, but the
valence of the answer will not change. In other words, negative answers will vary in
their level of being negative but will not become positive, and positive items will vary
in their level of being positive but will not become negative (Marsh & Parducci,
1978). As a result, we do not expect that an increasing number of gradations will
lead to a difference in NARS or in MR as such. However, due to the higher variation
in the intermediate response range, we do expect a decrease in the level of ERS (Hui
& Triandis, 1989).
H7: ERS decreases when more gradations of (dis)agreement are offered.
14
3.3.1. Labeling and midpoint
When the midpoint is present, full labeling is likely to affect both NARS and
ERS. The hypothesized impact of the midpoint on NARS varies according to whether
respondents interpret the midpoint for what it stands, that is, the neutral point. Such
an interpretation of the midpoint is more likely when the midpoint is labeled. In a
fully labeled scale, the midpoint and the intermediate options become more salient.
These effects will reinforce the decrease in ERS. We thus hypothesize:
H8: The full labeling of the response categories strengthens the positive
effect of offering a midpoint on NARS.
H9: Full labeling of the response categories strengthens the negative effect of
offering a midpoint on ERS.
As stated earlier, when the midpoint is offered, MR will decrease, as the
midpoint will attract respondents who otherwise might have misresponded (Velez &
Ashworth, 2007). When the scale is fully labeled, it will become more readily
apparent that one is responding inconsistently to a reversed item (Rohrmann, 2003).
Consequently, we hypothesize:
H10: The full labeling of the response categories strengthens the negative
effect of inclusion of a midpoint on MR.
3.3.2. Gradations and midpoint
When a midpoint category is present, an increase in the number of
gradations is likely to affect its perceived width. The provision of more intermediate
categories around the midpoint reduces the size of the middle category, as it
stimulates respondents to express their attitude even if their attitude is only slightly
15
positive or negative (Weems & Onwuegbuzie, 2001; Matell & Jacoby, 1972). Some
indifferent respondents – who would normally choose the middle position – now opt
for one of the nearby categories. These respondents will be randomly distributed
across the negative and positive sides, leaving the level of NARS unaffected
(Parducci, 1965). As discussed, adding more gradations and adding a midpoint both
reduce ERS. The reason is that non-extreme options attract respondents who might
otherwise have responded extremely. Because fewer respondents opt for the
extreme options when more gradations are provided, we expect that the negative
effect of offering a midpoint on ERS will be smaller than when only few response
options are provided. As both effects draw from the same pool of otherwise
extreme respondents, we expect that the effects offset one another:
H11: The presence of a midpoint offsets the negative effect of adding more
gradations of (dis)agreement on ERS.
The reduction in perceived width of the middle response category in scales
with more gradations will probably lead to more MR. Because more respondents do
make a choice, they can make processing errors and respond wrongly on a reversed
item. As a result, we expect that including a midpoint does lead to a decrease in MR
but that this decrease will be lower when there are more response options. In
particular, this implies that 7-point scale formats show higher MR than that shown
by 5-point scale formats.
H12: Adding more gradations reduces the negative effect of offering a
midpoint on MR
3.3.3. Gradations and labeling
As discussed, in a fully labeled scale, the salience of the intermediate options
results in lower levels of ERS and higher levels of NARS. For NARS, we do not expect
16
an interaction effect of labeling and gradations, as adding extra response categories
does not change the valence of the answers (Marsh & Parducci, 1978). On the other
hand, adding more gradations will lead to a decrease in ERS. However, this effect is
likely different according to the degree of labeling. In a fully labeled scale, we expect
the decrease of ERS, due to the addition of extra response options, to be weaker
when compared to an endpoint-only setting. The reason is that in a fully labeled
scale, some of the respondents already shifted their responses towards the more
salient intermediate response categories.
H13: Fully labeling scales weakens the negative effect of adding more
gradations of (dis)agreement on ERS.
We do not expect that adding extra gradations has an unconditional direct
effect on MR. However, we do expect such an effect for scales with endpoint labels.
A fully labeled scale makes all response options salient and clear for the respondent,
which facilitates responding (Rohrmann, 2003). In the case of an endpoint-only
format, we expect an increase in MR when more gradations of (dis)agreement are
offered. When extra response options are added in an endpoint-only setting,
respondents need to put more cognitive effort in both attaching meanings to the
extra response options and keeping these meanings in mind. The resulting cognitive
resources limitation is likely to result in MR (Swain et al., 2008).
H14: In formats with labels for the endpoints only, adding more gradations of
(dis)agreement leads to an increase in MR

17
4. METHODOLOGY
4.1. EMPIRICAL STUDY 1
4.1.1. Design
To test our hypotheses, we conducted an online survey, orthogonally
manipulating the labeling of the response categories (either only the extreme
response categories were labeled or all response categories were labeled) and the
number of response categories (4 to 7). The response category labels were the Dutch
back-translated equivalents of “strongly disagree” (“Helemaal niet akkoord”),
“disagree” (“Niet akkoord”), “slightly disagree” (“Eerder niet akkoord”), “neutral”
(“Neutraal”), “slightly agree” (“Eerder akkoord”), “agree” (“Akkoord”), and “strongly
agree” (“Helemaal akkoord”). In the fully labeled conditions with only 4 or 6
categories, the neutral category was dropped. In the fully labeled conditions with 4
and 5 categories, we also dropped the categories “slightly agree” and “slightly
disagree”. The respondents were randomly assigned to the conditions. This resulted
in the following cell counts. All labeled: 4-point (N=137), 5-point (N=153), 6-point
(N=143), 7-point (N=150). Extreme categories labeled: 4-point (N=175), 5-point
(N=156), 6-point (N=154), 7-point (N=139).
4.1.2. Sample
The sample was randomly drawn from all Dutch-speaking men on the panel
of an Internet market research company in Belgium, who are representative of local
Internet users. Only men were invited to participate because of reasons not related
to this study but to the questionnaire of which the current items were part. A total
of 1,207 people responded (response rate = 27%). The ages ranged from 15 to 65
years with a median of 49. In our sample, 42.2% of respondents did not have any
formal education after secondary school, while 57.8% did.

18
4.1.3. Instrument
The questionnaire consisted of two parts, one including items to measure MR
and an intention measure to be used for illustrative purposes, and the other part
designed to measure NARS and ERS. The first set of questions consisted of multi-item
measures for three constructs, containing both reversed and non-reversed items. A
specific brand in the GPS product category was used as the study topic. We included
the following three reversed item pairs to calculate the level of misresponse
(Bearden & Netemeyer, 1999): (a) “Compared to other products, this product is
important to me” and “I am not interested in this product”; (b) “I love this brand”
and “I find this a very bad brand”; (c) “This brand really resonates with me” and “In
no case would I use this brand”. Each item pair was used to compute an indicator of
MR. Specifically, the MR score for a reversed item pair was 1 for a respondent who
responded positively or negatively to both items (before reverse coding the item
responses) and 0 otherwise (Swain et al., 2008). This operation resulted in three MR
indicators, labeled a, b, and c. The intention items included to illustrate the impact of
response bias were “I would like to try this product”, and “Next time I make a
purchase in this product category, I will consider the product that was shown”.
The second part of the questionnaire consisted of items that were included
with the specific aim of measuring NARS and ERS. In particular, we randomly
sampled 21 items from as many unrelated marketing scales in Bearden and
Netemeyer (1999) and Bruner et al. (2001). We thus made sure that the contents of
these items had no substantial true correlations. This was confirmed by the low
inter-item correlations, ranging from .03 to .10 across conditions. As the items were
randomly sampled from existing marketing scales, they were highly heterogeneous,
and 21 items could be reasonably assumed to be sufficient to validly measure NARS
and ERS (Greenleaf, 1992b; Weijters et al., 2008).
To create measures of NARS and ERS, we used log odds. The odds refer to the
ratio of the probability that the event of interest occurs to the probability that it
does not, and are often estimated by the ratio of the number of times that the event

19
of interest occurs to the number of times that it does not (Bland & Altman, 2000). An
important advantage of using odds-based measures of NARS or ERS is that it
facilitates interpretation and that it does not require an assumption of interval
measurement level of the rating scales (which is a requirement when using means or
measures that capture the deviation from the midpoint, for example). Sample odds
ratios are limited at the lower end, as they cannot take on negative values, but not at
the upper end, resulting in a skewed distribution. However, the log odds ratio can
take any value and has an approximately normal distribution centered around zero
(Bland & Altman, 2000). NARS was computed as the log odds of the number of
agreements plus one over the number of disagreements plus one (the ones were
added to avoid zero values):
NARS = ln ((# agreements+1) / (# disagreements+1)), (1)
where ln indicates the natural logarithm and # (dis)agreements stands for a
count of the items to which a positive (negative) response was given. Similarly, ERS
was computed as the log odds of the number of extreme responses plus one over
the number of non-extreme responses. Extreme responses were defined as
responses in the most positive and the most negative categories:
ERS = ln ((# extreme responses + 1) / (# non-extreme responses + 1)). (2)
NARS and ERS had a range from -3.09 (which corresponds to ln(1/22) for
respondents who did not engage in NARS or ERS) through 3.09 (which corresponds
to ln(22) for respondents who answered all items positively or extremely). An NARS
(ERS) value of zero indicates that a respondent gave as many positive (extreme)
responses as negative (non-extreme) responses. The correlation between NARS and
ERS was -.08 (p = .004).
To assess concurrent validity, we estimate the correlation between our
proposed NARS measure and the traditional NARS measure based on the mean of
the items, as well as the correlation between our proposed ERS measure and the
20
traditional ERS measure based on the standard deviation of the items (Greenleaf,
1992a; Baumgartner & Steenkamp, 2001). Because the traditional measures are
specific to scale formats, we average the correlations of the new and traditional
measures across the eight experimental conditions. For NARS the correlation is .74,
for ERS the correlation is .78. Hence, the shared variance (i.e., r²; Fornell & Larcker,
1981) exceeds 50% in both cases, providing evidence in support of concurrent
validity of the proposed measures.
4.1.4. Findings
Figure 1 shows the model we test. In line with Weijters, Geuens, &
Schillewaert (in press b), we create three indicators for NARS and three indicators for
ERS by splitting the items in three groups (items 1, 4, 7... for group 1; items 2, 5, 8...
for group 2, etc.). As a result, we can model NARS and ERS as two latent factors with
three scale level indicators each, thus accounting for unique variance in the response
style indicators due to content specificity and random error. MR is modeled as a
latent factor with three binary indicators: each indicator is based on one reversed
item pair and takes on a value of 0 if no MR occurs for this item pair and a value of 1
if MR does occur for this item pair4.
Insert Figure 1
We code the experimental variables as follows. The labeling manipulation is
used as the grouping variable (group one contains the conditions where only the
extremes are labeled, group two contains the conditions where the response
categories are fully labeled). The manipulations related to the number of scale points
(gradations and midpoint) are coded by means of effect-coded variables. For
gradations, we create a variable that takes on a value of -1 for conditions with 2
4 We verified that using a summated score for MR gave parallel results and led to the same
substantive conclusions.
21
gradations of (dis)agreement and a value of 1 for conditions with 3 gradations of
(dis)agreement. For the midpoint, we create a variable that takes on a value of -1 if
no midpoint is present and a value of 1 if a midpoint is present. We also include a
contrast variable to account for the gradation by midpoint interaction, coding the 7-
point condition as 1 and the other formats as -1/3. This variable thus captures the
effect (not explained by the main effects) of simultaneously having 3 gradations and
a midpoint (i.e., a 7-point scale). The coding scheme is summarized in Table 2.
Insert Table 2
We specify NARS, ERS, and MR as latent factors with three indicators each.
The NARS, ERS, and MR factors are regressed on the experimental variables. The
regression weights capture the effects of increasing the number of gradations to 3
and of including a midpoint, or both, relative to the grand mean and while
controlling for the other experimental manipulations.
Group differences in the NARS, ERS, and MR intercepts reflect the effect of
labeling. We assess the labeling effects by means of Wald chi² tests (testing the
hypothesis of a null effect). For the hypothesis tests, we use alpha=0.05 as the
threshold for statistical significance, but we do report exact p-values for
completeness. We estimate the model with the WLSMV estimator in Mplus 5.1
(Muthén & Muthén, 2007). As respondents were randomly assigned to groups, the
measurement parameters (factor loadings, indicator residuals and indicator
intercepts) were set to equality across groups (extremes labeled versus all labeled).
The model fits the data acceptably well (chi²(57) = 107.71, p = .0001; CFI =
.952; TLI = .953; RMSEA = .038). All indicators have substantial and highly significant
standardized factor loadings (.589, .577, .573 for NARS; .806 .835, .831 for ERS; .428,
.855, .842 for MR5; all p<.001), indicating that the multiple indicators for each
response style indeed tap into a common underlying dimension. In other words, the
convergent validity of the multiple indicators per response style is supported. The
5 As pointed out by the Area Editor, it is interesting to see that the loading of the first indicator (a) on
MR is smaller than the other two. Indicator a refers to the product, while b and c are about the brand.
22
variance explained (R²) by the experimental variables is 11.3% for ARS, 15.3% for
ERS, and 45.2% for MR. The observed proportions of MR are shown in Table 3. The
model estimates are shown in Table 4.
Insert Tables 3 and 4
By means of Wald chi² group-difference tests, we test for group differences in
regression weights (i.e., moderating effects of labeling). We set invariant regression
weights to equality across groups (i.e., the estimates are equal for the extremes
labeled group and the fully labeled group; cf. Table 4). In particular, the three-way
interactions of labeling, gradations and midpoint were not significant for NARS
(chi²(1) = 0.02, p = 0.893), ERS (chi²(1) = .99, p = .320), and MR (chi²(1) = .02, p =
.881). The same is true for the two-way interactions of labeling with gradations on
NARS (chi²(1) = .04, p = .834), the two-way interaction of labeling with midpoint on
NARS (chi²(1) = .33, p = .567) (as a result, no evidence is found in support of H8), and
the two-way interaction of labeling with midpoint on ERS (chi²(1) = 1.25, p = .263)
(therefore, no evidence is found in support of H9).
Insert Table 5
The group differences in the intercepts of NARS, ERS, and MR represent the
effect of labeling. The intercepts of group one (extremes labeled) are zero as to the
model specification, so the t-test of the intercepts in group two (all labeled) provide
a test of the labeling effect. The intercept estimates are shown in the lower rows of
Table 4. Labeling has a significant effect on all three dependent variables and leads
to higher NARS (H1), lower ERS (H2), and lower MR (H3).
The inclusion of a midpoint leads to a significant increase in NARS (H4) and a
significant decrease in ERS (H5) (cf. Table 4). The decrease in ERS is smaller when the
inclusion of the midpoint is combined with an increase in the number of gradations
from 2 to 3 (H11). Adding the midpoint leads to lower MR (H6). As expected, we
23
found more negative MR (39%) than positive (2%) (binomial test p < .001). In line
with H10, the reduction in MR due to the inclusion of a midpoint is significantly
stronger in the fully labeled conditions (the parameter estimates are significantly
different across groups: Wald chi²(1) = 13.31, p = .0003; cf. Table 5). Also, the
decrease in MR due to the inclusion of the midpoint is weaker when the there are 3
gradations (H12).
Increasing the number of gradations from 2 to 3 does not affect NARS, but
results in a significant decrease in ERS (H7; cf. Table 4), and this effect is stronger in
the extremes labeled conditions (H13) (the parameter estimates are significantly
different across groups: Wald chi²(1) = 6.12, p = .013; cf. Table 5). Increasing the
number of gradations increases MR but only so in the condition with the extremes
labeled (H14): the effect is non-significant in the fully labeled condition (cf. Table 4),
and the parameter estimates are significantly different across groups (Wald chi²(1) =
4.39, p = .036; cf. Table 5).
4.1.5. Impact of format on intention measures
If an analyst would want to report the trial and purchase intentions of a
product, s/he might use the percentage of respondents agreeing with intention
items as a simple and efficient statistic. To make the impact of the format
manipulation and the resulting differences in response distributions tangible, Table 6
presents the percentage of respondents agreeing with two intention items. As
shown in Table 7, the distributions were significantly affected by the labeling and
inclusion of a midpoint but not the addition of a gradation of (dis)agreement.
Depending on the scale format used, estimates of the percentage of responders
agreeing with the intention items varied between 22.6% and 60.6%. This finding
succinctly demonstrates the danger of interpreting item scores in an absolute way.
The results in Table 6 also illustrate the relevance of the effects observed in the main
study: conditions associated with higher NARS indeed result in higher proportions of
respondents expressing a positive intention.

24
Insert Tables 6 and 7
4.1.6. Discussion Study 1
This first study demonstrates that the scale format components labeling and
the number of response categories affect NARS, ERS, and MR. The main conclusion is
thus that empirical results based on different scale formats may not be comparable.
Also, interpreting levels of agreement with Likert items in an absolute sense (e.g.,
“the majority of respondents agree”) is necessarily a tentative exercise at best.
The current practice is validated to some extent by our findings, in that
formats with an even number of categories are hardly used in practice and also
perform poorly in terms of MR in the current study. However, the default format in
marketing scales, that is, the 7-point scale with labels at the extremes, does not
necessarily provide the best data quality. The problem associated with this scale
format is the higher level of MR compared to the 5-point scale.
Researchers evaluating the results of Study 1 may look for better alternatives
than the default 7-point scale with labels at the endpoints by reasoning as follows.
The results indicate that a 5-point scale with labels at the extremes results in better
data quality, as it leads to lower MR. Labeling all response options would further
decrease MR. Our results show that labeling also results in higher NARS, but, in the
absence of a criterion measure, it is not clear to what extent this is problematic. To
address the latter issue, that is, whether or not all response categories should be
labeled, we set up an additional study.
4.2. EMPIRICAL STUDY 2
We set up Study 2 to investigate labeling effects more closely for 5-point
scale formats. Note that labeling all response categories is more common for this
25
number of response categories than for formats with any other number of
categories (see Table 1).
4.2.1. Design and sample
We conducted an additional online survey among a sample of British
respondents. For this study, we focused on 5-point scales only and manipulated the
labeling of the response categories at two levels (only the extreme response
categories were labeled or all response categories were labeled). The response
category labels were “strongly disagree”, “slightly disagree”, “neutral”, “slightly
agree” and “strongly agree”. We randomly assigned respondents to the two
conditions (N = 113 for the all labeled condition; N = 113 for the extremes labeled
condition). The sample was randomly drawn from all UK residents on the panel of an
Internet marketing research company. Ages ranged from 18 through 85, with a
median of 55 years (SD = 14.5). In our sample, 32.7% of respondents were female,
and 65.5% had attended college or university.
4.2.2. Instrument
The questionnaire was inspired by Greenleaf’s (1992a) work and contained
questions related to 10 diverse but common behaviors. The intentions related to all
behaviors were measured on a percentage scale and used the question “How likely is
it that you will do the following activities at least once during the next 2 weeks?
Please give a number from 0% to 100%”. Here, 0% means “definitely not” (i.e., there
is no chance I will do this the next two weeks) and 100% means “definitely will” (i.e.,
it is certain that I will do this activity in the next two weeks)”. This question is
concrete and specific, and uses a format that has an objective meaning
(probabilities) and that is clearly different from the Likert scales. For these reasons,
26
we assume that the data obtained with this measure do not share substantial
method bias with attitudinal Likert scales (Greenleaf, 1992a; Rindfleisch et al., 2008).
Later in the questionnaire, the attitude towards each behavior was probed
with a 5-point Likert item and the following question: “Please indicate to what
extent you (dis)agree with the following statements. In general, I like to….” Here, the
following behaviors are subsequently listed: go shopping; go to a restaurant; invite
friends at my place; attend a concert; go for a walk; go to the gym; play computer
game(s); communicate online with friends (chat, e-mail, Facebook); go to the
cinema; go to a bar to have a drink with friends. The average inter-item correlation
across behaviors was .21 for the intention items and .18 for the attitude items,
indicating that the activities were heterogeneous.
4.2.3. Findings and discussion: The effect of labeling on attitude-intention models
We relate intentions measured on a percentage scale to attitudes measured
on 5-point Likert scales that either have all categories labeled or only the extremes
labeled. This allows us to study how labeling affects model estimates in simple
regression models of a type that is quite common in marketing research. The
findings from Study 1 provide some hypotheses on how model estimates may be
biased.
Consider a simple linear regression where intention on a percentage scale is
regressed on attitude on a 5-point scale. As the intention scale is the same across
conditions, differences in model estimates can be attributed to the attitude
measurement effects. We expect that attitude measures in the fully labeled
condition show higher NARS. This could translate in higher observed attitude means
and/or lower intention intercepts (Greenleaf, 1992a). The reason for the latter is
that the attitude responses will be inflated relative to the intention scores; a
negative shift in intercept compensates for this. Attitude measures in the endpoints-
labeled condition are expected to show higher ERS, and we thus expect higher
attitude variances in this condition. A key question that relates to this but that is not
27
addressed in Study 1 is which of the two formats shows better criterion validity.
Better criterion validity would appear in a higher regression weight and higher
explained variance.
We study several behaviors’ attitude-intention pairs. In the questionnaire, 10
were included. A preliminary analysis shows that for one behavior, “go to a
restaurant”, the intention score is significantly different across conditions (t(224) = -
2.139, p = .034). As this suggests that the two random samples coincidentally differ
in terms of this behavior, we omit this attitude-intention pair for further analysis,
leaving us with nine pairs. We verify that the nine remainder intention measures are
invariant across conditions in terms of means, variances and covariances. This seems
to be the case, as the nested chi square invariance tests are all insignificant: chi²(9) =
8.21, p=.513 for the means, chi²(9)=13.28, p = .150 for the variances, and
chi²(36)=34.94, p = .519 for the covariances. As a result, any subsequent violation of
cross-group invariance in the model can be attributed to the responses to the
attitude questions.
In the model of interest, every intention item is regressed on its related
attitude item. The attitude items correlate freely, as do the residual terms of the
intention items. Using this model, we can investigate whether the difference in the
labeling of the attitude items affects model estimates.
Insert Table 8
The unconstrained model fits the data well (see the unconstrained model in
Table 8), and we use this unconstrained model as the reference model against which
we test invariance restrictions. The invariance restrictions test the hypotheses that
parameter estimates are the same in the two conditions (all categories labeled
versus extremes labeled). In the first model (“attitude means”), the chi-square
difference test tests the null hypothesis that the means of the nine attitude items
are equal across the two experimental conditions. This hypothesis is not rejected (p
= .284). The subsequent tests (also using the unconstrained model as the reference
model) indicate that invariance is rejected for the attitude variances, the intention

28
intercepts and the regression weights from attitude to intention items (all p < .05).
The model estimates for the latter parameters (that are not the same across
conditions) are shown in Table 9. The data are coded as follows: “Strongly disagree”
= -2; “Slightly disagree” = -1; “Neutral” = 0; “Slightly agree” = 1; “Strongly agree” = 2.
Consequently, the intercept term is the expected intention score corresponding to a
neutral attitude. The last four columns of Table 9 contain an index based on the ratio
of the estimate in the condition with all categories labeled over the estimate in the
extremes-labeled condition.
Insert Table 9
With one exception, the regression weights in the extremes condition are
greater than the regression weights in the all condition. The R² estimates are
consistently greater in the extremes condition. The intercepts are greater in the
extremes condition for 7 out of 9 behaviors6. The variances are greater in the
extremes condition for 6 out of 9 behaviors. Overall, these results support the notion
that the attitude measures in the all-labeled condition show higher NARS and lower
ERS.
Importantly, the explained variance, which indicates criterion validity, is
consistently and substantially higher in the extremes condition. The averaged model
implied regression slopes are shown in Figure 2, illustrating the higher intercept and
slope for the extremes condition. In sum, the results of this follow-up study indicate
that the extremes-only scale format performs better than the fully labeled scale
format in terms of criterion validity.
Insert Figure 2
6 We note that the intention intercept test is more sensitive than the attitude means test (as attitude
serves as a covariate of the experimental effect for the former).

29
5. GENERAL DISCUSSION
Marketing researchers use questionnaires with Likert-type rating scales in
order to understand, explain and predict the behavior of respondents. However,
researchers often use different rating scale formats with varying numbers of
response categories and labels. This article examines the effects of these scale
format characteristics on the response distributions and the level of MR in order to
provide better insight in the optimal scale format choice.
In Study 1, we experimentally manipulated the rating scale format of items,
varying the number of the response categories from 4 to 7, and the labels of the
response categories (all-labeled versus endpoints-only). Our results demonstrate
significant effects of scale format characteristics on NARS, ERS, and MR, and thereby
shed light on the processes that are involved in such effects.
NARS is higher in conditions where all response categories are labeled. We
attribute this effect to the clarity of a fully labeled version, which strengthens the
effect of positivity bias (Tourangeau et al., 2000). A fully labeled scale format also
leads to lower ERS scores due to the increased salience and attractiveness of the
intermediate options. In addition, labeling all response categories leads to less MR,
as it reduces cognitive load in that it clarifies the meaning of unlabeled response
categories (Krosnick, 1991; Swain et al., 2008).
Including a neutral point leads to an increase in NARS due to a
disproportional movement of otherwise negative responses to the midpoint.
Ambivalent respondents who are forced to take sides tend to react negatively
(Gilljam & Granberg, 1993). This finding is in concordance with the findings of Nowlis
et al. (2002) in that the distribution shift is evoked by ambivalent respondents.
However, it is not only the focus on the most important attribute that determines
the choice of response category; the task-related negative emotions also play an
important role.
The inclusion of a midpoint also results in lower levels of ERS and MR, and
MR is even lower for scales with a midpoint when all response categories are

30
labeled. In contrast with our expectations, the effect of including a midpoint on
NARS and ERS was not strengthened by full labeling. It is possible that the strong
main effects leave little room for establishing an interaction effect and/or that the
mechanisms truly are additive rather than interactive.
Adding gradations of (dis)agreement does not affect NARS and MR, as the
addition of extra response categories will not change the valence of the
respondent’s response choice (Marsh & Parducci, 1978). When only the endpoints
are labeled, adding gradations leads to higher MR, due to the ambiguous meanings
of the intermediate response categories for this scale format. Furthermore, MR
increases with an increasing number of gradations conditional on the presence of a
midpoint. Adding gradations of (dis)agreement offers the possibility to better qualify
the strength of a response and reduces ERS. This effect is mitigated when all
response categories are labeled or when a midpoint is present.
Study 2 focused on the effect of labeling response categories on criterion
validity in simple linear regressions. Findings replicate Study 1 in that a fully labeled
scale format led to higher NARS and lower ERS. More importantly, we find that
criterion validity was higher in the labeled endpoints condition, meaning that the
latter provided better data for estimation of linear models. It should be noted that
Study 2 is only a first, preliminary study into the criterion validity effects of labeling.
We discuss some suggestions for further research in the last section of this paper.
5.1. IMPLICATIONS
It is clear that scale format characteristics affect the central tendency, spread
and internal consistency of self-report data. Consequently, data obtained with
different formats are not comparable, and interpretations of Likert data are always
relative: the probability that respondents agree with an item depends on how such
agreement can be expressed. In setting up studies, researchers need to make a well-
considered choice for a specific format, and they need to explicitly report this choice.

31
Meta-analyses need to take into account response format as a factor influencing
estimates.
The practice of reporting survey results by means of percentages of
respondents who agree with a statement (“top two boxes” or “top three boxes”) has
to be treated with great caution. As shown in Table 6, the percentage of respondents
with positive trial and purchase intentions varied widely across formats (from 22.6%
through 60.6%). Additionally, for regressions, differences in format lead to
differences in model estimates and model fit. As shown in Table 9, formats with
endpoint labels resulted in a stronger linear relation between attitudes and
intentions than fully labeled formats.
Our study identifies a previously unrecognized antecedent of MR. This relates
back to the four cognitive processes that respondents perform when answering an
item: (1) comprehension, (2) retrieval, (3) judgment, and (4) response (Tourangeau
et al., 2000). Previous work has focused on MR due to problems in comprehension
(Schmitt & Stults, 1985), retrieval (Weijters et al., 2009) and/or judgment (Swain et
al., 2008; Weijters et al., 2009). Our findings demonstrate that MR can also be
caused by problems in mapping a judgment onto a specific response category.
Related to this, the question of whether or not to include a midpoint depends not
only on the particular research goals (Nowlis et al., 2002) but also on the risk for MR
in the data. The inclusion of a midpoint led to a reduction in MR. Overall, we suggest
avoiding scales without a midpoint, unless particular, relevant reasons present
themselves.
5.2. PRELIMINARY FRAMEWORK FOR SELECTING A RESPONSE SCALE FORMAT
We propose a preliminary framework for selecting a response scale format.
The current results are not conclusive, and the framework can serve as a guideline
for choosing a scale format until further evidence becomes available. We base this
framework on the extant literature on the topic, complemented by the two empirical
studies presented in this paper. The framework is shown in Figure 3.

32
Insert Figure 3
As shown in Figure 3, we distinguish studies based on two dimensions: the
study population and the study objective. We focus on student populations versus
general populations because they are common in marketing research and because
students tend to be relatively high in terms of cognitive ability, verbal skills, and
experience with questionnaires. These factors are likely to facilitate processing and
make respondents less prone to response biases, including MR (Knauper, 1999;
Krosnick, 1991; Marsh, 1996).
In selecting the optimal number of gradations, a tradeoff presents itself
between maximizing the potential information transmission (Garner, 1960; Green &
Rao, 1970) versus minimizing respondent demands (Krosnick, 1991; Weathers et al.,
2005). We suggest that it may be less problematic to use scales with more response
categories (specifically, seven categories) for student populations (and other
populations that rate high on cognitive ability, verbal skills and/or experience with
questionnaires). For studies among the general population, it may be safer to stick to
5-point scales. In the current study (general population), 5-point scales led to less
MR. We note that for rating scales having at least five response options, linear
models can approximate the data quite well (Bollen and Barb, 1981; Srinivasan and
Basu, 1989).
The choice for a particular scale format is further modulated by the study’s
objective. When developing a new scale, researchers may want to reduce the risk of
MR by fully labeling their scales. Otherwise, results may be biased against the
inclusion of reversed items. Similarly, if a researcher wants to report direct
summaries of responses (i.e., opinion measurement) by using means or percentages
(e.g. top boxes), it may be preferable to opt for a fully labeled 5-point scale format
(or fully labeled 7-point format for students) as labeling makes the scale more
directly interpretable (e.g. a “2” on a 5-point scale means “disagree” for both the
researcher and the respondent). Though respondents tend to be internally

33
consistent in this format, the downside is that they may be positively biased, so
estimates should be interpreted as such.
We also stress the inherent relativity of scale responses. If a researcher wants
to relate variables and estimate linear relations using correlations, regression
models, structural equation models (SEM), etc., a 5- (or 7-) point scale with endpoint
labels is the best choice. Respondents seem to use this format in a way that better
conforms to linear models, thus providing higher criterion validity (cf. Study 2). The
downside here is that reversed items may prove problematic in endpoint-labeled
formats. To minimize reversed item bias, researchers can disperse same-scale items
throughout the questionnaire by including buffer items or items of other scales in
between (Weijters et al. 2009). In addition, when analyzing the data, researchers can
include a method factor to account for reversed item bias (Weijters et al. 2009).
In a meta-analysis, the analyst can of course not select a scale format, but it is
still key to take the scale format into account, particularly by including scale format
characteristics as covariates (number of gradations, labeling). In replication studies,
it may be safe to initially use the same scale format as the study one is replicating.
Afterwards, it may in some instances be interesting to vary scale format as a
boundary condition (especially in studies on factor structure).
5.3. LIMITATIONS & FUTURE RESEARCH
To conclude, we note some limitations of our study that offer opportunities
for future research. We only studied Likert-type items in this study. Future research
might also examine the effects of labeling and the number of response categories in
other formats, such as semantic differentials.
An important limitation of Study 2 is the use of a self-report measure for
assessing criterion validity. One might argue that this leaves open the possibility that
5-point Likert scales with labeled endpoints are more similar to percentage scales
than to 5-point Likert scales with labels for all response categories. We admit this as
a limitation, and we are in favor of further research into this topic, possibly using
34
other criterion variables (e.g., observational data rather than self-reports). However,
there are several good reasons to believe that the current empirical context makes
the likelihood that the results are due to a confound small. (1) There were filler tasks
in between the two measures. This reduces the chance for the carryover effects of
response styles, as previous research has shown that there is a significant auto-
regressive component of response styles, i.e., response styles in adjacent parts of a
questionnaire are more similar than in distant parts of a questionnaire (Weijters,
Geuens, & Schillewaert, in press a). (2) The response formats we used (5-point Likert
scale versus percentage scale) have been reported to be very differently experienced
by respondents, resulting in different response tactics and response quality
(Weathers et al., 2005; Preston & Colman, 2000). In line with this, and referring to
the work by Podsakoff et al. (2003) and Lindell and Whitney (2001), Rindfleisch et al.
(2008) have recently recommended the use of different formats for predictor and
outcome variables to minimize method bias carryover. (3) For the intention
question, respondents had to fill out a percentage themselves, rather than having to
pick an option from a given set. (4) The difference in R² is large and consistent. In
sum, we consider the use of a self-report for assessing criteria a limitation rather
than a fatal flaw. Nevertheless, Study 2 is a first, preliminary investigation into this
topic, as more research is surely needed before we can draw solid conclusions.
A final intriguing question that remains unanswered is whether the scale
format interacts with culture in affecting response styles. We conducted Study 1
with Dutch-speaking respondents and Study 2 with English-speaking respondents.
The observation that the findings from Study 1 were predictive of the findings from
Study 2, provides evidence in support of the generalizability of our findings across at
least the two languages under study.
35
REFERENCES
Alwin, D. F., & Krosnick, J. A. (1991). The reliability of survey attitude measurement:
The influence of question and respondent attributes. Sociological Methods and
Research, 20(1), 139-181.
Andrews, F. M. (1984). Construct validity and error components of survey measures:
A structural modeling approach. Public Opinion Quarterly, 48, 409-442.
Arce-Ferrer, A. J. (2006). An Investigation Into the Factors Influencing Extreme-
Response Style. Educational and Psychological Measurement, 66(3), 374-392.
Baumgartner, H., & Steenkamp, J.B.E.M. (2001). Response styles in marketing
research: A cross-national investigation. Journal of Marketing Research, 38 (May),
143-156.
Bearden, W. O., & Netemeyer, R.G. (1999). Handbook of Marketing Scales: Multi-
Item Measures for Marketing and Consumer Behavior Research. CA: Sage.
Bland, J. M., & Altman, D. G. (2000). Statistics Notes: The odds ratio. British Medical
Journal, 320(7247): 1468.
Bollen, K. A., and Barb, K.H. (1981). Pearson's r and coarsely categorized measures.
American Sociological Review, 46(2), 232-239.
Bruner, G. C., James, K.E., & Hensel, P.J. (2001). Marketing Scales Handbook, A
compilation of Multi Item Measures Volume III. Chicago: American Marketing
Association.
Chang, L. (1994). A Psychometric evaluation of four-point and six-point Likert-type
scale in relation to reliability and validity. Applied Psychological Measurement, 18,
205-215.

36
Converse, J. M., & Presser, S. (1986). Survey Questions: Handcrafting the
standardized questionnaire. CA: Sage.
Cox, E. P. III (1980). The optimal number of response alternatives for a scale: A
review. Journal of Marketing Research, 17, 407-422.
Cronbach, L.J. (1950). Response set and test validity. Educational and Psychological
Measurement, 6 (Winter), 475-494.
Dhar, R. (1997). Consumer Preference for a No-Choice option. Journal of Consumer
Research, 24 (2), 215-231
De Jong, M. G., Steenkamp, J. B. E. M., Fox, J.P., & Baumgartner, H. (2008). Using
Item Response Theory to Measure Extreme Response Style in Marketing Research: A
Global Investigation. Journal of Marketing Research, 45, 104-115.
Fornell, C., & Larcker, D.F. (1981). Evaluating Structural Equation Models with
Unobservable Variables and Measurement Error. Journal of Marketing Research,
18(February), 39-50.
Garland, R. (1991). The Mid-Point on a Rating Scale: Is It Desirable? Marketing
Bulletin, 2, 66.
Garner, W.R. (1960). Rating scales, discriminability, and information transmission.
Psychological Review, 67(6), 343-352.
Ghiselli, E. E. (1939). All or None Versus Graded Response Questionnaires. Journal of
Applied Psychology, 23 (June), 405-15.
Gilljam, M., & Granberg, D. (1993). Should we take Don’t know for an answer? Public
Opinion Quarterly, 57 (3), 348-357.
Green, P. E., & Rao, V.R. (1970). Rating scales and information recovery: how many
scales and response categories to use? Journal of Marketing, 34(July), 33-39.

37
Greenleaf, E. A. (1992a). Improving rating scale measures by detecting and
correcting bias components in some response styles. Journal of Marketing Research,
29(2), 176-188.
Greenleaf, E. A. (1992b). Measuring extreme response style. Public Opinion
Quarterly, 56(3), 328-350.
Hippler, H. J., & Schwarz, N. (1987). Response Effects in Surveys. In: H.J. Hippler, N.
Schwarz, & S. Sudman (Eds.). Social Information Processing and Survey Methodology.
New York: Springer-Verlag.
Hui, H. C., & Triandis, H. C. (1989). Effects of Culture and Response Format on
Extreme Response Style. Journal of Cross-Cultural Pshychology, 20 (3), 296-309.
Klopfer F.J., & Madden, T.M. (1980). The Middlemost Choice on Attitude Items:
Ambivalence, Neutrality or Uncertainty. Personality and Social Psychology Bulletin, 6,
97-101.
Knauper, B. (1999). The Impact of Age and Education on Response Order Effects in
Attitude Measurement. Public Opinion Quarterly, 63 (Fall), 347-370.
Krosnick, J. A. (1991). Response strategies for coping with the cognitive demands of
attitude measures in surveys. Applied Cognitive Psychology, 5, 213-236.
Krosnick, J.A., & Fabrigar, L.R. (1997). Designing Rating Scales for Effective
Measurement in Surveys. In: Lyberg, L.E., Biemer, P., Collins, M., de Leeuw, E.D.,
Dippo, C., Schwarz, N., and Trewin, D. (Eds.). Survey Measurement and Process
Quality (pp. 141-164). NY: Wiley-Interscience.
Lazovik, G. F., & Gibson, C. L. (1984). Effects of Verbally Labeled Anchor Points on the
Distributional Parameters of Rating Measures. Applied Psychological Measurement,
8 (1), 49-57.
Lindell, M.K., & Whitney, D.J. (2001). Accounting for common method variance in
cross-sectional research designs. Journal of Applied Psychology, 86(1), 114-121.

38
Lozano, L. M., Garcia-Cueto, E., & Muñiz, J. (2008). Effect of the Number of Response
Categories on the Reliability and Validity of Rating Scales. Methodology, 4 (2), 73-79.
Marín, G., Gamba, R. J., & Marín, B. V. (1992). Extreme response style and
Acquiescence among Hispanics: The role of acculturation and education. Journal of
Cross-Cultural Psychology, 23 (4), 498-509.
Marsh, H.W., & Parducci, A. (1978). Natural Anchoring at the Neutral Point of
Category Rating Scales. Journal of Experimental Social Psychology, 14, 193-204.
Marsh, H. W. (1996). Positive and negative global self-esteem: A substantively
meaningful distinction or artifactors? Journal of Personality and Social Psychology,
70, 810-819.
Matell, M. S., & Jacoby, J. (1971). Is there an optimal number of alternatives for
Likert scale items? Study I: Reliability and validity. Educational and Psychological
Measurement, 31, 657-674.
Matell, M. S., & Jacoby, J. (1972). Is there an optimal number of alternatives for
Likert scale items? Effects of testing time and scale properties. Journal of Applied
Psychology, 56(6), 506-509.
McClendon, M. J. (1991). Acquiescence and Recency Response-Order Effects in
Interview Surveys. Sociological Methods and Research, 20 (1), 60-103.
Mirowsky, J., & Ross, C.E. (1991). Eliminating Defense and Agreement Bias from
Measures of the Sense of Control: A 2x2 Index. Social Psychology Quarterly, 54 (2),
127-145.
Moser, C.A., & Kalton, G. (1972). Survey Methods in Social Investigation. London:
Heinemann.
Muthén, L.K., and Muthén, B.O. (2007). Mplus User’s Guide. Fifth Edition. Los
Angeles, CA: Muthén & Muthén.

39
Narayan, S., & Krosnick, J. A. (1996). Education moderates some response effects in
attitude measurement. Public Opinion Quarterly, 60 (1), 58-88.
Nowlis, S.M., Kahn, B.E. & Dhar, R. (2002). Coping with Ambivalence: the Effect of
Removing a Neutral Option on Consumer Attitude and Preference Judgments.
Journal of Consumer Research, 29, 319-334.
Nunnally, J.C. (1967). Psychometric Theory. NY: McGraw Hill.
O’Muircheartaigh, C., Krosnick, J.A. & Helic, A. (2000). Middle Alternatives,
Acquiescence, and the Quality of Questionnaire Data. Presented at Annu. Meet. Am.
Assoc. Public Opin. Res., Fort Lauderdale, FL.
Parducci, A. (1965). Category Judgment: A range-Frequency Model. Psychological
Review, 72 (6), 407-418.
Paulhus, D. L. (1991). Measurement and control of response bias. In: Robinson J.P.,
Shaver P.R. and Wright L.S (Eds.). Measures of Personality and Social Psychological
attitudes (pp. 17-59). San Diego: Academic Press.
Peabody, D. (1962). Two components in Bipolar Scales: Direction and Extremeness.
Psychological Review, 69 (2), 65-73.
Podsakoff, P.M., MacKenzie, S.B., & Podsakoff, N.P. (2003). Common Method Biases
in Behavioral Research: A Critical Review of the Literature and Recommended
Remedies. Journal of Applied Psychology, 88, 879-903.
Posvac, S.S., Herzenstein, M., & Sanbonmatsu, D.M. (2003). The Role of Decision
Importance and the Salience of Alternatives in Determining the Consistency between
Consumer’s Attitudes and Decisions. Marketing Letters, 14, 47-57.
Posavac, S.S., Sanbonmatsu, D.M., & Fazio, R.H. (1997). Considering the Best Choice:
Effects of the Salience and Accessibility of Alternatives on Attitude Decision-
Consistency. Journal of Personality and Social Psychology, 72, 253-475.
40
Presser, S., & Schuman, H. (1980). The Measurement of A Middle Position in Attitude
Surveys. Public Opinion Quarterly, 44, 70-78.
Preston, C. C., & Colman, A. M. (2000). Optimal number of response categories in
rating scales: reliability, validity, discriminating power, and respondent preferences.
Acta Psychologica, 104, 1-15.
Rindfleisch, A., Malter, A.J., Ganesan, S., & Moorman, C. (2008). Cross-sectional
versus longitudinal survey research: Concepts, findings, and guidelines. Journal of
Marketing Research, 45 (3), 261-279.
Rohrmann, B. (2003). Verbal Qualifiers for Rating Scales: Sociolinguistic
considerations and psychometric data. Working paper.
Rossi, P. E., Gilula, Z. & Allenby, G. M. (2001). Overcoming Scale Usage
Heterogeneity: A Bayesian Hierarchical Approach. Journal of the American Statistical
Association, 96(453), 20-31.
Rossiter, J.R. (2002). The C-OAR-SE procedure for scale development in marketing.
International Journal of Research in Marketing, 19(4), 305-335.
Rozin, P., & Royzman, E. B. (2001). Negativity Bias, Negativity Dominance, &
Contagion. Personality and Social Psychology Review, 5 (4), 296-320.
Schaeffer, N.C., & Presser, S. (2003). The Science of Asking Questions. Annual Review
of Sociology, 29, 65-88.
Schimmack, U., & Colcombe, S. (2002). Theory of affective reactions to ambivalent
Situations (TARAS): A cognitive account of negativity dominance. Working paper.
Schmitt, N., & Stults, D.M. (1985). Factors defined by negatively defined keyed
items: The result of careless respondents. Applied Psychological Measurement, 9,
367-373.
41
Schwarz, N., Knauper, B., Hippler, H.J., Noelle-Neumann, E., & Clark, L. (1991). Rating
Scales: Numeric Values May Change the Meaning of Scale Labels. Public Opinion
Quarterly, 55 (4), 570-582.
Schuman, H., & Presser, S. (1981). Questions and answers in attitude surveys:
Experiments in question form, wording, & content. New York: Academic.
Sharma, S. & Weathers D. (2003). Assessing generalizability of scales used in cross-
national research. International Journal of Research in Marketing, 20(1), 287-295.
Simonson, I. (1989). Choice Based on Reasons: The Case of Attraction and
Compromise Effect. Journal of Consumer Research, 16, 158-174.
Srinivasan, V., and Amiya K. Basu (1989). The metric quality of ordered categorical
data. Marketing Science, 8(3), 205-230.
Steenkamp, J.B., & Burgess, S.M. (2002). Optimum Stimulation Level and Exploratory
Consumer Behavior in an Emerging Consumer Market. International Journal of
Research in Marketing, 19, 131-150.
Strizhakova, Y., Coulter, R.A., & Price, L.L. (2008). The meanings of branded
products: A cross-national scale development and meaning assessment. International
Journal of Research in Marketing, 25(2), 82-93.
Swain, S. D., Weathers, D., & Niedrich, R. W. (2008). Assessing three sources of
misresponse to reversed Likert items. Journal of Marketing Research, 45 (Feb), 116-
131.
Tourangeau, R., Rips, L. J., & Rasinski, K. (2000). The Psychology of Survey Response.
NY: Cambridge University Press.
Velez, P., & Ashworth, S. D. (2007). The Impact of Item Readability on the
Endorsement of the Midpoint Response in Surveys. Survey Research Method, 1 (2),
69-74.
42
Weathers, D., Sharma, S. & Niedrich, R. W. (2005). The impact of the number of scale
points, dispositional factors, and the status quo decision heuristic on scale reliability
and response accuracy. Journal of Business Research, 58, 1516-1524.
Weems, G. H., & Onwuegbuzie, A. J. (2001). The Impact of Midpoint Responses and
Reverse Coding on Survey Data. Measurement and Evaluation in Counseling and
Development, 34, 166-176.
Wegner, B., Faulbaum, F., & Maag, G. (1982). Die Wirkung von Antwortvorgaben bei
Kategorialskalen. ZUMA-Nachrichten, 10, 3-20.
Weijters, B., Geuens, M., & Schillewaert, N. (2009). The Proximity Effect: The Role of
Interitem Distance on Reverse-Item Bias. International Journal of Research in
Marketing, 26(1), 2-12.
Weijters, B., Geuens, M., & Schillewaert, N. (in press a). The individual consistency of
acquiescence and extreme response style in self-report questionnaires. Forthcoming
in Applied Psychological Measurement, Advance online publication
doi:10.1177/0146621609338593.
Weijters B., Geuens M., & Schillewaert N. (in press b). The stability of individual
response styles. Forthcoming in: Psychological Methods.
Weijters, B., Schillewaert, N., & Geuens, M. (2008). Assessing response styles across
modes of data collection. Journal of the Academy of Marketing Science, 36(3), 409–
422.
Weng, L.-J. (2004). Impact of the Number of Response Categories and Anchor Labels
on Coefficient Alpha and Test-Retest Reliability. Educational and Psychological
Measurement, 64 (6), 956-972.
Wildt, A. R., & Mazis, M. B. (1978). Determinants of Scale Response: Label versus
Position. Journal of Marketing Research, 15 (2), 261-267.

43
Wong, N., Rindfleisch, A., & Burroughs, J. E. (2003). Do Reverse-Worded Items
Confound Measures in Cross-Cultural Consumer Research? The Case of the Material
Values Scale. Journal of Consumer Research, 30(1), 72-91.
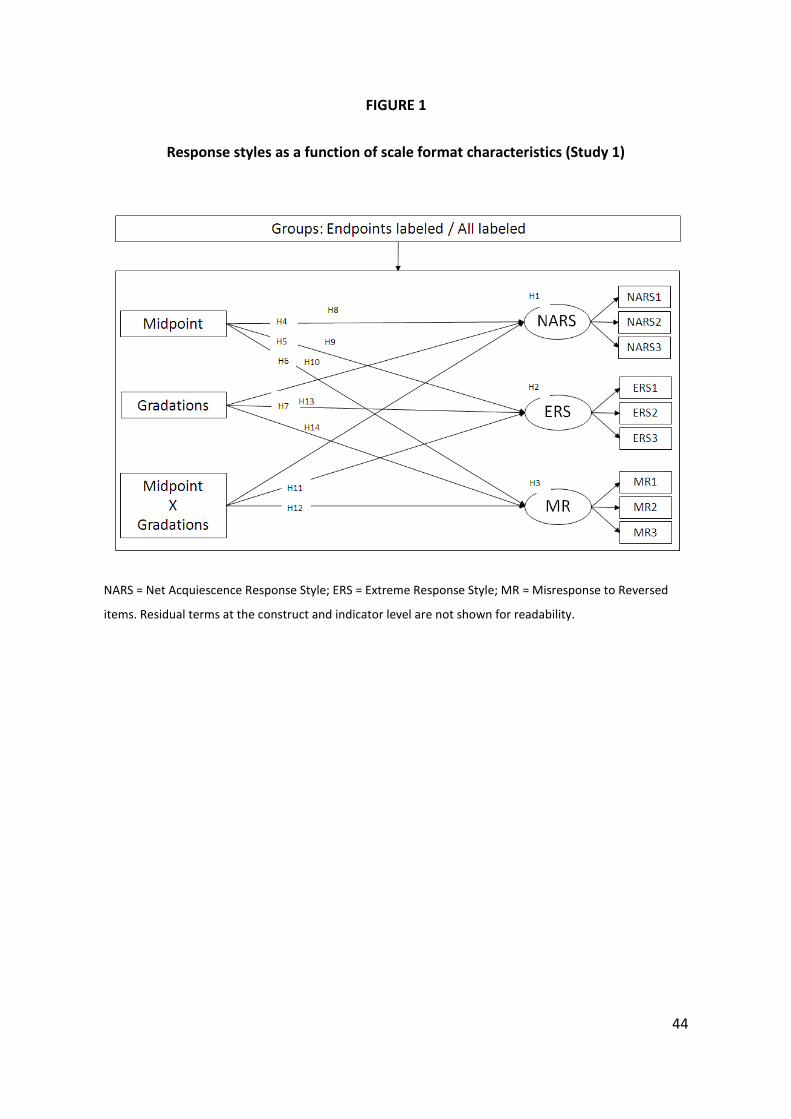
44
FIGURE 1
Response styles as a function of scale format characteristics (Study 1)
NARS = Net Acquiescence Response Style; ERS = Extreme Response Style; MR = Misresponse to Reversed
items. Residual terms at the construct and indicator level are not shown for readability.

45
FIGURE 2
Labeling response options leads to different regression functions (Study 2)
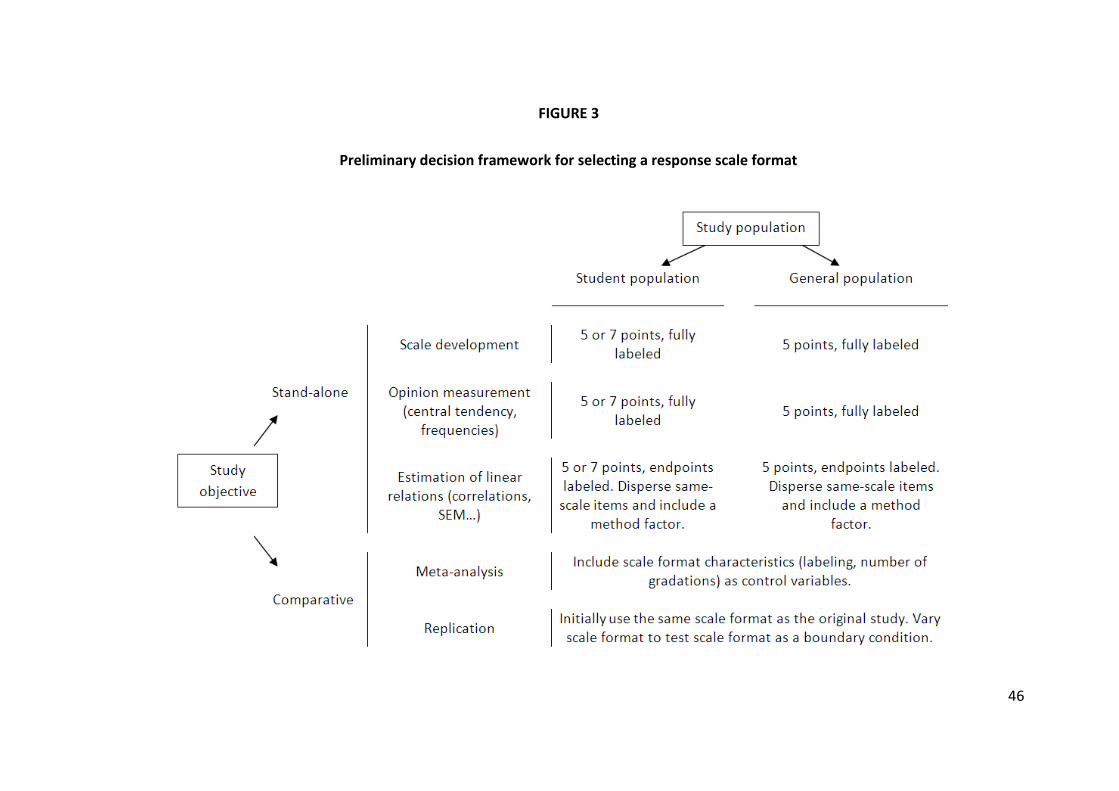
46
FIGURE 3
Preliminary decision framework for selecting a response scale format

47
TABLE 1
Overview of scale formats used in questionnaires
Bruner, James and Hensel 2001
(N = 603)
IJRM
(N = 82)
Number of response categories Extremes
labeled All
labeled Extremes
labeled All
labeled
< 4 0.5% 1.2% 6.1% .0% 4 0.8% .8% 3.7% .0% 5 30.0% 2.7% 19.5% 2.4%
6 2.0% .0% 2.4% .0% 7 55.2% .2% 43.9% .0%
> 7 6.6% 0.0% 22.0% .0%
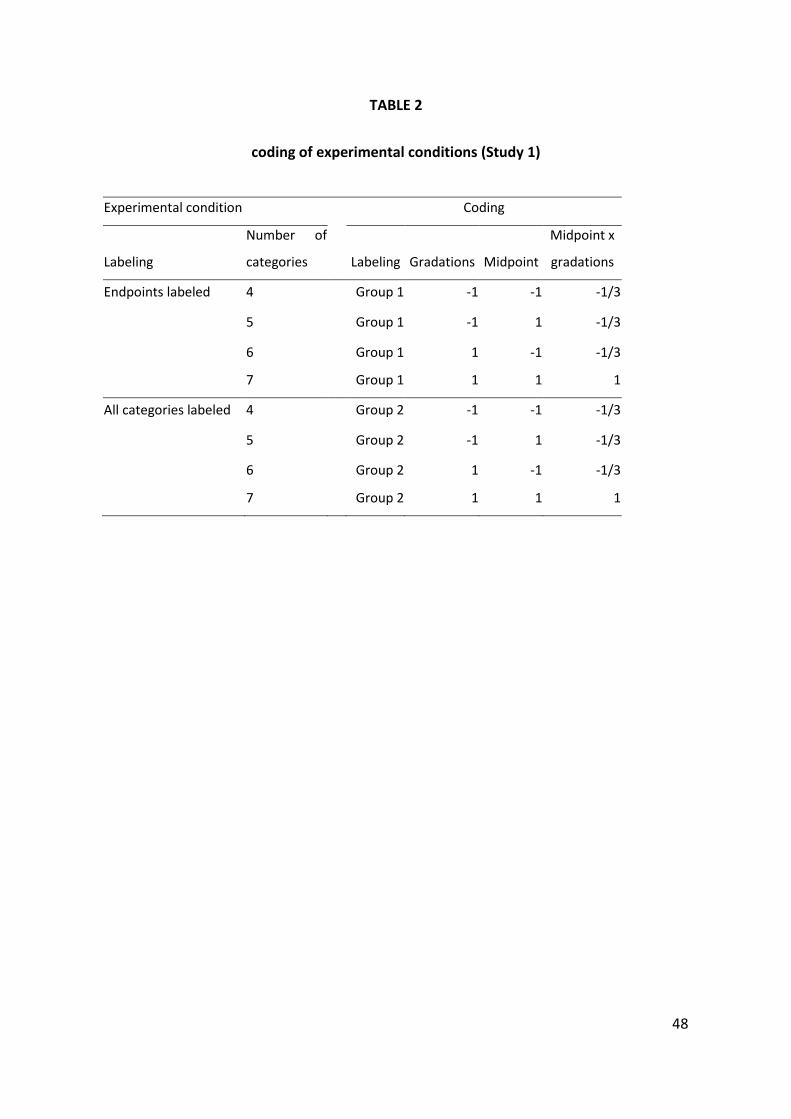
48
TABLE 2
coding of experimental conditions (Study 1)
Experimental condition Coding
Labeling
Number of
categories Labeling Gradations Midpoint
Midpoint x
gradations
Endpoints labeled 4 Group 1 -1 -1 -1/3
5 Group 1 -1 1 -1/3
6 Group 1 1 -1 -1/3
7 Group 1 1 1 1
All categories labeled 4 Group 2 -1 -1 -1/3
5 Group 2 -1 1 -1/3
6 Group 2 1 -1 -1/3
7 Group 2 1 1 1
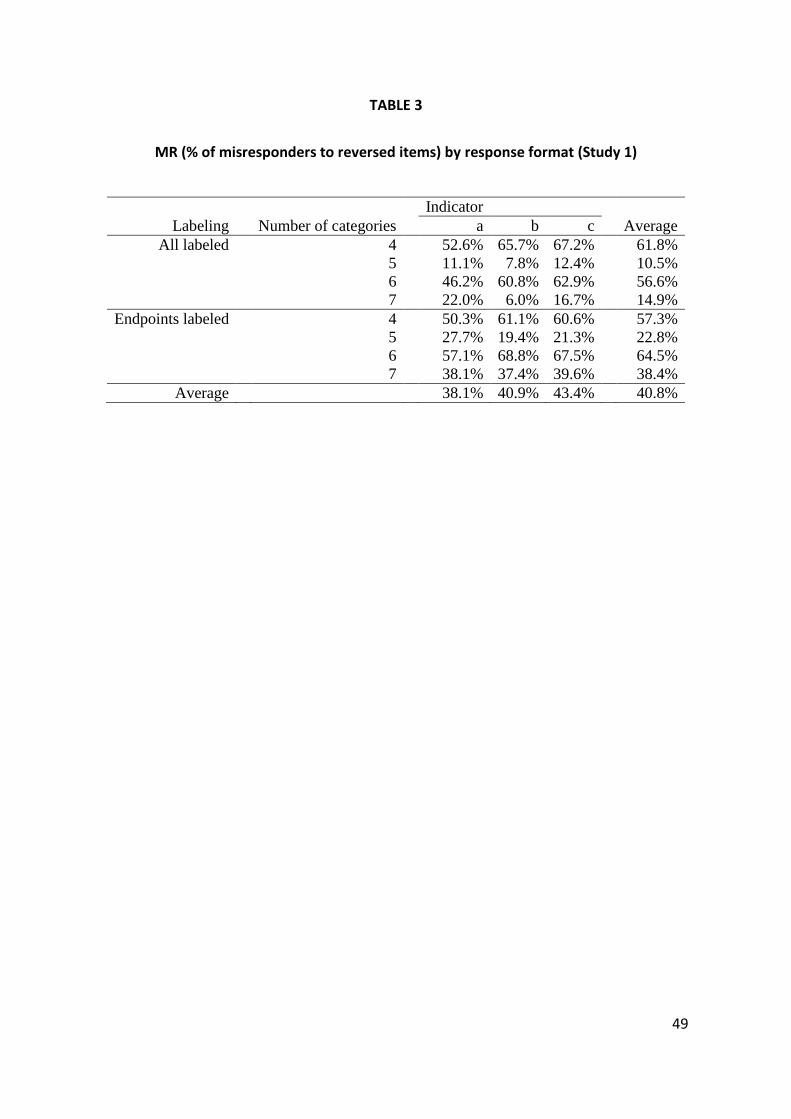
49
TABLE 3
MR (% of misresponders to reversed items) by response format (Study 1)
Indicator
Labeling Number of categories a b c Average
All labeled 4 52.6% 65.7% 67.2% 61.8%
5 11.1% 7.8% 12.4% 10.5%
6 46.2% 60.8% 62.9% 56.6%
7 22.0% 6.0% 16.7% 14.9%
Endpoints labeled 4 50.3% 61.1% 60.6% 57.3%
5 27.7% 19.4% 21.3% 22.8%
6 57.1% 68.8% 67.5% 64.5%
7 38.1% 37.4% 39.6% 38.4%
Average 38.1% 40.9% 43.4% 40.8%

50
TABLE 4
Model estimates of format effects on NARS, ERS, MR (Study 1)
Extremes labeled All labeled
DV IV Estimate SE t p Estimate SE t p
Intercepts NARS 0.000 0.168 0.027 6.32 0.000 H1
ERS 0.000 -0.436 0.045 -9.67 0.000 H2
MR 0.000 -0.490 0.084 -5.81 0.000 H3
B NARS Midpoint 0.078 0.018 4.32 0.000 0.078 0.018 4.32 0.000 H4
ERS Midpoint -0.117 0.029 -4.09 0.000 -0.117 0.029 -4.09 0.000 H5
MR Midpoint -0.703 0.081 -8.71 0.000 -1.132 0.093 -12.11 0.000 H6
NARS Gradations 0.017 0.019 0.91 0.183 0.017 0.019 0.91 0.183
ERS Gradations -0.242 0.044 -5.47 0.000 -0.097 0.038 -2.54 0.006 H7
MR Gradations 0.134 0.074 1.82 0.035 -0.090 0.077 -1.16 0.123
NARS Midpoint x gradations -0.012 0.038 -0.31 0.378 -0.012 0.038 -0.31 0.378
ERS Midpoint x gradations 0.133 0.062 2.16 0.016 0.133 0.062 2.16 0.016 H11
MR Midpoint x gradations 0.295 0.125 2.37 0.009 0.295 0.125 2.37 0.009 H12
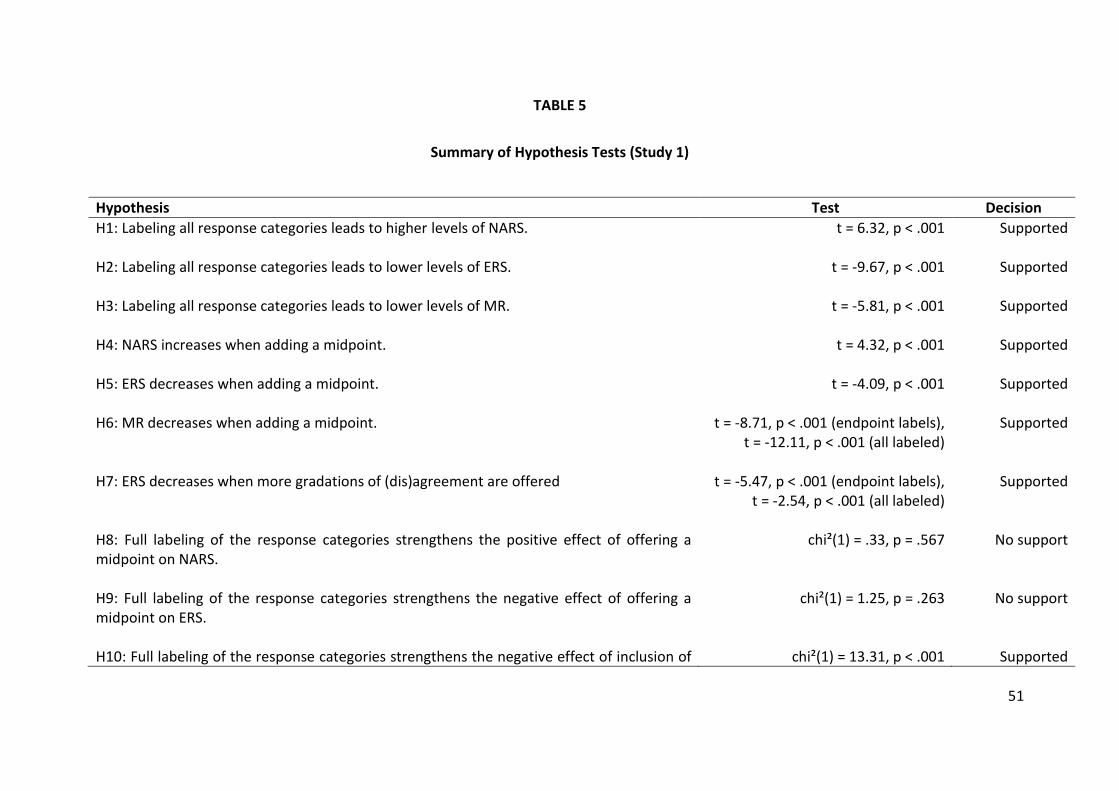
51
TABLE 5
Summary of Hypothesis Tests (Study 1)
Hypothesis Test Decision
H1: Labeling all response categories leads to higher levels of NARS.
t = 6.32, p < .001 Supported
H2: Labeling all response categories leads to lower levels of ERS.
t = -9.67, p < .001 Supported
H3: Labeling all response categories leads to lower levels of MR.
t = -5.81, p < .001 Supported
H4: NARS increases when adding a midpoint.
t = 4.32, p < .001 Supported
H5: ERS decreases when adding a midpoint.
t = -4.09, p < .001 Supported
H6: MR decreases when adding a midpoint. t = -8.71, p < .001 (endpoint labels), t = -12.11, p < .001 (all labeled)
Supported
H7: ERS decreases when more gradations of (dis)agreement are offered t = -5.47, p < .001 (endpoint labels), t = -2.54, p < .001 (all labeled)
Supported
H8: Full labeling of the response categories strengthens the positive effect of offering a midpoint on NARS.
chi²(1) = .33, p = .567 No support
H9: Full labeling of the response categories strengthens the negative effect of offering a midpoint on ERS.
chi²(1) = 1.25, p = .263 No support
H10: Full labeling of the response categories strengthens the negative effect of inclusion of chi²(1) = 13.31, p < .001 Supported
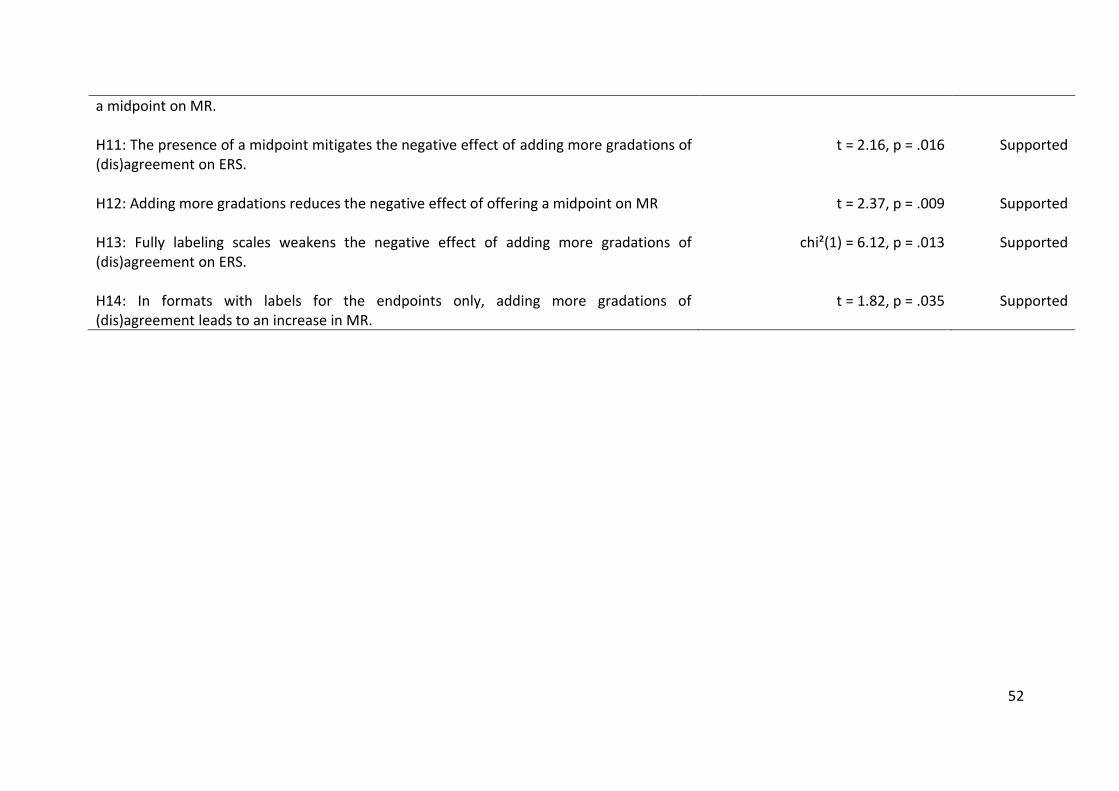
52
a midpoint on MR. H11: The presence of a midpoint mitigates the negative effect of adding more gradations of (dis)agreement on ERS.
t = 2.16, p = .016 Supported
H12: Adding more gradations reduces the negative effect of offering a midpoint on MR
t = 2.37, p = .009 Supported
H13: Fully labeling scales weakens the negative effect of adding more gradations of (dis)agreement on ERS.
chi²(1) = 6.12, p = .013 Supported
H14: In formats with labels for the endpoints only, adding more gradations of (dis)agreement leads to an increase in MR.
t = 1.82, p = .035 Supported
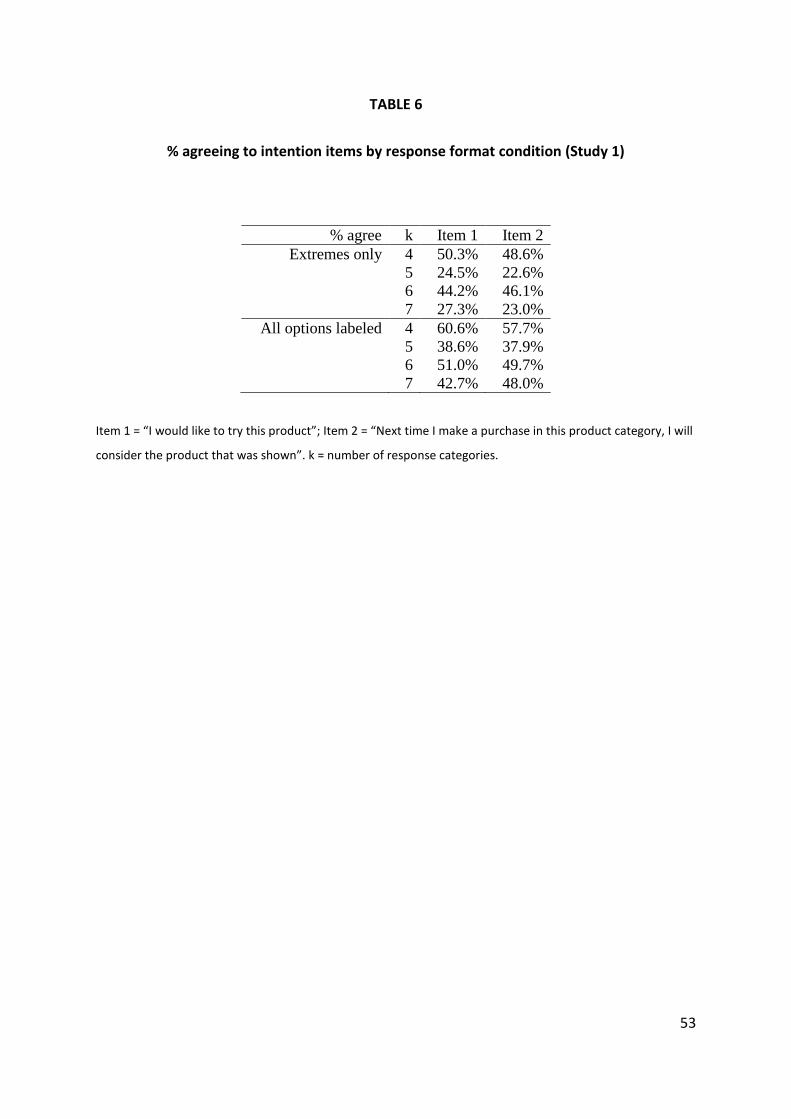
53
TABLE 6
% agreeing to intention items by response format condition (Study 1)
% agree k Item 1 Item 2
Extremes only 4 50.3% 48.6%
5 24.5% 22.6%
6 44.2% 46.1%
7 27.3% 23.0%
All options labeled 4 60.6% 57.7%
5 38.6% 37.9%
6 51.0% 49.7%
7 42.7% 48.0%
Item 1 = “I would like to try this product”; Item 2 = “Next time I make a purchase in this product category, I will
consider the product that was shown”. k = number of response categories.

54
TABLE 7
Chi² test for Intention measures by experimental condition (Study 1)
Total effect Main effects
Conditions Labeling Midpoint Gradations
df 7 1 1 1
Item 1 chi² 61.727 13.902 39.55 0.381
p 0.000 0.000 0.000 0.537
Item 2 chi² 69.311 18.537 36.889 0.035
p 0.000 0.000 0.000 0.852
Average chi² 65.52 16.22 38.22 0.21
p 0.000 0.000 0.000 0.648
Item 1 = “I would like to try this product”; Item 2 = “Next time I make a purchase in this product category, I will
consider the product that was shown”. k = number of response categories.
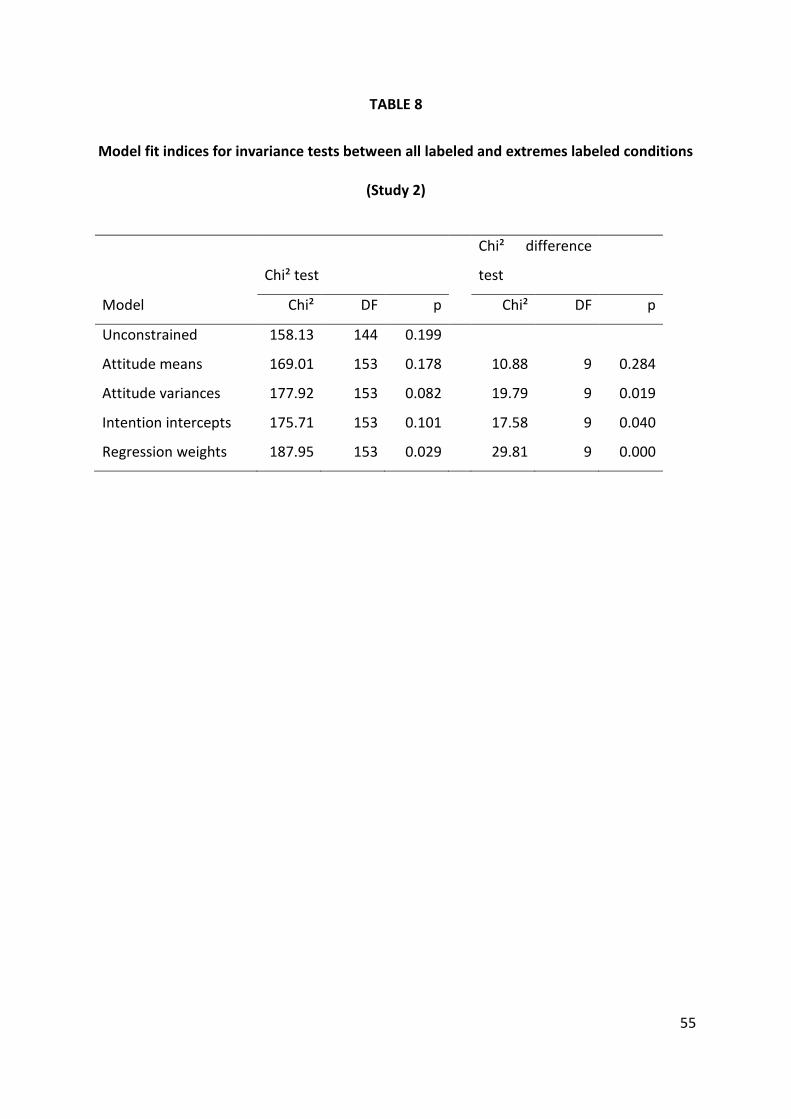
55
TABLE 8
Model fit indices for invariance tests between all labeled and extremes labeled conditions
(Study 2)
Chi² test
Chi² difference
test
Model Chi² DF p Chi² DF p
Unconstrained 158.13 144 0.199
Attitude means 169.01 153 0.178 10.88 9 0.284
Attitude variances 177.92 153 0.082 19.79 9 0.019
Intention intercepts 175.71 153 0.101 17.58 9 0.040
Regression weights 187.95 153 0.029 29.81 9 0.000
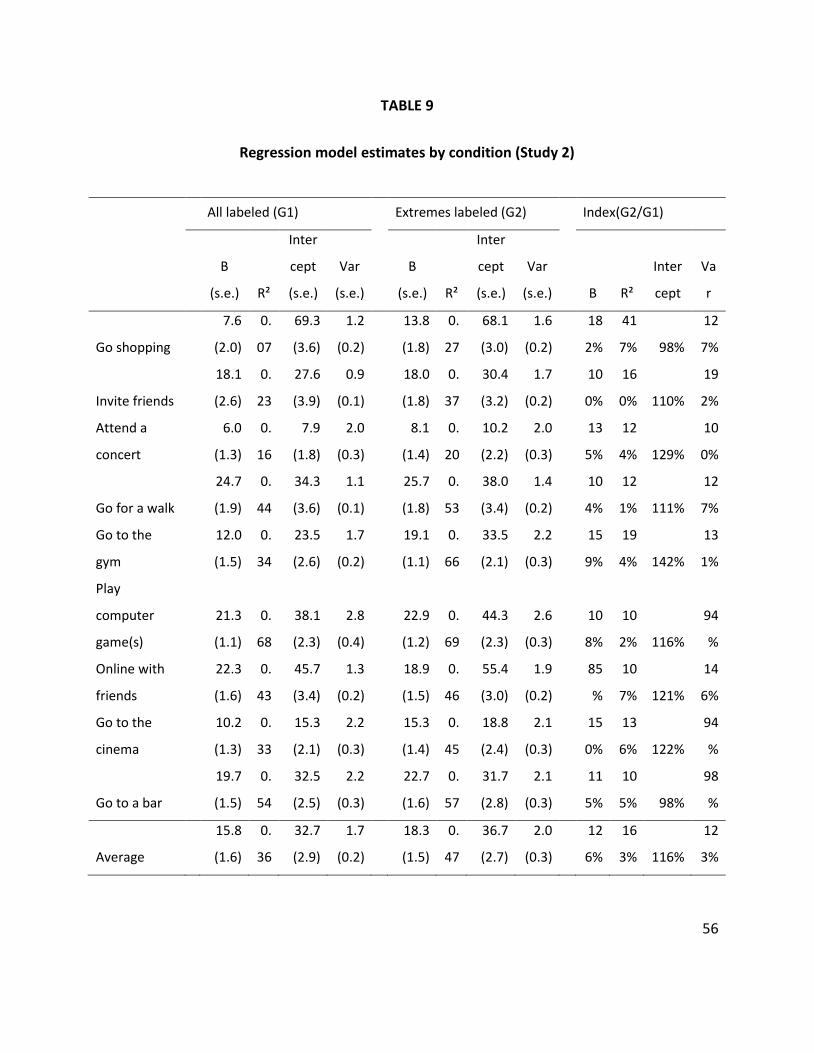
56
TABLE 9
Regression model estimates by condition (Study 2)
All labeled (G1) Extremes labeled (G2) Index(G2/G1)
B
(s.e.) R²
Inter
cept
(s.e.)
Var
(s.e.)
B
(s.e.) R²
Inter
cept
(s.e.)
Var
(s.e.) B R²
Inter
cept
Va
r
Go shopping
7.6
(2.0)
0.
07
69.3
(3.6)
1.2
(0.2)
13.8
(1.8)
0.
27
68.1
(3.0)
1.6
(0.2)
18
2%
41
7% 98%
12
7%
Invite friends
18.1
(2.6)
0.
23
27.6
(3.9)
0.9
(0.1)
18.0
(1.8)
0.
37
30.4
(3.2)
1.7
(0.2)
10
0%
16
0% 110%
19
2%
Attend a
concert
6.0
(1.3)
0.
16
7.9
(1.8)
2.0
(0.3)
8.1
(1.4)
0.
20
10.2
(2.2)
2.0
(0.3)
13
5%
12
4% 129%
10
0%
Go for a walk
24.7
(1.9)
0.
44
34.3
(3.6)
1.1
(0.1)
25.7
(1.8)
0.
53
38.0
(3.4)
1.4
(0.2)
10
4%
12
1% 111%
12
7%
Go to the
gym
12.0
(1.5)
0.
34
23.5
(2.6)
1.7
(0.2)
19.1
(1.1)
0.
66
33.5
(2.1)
2.2
(0.3)
15
9%
19
4% 142%
13
1%
Play
computer
game(s)
21.3
(1.1)
0.
68
38.1
(2.3)
2.8
(0.4)
22.9
(1.2)
0.
69
44.3
(2.3)
2.6
(0.3)
10
8%
10
2% 116%
94
%
Online with
friends
22.3
(1.6)
0.
43
45.7
(3.4)
1.3
(0.2)
18.9
(1.5)
0.
46
55.4
(3.0)
1.9
(0.2)
85
%
10
7% 121%
14
6%
Go to the
cinema
10.2
(1.3)
0.
33
15.3
(2.1)
2.2
(0.3)
15.3
(1.4)
0.
45
18.8
(2.4)
2.1
(0.3)
15
0%
13
6% 122%
94
%
Go to a bar
19.7
(1.5)
0.
54
32.5
(2.5)
2.2
(0.3)
22.7
(1.6)
0.
57
31.7
(2.8)
2.1
(0.3)
11
5%
10
5% 98%
98
%
Average
15.8
(1.6)
0.
36
32.7
(2.9)
1.7
(0.2)
18.3
(1.5)
0.
47
36.7
(2.7)
2.0
(0.3)
12
6%
16
3% 116%
12
3%