the effect of representations on difficulty perception and
TRANSCRIPT

Themes in Science & Technology Education, 6(2), 91-108, 2013
The effect of representations on difficulty perception and learning of the physical concept of pressure
David M. J. Corradi1, Christophe De Jaegher1, Norma A. Juarez-Collazo1, Jan Elen1, Geraldine Clarebout2
[email protected], [email protected],
[email protected], [email protected], [email protected]
1 Centre for Instructional Psychology and Technology, Faculty of Education and Psychology, KU
Leuven 2 Centre for Medical Education, Faculty of Medicine, KU Leuven
Abstract. Previous research indicates that when learners divide their attention over different sources of information (representations), learners perceive the information as more difficult and have a harder time increasing their understanding. This can be overcome by integrating representations. In this research, using 85 participants, we hypothesized that integrated representations of physics would be perceived as less difficult. Repeated measures MANOVA showed a significant interaction effect between results on the learning tasks and the perceived difficulty questionnaire. Results are discussed in the context of the performance evaluation effect that can occur in more ecologically valid settings.
Keywords: multiple representations; integration, difficulty perception, ecological setting, physics education
Introduction
Nature of the instructional design
In this research, we want to assess the effects of instructional or message design on perception of difficulty and learning results in the domain of physics. Both learning results and perception of difficulty are important indicators of the effectiveness of instructional design (Merrill, 1994). Previous research shows that the ease with which instructional material can be understood depends, amongst other factors, on the way information is presented (Marcus, Cooper, & Sweller, 1996). Learning results can be positively influenced by presenting the information in a way that is compatible with the goal of instruction (Brünken, Plass, & Leutner, 2003; Cook, 2006), which in this article consists of conceptual understanding.
Achieving conceptual understanding is a process where mental representations are constructed (Cook, 2006; Schnotz et al., 2010; Schnotz & Bannert, 2003). Mental or internal representations are constructed through external representations, which are abstract objects that stand for a certain type and amount of information, like a formula or a schema (de Jong et al., 1999; Schnotz et al., 2010). External representations can therefore help to model reality and can be used to communicate complex concepts such as force and pressure (Cheng & Gilbert, 2007; Cook, 2006; Schnotz et al., 2010).
To achieve conceptual understanding, learners require instructional material that presents the concept fully, through multiple external representations (Cook, 2006; de Jong et al., 2010; Larkin & Simon, 1987; van der Meij & de Jong, 2006). This is important because students who receive the information in the form of multiple representations tend to increase their
92 D.M.J. Corradi, C. De Jaegher, N.A. Juarez-Collazo, J.Elen, G.Clarebout
understanding of concepts in physics (Kohl, Rosengrant & Finkelstein, 2007; Rosengrant, Van Heuvelen & Etkina, 2008; van der Meij, 2007). Therefore, representations are crucial in achieving conceptual understanding of scientific concepts (e.g., Kozma, 2003).
Using multiple representations to construct a deep understanding of the content implies that learners need to understand each representation on its own (Ainsworth, 1999; van der Meij & de Jong, 2003). Furthermore, learners need to translate between those representations, which means recognizing overlapping elements in multiple representations (Ainsworth, 1999, 2008; Cheng & Gilbert, 2007; Chittleborough & Treagust, 2008; Cook, 2006; van der Meij & de Jong, 2006).
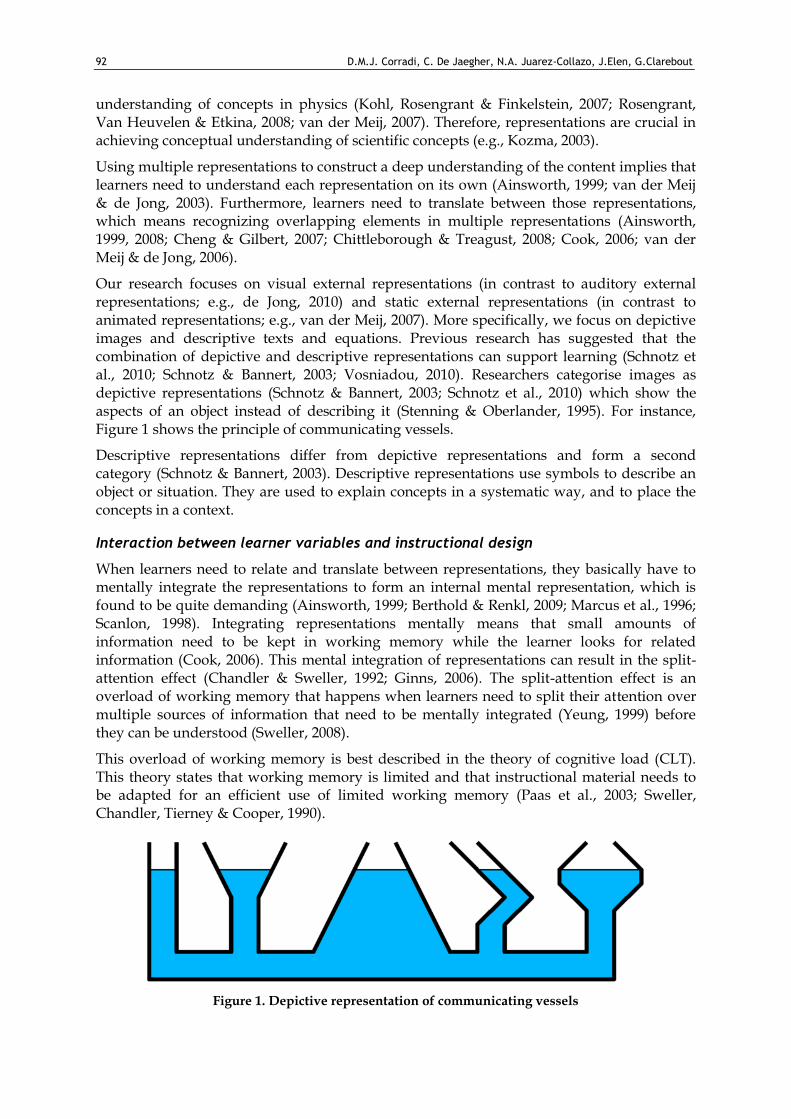
Our research focuses on visual external representations (in contrast to auditory external representations; e.g., de Jong, 2010) and static external representations (in contrast to animated representations; e.g., van der Meij, 2007). More specifically, we focus on depictive images and descriptive texts and equations. Previous research has suggested that the combination of depictive and descriptive representations can support learning (Schnotz et al., 2010; Schnotz & Bannert, 2003; Vosniadou, 2010). Researchers categorise images as depictive representations (Schnotz & Bannert, 2003; Schnotz et al., 2010) which show the aspects of an object instead of describing it (Stenning & Oberlander, 1995). For instance, Figure 1 shows the principle of communicating vessels.
Descriptive representations differ from depictive representations and form a second category (Schnotz & Bannert, 2003). Descriptive representations use symbols to describe an object or situation. They are used to explain concepts in a systematic way, and to place the concepts in a context.
Interaction between learner variables and instructional design
When learners need to relate and translate between representations, they basically have to mentally integrate the representations to form an internal mental representation, which is found to be quite demanding (Ainsworth, 1999; Berthold & Renkl, 2009; Marcus et al., 1996; Scanlon, 1998). Integrating representations mentally means that small amounts of information need to be kept in working memory while the learner looks for related information (Cook, 2006). This mental integration of representations can result in the split-attention effect (Chandler & Sweller, 1992; Ginns, 2006). The split-attention effect is an overload of working memory that happens when learners need to split their attention over multiple sources of information that need to be mentally integrated (Yeung, 1999) before they can be understood (Sweller, 2008).
This overload of working memory is best described in the theory of cognitive load (CLT). This theory states that working memory is limited and that instructional material needs to be adapted for an efficient use of limited working memory (Paas et al., 2003; Sweller, Chandler, Tierney & Cooper, 1990).
Figure 1. Depictive representation of communicating vessels

The effect of representations on difficulty perception and learning of the concept of pressure 93
The cognitive load theory describes different kinds of cognitive load. Intrinsic cognitive load is influenced by the learning content and the prior knowledge of the learner. A high intrinsic cognitive load is positively correlated with learning gains. Extraneous cognitive load, on the other hand, is load caused by the instructional material, but which does not contribute to the learners’ increase in understanding (de Jong, 2010; Cierniak, Scheiter & Gerjets, 2009). Some mention a third type of cognitive load (germane). This load is caused by the learning process itself, but there is little research to support this type of load (e.g., de Jong, 2010). The theory of cognitive load states that one should avoid extraneous cognitive load as much as possible to support learning (Schnotz & Kürschner, 2007).
To avoid a split-attention effect, and thus extraneous cognitive load, one can adapt the format of the instructional material by integrating the representations (Brünken et al., 2003; Schnotz, 2002). Van der Meij (2007) describes this physical integration of multiple external representations as placing the corresponding elements close to each other (van der Meij & de Jong, 2003). Figures 2 to 6 illustrate how this was done in our study. Representations keep their initial nature (representations are not made into one single representation) but informational equivalent parts are placed closer to each other. Figure 2, for example, shows that explanative text is placed closer to the parts of the hydraulic pump it is explaining. This is in contrast to Figure 3, where the explanative text is found below the picture.
Several authors have researched the effects of physical integration on both learning results and cognitive load (Bodemer et al., 2004; Chandler & Sweller, 1992; Cierniak et al., 2009; Cook, 2006; Ginns, 2006; Kolloffel et al., 2009; van der Meij & de Jong, 2003). Chandler and Sweller (1991; 1992) found that physical integration, amongst other factors, can have a positive effect on learning, with the combination of descriptive and depictive representations. Here, they found that integration reduces visual search and extraneous cognitive load. This opens up more cognitive sources for actual learning (Cierniak et al., 2009). Different authors have found empirical support for these claims (Bodemer et al., 2004; Cierniak et al., 2009; Cook, 2006; Ginns, 2006; Stylianidou, 2002; van der Meij & de Jong, 2003). Kolloffel et al. (2009), for example, found a perceived decrease in extraneous cognitive load when physical integration of two representations took place in the domain of probability education with equations and text. It is usually concluded that physical integration can be a support in learning and problem solving situations (Ainsworth, 1999; 2006).
Kolloffel et al. (2009) also found that not all combinations of integrated representations can be used successfully. The combination of diagrams and equations reduced cognitive load, but did not improve learning results (Kolloffel et al., 2009). Cierniak et al. (2009) also found no difference between cognitive load of learners that received a non-integrated format and those that did. Mayer and Gallini (1990) found that integrating explanative texts with representations of pressure pump systems helped high prior knowledge level learners achieve conceptual understanding, but not low prior knowledge level learners. This indicates that there is no consensus on the reasons why integration of representations works or does not work.
Moreover, the concept of cognitive load is also questioned for its validity. Theoretical papers question especially the measuring instruments (de Jong, 2010; Schnotz & Kürschner, 2007). For example, Schnotz and Kürschner (2007) and Yeung (1999) found that the described methods to measure cognitive load cannot distinguish between the different kinds of cognitive load. Therefore, the question remains what the precise impact is of integration on both the increase in understanding of concepts in physics and the mental effort of the learners which they experience when they receive integrated representations.

94 D.M.J. Corradi, C. De Jaegher, N.A. Juarez-Collazo, J.Elen, G.Clarebout
One way to measure mental effort is through perception of difficulty. This is the level with which a task is perceived as difficult or complex (Bratfish, 1972). Brünken et al. (2003) have found that there is a high correlation between measures of extraneous cognitive load and the perceived difficulty of the instructional material. Furthermore, there has also been a negative correlation between perceived difficulty and learning results (Brünken et al., 2003; Schunk, 1985). This implies that perceived difficulty does not measure intrinsic cognitive load since intrinsic cognitive load is the load that helps to increase understanding (e.g., Chandler & Sweller, 1991). One factor that positively influenced perception of difficulty is the number of informational elements in the instructional material (e.g., images, text blocks) (Bratfisch, 1972), which, as some empirical results indicate, can be decreased by physically integrating representations (Sweller, 1994; Sweller et al., 1990).
Yet, as far as we know, no research has tried to understand whether physically integrating representations for complex tasks in the domain of physics would decrease perceived difficulty and increase learning gains. Understanding how physically integrating Multiple External Representations (MER) influences difficulty perception and learning is crucial both for instructional designers and for teachers attempting to teach complex scientific concepts.
Furthermore, previous research is focused on representational and multimedia learning research that is often performed in a laboratory context, with learning tasks that are sometimes irrelevant for the participants (e.g., de Jong, 2010; Harskamp, Mayer & Suhre, 2007). Even though laboratory research can unravel the psychological mechanism behind learning with representations, it remains unclear how these mechanisms take place in an ecologically valid setting, and with learning materials that are relevant for the learners by their match with the curriculum.
Research Questions and Hypotheses
From the literature on integrating scientific representations, two main questions arise. First of all, it remains unclear whether or not integrating MER is helpful for understanding and solving problems of physical concepts, for learners in a classroom setting with curriculum-adjusted tasks. Our study tries to answer the following research question:
RQ1: Does the integration of multiple static representations have an effect on a) the perception of difficulty, and b) learning results, when learning the complex concept of pressure?
Our prediction for the first part of the research question is based on results of the studies by van der Meij (2007) and van der Meij and de Jong (2003). We are expecting for hypothesis 1 that learners will perceive physically integrated instructional material as significantly less difficult than non-integrated material. Hypothesis 2 answers the second part of the research question, where we also expect learners to demonstrate significantly more understanding of the information communicated through the physically integrated representations than through the non-integrated material. Finally, as studies show both concepts are interrelated (e.g., Brünken et al., 2003), hypothesis 3 expects a positive interaction effect between perception of difficulty and learning results: the increase in difficulty will decrease understanding.
As previous studies on instructional design of scientific concepts show, the effects of integration can be influenced specifically by the type of representations that are being integrated: some combinations do not have an effect (van der Meij & de Jong, 2006) while others do (Kolloffel et al., 2009). Our study attempts to answer the second research question:

The effect of representations on difficulty perception and learning of the concept of pressure 95
RQ2: Does the representational combination influence the perception of difficulty and the learning results?
We used three representational types to communicate the concept of pressure, namely small explanatory texts, equations and images. Following the results of Kolloffel et al. (2009) in the domain of statistics, hypothesis 4 states that when images and equations are presented in an integrated fashion, learners will score the lowest on perceived difficulty compared with other types of combinations (i.e., text + equations, text + images). Hypothesis 5 follows van der Meij and de Jong (2003) and predicts that there won’t be a significant difference between the different combinations of integrated representation on the results of the learning tasks.
Method
Participants
Participants were 85 high school students ranging between 15 and 17 years old from two Flemish high schools. 56% of the participants were female. None of the students had hard science as a major (majors were economy, human science or Latin).
Design and Material
To test for both the hypothesized main effects and interaction effects, we used a repeated measures design. To avoid an experimental effect, learners were tested in their traditional classrooms by their physics teacher, using a type of learning task and type of questions they were used to filling in. All tasks fitted into the curriculum of the participants. Conditions of the experiment are detailed in Table 1. All information was adapted from a physics textbook (Carpreau et al., 2007) and was constructed by a physics teacher. For content validity of the tasks and questions, three external specialists in physics independently quoted each question ranging it from 1 to 3 (1 being inappropriate). Inappropriate questions were excluded from the tasks.
Learners first received a starting task (task 1). This was a short test to measure prior understanding of the subject and can be found in the appendix. All participants had already received a course on the general formula of pressure (p = F/A) during previous classes. Participants were taught the principle of Pascal which states that “pressure exerted anywhere in a confined incompressible fluid is transmitted equally in all directions throughout the fluid such that the pressure ratio (initial difference) remains the same” (Bloomfield, 2006, p. 153). We measured in task 1 how well they knew this principle and results indicate that they had a good understanding of this since on a maximum of 4 points learners had an average of 3.46 (SD = 0.749). Task 1 did not involve a specific learning activity.
Table 1. Overview of all conditions type of physical integration of each task
Groups n Task 2 Task 3
Group 1 22 No integration No integration
Group 2 21 image + text image + text
Group 3 20 No integration image + equation
Group 4 22 image + text text + equation

96 D.M.J. Corradi, C. De Jaegher, N.A. Juarez-Collazo, J.Elen, G.Clarebout
For task 2 learners received either a task where none of the representations were physically integrated or a task where images and text were integrated. For the second learning task, participants had to study the mechanism of the hydraulic press by using the explanation from two different representations: a depictive scheme and a descriptive text. Figures 2 and 3 depict the two conditions in detail. Translation of the left part of Figure 2 goes as follows (same text is used in Figure 3): When the little pump with surface A1 moves up, valve K1 is opened (K2 remains closed), causing the fluid to be sucked out of the reservoir to a space between the valves. Translation of the right part: When the little pump is pressed down, valve K2 is opened causing the water to move to the basin under surface A2. This action is constantly repeated.
Learners needed to answer three questions to indicate their understanding of the represented information, and these can be found in the appendix. The hydraulic press was a novel application of pressure on fluid for the learners as it was not shown in previous classes.
Figure 2. Learning Task 2. Integration of text and images.
Figure 3. Learning Task 2. Text and images are shown separately.

The effect of representations on difficulty perception and learning of the concept of pressure 97
The third learning task focused on understanding the underlying theoretical principle of the hydraulic press. Here, learners used an explanation composed of three parts, namely: a depictive scheme, a descriptive text and a descriptive equation. Learners in group 1 received no integrated representations, as Figure 4 shows. In group 2, learners received integrated images and text (Figure 5). Equations were shown separately below the image. Group 3 received images and equations. Text is presented separately (Figure 6). Group 4 received integrated text with equations, but images were presented separately (Figure 7). The text of figures 4 to 7 reads: A small force F1 is exerted on a small array A1. The resulting pressure is equal throughout the fluid. A larger force F2 is exerted on a large array A2
Figure 4. Learning task 3 (group 1): images, text and equations are shown separately
Figure 5. Learning task 3 (group 2): images and text are presented integrated and the equations are shown separately

98 D.M.J. Corradi, C. De Jaegher, N.A. Juarez-Collazo, J.Elen, G.Clarebout
Figure 6. Learning task 3 (group 3): images and equations are presented integrated and text is shown separately
Figure 7. Learning task 3 (group 4). Images are presented separately while text and equations are integrated
Instruments
Instead of the cognitive load questionnaires that only use one question (de Jong, 2010), we used Robinson’s (2001) difficulty perception questionnaire. Robinson (2001) defines difficulty perception as a multi-faceted construct. Perception of difficulty is measured by five criteria: general perception of difficulty, stress, expected performance on the task, interest in the content, and motivation. Each question is measured on a 9 point Likert-scale, with 1 being “strongly disagree” and 9 being “strongly agree”. Robinson (2001) found that the test seems to correlate with a number of other difficulty measures, which indicates a good construct validity of the instrument.
Procedure
Each trial took place in the classroom of the student, during students’ usual classroom hours. The study took place during the learners’ class of physics and was conducted in one

The effect of representations on difficulty perception and learning of the concept of pressure 99
session. The session took about 25 minutes. Participants were randomly divided into one of the four groups. This was done as participants were entering the room. They had to take a number and sit at the appropriate desk. Tasks and tests were paper and pencil tests. Participants received a short explanation about the tasks. Total time for all the tasks was 25 minutes, but most learners completed the test before this time. Participants did not receive a reward for participating. The learning tasks were part of the participants’ curriculum of physics. Tasks were given sequentially, one directly following the other, and after each learning task participants filled in the perceived difficulty questionnaire. Participants were only given the questionnaire to fill in after they finished the learning tasks.
Data Analysis
To answer the first research question – namely, whether learners perceive, process and understand scientific information differently depending on the way the information is presented – we used repeated measures MANOVA. Learning results and perceived difficutly results were used as within-subject variables.
To answer the second research question – namely, whether a specific combination of representations influences learning or difficulty perception – we used (M)ANCOVA. To control for prior understanding, task 1 was used as covariate.
We used Cronbach’s alfa to measure the tests’ reliability for task 1, 2 and 3, which was .70 for task 1, .78 for task 2 and .77 for task 3. In line with Nunnally (1978) an alfa value of .70 was considered as representing good internal consistency. Inter-correlations in Table 2 indicate that most constructs seem to correlate quite strongly. Only interest does not seem to correlate in the first and second task with stress or general difficulty.
Table 2. Inter-correlations between constructs from the perceived difficulty instrument per task
Perceived difficulty questionnaire
Task 1 General Difficulty
Stress Exp. performance Interest Motivation
General difficulty 1 .524** -.548** -.02 -.346**
Stress 1 -.334** .115 -.13
Exp. Performance 1 .044 -.286*
Interest 1 .295*
Task 2
General difficulty 1 .386** -.508** -.279* -.558**
Stress 1 -.454** -.141 -.364**
Exp. Performance 1 .387** .526**
Interest 1 .521**
Task 3
General difficulty 1 .228* -.371* -.035 -.416*
Stress 1 -.471** -.282* -.489**
Exp. Performance 1 .449** .643**
Interest 1 .661**
* p<.05; ** p<.001

100 D.M.J. Corradi, C. De Jaegher, N.A. Juarez-Collazo, J.Elen, G.Clarebout
Results
Descriptive statistics
Correlations between results on the learning tasks and the questionnaire show that task score is negatively correlated with perceived general difficulty (for task 1 and 2) and perceived levels of stress (for task 2). Expected performance, interest and motivation are positively correlated for task 1 and 2. Task 3 only correlates with interest in the content (see Table 3). The maximum score for each task was 4. The average score for task 1 was 3.46 (SD = 0.749). Learning results for task 2 and 3 for each condition is put in Table 4. Learning results decrease with each complex task.
Research Questions
We predicted that there would be a significant main effect of difficulty perception (hypothesis 1), a main effect of learning gains (hypothesis 2), and an interaction effect of learning gains and difficulty perception (hypothesis 3) caused by the different design conditions. We used difficulty perception results and scores on the learning tasks as within-subject variables in a repeated measures MANOVA. We found an overall decrease of learning scores with each task F(2, 168) = 4.39, p = .014, etap² = .05. While scores on the first item (general difficulty) and the second item (stress) increases significantly with each task, F(4, 81) = 18.6, p = .000, etap² = .48, scores on expected performance, interest and motivation decreased significantly. This was, however, not influenced by design.
A repeated measures MANOVA, using responses on the questionnaire and the scores on the learning tasks as dependent (within-subject) variables, found a significant interaction effect, F(10, 75) = 22.35, p = .000, etap² = .75. This means that scores on the learning tasks are found to be influenced by the perception of difficulty, and effect size indicates that this relationship is very strong.
As repeated measures did not find an impact of design, we tested whether there would be a specific impact of a type of design. We performed a MANCOVA, using responses on the difficulty questionnaire as dependent variables, the design variables (integration vs. no integration) as independent and the results on task 1, perception of the domain, as covariate, and found no significant differences for any of the measures, as Table 5 details.
Table 3. Correlations between results on tasks and responses on the questionnaire measuring task difficulty
Tasks Perceived difficulty
General Difficulty Stress Expected performance Interest Motivation
Task 1 -.26* -.14 .33* .23* .24*
Task 2 -.36** -.24* .39** .23* .40**
Task 3 -.04 -.07 .19 .25* .16 * p<.05; ** p<.001
Table 4. Learning results for task 2 and 3
Group n Task 2 Task 3
Mean SD Mean SD
1 22 2.36 .9 2.23 1.23
2 21 3.00 .9 2.10 1.22
3 20 2.65 1.1 2.15 0.88
4 22 3.14 .9 2,32 1,13

The effect of representations on difficulty perception and learning of the concept of pressure 101
Table 5. MANCOVA scores for difficulty variables for the second task (df = 3.76)
Difficulty variables F p η²p
General difficulty .001 .976 .000
Stress .534 .467 .007
Expected performance .832 .365 .011
Interest 2.497 .118 .031
Motivation 1.313 .255 .017
Table 6. MANCOVA scores for difficulty variables for the third task (df = 3.76)
Difficulty variables F p eta²p
General difficulty .339 .797 .013
Stress 1.374 .257 .051
Expected performance 1.087 .360 .041
Interest .554 .647 .021
Motivation .651 .585 .025
A similar ANCOVA with learning results on the second task as dependent, design variable (integration vs. no integration) as independent and results on the first task as covariate also found no significant difference F(1, 82) = .091, p = .763, etap² = .001. Levene’s test found no significant differences between variances. Effect size was quite low, which implies that design had no influence whatsoever on either perception or task scores.
Hypothesis 4 predicted that perception of difficulty is lower when schemes and equations are displayed as integrated. Hypothesis 5 stated that the type of integration will not affect the learning results.
To see what precisely influenced the results of the third learning task, we performed a MANCOVA, using responses on the questionnaire as dependent variables, the design variable (no integration; images + text; images + equations; text + equations) as independent and perception of the domain (measured in task 1) as covariates, and found no significant differences for any of the measures, as Table 6 shows. A similar ANCOVA with learning results on the third task as dependent, design variables (integration vs. no integration) as independents. Results on the first task as covariates also found no significant difference F(3, 80) = .124, p = .946, etap² = .005. Levene’s test found no significant difference between variances. Effect sizes are – again – quite low, which results in the same conclusion as with task two, namely that design had no influence whatsoever on either perception or task scores. While perception of difficulty increased, at the same time, learning scores decreased. On average, learners scored the highest on the first task, which they also found the easiest.
Discussion
This research focused on the effect of physically integrated representations on perception of difficulty and learning results. Based on our results we can say that neither physical integration nor type of integration had any effect on perception of difficulty or learning results. We, therefore, refute hypothesis one, namely: learners perceive physically integrated instructional material as significantly more difficult than non-integrated material. We also

102 D.M.J. Corradi, C. De Jaegher, N.A. Juarez-Collazo, J.Elen, G.Clarebout
refute hypothesis two – that we should expect learners to demonstrate significantly more understanding of the information communicated through the physically integrated representations than through the non-integrated material – and hypothesis four – that when images and equations are combined, learners will score the lowest on perceived difficulty compared with other combinations of representations.
We did, however, find support for hypothesis three, where we predicted a positive interaction effect between perception of difficulty and learning results. The level of experience with the new content seemed to define how learners perceived and performed on the tasks rather than the design of the learning environment. This seems to confirm previous research that physical integration does not necessarily lead to significantly better learning gains (e.g., Cierniak et al., 2009; van der Meij & de Jong, 2003). Hypothesis five was also confirmed as there was no significant difference between the different combinations of integrated representation on the learning results. This is partly in accordance with Kolloffel et al. (2009) who did not find an influence of integration on learning results.
It also seems that the score on the learning task resulted in a feedback mechanism that affected the perception, rather than the other way around. Learners’ experience with the task influenced task difficulty, as indicated by the expected performance measure, which probably also enhanced the final result. The repeated measures results – the main effect of learning scores and difficulty perception - indicate that perception of difficulty is influenced by a number of novel elements compared with elements presented in previous science classes, such as new symbols or equations and new depictions, rather than the physical integration of these elements. This feedback mechanism might have been amplified by the classroom environment where participants knew each other, and this might have caused a performance evaluation effect (Pintrich & Schunk, 2002; Schunk, 2008). A performance evaluation effect can cause low grades to have quite a negative effect on motivation and performance expectation in a public setting. Moreover, those who receive low grades and who are conscious about their bad performance (as indicated by the expected performance measure) may not be motivated to improve (as indicated by the motivation measure) (Schunk, 2008). Both the high negative correlations between task scores and difficulty measures (especially for task 2) and also the quite strong interaction effect are indications of this effect. It is possible that this effect overpowered the effect of the (non-)integrated design. Since the performance evaluation effect has less chance of occurring in a laboratory setting, where the content of the intervention is less relevant for learners or where participants do not know each other or do not meet each other, it could very well be possible that in such a laboratory setting learners could be more sensitive to the design compared with our ecological setting.
Furthermore, it might also be that the difference between the non-integrated design and the integrated design was not big enough to measure a difference. This would mean that to measure accurately a split-attention effect with integrated and non-integrated physics representations in a classroom, one would need to place the non-integrated representations much farther from each other. In a practical situation, instructional designers or teachers should therefore not worry about a split-attention effect or an increase in perception of difficulty when presenting the information as we did (see appendix).
The significant increase in difficulty of the tasks might have discouraged the participants from exploring the learning task more deeply. We assume that this is caused by the number of novel elements in the learning tasks (Bratfisch, 1972; Marcus et al., 1996), rather than whether those elements were integrated or not. We noticed that the learning results on task 2 and 3 are significantly lower than on task 1 (pre-test), where we tested information that they already knew, so it is possible that the difference between the first task and the

The effect of representations on difficulty perception and learning of the concept of pressure 103
consecutive tasks was too big. Using three complex learning tasks – and the last two had lots of unfamiliar elements for the learners – might have created an impetus that hindered achievement. In terms of the conceptual model of Ainsworth (e.g., 2006), as mentioned in the introduction, learners have to understand each representation on its own, but also link and translate between these representations. Based on our results, we assume here that learners found understanding single representations, their specific depictions and descriptions, already quite challenging and were not influenced by the proximity or organisation of other representational formats.
These results might be generalisable to other domains of science education: as learners often receive tasks to perform during or after classes, high levels of difficulty might incline learners to feel demotivated when new elements are presented. Rather than the organisation of the representations, this could be partly influenced by the social context in which learners study.
Lastly, by using Robinson’s (2001) multi-faceted construct for perception of difficulty, we have a broader view of what influences the perception of difficulty. Indeed, now we know that general perception of difficulty is closely intertwined with expected performance, stress and motivation, and in some cases even interest in the content. Indeed, students can be quite demotivated, highly stressed and pessimistic about their results when set tasks that they themselves perceive to be difficult. We also know that interest in physics can be influenced by task difficulty, but this not necessarily the case.
Conclusion
The most significant finding is that design has no impact on perceived difficulty and task scores. To help learners learn efficiently, we propose – based upon the repeated measures results – that tasks are closely tied to the level of the learner (Schnotz & Kürschner, 2007) because a sudden increase in perceived difficulty seems to impact negatively learning behaviour. Task difficulty seems to decrease motivation, performance expectation, and sometimes content interest. Furthermore, it increases the stress of the learners and the general perception of difficulty. The study is limited by the fact that it focussed on a single topic of physics. Further research in an ecologically valid setting might decipher the precise dynamics of representational learning and representational design in the domain of physics and other scientific domains. As some reviewers correctly indicated, it might very well be true that in other situations physically integrating can be effective caused by other subtle stimuli (as opposed to the the performance evaluation effect proposed here).
As previous research finds advantages of integration of representations because it diminishes cognitive load (e.g., Bodemer et al., 2004; Chandler & Sweller, 1991; Cierniak et al., 2009; Ginns, 2006), our results suggest that in an ecological setting like a classroom, other contextual variables, such as performance evaluation, might impact upon representational learning more than design.
References
Ainsworth, S. (1999). The functions of multiple representations. Computers & Education, 33, 131-152. Ainsworth, S. (2006). DeFT: A conceptual framework for considering learning with multiple representations.
Learning and Instruction, 16, 183-198. Ainsworth, S. (2008). The educational value of multiple-representations when learning complex scientific
concepts. In J. Gilbert, M. Reiner & M. Nakhleh (eds.), Visualisation: Theory and practice in science education (pp. 191-208). Deventer: Kluwer Academic Publishers.

104 D.M.J. Corradi, C. De Jaegher, N.A. Juarez-Collazo, J.Elen, G.Clarebout
Berthold, K., & Renkl, A. (2009). Instructional aids to support a conceptual understanding of multiple representations. Journal of Educational Psychology, 101(1), 70-87.
Bloomfield, L. (ed.) (2006). How things work: The physics of everyday life. New York: John Wiley & Sons. Bodemer, D., Ploetzner, R., Feuerlein, I., & Spada, H. (2004). The active integration of information during
learning with dynamic and interactive visualizations. Learning and Instruction, 14, 325-341. Bratfisch, O. (1972). Perceptual correlates of mental performance: Perceived difficulty and experienced
intellectual activity. Retrieved 20 May 2013, from http://www.eric.ed.gov/ERICWebPortal/detail?accno=ED080557.
Brünken, R., Plass, J., & Leutner, D. (2003). Direct measurement of cognitive load in multimedia learning. Educational Psychologist, 38(1), 53-61.
Carpreau, M., Depover, A., Herreman, W., Merlin, N., & Vandekerckhove, A. (2007). Physics Today 4.1. [Fysica Vandaag 4.1]. Kapellen: Pelckmans.
Chandler, P., & Sweller, J. (1991). Cognitive load theory and the format of instruction. Cognition and Instruction, 8(4), 293-332.
Chandler, P., & Sweller, J. (1992). The split-attention effect as a factor in the design of instruction. Britisch Journal of Educational Psychology, 62(2), 233-246.
Cheng, M., & Gilbert, J. (2007). Towards a better utilization of diagrams in science educational research. Retrieved 20 May 2013, from http://na-serv.did.gu.se/ESERA2007/pdf/153B.pdf.
Chittleborough, G., & Treagust, D. (2008). Correct interpretation of chemical diagrams requires transforming from one level of representation to another. Research in Science Education, 38, 463–482.
Cierniak, G., Scheiter, K., & Gerjets, P. (2009). Explaining the split-attention effect: Is the reduction of extraneous cognitive load accompanied by an increase in germane cognitive load?. Computers in Human Behaviour, 25(2), 315-324.
Cook, M. (2006). Visual representations in science education: The influence of prior knowledge and cognitive load theory on instructional design principles. Science Education, 90(6), 1073-1091.
Cox, R., & Brna, P. (1995). Supporting the use of external representations in problem solving: The need for flexible learning environments. Journal of Artificial Intelligence in Education, 6(2/3), 239-302.
de Jong, T. (2010). Cognitive load theory, educational research, and instructional design: Some food for thought. Instructional Science, 38, 105-134.
de Jong, T., Ainsworth, S., Dobson, M., van der Hulst, A., Levonen, J., Reimann, P., Sime, J., van Someren, M., Spada, H., & Swaak, J. (1999). Acquiring knowledge in science and mathematics: The use of multiple representations in technology-based learning environments. In W. Van Someren, P. Reimann, H. Boshuizen & T. de Jong (eds.), Learning with multiple representations (pp. 9-40). Oxford: Pergamon.
Ginns, P. (2006). Integrating information: A meta-analysis of the spatial contiguity and temporal contiguity effects. Learning and Instruction, 16(6), 511-525.
Harskamp, E. G., Mayer R. E., & Suhre, C. (2007). Does the modality principle for multimedia learning apply to science classrooms? Learning and Instruction, 17(5), 465-477.
Kohl, P., Rosengrant, D., & Finkelstein, N. (2007). Strongly and weakly directed approaches to teaching multiple representation use in physics. Physical Review Special Topics - Physics Education Research, 3(1), 010108.
Kolloffel, B., Eysink, T., de Jong, T., & Wilhelm, P. (2009). The effects of representational format on learning combinatorics from an interactive computer simulation. Instructional Science, 37(6), 503-517.
Kozma, R. B. (2003). The material features of multiple representations and their cognitive and social affordances for science understanding. Learning and Instruction, 13(2), 205-226.
Larkin, J., & Simon, H. (1987). Why a diagram is (sometimes) worth ten thousand words. Cognitive Science, 11(1), 65-99.
Marcus, N., Cooper, M., & Sweller, J. (1996). Understanding instructions. Journal of Educational Psychology, 88(1), 49-63.
Mayer, R. E., & Gallini, J. K. (1990). When is an illustration worth ten thousand words?. Journal of Educational Psychology, 82(4), 715-726.
Merrill, M. D. (1994). Instructional design theory. New Jersey: Educational Technology Publications. Nunnally, Y. J. (1978). Psychometric theory. New York: McGraw Hill. Paas, F., Tuovinen, J., Tabbers, H., & Van Gerven, P. (2003). Cognitive load measurement as a means to advance
cognitive load theory. Educational Psychologist, 38(1), 63-71. Pintrich, P. R., & Schunk, D. H. (2002). Motivation in education: Theory, research, and applications. Upper Saddle
River, NJ: Merrill (2nd ed.). Robinson, P. (2001). Task complexity, task difficulty, and task production: Exploring interactions in a
componential framework. Applied Linguistics, 22(1), 27-57. Rosengrant, D., Van Heuvelen, A., & Etkina, E. (2009). Do students use and understand free-body diagrams?
Physical Review Special Topics - Physics Education Research, 5, 010108. Scanlon, E. (1998). How beginning students use graphs of motion. In W. Van Someren, P. Reimann, H.
Boshuizen, & T. de Jong (eds.), Learning with multiple representations (pp. 67-86). Oxford: Pergamon.

The effect of representations on difficulty perception and learning of the concept of pressure 105
Schnotz, W. (2002). Towards an integrated view of learning from text and visual displays. Educational Psychology Review, 14(1), 101-120.
Schnotz, W., Baadte, C., Müller, A., & Rash, R. (2010). Creative thinking and problem solving with depictive and descriptive representations. In L. Verschaffel, E. De Corte, T. de Jong & J. Elen (eds.), Use of representations in reasoning and problem solving (pp. 11-35). London: Routledge.
Schnotz, W., & Bannert, M. (2003). Construction and interference in learning from multiple representation. Learning and Instruction, 13(2), 141-156.
Schnotz, W., & Kürschner, C. (2007). A reconsideration of cognitive load theory. Educational Psychology Review, 19(4), 469-508.
Schunk, D. H. (1985). Self-efficacy and classroom learning. Psychology in the Schools, 22(2), 208-223. Schunk, D. H. (2008). Learning theories: an educational perspective. Upper Saddle River, NJ: Prentice Hall (5th ed.). Stenning, K., & Oberlander, J. (1995). A cognitive theory of graphical and linguistic reasoning: Logic and
implementation. Cognitive Science, 19(1), 97-140. Stylianidou, F. (2002). Analysis of science textbook pictures about energy and pupils’ readings of them.
International Journal of Science Education, 24(3), 257-283. Sweller, J. (1994). Cognitive load theory, learning difficulty, and instructional design. Learning and Instruction,
4(4), 295-312. Sweller, J. (2008). Human cognitive architecture. In J. M. Spector, M. D. Merrill, J. J. G. Van Merrienboer & M. P.
Driscoll (eds.), Handbook of research on educational communications and technology (pp. 369-381). New York, NY: Lawrence Erlbaum Associates (3rd ed.).
Sweller, J., Chandler, P., Tierney, P., & Cooper, M. (1990). Cognitive load as a factor in the structuring of technical material. Journal of Experimental Psychology, 119(2), 176-192.
van der Meij, J. (2007). Support for learning with multiple representations: Designing simulation-based learning environments. Unpublished doctoral dissertation, Universiteit Twente, Enschede.
van der Meij, J., & de Jong, T. (2003). Learning with multiple representations. Paper presented at the EARLI Conference, 26 August, Padua, Italy. Retrieved 20 May 2013, from http://www.it.iitb.ac.in/~s1000brains/rswork/dokuwiki/media/learning_with_multiple_representations.pdf.
van der Meij, J., & de Jong, T. (2006). Supporting students’ learning with multiple representations in a dynamic simulation-based learning environment. Learning and Instruction, 16(3), 199-212.
Vosniadou, S. (2010). Instructional considerations in the use of external representations: The distinction between perceptually based depictions and pictures that represent conceptual models. In L. Verschaffel, E. De Corte, T. de Jong & J. Elen (eds.), Use of representations in reasoning and problem solving (pp. 36-54). London: Routledge.
Yeung, A. (1999). Cognitive load and learner expertise: Split-attention and redundancy effects in reading comprehension tasks with vocabulary definitions. The Journal of Experimental Education, 67(3), 197-217.

106 D.M.J. Corradi, C. De Jaegher, N.A. Juarez-Collazo, J.Elen, G.Clarebout
Appendix
Questions for learning task 1 (translated from Dutch)
Question 1: Which is the correct formula to calculate pressure?
a. p
A
F
b. p
F
A
c. p F.A
d. p
F
A2
Question 2: Which statement is correct?
a. The pressure on a liquid increases with the depth.
b. The pressure on a liquid moves in a linear way through the liquid.
c. The pressure on a liquid will propagate indifferently in all directions.
Question 3: The correct formula to calculate force from pressure is
a. F p.A
b. F
p
A
c.
F A
p
Question 4: What happens when you hit a pond with a layer of ice with a hammer?
a. The force of the impact causes a pressure wave that will propagate through the water.
b. The force of the impact causes a pressure wave that reduces rather quickly.
c. The force of the impact will be absorbed by the ice and will not be passed on to the water.
The effect of representations on difficulty perception and learning of the concept of pressure 107
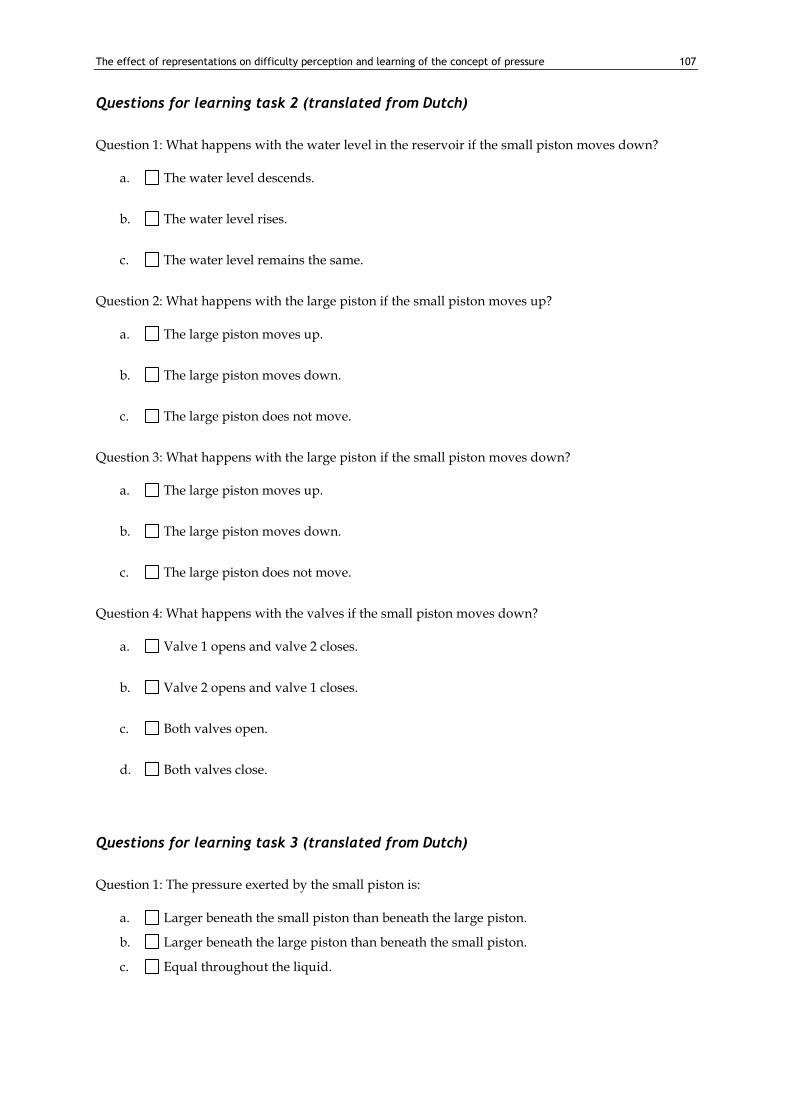
Questions for learning task 2 (translated from Dutch)
Question 1: What happens with the water level in the reservoir if the small piston moves down?
a. The water level descends.
b. The water level rises.
c. The water level remains the same.
Question 2: What happens with the large piston if the small piston moves up?
a. The large piston moves up.
b. The large piston moves down.
c. The large piston does not move.
Question 3: What happens with the large piston if the small piston moves down?
a. The large piston moves up.
b. The large piston moves down.
c. The large piston does not move.
Question 4: What happens with the valves if the small piston moves down?
a. Valve 1 opens and valve 2 closes.
b. Valve 2 opens and valve 1 closes.
c. Both valves open.
d. Both valves close.
Questions for learning task 3 (translated from Dutch)
Question 1: The pressure exerted by the small piston is:
a. Larger beneath the small piston than beneath the large piston.
b. Larger beneath the large piston than beneath the small piston.
c. Equal throughout the liquid.

108 D.M.J. Corradi, C. De Jaegher, N.A. Juarez-Collazo, J.Elen, G.Clarebout
Question 2: Which statement is correct?
a. F1 > F2
b. F1 < F2
c. F1 = F2
Question 3: If we calculate the force F2 with the formula
F2 F
1
A2
A1
, then:
a.
A2
A1
1
b.
A2
A1
1
c.
A2
A1
1
Question 4: We use the hydraulic press to:
a. Achieve a great force by using only a small force.
b. Achieve a small force by using a great force.
c. Displace a certain force over a greater distance.
To cite this article: Corradi, D.M.J., De Jaegher, C., Juarez-Collazo, N.A., Elen J., & Clarebout G. (2013). The effect of representations on difficulty perception and learning of the physical concept of pressure. Themes in Science and Technology Education, 6(2), 91-108.
URL: http://earthlab.uoi.gr/thete/index.php/theste