the effect of ridesharing services on drunk driving
TRANSCRIPT
THE EFFECT OF RIDESHARING SERVICES ON DRUNK DRIVING
An Undergraduate Research Scholars Thesis
by
ZACHARY KALMBACH
Submitted to Honors and Undergraduate Research Texas A&M University
in partial fulfillment of the requirements for the designation as an
UNDERGRADUATE RESEARCH SCHOLAR
Approved by Research Advisor: Dr. Amy Glass
May 2015
Major: Economics

TABLE OF CONTENTS
Page
ABSTRACT .................................................................................................................................. 1
SECTION
I INTRODUCTION ................................................................................................ 2
II LITERATURE REVIEW ..................................................................................... 5
III DATA ................................................................................................................... 7
IV RESULTS ........................................................................................................... 10
V CONCLUSION ................................................................................................... 15 REFERENCES ........................................................................................................................... 16

1
ABSTRACT
The Effect of Ridesharing Services on Drunk Driving. (May 2015)
Zachary Kalmbach Department of Economics Texas A&M University
Research Advisor: Dr. Amy Glass Department of Economics
Drunk driving is a significant problem in today’s society, and the recent development of
ridesharing services, like Uber, offer a new way to avoid driving under the influence. In this
paper, I examine whether the presence of Uber has caused a reduction in the number of DUI
violations per month in nine large American cities. I found significant evidence that uberX, the
most popular and affordable form of Uber, causes a 26% reduction in DUIs in the month the
service is launched. The results suggest that this effect fades quickly, although the estimates after
the first month are imprecise and statistically insignificant. I suggest that a future study using the
same model as this paper with a larger pool of available data would reach clearer conclusions
about the overall long-term effect of ridesharing services on the number of DUI violations.

2
SECTION I
INTRODUCTION
Driving under the influence of alcohol is a major problem in America. To give a brief depiction
of the extent of this problem, Mothers Against Drunk Driving reports that someone in America is
injured in a drunk driving accident every two minutes, 28 people die every day in America as a
result of drunk driving accidents, and drunk driving costs the U.S. nearly $200 billion every year
(MADD—Mothers Against Drunk Driving). Organizations like Mothers Against Drunk Driving
as well as law enforcement agencies are constantly looking for ways to curb this problem with
approaches like education programs, DUI checkpoints, or increased penalties for Driving Under
the Influence (DUI).
The recent development and popularization of smart phone app-based ridesharing services like
Uber provide an additional option when potential drunk drivers are facing the decision of
whether to get behind the wheel, and many people believe that these services will generate a
significant reduction in drunk driving in today’s society. For example, a recent article released by
MADD states, “Not only is Uber a convenient transportation option…it can also be a powerful
tool in the fight to reduce the number of drunk-driving crashes” (Unlike traditional taxi services,
these ridesharing services market themselves as a form of social networking, with a safe ride
home essentially in the palm of your hand. Because anti-drunk driving organizations and law
enforcement agencies are making it a priority to reduce the occurrence of drunk driving, these
app-based services are something agencies and organizations could potentially emphasize in
their quest to prevent drunk driving. Further, ridesharing could be viewed as a more positive way
3
to prevent drunk driving, in contrast to policies like frequent DUI checkpoints that could be seen
as limiting personal freedoms. Taxi companies and governments in many cities have banned
ridesharing services, claiming that ridesharing is the same as taking a taxi, and should therefore
be regulated as if they were a taxi company. Results proving that ridesharing is in fact reducing
drunk driving across the nation would force a conversation about the cost and benefits of
banning an easy and affordable way of preventing drunk driving.
Valued at $40 billion, Uber is by far the most prominent ridesharing service available. In fact,
they are valued at sixteen times more than their closest competitor, Lyft. Their most popular
service is called uberX, which is the least expensive version of Uber. The reason for this is
because uberX drivers use their own cars and are not required to be licensed chauffeurs. My goal
in this paper is to find out if Uber, or specifically uberX’s presence in major American cities has
had a significant effect on the number of DUI violations.
The rest of this paper is broken down into four sections. First I discuss the previous literature on
this subject. So far, Uber itself has released the majority of studies relating ridesharing and drunk
driving. Only one of their studies directly relates the presence of the service and the number of
DUI violations, and the study only consisted of two west-coast cities. My study aims to reach a
more far-reaching conclusion on the impact of Uber on DUI rates across America. Second I
discuss the data I gathered, which consists of the number of DUI violations per month in Austin,
Atlanta, Chicago, Dallas, Houston, Philadelphia, Pittsburgh, San Francisco, and Seattle as well
as the date that Uber and uberX first entered each city. I controlled for the legalization of
marijuana by including the date that marijuana was legalized in Washington. I then present my

4
results and reach a conclusion. While the results suggest that uberX significantly decreases DUIs
in the month it is launched, this effect seems to fade after the first month, although the estimates
after the first month are imprecise. The results tell nothing significant about the presence of any
form of Uber other than uberX. While there wasn’t enough time for me to gather DUI data for
more cities, and because Uber is still a very new service, a future study using the same model as
this paper could be able to reach more statistically significant conclusions and make claims about
Uber’s effect with more confidence than I can in this paper.

5
SECTION II
LITERATURE REVIEW
Uber itself has released the majority of studies relating ridesharing and drunk driving. As far as
looking for a direct connection between Uber and the number of violations for Driving Under the
Influence (DUI), the company released a study titled “DUI Rates Decline in Uber Cities”. The
company used a difference-in-differences framework with Seattle and San Francisco and
concluded that Uber is responsible for a 10% reduction in DUI violations in Seattle (Chris). This
study is the most similar to my paper, but there are two key differences. First, Uber used the
number of DUIs per day, while this paper uses the number of DUIs per month. I chose to study
the number of DUI violations per month in order to look at Uber’s effect not only in the month
of launch, but also months after the service enters a city. Second, my paper not only compares
San Francisco and Seattle, but also seven other cities across the America in addition to the two
West Coast cities. In this way, I aim to get a big-picture look at whether or not Uber has
significantly decreased the instance of drunk driving across America. Uber has released three
subsequent studies on the topic of drunk driving. Two of them, titled “Making Pennsylvania
Safer: As Uber Use Goes Up, DUI Rates Go Down” (Catherine) and “Providing Rides When
They Are Most Needed” (Ryan), focused their attention on the times of day that Uber is
requested the most in Philadelphia and Austin, respectively. Both of these studies found that
Uber receives the most requests for rides during the times where the rate of drunk driving is the
highest. Uber partnered with Mothers Against Drunk Driving in their most recent report,
“Making Our Roads Safer—For Everyone” (Michael). They concluded that alcohol related
accidents fell by 60 crashes per month among drivers under 30 years old in markets where Uber

6
operates following the launch of the uberX. These studies are all exciting for the prospect of
Uber causing a reduction in drunk driving, but I believe that law enforcement agencies would
want to see that the service significant effects DUI rates across the country in the long-term
rather than just a couple West Coast cities and Philadelphia before they would fully embrace the
fact that ridesharing services work and subsequently start investing in ways to promote them.
These agencies might also look more seriously upon a study that is done outside of Uber by an
impartial third party, since any positive results released by Uber could be seen as the company
promoting themselves through potentially biased methods.

7
SECTION III
DATA
This paper uses a difference-in-differences framework where the number of DUI arrests per
month is the response variable and the presence of uberX, any other form of Uber, and the
legalization of marijuana are the explanatory variables. The data on DUI violations was found in
online databases for Seattle (Seattle Police Department), San Francisco (San Francisco Police
Department), Philadelphia (Pennsylvania State Police), and Pittsburgh (Pennsylvania State
Police). Austin (“Chief’s Monthly Reports”) and Atlanta (“APD Uniform Crime Reports”)
published monthly crime reports on their police department websites. I submitted a public
information request to the Texas Department of Public Safety and was provided with monthly
DUI data through 2013 for Dallas and Houston. To obtain the data for Chicago, I contacted the
Illinois Criminal Justice Information Authority and was provided with the monthly statistics.
The summary of the DUI statistics per month is given in Table 1.
The launch dates of Uber and uberX were obtained from Uber’s website, specifically from their
“Launch” blog, which posts a new article every time the service is launched in a new city
(“Launch”). Since I am grouping the DUI arrest numbers by month, I used the month that Uber
and uberX entered into the cities rather than the exact date as the independent variable. The
months and years that Uber and uberX entered the selected cities is given in Table 2.

8
Table 1. Number of DUI Violations
City Mean Standard Dev. Austin 470.94 79.16
Atlanta 113.28 24.28
Chicago 342.95 45.39
Dallas 198.92 63.75
Houston 561.50 68.84
Philadelphia 901.86 407.90
Pittsburgh 72.10 17.41
San Francisco 31.22 6.93
Seattle 197.96 57.54
Table 2. Month of Uber Launch
City Uber uberX Austin June 2014 June 2014
Atlanta October 2012 July 2013
Chicago October 2011 May 2013
Dallas September 2012 November 2013
Houston February 2014 February 2014
Philadelphia June 2012 October 2013
Pittsburgh March 2014 March 2014
San Francisco June 2010 July 2012
Seattle August 2011 April 2013
9
In a difference-in-differences model I will describe in the results section, I used the presence of
Uber and uberX as binary variables, where the variable “uberx” equals 1 if the service is present
in the city, and 0 if it is not. Further, I controlled for the potential effect of any prior presence of
another form of Uber by adding another binary variable, denoted “uber”. This variable most
often refers to Uber’s service called “Uber Black”, which is a more expensive and less requested
version of uberX. The launch dates for this was found from Uber’s aforementioned “Launch”
blog.
I also felt it was necessary to control for the legalization of marijuana in Seattle because the
database where I found DUI violation statistics did not distinguish between Driving Under the
Influence of Alcohol and Driving Under the Influence of Drugs. Like the variables “uberx” and
“uber”, the legalization in marijuana is a binary variable labeled “pot”, where “pot” equals 1 if
marijuana is legalized and 0 if it is not.

10
SECTION IV
RESULTS
To test for Uber and uberX’s possible effect on the number of DUIs per month, I used a
difference-in-differences framework. This method determines the effect of an independent
variable on a response variable by comparing the mean change in the response variable over time
in a control group to the mean change in the response variable over time in a treatment group.
This is a useful method because it controls for any other variables that may be confounding the
treatment, assuming that the outcome in the control and treatment group would have the same
trend if there were no treatment. This is commonly referred to as the “parallel trends
assumption”. In this study, where I use panel data and where there are multiple cities, time
periods, and treatments, I am able to use an ordinary least squares regression model with fixed
effects to obtain difference-in-differences estimates.
In each model I use, each observation is a place at a given time, like Austin in May 2014. The
main variables of interest are 𝑢𝑏𝑒𝑟𝑥!", which represents uberX and 𝑢𝑏𝑒𝑟!", which represents any
other form of Uber. The variables 𝑢𝑏𝑒𝑟𝑥!" and 𝑢𝑏𝑒𝑟!" are equal to 1 if the service is present in
the city and 0 otherwise. Further, 𝑝𝑜𝑡!" equals 1 if marijuana is legal in the city and 0 otherwise,
and 𝑢𝑏𝑒𝑟!" equals 1 if a different form of Uber is present in the city, and 0 otherwise. The fixed
effects in the model are 𝑢! and 𝑇!, where 𝑢! is a fixed effect to control for how one city is
different from all of the other cities, such as access to public transportation in the cities, and 𝑇! is
a fixed effect to control for how one month is different from another month. The error term is
denoted as 𝜀!". The coefficients on the explanatory variables represent the mean percentage

11
change in the number of DUIs when the binary variables equal 1 instead of 0, that is, when
uberX or Uber is present and marijuana is legalized.
As I previously mentioned, the difference-in-differences model depends on what is known as the
“parallel trends assumption”. This assumes that the outcome in the treatment and control groups
would follow the same trend if there were no treatment. It essentially assumes that nothing in the
groups that would affect the response variable changes at the exact same time as the treatment
goes into effect. For example, suppose that in the same month that uberX enters a city, the city
decides to suspend the use of DUI checkpoints. The suspension of DUI checkpoints by itself
would most likely decrease the number of reported DUI violations, and this effect would be
falsely attributed to uberX. In this situation where DUI checkpoints are suspended, the parallel
trends assumption would no longer hold, and any conclusion reached would not be valid. A good
way to test this assumption is to test for pre-treatment trends, which can be done by including
leading variables in difference-in-differences models like Model 1. These “leads” are the
explanatory variables for uberX and Uber for the months before they go into effect. If the
coefficients on the leads are close to 0, then there is no evidence for pre-treatment effects, and
the parallel trends assumption most likely holds. I do this in Model 1:
log (𝑑𝑢𝑖)!" = 𝛼 + 𝛽!𝑢𝑏𝑒𝑟𝑥!"!! + 𝛽!𝑢𝑏𝑒𝑟𝑥!"!! + 𝛽!𝑢𝑏𝑒𝑟𝑥!"!! + 𝛽!𝑢𝑏𝑒𝑟𝑥!" + 𝛽!𝑢𝑏𝑒𝑟!"!! +
𝛽!𝑢𝑏𝑒𝑟!"!! + 𝛽!𝑢𝑏𝑒𝑟!"!! + 𝛽!𝑢𝑏𝑒𝑟!" + 𝛽!𝑝𝑜𝑡!" + 𝑢! + 𝑇! + 𝜀!" (1)
The results of this model, given in Table 3 in the column labeled “Model 1”, suggest that the
parallel assumption holds. The coefficient for uberX’s effect three months prior to its launch is a
12
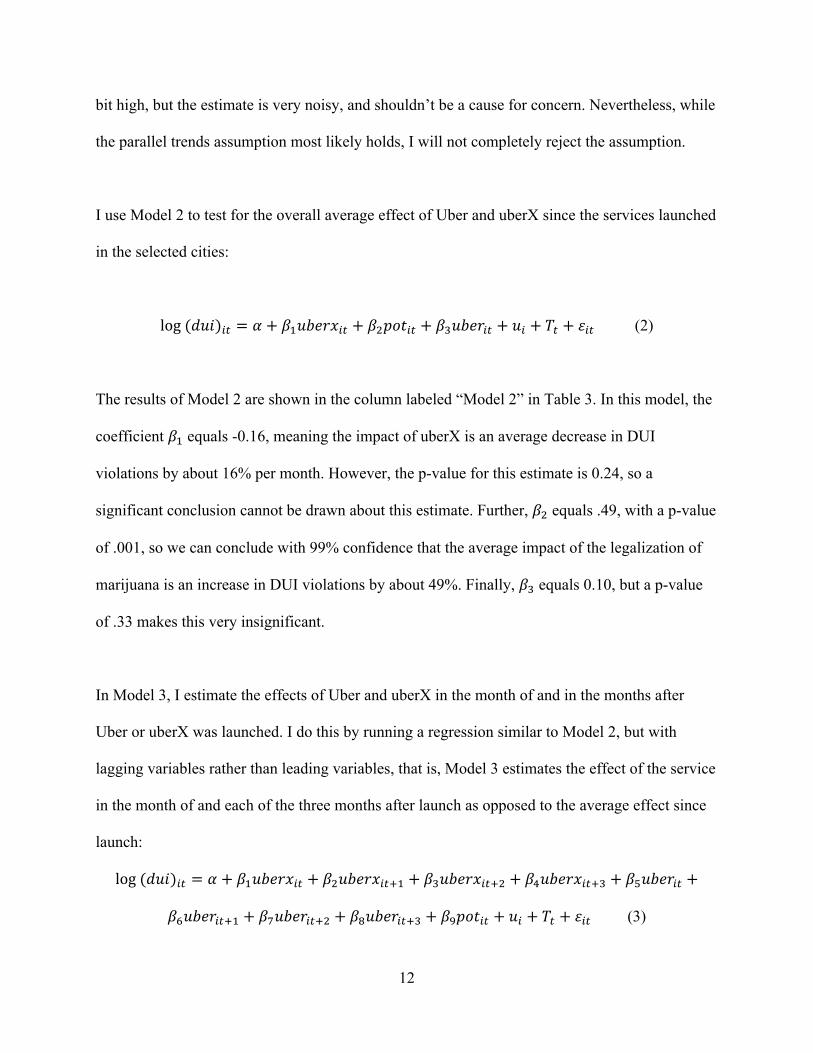
bit high, but the estimate is very noisy, and shouldn’t be a cause for concern. Nevertheless, while
the parallel trends assumption most likely holds, I will not completely reject the assumption.
I use Model 2 to test for the overall average effect of Uber and uberX since the services launched
in the selected cities:
log (𝑑𝑢𝑖)!" = 𝛼 + 𝛽!𝑢𝑏𝑒𝑟𝑥!" + 𝛽!𝑝𝑜𝑡!" + 𝛽!𝑢𝑏𝑒𝑟!" + 𝑢! + 𝑇! + 𝜀!" (2)
The results of Model 2 are shown in the column labeled “Model 2” in Table 3. In this model, the
coefficient 𝛽! equals -0.16, meaning the impact of uberX is an average decrease in DUI
violations by about 16% per month. However, the p-value for this estimate is 0.24, so a
significant conclusion cannot be drawn about this estimate. Further, 𝛽! equals .49, with a p-value
of .001, so we can conclude with 99% confidence that the average impact of the legalization of
marijuana is an increase in DUI violations by about 49%. Finally, 𝛽! equals 0.10, but a p-value
of .33 makes this very insignificant.
In Model 3, I estimate the effects of Uber and uberX in the month of and in the months after
Uber or uberX was launched. I do this by running a regression similar to Model 2, but with
lagging variables rather than leading variables, that is, Model 3 estimates the effect of the service
in the month of and each of the three months after launch as opposed to the average effect since
launch:
log (𝑑𝑢𝑖)!" = 𝛼 + 𝛽!𝑢𝑏𝑒𝑟𝑥!" + 𝛽!𝑢𝑏𝑒𝑟𝑥!"!! + 𝛽!𝑢𝑏𝑒𝑟𝑥!"!! + 𝛽!𝑢𝑏𝑒𝑟𝑥!"!! + 𝛽!𝑢𝑏𝑒𝑟!" +
𝛽!𝑢𝑏𝑒𝑟!"!! + 𝛽!𝑢𝑏𝑒𝑟!"!! + 𝛽!𝑢𝑏𝑒𝑟!"!! + 𝛽!𝑝𝑜𝑡!" + 𝑢! + 𝑇! + 𝜀!" (3)
13
The results of Model 3 are shown in the column labeled “Model 3” in Table 3. While, like the
other models, this model tells us nothing significant about the effect of any other form of Uber, it
gives a very interesting picture of the effect of uberX on DUI rates. Here, the coefficient on
𝑢𝑏𝑒𝑟𝑥!" is -0.30. When you calculate 𝑒!!.!" − 1, you find that the percentage impact is a
reduction in DUIs of about 26% in the month that uberX is launched. This estimate is
statistically significant at a 95% confidence level. However, as you can see from the results, this
effect quickly fades; after the first month, about half of this effect is lost, and after the third
month the overall effect goes down to about -12.17%. It is important to note that after the first
month, a lot of precision is lost, as only the estimate for the month of launch is statistically
significant. The fact that Uber and uberX are so new means that there wasn’t a lot of data for
months after the service was launched, and this is a big contributing factor to the loss of
precision in the months after the services are launched.
Another possible reason that the effect seems to dissipate after the first month could be because
Uber advertises heavily when they first enter a city, and in most cases a user’s first ride is free or
highly discounted. Further, when a user signs up they are given a promotion code that they can
give to their friends, and they receive free or discounted rides when their friends use the code.
This could potentially create a scenario in which Uber is a “fad” that fades after people exhaust
their free rides. This would explain Uber’s effect fading after the month of launch. However, to
test this claim I would need to obtain ridership data from Uber, something that I have not been
able to accomplish.

14
Table 3. Regression Output
Variable Model 1 Model 2 Model 3 𝒖𝒃𝒆𝒓𝒙𝒊𝒕 -0.04
(0.10) -0.16 (0.13)
-0.30 (0.11)*
𝒑𝒐𝒕𝒊𝒕 0.51 (0.11)**
0.49 (0.10)**
0.47 (0.09)**
𝒖𝒃𝒆𝒓𝒊𝒕 0.03 (0.03)
0.10 (0.10)
0.13 (0.08)
𝒖𝒃𝒆𝒓𝒙𝒊𝒕!𝟏 -0.03 (0.08)
𝒖𝒃𝒆𝒓𝒙𝒊𝒕!𝟐 -0.00 (0.09)
𝒖𝒃𝒆𝒓𝒙𝒊𝒕!𝟑 -0.13 (0.11)
𝒖𝒃𝒆𝒓𝒊𝒕!𝟏 -0.05 (0.04)
𝒖𝒃𝒆𝒓𝒊𝒕!𝟐 0.10 (0.07)
𝒖𝒃𝒆𝒓𝒊𝒕!𝟑 0.05 (0.10)
𝒖𝒃𝒆𝒓𝒙𝒊𝒕!𝟏 0.13 (0.11)
𝒖𝒃𝒆𝒓𝒙𝒊𝒕!𝟐 -0.01 (0.11)
𝒖𝒃𝒆𝒓𝒙𝒊𝒕!𝟑 0.05 (0.10)
𝒖𝒃𝒆𝒓𝒊𝒕!𝟏 -0.11 (0.08)
𝒖𝒃𝒆𝒓𝒊𝒕!𝟐 -0.06 (0.08)
𝒖𝒃𝒆𝒓𝒊𝒕!𝟑 0.16 (0.09)
𝑹𝟐
0.16 0.16 0.20
Observations
552 579 552
Notes: Table 3 shows the coefficients in the variables given in Column 1. Each column describes a logistic regression model where the response variable is the number of DUI violations per month. Column 1 shows a standard logistic regression model. Column 2 shows a model with leads included, and Column 3 shows a model with lags. 𝑅! pertains to “within” variation. All results are robust. * Variable is statistically significant at the 95% confidence level. ** Significant at the 99% confidence level
15
SECTION V
CONCLUSION
Drunk driving continues to be a significant problem in America, and ridesharing services like
Uber offer a safe, easy, and affordable ride home. In this paper, I explored the effect of Uber on
drunk driving across America. My overall conclusion from this paper is that while the overall
picture is imprecise, that is, the overall effect of uberX is statistically insignificant, uberX
definitely seems to have an impact in its first month. This effect, however, seems to fade away
quickly. Because my timeline did not allow me to wait any longer on other American cities to
provide me with DUI statistics and Uber and ridesharing in general is such a new service, lack of
data may have contributed to the imprecise overall conclusion. However, the fact that Uber gives
out so many free rides from promotions in month of launch could be a potential driving factor for
the decrease in the effect after the first month. With more months after the launch of Uber and
uberX in the data, the results for the months following launch would most likely be more precise.
I believe that with the passage of time providing more months to observe after the service’s
launch as well as data for more cities, a future study using the same models as this paper could
provide a clearer picture of Uber’s effect on drunk driving.
There are also other ridesharing services, like Lyft and Sidecar, that are starting to build
momentum, and including them in a future study could give an even better portrayal of the
ridesharing industry’s effect on drunk driving that law enforcement agencies and anti-drunk
driving organizations couldn’t ignore. Those sorts of results could add a new factor into the

16
government’s decision on whether to ban ridesharing services that are helping to prevent drunk
driving.

17
REFERENCES
“APD Uniform Crime Reports.” Atlanta Police Department. Atlanta Police Department, n.d. Web. 07 Feb. 2015. <http://www.atlantapd.org/uniformcrimereports.aspx>. Catherine. “Making Pennsylvania Safer: As Uber Use Goes Up, DUI Rates Go Down.” Uber Uber Blog. Uber, 21 July 2014. Web. 07 Feb. 2015. <http://blog.uber.com/Pittsburgh-DUI-Rates-Decline>. “Chief’s Monthly Reports.” The Official Website of the City of Austin. Austin Police Department, n.d. Web. 07 Feb. 2015. <http://www.austintexas.gov/page/chiefs-monthly-reports>. Chris. “DUI Rates Decline in Uber Cities.” Uber Blog. Uber, 05 May 2014. Web. 07 Feb. 2015. <http://blog.uber.com/duiratesdecline>. “Launch.” Uber Blog. Uber, n.d. Web. 07 Feb. 2015. <http://blog.uber.com/tag/launch/>. “MADD—Mothers Against Drunk Driving.” MADD. MADD, n.d. Web. 03 Feb. 2015. <http://www.madd.org/statistics/>. “MADD – New Report from MADD, Uber Reveals Ridesharing Services Important Innovation to Reduce Drunk Driving.” MADD. MADD, 27 Jan. 2015. Web. 07 Feb. 2015. <http://www.madd.org/media-center/press-releases/2015/new-report-from-madd- uber.html>. Michael. “Making Our Roads Safer—For Everyone.” Uber Blog. Uber, 27 Jan. 2015. Web. 07 Feb. 2015. <http://blog.uber/uber-madd>. Pennsylvania State Police. Uniform Crime Reporting Unit. Pennsylvania Uniform Crime Reporting System. Harrisburg: Uniform Crime Reporting Unit, n.d. Monthly Summary Arrest Reports. Web. 06 Feb. 2015. <http://www.paucrs.pa.gov/UCR/Reporting/Monthly/Summary/MonthlySumArrestUI.asp>. Ryan. “Providing Rides When They Are Most Needed.” Uber Blog. Uber, 13 Sept. 2014. Web. 07 Feb. 2015. <http://blog.uber.com/atxsaferides>. San Francisco Police Department. DataSF.org Data File Depository. N.p: n.p, n.d. Web. 06 Feb. 2015. <http://apps.sfgov.org/datafiles/index.php?dir=Police>. Seattle Police Department. Seattle Police Department 911 Incident Response. Seattle: n.p., n.d. Data.seattle.gov. Web. 06 Feb. 2015. <https://data.seattle.gov/Public-Safety/TrafficViolations-Accidents-DUIs/csrv-gf2j>.