the effect of sea salt, dry sourdough and fermented sugar
TRANSCRIPT

foods
Article
The Effect of Sea Salt, Dry Sourdough and FermentedSugar as Sodium Chloride Replacers on RheologicalBehavior of Wheat Flour Dough
Andreea Voinea, Silviu-Gabriel Stroe * and Georgiana Gabriela Codină
Faculty of Food Engineering, Stefan cel Mare University of Suceava, 720229 Suceava, Romania;[email protected] (A.V.); [email protected] (G.G.C.)* Correspondence: [email protected]; Tel.: +40-744-550-072
Received: 27 July 2020; Accepted: 6 October 2020; Published: 14 October 2020�����������������
Abstract: The aim of this study was to investigate the effects of formulation factors, sea salt (SS),dry sourdough (SD) and fermented sugar (FS) as sodium chloride replacers in wheat flour ondough mixing, extension, pasting and fermentation rheological properties, evaluated by Farinograph,Extensograph, Amylograph and Rheofermentometer devices. With regard to mixing and extensionproperties, SS and FS presented a strengthening effect, whereas SD presented a weakening one.SS and FS presented a positive effect on dough stability, energy and resistance, whereas SD presenteda negative one. On the Amylograph, peak viscosity increased by SS and FS addition and decreasedwhen SD was incorporated in the dough recipe. During fermentation, dough development and gasproduction in the dough system increased after SS and SD addition, whereas they decreased after FSaddition. Response surface methodology (RSM) was used to investigate the effect of independentvariables on the rheological properties of the dough. Mathematical models between the independentvariables, SS, SD and FS, and the dependent variables, represented by the rheological values of thedough, were obtained. The best formulation obtained was of 0.30 g/100 g SS, 0.50 g/100 g SD and1.02 mL/100 g FS addition with a 0.618 desirability value, following Derringer’s desirability functionapproach. For this formulation, bread quality characteristics were better appreciated than for thoseobtained for the control sample, in which 1.5% NaCl was incorporated in wheat flour.
Keywords: sea salt; dry sourdough; fermented sugar; dough rheological properties; optimization;response surface methodology
1. Introduction
High salt intake is associated with high blood pressure, a major risk factor for diseases such as stroke,heart attack and cardiovascular ones [1]. The World Health Organization’s (WHO) recommendationis to reduce sodium intake to up to 2 g daily and not to exceed salt consumption of more than 5 gper day [2,3]. However, daily salt intake exceeds the WHO recommended intake in most countries.For example, in the EU, daily salt intake varies between 7 and 13 g, which largely exceeds the WHOrecommendation [4]. Therefore, in many EU countries and beyond, measures are being taken in orderto reduce the salt content in food products [5]. Among foodstuffs, one of the main salt sources isbakery products [6]. The salt content in bakery products may vary from country to country fromaround 1 to 3 g, depending on consumption habits [5]. A total replacement of sodium chloride inbakery products is very difficult to achieve due to its technological effects on the bread baking processand on the baked product quality, especially flavor and taste [7,8]. The most important impact ofsodium chloride salt is on the flavor profile of the foodstuffs, which is significant due to the fact that itconfers a unique salty taste [9]. Sodium chloride, even in small amounts, is one of the main ingredients
Foods 2020, 9, 1465; doi:10.3390/foods9101465 www.mdpi.com/journal/foods

Foods 2020, 9, 1465 2 of 20
in bakery products, with a major impact on the wheat flour dough rheological properties and thefinished product quality. Today, many approaches are being tried to reduce the sodium content frombakery products. The most common ones are the replacement of sodium chloride with other salts,especially with chloride ones such as potassium, calcium, magnesium, etc. [10–12]. Lately, there hasalso been a concern about the use of various ingredients that may intensify the baked products’ flavorperception in order to reduce the sodium amount indifferent foodstuffs [13–16]. The aim of this studywas to investigate the effect of a sodium chloride replacement in bakery products with a different salt,such as sea salt, with a low sodium content, in combination with two enhancers of baked products’flavor, such as dry sourdough and fermented sugar, on the rheological properties of dough by usingresponse surface methodology (RSM). Although different studies were carried out on the effects ofdifferent types of a singular formulation on dough rheological properties, such as sourdough [7,17,18]or sea salt as sodium chloride replacements [12,19], very few studies have been conducted on thecombined effect of different salts, such as sodium chloride replacers [20] and different improversof baked products’ flavor [21]. There are many approaches to reducing sodium chloride content inbakery products while maintaining their high quality. The most common ones are sodium chloridesubstitution with different replacers, such as magnesium salts, KCl, calcium salts, etc. [10–12,20], andintensification through the addition of different ingredients. This study is a continuation of previousresearch by our group on sodium reduction in bakery products by partial substitution of NaCl withKCl [20] or sea salt with low sodium content, in combination with dry sourdough, in order to improvethe bakery products’ flavor [21]. Within this study, we used sea salt for sodium replacement inbakery recipes in combination with the other two ingredients (dry sourdough and fermented sugar) asimprovers of bread flavor perception. It was taken into account that the intensification of the bakeryproducts’ sensory characteristics, with regard to taste and flavor, is currently one of the main concernsof specialists in the field due to the fact that consumers find it difficult to accept products without thespecific salty taste provided by sodium chloride. To our knowledge, this is the first study performedon the combined effect of sea salt–dry sourdough–fermented sugar formulation as sodium chloridereplacers on dough rheological properties.
2. Materials and Methods
2.1. Materials
Wheat flour provided by S.C. Mopan S.A. (Suceava, Romania) from the 2019 harvest was used.Low sodium sea salt, dry sourdough and fermented sugar were used as ingredients. Sea salt (SS)obtained from the Dead Sea was provided by BK Giulini Corp., United States, with the commercialname Salona, and presented the following content: sodium as sodium chloride (max. 7%), potassiumchloride (21 ÷ 27%) and magnesium chloride (31 ÷ 35%), water insoluble max. 0.1%. Dry sourdough(SD) provided by Enzymes & Derivates S.A. Company (Neamt, Romania) was fermented wheat flour.The commercial SD product name is Grande Sélection Ble N◦1, which is produced by AIT Ingredients(Soufflet Group, Saint-Maximin, France). The SD was in powder form and of a white color, with ahumidity value less than 12%. According to the product technical sheet provided by the producer,it may contain yeast and molds at less than 5000 UFC/g, coliforms at less than 100 UFC/g and aerobicmesophilic flora at less than 100,000 UFC/g. The fermented sugar (FS), obtained from sugars such asbeet, cane, corn and tapioca, provided by Corbion (Amsterdam, Netherlands) (product name VerdadF95), contained fermentation products, such as organic acids, residual sugars and aroma components(slightly acidic, combined with umami and bouillon notes). The product was in liquid form, whichpresents, according to its technical sheet, a dry matter of 54 ÷ 61%, a pH amount of 5.0 ÷ 5.6 and anamount of organic salts of 490 ÷ 630 meq/100 g. It is of a high purity with a sugar amount of 5%,arsenic, cadmium, lead and mercury amounts of maximum 1 mg/kg and heavy metals of maximum5 mg/kg. From the microbiological point of view, it is free of Escherichia coli, Enterobacteriaceae andStaphylococcus in 1 g and Salmonella in 25 g. The Mesophilic bacteria is of max. 3000 counts/g and total

Foods 2020, 9, 1465 3 of 20
combined yeasts and molds count (TYMC) of max. 100 counts/g. The wheat flour used was verygood for bread making with low α amylase activity [22] according to the characteristics analyzed bythe international standard methods: 0.65 g/100 g ash (according to the International Association forCereal Science and Technology—ICC 104/1); 12.67 g/100 g protein (ICC 105/2); 30 g/100 g wet gluten(ICC106/1); 14.0 g/100 g moisture (ICC 110/1); falling number 442 s (ICC 107/1).
2.2. Dough Rheological Properties during Mixing and Extension
During mixing, dough rheological properties were analyzed according to the ICC method115/1 by using a Farinograph device (Brabender, Duigsburg, Germany, 300 g capacity), and duringextension, according to ICC method 114/1, by using an Extensograph device (Brabender, Duigsburg,Germany). With the Farinograph, the following values were determined: water absorption (WA),dough development time (DT), dough stability (ST) and the degree of softening at 10 min (DS).With the Extensograph, the following values were determined: resistance to extension (R50), maximumresistance to extension (Rmax), extensibility (Ext), energy (E) and ratio number (R/E) at a proving timeof 135 min.
2.3. Dough Rheological Properties during Pasting
The pasting properties of wheat flour dough were analyzed according to the ICC method 126/1 byusing an Amylograph (Brabender OGH, Duisburg, Germany). With the Amylograph, the followingvalues were determined: gelatinization temperature (Tg), temperature at peak viscosity (Tmax) andpeak viscosity (PVmax).
2.4. Dough Rheological Properties during Fermentation
During fermentation, dough rheological properties were determined according to the AmericanAssociation of Cereal Chemists (AACC) method 89-01.01 by using a Rheofermentometer device(Chopin Rheo, type F3, Villeneuve-La-Garenne Cedex, France). With the Rheofermentometer,the following values were determined: maximum height of gaseous production (H’m), total CO2
volume production (VT), volume of the gas retained in the dough at the end of the test (VR) andretention coefficient (CR).
2.5. Bread-Making Samples
Bread-making samples were made for the optimized samples (in which the optimum formula wasincorporated, namely 0.30% SS, 0.50% SD and 1.02 mL FS in 100 g wheat flour) and for control samplesin which 1.5% NaCl was incorporated into the bread recipe. The bread sample formula also contained3% yeast of Saccharomyces cerevisiae type and deionized water, according to the water absorption valueobtained with the Farinograph device. The ingredients were mixed at 200 rpm in a laboratory mixer(Kitchen Aid, Whirlpool Corporation, Benton Harbor, MI, USA) for 15 min, then divided, molded andfermented in a fermentation chamber (PL2008, Piron, Cadoneghe, Padova, Italy) at 35 ◦C for 40 min at85% relative humidity and baked in a bakery convection oven (Caboto PF8004D, Cadoneghe, Padova,Italy) at 180 ◦C for 50 min. After cooling for 4 h, the samples were analyzed.
2.6. Bread Samples Analysis
The bread samples obtained through the baking tests were analyzed from the physical, color,textural and sensory points of view. The bread physical characteristics analyzed were the loaf volume,elasticity and porosity, according to the Romanian standard SR 91:2007. The bread color characteristicsanalyzed were L* (lightness), a* (redness when positive and greenness when negative) and b* (yellownesswhen positive and blueness when negative) using a Konica Minolta CR-700 colorimeter (Chiyoda,Tokyo, Japan). The bread textural characteristics analyzed were springiness, cohesiveness, gumminess,firmness and resilience with a textural analyzer (Perten TVT 6700, Hägersten, Sweden). The bread

Foods 2020, 9, 1465 4 of 20
sensory characteristics were analyzed by using a hedonic test of 9 points (from 1—strong dislike to9—excellent taste) with 30 semi-trained panelists from the Stefan cel Mare University’s Faculty of FoodEngineering. The bread sensory characteristics evaluated were: appearance, color, flavor, taste, smell,texture and overall acceptability.
2.7. Experimental Design and Statistical Analysis
In order to achieve the proposed purpose—the analysis of the synergic effect of the amounts of seasalt (SS), dry sourdough (SD) and fermented sugar (FS) on the rheological properties of dough—theresponse surface method (RSM) was used. The central composite design (CCD) methodology wasused. CCD methodology consists of a three-level factorial design, a start design, and a central point.In this case, for three factors (SS, SD and FS) at three levels each, the design requires nine experimentalcombinations which are produced with six replicates at the center point, generating a total of twentyexperimental runs. The combination in the center point of the experiment is replicated six times.The factors studied were at the addition levels recommended by the producers to be incorporated inwheat flour. For SD and FS, the producers recommended levels which are between 0.5–5 g/100 g (SD)between 0.70–1.5 mL/100 g (FS). For SS, the only salt in the mix formulation, the levels chosen to beadded in wheat flour were those generally used by bread-making producers for sodium chloride whenit is used in a bread recipe (up to 1.5%). Response surface methodology (RSM) is an empirical modelingstatistical technique which has an important role in the design, development and proposal of newproducts to optimize the parameters and optimum condition of a process response variable [23,24].Obtaining the optimal values using the response surface methodology involves three main steps:design of the experiment, obtaining the coefficients for the mathematical models and the predictionof the system responses by the design of experiment methodology (DOE), using the trial versionof Design Expert software, (Stat-Ease, Minneapolis, MN, USA). In this research, three independentvariables were used: X1—sea salt (A), X2—dry sourdough (B) and X3—fermented sugar (C). The effectof variation in their amounts on the rheological parameters of the dough (dependent variables—Y1–13)was studied. The three independent variables and their real and coded values used in the experimentaldesign matrix, comprising 20 experiments, are shown in Table 1.
The rheological parameters determined with the Farinograph in this case were: WA—Y1; ST—Y2;DS—Y3. The rheological parameters determined with the Extensograph were: E—Y4; R50—Y5; Ext—Y6;Rmax—Y7.The rheological parameters determined with the Amylograph were: PVmax—Y8; Tmax—Y9;H’m—Y10; VT—Y11; VR—Y12; CR—Y13. The rheological values obtained for the dough samples forthe different levels of sea salt, dry sourdough and fermented sugar addition, according to our design,were performed twice. The average values were used in the statistical processing.
The responses for the independent variables used in our experiment are shown in Tables 2and 3. For responses of dough rheological properties, experimental values were expressed asmeans ± standard deviations.
Table 1. Experimental design with real values and coded values of independent variables.
Run
Real Values Coded Values
SS(g/100 g)
SD(g/100 g)
FS(mL/100 g) X1 X2 X3
1 0.90 2.75 1.10 0 0 0
2 1.50 0.50 1.50 +1 −1 +1
3 0.90 2.75 1.10 0 0 0
4 0.30 5.00 1.50 −1 +1 +1
5 0.90 0.50 1.10 0 −1 0
6 0.90 2.75 1.50 0 0 +1

Foods 2020, 9, 1465 5 of 20
Table 1. Cont.
Run
Real Values Coded Values
SS(g/100 g)
SD(g/100 g)
FS(mL/100 g) X1 X2 X3
7 1.50 5.00 0.70 +1 +1 −1
8 1.50 5.00 1.50 +1 +1 +1
9 0.30 0.50 0.70 −1 −1 −1
10 0.30 2.75 1.10 −1 0 0
11 0.30 0.50 1.50 −1 −1 +1
12 0.30 5.00 0.70 −1 +1 −1
13 1.50 0.50 0.70 +1 −1 −1
14 0.90 2.75 0.70 0 0 −1
15 0.90 2.75 1.10 0 0 0
16 0.90 2.75 1.10 0 0 0
17 0.90 5.00 1.10 0 +1 0
18 0.90 2.75 1.10 0 0 0
19 0.90 2.75 1.10 0 0 0
20 1.50 2.75 1.10 +1 0 0
Table 2. The effects of different levels of independent variable addition on dough rheological propertiesduring mixing and extension of sea salt–dry sourdough–fermented sugar mixtures.
RunFarinograph Extensograph (Proving Time 135 min)
WA (%) ST (min) DS (UB) E (cm2) R50 (BU) Ext (mm) Rmax (BU) R/E
1 58.0± 0.41 1.4 ± 0.10 76 ± 1.12 95 ± 2.3 611 ± 5.1 110 ± 1.3 665 ± 5.8 6.0 ± 0.14
2 55.7± 0.70 1.2 ± 0.10 51 ± 0.80 132 ± 4.1 898 ± 8.9 106 ± 1.2 949 ± 9.7 6.8 ± 0.16
3 58.0± 0.41 1.4 ± 0.10 76 ± 1.12 95 ± 2.3 611 ± 5.1 110 ± 1.3 665 ± 5.8 6.0 ± 0.14
4 57.4± 0.37 9.6 ± 0.14 44 ± 0.90 95 ± 2.3 545 ± 4.8 116 ± 1.4 627 ± 5.4 5.7 ± 0.13
5 56.4± 0.28 3.4 ± 0.14 55 ± 0.80 102 ± 3.0 530 ± 4.7 122 ± 1.1 629 ± 5.4 5.2 ± 0.12
6 59.2± 0.28 1.3 ± 0.14 69 ± 1.00 95 ± 2.3 619 ± 5.2 109 ± 1.3 693 ± 6.0 6.4 ± 0.17
7 59.8± 0.32 1.0 ± 0.14 97 ± 1.60 82 ± 1.7 590 ± 5.0 103 ± 1.3 620 ± 5.9 6.1 ± 0.13
8 59.6± 0.14 0.9 ± 0.14 93 ± 1.60 93 ± 2.3 680 ± 6.2 102 ± 1.3 711 ± 7.8 7.0 ± 0.24
9 57.8± 0.13 2.9 ± 0.14 59 ± 0.80 77 ± 2.2 392 ± 5.6 123 ± 1.5 453 ± 4.2 3.7 ± 0.10
10 60.0± 0.21 1.4 ± 0.10 81 ± 1.40 73 ± 2.0 430 ± 4.1 117 ± 1.4 466 ± 4.4 4.0 ± 0.10
11 57.4± 0.14 9.6 ± 0.14 44 ± 0.80 95 ± 2.3 545 ± 4.8 116 ± 1.4 627 ± 5.4 5.7 ± 0.13
12 61.4± 0.14 0.9 ± 0.14 130± 2.20 51 ± 0.8 354 ± 5.2 104 ± 1.4 364 ± 5.3 3.5 ± 0.10
13 57.4± 0.28 3.5 ± 0.14 56 ± 0.80 119 ± 3.6 671 ± 5.9 119 ± 1.5 784 ± 8.3 6.6 ± 0.18
14 58.9± 0.42 1.4 ± 0.10 85 ± 1.40 77 ± 2.2 462 ± 4.4 113 ± 1.3 520 ± 4.6 4.6 ± 0.10
15 58.0± 0.28 1.4 ± 0.10 76 ± 1.12 95 ± 2.3 611 ± 5.1 110 ± 1.3 665 ± 5.8 6.0 ± 0.14
16 58.0± 0.28 1.4 ± 0.10 76 ± 1.12 95 ± 2.3 611 ± 5.1 110 ± 1.3 665 ± 5.8 6.0 ± 0.14

Foods 2020, 9, 1465 6 of 20
Table 2. Cont.
RunFarinograph Extensograph (Proving Time 135 min)
WA (%) ST (min) DS (UB) E (cm2) R50 (BU) Ext (mm) Rmax (BU) R/E
17 60.2± 0.14 0.9 ± 0.03 96 ± 1.60 78 ± 2.2 573 ± 4.8 102 ± 1.3 612 ± 5.1 6.0 ± 0.14
18 58.0± 0.14 1.4 ± 0.10 76 ± 1.12 95 ± 2.3 611 ± 5.1 110 ± 1.3 665 ± 5.8 6.0 ± 0.14
19 58.0± 0.28 1.4 ± 0.10 76 ± 1.12 95 ± 2.3 611 ± 5.1 110 ± 1.3 665 ± 5.8 6.0 ± 0.14
20 57.8± 0.28 1.9 ± 0.14 63 ± 0.90 111 ± 3.4 730 ± 8.1 107 ± 1.2 803 ± 8.5 7.5 ± 0.25
WA—water absorption; ST—dough stability; DS—degree of softening at 10 min; E—energy; R50—resistance toextension up to 50 mm; Ext—extensibility; Rmax—maximum resistance; R/E—ratio number at a proving time of135 min.
Table 3. The effects of different levels of independent variable addition on dough rheological propertiesduring pasting and fermentation of sea salt–dry sourdough–fermented sugar mixtures.
RunResponses
PVmax (BU) Tmax (°C) H’m (mm) VT (mL) VR (mL) CR (%)
1 1245 ± 5.66 89.8 ± 0.3 72.5 ± 1.1 1267 ± 6.7 1122 ± 8.1 88.5 ± 0.9
2 1368 ± 1.41 89.8 ± 0.3 55.1 ± 0.7 1213 ± 6.5 1023 ± 7.8 84.3 ± 0.7
3 1245 ± 2.83 89.8 ± 0.3 72.4 ± 1.1 1266 ± 6.6 1120 ± 8.0 88.4 ± 0.9
4 1251 ± 1.84 89.3 ± 0.2 37.2 ± 0.8 601 ± 4.2 589 ± 5.2 98.0 ± 1.2
5 1218 ± 1.41 89.4 ± 0.3 62.5 ± 1.1 1222 ± 8.3 1104 ± 7.8 90.3 ± 1.0
6 1207 ± 1.13 89.1 ± 0.3 70.6 ± 1.0 1103 ± 9.6 1002 ± 7.2 90.8 ± 0.7
7 1265 ± 2.12 90.3 ± 0.4 64.0 ± 0.85 1301 ± 4.0 1119 ± 8.3 86.0 ± 0.5
8 1252 ± 2.10 89.5 ± 0.35 60.0 ± 0.8 1272 ± 6.7 1049 ± 8.1 82.4 ± 0.3
9 1113 ± 1.10 89.1 ± 0.3 70.6 ± 0.9 1376 ± 6.8 1213 ± 6.6 88.1 ± 0.4
10 1198 ± 1.15 89.5 ± 0.4 75.6 ± 1.0 1427 ± 6.9 1215 ± 6.8 85.1 ± 0.4
11 1251 ± 2.10 89.3 ± 0.4 37.2 ± 0.5 601 ± 3.1 589 ± 3.4 98.0 ± 0.2
12 1107 ± 1.20 89.3 ± 0.4 81.0 ± 1.5 1538 ± 8.1 1216 ± 6.5 79.0 ± 0.3
13 1286 ± 2.30 89.8 ± 0.4 64.1 ± 0.8 1279 ± 6.8 1132 ± 7.9 88.5 ± 0.6
14 1270 ± 2.13 89.3 ± 0.4 72.3 ± 1.1 1364 ± 6.7 1161 ± 6.3 85.1 ± 0.6
15 1245 ± 2.10 89.8 ± 0.5 72.5 ± 1.1 1267 ± 6.7 1122 ± 7.3 88.5 ± 0.7
16 1245 ± 2.10 89.8 ± 0.5 72.3 ± 1.1 1264 ± 6.2 1120 ± 7.2 88.6 ± 0.7
17 1250 ± 2.13 90.3 ± 0.6 75.9 ± 1.2 1405 ± 5.9 1244 ± 6.8 88.5 ± 0.7
18 1245 ± 2.10 89.8 ± 0.5 72.4 ± 1.1 1266 ± 8.4 1120 ± 7.2 88.4 ± 0.5
19 1245 ± 2.10 89.8 ± 0.5 72.3 ± 1.1 1267 ± 7.9 1121 ± 7.2 88.4 ± 0.7
20 1315 ± 2.83 90.0 ± 0.5 67.2 ± 1.0 1276 ± 8.1 1108 ± 6.8 86.8 ± 0.7
PVmax—peak viscosity, Tmax—temperature at peak viscosity, H’m—height under constraint of dough at maximumdevelopment time, VT—total volume of CO2 produced during fermentation, VR—volume of the gas retained in thedough at the end of the test, CR—retention coefficient.
The responses of the system (Y1–13) (Equation (1)) have been defined by the followingmathematical model:
Y = f(X1, X2, X3) = β0 +3∑
i = 1
βi·Xi +3∑
i, j = 1i , j
βi j·Xi·X j +3∑
i = 1
βii·X2i (1)

Foods 2020, 9, 1465 7 of 20
where: β0—constant coefficient; βi—linear coefficient; βij—interaction coefficient; βii—quadraticcoefficient; Xi and Xj—the coded values of the independent variables. The ANOVA test was usedto evaluate the significance of the mathematical model terms, as it compares the response variationwith the variation due to random error at the 95% probability value (p-value). The suitability of themathematical model has been checked by the Fisher tests (F-tests), and by the adjusted coefficientof determination (Adjusted R2), the accuracy of the fitted polynomial equation was determined.The non-significant coefficients were eliminated from the equations. In order to show the correlationbetween the independent and dependent variables, three-dimensional representations of the responsesurfaces were generated.
For responses and bakery tests, experimental values were expressed as means ± standarddeviations. The determinations were performed twice. Statistical analysis was carried out using a trialversion 12 of XLSTAT by an analysis of variance (one-way ANOVA) to evaluate the difference betweenmeans at p < 0.05 with Tukey’s test (at a 5% significance level).
3. Results
3.1. Fitting Models
Following the statistical processing of the experimental data, in order to show the effects ofthe independent variables on the predictive mathematical models for rheological properties duringthe mixing of sea salt (SS), dry sourdough (SD) and fermented sugar (FS) mixtures, the most fittingmathematical models (quadratic models) were obtained for the parameters of dough stability (ST),temperature at peak viscosity (Tmax), height under constraint of dough at maximum developmenttime (H’m) and volume of the gas retained in the dough at the end of the test (VR).
3.2. Dough Rheological Properties during Mixing and Extension
The effect of SS, SD and FS addition in wheat flour on dough mixing properties on Farinographvalues expressed by their quadratic models are shown in Table 4. The ANOVA results show that theobtained models were statistically significant (p < 0.001) for dough stability (ST), degree of softening at10 min (DS) and water absorption (WA) with high Adjusted R2 values for ST and DS parameters.
For the dough development time (DT) value, no significant model was obtained. A p-value of lessthan 0.05 indicates that model terms are significant. In our case, we obtained p-value = 0.84 (for thelinear model), p-value = 0.93 for the Two Factor Interaction (2FI) model and p-value = 0.97 for thequadratic model. In this case, there are no significant model terms. Values of p greater than 0.1 indicatethat the mathematical model terms are not significant. The most significant models were obtained forST—Adjusted R2 = 0.78 and DS—Adjusted R2 = 0.82, followed by those obtained for WA for whichAdjusted R2 = 0.62. The linear regression coefficients SS and FS presented a negative effect on WA,whereas the SD term presented a positive one on the WA value. The negative effect of SS on WAvalue has also been reported by different researchers, such as Lopes et al. [3], McCann and Day [25],Beck et al. [26], Beck et al. [27], Jekle et al. [28] and Uthayakumaran et al. [29], whereas the positiveeffect of SD has been previously reported by [14,21]. Chloride salts, just as in the case of SS, increasedhydrophobic interactions between gluten proteins, which aggregate to a higher extent, decreasing theWA value. Furthermore, the FS presence may decrease the pH value, which will affect the positivecharge of proteins, leading to changes in their conformation. This may favor a development of theunfold proteins, leading to a higher amount of reactive groups available to interact with water, a factthat may increase the WA value. On the ST value, the SS and FS have a positive effect, whereasthe SD has a negative one, as it may be seen from Figure 1a,b. This indicates that SS and FS havea strengthening effect on wheat flour dough. A similar effect of chloride salts as SS on wheat flourdough has also been previously reported [29–31]. This is due to the surface hydrophobicity of thegluten proteins, which promotes a higher aggregation in the chloride salt presence [12], leading tohigher ST values. Furthermore, in the presence of FS, which contains organic acids, some of the
Foods 2020, 9, 1465 8 of 20
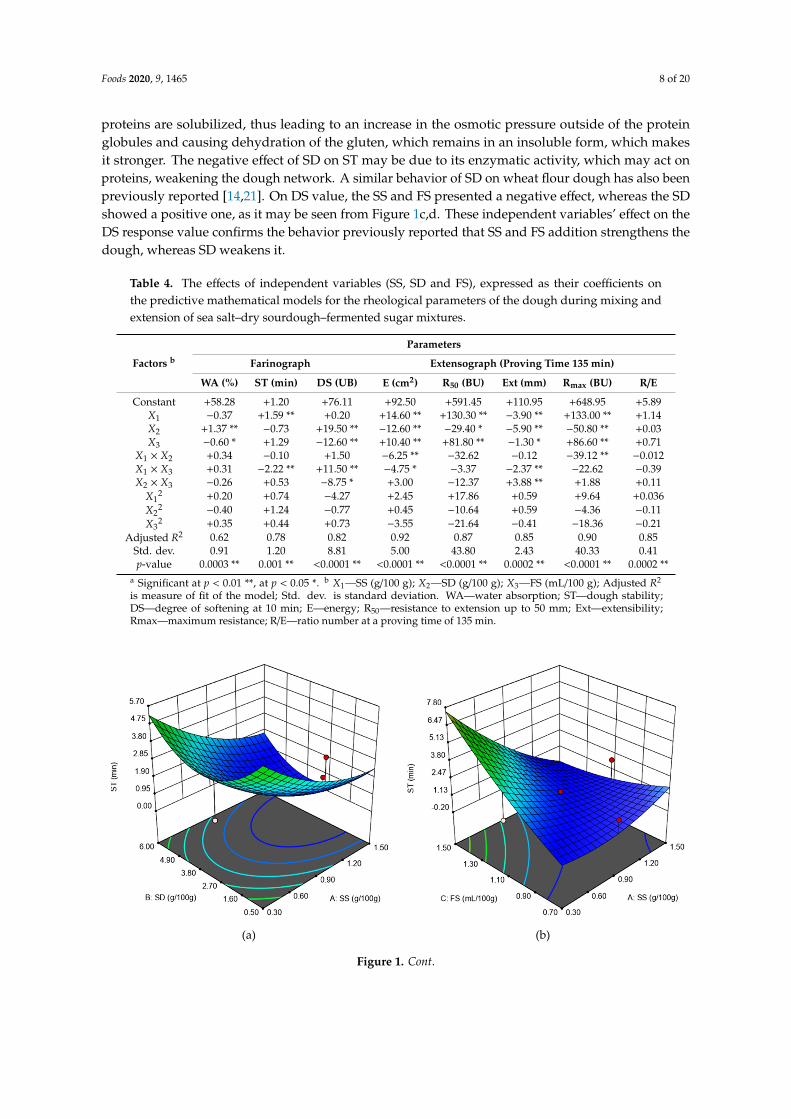
proteins are solubilized, thus leading to an increase in the osmotic pressure outside of the proteinglobules and causing dehydration of the gluten, which remains in an insoluble form, which makesit stronger. The negative effect of SD on ST may be due to its enzymatic activity, which may act onproteins, weakening the dough network. A similar behavior of SD on wheat flour dough has also beenpreviously reported [14,21]. On DS value, the SS and FS presented a negative effect, whereas the SDshowed a positive one, as it may be seen from Figure 1c,d. These independent variables’ effect on theDS response value confirms the behavior previously reported that SS and FS addition strengthens thedough, whereas SD weakens it.
Table 4. The effects of independent variables (SS, SD and FS), expressed as their coefficients onthe predictive mathematical models for the rheological parameters of the dough during mixing andextension of sea salt–dry sourdough–fermented sugar mixtures.
Factors b
Parameters
Farinograph Extensograph (Proving Time 135 min)
WA (%) ST (min) DS (UB) E (cm2) R50 (BU) Ext (mm) Rmax (BU) R/E
Constant +58.28 +1.20 +76.11 +92.50 +591.45 +110.95 +648.95 +5.89X1 −0.37 +1.59 ** +0.20 +14.60 ** +130.30 ** −3.90 ** +133.00 ** +1.14X2 +1.37 ** −0.73 +19.50 ** −12.60 ** −29.40 * −5.90 ** −50.80 ** +0.03X3 −0.60 * +1.29 −12.60 ** +10.40 ** +81.80 ** −1.30 * +86.60 ** +0.71
X1 × X2 +0.34 −0.10 +1.50 −6.25 ** −32.62 −0.12 −39.12 ** −0.012X1 × X3 +0.31 −2.22 ** +11.50 ** −4.75 * −3.37 −2.37 ** −22.62 −0.39X2 × X3 −0.26 +0.53 −8.75 * +3.00 −12.37 +3.88 ** +1.88 +0.11
X12 +0.20 +0.74 −4.27 +2.45 +17.86 +0.59 +9.64 +0.036
X22 −0.40 +1.24 −0.77 +0.45 −10.64 +0.59 −4.36 −0.11
X32 +0.35 +0.44 +0.73 −3.55 −21.64 −0.41 −18.36 −0.21
Adjusted R2 0.62 0.78 0.82 0.92 0.87 0.85 0.90 0.85Std. dev. 0.91 1.20 8.81 5.00 43.80 2.43 40.33 0.41p-value 0.0003 ** 0.001 ** <0.0001 ** <0.0001 ** <0.0001 ** 0.0002 ** <0.0001 ** 0.0002 **
a Significant at p < 0.01 **, at p < 0.05 *. b X1—SS (g/100 g); X2—SD (g/100 g); X3—FS (mL/100 g); Adjusted R2
is measure of fit of the model; Std. dev. is standard deviation. WA—water absorption; ST—dough stability;DS—degree of softening at 10 min; E—energy; R50—resistance to extension up to 50 mm; Ext—extensibility;Rmax—maximum resistance; R/E—ratio number at a proving time of 135 min.
Foods 2020, 9, x FOR PEER REVIEW 8 of 19
(a) (b)
(c) (d)
Figure 1. The graphical representations of the Farinograph parameters: (a) stability (ST) as affected by the levels of sea salt (SS) and dry sourdough (SD) incorporated in wheat flour at 1.10 (mL/100 g) fermented sugar; (b) stability (ST) as affected by the levels of sea salt (SS) and fermented sugar (FS) incorporated in wheat flour at 2.75 (g/100 g) dry sourdough; (c) degree of softening at 10 min (DS) as affected by the levels of sea salt (SS) and dry sourdough (SD) incorporated in wheat flour at 1.10 (mL/100 g) fermented sugar; (d) degree of softening at 10 min (DS) as affected by the levels of sea salt (SS) and fermented sugar (FS) incorporated in wheat flour at 2.75 (g/100 g) dry sourdough.
The Extensograph values: energy (E), resistance to extension (R50), extensibility (Ext) and maximum resistance to extension (Rmax) and ratio number at a proving time of 135 min (R/E) were quadratically influenced by SS, SD and FS addition. All the quadratic models obtained for the Extensograph data were significant (p < 0.001) with an Adjusted R2 higher than 0.85 for all the dependent variables, as it may be seen from Table 2. The effect of SS and FS was a highly significant positive one (p < 0.01) on E, R50, Rmax and R/E whereas SD had a negative effect on these variables. The effect of synergy action of independent variables SS-SD and SS-FS on the rheological parameters determined by the Extensograph led to obtaining of some quadratic models significant for the dependent variables E, Rmax, as it can be seen in Figure 2a–d.
Figure 1. Cont.

Foods 2020, 9, 1465 9 of 20
Foods 2020, 9, x FOR PEER REVIEW 8 of 19
(a) (b)
(c) (d)
Figure 1. The graphical representations of the Farinograph parameters: (a) stability (ST) as affected by the levels of sea salt (SS) and dry sourdough (SD) incorporated in wheat flour at 1.10 (mL/100 g) fermented sugar; (b) stability (ST) as affected by the levels of sea salt (SS) and fermented sugar (FS) incorporated in wheat flour at 2.75 (g/100 g) dry sourdough; (c) degree of softening at 10 min (DS) as affected by the levels of sea salt (SS) and dry sourdough (SD) incorporated in wheat flour at 1.10 (mL/100 g) fermented sugar; (d) degree of softening at 10 min (DS) as affected by the levels of sea salt (SS) and fermented sugar (FS) incorporated in wheat flour at 2.75 (g/100 g) dry sourdough.
The Extensograph values: energy (E), resistance to extension (R50), extensibility (Ext) and maximum resistance to extension (Rmax) and ratio number at a proving time of 135 min (R/E) were quadratically influenced by SS, SD and FS addition. All the quadratic models obtained for the Extensograph data were significant (p < 0.001) with an Adjusted R2 higher than 0.85 for all the dependent variables, as it may be seen from Table 2. The effect of SS and FS was a highly significant positive one (p < 0.01) on E, R50, Rmax and R/E whereas SD had a negative effect on these variables. The effect of synergy action of independent variables SS-SD and SS-FS on the rheological parameters determined by the Extensograph led to obtaining of some quadratic models significant for the dependent variables E, Rmax, as it can be seen in Figure 2a–d.
Figure 1. The graphical representations of the Farinograph parameters: (a) stability (ST) as affectedby the levels of sea salt (SS) and dry sourdough (SD) incorporated in wheat flour at 1.10 (mL/100 g)fermented sugar; (b) stability (ST) as affected by the levels of sea salt (SS) and fermented sugar (FS)incorporated in wheat flour at 2.75 (g/100 g) dry sourdough; (c) degree of softening at 10 min (DS)as affected by the levels of sea salt (SS) and dry sourdough (SD) incorporated in wheat flour at 1.10(mL/100 g) fermented sugar; (d) degree of softening at 10 min (DS) as affected by the levels of sea salt(SS) and fermented sugar (FS) incorporated in wheat flour at 2.75 (g/100 g) dry sourdough.
The Extensograph values: energy (E), resistance to extension (R50), extensibility (Ext) and maximumresistance to extension (Rmax) and ratio number at a proving time of 135 min (R/E) were quadraticallyinfluenced by SS, SD and FS addition. All the quadratic models obtained for the Extensograph datawere significant (p < 0.001) with an Adjusted R2 higher than 0.85 for all the dependent variables, as itmay be seen from Table 2. The effect of SS and FS was a highly significant positive one (p < 0.01) on E,R50, Rmax and R/E whereas SD had a negative effect on these variables. The effect of synergy action ofindependent variables SS-SD and SS-FS on the rheological parameters determined by the Extensographled to obtaining of some quadratic models significant for the dependent variables E, Rmax, as it can beseen in Figure 2a–d.
The E, R50 and Rmax measure the force required to stretch the dough, indicating the dough’sability to resist deformation forces. Therefore, the higher these values are, the stronger the doughis. The ratio number R/E is also a measure of dough strength, meaning that higher values of thisparameter indicate the fact that higher forces are required to stretch the dough. Therefore, the positiveeffect of SS and FS on these Extensograph values indicates their strengthening effect on wheat flourdough, whereas the negative effect of SD on these values indicates a weakening one. The strengtheningeffect produced by chloride salts, as SS on wheat flour dough was previously reported [12,25,32,33],whereas the weakening one of SD on wheat flour dough was reported by Nogueira et al. [14] andVoinea et al. [21]. The regression model for the Ext value has an R2 of 0.92, showing that the modelcould be used to explain more than 92% of the variability in the response. In this model, SS, SDand the interactions between SS and FS and SD and FS are significant model terms (p < 0.001). Allthe linear regression coefficients, SS, SD and FS added in wheat flour dough, presented a negativeeffect on this response, showing that dough extensibility decreased with the increased level of SS, SDand FS addition. Similar results were also obtained for SS addition in wheat flour [12] and for SDincorporation in dough recipe [14,21]. The negative effect of FS on Ext may be due to its organic acidcontent, knowing that normally, the acid addition in wheat flour decreases dough extensibility [34].

Foods 2020, 9, 1465 10 of 20Foods 2020, 9, x FOR PEER REVIEW 9 of 19
(a) (b)
(c) (d)
Figure 2. Graphical representations of the Extensograph parameters: (a) energy (E) as affected by the levels of sea salt (SS) and dry sourdough (SD) incorporated in wheat flour at 1.10 (mL/100 g) fermented sugar; (b) energy (E) as affected by the levels of sea salt (SS) and fermented sugar (FS) incorporated in wheat flour at 2.75 (g/100 g) dry sourdough; (c) maximum resistance (Rmax) as affected by the levels of sea salt (SS) and dry sourdough (SD) incorporated in wheat flour at 1.10 (mL/100 g) fermented sugar; (d) maximum resistance (Rmax) as affected by the levels of sea salt (SS) and fermented sugar (FS) incorporated in wheat flour at 2.75 (g/100 g) dry sourdough.
The E, R50 and Rmax measure the force required to stretch the dough, indicating the dough’s ability to resist deformation forces. Therefore, the higher these values are, the stronger the dough is. The ratio number R/E is also a measure of dough strength, meaning that higher values of this parameter indicate the fact that higher forces are required to stretch the dough. Therefore, the positive effect of SS and FS on these Extensograph values indicates their strengthening effect on wheat flour dough, whereas the negative effect of SD on these values indicates a weakening one. The strengthening effect produced by chloride salts, as SS on wheat flour dough was previously reported [12,25,32,33], whereas the weakening one of SD on wheat flour dough was reported by Nogueira et al. [14] and Voinea et al. [21]. The regression model for the Ext value has an R2 of 0.92, showing that the model could be used to explain more than 92% of the variability in the response. In this model, SS, SD and the interactions between SS and FS and SD and FS are significant model terms (p < 0.001). All the linear regression coefficients, SS, SD and FS added in wheat flour dough, presented a negative effect on this response, showing that dough extensibility decreased with the increased level of SS, SD and FS addition. Similar results were also obtained for SS addition in wheat flour [12] and for SD
Figure 2. Graphical representations of the Extensograph parameters: (a) energy (E) as affected by thelevels of sea salt (SS) and dry sourdough (SD) incorporated in wheat flour at 1.10 (mL/100 g) fermentedsugar; (b) energy (E) as affected by the levels of sea salt (SS) and fermented sugar (FS) incorporated inwheat flour at 2.75 (g/100 g) dry sourdough; (c) maximum resistance (Rmax) as affected by the levelsof sea salt (SS) and dry sourdough (SD) incorporated in wheat flour at 1.10 (mL/100 g) fermentedsugar; (d) maximum resistance (Rmax) as affected by the levels of sea salt (SS) and fermented sugar (FS)incorporated in wheat flour at 2.75 (g/100 g) dry sourdough.
3.3. Dough Rheological Properties during Pasting
The results from model analysis on the Amylograph values showed a significant quadratic effectof SS, SD and FS on peak viscosity (PVmax) and temperature at peak viscosity (Tmax), whereas ongelatinization temperature (Tg, ◦C), no significant model was obtained. The mathematical modelsobtained for the gelatinization temperature (Tg, ◦C) were not significant because we obtained thefollowing values of p: p-value = 0.062 (for the linear model), p-value = 0.2243 (for the 2FI model) andp-value = 0.2282 (for the quadratic model). The experimental modelling analysis on Amylographvalues is shown in Table 5. The most significant model for Amylograph was that obtained for Tmax,where Adjusted R2 = 0.71, followed by those obtained for PVmax where Adjusted R2 = 0.65.

Foods 2020, 9, 1465 11 of 20
Table 5. The effects of independent variables (SS, SD and FS), expressed as their coefficients on thepredictive mathematical models for the rheological parameters of the dough during pasting andfermentation of sea salt–dry sourdough–fermented sugar mixtures.
Factors b Parameters
PVmax (BU) Tmax (◦C) H’m (mm) VT (mL) VR (mL) CR (%)
Constant +1241.35 +89.75 +73.65 +1229.95 +1147.61 +88.22X1 +56.60 ** +0.29 ** +0.88 +79.80 * +60.90 * −2.02 **X2 −11.10 +0.13 * +2.86 +42.60 +15.60 −1.53 *X3 +28.80 * −0.08 −9.19 ** −206.80 ** −158.90 ** +2.68 **
X1 × X2 −16.37 +0.001 −0.70 −10.12 +1.25 +0.59X1 × X3 −26.62 −0.12 * +8.03 ** +202.13 ** +134.00 ** −4.59 **X2 × X3 −11.12 −0.12 * −0.67 −15.62 +4.50 +1.21 *
X12 +10.64 +0.077 −4.13 +5.86 −26.27 −1.91
X22 −11.86 +0.18 −6.33 * −32.14 −13.77 +1.54
X32 −7.36 −0.47 * −4.08 −112.14 −106.27 +0.091
Adjusted R2 0.65 0.71 0.75 0.80 0.77 0.83Std. dev. 34.95 0.19 5.81 103.26 84.20 1.79p-value 0.00123 ** 0.0045 ** 0.0022 ** 0.0007 ** 0.0014 ** 0.0003 **
a Significant at p < 0.01 **, at p < 0.05 *. b X1—SS (g/100 g); X2—SD (g/100 g); X3—FS (mL/100 g); AdjustedR2 is measure of fit of the model; Std. dev. is standard deviation. PVmax—peak viscosity, Tmax—temperatureat peak viscosity, H’m—height under constraint of dough at maximum development time, VT—total volumeof CO2 produced during fermentation, VR—volume of the gas retained in the dough at the end of the test,CR—retention coefficient.
There was a positive effect on PVmax produced by the linear terms SS and FS, whereas a negativeone was produced by the linear term SD and the interaction terms between the independent variablesSS, SD and FS, as shown in Figure 3a,b.
Following SD and FS addition, the pH of the wheat flour dough decreased. This fact will influencethe main components of the wheat flour dough, namely gluten and starch. SS is a product obtainedthrough wheat fermentation. Furthermore, FS is a fermented sugar. It is well known that throughthe fermentation process, the amount of lactic bacteria and acidic products increases, which leadsto a decrease in pH values. The PVmax decreased following the interaction between SS, SD and FS.This may be explained by the fact that, at low pH values specific to dough systems, by adding SDand FS, the solubility of the protein fractions are affected. Furthermore, a slightly acidic hydrolysis ofwheat flour starch is known to take place under the pH conditions of acidic dough [35]. The structuralchanges from the acidic dough are also influenced by enzyme activity from the wheat flour, especially inamylases which affect starch rheological behavior during heating, as was recorded by the Amylographdevice. However, the addition of SS in a linear form suppressed amylolytic activity due to the salt’spresence, which in turn led to an increase in the PVmax value. A similar behavior was previouslyreported by different researchers [14,21]. Furthermore, an increase in the PVmax value may also benoticed by adding FS in a linear form. This fact may be due to a decrease in the pH value of the doughsystem to a value that may reduce amylase activity in a significant way. However, the linear term SDand the interaction terms between SS, SD and FS decreased the PVmax value. This behavior may beattributed to the SD ingredient, which may contain a certain amount of α amylase activity, taking intoaccount that SD is obtained after the fermentation process of wheat flour [21].

Foods 2020, 9, 1465 12 of 20Foods 2020, 9, x FOR PEER REVIEW 11 of 19
(a) (b)
(c) (d)
Figure 3. Graphical representations of the Amylograph parameters: (a) peak viscosity (PVmax) as affected by the levels of sea salt (SS) and dry sourdough (SD) incorporated in wheat flour at 1.10 (mL/100 g) fermented sugar; (b) peak viscosity (PVmax) as affected by the levels of sea salt (SS) and fermented sugar (FS) incorporated in wheat flour at 2.75 (g/100 g) dry sourdough; (c) temperature at peak viscosity (Tmax) as affected by the levels of sea salt (SS) and dry sourdough (SD) incorporated in wheat flour at 1.10 (mL/100 g) fermented sugar; (d) temperature at peak viscosity (Tmax) as affected by the levels of sea salt (SS) and fermented sugar (FS) incorporated in wheat flour at 2.75 (g/100 g) dry sourdough.
Following SD and FS addition, the pH of the wheat flour dough decreased. This fact will influence the main components of the wheat flour dough, namely gluten and starch. SS is a product obtained through wheat fermentation. Furthermore, FS is a fermented sugar. It is well known that through the fermentation process, the amount of lactic bacteria and acidic products increases, which leads to a decrease in pH values. The PVmax decreased following the interaction between SS, SD and FS. This may be explained by the fact that, at low pH values specific to dough systems, by adding SD and FS, the solubility of the protein fractions are affected. Furthermore, a slightly acidic hydrolysis of wheat flour starch is known to take place under the pH conditions of acidic dough [35]. The structural changes from the acidic dough are also influenced by enzyme activity from the wheat flour, especially in amylases which affect starch rheological behavior during heating, as was recorded by the Amylograph device. However, the addition of SS in a linear form suppressed amylolytic activity due to the salt’s presence, which in turn led to an increase in the PVmax value. A similar behavior was previously reported by different researchers [14,21]. Furthermore, an increase in the PVmax value may also be noticed by adding FS in a linear form. This fact may be due to a decrease in the pH value of
Figure 3. Graphical representations of the Amylograph parameters: (a) peak viscosity (PVmax)as affected by the levels of sea salt (SS) and dry sourdough (SD) incorporated in wheat flour at1.10 (mL/100 g) fermented sugar; (b) peak viscosity (PVmax) as affected by the levels of sea salt (SS) andfermented sugar (FS) incorporated in wheat flour at 2.75 (g/100 g) dry sourdough; (c) temperature atpeak viscosity (Tmax) as affected by the levels of sea salt (SS) and dry sourdough (SD) incorporated inwheat flour at 1.10 (mL/100 g) fermented sugar; (d) temperature at peak viscosity (Tmax) as affectedby the levels of sea salt (SS) and fermented sugar (FS) incorporated in wheat flour at 2.75 (g/100 g)dry sourdough.
For the Tmax value, a positive effect was produced by the linear terms related to SS, SD andthe interactions between them, and a negative one by FS and the interaction between the latter andthe independent variables SS and SD, as shown in Figure 3c,d. It is well known that the Tmax valuedepends, among others, on the amount of water in the dough system. The SS, due to its ionic nature,decreased water activity, whereas SD addition favors protein weakening and, therefore, the wateravailability in the dough system. This influences the temperature value at which PVmax was recorded,these data being in accordance with those reported by Nogueira et al. [14] and Voinea et al. [21].
3.4. Dough Rheological Properties during Fermentation
The dough rheological parameters recorded during fermentation were maximum height of gaseousproduction (H’m), volume of the gas retained at the end of the test (VR), total CO2 volume production(VT) and retention coefficient (CR). In Table 3, the models obtained for these parameters and theregression coefficients are presented. For all the Rheofermentometer values, the most significant

Foods 2020, 9, 1465 13 of 20
influences were presented by the linear term FS and the interaction between SS and FS (p < 0.01).The H’m, VR and CR were quadratic, being influenced by the amount of SS, SD and FS added. All themodels obtained for the Rheofermentometer data were significant (p < 0.01), which reflects the factthat they are useful to describe the relationship between the SS, SD, FS and the dependent variables.According to the Adjusted R2 values, the most significant mathematical models were those obtainedfor VT (Adjusted R2 = 0.80) and CR (Adjusted R2 = 0.83), followed by those obtained for VR (AdjustedR2 = 0.77) and H’m (Adjusted R2 = 0.75). The effects of the interaction factors (SS–SD; SS–FS) obtainedfor the Rheofermentometer values VT and CR are shown in Figure 4.Foods 2020, 9, x FOR PEER REVIEW 13 of 19
(a) (b)
(c) (d)
Figure 4. Graphical representations of the Rheofermentometer parameters: (a) total CO2 volume production (VT) as affected by the levels of sea salt (SS) and dry sourdough (SD) incorporated in wheat flour at 1.10 (mL/100 g) fermented sugar; (b) total CO2 volume production (VT) as affected by the levels of sea salt (SS) and fermented sugar (FS) incorporated in wheat flour at 2.75 (g/100 g) dry sourdough; (c) retention coefficient (CR) as affected by the levels of sea salt (SS) and dry sourdough (SD) incorporated in wheat flour at 1.10 (mL/100 g) fermented sugar; (d) retention coefficient (CR) as affected by the levels of sea salt (SS) and fermented sugar (FS) incorporated in wheat flour at 2.75 (g/100 g) dry sourdough.
The independent variable addition of SS and SD presented a positive effect on H’m, VT and VR values, whereas addition of FS presented a negative one. The positive effect of SS and SD parameters on these Rheofermentometer values may be explained by an increase in the yeast fermentation speed due to SS and SD addition [34]. This caused an increase in the gas formed during fermentation and, therefore, in the VT value, which consequently led to an increased H’m value. Generally speaking, it is well known that chloride salts affect yeast fermentation, especially by repressing it, due to the osmotic pressure effect [35]. However, when low levels of salt are incorporated in the dough system, yeast cell multiplication is stimulated. This behavior is attributed to the annihilation of the toxic action of thionine by salt, which slows down yeast fermentation activity [21]. According to our design from the 20 runs analyzed, only five of them exceeded the level of 1 g/100 g salt addition in wheat flour. On the other hand, it is well known that only levels higher than 1% have a significant effect on suppressing yeast fermentation activity. Therefore, taking into account that 75% of the samples analyzed in the present study presented low levels of salt incorporated in the dough system, the general effect was a positive one on H’m, VT and VR values, due to increased yeast fermentation activity. Regarding the positive effect of SD on H’m, VT and VR values, this may be due to its
Figure 4. Graphical representations of the Rheofermentometer parameters: (a) total CO2 volumeproduction (VT) as affected by the levels of sea salt (SS) and dry sourdough (SD) incorporated inwheat flour at 1.10 (mL/100 g) fermented sugar; (b) total CO2 volume production (VT) as affected bythe levels of sea salt (SS) and fermented sugar (FS) incorporated in wheat flour at 2.75 (g/100 g) drysourdough; (c) retention coefficient (CR) as affected by the levels of sea salt (SS) and dry sourdough (SD)incorporated in wheat flour at 1.10 (mL/100 g) fermented sugar; (d) retention coefficient (CR) as affectedby the levels of sea salt (SS) and fermented sugar (FS) incorporated in wheat flour at 2.75 (g/100 g)dry sourdough.
The independent variable addition of SS and SD presented a positive effect on H’m, VT and VRvalues, whereas addition of FS presented a negative one. The positive effect of SS and SD parameterson these Rheofermentometer values may be explained by an increase in the yeast fermentation speeddue to SS and SD addition [34]. This caused an increase in the gas formed during fermentation and,therefore, in the VT value, which consequently led to an increased H’m value. Generally speaking, it is

Foods 2020, 9, 1465 14 of 20
well known that chloride salts affect yeast fermentation, especially by repressing it, due to the osmoticpressure effect [35]. However, when low levels of salt are incorporated in the dough system, yeastcell multiplication is stimulated. This behavior is attributed to the annihilation of the toxic action ofthionine by salt, which slows down yeast fermentation activity [21]. According to our design from the20 runs analyzed, only five of them exceeded the level of 1 g/100 g salt addition in wheat flour. On theother hand, it is well known that only levels higher than 1% have a significant effect on suppressingyeast fermentation activity. Therefore, taking into account that 75% of the samples analyzed in thepresent study presented low levels of salt incorporated in the dough system, the general effect was apositive one on H’m, VT and VR values, due to increased yeast fermentation activity. Regarding thepositive effect of SD on H’m, VT and VR values, this may be due to its amylolytic activity, which favorsstarch hydrolysis, leading to more fermentable sugars available for yeast activity [36,37]. From theindependent variables used, only FS presented a negative effect on H’m, VT and VR values. This hasalso presented the most significant influence (p < 0.01) on these Rheofermentometer values. This maybe due to the fact that this ingredient is a fermented sugar product which contains organic acidsthat may lead to a decrease in the pH dough value. This may cause a decrease in α-amylase activity,which may lead to lower levels of fermentable sugars for yeast activity. As a consequence, the gasformed during fermentation will decrease, resulting in lower H’m, VT and VR values. For CR value,SS and SD presented a negative effect, whereas FS presented a positive one. Taking into account thatCR is the ratio between VR and VT values, it is possible for FS to have a higher effect on VR value thanSS and SD on the VT one.
3.5. Optimization of Sea Salt, Dry Sourdough and Fermented Sugar Formulation
Obtaining the optimal values of the dough rheological parameters was one of the objectives ofthis study. Based on the results obtained in the experiment, the combination of the response surfacemethodology with Derringer’s desirability function (Equation (2)) allows the prediction of the optimalvalues of independent variables. The Derringer’s desirability function approach is one of the most usedtools in industry for optimizing multiple response processes [20,38]. Derringer’s desirability functionis based on the idea that the quality of a process that has several quality characteristics, with some ofthem outside desired limits, is completely undesirable.
D =(dr1
1 ·dr22 · . . . ·d
rnn
) 1∑ri (2)
where d1, d2, . . . , dn are indices of desirability of the dependent variables and r1, r2, . . . , ri are therelative importance of the dependent variables. The desirability function takes values between 0 and1, 0 for undesirable values, and 1 for a completely desirable value. The optimization process wasperformed using the trial version 12 of Design Expert software, (Stat-Ease, Minneapolis, MN, USA).Thus, applying the desirability function methodology, the optimal values of the independent variableswere calculated (Figure 5).
The optimum amounts obtained were 0.30 g/100 g SS, 0.50 g/100 g SD and 1.02 mL/100 g FS addedin wheat flour, with a desirable function score of 0.618018. Compared to our previous results [20,21]when other formulations for sodium replacement were used, we may conclude that this was the best one.This formulation contains the lowest sodium amount from sea salt composition (only 0.30% comparedto 1.396% SS in our previous study [21] or 1.31% NaCl of another study [20]. The correspondingresponses for these optimum values obtained in this study are shown in Table 6, in which these dataare compared to those in which 1.5% NaCl was added in the wheat flour (control sample).

Foods 2020, 9, 1465 15 of 20
Foods 2020, 9, x FOR PEER REVIEW 14 of 19
amylolytic activity, which favors starch hydrolysis, leading to more fermentable sugars available for yeast activity [36,37]. From the independent variables used, only FS presented a negative effect on H’m, VT and VR values. This has also presented the most significant influence (p < 0.01) on these Rheofermentometer values. This may be due to the fact that this ingredient is a fermented sugar product which contains organic acids that may lead to a decrease in the pH dough value. This may cause a decrease in α-amylase activity, which may lead to lower levels of fermentable sugars for yeast activity. As a consequence, the gas formed during fermentation will decrease, resulting in lower H’m, VT and VR values. For CR value, SS and SD presented a negative effect, whereas FS presented a positive one. Taking into account that CR is the ratio between VR and VT values, it is possible for FS to have a higher effect on VR value than SS and SD on the VT one.
3.5. Optimization of Sea Salt, Dry Sourdough and Fermented Sugar Formulation
Obtaining the optimal values of the dough rheological parameters was one of the objectives of this study. Based on the results obtained in the experiment, the combination of the response surface methodology with Derringer’s desirability function (Equation (2)) allows the prediction of the optimal values of independent variables. The Derringer’s desirability function approach is one of the most used tools in industry for optimizing multiple response processes [20,38]. Derringer’s desirability function is based on the idea that the quality of a process that has several quality characteristics, with some of them outside desired limits, is completely undesirable. = · · … · ∑
(2)
where d1, d2, …, dn are indices of desirability of the dependent variables and r1, r2, …, ri are the relative importance of the dependent variables. The desirability function takes values between 0 and 1, 0 for undesirable values, and 1 for a completely desirable value. The optimization process was performed using the trial version 12 of Design Expert software, (Stat-Ease, Minneapolis, MN, USA). Thus, applying the desirability function methodology, the optimal values of the independent variables were calculated (Figure 5).
Figure 5. Desirability function scores for the studied independent and dependent variables: sea salt (SS), dry sourdough (SD), fermented sugar (FS), water absorption (WA), dough development time (DT), dough stability (ST), degree of softening at 10 min (DS), gelatinization temperature (Tg), peak viscosity (PVmax), temperature at peak viscosity (Tmax), maximum height of gaseous production (H’m), total CO2 volume production (VT), volume of the gas retained in the dough at the end of the test (VR),
Figure 5. Desirability function scores for the studied independent and dependent variables: sea salt(SS), dry sourdough (SD), fermented sugar (FS), water absorption (WA), dough development time (DT),dough stability (ST), degree of softening at 10 min (DS), gelatinization temperature (Tg), peak viscosity(PVmax), temperature at peak viscosity (Tmax), maximum height of gaseous production (H’m), total CO2
volume production (VT), volume of the gas retained in the dough at the end of the test (VR), retentioncoefficient (CR), energy (E), resistance to extension (R50), extensibility (Ext), maximum resistance toextension (Rmax) and ratio number (R/E) at a proving time of 135 min.
Table 6. The characterization of wheat flour dough rheological properties with 1.5% NaCl addition(control sample) and the optimized sea salt, dry sourdough and fermented sugar formulation sample.
ParametersValues
Control Sample Optimized Sample
Water absorption (%) 57.2 ± 0.1 56.6Dough development time (min) 2.7 ± 0.1 1.5
Stability (min) 3.6 ± 0.2 4.6Degree of softening (UB) 61 ± 0.8 57
Energy (cm2) 85 ± 2.2 83.95Resistance to extension up to 50 mm (BU) 416 ± 3.9 437.35
Extensibility (mm) 122 ± 1.1 122.14Maximum resistance (BU) 298 ± 5.6 502.69
Ratio number at a proving time of 135 2.78 ± 0.2 4.34Gelatinization temperature (◦C) 63.9 ± 0.1 63.86
Peak viscosity (BU) 1290 ± 3.1 1163.81Temperature at peak viscosity (◦C) 89.9 ± 0.2 89.50
Maximum height of gaseous production (mm) 50.6 ± 0.8 62.91Total CO2 volume production (mL) 939 ± 3.5 1236.85
Volume of the gas retained in the dough at the end of the test (mL) 855 ± 2.3 1104.63Retention coefficient (%) 91.0 ± 0.1 90.37
It may be seen that dough rheological properties during mixing and pasting are not significantlydifferent between the optimized and control sample. Regarding the extension data obtained throughthe Extensograph device, similar data may be noticed, with a significant difference only betweenmaximum resistance and ratio number at a proving time of 135 min, for which the optimized samplepresented higher values. This indicates that the optimum formulation of SS, SD and FS has moreof a strengthening effect on dough rheological properties during extension than the chloride salt

Foods 2020, 9, 1465 16 of 20
at a 1.5% addition in wheat flour. Regarding dough rheological properties during fermentation, aslight difference may be seen between the compared samples, the optimized one presenting highervalues. This behavior may be due to the fact that a higher level of NaCl addition (such as 1.5% NaCladdition in wheat flour) causes yeast activity to decrease on the semi-permeable membrane of yeastcells and to the osmotic pressure from the dough system [21]. Furthermore, the optimized samplecontains dry sourdough (SD), which may exhibit slightly amylolytic activity, favoring starch hydrolysis,which increases yeast activity [37], and sea salt in a low amount of only 0.30 g/100 g wheat flour, which,at this level, stimulates yeast activity [21].
3.6. Quality Characteristics for Bread Samples with 1.5% NaCl Addition (Control Sample) and the OptimizedSea Salt, Sry Sourdough and Sermented Sugar Formulation
The bread quality characteristics for the optimized and control bread samples are shown in Table 7.Furthermore, the image of the obtained bread samples is shown in Figure 6.
Table 7. The characterization of bread quality characteristics for the samples with 1.5% NaCl addition(control sample) and the optimized sea salt, dry sourdough and fermented sugar formulation sample.
ParametersValues
Control Sample Optimized Sample
Physical characteristics
Loaf volume (cm3/100 g) 332.97 ± 1.2 a 343.83 ± 1.3 a
Porosity (%) 95.00 ± 0.15 a 96.66 ± 0.14 a
Elasticity (%) 67.88 ± 0.12 a 75.49 ± 0.15 a
Color characteristics
Lightness—L* 73.9 ± 0.12 a 71.81 ± 0.16 a
Redness/greenness—a* −3.73 ± 0.08 a−3.72 ± 0.06 a
Yellowness/blueness—b* 20.83 ± 0.09 a 21.24 ± 0.11 a
Textural characteristics
Springiness (%) 81.36 ± 0.22 a 88.83 ± 0.12 a
Cohesiveness 0.75 ± 0.01 a 0.82 ± 0.02 a
Gumminess (kg) 1.22 ± 0.06 a 1.27 ± 0.05 a
Firmness (kg) 1.61 ± 0.02 a 1.55 ± 0.02 a
Resilience 1.53 ± 0.06 a 1.71 ± 0.04 a
Sensory characteristics
Appearance 8.44 ± 0.05 a 8.66 ± 0.03 a
Color 8.11 ± 0.07 a 8.55 ± 0.06 a
Taste 7.77 ± 0.12 a 8.33 ± 0.17 a
Smell 7.66 ± 0.16 a 8.22 ± 0.11 a
Texture 7.00 ± 0.21 a 8.33 ± 0.18 a
Flavor 7.44 ± 0.13 a 8.11 ± 0.14 a
Overall acceptability 8.00 ± 0.14 a 8.44 ± 0.12 a
The values are means ± standard deviations of three replicates. Means in the same column followed by identicalsuperscript letters (a) indicates no significant difference at p < 0.05.

Foods 2020, 9, 1465 17 of 20Foods 2020, 9, x FOR PEER REVIEW 17 of 19
(a) (b)
Figure 6. The bread samples obtained: (a) optimized bread sample, (b) control bread sample.
From the color point of view, it may be seen that the optimized sample presents lower lightness (L* value) and higher greenness (a* value) and yellowness (b* value) than the control sample. This may be attributed to the formulation mix used to obtain the optimized sample. It contains dry sourdough, which may present a slightly amylolytic and proteolytic activity. This increases the amount of amino acids and fermentable sugars from the dough system, favoring melanoidin formation during the baking process, leading to a darker bread color. This may also contribute to the formation of a higher amount of flavor compounds during baking, which improves the bread’s sensory properties. Apart from these properties, the optimized sample contains fermented sugar, which presents aroma components that lead to a slightly acidic flavor combined with ferment and savory notes (bouillon, umami). The data obtained for the optimized bread sample from the sensory point of view were quite surprising for us since this sample contains a very low amount of sodium chloride, which comes only from sea salt. Even so, the taste and flavor of the optimized sample were better appreciated than those of the control one.
4. Conclusions
According to the data obtained, all of the independent variables, SS, SD and FS, changed the rheological characteristics of wheat flour dough during mixing, extension, pasting and fermentation. During mixing, it was noticed that water absorption (WA) decreased by SS and FS addition and increased when SD was incorporated in the wheat flour dough. From all the independent variables used, it seems that only SD presented a significant effect on dough weakening by decreasing dough stability (ST) (p < 0.1) and increasing the degree of softening at 10 min DS (p < 0.01). As well as that, SD also presented a significant (p < 0.1) weakening effect on dough rheological properties during extension by decreasing all the Extensograph E, R50 and Rmax values, whereas the SS and FS increase was significant (p < 0.01). On peak viscosity during pasting, SS and FS presented a significantly positive effect (p < 0.01), whereas SD presented a negative one. On all the Rheofermentometer-analyzed values except the retention coefficient value, the SS and SD presented a positive effect, whereas FS, a negative one. Response surface methodology was an efficient statistical tool able to model the influence of SS, SD, and FS on dough rheological properties. The models obtained for the variables were significant, with high values of Adjusted R2 ≥ 0.71 (except for WA—0.62 and PVmax—0.65) and all p-values < 0.01 showing, for most dependent variables, no lack of fit. The optimum values, obtained with the numerical method, were: for SS—0.30 g/100 g wheat flour, for SD—0.50 g/100 g wheat flour and for FS—1.02 mL/100 g wheat flour. For this formulation, compared to a control sample in which only 1.5% NaCl was incorporated in wheat flour, the dough rheological properties during fermentation were higher but no significant differences were obtained for those obtained during mixing and pasting. The comparison between the optimized bread sample characteristics obtained through the baking test and control sample indicates no significant differences (p < 0.05) between samples. However, the optimized sample presented better
Figure 6. The bread samples obtained: (a) optimized bread sample, (b) control bread sample.
As it may be seen, no significant differences (p < 0.05) were obtained between samples. However,it may be noticed that the optimized sample presented a higher quality than the control one. It presentedhigher physical and textural characteristics (with the exception of firmness) and was better appreciatedfrom the sensory point of view. The higher physical and textural characteristics of the optimized breadsample may be due to the fact that it was obtained from wheat flour dough with higher values fordough rheological properties during fermentation, such as maximum height of gaseous production,total CO2 volume production, volume of the gas retained in the dough at the end of the test than thecontrol sample. Therefore, the optimized bread sample (Figure 6a) was obtained from a wheat flourdough which can better retain the gas formed in a higher amount during the fermentation processthan the control sample (Figure 6b).
From the color point of view, it may be seen that the optimized sample presents lower lightness(L* value) and higher greenness (a* value) and yellowness (b* value) than the control sample. This maybe attributed to the formulation mix used to obtain the optimized sample. It contains dry sourdough,which may present a slightly amylolytic and proteolytic activity. This increases the amount of aminoacids and fermentable sugars from the dough system, favoring melanoidin formation during the bakingprocess, leading to a darker bread color. This may also contribute to the formation of a higher amountof flavor compounds during baking, which improves the bread’s sensory properties. Apart from theseproperties, the optimized sample contains fermented sugar, which presents aroma components thatlead to a slightly acidic flavor combined with ferment and savory notes (bouillon, umami). The dataobtained for the optimized bread sample from the sensory point of view were quite surprising forus since this sample contains a very low amount of sodium chloride, which comes only from seasalt. Even so, the taste and flavor of the optimized sample were better appreciated than those of thecontrol one.
4. Conclusions
According to the data obtained, all of the independent variables, SS, SD and FS, changed therheological characteristics of wheat flour dough during mixing, extension, pasting and fermentation.During mixing, it was noticed that water absorption (WA) decreased by SS and FS addition andincreased when SD was incorporated in the wheat flour dough. From all the independent variablesused, it seems that only SD presented a significant effect on dough weakening by decreasing doughstability (ST) (p < 0.1) and increasing the degree of softening at 10 min DS (p < 0.01). As well as that,SD also presented a significant (p < 0.1) weakening effect on dough rheological properties duringextension by decreasing all the Extensograph E, R50 and Rmax values, whereas the SS and FS increasewas significant (p < 0.01). On peak viscosity during pasting, SS and FS presented a significantly

Foods 2020, 9, 1465 18 of 20
positive effect (p < 0.01), whereas SD presented a negative one. On all the Rheofermentometer-analyzedvalues except the retention coefficient value, the SS and SD presented a positive effect, whereas FS,a negative one. Response surface methodology was an efficient statistical tool able to model theinfluence of SS, SD, and FS on dough rheological properties. The models obtained for the variableswere significant, with high values of Adjusted R2
≥ 0.71 (except for WA—0.62 and PVmax—0.65) and allp-values < 0.01 showing, for most dependent variables, no lack of fit. The optimum values, obtainedwith the numerical method, were: for SS—0.30 g/100 g wheat flour, for SD—0.50 g/100 g wheat flourand for FS—1.02 mL/100 g wheat flour. For this formulation, compared to a control sample in whichonly 1.5% NaCl was incorporated in wheat flour, the dough rheological properties during fermentationwere higher but no significant differences were obtained for those obtained during mixing and pasting.The comparison between the optimized bread sample characteristics obtained through the bakingtest and control sample indicates no significant differences (p < 0.05) between samples. However,the optimized sample presented better characteristics from the physical and textural points of viewand was darker and more appreciated by the panelists from the sensory point of view.
Author Contributions: A.V., S.-G.S. and G.G.C. contributed equally to the study design, collection of data,development of the sampling, analyses, interpretation of results and preparation of the paper. All authors haveread and agreed to the published version of the manuscript.
Funding: This research received no external funding.
Acknowledgments: This work was supported by contract no. 18PFE/16.10.2018, funded by the Ministryof Research and Innovation within Program 1: Development of national research and development system,Subprogram 1.2: Institutional Performance—RDI excellence funding projects.
Conflicts of Interest: The authors declare no conflict of interest.
References
1. Van Buren, L.; Dötsch-Klerk, M.; Seewi, G.; Newson, R.S. Dietary impact of adding potassium chloride tofoods as a sodium reduction technique. Nutrients 2016, 8, 235. [CrossRef]
2. Zandstra, E.H.; Lion, R.; Newson, R.S. Salt reduction: Moving from consumer awareness to action.Food Qual. Prefer. 2016, 48, 376–381. [CrossRef]
3. Lopes, M.; Cavaleiro, C.; Ramos, F. Sodium reduction in bread: A role for glasswort (Salicornia ramosissimaJ. woods). Compr. Rev. Food Sci. Food 2017, 16, 1056–1071. [CrossRef]
4. Kloss, L.; Meyer, J.D.; Graeve, L.; Vetter, W. Sodium intake and its reduction by food reformulation in theEuropean Union—A review. NFS J. 2015, 1, 9–19. [CrossRef]
5. Belc, N.; Smeu, I.; Macri, A.; Vallauri, D.; Flynn, K. Reformulating foods to meet current scientific knowledgeabout salt, sugar and fats. Trends Food Sci. Technol. 2019, 84, 25–28. [CrossRef]
6. Silow, C.; Axel, C.; Zannini, E.; Arendt, E.K. Current status of salt reduction in bread and bakery products—Areview. J. Cereal Sci. 2016, 72, 135–145. [CrossRef]
7. Lynch, E.J.; Dal Bello, F.; Sheehan, E.M.; Cashman, K.D.; Arendt, E.K. Fundamental studies on the reductionof salt on dough and bread characteristics. Food Res. Int. 2009, 42, 885–891. [CrossRef]
8. Moreau, L.; Lagrange, J.; Bindzus, W.; Hill, S. Influence of sodium chloride on colour, residual volatiles andacrylamide formation in model systems and breakfast cereals. Int. J. Food Sci. Technol. 2009, 44, 2407–2416.[CrossRef]
9. Koliandris, A.L.; Morris, C.; Hewson, L.; Hort, J.; Taylor, A.J.; Wolf, B. Correlation between saltinessperception and shear flow behavior for viscous solutions. Food Hydrocoll. 2010, 24, 792–799. [CrossRef]
10. Bassett, M.N.; Palacios, T.P.; Cipriano, I.; Cardoso, P.; Ferreira, I.M.; Samman, N.; Pinho, O. Development ofbread with NaCl reduction and calcium fortification: Study of its quality. J. Food Qual. 2013, 37, 107–116.[CrossRef]
11. Belz, M.C.E.; Ryan, L.A.M.; Arendt, E.K. The Impact of Salt Reduction in Bread: A Review. Crit. Rev. FoodSci. Nutr. 2012, 52, 514–524. [CrossRef]
12. Miller, R.A.; Hoseney, R.C. Role of Salt in Baking. Cereal Foods World 2008, 53, 4–6. [CrossRef]

Foods 2020, 9, 1465 19 of 20
13. Raffo, A.; Carcea, M.; Moneta, E.; Narducci, V.; Nicoli, S. Influence of different levels of sodium chloride of areduced sodium salt substitute on volatiles formation and sensory quality of wheat bread. J. Cereal Sci. 2018,79, 519–526. [CrossRef]
14. Nogueira, A.C.; Kussano, J.T.; Steel, C.J. Sourdough reduces sodium in wheat flour doughs. Int. J. FoodSci. Technol. 2015, 50, 2621–2629. [CrossRef]
15. Jimenez-Maroto, L.A.; Sato, T.; Rankin, S.A. Saltiness potentiation in white bread by substituting sodiumchloride with a fermented soy ingredient. J. Cereal Sci. 2013, 58, 313–317. [CrossRef]
16. Israr, T.; Rakha, A.; Sohail, M.; Rashid, S.; Shehzad, A. Salt reduction in baked products: Strategies andconstraints. Trends Food Sci. Technol. 2016, 51, 98–105. [CrossRef]
17. Zhao, C.J.; Kinner, M.; Wismer, W.; Ganzle, M.G. Effect of glutamate-accumulation during sourdoughfermentation with Lactobacillus reuteri on the taste of bread and sodium-reduced bread. Cereal Chem. 2014,92, 224–230. [CrossRef]
18. Belz, M.C.E.; Mairinger, R.; Zannini, E.; Ryan, L.A.M.; Cashman, K.D.; Arendt, E.K. The effect of sourdoughand calcium propionate on the microbial shelf-life of salt-reduced bread. Appl. Microbiol. Biotechnol. 2012, 96,493–501. [CrossRef]
19. Simsek, S.; Martinez, M.O. Quality of dough and bread prepared with sea salt or sodium chloride. J. FoodProcess. Eng. 2016, 39, 44–52. [CrossRef]
20. Voinea, A.; Stroe, S.-G.; Codină, G.G. Use of Response Surface Methodology to Investigate the Effects ofSodium Chloride Substitution with Potassium Chloride on Dough’s Rheological Properties. Appl. Sci. 2020,10, 4039. [CrossRef]
21. Voinea, A.; Stroe, S.-G.; Codină, G.G. The effect of sodium reduction by sea salt and dry sourdough additionon the wheat flour dough rheological properties. Foods 2020, 9, 610. [CrossRef]
22. Codină, G.G.; Mironeasa, S.; Mironeasa, C. Variability and relationship among Mixolab and Falling Numberevaluation based on influence of fungal α-amylase addition. J. Food Sci. Agric. 2012, 92, 2162–2170. [CrossRef]
23. Wang, Y.; Gao, Y.; Ding, H.; Liu, S.; Han, X.; Gui, J.; Liu, D. Subcritical ethanol extraction of flavonoids fromMoringaoleifera leaf and evaluation of antioxidant activity. Food Chem. 2017, 218, 152–158. [CrossRef]
24. Codină, G.G.; Mironeasa, S. Use of response surface methodology to investigate the effects of brown andgolden flaxseed on wheat flour dough microstructure and rheological properties. J. Food Sci. Technol. 2016,53, 4149–4158.
25. McCann, T.H.; Day, L. Effect of sodium chloride on gluten network formation, dough microstructure andrheology in relation to bread making. J. Cereal Sci. 2013, 57, 444–452. [CrossRef]
26. Beck, M.; Jekle, M.; Becker, T. Impact of sodium chloride on wheat flour dough for yeast-leavened products.I. Rheological attributes. J. Food Sci. Agric. 2012, 92, 585–592. [CrossRef]
27. Beck, M.; Jekle, M.; Becker, T. Impact of sodium chloride on wheat flour dough for yeast-leavened products.II. Baking quality parameters and their relationship. J. Food Sci. Agric. 2012, 92, 299–306. [CrossRef]
28. Jekle, M.; Necula, A.; Jekle, M.; Becker, T. Concentration dependent rate constants of sodium substitutefunctionalities during wheat dough development. Food Res. Int. 2019, 116, 346–353. [CrossRef]
29. Uthayakumaran, S.; Batey, I.L.; Day, L.; Wrigley, C.W. Salt reduction in wheat-based foods-technical challengesand opportunities. Food Aust. 2011, 63, 137–140.
30. Costa, R.G.B.; Sobrala, D.; Aglaê, V.; Teodoro, M.; Costa Junior, L.C.G.; de Paula, J.C.J.; Landin, T.B.;Oliveira, M.B. Sodium substitutes in Prato cheese: Impact on the physicochemical parameters, rheologyaspects and sensory acceptance. LWT-Food Sci. Tehcnol. 2018, 90, 643–649. [CrossRef]
31. Wellner, N.; Bianchini, D.; Mills, E.N.C.; Belton, P.S. Effect of selected hofmeister anions on the secondarystructure and dynamics of wheat prolamins in gluten. Cereal Chem. 2003, 80, 596–600. [CrossRef]
32. Ortolan, F.; Corream, G.P.; da Cunha, R.L.; Steel, C.J. Rheological properties of vital wheat glutens with wateror sodium chloride. LWT-Food Sci. Tehcnol. 2017, 79, 647–654. [CrossRef]
33. Tuhumury, H.C.D.; Small, D.M.; Day, L. Effects of Hofmeister salt series on gluten network formation: Part, I.Cation series. Food Chem. 2016, 212, 789–797. [CrossRef]
34. Clarke, C.I.; Shober, T.J.; Angst, E.; Arendt, E.K. Use of response surface methodology to investigate theeffects of processing conditions on sourdough bread quality. Eur. Food Res. Technol. 2003, 217, 23–33.
35. Schober, T.J.; Dockery, P.; Arendt, E.A. Model studies for wheat sourdoughs systems using gluten, lactatebuffer and sodium chloride. Eur. Food Res. Technol. 2003, 217, 235–243. [CrossRef]

Foods 2020, 9, 1465 20 of 20
36. Pasqualone, A.; Caponio, F.; Pagani, M.A.; Summo, C.; Paradiso, V.M. Effect of salt reduction on quality andacceptability. Food Chem. 2019, 289, 575–581. [CrossRef]
37. Codină, G.G.; Voica, D. The influence of different forms of bakery yeast Saccharomyces cerevisie type strainon the concentration of individual sugars and their utilization during fermentation. Rom. Biotech. Lett. 2010,15, 5417–5422.
38. Candioti, L.V.; de Zan, M.M.; Cámara, M.S.; Héctor, C.G. Experimental design and multiple responseoptimization. Using the desirability function in analytical methods development. Talanta 2014, 124, 123–138.[CrossRef]
Publisher’s Note: MDPI stays neutral with regard to jurisdictional claims in published maps and institutionalaffiliations.
© 2020 by the authors. Licensee MDPI, Basel, Switzerland. This article is an open accessarticle distributed under the terms and conditions of the Creative Commons Attribution(CC BY) license (http://creativecommons.org/licenses/by/4.0/).