the effect of sodium doping on calcium polyphosphate · the effect of sodium doping on calcium...
TRANSCRIPT

The Effect of Sodium Doping on Calcium Polyphosphate
by
Judy Wai-Tak Ue
A thesis submitted in conformity with the requirements for the degree of Master of Applied Science
Graduate Department of Material Science and Engineering University of Toronto
© Copyright by Judy Wai-Tak Ue 2009

ii
The effect of sodium doping on calcium polyphosphate
Judy Wai-Tak Ue
Master of Applied Science
Department of Material Science & Engineering University of Toronto
2009
Abstract
Calcium polyphosphate (CPP) is a suitable substrate in a novel tissue-engineering strategy. The
strategy aims to culture articular cartilage in vitro onto porous CPP and then implant the biphasic
construct into the joint to replace damaged cartilage. CPP substrates should degrade faster to
enhance repair.
This project examined the structural and degradation effects of doping CPP with sodium
phosphate, sodium hydroxide, and sodium carbonate. Doping concentration was narrowed to
0.01 Na2O/CaO for comparable phase composition to pure CPP. All doped groups sintered and
crystallized at lower temperatures than pure CPP. Hydroxide-doped CPP did not form adequate
sinter necks. At similar open porosity, Phosphate-doped CPP had similar diametral strength than
pure CPP, while Carbonate-doped CPP had greater diametral strength. Degradation in vitro
showed that Phosphate-doped CPP had greater strength loss, while Carbonate-doped CPP had
similar strength loss, compared to pure CPP. Both doped groups degraded more slowly than pure
CPP.

iii
Acknowledgments
This journey has been an eye-opening experience, and I owe its success to my two supervisors,
Professors Marc Grynpas and Tom Coyle. I could not have completed this thesis without their
patience, insight, and support. I would also like to thank Professor Bob Pilliar, who welcomed
me into his lab, generously provided advice, guidance for my thesis, and workspace for my
experiments.
I have been fortunate to be surrounded by knowledgeable people who provided helpful technical
expertise. Thanks go to Dan Mathers and the staff at ANALEST for ICP-AES training and
support; to Dr. Sidney Omelon and Keri Tupy for training and trouble-shooting powder XRD
and the Rigaku; to Doug Holmyard for SEM training and support; to Dr. Jason Hong for training
on CPP; to Dr. Jian Wang, for mechanical testing support; to Prof. Hooton, Dr. Terry
Ramlochan, Olga Perebatova, and Frank Gibbs for DTA training, use, and support. Special
thanks go to Dr. Srebi Petrov for wonderful enthusiasm and clarifying crystal structures. Richard
Cheung, John Ford, and Paul Jowlabar have been resident “Jacks of all trades” and deserve
special recognition.
A number of people have spent valuable time and effort in bouncing ideas with me; many of
these people have been mentioned above. I am also obliged to Nastaran Abbarin, Ken Chien,
Dr. Lu Gan, Youxin Hu, and Dr. Murray Johnston for their input.
Friends and colleagues have been very encouraging. I am grateful for all the late-night chats,
work sessions, stern counsel kindly meant, and overall good times spent. Support from the MSE
office (especially Maria), IBBME office, CACT, the Grynpas lab, the Grynpasland coffee club,
and the Pilliar lab need also be acknowledged.
Last but not least, my family has been ever patient and supportive in this endeavor. Thank you
for putting up with an absentee daughter/sister, and for keeping up a steady supply of warmth
and nourishment.

iv
Table of Contents Acknowledgments.......................................................................................................................... iii Table of Contents........................................................................................................................... iv List of Tables ................................................................................................................................. vi List of Figures ............................................................................................................................... vii 1. Introduction............................................................................................................................. 1
1.1. Osteoarthritis.............................................................................................................. 1 1.1.1. Disease and Prevalence......................................................................................1 1.1.2. Current surgical approaches for OA ..................................................................3 1.1.3. Cell-based interventions approaches for OA .....................................................5 1.1.4. Tissue Engineering Approaches ........................................................................8
1.2. Substrates for Tissue-Engineered Cartilage............................................................... 9 1.2.1. Ceramic substrates for tissue-engineered cartilage............................................9
1.3. Calcium polyphosphate (CPP)................................................................................. 13 1.3.1. Amorphous CPP...............................................................................................13 1.3.2. Crystalline CPP................................................................................................16 1.3.3. Effects of CPP structure on degradation..........................................................19 1.3.4. Na2O-CaO-P2O5 phase diagram.......................................................................25
1.4. Objectives ................................................................................................................ 28 2. Methods................................................................................................................................. 29
2.1. Pure and Sodium-doped CPP synthesis ................................................................... 29 2.2. Chemical analysis of doped CPP glass .................................................................... 32 2.3. Powder X-ray diffraction ......................................................................................... 33 2.4. Thermal Analysis of doped CPP.............................................................................. 34 2.5. Sintering of pure CPP .............................................................................................. 36 2.6. Sintering of doped CPP............................................................................................ 37 2.7. Bulk density and open porosity measurements........................................................ 38 2.8. Pyknometry measurements of doped CPP............................................................... 40 2.9. Closed porosity of doped CPP ................................................................................. 41 2.10. Mechanical testing of sintered/crystallized samples................................................ 42 2.11. SEM of construct and fracture surface..................................................................... 43 2.12. Degradation study of constructs............................................................................... 43 2.13. Statistical analysis.................................................................................................... 45
3. Results................................................................................................................................... 47 3.1. Differential thermal analysis of doped and pure CPP glass..................................... 47 3.2. Powder X-ray diffraction of doped CPP glass......................................................... 51 3.3. Chemical analysis of as-made doped CPP frit ......................................................... 52 3.4. Initial sintering experiments .................................................................................... 54 3.5. Sintering and crystallization of doped-CPP at 0.1 Na2O/CaO................................. 57
3.5.1. Physical Characterization of Sintered Doped-CPP..........................................57 3.5.2. Physical Characterization of Sintered, Crystallized Doped-CPP (730ºC).......60 3.5.3. Physical Characterization of Sintered, Crystallized Doped-CPP (718ºC).......63 3.5.4. Mechanical Properties of Sintered, Crystallized Doped-CPP..........................65 3.5.5. XRD of Sintered, Crystallized Doped-CPP.....................................................66
3.6. Sintering and crystallization of doped-CPP at 0.01 Na2O/CaO............................... 70 3.6.1. Physical Characterization of Sintered, Crystallized Doped-CPP (720ºC).......70

v
3.6.2. Mechanical Properties of Sintered, Crystallized Doped-CPP (720ºC) ............71 3.6.3. SEM of Sintered, Crystallized Doped-CPP .....................................................74 3.6.4. XRD of Sintered, Crystalline Doped-CPP.......................................................77 3.6.5. Material density of Phosphate-doped 0.01 and Carbonate-doped 0.01 ...........79
3.7. Degradation of doped-CPP at 0.01 Na2O/CaO........................................................ 80 3.7.1. Physical characterization of specimens before degradation ............................80 3.7.2. Changes in chemical and mechanical properties of Doped-CPP.....................81 3.7.3. SEM images of Doped-CPP degradation.........................................................82
4. Discussion............................................................................................................................. 87 4.1. Effect of doping on crystalline phase composition of sodium-doped CPP ............. 87
4.1.1. Experimental results.........................................................................................87 4.1.2. Na2O•P2O5 – CaO•P2O5 phase diagrams .........................................................88
4.2. Effects of sodium doping on CPP sintering, strength and degradation ................... 90 4.2.1. Effects of doping on amorphous CPP..............................................................90 4.2.2. Effects of doping on CPP sintering..................................................................91 4.2.3. Effects of doping on CPP mechanical strength................................................93 4.2.4. Effects of doping on CPP degradation.............................................................94
4.3. Dopant anion effects on CPP ................................................................................... 96 4.3.1. Choice of dopants ............................................................................................96 4.3.2. Hydroxide-doping effects on CPP ...................................................................96 4.3.3. Phosphate-and Carbonate-doping effects on CPP ...........................................97
5. Summary and Conclusions ................................................................................................... 99 6. Recommendations............................................................................................................... 101 7. References........................................................................................................................... 102

vi
List of Tables
Table 1.3.1. Reported crystal structures of calcium polyphosphate....................................18 Table 1.3.2. Reported powder diffraction files of calcium polyphosphate..........................18 Table 2.1.1. Composition of Ca(H2PO4)2•H2O supplied by manufacturer..........................29 Table 2.1.2. Chemical composition of Ca(H2PO4)2•H2O .......................................................29 Table 2.1.3. Composition of dopant chemicals.......................................................................30 Table 2.1.4. Design Composition of Doped Material.............................................................31 Table 2.2.1. Detection wavelengths, ICP-AES. ......................................................................32 Table 2.12.1. Composition of Phosphate-buffered saline pH=7.5. .........................................43 Table 3.1.1. Peak temperatures from differential thermal analysis.....................................50 Table 3.3.1. Composition of doped material...........................................................................52 Table 3.3.2. Doped material content, expressed in as mmol/(g sample). .............................53 Table 3.4.1. Heating profile of one-stage pure and sodium-doped CPP..............................54 Table 3.5.1. Summary of specimens of sintered, crystallized Phosphate-doped 0.1 and
Carbonate-doped 0.1............................................................................................................61 Table 3.5.2. Summary of specimens of sintered, crystallized Phosphate-doped 0.1 and
Carbonate-doped 0.1............................................................................................................63 Table 3.5.3. Summary of Weibull modulus and characteristic strengths of doped-CPP at
0.1 Na2O/CaO. ......................................................................................................................66 Table 3.5.4. Pattern matches with residual peaks of doped-CPP at 0.1Na2O/CaO............68 Table 3.6.1. Summary of bulk density and open porosity of doped-CPP at 0.01
Na2O/CaO. ............................................................................................................................70 Table 3.6.2. Summary of Weibull plots of doped-CPP at 0.01 Na2O/CaO..........................73 Table 3.6.3. Absolute density of doped-CPP at 0.01 Na2O/CaO (glass and crystalline). ...79 Table 3.6.4. Closed porosity of pure CPP and doped CPP at 0.01 Na2O/CaO. ..................79 Table 3.7.1. Physical characterization of pure CPP for degradation. .................................80 Table 3.7.2. Physical characterization of Carbonate-doped 0.01 for degradation. ............80 Table 3.7.3. Physical characterization of Phosphate-doped 0.01 for degradation..............81 Table 3.7.4. Degradation and mechanical property changes of Doped CPP.......................81 Table 4.2.1. Doped and pure CPP chemical and mechanical degradation..........................94

vii
List of Figures Figure 1.3.1. Calcium polyphosphate monomer......................................................................14 Figure 1.3.2. Schematic of calcium polyphosphate glass. .......................................................14 Figure 1.3.3. Phase diagram of Na2O•P2O5 and CaO•P2O5....................................................25 Figure 1.3.4. Phase diagram of NaPO3 – Ca(PO3)2. ................................................................27 Figure 2.4.1. Schematic of differential thermal analysis of glass...........................................34 Figure 2.4.2. Sample differential thermal analysis of pure calcium polyphosphate ............35 Figure 2.10.1. Sample load-displacement curves of disc samples. ...........................................42 Figure 3.1.1. Differential thermal analysis of pure CPP.........................................................47 Figure 3.1.2. Sample differential thermal analysis of sodium phosphate-doped CPP.........48 Figure 3.1.3. Sample differential thermal analysis of sodium carbonate-doped CPP. ........48 Figure 3.1.4. Sample differential thermal analysis of sodium hydroxide-doped CPP. ........49 Figure 3.2.1. XRD pattern of sodium-doped calcium polyphosphate. ..................................51 Figure 3.4.2. Scanning electron micrographs of doped CPP..................................................55 Figure 3.4.3. Powder X-ray diffraction patterns of 0.1 Na2O/CaO sintered at 540ºC.........56 Figure 3.4.4. Powder X-ray diffraction patterns of 0.01 Na2O/CaO, sintered at 582ºC......56 Figure 3.5.1. Bulk density of one-stage sodium-doped CPP at 0.1 Na2O/CaO.....................57 Figure 3.5.2. SEM of Phosphate-doped 0.1 and Carbonate-doped 0.1..................................58 Figure 3.5.3. X-ray diffraction patterns of sintered Phosphate-doped 0.1 ...........................59 Figure 3.5.4. X-ray diffraction patterns of sintered Carbonate-doped 0.1. ..........................60 Figure 3.5.5. SEM images of Phosphate-doped 0.1 and Carbonate-doped 0.1.....................62 Figure 3.5.6. SEM image of Phosphate-doped 0.1 and Carbonate-doped 0.1 ......................64 Figure 3.5.7. Weibull plots of Phosphate-doped CPP at 0.1...................................................65 Figure 3.5.8. Weibull plots of Carbonate-doped CPP 0.1.......................................................66 Figure 3.5.9. X-ray diffraction patterns of Phosphate-doped 0.1. .........................................67 Figure 3.5.10. X-ray diffraction patterns of Carbonate-doped 0.1..........................................68 Figure 3.5.11. X-ray diffraction patterns of Hydroxide-doped 0.1..........................................69 Figure 3.6.1. Survival plot of Phosphate-doped 0.01. .............................................................72 Figure 3.6.2. Survival plot of Hydroxide-doped 0.01. .............................................................72 Figure 3.6.3. Survival plot of Carbonate-doped 0.01. .............................................................73 Figure 3.6.4. SEM images of doped-CPP at 0.01 Na2O/CaO sintered at 580ºC. ..................75 Figure 3.6.5. SEM images doped-CPP at 0.01 Na2O/CaO sintered at 590ºC. ......................76 Figure 3.6.6. X-ray diffraction patterns of Phosphate-doped 0.01. .......................................77 Figure 3.6.7. X-ray diffraction patterns of Hydroxide-doped 0.01........................................78 Figure 3.6.8. X-ray diffraction patterns of Carbonate-doped 0.01........................................78 Figure 3.7.1. Chemical and mechanical degradation of doped and pure CPP.....................82 Figure 3.7.2. SEM images of degraded pure CPP. ..................................................................84 Figure 3.7.3. SEM images of degraded Phosphate-doped 0.01. .............................................85 Figure 3.7.4. SEM images of degraded Carbonate-doped 0.01..............................................86 Figure 4.2.1. Schematic of possible sodium interaction with calcium polyphosphate. ........91

1
1. Introduction
1.1. Osteoarthritis
1.1.1. Disease and Prevalence
Osteoarthritis (OA), alternatively known as degenerative joint disease, describes a set of
degenerative symptoms of the articular cartilage and the underlying subchondral bone[1, 2].
These include the development of focal fissures and irregularities on the smooth, continuous
cartilage surface, leading to further erosion and propagation of damage to the subchondral
bone[3]. Risk factors for OA include age, developmental defects, trauma and inflammation[4].
As the cartilage tissue is avascular and lacks nerve endings, focal defects generally remain
undetected until damage has developed into the subchondral bone and the individual experiences
pain and loss of movement in the joint. Early signs of abnormalities may be detected in more
athletic populations during arthroscopic examination of other injuries to the joint[5]. It should be
noted by Smith et al. that these early defects are often not sufficiently developed to warrant
intervention[5].
Although the cartilage tissue has its own repair mechanism, in which chondrocytes rebuild
the collagen matrix in the cartilage to a limited degree, this process is much slower than the rate
of degeneration. As a result, osteochondral defects accumulate throughout an individual's
lifetime, and the individual experiences increasing discomfort and difficulty with movement as
the disease advances. A variety of modalities are available[1, 6], and these were appraised by a
panel of experts appointed by the Osteoarthritis Research Society International in 2005 [7, 8].

2
This panel of surgeons and researchers assessed existing guidelines and evidence-based
modalities for OA, and condensed these modalities to twenty-five recommendations, categorized
as general recommendations, followed by non-pharmacological, pharmacological, and surgical
modalities of treatment [7, 8]. The panel agreed that the "optimal treatment of OA requires a
combination of non-pharmacological and pharmacological modalities". Non-pharmacological
modalities of treatment include patient education, regular telephone contact with health
professionals, physical therapy evaluation and instruction, appropriate forms of exercise, weight
loss, walking aids and appropriate braces and footwear, thermal modalities, transcutaneous
electrical nerve stimulation and acupuncture. Pharmacological modalities recommended include
acetaminophen and non-steroidal anti-inflammatory drugs (NSAIDs) as oral analgesics for
treatment of mild to moderate pain, with topical NSAIDs and capsaicin as alternatives or
substitutions; intra-articular (IA) injections with corticosteroids or hyaluronate for moderate to
severe pain; treatment using glucosamine and/or chondroitin sulphate for symptomatic or
potentially structure-modifying benefit; and as a last pharmacological treatment resort, weak
opioids and narcotic analgesics for treatment of refractory pain. Surgical modalities listed by the
OARSI include partial or total joint replacement surgery, unicompartmental knee replacement,
osteotomy and joint preserving surgical procedures for young adults, joint lavage, arthroscopic
debridement, and as a final surgical treatment beyond joint replacement and revision surgeries,
joint fusion was suggested [8]. Each of the listed recommendations was assigned a strength-of-
recommendation (SOR) score based on the panel's expertise.
The recommendations listed by OASRI showed clearly, with the exception of surgical
interventions, that most other modalities are aimed at OA pain relief. These palliative options are
also temporarily effective, as discomfort inevitably increases as the arthritic joint continue to

3
deteriorate. Further, pharmacological modalities such as NSAIDs are not recommended for long-
term use due to increased risk of adverse gastrointestinal events. Samuels et al. and Goldring et
al both pointed out that research towards identifying OA disease modifying pharmaceuticals are
underway, with the aim of arresting cartilage degeneration or providing aid in cartilage structure
preservation [1, 4]. However, this has not become a viable clinical modality.
1.1.2. Current surgical approaches for OA
Surgical recommendations listed by the OASRI have varying degrees of joint preservation.
Options such as joint lavage and debridement for knee or hip OA did not attain high SOR scores,
and the literature showed that these techniques did not provide statistically significant
improvement by known pain scoring matrices [8-10]. In fact, the placebo effect appears to
contribute to pain relief as assessed by these matrices [8-11].
Microfracture is also an available option, and has been shown to have positive clinical
outcomes in a case-study of patients less than 45 years old, with chondral defects of the knee,
over the course of 7 to 17 years of follow-up [12]. Steadman et al. first debrided damaged
cartilage from lesions to neatly expose the subchondral bone, and then made holes of
approximately 3 to 4 mm deep, spaced also 3 to 4 mm apart, using an awl to produce
perpendicular microfracture around the subchondal bone perimeter [12]. While variations for the
technique exist [13], the principle of these marrow stimulation techniques take advantage of
undifferentiated mesenchymal cells from the bone marrow to repair the subchondral bone and
the articular cartilage surface [5, 14]. Compared to the Pridie drilling method, which is also
based on the same principle, this has the advantage of avoiding excessive thermal damage to the
microfracture sites. However, both methods fall short of the ideal cartilage reparation, as the
regenerated fibrocartilage is not suitable for proper joint support, compared to the highly
4
organized hyaline cartilage. Davies and Jones (2004) also noted that microfracture is typically
suitable for smaller defects, of less than 2 cm2 [15].
Of the surgical treatment modalities, joint replacement won overwhelming support from the
OSARI panel as an "effective and cost-effective intervention with significant symptoms, and/or
functional limitations associated with a reduced health-related quality of life."[8] The surgery
involves removing the components of the defective joint, and replacing it with implants made of
non-biological materials. In hip arthroplasty, an acetabular cup fits into the hip socket, and the
femoral head and neck are exercised and replaced with a femoral stem. An estimated 200 000
total hip replacements and 35 000 total knee replacements are performed in the United States,
and post-operative assessment predicts that 80-90% of patients will have improvement in joint
function, and near complete pain relief [16].
Designs of replacement implants vary in terms of materials (stainless steel, cobalt chrome,
titanium alloy, alumina, zirconia) [17, 18], size, extent of femoral head replacement (with the
aim of preserving more bone stock), the angle between the implant femoral neck and stem, and
tissue-implant contact methods (cement, smooth contact surface, porous coated surfaces,
roughened/abraded surfaces) [19, 20]. Although joint function is rapidly restored and pain relief
is largely overcome after surgery, total joint replacement has specific shortcomings. Osteolysis
occurs in the repaired joint, and was associated with the presence of polyethylene wear debris
[21], particularly in metal-on-polymer hip (acetabular cups) or knee (tibial plate inserts) implants
[22]. Metallic debris and cement particulates are also identified. In addition, the bone
surrounding the implant experiences less mechanical load as a result of the stress-shielding effect
from the implant material, and so it does not rebuild sufficiently to fulfill its function [23]. These
factors lead to aseptic loosening of the implant, and revision surgery is required after ten to
fifteen years. Combined with other factors such as joint instability [24], increased high-activity

5
levels, and longer average life expectancy, there is increasing demand from both a health and an
economic standpoint to improve current designs for joint replacement [25], or to identify
strategies that can delay the surgery.
1.1.3. Cell-based interventions approaches for OA
Several cell-based surgical strategies are available to repair and restore osteochondral
defects, thus returning the tissue, and thus the articulating joint, to its load-bearing function.
These strategies vary in terms of level of clinical development, tissue manipulation, and use of
synthetic biomaterials. Autologous chondrocyte implantation (ACI) involves several steps.
Chondrocytes are isolated and cultured in vitro following extraction from the patient's own
healthy cartilage tissue. When sufficient cell volume is reached, the chondocytes are injected to
fill the defect cartilage site, which has been cleared of damaged tissue. The defect is enclosed
with a periosteum flap. Postsurgical rehabilitation and walking aids are used to provide
controlled mechanical stimuli without overloading the recovering joint while cartilage tissue
develops [6, 15, 26]. Minas et al. suggests that the tissue reaches maturation and stabilization
between one to three years after transplant [27]. Peterson et al. showed that the procedure is
applicable to patients of wider age groups compared to total joint replacements, and can be used
for other forms of articular cartilage disorders (i.e., lesions) [28]. Mithöfer et al. showed that that
sixty percent of adolescent athletes who underwent ACI due to full-thickness articular cartilage
lesions in the knee returned to high impact sports at a level equal or higher than their pre-injury
levels [29].
Although chondrocytes were injected into the enclosed periosteum-enclosed "pouch",
reported recovery showed that a variety of tissue types, including hyaline cartilage, fill the
defect. Preoperative and postoperative radiographic examination identified osteophyte growth in
fifteen of twenty-seven patients who underwent ACL due to osteochondritis dissecans of the

6
knee [28]. In another study, the authors identified fibrocartilage by histological examination of
biopsies from four out of twelve patients at an average of 54 months post transplantation. The
authors did not specify the graft locations for this part of the study, although the study included
61 patients with lesions of various types from various locations on the knee [30]. Despite the
positive clinicial scores for the treatment, these varying results suggest that the cartilage is not
entirely repaired to its "healthy" state. Furthermore, Horas et al. found that recovery from ACI is
slower at all of the follow-up time points (6-, 12-, 24-month) compared to another cell-based
surgical modality, mosaicplasty (also known as osteochondral autologous transplantation,
OATS) [31].
Osteochondral autologous transplantation (OATS) or mosaicplasty, is another cell-based
alternative [32, 33]. The procedure involves filling osteochondral defects with "plugs" of bone
and developed cartilage, which were harvest from a healthy site in the patient's own articulating
joints. The press-fitted plugs are sized to maximize coverage of the defects, but since the defect
size for this form of intervention is typically large (1 to 4 cm2) compared to the size of plugs
(varying diameters, from 3 to 6mm [33], up to 10mm [34], the resulting transplantation often
resembles a mosaic of plugs. In a trial that included mosaicplasty of various parts of the knee, the
researchers found that good-to-excellent clinical scores (pain, ease of mobility, activity levels)
were achieved in at least 80% of the 831 procedures documented in a ten-year span [32]. In
addition, arthroscopic observations showed that the restructured defect formed a good gliding
surface, and histology showed that the transplanted hyaline cartilage survived [32]. Other
studies showed similar positive results [35].
Typical harvest sites for mosaicplasty grafts for the knee include the minimal load-bearing
periphery of the petallofemoral joint, or of the medial femoral condyle. Individual "plugs" were
extracted with specialized tools spaced evenly to preserve local joint stability. Donor sites are

7
either left "unfilled" after the surgery [32, 33], or are filled and covered with periosteum, with
either bone grafted from the iliac crest, or bone substituted material [35, 36]. In the ten-year
study conducted by Hangody et al., three percent of the patients experienced donor-site
disturbances, and fibrocartilage was observed at the "unfilled" donor sites during post-operative
arthroscopy [32]. Feczko et al. assessed donor site repair using rods made of hydroxyapatite,
carbon fibre, polyglyconate-B, compressed collagen, or two types of polycaprolactones, in a dog
model [36]. They found that with the exception of compressed collagen rods, repairs using the
other bone substitutes resulted in poor articular gliding surfaces, and/or scar tissue formation that
was weaker compared to even fibrocartilage when probed. Repairs made using compressed
collagen rods results in fibrocartilage formation of similar macroscopic appearance compared to
the unfilled, control donor sites at thirty weeks post surgery.
Although the osteochondral defects are effectively filled with hyaline cartilage anchored onto
bone, thus recreating much of the biological conditions of the pre-defect joint, there are notable
concerns with the procedure. Foremost is the possibility that the donor cartilage tissue is
diseased, since it may not be possible to detect the extent of the pathology in the joint. In fact,
OATS as practiced by Hangody and collaborators listed osteoarthritis and rheumatoid arthritis as
absolute contraindication for the procedure [33]. Secondly, there is a limited supply of "healthy
tissue", as there is a limited "minimal" load-bearing tissue source. Furthermore, harvesting can
influence subsequent stress distributions at donor sites [37], leading to donor site morbidity.
Allografts harvested from cadaver joints may address these concerns, and reports have shown
that they are used in large defects or where a large amount of bone stock is desired [38], but in
this case additional concerns over disease transmission, tissue viability (dependent upon the
tissue stock storage [39]), and graft immunogenicity dominate in the success of the modality.
Finally, although the restructured defect surface appears smooth and has similar stiffness to that

8
of hyaline cartilage, the individual plugs as well as the periphery of the defect are surrounded by
fibrocartilage [15, 33]. Histologically, gaps were noted in some cases between adjacent hyaline
cartilage, suggesting compromised cartilage integration [31]. These repair heterogeneities remain
weak spots in the joint.
1.1.4. Tissue Engineering Approaches
The problems of tissue shortage and donor site morbidity could be avoided by tissue
engineering, "the application of scientific principles to the design, construction, modification,
growth and maintenance of living tissues" [40]. Cartilage tissues cultured in vitro presents an
unlimited supply for repair, and the tissue composition and structure can be manipulated using
proper culture conditions. This can also help to avoid the growth of fibrocartilage in the repair
tissue, another shortcoming in both ACI and OATS. Defects affecting the cartilage and bone can
be repaired using the same principle behind OATS, with tailored plugs consisting of tissue-
engineered cartilage grown on an appropriate substrate. These plugs create a biphasic construct,
and have been a strategy of much research interest [41-54]. Designs of the biphasic constructs
varied depending upon the maturity of the developing cellular component (from mesenchymal
stem cells seeding [45, 55] to cartilaginous tissue [51, 52]), the substrate material [56] (P(L)LA,
P(DL)LA [53], Collagen and HA [46, 57], PGA and Collagraft [42], PLGA-β-tricalcium
phosphate [58], tricalcium phosphate [44, 45]), and tissue-substrate anchorage mode (in vivo
merged [55], sutured [42], integrated [46, 52, 59], fibrin glue gel with cell seeding [60]).

9
1.2. Substrates for Tissue-Engineered Cartilage
These strategies illustrate a set of requirements for the substrate component of biphasic
implants. They include biocompatibility, bioactivity (towards both cartilage and bone), sufficient
mechanical strength to sustain the loading conditions at the defect site, and the capability to be
fabricated with an open-pore structure to facilitate subchondral bone in-growth. Furthermore, it
should be bioresorbable at a rate that is in concert with the rate of bone in-growth [50, 54].
Polymers, both naturally derived and synthetic, have the advantage of versatility in fabrication
and design for specificity, and have been tailored to fulfill some of these criteria [48]. Chen et al.
used a PLGA sponge as the backbone structure upon which collagen were deposited to fill up
parts of the void, and hydroxyapatite particles were deposited onto the organic surfaces. The
collagen further partitioned the voids within the PLGA foam, but neither it nor the
hydroxyapatite particles formed a continuous secondary phase [59, 61]. As a class of materials
polymers have lower strength compared to that of bone mineral, which makes these substrates
less desirable for osteochondral defects. Metals have been widely used as dental and orthopaedic
implants. While there is a wide range of designs to tailor the substrate porosity and to enhance
osteointegration at the bone-implant interface [20, 62, 63], metals are not suitable as
osteochondral biodegradable substrates because of low degradation rates, and limited
bioresorbability of wear particles [64].
1.2.1. Ceramic substrates for tissue-engineered cartilage
Ceramics such as alumina and zirconia, considered bioinert, have been incorporated into
orthopaedic implant designs, owing to their improved wear resistance in load-bearing sites
compared to older metal-on-polymer models [18, 56]. Ceramic for osteochondral substrates are
typically calcium phosphates, since they are chemically similar to bone mineral, and are
bioactive without additional surface modifications [65, 66]. Many calcium phosphates have been

10
shown to be osteoconductive; that they promote bone growth into the porous substrate [67, 68].
In addition, some calcium phosphates were suggested to have an osteoinductive effect, the ability
of promoting bone mineralization when implanted in sites where bone does not develop (e.g.,
muscle sites) [69, 70]. Of particular interest amongst these ceramics is hydroxyapatite (HA) and
β-tricalcium phosphate (β-TCP). Since the former is very close to the composition of bone, and
the other has a faster degradation rate, composites of HA/β-TCP, termed BCP (biphasic calcium
phosphate), has received much research attention as a bone substitute material [71-74]. Other
calcium phosphates have been explored for a variety of different orthopaedic and dental
applications, such as Bioglass ™ as dental filler, or combined with polymers as osteochondral
substrates[75], HA derived from coral, which serve as natural templates to fulfill the trabecular
structure requirement, such as thermally converting coral into HA [76].
Scaffold designs consisting of composites of bioactive ceramics and polymers were also
investigated to compensate for the stiff ceramics. The structure of these composites vary from a
continuous polymer matrix filled with bioactive ceramic particles to two interpenetrating phases,
formed by infiltrating sintered ceramic compacts with polymers [77-80]. Kim et al. used
polymer-HA particle-antibiotic coating on a calcined porous HA scaffold to produce a drug
carrier with greater mechanical strength than the bare HA scaffold [79]. Ghosh et al. used
compression moulding to join two layers of different stiffness: a starch-P(L)LA layer (elastic
modulus = 23±5 MPa) and an HA particulate/P(L)LA matrix composite layer (elastic modulus =
110 ± 25 MPa). A compacted layer of P(L)LA polymer formed between the two layers during
fabrication, and NaCl particles were used to generate an open pore structure [81]. Andriano et al.
evaluated in vivo biocompatibility of composites of polymer and phosphate fibres [82]. These
composites were synthesized by solvent mixing (methylene chloride) of either crystalline
calcium sodium metaphosphate fibres or amorphous sodium calcium aluminum polyphosphate

11
fibres into either poly(ε-caprolactone/L-lactide) or poly(ortho ester), followed by drying, heating
and injection moulding into the desired specimen shapes. The implants were inserted in bone
(rabbit lateral femoral cortex) and in muscle (rabbit back) sites, and assessed histologically after
sacrifice at 4, 13 and 26 weeks [82]. The authors noted that not all combinations of polymer/fibre
ratios were assessed, but as emphasized by Rezwan et al., composite scaffold design strategies
should generally have detailed in vitro and in vivo characterization and degradation analyses to
determine their effectiveness as scaffolds for osteochondral implants [80].
In this regard, bioactive ceramics hold an advantage since their biocompatibility in vivo is
well established, particularly as load-bearing bone substitutes [72, 76]. The literature described
in vivo studies of tissue-engineered cartilage-substrate strategies, using either porous
interconnected hydroxyapatite [83], or porous calcium polyphosphate (CPP) [52, 84], as
substrates in rabbit and sheep models, respectively. Both substrates were shown to be
osteoconductive in another rabbit model [67, 85]. A recent study found that under specific
culture conditions, a calcified cartilage layer would form between the tissue-engineered cartilage
and CPP. This layer is generally observed as part of the anatomy of the native articular cartilage-
subchondral bone structure [51], and was hypothesized to stabilize the tissue-subchondral bone
interface during transfer of mechanical loads.
This strategy of tissue-engineered cartilage grown on CPP substrates was proposed by Drs,
Grynpas, Kandel, and Pilliar at the University of Toronto [86]. The CPP porous substrate was
formed by gravity sintering and crystallization of CPP glass particles [87] packed into a platinum
mould[88]. Particle size and processing conditions were carefully controlled, as they were found
to affect the degradation of the crystalline substrate in vivo [67, 89]. Literature showed that
although as much as 50% of the CPP substrate surface formed intimate contact with bone tissue
within three months of implant in vivo [52], the in vitro and in vivo degradation of the CPP

12
substrate was slower than desired for the substrate to fully bioresorb, based on the requirements
for osteochondral substrate design [67, 88]. Thus there is a need to tailor the degradation rate of
the substrate.

13
1.3. Calcium polyphosphate (CPP)
Calcium polyphosphate (CPP) has been investigated in the last sixty years for many
applications, which include fertilizer [90], water softener [91], detergent [92, 93], and as a vessel
for nuclear waste containment ([94], pp. 267-287). More recently, it is being considered for
various biomedical applications, including a vehicle for controlled drug release [95, 96], as bone
substitute [65], and as described above, as osteochondral substrates for tissue engineering.
1.3.1. Amorphous CPP
Calcium polyphosphate is an inorganic polymer with a monomer structure as shown in
Figure 1.3.1, linked via bridging oxygen atoms in the form of –P-O-P– bonds between
tetrahedral phosphates[97]. Cations, including hydrogen and calcium, bind to other unbound
oxygen atoms, and may be located at various positions relative to the polyphosphate structure
(Figure 1.3.2). These positions include the end of chains, or along the chain, where non-bridging
oxygen reside. Therefore, calcium atoms may bind to oxygen atoms from two different chains,
effectively connecting the two molecules. Hoppe suggests that there is additional orientation
between all non-bridging oxygen atoms and the cations [98]. Depending on the proportion of
cations and anions in the matrix, expressed as the ratio of cation oxide to phosphorus pentoxide,
(M2O/P2O5), the polyphosphate may be linear (1 ≤ M2O/P2O5 < 2), or it may form a cross-linked
network in (M2O/P2O5 < 1), termed “ultraphosphate” [99]. The coordination between non-
bridging oxygen and the cation accordingly varies, but it is also dependent on the cation
(network modifier) properties, of which Hoppe illustrated the effects of valence and covalent
character between the modifier and the coordinating oxygen [98]. The CPP glass synthesized for
the present study carefully keeps CaO/P2O5 at unity, and is quenched from a relatively short
melting dwell[94], thus likely arresting the formation of a stable structure [67].

14
O P
O
OPO
O
O
Ca2+
Figure 1.3.1. Calcium polyphosphate monomer. Non-bridging oxygen atoms (red) bind to the available calcium atom (blue). The conformation of the non-bridging oxygen atoms varies.
OP
OO
O
OP
OO
POO
O
PO
OO
OPOO
O
P OO
O
OP
OO
POO
O
OP
O
O
P OO
O
OPO O
OPO
OO
OPO
OPO
OO
OPO O
OPOO
P OO
O
O P OO
O
OPO
OPO
OO
POO
O
OP
O O
O POO
O
O POO
OPO
O
POO
O
O P OO
OP
O
O
Ca
CaCa
Ca
Ca
Ca
Ca
Ca
Ca
Ca
Ca
Ca
Ca
Ca
O P OO
O
O PO
O
POO
O
O P OO
OPO
O
POO
OO P O
O
OP
O
O
Ca
Ca
Ca
Ca
Figure 1.3.2. Schematic of calcium polyphosphate glass. Non-bridging oxygen atoms (red) bind to available calcium atoms (blue) and hydrogen (not-shown). Cations can be found at the end of chains or along the chain. Conformation of the non-bridging oxygen atoms is randomly positioned to illustrate the metastable material used in this study.

15
There are two main synthesis methods for amorphous CPP. Aqueous reactions between
phosphoric acid and calcium hydroxide, at the desired M2O/P2O5, followed by heating, with
[100], or without[101], controlled cooling, and ending with purification by wash and filtration
generally produced crystalline CPP. Amorphous calcium polyphosphate, on the other hand,
could be produced under more specific M2O/P2O5 ratios (1≤ M2O/P2O5 ≤ 2, [102]) and heating
conditions. Another common method is by melt quenching. A melt is typically made from
calcium phosphate monobasic monohydrate, Ca(H2PO)2•H2O, resulting in condensation and
polymerization of the phosphate groups into polyphosphates [65, 96, 103-107]. In studies that
manipulate M2O/P2O5, or that aim to include more than one type of cation, salt mixtures would
be used as the starting material for thermo-synthesis [108-113]. This melt of polyphosphates is
then quenched in water, resulting in an amorphous frit. Further processing produces glass of the
desired particle size, which may be used as-made[114], compacted and isostatically
pressed[115], compacted and sintered [116], or gravity-sintered [67, 87, 88].
Although there are some differences in the hypotheses of the reaction pathway for
polyphosphate formation [94, 117], the underlying agreement is that calcium polyphosphate
consist of a phosphate backbone, connected via shared oxygen atoms as -P-O-P- bonds.
Particularly during the melt, at temperatures typically at 1000ºC or above [113], the hydrolysis
reaction:
- [P-O-P-]n-O-[P-O-P-]m- + H2O(g) -[P-O-P-]n-OH + HO-[P-O-P-]m- [ 1]
competes with the condensation reaction:
- [P-O-P-]n-OH + HO-[P-O-P-]m- -[P-O-P-]n-O-[P-O-P-]m- + H2O(g) [ 2]
The resulting polyphosphate glass chain length was thought to depend upon the time spent at this
step [94].

16
The synthesis route taken also has an impact on the resulting product, as LeGero pointed out,
since phosphate synthesis is sensitive to chemical impurities [118]; and for polyphosphates, a
small excess of phosphorus could “contaminate” the resulting glass and affect its stability [119].
No literature to date has compared the properties of amorphous CPP synthesized from different
routes.
1.3.2. Crystalline CPP
The structure of crystalline CPP has been under examination in a number of studies.
McIntosh and Jablonski described the transformations of monocalcium phosphate hydrate into
different calcium metaphosphate phases by varying the temperature of heat treatment and the
treatment atmosphere (air versus steam), and provided XRD data for these phases [120]. β-CPP
formed in either atmosphere by heating at 700ºC. Heat treatment in air would produce β-CPP at
temperatures as low as 500ºC, whereas heat treatment in steam at 270ºC, followed by heating in
air to 340-360ºC resulted in γ-CPP, which converted to β-CPP at 700ºC. Qiu et al. heated
amorphous CPP in air for one hour at 1000ºC and 800ºC and found that the three strongest peaks
in the XRD patterns of these samples matched those of γ-CPP and β-CPP, respectively, presented
by McIntosh and Jablonski [117, 120], (d-spacings of 3.49, 2.76, 4.76 Å for γ-CPP and 3.74,
3.52, 4.58 Å for β –CPP). Qiu et al. [117] then reported that the material they identified as γ-CPP
degraded fully by the end of four weeks, as measured by weight loss in tris-buffered solution
(pH=7.4), whereas the material identified as β-CPP experienced only a 12% weight loss within
the same period. Considering that the synthesis temperature for γ-CPP (1000ºC) reported by Qiu
et al. [117] was above the melting point of CPP as determined by DTA (984ºC), and the
degradation profiles between γ-CPP and amorphous CPP were similar [117], it is likely that the
increased degradation rate for these specimens was due to the presence of an amorphous phase.
The story of γ-CPP is even more confusing when Guo et al. [107] reportedly converted mixtures

17
of γ-CPP/β-CPP phases into a pure β-CPP phase by increasing the sintering temperature of CPP
from 500 to 900ºC, based on calculations done on the XRD patterns of the samples, with
standard patterns of two calcium metaphosphate phases as reference [107].
The structure of calcium polyphosphate was presented by Rothammel et al.[121], who named
the chemical calcium metaphosphate in the original publication, and Schneider et al. [122], who
named the chemical β-calcium polyphosphate. Simulated diffraction patterns of these two
structures were identical [123]. These two reports, and another publication on the crystal
structure of calcium polyphosphate are summarized in Table 1.3.1. Experimental and calculated
powder diffraction patterns of β-CPP and γ-CPP are summarized in Table 1.3.2.
Table 1.3.1 showed that the PDF cards 79-0700 and 77-1953 are identical as they are
calculated patterns from the identical structure as presented by Rothammel et al.[121] and
Schneider et al.[122], respectively. The PDF #11-0039 includes unit cell parameters that are very
close to that reported by Corbridge [124], and also matches the other two PDF cards for CPP.
These powder diffraction files, and the structural information as presented in Table 1.3.1,
describe β-CPP. A comparison between these patterns with the diffraction pattern for β-CPP as
reported by McIntosh and Jablowski [120] (PDF #17-0500) showed that while the position of the
major peaks are identical, the intensity of these peaks varied, and weaker peaks are missing in
PDF #17-0500 (between 15 and 18 º2θ). Since the McIntosh and Jablowski presented d-spacings
and relative intensities for peaks with intensities as low as 5% [120], a possible reason that
accounts for the missing peaks could be that the β-CPP structure had preferred orientation.
Two experimental PDF cards exist for γ-CPP, but PDF #17-0498 has been replaced by the
more details PDF 50-0584, which included structural information, as shown in Table 1.3.1.

18
Tab
le 1
.3.1
. R
epor
ted
crys
tal s
truc
ture
s of c
alci
um p
olyp
hosp
hate
. St
ruct
ural
info
rmat
ion
extr
acte
d fr
om so
urce
, whi
le c
olle
ctio
n co
des a
re su
pplie
d if
the
stru
ctur
e w
as in
clud
ed in
the
ICSD
.
Tab
le 1
.3.2
.
Rep
orte
d po
wde
r di
ffra
ctio
n fil
es o
f cal
cium
pol
ypho
spha
te.

19
The x-ray diffraction pattern obtained from crystalline CPP synthesized using the method of
Pilliar et al. [87, 88] matched the simulated diffraction patterns based on the structures of
Rothammel et al. [121] and Schneider et al. [122], and is thus reported as β-CPP [111].
Degradation in vitro of this substrate material using tris-buffered solution (pH= 7.4) showed that
the sample released 0.5% of the total available phosphorus into the solution at the end of one
month.
1.3.3. Effects of CPP structure on degradation
Many different studies have reported on the effects of amorphous or crystalline CPP structure
on its degradation and mechanical properties. Qiu et al. assessed the degradation rate and the
mechanical strength of CPP glass made by calcining Ca(H2PO4)2•H2O at 500ºC for one, five and
ten hours before melting at 1100ºC for one hour [117, 125]. The authors reported that the in vitro
degradation rate of glass particles increased as calcining time decreased. However the authors
did not fully describe the degradation behavior of crystallized samples made from these glass
groups, nor did they analyze the polyphosphate glass structure. Ropp advocated increasing the
length of the melting step for a chemically stable glass[94]. In an study aimed at producing a
stable glass product, Ropp increased the melt hold time of CPP glass, held at 1200ºC, to 144
hours. He found that increased melt hold time resulted in an increase in the glass transition
temperature of CPP, and the resulting glass was nearly unaffected by boiling water degradation
test. While this is not the aim for the design for a bioresorbable substrate for tissue-engineering,
it nevertheless suggests that reducing the melt hold time may result in a less chemically stable
product.
Wang et al. reported on the effect of phase composition of CPP on degradation and cell
viability [104]. CPP was calcined at 500ºC for ten hours, melted at 1200ºC for 1.5 hours,
quenched and milled. The CPP glass was then mixed with stearic acid as a pore-forming agent,

20
pressed, heated for removal of pore-forming phase, and then sintered at 550ºC, 650ºC and 750ºC,
respectively. XRD of the sintered bodies showed that at 550ºC, CPP (550-CPP) remained
amorphous, while at 650ºC and 750ºC, CPP (650-CPP; 750-CPP) crystallized and the resulting
pattern matched that of β-CPP (PDF #11-0039). Degradation of the specimens in SBF showed
that by the end of one month, weight loss of 550-CPP reached 80%, while that of 650-CPP and
750-CPP were approximately 8% and 5%, respectively. Accordingly, compressive strength of
550-CPP under degradation was lower than that of the other two groups. Cell culture on the three
groups showed that after six days, higher cell density was observed on 650-CPP and 750-CPP.
At each of the earlier time points (two and four days), higher cell volume was found at the other
two substrate groups as well. The authors noted that this could be because the amorphous 550-
CPP degraded more quickly than either of the crystalline groups (20% weight loss after six days
in SBF, compared to less than 2% for the other two groups). In addition, Omelon[89] showed
that a partially crystalline material degrades faster than highly crystalline CPP. This suggested
that an amorphous structure, while favourable towards degradation, would not be suitable as a
substrate for osteochondral tissue engineering.
A number of publications have reported the effects of manipulating the chemical composition
of phosphate glass on various mechanical and chemical degradation properties. Knowles
summarized the degradation effects of varying the composition of cation and phosphorous
content in the Na2O-CaO-P2O5, K2O-CaO-P2O5 systems[126]. Both cation and anion contents
were manipulated, and at fixed P2O5 (45 mol%), an increase in Na2O (from 15 mol% to 37
mol%, the balance being CaO) was associated with an increase in the dissolution rate in terms of
substrate mass loss and sodium ion released [126]. A similar effect was achieved by increasing
the concentration of K2O in the K2O-CaO-P2O5 system.

21
Ahmed et al. further investigated this system at 45, 50 and 55 mol% P2O5, each with 30, 35,
or 40 mol% CaO, and the balance being Na2O, to determine the glass transformation
temperatures, glass degradation rates, and phase composition upon annealing of the bulk material
[113]. NaH2PO4, CaCO3, P2O5 were used as precursors, and upon melting for one hour, between
1000ºC to 1050ºC, the melts were poured into a preheated (350ºC) graphite mould and slowly
cooled in a furnace [113]. Differential thermal analysis of the ground glass clearly showed more
than one crystallization peak, and/or more than one melting peak, for all three CaO compositions
at 45 mol% P2O5, at 30 mol% and 40 mol% CaO when phosphate content was 50 mol%, and at
35 mol% and 40 mol% CaO when the phosphate content was 55 mol% [113]. XRD of the
crystallized groups showed that all but one group possessed one or more phases of sodium
calcium phosphate [113]. The authors reported that the major phase of the exception, (Na2O)0.05-
(CaO)0.40-(P2O5)0.55, matched PDF #11-0039, that of β-CPP, but did not indicate whether the
diffraction pattern contained unidentified peaks. Glass degradation was lowest for all three CaO
concentrations at this P2O5 content. Expressed as glass solubility, in terms of weight loss per
initial specimen area, the authors reported approximately 0.05 to 0.06 mg/cm2 of material was
lost at the end of nearly 200 hours of immersion in water at 37ºC. Solubility for other glass
groups reached as high as 0.55 mg/cm2, for (Na2O)0.20-(CaO)0.30-(P2O5)0.50. Glass groups with
higher CaO concentration had lower solubility, for all three P2O5 compositions[113]. The same
observations about degradation were made by the authors when they assessed glass fibre samples
of these compositions[127]; however, they pointed out that it was impossible to produce fibres
with 45 mol% P2O5, owing to the low viscosity of the melt. This could be due to a lack of
phosphate network formers, as the (Na2O + CaO)/P2O5 ratio in this instance is greater than one,
exceeding the metaphosphate range as suggested by van Wazer [99]. Degradation rates of the
crystallized material were not investigated in these studies.

22
Chun et al.[128] combined NaH2PO4•2H2O with Ca(H2PO4)2•H2O to synthesize sodium-
incorporated calcium metaphosphate, and assessed the degradation of the amorphous and
crystalline materials in tris-buffered saline and in simulated body fluids (SBF). The ratio (CaO +
Na2O)/P2O5 was kept at one (metaphosphate region), and two levels of Na2O were assessed (5
mol% Na2O, and 10 mol% Na2O, respectively). Although the authors did not analyze the
chemical nor the phase composition of the starting materials, they found that the amorphous
materials degraded faster than the crystalline materials. Comparing the crystallized groups,
calcium metaphosphate (CMP) with 10 mol% Na2O lost 10% of its initial weight after 21 days in
tris-buffered saline, compared to no weight changes in pure CMP, despite measurable (up to 10%
weight loss) at earlier time points. This “mass gain” during degradation was also observed in
both groups when SBF was used as the solvent, such that pure CMP experienced no weight loss
at the end of the degradation, but 10% weight loss was measured at day 3, 5% weight loss at day
7, whereas CMP with 10 mol% Na2O also measured 10% weight loss at day 3, no weight loss at
day 7, and 4% weight loss at day 21. Since the authors also observed precipitation on the
degrading specimens, it was possible that the weight changes were underestimated values of
actual material degradation. Yoon et al.[112] reported, in the crystallized form, pure CPP, and
CPP with 5% Na2O, experienced no more than 5% weight loss at any time points (1, 7, 14, 21
days) in SBF. Since the authors did not describe in detail their synthesis method, nor did they
characterize the materials, it is difficult to put this data in context.
In another study, Chun et al.[116] assessed the degradation of mixed phase NaCa(PO3)3-
CMP and KCa(PO3)3-CMP. NaH2PO4•2H2O and KH2PO4 were mixed with Ca(H2PO4)2•H2O
and calcined at 600ºC and 650ºC, respectively for twelve hours. The powders were then milled,
pressed, and then sintered in air for three hours at 730º (NaCa(PO3)3-CMP) and 800ºC
(KCa(PO3)3-CMP). For each monovalent salt, 5, 10, 15 and 20 mol% was incorporated, and were

23
measured as mol% of salt (NaCa(PO3)3 or KCa(PO3)3) in CMP. The authors found that whereas
weight changes for NaCa(PO3)3-CMP fluctuated between a gain of 0.120 % (10 mol%
NaCa(PO3)3-CMP) and a loss of 0.027% (20 mol% NaCa(PO3)3-CMP) for these four levels at
the end of 21 days in revised-SBF, increased potassium content was associated with increased
weight loss within the same period, from 0.747% (5 mol% KCa(PO3)3-CMP), to 12.16% (20
mol% KCa(PO3)3-CMP). The authors observed precipitation on NaCa(PO3)3-CMP specimens,
and pore enlargement on KCa(PO3)3-CMP specimens over the course of degradation. They
suggested that the difference in degradation rates between NaCa(PO3)3-CMP and KCa(PO3)3-
CMP was due to preferential degradation of KCa(PO3)3, since diffraction patterns of degraded
samples of the latter showed a reduction in relative intensity of peaks associated with KCa(PO3)3
over the course of degradation. The authors also reported that although the flexural strength of
NaCa(PO3)3-CMP was lower than that of KCa(PO3)3-CMP before degradation (7.7 MPa vs. 16
MPa), it increased during degradation, while that of KCa(PO3)3-CMP decreased. At the end of
two weeks, flexural strength of the former was 13.2 MPa, and that of the latter was 5 MPa.
Unfortunately, the authors did not attempt to resolve how the monovalent cations affected the
calcium polyphosphate phase in these mixed phase groups. Further, as the authors chose a
different synthesis method, one without a high temperature melt, it was difficult to assess
whether the mixed phases occurred via precipitation, as a result of the solubility limit of the
monovalent cation into calcium polyphosphate, or from the initial phosphate mixture.
To assess the degradation effects of doping trace amounts of cations into calcium
polyphosphate, Song et al.[129] incorporated small amounts of sodium carbonate, potassium
carbonate, zinc carbonate, magnesium carbonate, or strontium carbonate into calcium
polyphosphate. The materials were synthesized by mixing each dopant with calcium carbonate
and phosphoric acid in water, dried, then calcined at 500ºC for ten hours and melted at 1200ºC

24
for one hour and quenched in ice. The glass frits were milled, then packed in a cylindrical mould,
pressed, and sintered at 800ºC for one hour. Crystallized calcium polyphosphate was found to
match the β-CPP structure (PDF #17-1953) as described above, and lattice parameters for each
doped group were calculated. Degradation of the specimens in SBF over 28 days showed that
potassium-doped CPP degraded most (0.14%), followed by magnesium-doped CPP, sodium-
doped CPP, zinc-doped CPP, pure CPP (approximately 0.025%), and finally strontium-doped
CPP was most stable (approximately 0.01% weight loss over 28 days). The authors noted that
these values were underestimated by the presence of variable amounts of precipitation on the
specimen surface, which also affected measurements of soluble phosphate in SBF. The initial
spike in degradation observed by Chun et al. [128] was noted in this study only in potassium-
doped, sodium-doped and magnesium-doped CPP. This could be attributed to a difference in
doping concentration. The authors were ambiguous in describing the concentration of the
dopants incorporated in this study. It was further difficult to discern from the available results
since XPS was used to ascertain the presence of each dopant, but the plots showed very faint
signals largely masked by background noise. Since no other analyses for dopant concentration
was present, it was difficult to ensure that the results presented were due to cation doping.
Underlying these studies is a keen interest in introducing impurities to effect CPP
degradation. However, it is unclear whether the results reported thus far represent dopant effects
on degradation of crystalline CPP, or that they are mixed-phase effects, or both. In its capacity as
an osteochondral substrate, mixed-phase effects may compromise the substrate’s ability in tissue
support, particularly if one phase degrades faster than the other(s). Moreover, these papers did
not differentiate between cation from anion effects. Since this study focuses on sodium doping
on CPP, it is therefore necessary to consider the solubility limit of sodium, in its network
modifier form, Na2O, in the CaO-P2O5 phase diagram, when CaO/P2O5 = 1.

25
1.3.4. Na2O-CaO-P2O5 phase diagram
Three phase diagrams of the Na2O-CaO-P2O5 have been published. Morey[93] first described
the binary system NaPO3-Ca(PO3)2 in 1952 (Figure 1.3.3 (left)). However, since the focus of the
paper was to identify calcium-sequestering ability of sodium polyphosphates in hard water, the
compositions investigated leaned towards high concentrations of NaPO3. Further details were
added by van Wazer (Figure 1.3.3 (right), [130]), which provided more details on the opposite
end of the phase diagram, and composition unit conversions. Griffith produced a different
version of the phase diagram based on his work with phosphate glass fibres (Figure 1.3.4, [131]).
Figure 1.3.3. Phase diagram of Na2O•P2O5 and CaO•P2O5.
Phase diagram by from Morey [93] (left), weight percent of CaO•P2O5 is shown on the x-axis. Modified phase diagram by van Wazer [130], (right).

26
None of the phase diagrams show a terminal solid solution of NaO•P2O5 in CaO•P2O5, which
suggests that the solubility of sodium in CaO•P2O5 is either low, or that it is below the lowest
sodium-containing composition investigated. In Morey’s phase diagram this was at 11.2 wt%
NaO•P2O5 (approximately 0.11 Na2O/CaO); the lower limits of the other two phase diagrams are
unknown. It is interesting to note that, while van Wazer pointed out that the formula
Na4Ca(PO3)6 was empirical, Ahmed et al. [113] reported that XRD of their crystallized sodium
calcium phosphate matched powder diffraction patterns of this name, although the material had a
slightly higher M2O/P2O5 ratio ( (Na2O+CaO)/P2O5 =1.22). Based on their results, at
M2O/P2O5 = 1, one would expect to find NaCa(PO3)3, which only appeared in Griffith’s phase
diagram (Figure 1.3.4). All these inconsistencies suggest that the information on the phase
diagrams may be incomplete.

27
Figure 1.3.4. Phase diagram of NaPO3 – Ca(PO3)2.
Phase diagram by Griffith [131]. Proportion of calcium polyphosphate is shown in mol % basis on the x-axis. Typographical errors are: [NaCa(PO3)2] should be [NaCa(PO3)3] between 70% and 100% [Ca(PO3)2]n,, and NaPO3 should read Na4Ca(PO3)6.
28
1.4. Objectives
The overall goal of the project is to determine the effects of sodium doping on crystalline
calcium polyphosphate (CPP), particularly in CPP’s role as an osteochondral tissue-engineered
cartilage substrate. As stated previously, this type of substrates must possess the following
qualities: biocompatibility, bioactivity (towards both cartilage and bone), sufficient mechanical
strength to sustain the loading conditions at the defect site, and the capability to be fabricated
with an open-pore structure to facilitate subchondral bone in-growth. Furthermore, it should be
bioresorbable at a rate that is in concert with the rate of bone in-growth [50, 54]. Since CPP
already possesses many of these properties [52, 67], specific objectives are to determine how
sodium doping affects the mechanical properties and the degradation rate in vitro of CPP.
There are three parts to this project, listed as follows:
• To synthesize vitreous sodium-doped CPP and upon sintering, to characterize the porous
sintered, crystalline substrates;
• To determine the mechanical strength loss of porous crystalline sodium-doped CPP
substrates under in vitro degradation;
• To determine the in vitro chemical degradation rate of porous crystalline sodium-doped
CPP substrates
This study will use three dopants, Na2HPO4, NaOH, and Na2CO3. It is important for sodium-
doped CPP to have the same crystal structure as that of pure CPP, so to isolate the effects of
doping. The as-made sodium-doped CPP substrates should have the same open porosity, as well
as equal if not greater diametral strength, compared to pure CPP substrates. It would be desirable
for sodium-doped CPP to have a faster in vitro degradation rate.

29
2. Methods
2.1. Pure and Sodium-doped CPP synthesis
Pure CPP glass was produced by calcining crystalline Ca(H2PO4)2•H2O (J.T. Baker,
ACS grade, for composition, see Table 2.1.1 and ) at 500ºC for ten hours, followed by
melting at 1100ºC for one hour. The melt was quenched in distilled, deionized water, and
washed with anhydrous ethanol to remove excess water. The glass frit was dried in an
oven (Fisherband Isotherm 600 Series) at 60ºC, and then milled using an automatic
grinder (Retsch RM100) equipped with agate mortar and pestle. Particle sieving using
standard sieves (Fisherbrand Standard Test Sieves) and a sieve shaker (Endecotts
Octagon digital CE) produced glass powders of size range 75µm to 106µm [88].
Table 2.1.1. Composition of Ca(H2PO4)2•H2O supplied by manufacturer. Data was supplied by manufacturer (Baker Analyzed ™, ACS grade, VWR).
Component Content Assay 99-105% Insoluble in HCl Max. 0.01% Chloride Max. 0.002% Sulphate Max. 0.01% Ammonium Max. 0.01% Heavy metals (as Pb) Max. 0.002% Iron (Fe) Max. 0.002% Trace impurities Arsenic (As ) max. 1 ppm
Table 2.1.2. Chemical composition of Ca(H2PO4)2•H2O Results collected from four samples analyzed by neutron activation analysis..
Component Content Ca 15.85% P 21.08%
Mg 250 ppm Al 123 ppm Sr 82 ppm Na 44 ppm Cl 36 ppm

30
Sn 32 ppm Ti 18 ppm Cu 6.5 ppm Br 3.2 ppm I 1.6 ppm
Mn 0.47 ppm V 0.1 ppm
NaOH, Na2HPO4, and Na2CO3 were used to make sodium-doped CPP (Fisher
Scientific, ACS grade for all but Na2CO3, which was HPLC grade, see Table 2.1.3).
Aqueous solutions of each dopant were mixed with crystalline Ca(H2PO4)2•H2O (J.T.
Baker, ACS grade) to produce a slurry, and the slurry was dried at 150ºC to 200ºC for
one hour to remove excess moisture. The viscous mixture then followed the same
procedure as pure CPP synthesis as mentioned above.
Table 2.1.3. Composition of dopant chemicals. Data as specified by Fisher Scientific.
NaOH (ACS grade) Na2HPO4 (ACS grade) Na2CO3 (HPLC grade) Component Content Component Content Component Content
NaOH ≥ 97% Assay ≥ 99.0% Assay ≥ 99.5% Insoluble matter ≤ 0.01% Insoluble matter ≤ 0.01% Loss on drying
(at 105ºC) ≤ 0.2% Loss on heating
(at 285ºC) ≤ 1.0%
Sodium carbonate
≤ 1.0%
Calcium ≤ 0.03% Magnesium ≤ 0.005%Chloride ≤ 0.005% Chloride ≤ 0.002% Chloride ≤ 0.001%Nitrogen compound (as N)
≤ 0.001%
Phosphate ≤ 0.001% Phosphate ≤ 0.001%Sulphate ≤ 0.003% Sulphate ≤ 0.005% Sulphur
compounds (as SO)
≤ 0.003%
Ammonium hydroxide precipitate
≤ 0.002%
Heavy metals (as Ag)
≤ 0.002% Heavy metals (as Pb)
≤ 0.001% Heavy Metals (as Pb)
≤ 5 ppm
Iron ≤ 0.001% Iron ≤ 0.002% Iron ≤ 5 ppm Nickel ≤ 0.001%

31
Potassium ≤ 0.02% Potassium ≤ 0.005%Mercury ≤ 0.1 ppm Silica ≤ 0.005%
Three size ranges of doped glass powders were produced: less than 75µm, 75µm to
106µm, and greater than 106µm. Design dopant concentrations are as follows, expressed
as molar ratios Na2O/CaO:
Table 2.1.4. Design composition of doped material. All values are expressed as molar cationic ratios of sodium oxide to calcium oxide.
Name Na2O/CaO Name Na2O/CaO Name Na2O/CaO Na2HPO4 NaOH Na2CO3
D 0.501 O 0.500 U 0.500 J 0.100 P 0.100 V 0.100 K 0.050 Q 0.049 W 0.050 L1 0.010 R 0.010 X 0.010 M 0.005 S 0.005 Y 0.005 N 0.001 T 0.001 Z 0.001

32
2.2. Chemical analysis of doped CPP glass
Dopant concentrations in CPP glass were quantified by inductively-coupled plasma
atomic emission spectroscopy (ICP-AES). Approximately 0.1 g of milled powder
(<75µm) was dissolved in 10mL of 1N HCl (ICP-MS grade), and heated to 60ºC for 1
hour. An aliquot (1mL) of the resulting solution was diluted to 25mL with distilled,
deionized water. The solutions were analyzed using a Perkin Elmer Optima 3000DV
/7300 DV, and the intensities of the Na, Ca, P spectras were quantified against calibrated
standards. Four samples were taken from the glass frit, and the resulting concentration
readings were averaged from three measurements. Detection wavelengths are listed
below:
Table 2.2.1. Detection wavelengths, ICP-AES. Element Wavelength (nm) Na 589.592 Ca 317.933 P 178.221
Na, Ca, P aqueous standards were made using AAS grade stock solutions (1000ppm,
Spex CertiPrep, Fisher Scientific).

33
2.3. Powder X-ray diffraction
Powder x-ray diffraction was performed using a Rigaku Multiflex diffractometer, at
40 kV 20mA using Cu Kα. Scans were performed at 1 º2θ/min, from 10 to 60 º2θ. Data
collection was performed by the Rigaku software. Milled doped samples (< 75µm) were
used, and both amorphous and crystalline materials were examined. Glass doped CPP
samples were analyzed to ensure that the material is amorphous, while diffraction
patterns of sintered samples were used for phase identification by comparison with the
ICDD database using the Jade software (v. 5.0) [132]. The search-match function was
limited to compounds that definitely contain phosphorus and oxygen, and that possibly
contain calcium or sodium. If residual, minor phases were presented after identification
of the major phase, the pure CPP diffraction pattern was used to isolate the peaks of the
minor phases. Then, the search-match function was used to identify the minor phases,
with the same search parameters.

34
2.4. Thermal Analysis of doped CPP
Crystallization and melting temperatures of milled glass samples were identified by
differential thermal analysis (Netzsch STA 409PC/PG). Pre-weighed samples (< 75µm)
were heated from room temperature to 1100ºC in an inert atmosphere at 10ºC/min.
Thermoelectric changes were recorded in µV/mg; energy standards were not used.
Weight changes were also recorded for comparison in some groups. Data collected were
used to estimate sintering temperatures for these glass samples. Glass transition
temperatures, when clearly shown on thermographs, were also noted. A typical DTA
curve is shown below:
Figure 2.4.1. Schematic of differential thermal analysis of glass Adopted from Barsoum [133]. Glass transition temperature (Tg) is described as an anomaly on the DTA baseline. Crystallization/devitrification and melting are shown as exothermic and endothermic reactions, respectively.
A sample DTA of CPP glass that underwent 122 hours of melting at 1200ºC is
presented below (Figure 2.4.2), showing clearly the glass transformations expected[94]. It
was expected that glass that underwent shorter melting would show less pronounced
signals.

35
Figure 2.4.2. Sample differential thermal analysis of pure calcium polyphosphate Ropp[94] showed that DTA of CPP glass melted for 122 hours clearly showed glass transformations, namely glass transition temperature (Tg), softening temperature (Tsp), devitrification/crystallization temperature (Td), and melting temperature (Tm).

36
2.5. Sintering of pure CPP
Porous crystalline CPP substrates were made by gravity-sintering and crystallizing
amorphous CPP powder under controlled atmosphere (air inlet adjusted to the equivalent
of 35% RH at 23ºC) [87, 103]. Amorphous CPP was prepared as described in Section 2.1
(above). The CPP glass particles (75-106µm) were loosely packed into Pt/Rh crucibles as
described by Porter et al. [88]. Samples were sintered at temperatures below the
crystallization temperature, but above the glass transition temperature, in order to
promote viscous flow sintering [103, 111]. The crystallization step that followed arrested
densification, resulting in a solid body with an open, interconnected porous network.
Grynpas et.al. quantified this porosity to be about 35% (volume basis) based on image
analysis of substrate cross-section SE micrographs, and Omelon reported that specimens
sintered at 585ºC for one hour and crystallized at 950ºC for one hour had a volume
porosity of 29.9±4.2% [89]. Porous constructs of pure CPP sintered from the same size
range from 75 to 106µm, as above, sintered at 585ºC, and crystallized at 950ºC[87, 88],
were used as a control group.

37
2.6. Sintering of doped CPP
Initial sintering experiments were performed in a Lindberg/Blue M tube furnace.
Milled samples, with a particle size range of 75µm to 106µm, were loosely packed in
alumina rectangular trays lined with platinum foils. Sintering was conducted in air, with
constant inlet moisture content (adjusted to the equivalent of 35% RH at 23ºC). To
determine sintering characteristics, samples were heated at 10ºC/min, and held for one
hour at temperatures near their crystallization temperatures, and then cooled to room
temperature. Bulk density and porosity of the sintered constructs at each temperature
were evaluated. Powder x-ray diffraction patterns of ground specimens were used to
determine whether samples had crystallized.
Doped CPP rod specimens were sintered and crystallized based on the doped glass
crystallization and melting temperatures, but the at a ramp rate of 10ºC/min and hold time
of one hour throughout. Sintering temperatures were selected near the crystallization
temperature, while the temperature for the crystallization step was set at a temperature
below the lowest melting temperature of the doped glass groups. These experiments were
performed using a box furnace (Lindberg/Blue M LGO™) with sintering atmosphere
moisture control, and samples were prepared as described above (Section 2.5).

38
2.7. Bulk density and open porosity measurements
Bulk density was calculated by combining the specific gravity of the specimen with
its open porosity. A Sartorius balance (model BP 110S) with density apparatus (model
YDK 01) was used to determine the specimen’s weights in air and ethanol. The specific
gravity, ρsolid, was calculated from these values using the equation (Sartorius YDK 01
manual, p. 18), which included a correction factor for the apparatus (0.99983):
33
/0012.0)]()([99983.0
]/0012.0)([)( cmgflWaWcmgflaW
solid +−⋅
−⋅=
ρρ [eq. 1]
Where ρ(fl) = density of fluid, temperature specific (in this case, ethanol, ρethanol at TºC) W(a) = weight of sample in air W(fl) = weight of sample in fluid (in this case, W(ethanol)) The density of air is taken to be constant (0.0012 g/cm3). Ethanol temperatures were noted for each measurement.
As the sintered samples were porous, ethanol was expected to infiltrate into the
specimen’s open pores when submerged. Thus, after measuring the submerged weight,
the specimen was removed from ethanol, surface liquid was absorbed using moist
Kimwipe, and the ethanol-infiltrated specimen was weighed in air. The volume of open
porosity was calculated using the equation:
CTatethanolporosityopen
aWethanolWVº
)()(ρ
−=
[eq. 2]
Bulk density, ρbulk, of these samples was calculated as the ratio of the sample’s dry
weight to the total volume, made up of the solid volume and the volume occupied by
open porosity. The % open porosity was calculated as the ratio of the open porosity
volume to the total volume. Hence:

39
solidporeopen
solidporeopenbulk aw
V
awVV
aw
ρ
ρ)(
)()(
+=
+=
[eq. 3]
%100)(
% ×=
bulk
porosityopen
aWV
porosityopen
ρ [eq. 4]
Four to six measurements were taken per specimen, with thirty to forty minutes
drying time (at 60ºC) in between measurements, depending on specimen size. Average
bulk density, % open porosity and their respectively standard errors of the mean were
reported for each specimen.

40
2.8. Pyknometry measurements of doped CPP
Density of amorphous and crystalline doped CPP powders were measured using
ISO18753:2004(E), “Determination of absolute density of ceramic powders by
pyknometer.”[134] Approximately one gram of fine powders (particle size < 25 µm) was
placed in the glass pyknometer and the combined weight was recorded (wSP). The exact
sample weight (wS) was back-calculated using the known weight of the empty
pyknometer (wP). The pyknometer was then filled with 90% ethanol, and re-weighed
(wESP). The weight of ethanol was calculated from that of the sample and pyknometer
(wESP - wSP). The mixture was decanted and the pyknometer thoroughly dried, then re-
filled completely with ethanol, and weighed (wEP). The weight of ethanol in this case
(wEP- wP) was compared against the weight of ethanol calculated previously (wESP-wSP).
This difference was converted to the solvent’s volume, equivalent to the volume occupied
by the sample. As the sample was finely ground, all closed porosity was assumed to be
exposed; the sample’s “true” density was estimated by dividing wS by this volume. The
density of the solvent, 90% (v/v) ethanol, at various temperatures was first measured by
accurately pipetting and weighing one millilitre of the solvent into a container of known
weight.

41
2.9. Closed porosity of doped CPP
Closed porosity of glassy and crystallized specimens were calculated by comparing
the material density, as measured using the pyknometer (ρsolid, see above), with the bulk
density (ρbulk, see Section 2.7). The volume of closed porosity, Vclose, was first calculated:
⎟⎟⎠
⎞⎜⎜⎝
⎛ −=−=
truesolid
solidtrueS
true
S
solid
Sclosed w
wwV
ρρρρ
ρρ [eq. 5]
The closed porosity was expressed as a percentage of bulk volume, Vtotal. It was
calculated as follows:
( )truesolid
solidtruebulk
bulk
S
truesolid
solidtrueS
total
closed
w
w
VV
porosityclosedρρ
ρρρ
ρ
ρρρρ
−=
⎟⎟⎠
⎞⎜⎜⎝
⎛ −
==% [eq. 6]
Since total volume may vary, % closed porosity was used to describe doped CPP.

42
2.10. Mechanical testing of sintered/crystallized samples
Sintered and crystallized samples were mechanically tested by diametral
compression, as described by Pilliar et al. [88]. Briefly, cylindrical specimens of 4 mm
diameter were cut into discs 2 mm thick. A load was applied along the diameter of the
specimen, resulting in fracture normal to the direction of force. The strength of the
specimen was calculated as follows:
tDPstrengthDiametral
π2
= [eq. 7]
Where P = applied load (N) D = diameter, average of four measurements (mm) t = thickness, average of four measurements (mm)
The specimens were tested on an Instron 4465 mechanical tester (Instron Canada
Inc.) using a 1000N load cell at a crosshead speed 0.2 mm/min. Only specimens that
failed via brittle fracture were considered (Figure 2.10.1). Weibull statistics were used to
analyze the data for each sample group (See Section 2.13).
05
101520
25303540
0 0.2 0.4 0.6 0.8 1
Displacement (mm)
Forc
e (N
)
Specimen crumbled
0
50
100
150
200
250
300
350
0 0.1 0.2 0.3 0.4 0.5 0.
Displacement (mm)
Forc
e (N
)
Figure 2.10.1. Sample load-displacement curves of disc samples. (Left- Sodium carbonate-doped at 0.1Na2O/CaO)Parts of this specimen chipped away from the bulk as compression was applied, and the entire specimen crumbled. (Right – Sodium phosphate-doped CPP at 0.1 Na2O/CaO) Specimen sustained compression until it ruptured along the diameter normal to the applied force. Only specimens that failed in this way were considered.
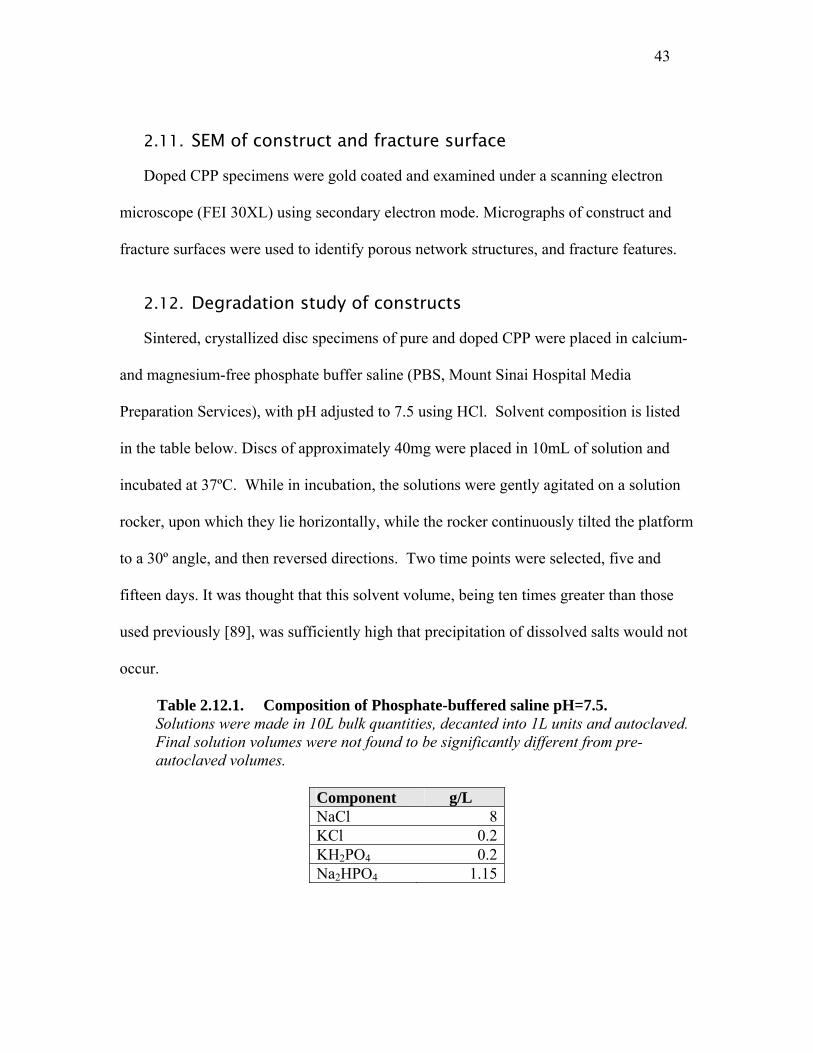
43
2.11. SEM of construct and fracture surface
Doped CPP specimens were gold coated and examined under a scanning electron
microscope (FEI 30XL) using secondary electron mode. Micrographs of construct and
fracture surfaces were used to identify porous network structures, and fracture features.
2.12. Degradation study of constructs
Sintered, crystallized disc specimens of pure and doped CPP were placed in calcium-
and magnesium-free phosphate buffer saline (PBS, Mount Sinai Hospital Media
Preparation Services), with pH adjusted to 7.5 using HCl. Solvent composition is listed
in the table below. Discs of approximately 40mg were placed in 10mL of solution and
incubated at 37ºC. While in incubation, the solutions were gently agitated on a solution
rocker, upon which they lie horizontally, while the rocker continuously tilted the platform
to a 30º angle, and then reversed directions. Two time points were selected, five and
fifteen days. It was thought that this solvent volume, being ten times greater than those
used previously [89], was sufficiently high that precipitation of dissolved salts would not
occur.
Table 2.12.1. Composition of Phosphate-buffered saline pH=7.5. Solutions were made in 10L bulk quantities, decanted into 1L units and autoclaved. Final solution volumes were not found to be significantly different from pre-autoclaved volumes.
Component g/L NaCl 8KCl 0.2KH2PO4 0.2Na2HPO4 1.15

44
A previous study showed that the mechanical strength of pure CPP constructs are
different when tested wet, compared to dry testing [89]. As a result, at the end of each
time point, the degraded specimens immediately underwent diametral compression,
without drying. As an additional “time zero” time point, some specimens for each group
were placed in solution overnight and assessed the next morning.
Upon completion of mechanical testing, the specimens were washed in deionized,
distilled water to remove surface salt precipitates due to the saline solution, then rinsed in
ethanol and dried at 60ºC for one hour in an oven. These specimens were then mounted
and gold-coated for SEM examination (See Section 2.11). The remaining solution was
diluted with deionized, distilled water in a ratio of 1:1, filtered to remove any loose
particles, and the calcium content was measured by ICP-AES, using the same wavelength
as in Table 2.2.1, with appropriate adjustments to the method. Since PBS was originally
free of calcium, measured calcium content was attributed as the degraded species, and
normalized based on the original calcium content in the specimens.

45
2.13. Statistical analysis
Unless noted otherwise, physical and chemical characterization data were presented
as the mean, and error values were presented as the standard error of the mean, along
with the number of specimens sampled. Student t-test is used to analyze the effect of one
factor, and statistical significance and statistical trend is assigned where p < 0.005 and p
< 0.01, respectively.
Weibull statistics were used to analyze diametral compression data of CPP discs. This
described the probability of failure (or survival) as a function of the failure stress
population of CPP specimens [133]. The fraction of specimens that would fail (P) at a
given failure stress (σ) was expressed as:
⎥⎥⎦
⎤
⎢⎢⎣
⎡⎟⎟⎠
⎞⎜⎜⎝
⎛−−=
m
P0
exp1σσ
[eq. 8]
where σ0 = characteristic strength, and m = shape factor, or Weibull modulus.
The Weibull modulus and characteristic strength were unique to the population, and
thus were determined for each doped CPP group. Diametral strength of each specimen in
a group of n samples were sorted and ranked from lowest to highest. A probability of
failure (Pi) was calculated for each ranking (i), using the equation:
4.03.0
+−=
niPi
[eq. 9]

46
Linear regression (Microsoft Excel) of a plot of Pi versus the natural logarithm of
diametral strength for each group was used to solve for the Weibull modulus (slope of the
regression) and characteristic strength (calculated from the y-intercept) in equation 8.
Confidence intervals (90%) of the characteristic strength were reported as error
estimates. This value was expressed as a percentage of the characteristic strength, and
was highly dependent on sample size [135, 136]. Since ten to twenty specimens were
analyzed, the 90% C.I. was determined to be ±10% of the characteristic strength. Where
necessary, student t-test (Microsoft Excel) was used to analyze characteristic strengths
between two groups[137]. ANOVA was not applicable to these sets of data because the
statistical mean used in the procedure is not equivalent to the characteristic strength as
determined by Weibull statistics. The ANOVA procedure employs sums of squares
terms, which determine the sum of squares of differences between each value and the
arithmetic mean, between and within sampling groups. On the other hand, the Weibull
function, based on the “weakest link hypothesis,” gives greater weight to the most serious
flaw, which is not necessarily the largest flaw [133, 138, 139]. As Weibull analysis
requires each group to have at least ten specimens, statistical methods were not applied to
groups with insufficient samples.

47
3. Results
3.1. Differential thermal analysis of doped and pure CPP glass Differential thermal analyses (DTA) were performed on all doped glass samples. Typical
results of pure and doped CPP are shown (sodium phosphate-doped CPP - Figure 3.1.2, sodium
carbonate-doped CPP - Figure 3.1.3, sodium hydroxide-doped CPP - Figure 3.1.4).
Figure 3.1.1. Differential thermal analysis of pure CPP.
Peaks represent crystallization (exothermic) and melting (endothermic).
Differential thermal analysis of pure CPP
-1.50
-1.00
-0.50
0.00
0.50
1.00
1.50
2.00
450 550 650 750 850 950 1050Temp (ºC)
DTA
(µV/
mg)
exothermic

48
Figure 3.1.2. Sample differential thermal analysis of sodium phosphate-doped CPP.
Graphs are labelled (arrows) by dopant concentration in Na2O/CaO.
Differential thermal analysis - Sodium-doped CPP (carbonate)
-0.50
-0.30
-0.10
0.10
0.30
0.50
0.70
0.90
1.10
1.30
1.50
450 550 650 750 850 950 1050Temp (ºC)
DTA
(µV
/mg)
Carbonate-0.1 Carbonate-0.05 Carbonate-0.01 CPP Carbonate-0.5
exothermic
CPP0.050.10.01
0.5
Figure 3.1.3. Sample differential thermal analysis of sodium carbonate-doped CPP.
Graphs are labelled (arrows) using dopant concentration in Na2O/CaO.
Differential thermal analysis - Sodium-doped CPP (phosphate)
-1.50
-1.00
-0.50
0.00
0.50
1.00
1.50
2.00
450 550 650 750 850 950 1050Temp (ºC)
DTA
(µV
/mg)
Phosphate-0.1 Phosphate-0.05 CPP Phosphate-0.01 Phosphate-0.5
exothermic
CPP
0.050.1
0.01
0.5

49
Differential thermal analysis - Sodium-doped CPP (hydroxide)
-1.50
-1.00
-0.50
0.00
0.50
1.00
1.50
2.00
450 550 650 750 850 950 1050Temp (ºC)
DTA
(µV
/mg)
Hydroxide-0.1 Hydroxide-0.01 Hydroxide-0.05
CPP Hydroxide-0.5
exothermic
CPP0.010.05
0.10.5
Figure 3.1.4. Sample differential thermal analysis of sodium hydroxide-doped CPP.
Graphs are labelled (arrows) using dopant concentration in Na2O/CaO. Melting peaks occurred approximately 200ºC lower than that of pure CPP (red) in 0.05 Na2O/CaO and above.
The exothermic peak indicates crystallization of the sample, while the endothermic peak
indicates melting. It is important to note that the ordinate has units µV/mg, rather than mW/g,
hence manipulation of the data for enthalpy of crystallization and of melting was not pursued.
Crystallization and melting temperatures decreased as dopant concentration increased
regardless of dopant sources. Glass transition temperatures, indicated as an inflection on the
thermograms, were not apparent (reported Tg for CPP was 550ºC [140]). Groups doped with
sodium carbonate and sodium phosphate below 0.05 Na2O/CaO showed only one endothermic
peak, but those above this concentration showed two peaks, a smaller peak at temperatures below
800ºC, and another at approximately 950ºC. This suggests that two phases formed for these
groups. Although these groups did not show multiple exothermic peaks, it is possible that two or
more peaks appeared as a merged, broader peak as a result of heating rate (10ºC/min) despite
frequent sampling (every 0.025 min). Recorded crystallization and melting temperatures are

50
listed in Table 3.1.1, and broad peaks are indicated by *. Thermogravimetry was conducted on
some samples, but mass changes were found to be negligible; and so the analysis was not
pursued in all groups.
Table 3.1.1. Peak temperatures from differential thermal analysis. Thermogravimetric results are presented where available. Error in the analysis is ± 5ºC. Temperatures marked by “*” indicate broad peaks.
The thermal behavior of CPP samples doped at 0.5 Na2O/CaO deviated significantly from
that of pure CPP, and their melting temperatures could not be detected.
All peaks in ºC Other peaks in ºC Source Name Na2O/CaO Tc Tm Endoth
ermic Exothermic
Thermogravimetry analysis (% weight
change) CPP 0 653 974 n/a --
-
CPP 0 652 972 n/a 0.5 0.5 545 748 n/a 0.1 0.1 598 747 894*,
981* n/a
0.05 0.05 635* 742* 947*, 972*
n/a
0.01 0.01 648 969* n/a 0.005 0.005 644 975* n/a
Na 2
HPO
4
0.001 0.001 670 998 -0.68% 0.5 0.5 512 undetected -0.4% 0.1 0.1 601 758 955*,
901* 714* n/a
0.05 0.05 623* 752 954* n/a 0.01 0.01 642 971* -0.3%
0.005 0.005 643 974 -1.1%
NaO
H
0.001 0.001 655 980 -0.3% 0.5 0.5 491 undetected -0.3% 0.1 0.1 611 750 899*,
951* -0.2%
0.05 0.05 624* 746 945* -0.4% 0.01 0.01 647 976 -0.2%
0.005 0.005 643* 971 -0.8%
Na 2
CO
3
0.001 0.001 652 977 -0.3%

51
3.2. Powder X-ray diffraction of doped CPP glass
Diffraction patterns were obtained from all remaining sample groups (<75µm), and all were
found to be amorphous. As an example, sodium-carbonate doped specimens are shown below
(Figure 3.2.1): Ar
bitra
ry u
nits
Figure 3.2.1. XRD pattern of sodium-doped calcium polyphosphate. Sodium carbonate-doped materials are shown for the following concentrations: 0.1 Na2O/CaO (blue), 0.05 Na2O/CaO (red), 0.01 Na2O/CaO (magenta), 0.005 Na2O/CaO (green).

52
3.3. Chemical analysis of as-made doped CPP frit
Four replicates of each doped sample were analyzed by inductively-coupled plasma atomic
emission spectroscopy (ICP-AES) using the method described in Section 2.2 and concentrations
of sodium, calcium and phosphorus were reported as mg/L. These values were normalized using
the original sample mass, and then converted to molar ratios of Na2O to CaO to compare with
expected dopant concentrations, as listed in Section 2.1.
Table 3.3.1. Composition of doped material. All values are expressed as ratios of mol/mol. Cations are expressed as cation oxides, and and phosphorus is expressed as phosphorus pentoxide (P2O5).
Dopant Source (Sample Name)
n Expected Na2O/CaO
Measured Na2O/CaO
Measured CaO/P2O5
Measured (Na2O + CaO)
/P2O5 CPP 4 0 0.0065 ± 0.0001 1.0426 ± 0.0019 1.0493 ± 0.0039
0.1 4 0.099 0.0987 ± 0.0001 0.9749 ± 0.0014 1.0711 ± 0.00300.05 4 0.053 0.0397 ± 0.0003 1.0710 ± 0.0064 1.1136 ± 0.01310.01 4 0.010 0.0185 ± 0.0000 1.0147 ± 0.0021 1.0335 ± 0.0043
Na 2
HPO
4
0.005 4 0.005 0.00651 ± 0.00005 1.0152 ± 0.0035 1.0218 ± 0.00710.1 4 0.100 0.0991 ± 0.0003 1.0043 ± 0.0043 1.1039 ± 0.00930.05 3 0.049 0.0479 ± 0.0002 1.0022 ± 0.0020 1.0502 ± 0.00420.01 4 0.010 0.0108 ± 0.0001 1.0178 ± 0.0018 1.0288 ± 0.00370.005 4 0.005 0.0053 ± 0.0001 0.9956 ± 0.0045 1.0008 ± 0.0090N
aOH
0.001 4 0.001 0.0023± 0.0001 0.9995 ± 0.0031 1.0018 ± 0.00620.1 4 0.100 0.1030 ± 0.0001 1.0057 ± 0.0018 1.1093 ± 0.00380.5 4 0.050 0.0515 ± 0.0001 1.0170 ± 0.0025 1.0694 ± 0.00530.01 3 0.010 0.00865 ± 0.00004 0.8056 ± 0.0031 0.8126 ± 0.00620.005 4 0.005 0.00572 ± 0.00003 0.9997 ± 0.0040 1.0168 ± 0.0081N
a 2C
O3
0.001 4 0.001 0.00190 ± 0.00003 1.0134 ± 0.0027 1.0094 ± 0.0055
As another representation of the composition, molar values are normalized to sample mass in the
table below. Expected values of each element are reported based on mass balance, taking into
account the initial dopant chemical incorporated into Ca(H2PO4)2•H2O

53
Table 3.3.2. Doped material content, expressed in as mmol/(g sample). Error values are determined by standard error of the mean and error propagation.
Dopant Source (Name)
n Expected mmol Na/ g sample
Measured mmol Na/ g sample
Expected mmol Ca/ g sample
Measured mmol Ca/ g sample
Expected mmol P/ g sample
Measured mmol P/ g sample
CPP 4 0.000 0.069 ± 0.002 4.970 5.452 ± 0.012 9.940 10.46 ± 0.03 J 4 0.917 1.072 ± 0.002 4.646 5.432 ± 0.010 9.750 11.14 ± 0.02 K 4 0.520 0.464 ± 0.004 4.886 5.852 ± 0.054 10.03 10.93 ± 0.08 L1 4 0.104 0.189 ± 0.001 5.017 5.138 ± 0.010 10.09 10.13 ± 0.04
Na 2
HPO
4
M 4 0.051 0.075 ± 0.001 5.034 5.791 ± 0.028 10.09 11.41 ± 0.06 P 4 0.990 1.101 ± 0.005 4.935 5.552 ± 0.021 9.870 11.06 ± 0.08 Q 3 0.471 0.522 ± 0.003 4.842 5.457 ± 0.011 9.685 10.89 ± 0.04 R 4 0.101 0.107 ± 0.001 5.038 4.968 ± 0.010 10.08 9.764 ± 0.028 S 4 0.052 0.059 ± 0.001 5.044 4.805 ± 0.012 10.09 9.544 ± 0.072 N
aOH
T 4 0.010 0.026 ± 0.001 5.049 4.902 ± 0.013 10.10 9.730 ± 0.040 V 4 0.991 1.003 ± 0.003 4.935 4.866 ± 0.009 9.870 9.680 ± 0.029 W 4 0.500 0.516 ± 0.001 4.992 5.006 ± 0.009 9.984 9.847 ± 0.047 X1 4 0.103 0.071 ± 0.001 5.050 4.420 ± 0.010 10.10 11.06 ± 0.06 Y 4 0.051 0.061 ± 0.001 5.044 4.924 ± 0.024 10.09 9.756 ± 0.062 N
a 2C
O3
Z 4 0.010 0.025 ± 0.001 5.049 4.978 ± 0.018 10.10 9.890 ± 0.041
Since trace amounts of sodium was found in pure CPP, which was comparable to sodium-
doped CPP at 0.005 Na2O/CaO, the study was further narrowed to examine doped-CPP at
concentrations higher than this value. As a result, initial sintering was conducted upon CPP
doped at 0.1 and 0.01 Na2O/CaO.

54
3.4. Initial sintering experiments
CPP doped at 0.1 Na2O/CaO and 0.01 Na2O/CaO using the three dopants were sintered at
near-crystallization temperatures as indicated by DTA thermograms. For simplicity, the
following results refer to these groups by their dopant source and concentration, e.g.,
“Carbonate-doped 0.01” refers to sodium carbonate-doped CPP at 0.01 Na2O/CaO. Sintering
conditions are as-follows:
Table 3.4.1. Heating profile of one-stage pure and sodium-doped CPP Sintered specimens are air-cooled before removal from furnace.
Samples Heating rate Dwell time CPP 10ºC/min to 500ºC, 5ºC/min to 585ºC 1 hour at 585ºC 0.1 Na2O/CaO (all dopant sources)
10ºC/min to 500ºC, 5ºC/min to 540ºC 1 hour at 540ºC
0.01 Na2O/CaO (all dopant sources)
10ºC/min to 500ºC, 5ºC/min to 582ºC 1 hour at 582ºC
The purpose of this test was to identify the groups that could be sintered into intact, porous
constructs. SEM images (Figure 3.4.2) of the samples indicated that Phosphate-doped 0.1 and
Carbonate-doped 0.1 showed particle rounding and some sinter necks, as do Phosphate-doped
0.01. Carbonate-doped 0.01, Hydroxide-doped 0.1 and 0.01 specimens showed less particle
rounding, and sinter neck formation was not obvious.

55
Source CPP doped at 0.1 Na2O/CaO CPP doped at 0.01 Na2O/CaO
Phosphate
Hydroxide
Carbonate
Figure 3.4.2. Scanning electron micrographs of doped CPP. CPP doped at 0.1 Na2O/CaO (left) or 0.01 Na2O/CaO (right) are labelled by the dopant sources (left-most column).
XRD patterns of these samples indicated that Hydroxide-doped 0.1 and 0.01 already
underwent crystallization at these temperatures (Figure 3.4.3 for CPP doped at 0.1 Na2O/CaO,
and Figure 3.4.4 for CPP doped at 0.01 Na2O/CaO). Combined with the observation that there
was little sinter neck formation in these groups, only CPP doped with sodium phosphate
(phosphate-doped CPP) and CPP doped with sodium carbonate (carbonate-doped CPP) at 0.1
Na2O/CaO appeared to be more promising candidates to produce sintered porous constructs.

56
arbi
trar
y un
it
Figure 3.4.3. Powder X-ray diffraction patterns of 0.1 Na2O/CaO sintered at 540ºC.
Phosphate-doped CPP appeared amorphous (blue), while Hydroxide-doped CPP (red) showed crystalline patterns. Carbonate-doped CPP (magenta) appeared amorphous. Diffraction pattern of Ca(PO3)2 (PDF #11-0039) is shown as green marks for reference.
arbi
trar
y un
it
Figure 3.4.4. Powder X-ray diffraction patterns of 0.01 Na2O/CaO, sintered at 582ºC.
Phosphate-doped CPP (blue) appeared amorphous, while Carbonate-doped CPP (magenta) crystallized, and Hydroxide-doped CPP (red) appeared amorphous with some crystalline content. Diffraction pattern of Ca(PO3)2 (PDF #11-0039) is shown as green markers for reference.

57
3.5. Sintering and crystallization of doped-CPP at 0.1 Na2O/CaO
3.5.1. Physical Characterization of Sintered Doped-CPP
Phosphate-doped 0.1 and Carbonate-doped 0.1 were sintered at different temperatures
near crystallization temperatures to determine appropriate conditions to produce an open pore
structure for tissue engineering, with an open porosity of approximately 35% [52, 67, 88]. As a
preliminary experiment these groups were sintered at 530ºC, 540ºC, 550ºC, 560ºC, and 570 ºC
for one hour. Bulk density and open porosity were measured for these groups, and between two
to three specimens were analyzed (Figure 3.5.1). As sintering temperature increased, specimens
from both dopant sources show an increase in bulk density and a decrease in open porosity. This
densification was reflected in SEM images of these specimens (Figure 3.5.2). XRD patterns of
these specimens showed that crystallization occurs in treatments higher than 550ºC (Phosphate-
doped CPP - Figure 3.5.3; Carbonate-doped CPP - Figure 3.5.4). While comparable bulk density
and open porosity to those of pure CPP were achieved when these specimens were sintered at
540ºC, both Phosphate-doped 0.1 and Carbonate-doped 0.1 specimens sintered at 530ºC did not
hold together during bulk density measurements, and these specimens could not be properly
mounted for SEM observation. However, XRD of these specimens were performed.
Doped CPP (0.1Na2O/CaO)
0%
5%
10%
15%
20%
25%
30%
35%
40%
45%
50%
530 540 550 560 570
Sintering temperature (ºC)
Ope
n po
rosi
ty (%
)
0.00
0.50
1.00
1.50
2.00
2.50
Bul
k de
nsity
(g/c
m^3
)
Phosphate (bulk density) Carbonate (bulk density) Phosphate (% porosity) Carbonate (% porosity) Figure 3.5.1. Bulk density of one-stage sodium-doped CPP at 0.1 Na2O/CaO.
Phosphate-doped CPP (purple) and Carbonate-doped CPP (blue) showed increasing bulk density and decreasing open porosity after one-stage sintering.

58
Sintering temperature
Phosphate-doped 0.1 Carbonate-doped 0.1
540ºC
550ºC
560ºC
570ºC
Figure 3.5.2. SEM of Phosphate-doped 0.1 and Carbonate-doped 0.1 Phosphate-doped CPP (left) and Carbonate-doped CPP (right) at 0.1 Na2O/CaO sintering temperatures as labelled.

59
arbi
trar
y un
it
Figure 3.5.3. X-ray diffraction patterns of sintered Phosphate-doped 0.1
Phosphate-doped CPP at 0.1 Na2O/CaO showed that crystallization occurred in specimens sintered at temperatures greater than 550ºC. Sintering temperatures are indicated to the left of each pattern, and green markers represent PDF #11-0039 Ca(PO3)2.
570ºC 560 ºC 550 ºC 540 ºC
530 ºC

60
arbi
trar
y un
it
Figure 3.5.4. X-ray diffraction patterns of sintered Carbonate-doped 0.1. Carbonate-doped CPP doped at 0.1 Na2O/CaO crystallized when sintered at temperatures greater than 550ºC. Sintering temperatures are indicated to the left of each pattern, and green markers represent PDF #11-0039 Ca(PO3)2.
3.5.2. Physical Characterization of Sintered, Crystallized Doped-CPP (730ºC)
To maximize crystallization, a second stage of heat treatment was applied to phosphate-
and carbonate-doped CPP at 0.1 Na2O/CaO, near their melting points. In these experiments,
Phosphate-doped 0.1 and Carbonate-doped 0.1 were first sintered at 540, 550, 560, and 570
respectively for one hour, and then further heating was conducted at 10ºC/min to 730ºC and held
for one hour. The objective was to measure the final open porosity to determine the proper
combination of sinter neck formation and crystallization. Open porosity of all groups, regardless
of the sintering temperature, dropped to approximately 10% from this crystallization treatment
(Table 3.5.1). This was also observed from SEM images (Figure 3.5.5). Porous networks
observed from sintering (Figure 3.5.2) collapsed upon crystallization treatment, and sintered
570ºC 560 ºC 550 ºC 540 ºC
530 ºC

61
particle contours were difficult to distinguish from the bulk. Isolated pores could be observed
from these fracture surfaces, and overall, this degree of densification was unexpected.
Table 3.5.1. Summary of specimens of sintered, crystallized Phosphate-doped 0.1 and Carbonate-doped 0.1. Specimens were sintered at different temperatures and crystallized at 730ºC. Sintered and crystallized CPP was used as control. Errors represent standard error of the mean.
Group CPP Phosphate-doped CPP 0.1 Carbonate-doped CPP 0.1
Sintering temperature (ºC) 585 540 550 560 570 540 550 560 570 Number of samples 28 8 7 4 8 8 8 4 7 Open porosity (%)
36.1% ±0.9%
10.8% ± 1.10%
15.8% ± 2.10%
12.6% ± 1.80%
15.7% ± 1.4%
11.0% ± 2.0%
12.2% ± 1.3%
11.7% ± 1.8%
11.0% ± 2.3%
Bulk density (g/cm3)
1.66 ± 0.02
2.38 ± 0.03
2.21 ± 0.05
2.33 ± 0.04
2.25 ± 0.04
2.39 ± 0.05
2.30 ± 0.04
2.32 ± 0.06
2.36 ± 0.06

62
Sintering temperature (ºC) Phosphate-doped 0.1 Carbonate-doped 0.1
540ºC
550ºC
560ºC
570ºC
Figure 3.5.5. SEM images of Phosphate-doped 0.1 and Carbonate-doped 0.1. Fracture surfaces of are labelled by their sintering temperature (left-most column). All specimens were crystallized at 730ºC

63
3.5.3. Physical Characterization of Sintered, Crystallized Doped-CPP (718ºC)
Crystallization of these specimens was attempted once more at a reduced temperature
(718ºC), using the same heating profiles. For each dopant source, two rods specimens were
sintered at each sintering/crystallization temperature. Specimens were then cut into discs
approximately 2 mm thick. Bulk density and open porosity of 13 to 14 specimens for each
dopant/sintering temperature was measured (Table 3.5.2).
Table 3.5.2. Summary of specimens of sintered, crystallized Phosphate-doped 0.1 and Carbonate-doped 0.1. Phosphate-doped CPP at 0.1Na2O/CaO and carbonate-doped CPP at 0.1Na2O/CaO, sintered at different temperatures and crystallized at 718ºC. Sintered and crystallized CPP was used as control.
Group CPP Phosphate-doped CPP 0.1 Carbonate-doped CPP 0.1 Sintering temperature (ºC)
585/ 950ºC 540 550 560 570 540 550 560 570
Number of samples 28 14 14 13 14 14 14 14 14 Open porosity (%)
36.1% ±0.9%
37.7% ±1.3%
34.0% ±1.5%
24.6% ±0.8%
13.3% ±0.6%
34.3% ±1.1%
13.2% ±0.6%
11.6% ±0.8%
13.3% ±1.3%
Bulk density (g/cm3)
1.66 ±0.02
1.67 ±0.03
1.77 ±0.04
1.96 ±0.02
2.32 ±0.02
1.73 ±0.02
2.27 ±0.02
2.35 ±0.02
2.31 ±0.03
Crystallized Carbonate-doped 0.1 sintered at 540ºC, and crystallized Phosphate-doped
0.1 specimens sintered at 540ºC or 550ºC, all had comparable open porosity to that of pure CPP.
However, open porosity decreased in all other doped specimens after crystallization. SE
micrographs (Figure 3.5.6) clearly confirmed this. Crystallized Phosphate-doped 0.1 specimens
have a morphology similar to as-sintered samples (Figure 3.5.2). Crystallized Carbonate-doped
0.1 specimens, however, lost the morphology of sintered particles, and sinter necks became
indistinguishable. Interestingly, there were no signs of extensive melting, and some specimens
appeared hollow (white arrows, Figure 3.5.6).
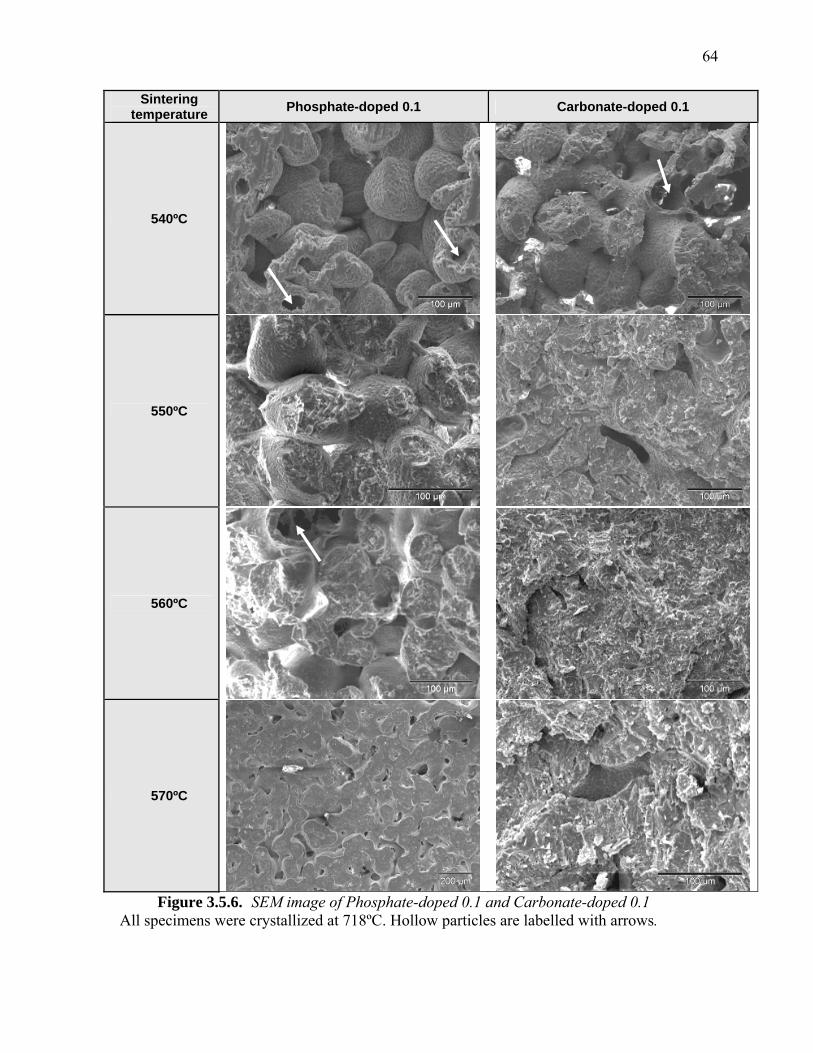
64
Sintering temperature Phosphate-doped 0.1 Carbonate-doped 0.1
540ºC
550ºC
560ºC
570ºC
Figure 3.5.6. SEM image of Phosphate-doped 0.1 and Carbonate-doped 0.1
All specimens were crystallized at 718ºC. Hollow particles are labelled with arrows.

65
3.5.4. Mechanical Properties of Sintered, Crystallized Doped-CPP
Logarithmic survival probability plots for Phosphate-doped 0.1 and Carbonate-doped 0.1
are shown in Figure 3.5.7 and Figure 3.5.8. All groups showed more than one linear region,
suggesting more than one failure mode. Linear regression was performed for these plots, from
which the characteristic strength (σc), and Weibull modulii (m) were calculated. Error was
estimated at ± 10% of the characteristic strengths of each group, as described by McLean and
Hartsock [136]. R2 values are listed as an indication of goodness-of-fit (Table 3.5.3). Sample
sizes differed from those used for bulk density measurements (Table 3.5.2) as some samples
experienced compression rather than brittle failure, and were removed from the pooled data.
Survival probability - Phosphate-doped 0.1
-2.0
-1.0
0.0
1.0
2.0
3.0
4.0
0 1 2 3 4
ln(stress)
-ln(ln
(1/fa
ilure
pro
babi
lity)
)
CPP 540ºC/718ºC 550ºC/718ºC 560ºC/718ºC 570ºC/718ºC
Figure 3.5.7. Weibull plots of Phosphate-doped CPP at 0.1 Plots of sodium phosphate-doped CPP at 0.1 Na2O/CaO are labelled with their sintering/crystallization temperatures.

66
Survival probability - Carbonate-doped 0.1
-2.0
-1.0
0.0
1.0
2.0
3.0
4.0
0 1 2 3 4 5
ln(stress)
-ln(ln
(1/fa
ilure
pro
babi
lity)
)
CPP 540ºC/718ºC 550ºC/718ºC 560ºC/718ºC 570ºC/718ºC
Figure 3.5.8. Weibull plots of Carbonate-doped CPP 0.1 Plots of sodium carbonate-doped CPP at 0.1Na2O/CaO are labelled with their sintering/crystallization temperatures.
Table 3.5.3. Summary of Weibull modulus and characteristic strengths of doped-CPP at 0.1 Na2O/CaO.
Phosphate-doped CPP Carbonate-doped CPP Group CPP 540ºC 550 ºC 560 ºC 570 ºC 540 ºC 550 ºC 560 ºC 570 ºC
n 21 13 8 10 14 13 12 12 11 % open porosity
34.5% ± 0.8%
37.9% ± 1.4%
31.5% ± 1.0%
24.5% ± 1.0%
13.3% ± 0.6%
34.5% ± 1.1%
13.4% ± 0.7%
11.5% ± 0.8%
13.0 ± 1.3%
Weibull modulus 3.30 2.24 4.18 4.15 5.85 4.25 7.80 5.31 5.70
σc 7.50 8.36 12.78 11.65 36.25 9.36 32.80 43.87 18.80 Δσc 0.75 0.84 1.28 1.17 3.63 0.94 3.28 4.39 1.88 R2 0.9544 0.8921 0.9106 0.9431 0.9233 0.8373 0.9748 0.8412 0.9538
3.5.5. XRD of Sintered, Crystallized Doped-CPP
Sample XRD patterns of specimens from both dopant sources showed that doped-CPP
was amorphous when sintered at 550ºC, but at either crystallization temperature (718ºC or
730ºC), the specimens have crystallized (Figure 3.5.9 and Figure 3.5.10, for Phosphate-doped 0.1
and Carbonate-doped 0.1, respectively). Although major peaks were identified as those of
crystalline β-CPP (sintered, crystallized CPP, blue patterns in Figures 1.5.9 and 1.5.10), a

67
number of other prominent peaks also appeared, suggesting multiple phases. It is interesting to
note that these residual peaks are similar regardless of crystallization temperature used.
arbi
trar
y un
it
Figure 3.5.9. X-ray diffraction patterns of Phosphate-doped 0.1.
Sintered (at 550ºC) and crystallized sodium phosphate-doped CPP at 0.1Na2O/CaO showed diffraction patterns with similar major peaks compared to crystallized CPP (blue pattern), but other peaks are unaccounted for. This is observed in specimens crystallized in 718ºC (green pattern), as well as those crystallized at 730ºC (brown patterns). Red patterns are obtained from sintered specimens not exposed to a second, high temperature, crystallization heat treatment.
730ºC 718ºC pure CPP (blue)
sinter-only

68
arbi
trar
y un
it
Figure 3.5.10. X-ray diffraction patterns of Carbonate-doped 0.1. Diffraction patterns of sintered (at 550ºC) and crystallized sodium carbonate-doped CPP at 0.1Na2O/CaO have similar major peaks compared to crystallized CPP (blue pattern), but other peaks are unaccounted for. This is observed in specimens crystallized in 718ºC (green pattern), as well as those crystallized at 730ºC (brown patterns). Red patterns are obtained from sintered specimens not exposed to a second, high temperature, crystallization heat treatment.
An attempt was made to identify these other phases using Jade with the PDF-2 database. The
XRD pattern of crystalline sintered CPP was subtracted from crystalline doped CPP patterns.
The residual peaks underwent search and match functions to find the most likely full-pattern fits
within the PDF-2 database. Phases that are associated with these other peaks are tabulated below
(Table 3.5.4).
Table 3.5.4. Pattern matches with residual peaks of doped-CPP at 0.1Na2O/CaO. Doped CPP groups (# of patterns examined)
Name ICDD # Phosphate-doped 0.1
patterns (5)
Hydroxide-doped 0.1
patterns (5)
Carbonate-doped 0.1
patterns (4) NaCa(PO3)3 23-0669 5 5 4 Na1.8Ca1.1P6O17 47-0863 5 4 3 Na4Ca(PO3)6 25-0811 2 3 1
09-0345 0 1 3 09-0346 1 0 0 Ca2P2O7 33-0297 2 1 2
CaP2O6 11-0039 1 0 1 Ca4P6O19 15-0177 1 0 2
730ºC 718ºC pure CPP (blue)
sinter-only

69
A number of standard powder diffraction patterns matched residual patterns of both
doped sources. The tally above also clearly showed that if the standard and residual patterns are
true matches, then the residual patterns consist of a combination of mixed phases. Interestingly,
diffraction patterns of sintered, crystallized (730ºC) Hydroxide-doped 0.1 also contain additional
peaks than those of pure CPP (Figure 3.5.11). Even though Carbonate-doped 0.1 and Phosphate-
doped 0.1 could be sintered into porous constructs with greater characteristic tensile strength
compared to pure CPP of the same porosity, their lack of phase homogeneity made them
undesirable substrates for tissue engineering.
arbi
trar
y un
it
Figure 3.5.11. X-ray diffraction patterns of Hydroxide-doped 0.1. Patterns of sodium hydroxide-doped CPP at 0.1 Na2O/CaO, sintered (590ºC – green) and sintered-then-crystallized (590ºC and 730ºC– brown). Peaks in addition to those of pure CPP (blue) can be observed.
590ºC/730ºC 590ºC pure CPP (blue)

70
3.6. Sintering and crystallization of doped-CPP at 0.01 Na2O/CaO
3.6.1. Physical Characterization of Sintered, Crystallized Doped-CPP (720ºC)
Two sintering temperatures for sodium phosphate-doped CPP at 0.01 Na2O/CaO and
sodium carbonate-doped CPP at 0.01 were selected (580ºC and 590ºC) since initial sintering
experiments (Section 3.4) produced intact samples, with insufficient sinter necks. These rod
specimens were crystallized at 720ºC for one hour, and disc specimens were cut. Bulk density
and open porosity were determined (Table 3.6.1).
Table 3.6.1. Summary of bulk density and open porosity of doped-CPP at 0.01 Na2O/CaO. CPP doped at 0.01 Na2O/CaO using sodium phosphate (Phosphate-doped 0.01), sodium hydroxide (Hydroxide-doped 0.01), or sodium carbonate (Carbonate-doped 0.01) were sintered at the temperatures shown and crystallized at 720ºC. Reported data showed mean ± S.E. of the mean.
CPP Phosphate-doped 0.01
Hydroxide-doped 0.01
Carbonate-doped 0.01
Sintering temperature (ºC)
585ºC/ 950ºC 580ºC 590ºC 580ºC 590ºC 580ºC 590ºC
Number of samples 28 11 14 9 14 7 39
Open porosity (%)
36.1% ± 0.9%
30.1% ± 1.1%
33.1% ± 2.5%
38.1% ± 0.5%
39.8.% ± 1.2%
45.8% ± 1.4%
36.9% ± 0.5%
Bulk density (g/cm3)
1.66 ± 0.02
1.88 ± 0.02
1.77 ± 0.02
1.61 ±0.01
1.59 ±0.03
1.41 ±0.02
1.69 ± 0.01
Sintered, crystalline pure CPP discs were used for comparison. Sample size varied in
these groups as a number of the specimens crumbled during handling, particularly those sintered
at 580ºC. Bulk density and open porosity showed that the applied sintering temperatures had
different effects on CPP doped at 0.01 Na2O/CaO depending on the dopant source. Sodium
phosphate-doped CPP at 0.01 Na2O/CaO (Phosphate-doped 0.01) has lowest open porosity,
while sodium carbonate-doped CPP at 0.01 Na2O/CaO (Carbonate-doped 0.01) has the highest
open porosity, when sintered at 580ºC. The same ranking persists when the specimens are
sintered at 590ºC.

71
It is interesting to note that contrary to expectations, Phosphate-doped 0.01 specimens
shows a slight increase in open porosity (3.0% ± 2.7%, p=0.048 < 0.05), and a decrease in bulk
density (0.11± 0.03g/cm3, p=0.002 <0.01) as sintering temperature increased. Carbonate-doped
0.01 showed the largest change over a ten-degree sintering temperature difference, a decrease of
8.9% ± 1.5% and an increase of 0.28 ± 0.02g/cm3, in open porosity and bulk density,
respectively. Since a large number of specimens sintered at 580ºC that could not be assessed,
significance could not be reported. Hydroxide-doped 0.1 did not appear influenced by sintering
temperature changes, as evidenced by statistically insignificant differences in open porosity and
bulk density.
3.6.2. Mechanical Properties of Sintered, Crystallized Doped-CPP (720ºC)
Diametral compression of doped CPP at 0.01 Na2O/CaO was performed, and it was
observed that Carbonate-doped 0.01 specimens sintered at 580ºC failed by compression, rather
than tension, and could not be considered in the Weibull analysis. Survival probability plots for
all other doped-CPP groups at 0.01 Na2O/CaO are shown (Figure 3.6.1 to Figure 3.6.3). Since all
groups appear to conform to the linear regression, visual inspection suggests that each group was
influenced by only one population of flaws. While it may be an artefact of the small sample
sizes, it is interesting to note that both Phosphate-doped 0.01 and Hydroxide-doped
0.01specimens sintered at 590ºC have lower ranges of failure stresses, compared to those
sintered at 580ºC. Weibull modulus (m), characteristic strength (σc), and coefficient of
determination (R2) results are shown in Table 3.6.2.

72
Survival probability - Phospahte-doped 0.01
-3.0
-2.0
-1.0
0.0
1.0
2.0
3.0
4.0
0.0 1.0 2.0 3.0 4.0
ln(stress)
-ln(ln
(1/fa
ilure
pro
babi
lity)
)
CPP 582ºC/720ºC 592ºC/720ºC
Figure 3.6.1. Survival plot of Phosphate-doped 0.01. Groups are listed by their sintering/crystallization temperature. Sintered, crystallized CPP is shown (in blue) for comparison. Plots of each group is shown with a linear guide for a single mode of failure.
Survival probability - Hydroxide-doped 0.01
-3.0
-2.0
-1.0
0.0
1.0
2.0
3.0
4.0
0.0 0.5 1.0 1.5 2.0 2.5 3.0 3.5 4.0
ln(stress)
-ln(ln
(1/fa
ilure
pro
babi
lity)
)
CPP 590ºC/720ºC 580ºC/720ºC
Figure 3.6.2. Survival plot of Hydroxide-doped 0.01. Groups are listed by their sintering/crystallization temperature. Sintered, crystallized CPP is shown (in blue) for comparison. Plots of each groups is shown with a linear guide for a single mode of failure.

73
Survival probability - Carbonate-doped 0.01
-3.0
-2.0
-1.0
0.0
1.0
2.0
3.0
4.0
0.0 1.0 2.0 3.0 4.0
ln(stress)
-ln(ln
(1/fa
ilure
pro
babi
lity)
)
CPP 592ºC/720ºC
Figure 3.6.3. Survival plot of Carbonate-doped 0.01. Sintered, crystallized CPP is shown (in blue) for comparison.
Table 3.6.2. Summary of Weibull plots of doped-CPP at 0.01 Na2O/CaO. All groups were crystallized at 720ºC for one hour. Data for Carbonate-doped 0.01 sintered at 582ºC was eliminated.
Phosphate-doped 0.01
Hydroxide-doped 0.01
Carbonate-doped 0.01 Group CPP
582ºC 592ºC 582ºC 592ºC 582ºC 592ºC n 21 9 13 9 14 33
% open porosity
34.5% ± 0.8%
28.7% ± 0.8%
33.2% ± 1.0%
38.1% ± 0.5%
39.8% ± 1.2%
36.5% ± 0.6%
Weibull modulus
3.30 7.51 5.85 5.93 2.58 5.71
σc (MPa) 7.50 22.08 15.87 5.40 4.07 18.20 Δσc (MPa) 0.75 2.21 1.59 0.54 0.41 1.82
R2 0.9544 0.9537 0.9708 0.8998 0.9314
n/a
0.9783
Although linear regression showed favourable goodness-to-fit between the calculated
parameters and the collected data, the Weibull distribution has a strong dependence on sample
size. As a result, the parameter estimates for Phosphate-doped 0.01 and Hydroxide-doped 0.01,
sintered at 580ºC and crystallized at 720ºC, were likely affected by higher uncertainty than
others.
It is surprising that Phosphate-doped 0.01 (sintered at 590ºC and crystallized at 720ºC)
specimens have twice the characteristic strength compared to pure CPP, when the two groups

74
have similar open porosity (Table 3.6.1). The same is observed from the comparison between
Carbonate-doped 0.01 (sintered at 590ºC and crystallized at 720ºC) and the control group.
3.6.3. SEM of Sintered, Crystallized Doped-CPP
SEM micrographs of doped CPP of 0.01 Na2O/CaO from all three dopant sources showed
features similar to those found in 0.1 Na2O/CaO groups. Porosity within particles was observed
(black arrows), but not to the extent seen in groups of the higher doping concentration. Sinter
necks observed from Carbonate-doped 0.01 specimens sintered at 580ºC were narrow, with little
densification, but this changed dramatically when the specimens were sintered at 590ºC, in
which sinter necks and densification increased visibly, and particle rounding was obvious.

75
Group Disc surface Fracture surface
CPP
Ph
osph
ate-
dope
d 0.
01
Hyd
roxi
de-d
oped
0.0
1
Car
bona
te-d
oped
0.0
1
Figure 3.6.4. SEM images of doped-CPP at 0.01 Na2O/CaO sintered at 580ºC.
Images of sintered, crystalline CPP are shown for comparison with sintered, crystalline (720ºC) doped-CPP. Discs surfaces (left) and fracture surfaces (right) are presented for material surface and fracture morphology, and for porosity observations.
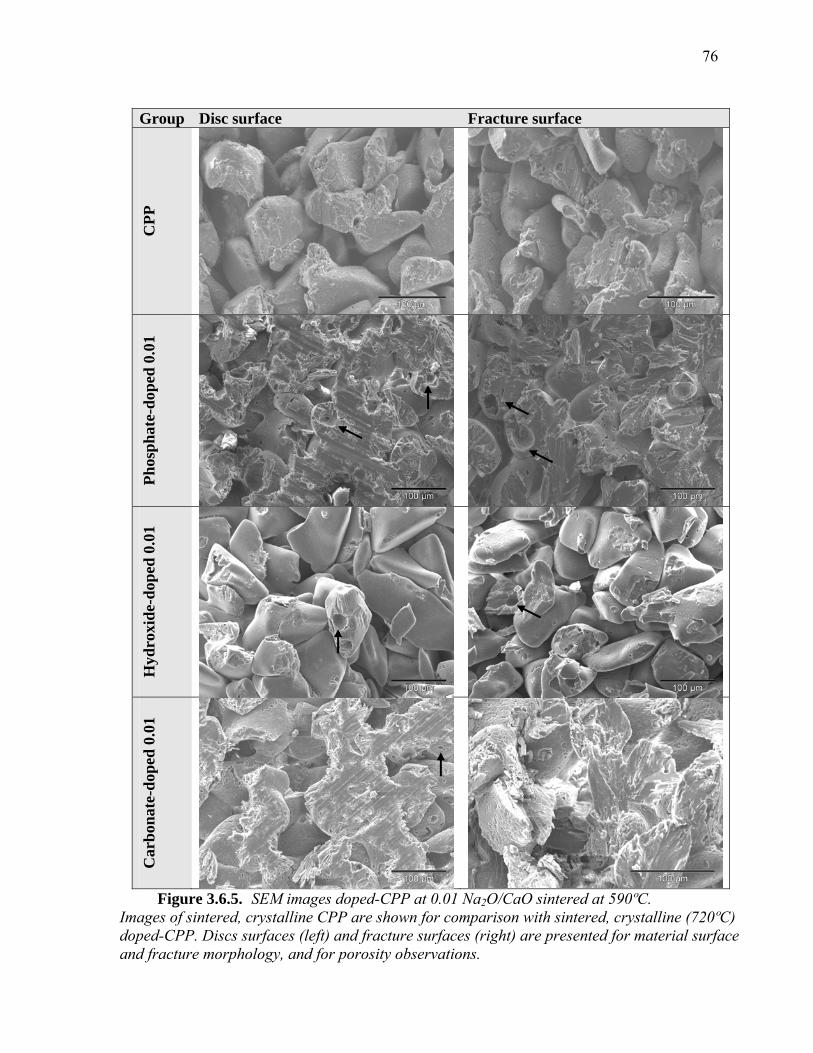
76
Group Disc surface Fracture surface
CPP
Ph
osph
ate-
dope
d 0.
01
Hyd
roxi
de-d
oped
0.0
1
Car
bona
te-d
oped
0.0
1
Figure 3.6.5. SEM images doped-CPP at 0.01 Na2O/CaO sintered at 590ºC.
Images of sintered, crystalline CPP are shown for comparison with sintered, crystalline (720ºC) doped-CPP. Discs surfaces (left) and fracture surfaces (right) are presented for material surface and fracture morphology, and for porosity observations.

77
3.6.4. XRD of Sintered, Crystalline Doped-CPP
Diffraction patterns of CPP doped at 0.01 Na2O/CaO match exactly with those of pure
CPP, regardless of the dopant source (Figure 3.6.6-8). The pattern of Phosphate-doped 0.01
sintered/crystallized at 590ºC/720ºC showed a small peak at 16º 2θ, which is attributed to the
quartz sample holder. Comparison with diffraction patterns of samples sintered at 580ºC (Figure
3.4.4) showed that crystallization had begun these two sintering temperatures.
arbi
trar
y un
it
Figure 3.6.6. X-ray diffraction patterns of Phosphate-doped 0.01. Patterns from sintered (590ºC, red), and sintered-and-crystalline (590ºC/720ºC, green) specimen compared with that of pure CPP (blue).
590ºC/720ºC 590ºC pure CPP (blue)

78
arbi
trar
y un
it
Figure 3.6.7. X-ray diffraction patterns of Hydroxide-doped 0.01. Patterns from sintered (590ºC, red), and sintered-and- crystalline (590ºC/720ºC, green) specimens compared with that of pure CPP (blue).
arbi
trar
y un
it
Figure 3.6.8. X-ray diffraction patterns of Carbonate-doped 0.01. Patterns from sintered (590ºC, red), and sintered-and- crystalline (590ºC/720ºC, green) specimens compared with that of pure CPP (blue).
590ºC/720ºC 590ºC pure CPP (blue)
590ºC/720ºC 590ºC pure CPP (blue)

79
3.6.5. Material density of Phosphate-doped 0.01 and Carbonate-doped 0.01
Phosphate-doped 0.01 and Carbonate-doped 0.01, both sintered/crystallized at 590º/720ºC,
were identified as the doped CPP groups that have comparable porosity to that of pure CPP
constructs, and higher diametral characteristic strength. To examine further earlier observations
of closed porosity (Figure 3.6.4-5), absolute density of these groups, and of pure CPP, were
determined as described in Section 2.8. Results are tabulated below:
Table 3.6.3. Absolute density of doped-CPP at 0.01 Na2O/CaO (glass and crystalline). Error shown is standard error of the mean.
Group CPP Phosphate-doped 0.01 Carbonate-doped 0.01 State glass crystalline glass crystalline glass crystalline
Density (g/cm3)
2.58 ± 0.03
2.90 ± 0.04
2.68 ± 0.02
3.02 ± 0.06
2.66 ± 0.03
2.88 ± 0.08
n 15 4 6 7 3 4
As expected crystallized pure and doped CPP had greater absolute density than their glassy
counterparts. There were no significant differences in density among the crystallized groups.
Using these values as well as pooled specific gravity and bulk density data from the previous
sections (Section 2.9), an estimate of the closed porosity was made of the sintered, crystalline
constructs (Table 3.6.4).
Table 3.6.4. Closed porosity of pure CPP and doped CPP at 0.01 Na2O/CaO. Error represents standard error of the mean. Number of samples refers to the number of data points collected from physical characterization of these groups.
Group CPP Phosphate-doped 0.01
Carbonate-doped 0.01
Sintering temperatures (ºC) 585ºC/950ºC 590ºC/720ºC 590ºC/720ºC
n 21 14 39 % closed porosity 5.94% ±0.28% 7.40% ±0.43% 4.35% ±0.19%
These closed porosity estimates, calculated on a volume-basis, confirm observations from the
SEM images, which exposed some of these closed pores (Figure 3.6.5). The values also suggest
that of the three groups, Phosphate-doped 0.01 had the highest closed porosity.

80
3.7. Degradation of doped-CPP at 0.01 Na2O/CaO
3.7.1. Physical characterization of specimens before degradation
Phosphate-doped 0.01 and Carbonate-doped 0.01 specimens, sintered and crystallized at
590ºC and 720ºC, were selected for comparable open porosity (approximately 36% vol. basis) to
that of pure CPP constructs used as tissue-engineered cartilage substrates. The table below
summarizes the as-made specifications of the specimens used for the degradation study.
Specimens are grouped by their assigned degradation time points, and are denoted “wet” to
emphasize mechanical testing before drying the specimens (Section 2.12). Characterization
results from the previous section have been included as reference (listed as “reference”, under
“Time point”).
Table 3.7.1. Physical characterization of pure CPP for degradation.
Group CPP n 21 15 17 14
Bulk density ± S.E.
(g/cm3)
1.70 ±0.02
1.66 ±0.01
1.64 ±0.01
1.66 ±0.02
% open porosity ±
S.E.
34.50% ± 0.80%
37.70% ±0.50%
38.00% ±0.50%
37.66% ±0.55%
Time point reference Day 0, wet Day 5, wet Day 15, wet
Table 3.7.2. Physical characterization of Carbonate-doped 0.01 for degradation.
Group Carbonate-doped 0.01 590
n 39 13 16 15 Bulk density
± S.E. (g/cm3)
1.69 ±0.01
1.64 ±0.02
1.72 ±0.02
1.72 ±0.02
% open porosity ±
S.E.
36.90% ±0.50%
39.20% ±0.70%
36.00% ±0.80%
36.0% ±0.72%
Time point reference Day 0, wet Day 5, wet Day 15, wet

81
Table 3.7.3. Physical characterization of Phosphate-doped 0.01 for degradation. Group Phosphate-doped 0.01 590
n 13 14 13 14 Bulk density
± S.E. (g/cm3)
1.77 ± 0.02
1.71 ± 0.02
1.73 ±0.01
1.65 ±0.03
% open porosity ±
S.E.
33.20% ±1.00%
36.20% ±0.90%
35.00% ±0.70%
37.65% ±0.94%
Time point reference Day 0, wet Day 5, wet Day 15, wet
3.7.2. Changes in chemical and mechanical properties of Doped-CPP
Specimens removed from degradation were tested while wet by diametral compression and
Weibull parameters are tabulated (Table 3.7.4) and graphically represented (Figure 3.7.1).
Calcium dissolved into the solution were analyzed and normalized by the total calcium content in
the constructs, and are thus termed “% Ca released.”
Table 3.7.4. Degradation and mechanical property changes of Doped CPP. Error represents standard error of the mean.
Group CPP Phosphate-doped 0.01 Carbonate-doped 0.01
Time point Day 0, wet
Day 5, wet
Day 15, wet
Day 0, wet
Day 5, wet
Day 15, wet
Day 0, wet
Day 5, wet
Day 15, wet
n 15 17 14 14 14 14 15 16 15
% Ca released
0.13% ±0.01%
0.69% ± 0.09%
0.98% ± 0.07%
0.10% ±0.003%
0.16% ±0.01%
0.28%±0.01%
0.08% ±0.01%
0.24%±0.03%
0.33%±0.01%
Characteristic strength, σc
(MPa)
7.16 ± 0.8
4.74 ± 0.5
5.40 ± 0.6
12.7 ± 1.7
10.75 ± 1.2
5.62 ± 0.73
14 ± 1.6
12.9 ± 1.5
12.16 ± 1.4
Weibull modulus 5.27 5.42 3.96 5.55 5.93 1.81 4.89 5.47 6.88
R2 0.9701 0.9090 0.7779 0.9787 0.9237 0.7588 0.8995 0.9658 0.9814

82
Degradation of pure and doped CPP
0
24
6
810
12
1416
18
Day 0 Day 5 Day 15
Cha
ract
eris
tic s
tren
gth
(MP
a)
0.0%
0.2%
0.4%
0.6%
0.8%
1.0%
1.2%
% C
a re
leas
ed
CPP, strength Phosphate, strength Carbonate, strengthCPP, %Ca Phosphate, % Ca Carbonate, % Ca
Figure 3.7.1. Chemical and mechanical degradation of doped and pure CPP.
Bars represent diametral characteristic strength, points represent % calcium released into solution. Values are numerically represented in Table 3.7.4.
The data showed that of the three groups, pure CPP degraded the fastest chemically, while in
terms of diametral characteristic strength, Phosphate-doped 0.01 decreased the most over the
course of degradation. Carbonate-doped 0.01 specimens degraded slowly both chemically and in
terms of strength loss. It is interesting to note that although mechanically frail, Phosphate-doped
0.01 did not chemically degrade faster than that of Carbonate-doped 0.01.
3.7.3. SEM images of Doped-CPP degradation
Images for both disc and fracture surfaces are shown below, for pure CPP (Figure 3.7.2),
Phosphate-doped 0.01 (Table 3.7.2), and Carbonate-doped 0.01 (Table 3.7.3). Micrographs of as-
made specimens (no degradation) are included for comparison.
SEM images of partially degraded specimens revealed that construct surface changes are
more prominent in both pure and doped CPP. Bristle-like features were observed on the surface
of Phosphate-doped 0.01 and Carbonate-doped 0.01 degrading discs (Figure 3.7.3-4, Days 5 and
15, disc surfaces, white arrows). These were not observed on fracture surfaces of these

83
specimens, suggesting that they occur as a result of direct contact with the solvent during
degradation. These were also generally found on the cross section of a sintered particle, which
was exposed during specimen cutting. However, despite the same preparation, these fibre-like
structures were not observed on pure CPP disc surfaces. Rather, CPP disc and fracture surfaces
show signs of laminar material separation (Figure 3.7.2, Day 15, disc surface, red arrows). As
expected, degradation up to 15 days did not influence the interior of crystalline particles, since
fracture surface images appeared little different from as-made images for these three groups.

84
Time point
Disc surface Fracture surface
--- (
as m
ade)
Day
0
Day
5
Day
15
Figure 3.7.2. SEM images of degraded pure CPP.
Discs surfaces (left) and fracture surfaces (right) are presented for material surface and fracture morphology. Degradation length is shown on the left-most column.

85
Time point
Disc surface Fracture surface
--- (
as m
ade)
D
ay 0
D
ay 5
D
ay 1
5
Figure 3.7.3. SEM images of degraded Phosphate-doped 0.01. Discs surfaces (left) and fracture surfaces (right) are presented for material surface and fracture morphology. Degradation length is shown on the left-most column.

86
Time point
Disc surface Fracture surface
--- (
as m
ade)
D
ay 0
D
ay 5
D
ay 1
5
Figure 3.7.4. SEM images of degraded Carbonate-doped 0.01.
Discs surfaces (left) and fracture surfaces (right) are presented for material surface and fracture morphology. Degradation length is shown on the left-most column.

87
4. Discussion
4.1. Effect of doping on crystalline phase composition of sodium-doped CPP
4.1.1. Experimental results
Doping concentrations from 0.5 to 0.001 Na2O/CaO were considered in this study. With the
aim of obtaining a single crystalline phase, thermograms of CPP doped with sodium phosphate,
sodium hydroxide, and sodium carbonate (labelled Phosphate-doped, Hydroxide-doped and
Carbonate-doped, respectively) were compared to that of pure CPP. Although it was expected
that glass transition endotherms would be weaker in these thermograms than those reported by
Ropp[94], it was surprising to find that well-defined melting endotherms of Hydroxide-doped 0.5
and Carbonated-doped 0.5 could not be identified. Two melting peaks were observed for the
Phosphate-doped 0.5 thermogram, indicating that at this concentration more that one crystalline
phase had formed. Therefore, the 0.5 Na2O/CaO composition was not considered further. It is
interesting to note that the thermogram of Phosphate-doped 0.5 matched the glass fibre results
presented by Ahmed et al. [127], who had a similar chemical composition (50 mol% P2O5, 35
mol% CaO, 15 mol% Na2O), but a different DTA heating rate (20ºC/min instead of 10ºC/min
used here). At this concentration, Ahmed et al.[113] reported that the main peaks in the XRD
patterns corresponded to NaCa(PO3)3 (PDF# 23-0669).
The lower limit of sodium doping was established by the sodium content in the calcium
phosphate precursor, Ca(H2PO4)2•H2O. The material contained the equivalent of 0.0002
Na2O/CaO (see Section 2.1), but after processing, the sodium content of the resulting CPP glass
increased to 0.0065 ± 0.0001 Na2O/CaO, as measured by ICP-AES (Table 3.3.1). This
effectively became the lower limit for the doping study, and specimens doped at 0.005 and 0.001

88
Na2O/CaO were discarded. This result was surprising, as it is unclear how sodium could have
been introduced during synthesis. However, it would account for the observation (Table 3.3.2)
that in general among the doped groups there was slightly higher sodium content than expected.
Furthermore, a similar observation was noted by Illingworth, who aimed to incorporate trace
amounts of sodium into CPP, with the target concentration of 0.01 wt% Na, the equivalent of
8.72x10⁻⁵ mol Na2O/CaO. Analysis of the resulting doped CPP glass showed that the dopant
concentration was 7.06x10⁻⁴ Na2O/CaO)[141].
For the rest of the study, only 0.01 Na2O/CaO, 0.05 Na2O/CaO, and 0.1 Na2O/CaO were
examined. XRD patterns of crystallized sodium-doped CPP at 0.01 Na2O/CaO, regardless of the
dopant, matched that of pure CPP. Although doped CPP at 0.05 Na2O/CaO were not crystallized
and assessed, DTA thermograms of these specimens were very similar to those of sodium-doped
at 0.1 Na2O/CaO, containing features such as asymmetrical crystallization peaks, multiple
melting peaks, and shoulders on these melting peaks. Since XRD of crystallized sodium-doped
CPP at 0.1 Na2O/CaO showed a number of peaks in addition to those of pure CPP, it was
concluded that the thermograms of the 0.1 and 0.05 Na2O/CaO specimens indicated the presence
of more than one crystalline phase. Thus, the solubility limit of sodium into CPP is between 0.05
Na2O/CaO and 0.01 Na2O/CaO.
4.1.2. Na2O•P2O5 – CaO•P2O5 phase diagrams
As mentioned, there are two main phase diagrams pertaining to the system Na2O•P2O5 -
CaO•P2O5, that of Morey and van Wazer [93, 130], and that of Griffith[131] (Figure 1.3.3 and
Figure 1.3.4). It appears that neither the Morey-van Wazer diagram nor the Griffith diagram
included data of sodium concentrations below approximately 10 wt% NaPO3, thus the solubility
limit of sodium in calcium polyphosphate is not indicated in these diagrams. The differences
between these two diagrams are in phase labelling and Griffith's identification of NaCa(PO3)3, at

89
70% [Ca(PO3)2]n, which undergoes a peritectic reaction at 770ºC. As a result, two new phase
fields appear. Between 70% and 100% [Ca(PO3)2]n, the field consists of a mixture of Ca(PO3)2
and NaCa(PO3)3, while Na4Ca(PO3)6 (erroneously labelled NaPO3 in the diagram) and
NaCa(PO3)3 are found between 30% and 70% [Ca(PO3)2]n. Van Wazer presented this region (the
equivalent of 30 to 100 mol% Ca(PO3)2) as one field containing a mixture of Ca(PO3)2 and
Na4Ca(PO3)6, with a eutectic isotherm at 725ºC.
X-ray diffraction patterns of sintered, and/or crystallized sodium-doped CPP specimens at
0.1 Na2O/CaO showed a number of peaks other than those that belonging to pure CPP. The
attempt to identify the phase responsible for these residual peaks showed that the most frequent
match of the remaining peaks was with NaCa(PO3)3 (PDF-2, #23-0669). Occasionally these
residual peaks matched Na4Ca(PO3)6 (#25-0811). The phase NaCa(PO3)3 appeared only in
Griffith’s phase diagram of the Na2O•P2O5 - CaO•P2O5 system, therefore it would appear that
Griffith’s phase diagram is correct. This phase diagram is further supported by the DTA results.
In thermographs showing more than one melting peak, the low temperature peak occurred at
~750C, close to the peritectic temperature of ~775C as indicated on Griffith's diagram. The
melting peak occurred at ~970C in thermographs containing only one melting peak (sodium-
doped CPP at 0.01 Na2O/CaO), slightly below the reported melting temperature of pure CPP.

90
4.2. Effects of sodium doping on CPP sintering, strength and degradation
4.2.1. Effects of doping on amorphous CPP
Incorporating sodium phosphate, sodium hydroxide, or sodium carbonate into calcium
polyphosphate glass using the present synthesis method resulted in an amorphous product, as
shown by XRD of the doped groups Figure 3.2.1. The groups also have different crystallization
and melting temperatures, as summarized in Table 3.1.1. Crystallization temperatures decreased
as sodium concentration increased, regardless of the dopant source. Melting temperatures, or in
some cases, the first of several melting peaks, also decreased as sodium content increased.
Similar observations in glass transition temperatures were noted by Ahmed et al. [113, 127].
The presence of sodium is believed to influence the chain length and/or crystalline structure
of calcium polyphosphate. Sodium oxide is known as a network modifier in the silicate glass
system [94, 133], and it is thought to serve a similar purpose in the network forming phosphate
glass system. Two monovalent sodium cations would replace one calcium cation in forming two
ionic bonds with non-bridging oxygen in polyphosphate chains (Figure 4.2.1). In the case of
adjacent polyphosphate chains, this new arrangement would increase the mobility of the
polyphosphates species, which may improve sintering (Figure 4.2.1, middle). Upon
crystallization, there are a number of positions in which sodium might reside. It is possible that
either one or two sodium ions would reside at a calcium site, thus creating lattice strain due to
the ionic size mismatch. In the case of one-to-one atomic substitution, electronic defects would
also occur. It is also possible for sodium to reside interstitially.

91
OP
OO
O
OP
OO
POO
O
PO
OO
OPOO
O
P OO
O
OP
OO
POO
O
OP
O
O
P OO
O
OPO O
OPO
OO
POO
O
Ca
CaCa
Ca
Ca
Ca
CaCa
Ca
OP
OO
O
OP
OO
POO
O
PO
OO
OPOO
O
P OO
O
PO
OO
Ca
CaCa
Ca
Ca
Ca
Na
Na
POO
O
OP
O
O
P OO
O
OPO O
ONa
Na
OPOO
OP
OO
O
Ca
NaNa
Figure 4.2.1. Schematic of possible sodium interaction with calcium polyphosphate. An increased proportion of sodium is used to illustrate three possible locations of sodium. As a chain modifier (dotted oval, top), longer polyphosphate chains are broken by Na2O. By substituting a calcium ion that is bound to oxygen of two distinct chain (dotted oval, middle), the resulting chains are further separated from one another. It is also possible for substitution to occur upon a calcium ion that is bound to oxygen atoms of the same chain (dotted oval, bottom). Other non-bridging oxygen atoms are assumed to be bound to hydrogen ions.
4.2.2. Effects of doping on CPP sintering
Sodium-doped CPP at either 0.1 or 0.01 Na2O/CaO crystallized at lower temperatures than
the crystallization temperatures identified by DTA results. XRD patterns of Phosphate-doped 0.1
and Carbonate-doped 0.1 showed that these groups crystallized by 560ºC, despite crystallization
temperatures of 598ºC and 611ºC, respectively. Hydroxide-doped 0.1 crystallized when sintered
at 540ºC, although its crystallization peak on the DTA occurred at 601ºC. Phosphate-doped 0.01,
Hydroxide-doped 0.01, and Carbonate-doped 0.01 showed signs of crystallization at 590ºC,
although their crystallization peaks occurred at 648ºC, 642C, and 647ºC, respectively. Early
crystallization could be attributed to differences in heating atmosphere, since the DTA was
conducted in an inert atmosphere, while sintering occurred in air with controlled humidity (inlet
35% RH at 23ºC). The presence of moisture and oxygen appears to have an effect on CPP

92
sintering [111]. Heating rate and particle size also influence the observed crystallization
temperatures.
CPP substrates doped with different anions had different open porosity when sintered
under the same conditions. At 0.1 Na2O/CaO, Carbonate-doped 0.1 was more sensitive to
sintering temperature than Phosphate-doped 0.1. Open porosity of crystallized Carbonate-doped
0.1 decreased from 34.3% ± 1.1% to 13.2% ± 0.6% when sintering temperature increased from
540ºC to 550ºC, but did not change significantly beyond that temperature. On the other hand,
open porosity decreased more gradually in crystallized Phosphate-doped 0.1, resulting in
approximately 10% loss for every ten degree increase in sintering temperature, from 550ºC to
570ºC. At the lower concentration, Carbonate-doped 0.01 was also more sensitive to sintering
temperature than Phosphate-doped 0.01. However, as the aim was to identify the conditions to
sinter and crystallize doped CPP into open porosity close to that of pure CPP, other sintering
temperatures for these groups were not investigated.
SEM images reflected the low porosity of CPP doped at 0.1 Na2O/CaO, clearly showing
the collapse of porous architecture (Figure 3.5.5 and Figure 3.5.6). Micrographs of 0.01
Na2O/CaO at either sinter temperature (580ºC (Figure 3.6.4), or 590ºC (Figure 3.6.5)) showed an
open pore structure, comparable to that of pure CPP. An interesting feature common to both
dopant concentrations is the appearance of internal porosity, as marked by arrows. Although
sintered CPP also contains some internal voids (Figure 3.6.4-5, CPP fracture surface), as noted
by Omelon and estimated to be about three percent [89], those found in sodium-doped CPP were
larger, some of which were exposed to the surface (Hydroxide-doped 0.01, sintered at 580ºC,
Figure 3.6.4), while others have developed into an internal, porous network (Phosphate-doped
0.1, sintered at 560ºC, crystallized at 718ºC, Figure 3.5.6). If sodium doping into polyphosphate

93
did allow greater mobility of phosphate chains, this could have contributed to more rapid growth
of the pores within the particles.
4.2.3. Effects of doping on CPP mechanical strength
Diametral strengths of Phosphate-doped and Carbonate-doped CPP showed marked
improvement compared to pure CPP of similar open porosity. The characteristic strengths of
Phosphate-doped 0.1 and 0.01 were similar for comparable open porosity (Table 3.5.3 and Table
3.6.2). When sintered at 550ºC and crystallized, Phosphate-doped 0.1 had open porosity of
34.0±1.5% and characteristic strength of 13 MPa, while Phosphate-doped 0.01 achieved
33.1±2.5% open porosity and a characteristic strength of 16 MPa, when sintered at 590ºC and
crystallized. Due to the small sample sizes in these two groups, which resulted in an uncertainty
of approximately 10% (90% confidence intervals) in the characteristic strength, there were no
statistical differences in the two strength values. It is clear though, that both groups had higher
strength values than undoped CPP, whose diametral strength was 7.5 ±0.75 MPa with an open
porosity of 34.5± 0.8%. Carbonate-CPP also seemed stronger than pure CPP. Carbonate-doped
0.1 and 0.01 had strengths of 9 MPa and 18 MPa, at open porosities of 34.5± 1.1% and 36.5±
0.6% respectively. The increase in strength at lower doping concentration suggests a dependence
upon concentration, which was not noticeable in Phosphate-doped CPP. This also suggests that
dopant source has an influence upon the sintering and mechanical strength of the sintered,
crystallized substrates.
These differences are unique in that compared to pure CPP, doped CPP substrates had
increased in strength without further densification. While strength increases could be explained
by differences in the size of sinter necks, when combined with similarity in open porosity, the
results suggest differences in the macroscopic driving forces that occur during sintering, namely
the competition between densification and coarsening. Densification results in a reduction in
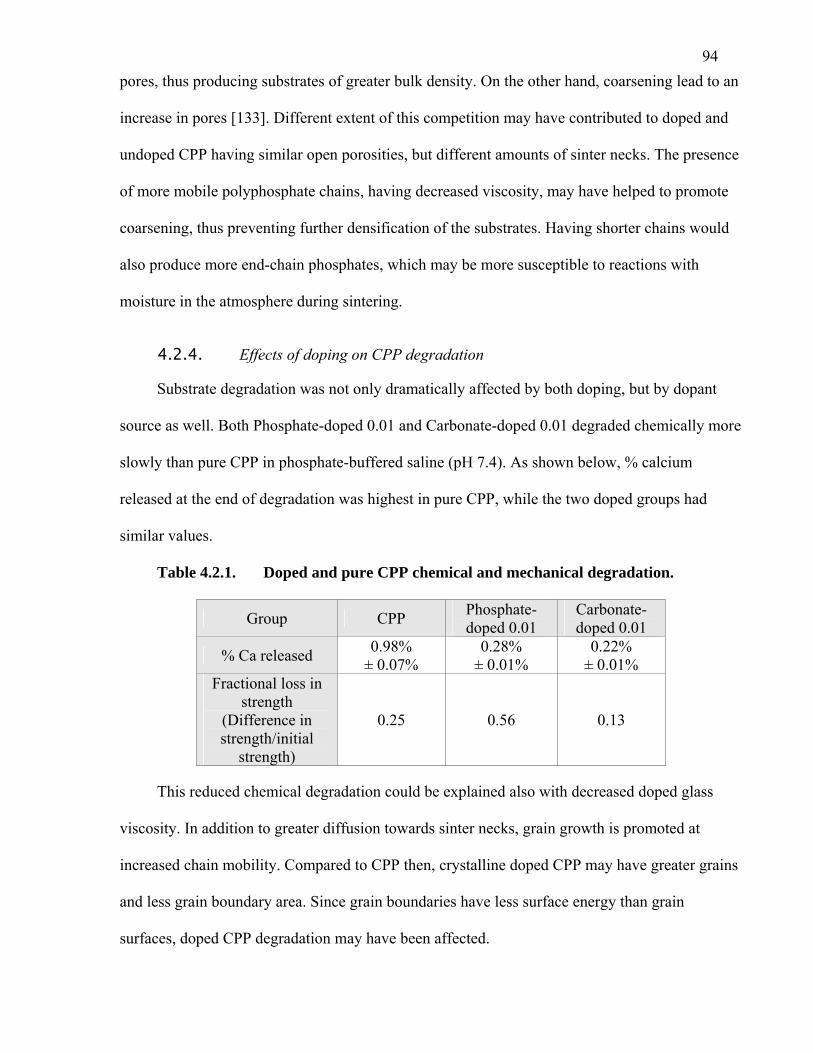
94
pores, thus producing substrates of greater bulk density. On the other hand, coarsening lead to an
increase in pores [133]. Different extent of this competition may have contributed to doped and
undoped CPP having similar open porosities, but different amounts of sinter necks. The presence
of more mobile polyphosphate chains, having decreased viscosity, may have helped to promote
coarsening, thus preventing further densification of the substrates. Having shorter chains would
also produce more end-chain phosphates, which may be more susceptible to reactions with
moisture in the atmosphere during sintering.
4.2.4. Effects of doping on CPP degradation
Substrate degradation was not only dramatically affected by both doping, but by dopant
source as well. Both Phosphate-doped 0.01 and Carbonate-doped 0.01 degraded chemically more
slowly than pure CPP in phosphate-buffered saline (pH 7.4). As shown below, % calcium
released at the end of degradation was highest in pure CPP, while the two doped groups had
similar values.
Table 4.2.1. Doped and pure CPP chemical and mechanical degradation.
Group CPP Phosphate-doped 0.01
Carbonate-doped 0.01
% Ca released 0.98% ± 0.07%
0.28% ± 0.01%
0.22% ± 0.01%
Fractional loss in strength
(Difference in strength/initial
strength)
0.25 0.56 0.13
This reduced chemical degradation could be explained also with decreased doped glass
viscosity. In addition to greater diffusion towards sinter necks, grain growth is promoted at
increased chain mobility. Compared to CPP then, crystalline doped CPP may have greater grains
and less grain boundary area. Since grain boundaries have less surface energy than grain
surfaces, doped CPP degradation may have been affected.

95
The fractional loss in strength is determined by dividing the difference between initial and
final (after degradation) characteristic strengths by the initial strength. The fractional strength
loss is highest for Phosphate-doped 0.01, while that of Carbonate-doped 0.01 is less than that of
pure CPP. Dopant sources then, seemed to contribute to the mechanical strength differences of
CPP substrates.

96
4.3. Dopant anion effects on CPP
4.3.1. Choice of dopants
The previous sections outlined the observed dopant anion effects for CPP doped at 0.01
Na2O/CaO. In this study, sodium phosphate was chosen as it maintains the same cation oxide to
diphosphorus pentoxide ratio as the calcium phosphate precursor. Sodium carbonate was
introduced to the study as it was hypothesized that only sodium cations would be introduced into
calcium polyphosphate. This was due to the fact that the aqueous sodium carbonate solution
reacted with calcium phosphate monobasic monohydrate during slurry synthesis, and generated
effervescence, which was thought to be carbon dioxide, and so sodium remained in the slurry.
Sodium hydroxide was selected as the source which would introduce both sodium and hydroxyl
ions to CPP.
4.3.2. Hydroxide-doping effects on CPP
One of the most evident observations about dopant source effects is that Hydroxide-doped
0.01 crystallized during the sintering step (580ºC or 590ºC), but did not form sufficient sinter
necks, and open porosity of the substrates was not influenced by sintering temperatures. It
possessed low diametral strength, likely due to its lack of sinter necks, as observed by SEM
(Figure 3.6.4 and Figure 3.6.5). XRD patterns showed that these specimens crystallized at the
end of sintering. It seems possible that hydroxide contributed to these effects, since they were not
observed in doped-CPP groups using other sources.
As network modifiers, both sodium oxide and the hydroxide ions may have broken
polyphosphate chains, or prevented its formation. An increase of hydroxide ions will shift the
condensation/hydrolysis equilibrium towards the left (below):
- [P-O-P-]n-OH + HO-[P-O-P-]m- ↔ -[P-O-P-]n-O-[P-O-P-]m- + H2O(g) [ 1]

97
This may also shift the resulting chain length distribution towards shorter chains overall, which
may increase polyphosphate glass mobility and thus sintering, but at the same time, shorter
chains may have greater short-range order, and so it may crystallize more readily than longer
chains. In the competition between densification and crystallization, it appeared that
crystallization was favored, rather than densification and the formation of sinter necks.
4.3.3. Phosphate-and Carbonate-doping effects on CPP
Phosphate-doped CPP showed some improvements in as-made mechanical strength
compared to mechanical strength of undoped CPP of the same % open porosity. Comparing the
chemical composition of the Phosphate-doped 0.01 and pure CPP (Table 3.3.2), one finds that
the two to have similar phosphate content. This suggests that the differences observed, namely:
lower sintering temperature required to sinter substrates of comparable porosity as pure CPP,
increased as-made diametral strength, greater strength loss during in vitro degradation, decreased
chemical degradation in vitro, can be attributed to the effect of the sodium cation. Comparison of
the micrographs showed that the laminar structure of crystalline Phosphate-doped CPP, as shown
on fracture surface images, seemed more ordered than CPP (Figure 3.6.4 and Figure 3.6.5).
The behaviour of Carbonate-doped CPP is interesting. It was assumed that this dopant would
only contribute sodium into calcium polyphosphate, but sintered, crystalline Carbonate-doped
CPP has higher characteristic strength than Phosphate-doped CPP, for which sodium was also
proposed as main influence. Carbonate-doped CPP was also found to be more sensitive to
sintering temperature than Phosphate-doped CPP. These observations then, suggest that there is a
hidden anion effect from this dopant source. Although it was assumed that CO2 bubbles
generated from the reaction between sodium carbonate and acidic, slightly soluble
Ca(H2PO4)2•H2O during slurry mixing subsequently escaped into the atmosphere, the exact
carbonate content in the doped CPP was not determined analytically. Therefore, it is possible that

98
upon drying of the slurry, trace amounts of planar carbonate, or carbon dioxide, was left behind
and incorporated into the glassy tetrahedral phosphate network.
This hypothesis may help to describe the marked differences in fractional strength loss after
degradation between Phosphate-doped and Carbonate-doped CPP (Table 4.2.1). Assuming that
Phosphate-doped CPP was only modified by sodium doping, then Carbonate-doped CPP might
be affected by doping of sodium and a carbon compound. As it is unclear which carbon
compound might be incorporated, a number of possibilities exist. Being tetravalent ion with
smaller ionic radius than calcium, it may be possible for one carbon ion to directly replace one
calcium ion, but charge balance must be satisfied either by the displacement of another calcium
ion, or the reconfiguration of the polyphosphate tetrahedra. Both may translate into defects in the
material upon crystallization. An additional possibility is that the carbon compound may be
present as an impurity in the polyphosphate grains [142], with no chemical interaction to the
polyphosphate chains structure.

99
5. Summary and Conclusions
This project investigated the doping of calcium polyphosphate (CPP) with low
concentrations of sodium to avoid the formation of more than one phase in the crystalline
material. This helps to maintain the favourable properties that make CPP part of the biphasic
tissue-engineered cartilage/substrate strategy [52, 84, 86, 87]. In addition to CPP's bioactivity,
these constructs are osteoconductive [67] and have an open, interconnected pore structure for
bone integration. They also possess sufficient mechanical strength to sustain loading conditions
at defect sites[52, 84]. Doped CPP constructs must also possess these favourable properties. As
noted in previous work, the degradation rate of pure CPP is lower than desired [88, 89] for the
observed mechanical strength loss. It would be desirable for doped CPP to have a faster chemical
degradation, without increasing its mechanical strength loss.
The conclusions drawn from the results of this study are as follows:
• The solubility limit of sodium in calcium polyphosphate (M2O/P2O5 = 1) is between
0.01 and 0.05 Na2O/CaO.
• XRD of crystallized sodium-doped CPP at 0.1 Na2O/CaO contains peaks that match
those of pure CPP, as well as other peaks that match NaCa(PO3)3 (PDF #23-0669).
This shows that Griffith’s phase diagram of Na2O•P2O5 – CaO•P2O5 is correct.
• Doping CPP with sodium at 0.01 Na2O/CaO, using any of Na2HPO4, NaOH, or
Na2CO3 yields a crystalline material whose XRD patterns that match that of pure
CPP.
• Sodium hydroxide-doped CPP at 0.01 Na2O/CaO did not sinter.
100
• When compared to pure CPP of similar open porosity, Phosphate-doped CPP at 0.01
Na2O/CaO has similar diametral strength, while Carbonate-doped CPP at 0.01
Na2O/CaO has greater diametral strength. Hydroxide-doped CPP at 0.01 has very low
strength.
• Both Phosphate-doped CPP at 0.01 Na2O/CaO and Carbonate-doped CPP at 0.01
Na2O/CaO released less calcium during in vitro degradation than pure CPP, and thus
degraded more slowly. Therefore, the more rapid degradation reported in studies in
which sodium was added to calcium polyphosphate should be attributed to the
presence of second phases.
• Carbonate-doped CPP at 0.01 Na2O/CaO experienced less strength loss from in vitro
degradation than pure CPP, while Phosphate-doped CPP at 0.01 Na2O/CaO lost more
of its strength than pure CPP.
• The dopant anion was found to have a significant effect on sintering, strength and
degradation of CPP substrates.

101
6. Recommendations
This study focused upon single-phased doped CPP using sodium compounds as dopants.
Recommendations based on these results and the available literature, are as follows:
• Explore CPP doping using other salts, to determine the effects of doping with cations of
similar and/or different sizes and charge, compared to calcium. It would be important
towards the tailoring of CPP substrates for tissue-engineered cartilage, if one can
determine whether charge or size differences have a greater impact on doped-CPP. Anion
selection must also be considered as they may also affect doped-CPP properties. Dopant
selection should also consider compounds that may have an added biological/tissue-
engineering benefit.
• Clarify the Na2O•P2O5 – CaO•P2O5 phase diagram by identifying equilibrium species at
low concentrations of Na2O•P2O5, and compiling the existing diagrams.
• Determine how the β-CPP structure was affected by sodium-doping, to clarifying the
dopant effect on crystalline structure.
• Explore sintering conditions to determine whether it is possible to produce an open-pore
structure with internal porosity and sufficient mechanical strength to serve as substrate
for osteochondral tissue-engineered cartilage. The resulting shell-like structure will
increase total available pore volume for gradual bone in-growth, and the same volume
will contain less material for bioresorption.

102
7. References1. Samuels, J., S. Krasnokutsky, and S.B. Abramson, Osteoarthritis: a Tale of Three
Tissues. Bulletin of the NYU hospital for Joint Diseases, 2008. 66(3): p. 244-250. 2. Knutson, K., Arthroplasty and its complications, in Osteoarthritis, K.D. Brandt, M.
Doherty, and L.S. Lohmander, Editors. 2003, Oxford University Press: New York. p. 361-370.
3. Huber, M., S. Trattnig, and F. Lintner, Anatomy, Biochemistry, and Physiology of Articular Cartilage. Investigative Radiology, 2000. 35: p. 573-580.
4. Goldring, M.B., Update on the biology of the chondrocyte and new approaches to treating cartilage diseases. Best Practice & Research Clinical Rheumatology, 2006. 20(5): p. 1003-1025.
5. Smith, G.D., G. Knutsen, and J.B. Richardson, A clinical review of cartilage repair techniques. The Journal of Bone & Joint Surgery, 2005. 87-b(4): p. 445-449.
6. Shah, M.R., et al., Articular Cartilage Restoration of the Knee. Bulletin of the NYU hospital for Joint Diseases, 2007. 65(1): p. 51-60.
7. Zhang, W., et al., OARSI recommendations for the management of hip and knee osteoarthritis, Part I: Critical appraisal of existing treatment guidelines and systematic review of current research evidence. Osteoarthritis and Cartilage, 2007. 15: p. 981-1000.
8. Zhang, W., et al., OARSI recommendations for the management of hip and knee osteoarthritis, Part II: OARSI evidence-based, expert consensus guidelines. Osteoarthritis and Cartilage, 2008. 6: p. 137-162.
9. Kirkley, A., et al., A randomized trial of arthroscopic surgery for osteoarthritis of the knee. The New England Journal of Medicine, 2008. 359(11): p. 1097-1107.
10. Moseley, J., J. Bruce, et al., A controlled trial of arthroscopic surgery for osteoarthritis of the knee. The New England Journal of Medicine, 2002. 347(2): p. 81-88.
11. Hróbjartsson, A. and P.C. Gøtzsche, Is the Placebo Powerless? The New England Journal of Medicine, 2001. 344(21): p. 1594-1602.
12. Steadman, J.R., et al., Outcomes of Microfracture for Traumatic Chondral Defects of the Knee: Average 11-Year Follow-up. Arthroscopy: The Journal of Arthroscopic and Related Surgery, 2003. 19(5): p. 477-484.
13. Steadman, J.R., W.G. Rodkey, and K.K. Briggs, Microfracture Chondroplasty: Indications, Techniques, and Outcomes. Sports Medicine and Arthroscopy Review, 2003. 11(4): p. 236-244.
14. Gill, T.J., The role of the microfracture technique in the treatment of full-thickness chondral injuries. Operative Techniques in Sports Medicine, 2000. 8(2): p. 138-140.
15. Davis, J.T. and D.G. Jones, Treatment of knee articular cartilage injuries. Current Opinion in Orthopaedics, 2004. 15(2): p. 92-99.
16. Katz, J.N., Total joint replacement in osteoarthritis. Best Practice & Research Clinical Rheumatology, 2006. 20(1): p. 145-153.
17. Salama, A. and A.J. Hamer, Degenerative and rheumatoid arthritis (including joint replacement). Surgery, 2007. 25(4): p. 160-165.
18. Blunt, L., et al., The role of tribology and metrology in the latest development of biomaterials. Wear, 2009. 266: p. 424-431.
19. Vallet-Regí, M. and J.M. González-Calbet, Calcium phosphates as substitution of bone tissues. Progress in Solid State Chemistry, 2004. 32: p. 1-31.

103
20. Svehla, M., et al., Morphometric and mechanical evaluation of titanium implant
integration: comparison of five surface structures. Journal of Biomedical Materials Research, 2000. 51: p. 15-22.
21. Landgraeber, S., et al., Extrinsic and intrinsic pathways of apoptosis in aseptic loosening after total hip replacement. Biomaterials, 2008. 29: p. 3444-3450.
22. Engh, G.A., K.A. Dwyer, and C.K. Hanes, Polyethylene wear of metal-backed tibial components in total and unicompartmental knee prostheses. The Journal of Bone & Joint Surgery, 1992. 74-B(1): p. 9-17.
23. Ulrich, S.D., et al., Total hip arthroplasties: What are the reasons for revision? International Orthopaedics, 2008. 32: p. 597-604.
24. Krackow, K.a., Instability in Total Knee Arthroplasty - Loose as a Goose. The Journal of Arthroplasty, 2003. 18(3): p. 45-47.
25. Espinoza-Ervin, C., X. Zhang, and M.H. Huo, Hip Reconstruction: Can we afford revision total hip replacement? Current Orthopaedic Practice, 2009. 20(1): p. 29-33.
26. Browne, J.E., et al., Clinical Outcome of Autologous Chondrocyte Implantation at 5 Years in US Subjects. Clinical orthopaedics and related research, 2005. 436: p. 237-245.
27. Minas, T. and L. Peterson, Autologous chondrocyte transplantation. Operative Techniques in Sports Medicine, 2000. 8(2): p. 144-157.
28. Peterson, L., et al., Treatment of Osteochondritis Dissecans of the Knee with Autologous Chondrocyte Transplantation. The Journal of Bone & Joint Surgery, 2003. 85-A: p. 17-24.
29. Mithöfer, K., et al., Funcational Outcome of Knee Articular Cartilage Repair in Adolescent Athletes. The American Journal of Sports Medicine, 2005. 33: p. 1147-1153.
30. Peterson, L., et al., Autologus Chondrocyte Transplantation. The American Journal of Sports Medicine, 2002. 30: p. 2-12.
31. Horas, U., et al., Autologous Chondrocyte Implantation and Osteochondral Cylinder Transplantation in Cartilage Repair of the Knee Joint. The Journal of Bone & Joint Surgery, 2003. 85-A(2): p. 185-192.
32. Hangody, L. and P. Füles, Autologous Osteochondral Mosaicplasty for the Treatment of Full-Thickness Defects of Weight-Bearing Joints. The Journal of Bone & Joint Surgery, 2003. 85-A(supplement 2): p. 25-32.
33. Hangody, L., et al., Autologous Osteochondral Mosaicplasty: Surgical Technique. The Journal of Bone & Joint Surgery, 2004. 86-A(supplement 1): p. 65-72.
34. Bobić, V., Arthroscopic osteochondral autograft transplantation in anterior cruciate ligament reconstruction: a preliminary clinical study. Knee Surgery, Sports Traumatology, Arthroscopy, 1995. 3: p. 262-264.
35. Horas, U. and R. Schnettler, Chondral Defects of the Knee Treated by Transplantation of Autogenous Osteochondral Plugs. Orthopedics and Traumatology, 2002. 10(3): p. 220-234.
36. Feczkó, P., et al., Experimental Results of Donor Site Filling for Autologous Osteochondral Mosaicplasty. The Journal of Arthroscopic and Related Surgery, 2003. 19(7): p. 755-761.
37. Simonian, P.T., et al., Contact Pressures at Osteochondral Donor sites in the Knee. The American Journal of Sports Medicine, 1998. 26: p. 491-494.
38. Alford, J.W. and B.J. Cole, Cartilage Restoration, Part 2 Techniques, Outcomes, and Future Directions. The American Journal of Sports Medicine, 2005. 33: p. 443-460.
39. Ranawat, A.S., et al., Material Properties of Fresh Cold-stored Allografts for Osteochondral Defects at 1 Year. Clinical orthopaedics and related research, 2008. 466: p. 1826-1836.
104
40. Berthiaume, F. and M.L. Yarmush, Fundamentals of Tissue Engineering, in Tissue
Engineering, B. Palsson, et al., Editors. 2003, CRC Press Inc. p. 8-1. 41. Damien, C.J. and J.r. Parsons, Bone graft and bone graft substitutes: a review of current
technology and applications. Journal of Applied Biomaterials, 1991. 2(3): p. 187-208. 42. Schaefer, D., et al., Tissue-Engineered composites for the repair of large osteochondral
defects. Arthritis & Rheumatism, 2002. 46(9): p. 2524-2534. 43. Ciolfi, V.J.D., et al., Chondrocyte interactions with porous titanium alloy and calcium
polyphosphate substrates. Biomaterials, 2003. 24: p. 4761-4770. 44. Guo, X., et al., Repair of Osteochondral Defects with Autologous Chondrocytes Seeded
onto Bioceramic Scaffold in Sheep. Tissue Engineering, 2004. 10(11/12): p. 1830-1840. 45. Guo, X., et al., Repair of Large Articular Cartilage Defects with Implants of Autologous
Mesenchymal Stem Cells Seeded into β-Tricalcium Phosphate in a Sheep Model. Tissue Engineering, 2004. 10(11/12): p. 1818-1829.
46. Wang, X., et al., Tissue engineering of biphasic cartilage constructs using various biodegradable scaffolds: an in vitro study. Biomaterials, 2004. 25: p. 3681-3688.
47. Cancedda, R., P. Giannoni, and M. Mastrogiacomo, A tissue engineering approach to bone repair in large animal models and in clinical practice. Biomaterials, 2007. 28: p. 4240-4250.
48. Mano, J.F. and R.L. Reis, Osteochondral defects: present situation and tissue engineering approaches. Journal of Tissue Engineering and Regenerative Medicine, 2007. 1: p. 261-273.
49. Drosse, I., et al., Tissue engineering for bone defect healing: An update on a multi-component approach. International Journal of The Care of The Injured, 2008. 39S2: p. S9-S20.
50. O'Shea, T.M. and X. Miao, Bilayered Scaffolds for Osteochondral Tissue Engineering. TISSUE ENGINEERING: Part B, 2008. 14(4): p. 447-464.
51. Allan, K.S., et al., Formation of Biphasic Constructs Containing Cartilage with a Calcified Zone Interface. Tissue Engineering, 2007. 13(1): p. 167-177.
52. Kandel, R.A., et al., Repair of osteochondral defects with biphasic cartilage-calcium polyphosphate constructs in a Sheep model. Biomaterials, 2006. 27: p. 4120-4131.
53. Kuo, C.K., et al., Cartilage tissue engineering: its potential and uses. Current Opinion in Rheumatology, 2006. 18(1): p. 64-73.
54. Nesic, D., et al., Cartilage tissue engineering for degenerative joint disease. Advanced Drug Delivery Reviews, 2006. 58: p. 300-322.
55. Guo, J., et al., Repair of Osteochondral Defect with Tissue-Engineered Two-Phase Composite Material of Injectable Calcium Phosphate and Hyaluronan Sponge. Tissue Engineering, 2002. 8(2): p. 827-837.
56. Chevalier, J. and L. Gremillard, Ceramics for medical applications: A picture for the next 20 years. Journal of European Ceramic Society, 2009. 29: p. 1245-1255.
57. Yaylaoglu, M.B., et al., A novel osteochondral impant. Biomaterials, 1999. 20: p. 1513-1520.
58. Liao, C.-J., et al., Injecting partially digested cartilage fragments into a biphasic scaffold to generate osteochondral composites in a nude mice model. Journal of Biomedical Materials Research Part A, 2007. 81(3): p. 567-577.
59. Chen, G., et al., Preparation of a biphasic scaffold for osteochondral tissue engineering. Materials Science and Engineering C, 2006. 26: p. 118-123.
60. Shao, X.X., et al., Repair of Large Articular Osteochondral Defects Using Hybrid Scaffolds and Bone Marrow-Derived Mesenchymal Stem Cells in a Rabbit Model. Tissue Engineering, 2006. 12(6): p. 1539-1551.

105
61. Chen, G., T. Ushida, and T. Tateishi, Poly(DL-lactic-co-glycolic acid) sponge hybridized
with collagen microsponges and deposited apatite particulates. Journal of Biomedical Materials Research, 2001. 57: p. 8-14.
62. Karageorgiou, V. and D.L. Kaplan, Porosity of 3D biomaterial scaffolds and osteogenesis. Biomaterials, 2005. 26.
63. Li, J., et al., Biological performance in goats of a porous titanium alloy–biphasic calcium phosphate composite. Biomaterials, 2007. 28: p. 4209-4218.
64. Papageorgiou, I., et al., The effect of nano- and micron-sized particles of cobalt-chromium alloy on human fibroblasts in vitro. Biomaterials, 2007. 28: p. 2946-2958.
65. Baksh, D., J.E. Davies, and S. Kim, Three-dimensional matrices of calcium polyphosphates support bone growth in vitro and in vivo. Journal of Materials Science: Materials in Medicine, 1998. 9: p. 743-748.
66. Kilpadi, K., P.-L. Chang, and S.L. Bellis, Hydroxylapatite binds more serum proteins, purified integrins, and osteoblast precursor cells than titanium or steel. Journal of Biomedical Materials Research, 2001. 57: p. 258-267.
67. Grynpas, M.D., et al., Porous calcium polyphosphate scaffolds for bone substitute applications in vivo studies. Biomaterials, 2002. 23: p. 2063-2070.
68. Leupold, J.A., et al., A Comparison of ProOsteon, DBX, and Collagraft in a Rabbit Model. Journal of Biomedical Materials Research Part B: Applied Biomaterials, 2006. 79B: p. 292-297.
69. Yuan, H., et al., Osteoinduction by calcium phosphate biomaterials. Journal of Materials Sciences: Materials in Medicine, 1998. 9: p. 723-726.
70. Le Nihouannen, D., et al., Bone tissue formation in sheep muscles induced by a biphasic calcium phosphate ceramic and fibrin glue composite. Journal of Materials Science: Materials in Medicine, 2008. 19: p. 667-675.
71. LeGeros, R.Z., et al., Biphasic calcium phosphate bioceramics: preparation, properties and applications. Journal of Materials Science: Materials in Medicine, 2003. 14: p. 201-209.
72. Ramay, H.R.R. and M. Zhang, Biphasic calcium phosphate nanocomposite porous scaffolds for load-bearing bone tissue engineering. Biomaterials, 2004. 25.
73. Ruan, J.M., et al., Porous hydroxyapatite–tricalcium phosphate bioceramics. Powder metallurgy, 2006. 49(1): p. 66-69.
74. Bouler, J.-M., R.Z. LeGeros, and G. Daculsi, Biphasic calcium phosphates: Influence of three synthesis parameters on the HA/β-TCP ratio. Journal of Biomedical Materials Research, 2000. 51: p. 680-684.
75. Niederauer, G.G., et al., Evaluation of multiphase implants for repair of focal osteochondral defects in goats. Biomaterials, 2000. 21: p. 2561-2574.
76. Bensaïd, W., et al., De Novo Reconstruction of Functional Bone by Tissue Engineering in the Metatarsal Sheep Model. Tissue Engineering, 2005. 11(5/6): p. 814-824.
77. Frenkel, S.R., et al., Regeneration of articular cartilage - Evaluation of osteochondral defect repair in the rabbit using multiphasic implants. Osteoarthritis and Cartilage, 2005. 13: p. 798-807.
78. García-González, C.A., et al., Composite fibrous biomaterials for tissue engineering obtained using a supercritical CO2 antisolvent process. Acta Biomaterialia, 2009. 5: p. 1094-1103.
79. Kim, H.-W., J.C. Knowles, and H.-E. Kim, Hydroxyapatite/poly(ε-caprolactone) composite coatings on hydroxyapatite porous bone scaffold for drug delivery. Biomaterials, 2004. 25: p. 1279-1287.

106
80. Rezwan, K., et al., Biodegradable and bioactive porous polymer/inorganic composite
scaffolds for bone tissue engineering. Biomaterials, 2006. 27: p. 3413-3431. 81. Ghosh, S., et al., Bi-layered constructs based on poly(L-lactic acid) and starch for tissue
engineering of osteochondral defects. Materials Science and Engineering C, 2008. 28: p. 80-86.
82. Andriano, K.P., et al., Preliminary Biocompatbility Screening of Several Biodegradable Phosphate Fiber Reinforced Polymers. Journal of Applied Biomaterials, 1993. 4: p. 1-12.
83. Ito, Y., et al., Transplantation of Tissue-Engineered Osteochondral Plug Using Cultured Chondrocytes and Interconnected Porous Calcium Hydroxyapatite Ceramic Cylindrical Plugs to Treat Osteochondral Defects in a Rabbit Model. Artificial Organs, 2007. 32(1): p. 36-44.
84. Pilliar, R.M., et al., Osteochondral defect repair using a novel tissue engineering approach: Sheep model study. Technology and Health Care, 2007. 15: p. 47-56.
85. Tamai, N., et al., Novel hydroxyapatite ceramics with an interconnective porous structure exhibit superior osteoconduction in vivo. Journal of Biomedical Materials Research, 2002. 59(1): p. 110-117.
86. Kandel, R.A., R.M. Pilliar, and M.D. Grynpas, Resorbable implant biomaterial made of condensed calcium phosphate particles U.S.P.a.T. Office, Editor. 2000: United States of America.
87. Pilliar, R.M., J. Hong, and J.P. Santerre, Method of manufacture of porous inorganic structures U.S.P.a.T. Office, Editor. 2009: United States of America.
88. Pilliar, R.M., et al., Porous calcium polyphosphate scaffolds for bone substitute applications - in vitro characterization. Biomaterials, 2001. 22: p. 963-972.
89. Omelon, S., Material Properties, and In Vitro and In Vivo Degradation of Calcium Polyphosphate, in Department of Materials Science and Engineering
Institute of Biomaterials and Biomedical Engineering. 2006, University of Toronto: Toronto. p. 167.
90. MacLennan, G. and C.A. Beevers, The Crystal Structure of Monocalcium Phosphate Monohydrate, Ca(H2PO4)2•H2O. Acta Crystallographica, 1956. 9(2): p. 187-190.
91. Kartaginer, A., Use of Polyphosphates in POU Devices. Water Conditioning & Purification, 2006(July 2006).
92. Elmore, K.L. and T.D. Farr, Equilibrium in the system calcium oxide-phosphorus pentoxide-water. Industrial and Engineering Chemistry, 1940. 32(4): p. 580-586.
93. Morey, G.W., The System Sodium Metaphosphate-Calcium Metaphosphate. Journal of American Chemical Society, 1952. 74(22): p. 5783-5784.
94. Ropp, R.C., Inorganic Polymeric Glasses. Studies in Inorganic Chemistry. Vol. 15. 1992, New York: Elsevier.
95. Bray, J., et al., Measurement of fluid ingress into calcium polyphosphate bioceramics using nuclear magnetic resonance microscopy. Solid state nuclear magnetic resonance, 2007. 32: p. 118-128.
96. Petrone, C., et al., Compaction strategies for modifying the drug delivery capabilities of gelled calcium polyphosphate matrices. Acta Biomaterialia, 2008. 4: p. 403-413.
97. van Wazer, J.R., Phosphorus and Its Compounds. Vol. 1. 1958, New York: Interscience Publishers, Inc.
98. Hoppe, U., A structural model for phosphate glasses. Journal of Non-Crystalline Solids, 1996. 195: p. 138-147.
99. Van Wazer, J.R., Amorphous phosphates, in Phosphorus and its compounds Vol. I: Chemistry. 1958, Interscience Publisher, Inc.: New York. p. 733.
107
100. Jackson, L.E., et al., Synthesis and Structure of a Calcium Polyphosphate with a Unique
Criss-Cross Arrangement of Helical Phosphate Chains. Chemistry of Materials, 2005. 17: p. 4642-4646.
101. Jackson, L.E. and A.J. Wright, A New Synthetic Route to Calcium Polyphosphates. Key Engineering Materials, 2005. 284-286: p. 71-74.
102. Van Wazer, J.R., Principles of Size Distribution, in Phosphorous and its compounds Vol. I: Chemistry. 1958, Intersciences Publishers Inc.: New York. p. 733.
103. Porter, N.K., R.M. Pilliar, and M.D. Grynpas, Fabrication of porous calcium polyphosphate implants by solid freeform fabrication: A study of processing parameters and in vitro degradation characteristics. Journal of Biomedical Materials Research, 2001. 56: p. 504-515.
104. Wang, K., et al., The effect of polymeric chain-like structure on the degradation and cellular biocompatibility of calcium polyphosphate. Materials Science and Engineering C, 2008. 28: p. 1572-1578.
105. Abe, Y., T. Arahori, and A. Naruse, Crystallization of Ca(PO3)2 glass below the glass transition temperature. Journal of American Ceramics Society, 1976. 59(11-12): p. 487-490.
106. Wang, K., C. Rüssel, and C. Liu, Preparation, mechanical properties and corrosion behaviors of oriented Ca(PO3)2 glass-ceramics. Materials Chemistry and Physics, 2008. 111: p. 106-113.
107. Guo, L., H. Li, and X. Gao, Phase transformations and structure characterization of calcium polyphosphate during sintering process. Journal of Materials Science, 2004. 39: p. 7041-7047.
108. Westman, A.E.R. and P.A. Gartaganis, Constitution of sodium, potassium, and lithium phosphate glass. Journal of American Ceramics Society, 1957. 40(9): p. 293-299.
109. Ahmed, I., M.P. Lewis, and J.C. Knowles, Quantification of anions and cations from ternary phosphate based glasses with fixed 50 and 55 mol% P2O5 using ion chromatography. Physics and Chemistry of Glasses, 2005. 46(6): p. 547-552.
110. Ahmed, I., et al., Quantification of Anion and Cation Release from a Range of Ternary Phosphate-based Glasses with Fixed 45 mol% P2O5. Journal of Biomaterials Applications, 2005. 20: p. 65-80.
111. Filiaggi, M., R.M. Pilliar, and J. Hong, On the sintering characteristics of calcium polyphosphate. Key Engineering Materials, 2001. 192-195: p. 171-174.
112. Yoon, J.H., et al., Evaluation of 5% Na2O-Incorporated Calcium Metaphosphate as a Scaffold for Tissue-Engineered Bone Regeneration. Key Engineering Materials, 2006. 309-311: p. 985-988.
113. Ahmed, I., et al., Phosphate glasses for tissue engineering: Part 1. Processing and characterisation of a ternary-based P2O5-CaO-Na2O glass system. Biomaterials, 2004. 25: p. 491-499.
114. Chun, S., et al., Biodegradation study of potassium calcium metaphosphate in the SBF and Tris-Buffer Solution. Key Engineering Materials, 2002. 218-220: p. 149-152.
115. Yue, Y., et al., Glass transition in an isostatically compressed calcium metaphosphate glass. The Journal of Chemical Physics, 2007. 126(14): p. 144902.
116. Chun, S., et al., Biodegradation and Characterization of Phase Separated NaCa(PO3)3 and KCa(PO3)3 from Pure Ca(PO3)2. Key Engineering Materials, 2006. 309-311: p. 211-214.
117. Qiu, K., et al., Fabrication and characterization of porous calcium polyphosphate scaffolds. Journal of Materials Science, 2006. 41: p. 2429-2434.

108
118. LeGeros, R.Z., Biodegradation and Bioresorption of Calcium Phosphate Ceramics.
Clinical Materials, 1993. 14: p. 65-88. 119. Ropp, R.C., Effect of excess H3PO4 on the reaction paths of monobasic phosphate salts,
in Inorganic Polymeric Glasses. 1992, Elsevier: New York. p. 144-153. 120. McIntosh, A.O. and W.L. Jablonski, X-Ray Diffraction Powder Patterns of the Calcium
Phosphates. Analytical Chemistry, 1956. 28(9): p. 1424-1427. 121. Rothammel, W., H. Burzlaff, and R. Specht, Structure of Calcium Metaphosphate
Ca(PO3)2. Acta Crystallographica, 1989. C45: p. 551-553. 122. Schneider, M., K.-H. Jost, and P. Leibnitz, Crystal Structure of Calciumpolyphosphate,
[Ca2(PO3)4]x. Zeitschrift fr anorganische und allgemeine Chemie, 1985. 527: p. 99-104. 123. Petrov, S., Simulated patterns of Rothammel and Schneider structures. 2009: Toronto. 124. Corbridge, C., Crystallographic data on some Kurrol salts. Acta Crystallographica, 1955.
8: p. 520. 125. Qiu, K., et al., In Vitro Degradation Studies of Calcium Polyphosphate Ceramics
Prepared by Controlled Degree of Polymerization and Crystallization. Key Engineering Materials, 2005. 288-289: p. 553-556.
126. Knowles, J.C., Phosphate based glasses for biomedical applications. Journal of Materials Chemistry, 2003. 13: p. 2395-2401.
127. Ahmed, I., et al., Phosphate glasses for tissue engineering: Part 2. Processing and characterisation of a ternary-based P2O5-CaO-Na2O glass fibre system. Biomaterials, 2004. 25: p. 501-507.
128. Chun, S., et al., Biodegradation study of amorphous and crystalline calcium metaphosphate in the SBF and tris buffer solution. Key Engineering Materials, 2001. 192-195: p. 131-134.
129. Song, W., et al., The study on the degradation and mineralization mechanism of ion-doped calcium polyphosphate in vitro. Journal of Biomedical Materials Research Part B: Applied Biomaterials, 2009. 89B: p. 430-438.
130. Van Wazer, J.R., Individual Chain Phosphates, in Phosphorus and its compounds Vol. I: Chemistry. 1958, Interscience Publishers Inc.: New York. p. 612.
131. Griffith, E., Melt and Phases, in Phosphate Fibers. 1995, Plenum Press: New York. p. 134-135.
132. Cullity, B.D., Elements of x-ray diffraction. 3rd ed. 2001, Upper Saddle River: Prentice Hall.
133. Barsoum, M.W., Fundamentals of Ceramics. 2 ed. Series in Materials Science and Engineering, ed. B. Cantor and M.J. Goringe. 2003, Bristol: Institute of Physics Publishing.
134. Ceramics, T.C.I.T.F., Fine ceramics (advance ceramics, advanced technical ceramics) - Determination of absolute density of ceramic powders by pyknometer. 2004, ISO copyright office: Geneva. p. 6.
135. Pai, S.S. and J.P. Gyekenyesi, Calculation of Weibull Strength Parameters and Batdorf Flow-Density Constants for Volume- and Surface-Flaw-Induced Fracture in Ceramics. 1988.
136. McLean, A.F. and D.L. Hartsock, Design of Structrual Ceramics, in Structural Ceramics, J.J. Wachtman, Editor. 1989, Academic Press: Boston.
137. Mendenhall, W. and T. Sincich, Statistics for Engineering and the Sciences. 4 ed. 1995, Englewood cliffs, NJ: Prentice Hall.
138. Bergman, B., On the estimation of the Weibull modulus. Journal of Materials Science Letters, 1984. 3: p. 689-692.

109
139. Bergman, B., On the variability of the fracture stress of brittle materials. Journal of
Materials Science Letters, 1985. 4: p. 1143-1146. 140. Pilliar, R.M., Pilliar lab data. 141. Illingworth, B.E., Sintering characteristics of calcium polyphosphate, in Materials
Science and Engineering. 2005, University of Toronto: Toronto. 142. Callister, W.D. and D.G. Rethwisch, Imperfections in Solids, in Fundamentals of
Materials Science and Engineering: An Integrated Approach. 2009, John Wiley & Sons: Mississauga. p. 127-160.