the effect of substitution of wheat flour in different
TRANSCRIPT
International Journal of Science and Research (IJSR) ISSN (Online): 2319-7064
Index Copernicus Value (2015): 78.96 | Impact Factor (2015): 6.391
Volume 6 Issue 2, February 2017 www.ijsr.net
Licensed Under Creative Commons Attribution CC BY
The Effect of Substitution of Wheat Flour inDifferent Proportions of Barley Flour in the
Rheological Properties of Dough and Bread's Sensual Properties
Dr. Hamdia Mohammed Shahwan Al-Hamdani1, Dr. Salim Salah Hussian Al-Temmemi2
Abstract: The objectives of this study was to investigate the physico-chemical and sensory properties of bread supplemented with seven different levels (control, 10%, 20%, 30%, 40%, 50% and 60%) of barley flour. And the other objective was to show the fake of backers about spongy barley bread that is available in Iraqi local market as healthier bread. The physical (weight, loaf volume and specific volume) and chemical (moisture, protein, ash, gluten, fat and fatty acids) analysis were determined in different flour. The bread making was led according to the French test NFV03-716. Sensory evaluation of dough, bread, crumb and volume were conducted on the control, real barley bread and supplemented bread. It was found that increasing the level of supplementation from 10% to 60% barley flour significantly (p<0.05) increased percent water absorption, development time and stability time of the dough, and significantly decreased degree of the softening (p<0.05). Loaf volume and specific volume of supplemented bread were significantly different (p<0.05) compared with control and barley bread treatment. Sensory evaluation shows that bread with 10-40% barley flour was rated the most acceptable and was not significantly different in terms of acceptability compared to the control and real barley flour. Also, it was found that barley bread in Iraqi local market was fake barley bread and sold as barley bread.
Keywords: Barley bread-Wheat bread-physicochemical analysis- Sensory evaluation-Fake barley bread
1. Introduction
Bread is a staple food prepared by baking dough of flour, water and some of salt which is rich in calories and widely consumed in Iraq, as a part of the Iraqi culture, it is eaten ateach meal. In Iraq, wheat products especially bread has animportance in diets, 65% of the energy consumed per capita is supplied from cereal (bread and rice) and 55% ofthis energy is supplied only from breads (FAO, 1982).Bread can have different topping, fillings, shapes, and textures. The Iraqi baked products market especially at the capital of Iraq, Baghdad, has grown significantly from last century till now because of several factors such as the increase in purchasing power and options in the market, technological improvements, and appeal for healthy foods. During the last years, there is a renewed interest in the use of barley flour by modern bakeries located inside Baghdad by its wealth protocols (vitamin E) and soluble fiber (ß-glucans) and minerals. Barley is a cereal grain which belongs to the family of Poacea, the Triticeae tribe and Hordeumvulgare genus. Barley is a rich source of soulable and insoulable fiber (Gary, et, al.1982). Β-glucan, a soluble fraction is responsible for lowering serum cholesterol and blood glucose (Behall, et al. 2001and 2004).Hence, the ß-glucans component expressed an important feature ofbarley bread (Joseph, et al. 2007; Aziz and Mohammed 2013). Also, soluble fiber retards intestinal transit and ispartially fermented in large intestine which produced low molecular weight of volatile fatty acids which is very important in lowering serum cholesterol and blood glucose (Mishra, et al. 2010). The use of barley flour for bread making has been the subject of several studies In Iraq (Sabeha, 2010 ;Makarim, et al. 2012). All of these studies showed that the incorporation of barley flour more than 15% resulted in an unacceptable qualitative change. Also, there were many studies worldwide showed the same thing
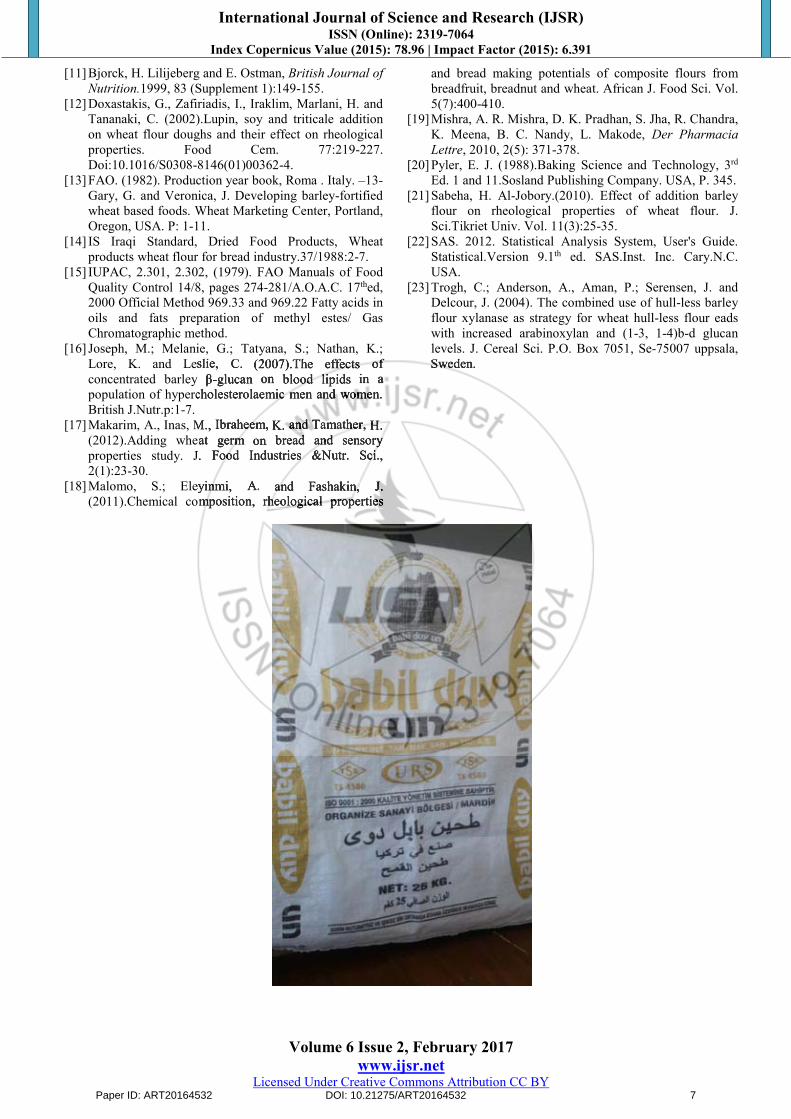
that over 20% of barley flour addition to wheat flour affect the quality of bread unpleasant (Aziz and Mohammed 2013;Bhatty, 1968). But, the bakery markets of Baghdad offered barley bread look like wheat bread just it has a brown color. The person who specialized in baking goods processor can distinguish the Commercial Fraud at a glance. So that, this study to seek this phenomenon and to collect many flour,s sample from many different bakery shops at Baghdad city and from rural regions to search the physic-chemical and rheological properties of the dough to decide that is wheat orbarley flour. In addition, here tried very hard to get on the type of real flour bag, which imports from Turkey to work bakery product process through some friends and associates truthful, as is evident in the picture shown as wheat flour and not barley Fig.1. But the bakers offer it for sale on the grounds that barley bread. Therefore, our main objectives were to study the physicochemical analysis between wheat flour and Defendant barley flour. The other objective is tostudy the effect of barley flour incorporation on quality and sensory evaluation of bread. The last an important objective isto declare the truth of the defendant barley bread in the local market which is a great calamity sold as healthy bread for obese and diabetes persons.
2. Materials and Methods
MaterialCommon wheat flour TWF used widely in Iraq under the name "Bushler" that was imported from Turkey; other source is from Al-Bashaer mill that milled ad mixed different kind oflocal wheat seed IWF. The barley seed of variety "Brear" was obtained from Agriculture Research Center/Baghdad city/Iraq. Then barley seeds were cleaned, dehlled and finally milled into flour 70% through sieve 8xxx with Laboratory mill (Retsch Germany, RetschRm200 www.retsch.com ) toget very fine particles. The added materials used in bread
Paper ID: ART20164532 DOI: 10.21275/ART20164532 1
<0.05) increased percent water absorption, development time and stability time of the softening (p<0.05). Loaf volume and specific volume of supplemented bread were significantly different (p<0.05) of supplemented bread were significantly different (p<0.05) supplemented bread were significantly different (p<0.05) of
compared with control and barley bread treatment. Sensory evaluation shows that bread with 10-40% barley flour was rated the most acceptable and was not significantly different in terms of acceptability compared of acceptability compared acceptability compared of to the control and real barley flour. Also,
Iraqi local market was fake barley bread and sold as barley bread.
Barley bread-Wheat bread-physicochemical analysis- Sensory evaluation-Fake barley bread
a staple food prepared by baking dough by baking dough baking dough by of flour, of flour, flour, of salt which is rich in calories and widely in calories and widely calories and widely in
a part of the Iraqi culture, of the Iraqi culture, the Iraqi culture, of it is eaten at Iraq, wheat products especially bread has an
65% of the energy consumed per of the energy consumed per the energy consumed per of supplied from cereal (bread and rice) and 55% of
supplied only from breads (FAO, 1982). have different topping, fillings, shapes, and
textures. The Iraqi baked products market especially at the at the the at Iraq, Baghdad, has grown significantly from last
now because of several factors such of several factors such several factors such of as the purchasing power and options in the market, in the market, the market, in
technological improvements, and appeal for healthy foods. During the last years, there is a renewed interest in the use in the use the use in
modern bakeries located inside Baghdad protocols (vitamin E) and soluble fiber (ß-
glucans) and minerals. Barley is a cereal grain which
that over 20% of barley flour addition of barley flour addition barley flour addition ofthe quality of bread unpleasant (Aziz and Mohammed of bread unpleasant (Aziz and Mohammed bread unpleasant (Aziz and Mohammed of;Bhatty, 1968). But, the bakery markets barley bread look like wheat bread just The person who specialized in baking goods processor can in baking goods processor can baking goods processor can indistinguish the Commercial Fraud study to seek this phenomenon and sample from many different bakery shops and from rural regions to search the physic-chemical and rheological properties of the dough of the dough the dough ofbarley flour. In addition, here tried very hard In addition, here tried very hard addition, here tried very hard Intype of real flour bag, which imports from Turkey of real flour bag, which imports from Turkey real flour bag, which imports from Turkey ofbakery product process through some friends and associates truthful, as is evident in the picture shown in the picture shown the picture shown innot barley Fig.1. But the bakers offer grounds that barley bread. Therefore, our main objectives were to study the physicochemical analysis between wheat flour and Defendant barley flour. The other objective study the effect of barley flour incorporation of barley flour incorporation barley flour incorporation of
Market Research and Consumer Protection Center, Baghdad University, Iraq
International Journal of Science and Research (IJSR) ISSN (Online): 2319-7064
Index Copernicus Value (2015): 78.96 | Impact Factor (2015): 6.391
Volume 6 Issue 2, February 2017 www.ijsr.net
Licensed Under Creative Commons Attribution CC BY
processing i.e. fresh yeast, salt, and bread improver, were provided by bakery in Baghdad. Baker's yeast was stored, before use, at 4° C following the label guidelines. The improver incorporated at a level of 0.2% consists of wheat flour 83.5%, ascorbic acid 4%, malt 10% and alpha-amylase(2.5%).
Composite flour preparation Ten blends were prepared by homogenously mixing different percentage of barley flour with wheat flour as intable 1 using a Kenwood food processor (Model A 907 D,Kenwood Ltd, England).
2.2 Methods
All data measured are means of at least duplicate measurements unless stated otherwise.
Chemical analysis:The moisture, ash and fat contentwere determined according to AOAC (1990) standard method. Moisture was determined using hot air oven at 100-105 o C for 4 hours (AOAC, method 925.40). Protein content (5Nx6.25) was determined by Kjedahl method (AOAC, Method 920.39).The ash content was measured according to dry ashing procedure (AOAC, Method 7.504).Total fat and fatty acids was determined by the Soxhlet extraction method to obtained 200 mg. The extracted fat (80 ml) was transferred to esters, and concentrations of fatty acid s inthe form of methyl-esters (FAMEs) were specified by gas chromatography analyzer GC-2010 (Shimadzu, Japan) with flame ionization detector (FID). The method with anaddition of internal standard (C15:0) was used. The GC-2010 system was equipped with an auto sampler and auto injector. The injection volume was 1µl. The total split flow was 90 ml/min. Helium was used as the carrier gas. Air and hydrogen gases were used as auxiliary gases. The FAMEs were separated on a column VB-VAX (60 m length; 0.25 mm ID; 0.25µm film thickness). The FID temperature was set at 300oC, initial injector temperature was 280oC and pressure was 299.2 kPa, initial column temperature was 70oC. The data were processed by a computer using data processor GC solution Post run (IUPAC, 1079).
Determination of % gluten in flourAbout 20 g of each composite flour sample and barley flourwere weighed onto a Petri dish of known weight and thoroughly mixed with 1 ml of water to form dough. The dough is kneaded under running water to remove starch and later put into Petri dish and weight. It was then dried in anoven (LCON53CF, Genlab, England) and weighed after drying (method 38-10,AACC 2000).The % glutein iscalculated as follow: % wet glutin=weight of glutin/weight of original flour× 100
Physical characteristics:The particle size of WF and BF was determined according to the method published by the Iraqi Standard NM 08.1.224 (IS) using sieve analysis (plansifter laboratory model MLU-300). The particle size is defined as the quantity ofground cereals remaining is sieves of specific mesh aperture after the sieving process, plus the screening of the
finest sieve used. Different blends were tested for bread making quality. Color of the fractions was measured with General State Company of Cereal Technology Laboratory with Hunterlab and Agtrol Colorimeters. In the latter method dry fractions were used, and the Agtron was standardized with nos. 63 (0%) and 97 (100%) disk (AACC, 1969). Compsite flour were prepared by adding 0, 10, 20, 30, 40, 50, and 60% barley flour (Braer) to commercial untreated wheat flour, and read baking quality was determined using the straight-dough method (AACC, 1969). The standard baking formula optained in addition 15 ppm potassium bromate and 0.5% sodium tearyl 2-lactylate (SSL). Water absorption was about 61% in each case. LoafLoaf volume (ml) of baked bread was determined by rapeseed displacement method according to (Pyler, 1988), the loaf weight of bread wasmeasured in (gm). And the bread was scored for shape, crust color, crumb color and texture. Dough properties of the composite flours were determined at 65% absorption with a Swenson mixograph. The mixograph curve was measured for time to reach maximum height (dough development time), peak height and curve area.
Farinograph water absorptionThe farinograph water absorption (FWA) was determined for different blends to foretell the hydration rate for bread making procedure. FWA is the volume of water, expressed inml/100 g of flour at 14.0% moisture content, required toproduce dough with a maximum consistency of 500 FU(Farinograph Unit) under the operating condition specified bythe Iraqi standard NM 08.1.245 (AACC, 1984).
Bread making Bread was produced using the straight dough process. Baking testwas carried out under laboratory conditions to optimize baking condition prior to actual runs. Flour and doughweighing was carried out on laboratory-scale. Dough wasmixed to optimum consistency in a Kenwood mixer (Model A 907 D, Kenwood Ltd., England) with low speed of 85rpm/1 min., kneaded and left to proof for 15 min. After proofing the dough was scaled into 500 g portions, manually rounded, then rolled and put in tin baking pans (75 min, on30°C, and 80% relative humidity). Baking was done at 230°C in an electric oven (Electric oven SL-9 Infrared Food Oven, Hubert, China) until the golden brown color is formed. The resulting bread samples were cooled to room temperature 37°C/2 h before further analysis were carried out.
Evaluation of the physical properties of bread samples
Loaf weight: Bread loaves were weighted 20 min after baking in grams.Loaf volume: Loaf volume was determined using rapeseed displacement method (AACC, 2000, Standard 10-05). Rapeseed were loaded into an empty box with calibrated mark until it reached the marked level and unloaded back again. The remaining rapeseed left outside the box was measured using measuring cylinder and recorded as loaf volume in cm3.
Specific volume: Bread height and diameter was measured using a measuring ruler. Loaf shape was measured in terms ofheight to diameter ratio while specific volume was thereafter calculated as volume to mass ratio (cm3/g).
Paper ID: ART20164532 DOI: 10.21275/ART20164532 2
The moisture, ash and fat contentwere determined AOAC (1990) standard method. Moisture was
determined using hot air oven at 100-105 o C for 4 hours (AOAC, method 925.40). Protein content (5Nx6.25) was
Kjedahl method (AOAC, Method 920.39).The ash content was measured according to dry ashing procedure (AOAC, Method 7.504).Total fat and fatty acids was determined by the Soxhlet extraction by the Soxhlet extraction by
mg. The extracted fat (80 ml) was esters, and concentrations of fatty acid s of fatty acid s of in
methyl-esters (FAMEs) were specified by gas by gas bychromatography analyzer GC-2010 (Shimadzu, Japan) with flame ionization detector (FID). The method with an
internal standard (C15:0) was used. The GC- system was equipped with an auto sampler and auto an auto sampler and auto an
injector. The injection volume was 1µl. The total split flow ml/min. Helium was used as the carrier gas. Air and
hydrogen gases were used as auxiliary gases. The FAMEs a column VB-VAX (60 m length; 0.25
ID; 0.25µm film thickness). The FID temperature was initial injector temperature was 280oC and
pressure was 299.2 kPa, initial column temperature was The data were processed by a computer using data by a computer using data by
solution Post run (IUPAC, 1079).
% gluten in flour
time to reach maximum height (dough development time), peak height and curve area.
Farinograph water absorptionThe farinograph water absorption (FWA) was determined for different blends to foretell the hydration rate for bread making procedure. FWA is the volume ml/100 g of flour of flour of at 14.0% moisture content, required at 14.0% moisture content, required atproduce dough with a maximum consistency (Farinograph Unit) under the operating condition specified the Iraqi standard NM 08.1.245 (AACC, 1984).
Bread making Bread was produced using the straight dough process. Baking testwas carried out under laboratory conditions baking condition prior to actual runs. Flour and weighing was carried out on laboratory-scale. Dough mixed to optimum consistency in a Kenwood mixer (Model in a Kenwood mixer (Model inA 907 D, Kenwood Ltd., England) with low speed rpm/1 min., kneaded and left to proof for proofing the dough was scaled into rounded, then rolled and put in tin baking pans (75 min, in tin baking pans (75 min, in30°C, and 80% relative humidity). Baking was done in an electric oven (Electric oven an electric oven (Electric oven anHubert, China) until the golden brown color resulting bread samples were cooled
International Journal of Science and Research (IJSR) ISSN (Online): 2319-7064
Index Copernicus Value (2015): 78.96 | Impact Factor (2015): 6.391
Volume 6 Issue 2, February 2017 www.ijsr.net
Licensed Under Creative Commons Attribution CC BY
Sensory evaluation For sensory evaluation, Control, barley and composite (Barley and wheat flour) bread samples were served atroom temperature in duplicate. Ten panelists were chosen who were familiar with bread. Ages ranged from 25 to 40.Four of them were male. All panelists were non-smokers. Instructions were given in full to panelists beforehand. Examinations took place in tasting booths under normal white illumination. Final judgment was obtained byaveraging the scores given by all panelists. Barley flour-supplemented wheat flour samples were evaluated on a scale of 1 to 5 for five quality parameters (Exterior appearance: volume, crust color, regulatory grilling, break and shred, smoothing the surface, and regulatory. Interior appearances: crump granulation, crump color, texture tenderness, flavor and taste) were assessed for all sampled and control within 3-6 h. of baking (Anonymous, 2008).
Statistical analysisStatistical Analysis System- SAS (2012) program was used to test the significance of treatment differences of studied parameters. Least significant difference -LSD test was used to compare between means significances in this research. Every analysis was performed in triplicates and mean values are expressed on a dry matter.
Table 1: Formula forbread making testIngredients (g)
%BF Improver2Water1YeastSaltBFWF0FWA000000000%0FWA000000000%0FWA00000000000%0FWA000000000000%0FWA000000000000%0FWA000000000000%0FWA000000000000%0FWA000000000000%0FWA00000000000%0FWA00000000000%
(1) FWA = Farinograph water absorption. (2) Wheat flour (83.5%), ascorbic acid 4%, malt (10%) and alpha-amylase (2.5%). All flours used in this experiment contained approximately 11% moisture (Table 2). This is about average for Iraqi flours.
3. Result and Discussion
The moisture content is important for bread-making. Itinfluences the rate of dough hydration and thus rheological characteristics [21]. The maximal limit fixed by the Iraqi standard is 14 % [Is]. WF and BF were found to contain 12.8 and 10.7% respectively. The low moisture content observed for BF is justified because barley is generally milled without tempering process. The ash content explainthe amount ofbran remaining in the flour after the milling.Barley flour contains 1.8% of ash significantly, higher than wheat flour 0.72%. The greater percentage of ash in barley flours could be due to a less complete separation of the bran and germ from the endosperm. Fat content in barley flour is17.45%significantly higher than wheat flour which is 1.55%. Color values of the two barley fractions (BF 50gg and BF ontray), WWF1, TWF, IWF and Control wheat flour are showed in table 2. The color degree values showed that whole wheat flour and barley flourwas darker than imported and local wheat flour presented in local Iraqi markets. The particles size refers the fineness and homogeneity of the flour. The determination of this character is important because water absorption is higher in flour with a fine particles size than coarse flour, due to the surface area factor. As shown in table 2, barley flour was 30-39 mm significantly smaller than wheat flour which was 70 mm in average by the sieve of 10xxof diameter. While, particle size of the wheat flour range from 6-14 mm finer than barley flour which was 30 mm on 50xx.
Table 2: Physical and chemical analyzes of barley, imported (Turkish) and Local Iraqi wheat flours.particle size on 50xxparticle size on 10xxColor degreeFat%Ash %Moisture %Samples
304014.400.00211.6WBF000310.200.001.810.4BF 50gg00009.004.001.410.6BF on tray147215.50.001.711.0WWF 1 (Bakery flour, dark flour)10714.30.000.7911.2TWF on tray Turkey8724.20.400.7214.0IWF (Al-Bashaer mill) Iraq6703.50.001.513.1Control
5.02 *11.65 *3.97 *4.31 *0.662 *2.885 *LSD value18.53%22.65%12.73%18.46%12.05%15.88 %CV %
WBF=wheat barley flour, BF=barley flour, WWF=whole wheat flour, TWF=Turkish wheat flour, IWF=Iraqi wheat flour (Iraqi mill, Bashaer) and the control= standard white flour used for bread in Iraq.
Table 3 shows the fatty acid composition of the barley flour. Lauric, myristic, oleic and palmitic acids were the major fatty acids.
Table 3: Concentrations of fatty acids most frequently present in oil of the barley flour
g/100g-1oilFatty acids0.1970C6Caproic acid3.6866C:8Caprlic acid3.8246C10Capric acid51.8627C12lauric15.4580C14Myristic7.9398C16palmitic acid1.7437C18Stearic11.4389C18:1Oleic1.5739C18:2Linoleic
04.00%Fat (g/100g)
Paper ID: ART20164532 DOI: 10.21275/ART20164532 3
Statistical Analysis System- SAS (2012) program was used of treatment differences of treatment differences of of studied of studied of
parameters. Least significant difference -LSD test was used compare between means significances in this research. in this research. in
Every analysis was performed in triplicates and mean in triplicates and mean in a dry matter.
Formula forbread making testIngredients (g)
Improver2Water1YeastSalt0FWA0000
0FWA0000
0FWA0000
0FWA0000
0FWA0000
0FWA0000
0FWA0000
0FWA0000
0FWA0000
0FWA0000
be due to a less complete separation from the endosperm. Fat content 17.45%significantly higher than wheat flour which Color values of the two barley fractions (BF 50gg and of the two barley fractions (BF 50gg and oftray), WWF1, TWF, IWF and Control wheat flour are showed in table in table in 2. The color degree values showed that whole wheat flour and barley flourwas darker than imported and local wheat flour presented in local Iraqi markets. The particles in local Iraqi markets. The particles insize refers the fineness and homogeneity determination of this character of this character of isabsorption is higher in flour with a fine particles size than in flour with a fine particles size than incoarse flour, due to the surface area factor. 2, barley flour was 30-39 mm significantly smaller than mm significantly smaller than mmwheat flour which was 70 mm in average in average inof diameter. While, particle size of diameter. While, particle size of of the wheat flour range from of the wheat flour range from of6-14 mm finer than barley flour which was mm finer than barley flour which was mm
Physical and chemical analyzes of barley, imported (Turkish) and Local Iraqi wheat flours.of barley, imported (Turkish) and Local Iraqi wheat flours.ofparticle size on 10xxColor degreeFat%Ash %Moisture %
4014.400.00211.60310.200.001.810.4009.004.001.410.67215.50.001.711.0dark flour)
International Journal of Science and Research (IJSR) ISSN (Online): 2319-7064
Index Copernicus Value (2015): 78.96 | Impact Factor (2015): 6.391
Volume 6 Issue 2, February 2017 www.ijsr.net
Licensed Under Creative Commons Attribution CC BY
Glutein contentsThe percentage of gluten content of the different kind offlour (WBF, BF on 50gg, BF on tray, WWF1, TWF, IWF and control) is measured in table 4 to see the fade of sellers in the absence of healthysurveillance ( monitoring) and consumer protection. It was found that the percentage ofthe gluten in the white barley flour zero, while it is bought in all Iraqi market as barley flour. The same thing with barley flour which runs on sieve 50gg and on tray, the percentage of the gluten was zero as shown clearly in table 4. In contrast of that, the highest of gluten percent was inthe wheat flour imported from Turky 25 when compared with the control 24.2%. Gluten content decreased to 22.o% in each of the wheat flour which was found in the local markets and which was produced in the General Company for Cereal production in Iraq. As known, the yields ofgluten fraction were closely correlated with protein contents of their flours (based on values in table 5.
Table 4: Gluten content (%) of different flour which used in Baghdad
%GlutenSamplesNo gluten network formationWBF=White barley flourNo gluten network formationBF 50gg= barley flourNo gluten network formationBF on tray= barley flour on
tray22.0WWF 1 (Bakery wheat flour)
dark flour25.0TWF on tray (Turkey) wheat
flour22.0IWF (Al-Bashaer mill) Iraq
wheat flour24.2Control
2.750 *LSD value14.63%CV %
Rheological properties of the doughThe farinograph data of the barley flour and different types ofwheat flour that used in Iraqi local markets are summarized intable 5. Protein is an important criterion for bread-making, which is used to appreciate the end use of wheat. The protein content is strongly correlated to the quantity of gluten which is responsible for rheological characteristics and behavior offlour during baking (Aziz, and Mohammed 2013). Protein content of the barley flour ranged from 11.2 to 12.5% and ranged from 9.0 to 10.2% in different wheat flours which issignificantly different compared with control. Moisture content also significantly different for all kinds of flours compared with control. Water absorption of the all kinds ofbarley flour dough ranged from 70.0 to 72.0% that was higher than the control 58.2%, and also was higher than all kinds ofwheat flours that were ranged from 59.9 to 69.3% flours which are significantly different compared with control. The arrival time of the wheat's dough was the same with control 1.0 min., while the stability time of imported dough's flour from Turkey was longer 12.6 min than that of the control except for whole wheat WWF1 and Iraqi wheat flour IWF which are smaller than control 5.5 and 5.5 min respectively. In contrast of that, dough made from barley flour could notdevelop and there weren’t arrival times and dough stability, due to the absence of the gluten content which is important tomake the dough structure and the gluten network as shown clearly in table 4.The defects observed in dough’s flour mixtures are mainly due to the weakness and no elasticity ofbarley gluten. This depreciation is perceptible starting at 40%barley flour incorporation.
Table 5: Rheological properties of the dough from different sources of wheat, barley flour & its fractions used in Baghdad city
Dough stabilitytime (min)
Dough developmenttime (min)
Arrival time(min)
Waterabsorption %
Moisture %Protein %Samples
---7211.610.2WBF---71.510.411.5BF 50gg---70.010.612.5BF on tray
5.35.71.269.311.09.0WWF 1 (Bakery flour) darkflour
12.62.41.160.411.210.2TWF on tray, Turkey5.52.01.359.914.09.7IWF (Al-Bashaer mill) Iraq7.21.81.058.213.110.5Control
3.64 *1.75 *0.42 NS6.84 *2.28 *2.06 *LSD value11.85%13.49%11.02%19.07 %16.35 %12.78%CV %
Values with the same letters in the same column are not significantly different. Control=100% WF, BF50gg=Barley flour on sieve 50gg, WWF1= Whole wheat flour, WFT= Imported Turkish wheat flour, IWF= Iraqi wheat flour from Al-Bashaer mill.
Rheological properties of the plain and composite dough:The farinograph data of the plain and composite flours are summarized in table 6. There were no significance differences in moisture contents in different composite flour with barley flour or with wheat or barley flour. Gluten content in wheat flour is the highest 24.2%, while it was zero content of gluten in barley flour as presented in table
6. Gluten content decreased significantly as the level ofreplacement increased. Water absorption of the composite flour dough ranged from 68.3 to 74.7% with sample of 10%and 60% barley flour subsistution and was significantly higher than the control 63.4%. The high percent of water absorption during mixing is a typical property of composite starches (Doxastakis et al. 2002). Also, Lee et al. (2001) and Morita et al. (2002) presented that the dough of the composite flours absorbed more water than wheat flour only. Development time is the time from the first addition of the water to the time the dough reached the point of greatest torque (Malomo, et al. 2006). During this phase of mixing, the water hydrates the flour components and the dough isdeveloped. There were significant differences in development
Paper ID: ART20164532 DOI: 10.21275/ART20164532 4
Gluten content (%) of different flour which used of different flour which used ofin Baghdadin Baghdadin
%GlutenNo gluten network formationflourNo gluten network formationNo gluten network formationon
22.0flour)
25.0wheat
22.0Iraq
24.22.750 *14.63%
from Turkey was longer 12.6 min than that except for whole wheat WWF1 and Iraqi wheat flour IWF which are smaller than control 5.5 and 5.5 min respectively. In contrast In contrast In of that, dough made from barley flour could of that, dough made from barley flour could ofdevelop and there weren’t arrival times and dough stability, weren’t arrival times and dough stability, weren’t
due to the absence of the gluten content which of the gluten content which ofmake the dough structure and the gluten network clearly in table in table in 4.The defects observed mixtures are mainly due to the weakness and barley gluten. This depreciation is perceptible starting barley flour incorporation.
Rheological properties of tof tof he dough from different sources of wheat, barley flour & of wheat, barley flour & of its fractions used city
Dough developmenttime (min)
Arrival time(min)
Waterabsorption %
Moisture %Protein %
--7211.610.2--71.510.411.5--70.010.612.5
5.71.269.311.09.0flour) dark
2.41.160.411.210.2Turkey1.359.914.09.7mill) Iraq 2.0
International Journal of Science and Research (IJSR) ISSN (Online): 2319-7064
Index Copernicus Value (2015): 78.96 | Impact Factor (2015): 6.391
Volume 6 Issue 2, February 2017 www.ijsr.net
Licensed Under Creative Commons Attribution CC BY
time between the dough with or without substitution. Dough development times of the composite flours were not substantially altered by adding of up to 20% barley flour. However, both peak height and area decreased significantly by addition up to 60% barley flour to wheat flour due to the some extensibility of barley proteins.The defects observed in dough’s flour mixtures are mainly due to the weakness and no elasticity of barley gluten. This depreciation is
perceptible starting at 40 % barley flour incorporation. The characteristics of bread baked from composite flour (wheat and barley) confirmed data obtained with mixograph. Higher levels of barley flour dilute wheat gluten and impairment ofits gas retention capacity. An earlier study (Aziz and Mohammed 2013, Malomo, et al. 2006) also presented acceptable bread produced from 10-50% wheat-barley composite flour.
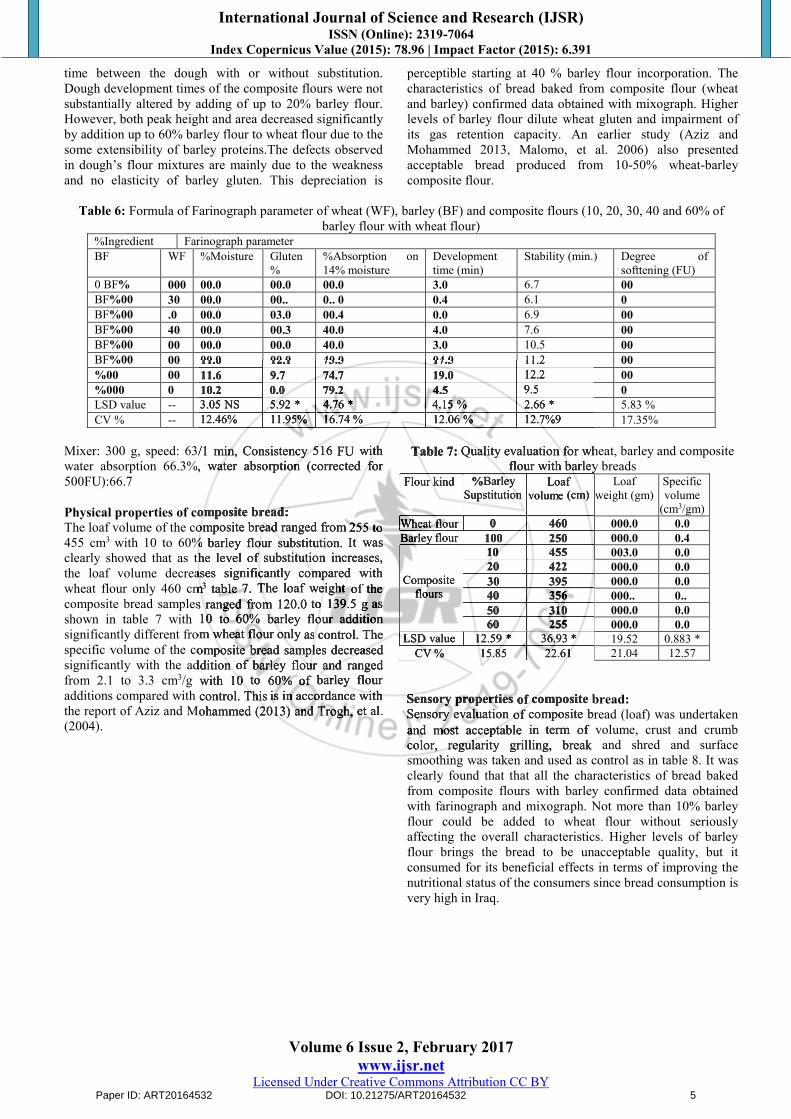
Table 6: Formula of Farinograph parameter of wheat (WF), barley (BF) and composite flours (10, 20, 30, 40 and 60% ofbarley flour with wheat flour)
Farinograph parameter%IngredientDegree ofsofttening (FU)
Stability (min.)Developmenttime (min)
%Absorption on14% moisture
Gluten%
%MoistureWFBF
006.73.000.000.000.00000 BF%06.10.40.. 000..00.030BF 00%006.90.000.403.000.0.0BF 00%007.64.040.000.300.040BF 00%0010.53.040.000.000.000BF 00%0011.204.040.000.000.000BF 00%0012.203.040.43.400.00000%09.50.043.00.000.00000%5.83 %2.66 *4.15 %4.76 *5.92 *3.05 NS--LSD value17.35%12.7%912.06 %16.74 %11.95%12.46%--CV %
Mixer: 300 g, speed: 63/1 min, Consistency 516 FU with water absorption 66.3%, water absorption (corrected for 500FU):66.7
Physical properties of composite bread:The loaf volume of the composite bread ranged from 255 to455 cm3 with 10 to 60% barley flour substitution. It was clearly showed that as the level of substitution increases, the loaf volume decreases significantly compared with wheat flour only 460 cm3 table 7. The loaf weight of the composite bread samples ranged from 120.0 to 139.5 g asshown in table 7 with 10 to 60% barley flour addition significantly different from wheat flour only as control. The specific volume of the composite bread samples decreased significantly with the addition of barley flour and ranged from 2.1 to 3.3 cm3/g with 10 to 60% of barley flour additions compared with control. This is in accordance with the report of Aziz and Mohammed (2013) and Trogh, et al. (2004).
Table 7: Quality evaluation for wheat, barley and composite flour with barley breads
Specificvolume
(cm3/gm)
Loafweight (gm)
Loafvolume (cm)
%BarleySupstitution
Flour kind
0.0000.00000Wheat flour0.4000.0000000Barley flour0.0003.000000
Compositeflours
0.0000.0000000.0000.0030000..000..000000.0000.0000000.0000.000000
0.883 *19.5236.93 *12.59 *LSD value12.5721.0422.6115.85CV %
Sensory properties of composite bread:Sensory evaluation of composite bread (loaf) was undertaken and most acceptable in term of volume, crust and crumb color, regularity grilling, break and shred and surface smoothing was taken and used as control as in table 8. It was clearly found that that all the characteristics of bread baked from composite flours with barley confirmed data obtained with farinograph and mixograph. Not more than 10% barley flour could be added to wheat flour without seriously affecting the overall characteristics. Higher levels of barley flour brings the bread to be unacceptable quality, but itconsumed for its beneficial effects in terms of improving the nutritional status of the consumers since bread consumption isvery high in Iraq.
Paper ID: ART20164532 DOI: 10.21275/ART20164532 5
11.204.040.000.000.0
12.203.040.43.400.0
9.50.043.00.000.0
2.66 *4.15 %4.76 *5.92 *3.05 NS12.7%912.06 %16.74 %11.95%12.46%
speed: 63/1 min, Consistency 516 FU with water absorption 66.3%, water absorption (corrected for
composite bread: the composite bread ranged from 255 to
60% barley flour substitution. It was It was It the level of substitution increases, of substitution increases, of
the loaf volume decreases significantly compared with cm3 table 7. The loaf weight of the of the of
composite bread samples ranged from 120.0 to 139.5 g as10 to 60% barley flour addition
significantly different from wheat flour only as control. The the composite bread samples decreased
significantly with the addition of barley flour and ranged of barley flour and ranged of with 10 to 60% of barley flour of barley flour of
additions compared with control. This is in accordance with in accordance with in Aziz and Mohammed (2013) and Trogh, et al. et al. et
Table 7: Quality evaluation for wheat, barley and composite flour with barley breads
Loafvolume (cm)
%BarleySupstitution
Flour kind
0000Wheat flour000000Barley flour
00 000
Compositeflours
00000
03000
00000
00000
00000
36.93 *12.59 *LSD value22.6115.85CV %
Sensory properties of composite bread:of composite bread:ofSensory evaluation of composite bread (loaf) was undertaken of composite bread (loaf) was undertaken ofand most acceptable in term in term in of volume, crust and crumb of volume, crust and crumb ofcolor, regularity grilling, break and shred and surface smoothing was taken and used control

International Journal of Science and Research (IJSR) ISSN (Online): 2319-7064
Index Copernicus Value (2015): 78.96 | Impact Factor (2015): 6.391
Volume 6 Issue 2, February 2017 www.ijsr.net
Licensed Under Creative Commons Attribution CC BY
Table 8: Sensory evaluation of laboratory bread quality (processed from wheat and composite from wheat & barley flour)Composite flours with barley flour%Wheat
Flour(%100)
Graderange
Characters000000000000
Exterior appearance0.00.00.08.0. .03.000.01-10Volume0.00.40.00.00.00.34.01-8Crust color0.30.00.00.00.00..0.01-3Regularity Grilling0.00.40.00.00.00.00.01-3Break & shred0.00.00.00.00.40..0..1-3Smoothing the surface0.00.00.00.00.40.30.01-3Regularity
Interior appearance0.00.00.04.0. .0. .43.01-10Crump granulation0.00.30.04.04.333.01-10Crump color4.03.03.000.000.000.000.01-15Texture tenderness. .0. .000.000.000.000.000.01-15Flavor00.000.000.000.004.00.. 003.01-20Taste00..00.000.040.0.0. 0... 030..000Total
2.62*3.07*3.44*5.43*2.52*3.73 *3 .29 *--LSD value16.32%13.78%14.09%14.38%18.02%15.87%12.94%--CV %
All data are the average of 10 specific panelist's evaluation
4. Conclusion
The use of barley bread begins to grow especially inmodern bakeries installed in the center of Baghdad and other bigger states in Iraq. Barley flour was found tocontain high percent of protein, ash and fat, also a reasonable amount of oleic unsaturated fatty acid instead ofother saturated fatty acid which was very important for human health. Increasing the level of barley flour supplementation to 40-60% affects the sensory characteristics (color, thickness and volume) of bread significantly. While, bread made from 10-40% of barley flour supplementation was found acceptable in all quality properties. However, the overall quality of bread remains more acceptable till 60% of barley flour addition for consumers who are aware about their health and nutrition. Other finding in this study was declarethat all barleys breads that bought in all local market as barley bread isfade. The0ther important objective of this study was Verification and search for the truth, that’s barley bread with higher volume and excellent texture that’s sold inlocal markets by checking the chemical analysis of barley flour and compared with wheat flour. It was found that barley flour milled from barley flour did not have any gluten, while the percent of gluten in fade barley flour was 25.0, that’s means is not barley flour theoretically and just specialist person knotweed. Instead of that, the Insisting and investigate the source of the fake barley flour, it was found that flour is sold as wheat flour which imported from Turkey as shown clearly in the picture below. But, cheating bakers make it as barley bread, and also Consumer ignorance about any nutritional information on barley flourled to increased use of this type of flour fake onconsumer health account. So it will be announced through the satellite TV channels for deceiving bakers and warn consumers, especially diabetics and obese persons to quit consuming that kind of bread because it will adversely affect their health and obesity.
5. Acknowledgements
This work was conducted at General Company for Grain Processing / Quality Control / Ministry of Commercial. For their contribution with all chemical, physical and sensory analysis. Also, authors are thankful to the bakery staff and tothe professional bakers who have performed the sensory evaluation of the produced bread.
References
[1] American Association of Cereal Chemistry, 1969.Approved methods of the AACC. Method 10-10,approved April 1961; Method 14-30 approved October 1974. The Association: St. Paul, MN.-
[2] A.A.C.C. (1984).Approved Methods of American Association of Cereal Chemists. St. Poul. MN.
[3] A.A.C.C. (2000).American Association of Cereal Chemistry. Approved Methods of AACC (10th ed.), StPaul,Minnesota.
[4] Anonymous, (2008).Bread World Record (in Germany).www.bivrhenland. De/Brotweltrekord/BWR-WDR-TV 140905.
[5] A.O.A.C. (1990).Association of Official Analytical Chemists 15th ed. of Anayt. Chem. Washington D.C.: Association of Official Analytical Chemist.
[6] Aziz, E. and Mohammed, O. (2013).Utilization of barley (Hordeumvulgare L.) flour with common wheat. Annals of Biological Research, Vol.4(2):119-129.
[7] Bhatty, R. S. (1968). Physicochemical and functional (bread making) properties of hull-less barley fractions. Cereal Chemistry. 63:31-35.
[8] Bhatty, R.S. (1999).Cereal Chemistry 1999, 76(5): 589-599.
[9] Behall KM, Scholfield DJ, Hallfrisch JG.(2002). Fasting glucose and insulin and measures of insulin resistance ofmen after consumption of whole wheat/brown rice orbarley. (Abstract). J Am CollNutr 21:486.
[10] Behall KM, Scholfield DJ, Hallfrisch J. (2004). Lipids significantly reduced by diets containing barley inmoderately hypercholesterolemic men. J Am CollNutr. 23(1):55-62. 2004
Paper ID: ART20164532 DOI: 10.21275/ART20164532 6
of 10 specific panelist's evaluation
barley bread begins to grow especially inmodern bakeries installed in the center of Baghdad and of Baghdad and of
Iraq. Barley flour was found toof protein, ash and fat, also a of protein, ash and fat, also a of
oleic unsaturated fatty acid instead ofother saturated fatty acid which was very important for human health. Increasing the level of barley flour of barley flour of
40-60% affects the sensory characteristics (color, thickness and volume) of bread of bread ofsignificantly. While, bread made from 10-40% of barley of barley offlour supplementation was found acceptable in all quality in all quality inproperties. However, the overall quality of bread remains of bread remains of
60% of barley flour addition for of barley flour addition for ofconsumers who are aware about their health and nutrition.
this study was declarethat all barleys all local market as barley bread is
fade. The0ther important objective of this study was of this study was ofVerification and search for the truth, that’s barley bread with higher volume and excellent texture that’s sold in
checking the chemical analysis of barley of barley offlour and compared with wheat flour. It was found that It was found that It
5. Acknowledgements
This work was conducted at General Company for Grain at General Company for Grain atProcessing / Quality Control / Ministry their contribution with all chemical, physical and sensory analysis. Also, authors are thankful the professional bakers who have performed the sensory evaluation of the produced bread. of the produced bread. of
References
[1] American Association of1969.Approved methods of the AACC. Method of the AACC. Method ofapproved April 1961; Method 1974. The Association: St. Paul, MN.
[2] A.A.C.C. (1984).Approved Methods Association of Cereal Chemists. of Cereal Chemists. of
[3] A.A.C.C. (2000).American Association Chemistry. Approved Methods Paul,Minnesota.
[4] Anonymous, (2008).Bread World Record (in Germany).www.bivrhenland. De/Brotweltrekord/BWR-WDR-TV 140905.
[5] A.O.A.C. (1990).Association Chemists 15th ed. of Anayt. Chem. Washington D.C.: of Anayt. Chem. Washington D.C.: of
International Journal of Science and Research (IJSR) ISSN (Online): 2319-7064
Index Copernicus Value (2015): 78.96 | Impact Factor (2015): 6.391
Volume 6 Issue 2, February 2017 www.ijsr.net
Licensed Under Creative Commons Attribution CC BY
[11] Bjorck, H. Lilijeberg and E. Ostman, British Journal ofNutrition.1999, 83 (Supplement 1):149-155.
[12] Doxastakis, G., Zafiriadis, I., Iraklim, Marlani, H. and Tananaki, C. (2002).Lupin, soy and triticale addition on wheat flour doughs and their effect on rheological properties. Food Cem. 77:219-227.Doi:10.1016/S0308-8146(01)00362-4.
[13] FAO. (1982). Production year book, Roma . Italy. –13-Gary, G. and Veronica, J. Developing barley-fortified wheat based foods. Wheat Marketing Center, Portland, Oregon, USA. P: 1-11.
[14] IS Iraqi Standard, Dried Food Products, Wheat products wheat flour for bread industry.37/1988:2-7.
[15] IUPAC, 2.301, 2.302, (1979). FAO Manuals of Food Quality Control 14/8, pages 274-281/A.O.A.C. 17thed, 2000 Official Method 969.33 and 969.22 Fatty acids inoils and fats preparation of methyl estes/ GasChromatographic method.
[16] Joseph, M.; Melanie, G.; Tatyana, S.; Nathan, K.; Lore, K. and Leslie, C. (2007).The effects ofconcentrated barley β-glucan on blood lipids in a population of hypercholesterolaemic men and women. British J.Nutr.p:1-7.
[17] Makarim, A., Inas, M., Ibraheem, K. and Tamather, H.(2012).Adding wheat germ on bread and sensory properties study. J. Food Industries &Nutr. Sci., 2(1):23-30.
[18] Malomo, S.; Eleyinmi, A. and Fashakin, J.(2011).Chemical composition, rheological properties
and bread making potentials of composite flours from breadfruit, breadnut and wheat. African J. Food Sci. Vol. 5(7):400-410.
[19] Mishra, A. R. Mishra, D. K. Pradhan, S. Jha, R. Chandra, K. Meena, B. C. Nandy, L. Makode, Der Pharmacia Lettre, 2010, 2(5): 371-378.
[20] Pyler, E. J. (1988).Baking Science and Technology, 3rd
Ed. 1 and 11.Sosland Publishing Company. USA, P. 345.[21] Sabeha, H. Al-Jobory.(2010). Effect of addition barley
flour on rheological properties of wheat flour. J.Sci.Tikriet Univ. Vol. 11(3):25-35.
[22] SAS. 2012. Statistical Analysis System, User's Guide. Statistical.Version 9.1th ed. SAS.Inst. Inc. Cary.N.C. USA.
[23] Trogh, C.; Anderson, A., Aman, P.; Serensen, J. and Delcour, J. (2004). The combined use of hull-less barley flour xylanase as strategy for wheat hull-less flour eads with increased arabinoxylan and (1-3, 1-4)b-d glucan levels. J. Cereal Sci. P.O. Box 7051, Se-75007 uppsala, Sweden.
Paper ID: ART20164532 DOI: 10.21275/ART20164532 7
and Leslie, C. (2007).The effects ofβ-glucan on blood lipids on blood lipids on in a in a in
hypercholesterolaemic men and women.
M., Ibraheem, K. and Tamather, H.(2012).Adding wheat germ on bread and sensory on bread and sensory on
J. Food Industries &Nutr. Sci.,
Malomo, S.; Eleyinmi, A. and Fashakin, J.(2011).Chemical composition, rheological properties
Sweden.