the effect of supply chain visibility systems on business
TRANSCRIPT

The Effect of Supply Chain Visibility Systems on Business Processes:A Multi-Case Study Analysis
by
Anna StanchikBachelor of Arts in International Studies, University of Wisconsin-Madison, 2010
SUBMITTED TO THE PROGRAM IN SUPPLY CHAIN MANAGEMENTIN PARTIAL FULFILLMENT OF THE REQUIREMENTS FOR THE DEGREE OF
MASTER OF ENGINEERING IN LOGISTICS
AT THE
MASSACHUSETTS INSTITUTE OF TECHNOLOGY
FEBRUARY 2016
0 2016 Anna Stanchik. All rights reserved.
The author hereby grants to MIT permission to reproduce and to distribute publicly paper andelectronic copies of this thesis document in whole or in part
in any medium now known or hereafter created.
Signature of Author.........................
Certified by................
Accepted by...............
Signature redactedMaster of Engineering in Logistics Program
January 15, 2016
Signature redactedIf Dr. Jarrod Goentzel
Director, MIT Humanitarian Response LabThesis Supervisor
Signature redacted
MASSACHUSETTS INSTITUTEOF TECHNOLOGY
JUN 30 2016
LIBRARIESARCHIVES
(7 C ' Dr. Yossi SheffiDirector, Center for Transportation and LogisticsElisha Gray II Professor of Engineering SystemsProfessor, Civil and Environmental Engineering

The Effect of Supply Chain Visibility Systems on Business Processes:A Multi-Case Study Analysis
by
Anna Stanchik
Submitted to the Supply Chain Management Program
on January 15, 2016 in Partial Fulfillment of the
Requirements for the Degree of Master of Engineering in Logistics
Abstract
As supply chains become more global and complex, it increases the importance of end-to-endvisibility into the material, information, and financial flows of a firm. This work covers variousaspects of supply chain visibility such as current status, its benefits, and the benefit-enablingmechanisms, traced through multiple stages of research, including a survey, roundtable, anddetailed interviews. Specifically, we developed a multi-case study analysis of supply chainvisibility solutions (SCVS) and analyzed its effect on key supply chain processes.
A qualitative "with and without SCVS" framework was employed to understand the changesobserved in key business processes at several companies that recently implemented SCVS. Thiswas combined with a cross-case study analysis to evaluate the effect of SCVS on the efficiencyand effectiveness dimensions of process performance. We found that SCVS has a direct positiveeffect on data management processes via benefit-enabling mechanisms such as automation,standardization, and better raw data. Key operational processes, such as shipment and inventorymanagement, risk management, and procurement and partner collaboration, were affectedpositively by SCVS via the antecedent data management process. The strength of impact ofSCVS on key operational processes varies by company characteristics and the stage ofimplementation of SCVS.
This research is most useful to companies considering implementing an SCVS to understand thepotential benefits of SCVS and the underlying mechanisms. Managers can increase the relevanceand robustness of results by extending the case-study analysis to include more companies withsimilar operating characteristics.
Thesis Supervisor: Dr. Jarrod Goentzel
Title: Director, MIT Humanitarian Response Lab
2

Acknowledgements
I would like to take this opportunity to thank Dr. Chris Caplice, Dr. Jarrod Goentzel, and Dr.Fredrik Eng Larsson for their guidance and insightful discussions throughout this past year. Iwould also like to express gratitude to all the individuals from the different companies for theirtime on the project, offering invaluable data and insights, without which this thesis would not bepossible. Lastly, I would like to thank Dr. Bruce Arntzen, Kirsten Greco, Allison Manning andall the faculty and staff at CTL for their tremendous support, encouragement, and guidance.
I would like to thank Tanya, Rick, Santosh, Anatoly, and Tamara for their love, support, andencouragement during this past year.
3

Table of Contents
Abstract ........................................................................................................................................... 2
A cknow ledgem ents......................................................................................................................... 3
Tables and Figures .......................................................................................................................... 6
1. Introduction................................................................................................................................. 7
1.1 Background and Research Question ............................................................................. 7
1.2 Thesis Scope and Structure .......................................................................................... 8
2. Literature Review ........................................................................................................................ 9
2.1 Concept of SCV ......................................................................................................... 9
2.2 Im pact of SCV on Processes and Perform ance........................................................... 10
2.3 Technology as SCV Enabler .......................................................................................... 12
3. Research M ethodology ............................................................................................................. 14
3.1 Survey............................................................................................................................. 15
3.2 Becom ing Location-A w are Roundtable...................................................................... 16
3.3 Extensive Interview s ................................................................................................... 16
3.4 Intensive Interview s ................................................................................................... 17
4. Results....................................................................................................................................... 21
4.1 Results from Initial Survey ............................................................................................ 21
4.1.1 Current Status of SCV ............................................................................................... 22
4.1.2 Technology and Solutions Providers ........................................................................ 23
4.1.3 Features and Benefits of SCV .................................................................................. 24
4.2 Results from Roundtable................................................................................................ 25
4.2.1 Pre-requisites for SCV ............................................................................................. 25
4.2.2 Technology and Solutions Providers........................................................................ 26
4.2.3 D ata and Exception M anagem ent ............................................................................. 27
4.2.4 Benefits of SCV ........................................................................................................... 28
4.3 Results from Extensive Interview s................................................................................. 30
4.3.1 Com panies Selected for Interview s .......................................................................... 30
4.3.2 Current Status of SCV ............................................................................................... 31
4.3.3 Technology and Solutions Providers ........................................................................ 32
4.3.4 Features and Benefits of SCV .................................................................................. 35
4.3.5 M ethods to Evaluate Effect of SCV ......................................................................... 36
4

4.4 Results from Intensive Case Studies .............................................................................. 36
4.4.1 Company and System Description............................................................................... 37
4.4.2 Key Processes Identified in Intensive Interviews .................................................... 42
4.4.3 Capturing the Effect of SCVS on Key Business Processes ...................................... 44
5 . A n aly sis..................................................................................................................................... 6 1
5.1 Analysis of the Effect of SCVS on Data Management Processes ................................... 62
5.2 Analysis of the Effect of SCVS on Key Operational Processes ...................................... 65
5.3 Analysis Summary and Managerial Implications ........................................................... 67
6. Conclusion and Further Research .......................................................................................... 69
Appendix 1: Definitions of Supply Chain Visibility ................................................................. 71
R eferen ces..................................................................................................................................... 72
5

Tables and Figures
List of Tables
Table 2-1: "Matrix of supply chain technology approach and business fit".............................13
Table 4-1: Details of Participants in Extensive Interviews........................................................31
Table 4-2: List of Key Business Processes and Sub-Processes............................................... 43
Table 4-3: Summary of "With and Without" Results for Shipper 1..........................................49
Table 4-4: Summary of "With and Without" Results for Shipper 2..........................................55
Table 4-5: Summary of "With and Without" Results for Shipper 3..........................................60
Table 5-1: Enabling Factor M echanism s.................................................................................. 62
Table 5-2: Effect of SCVS on Process Performance............................................................... 63
Table 5-3: Effect of SCVS on Company Performance.............................................................65
List of Figures
Figure 3-1: Research D esign and Process.................................................................................. 15
Figure 4-1: Scheme of the Current SCV System at Shipper 1................................................. 38
Figure 4-2: Scheme of the Current SCV System at Shipper 2..................................................39
Figure 4-3: Scheme of the Current SCV System at Shipper 3................................................. 41
Figure 4-4: Framework for Assessing Effect of SCVS.............................................................44
6

1. Introduction
1.1 Background and Research Question
As supply chains become more global and complex, it increases the importance of end-to-end
visibility into the material, information, and financial flows of a firm. While there is no single
definition of supply chain visibility (SCV), the two major themes that dominate SCV are the
exchange of information for decision-making across the supply chain, and the technology that
enables the process of creating visibility.
Most importantly, SCV is to be seen as a means and not an end - ideally, it ought to support
decision-making by allowing companies to act on information that is accurate, timely, and
holistic. Both academics and practitioners agree that increased visibility has a positive impact on
decision-making, and therefore on supply chain performance. At both the systems and process
level, researchers have investigated different ways in which SCV can enhance performance -for
example, improved inventory management, better planning and purchasing, and a reduction in
uncertainty and the "bullwhip effect" in the supply chain. On the technology front, information
and communications technology (ICT) such as the control tower is also a visibility enabler. Yet,
despite sophisticated technology and proliferation of SCV providers, many shippers still face
challenges and uncertainties - not only during selection and implementation stages, but also later
when evaluating the benefits of the implemented supply chain visibility solution (SCVS).
This thesis focuses on developing a multi-case study analysis of supply chain visibility
implementation and its impact on supply chain processes. This work employs a qualitative "with
and without" framework to understand the changes observed in key business processes at several
companies that recently implemented SCVS. To do so, this work utilizes an exploratory theory-
7

building approach and conducts cross-study analysis to identify SCVS effect on processes across
two performance dimensions, efficiency and effectiveness.
1.2 Thesis Scope and Structure
This research can be most useful to inform companies considering implementing SCVS (or
are already in the early stages of implementation) about the potential effects on some of their
business processes. The focus is on the positive impacts of SCVS and does not cover potential
drawbacks, such as security concerns with respect to commercially sensitive information - since
drawbacks tend to surface over time, and are also likely to be addressed by the organization's
response mechanisms.
This research recognizes that changes to business processes and organizational structure at
companies are the result of complex interactions that are often unique to organizations.
Therefore, our findings are general in nature and not meant to be prescriptive or offer concrete
guidance to companies. Also, since this research is qualitative in nature, we do not attempt to
quantify SCV or degree of the impact.
The remainder of this thesis is organized as follows. Section 2 presents a summary of the
literature review on the concept of SCV, its impact on processes and performance, and SCV
technology. In section 3, we introduce the methods used to collect data at different stages of
research. Section 4 discusses the results obtained from the survey, industry roundtable, and
extensive and intensive interviews. Section 5 presents the analysis of the effects of SCVS on data
management and key operational processes, the underling mechanisms, as well as managerial
implications. The last section summarizes findings, identifies limitations, and proposes
recommendations for further research.
8

2. Literature Review
This section is organized in three sections: first, we present the concept of SCV based on the
definitions found in literature; next, we discuss the research on impacts of SCV on processes and
performance; lastly, we provide an overview of the technologies that enable SCV.
2.1 Concept of SCV
Despite significant interest in the topic, and supply chain visibility becoming a "popular
buzzword," academics recognize that there is no unique definition (e.g. Caridi, Francis, Zhang et
al., Goh et al., Barrat & Oke). While presenting their definitions of SCV, different authors tend
to focus on different aspects of SCV. Appendix 1 summarizes the definitions in existing
academic literature and also offers examples of definitions by several research agencies and
consulting companies. Goh et al. explore the terminology in detail and propose "a
comprehensive definition":
SCV is the capability of a supply chain player to have access to or to provide the
required timely information/knowledge about the entities involved in the supply chain
from/to relevant supply chain partners for better decision support (Goh et al., 2009).
This thesis uses this definition and focuses on a company's ability to capture and easily
access relevant, timely, and accurate end-to-end supply chain data, thus providing a single
version of truth in the supply chain that is used for analysis and decision-making.
SCV is increasingly viewed as essential for both short-term and long-term competitiveness of
the company. Zhang et al. acknowledges importance of visibility for both tactical and strategic
decision-making (2008). Tactical visibility "offers the visibility to material flows, finance flows,
inventory level, availability of production capacity and resources in the supply chain," while
9

strategic visibility focuses on the entire organization and collaboration with supply chain partners
(ibid.). This thesis considers the visibility that availability of data brings on the strategic, tactical,
and operational levels. Specifically, the overall strategy and design informs tactical processes
and planning, which in turn sets real-time operational and execution parameters. Output of
decisions and actions on all these levels produces new data that in turn feeds back into each of
these processes for decision-making.
Collaboration with partners and data exchange across the supply chain are at the center of
SCV definition. Caridi points out that "visibility can be considered an enabler for strong SC
relationships" (2014). In turn, collaborative relationships that involve exchange of
comprehensive data between partners were found to lead to improvements in productivity,
customer service, inventory and risk management, and overall marketplace performance (e.g.
Bartlett et. al., Kim et. al.). However, Holcomb et al. note that sometimes there can be difficulty
in establishing even internal visibility, since it is typical for firms' systems to evolve over the
years and often on a functional basis leading to disconnect between various processes (2004,
2011). This research examines partner collaboration as one of the key business processes that is
affected by SCV and offers insights based on in-depth interviews with shippers.
2.2 Impact of SCV on Processes and Performance
SCV, with its real-time or near real-time supply chain information, can help companies to
improve operational efficiency, resource productivity, effectiveness, and customer service
(Holcomb et al.,2004; Caridi, 2010). A primary goal of SCV is to improve performance of the
entire company. Researchers have found that visibility positively impacts many supply chain
10

processes that may ultimately result in overall company performance improvement (Caridi et al.,
2014; Wang and Wei, 2007).
However, SCV does not automatically lead to such improvements. Rather, McIntire proposes
to treat SCV "as a vector of influence on the supply chain operation, which in turn is a vector of
influence on the business outcomes" (2014). Moreover, Barrat and Oke argue that "information
sharing is not directly linked to performance" (2007). The authors suggest that the company
should first validate whether shared information actually provides visibility by being accurate,
timely, and useful. In a positive case, this information can be used to make a more informed
decision, which subsequently may lead to improved performance (ibid.). The model and findings
in this research are consistent with the two-stage approach of linking information sharing with
performance proposed by Barratt and Oke. The companies interviewed discussed improvements
in terms of performance quality and efficiency of time and resource utilization.
Lastly, identifying the processes most impacted by visibility is a critical step for companies.
This helps companies prioritize which information flows to share (Caridi, 2014). The role of
improved visibility in processes within procurement, manufacturing, planning, inventory
management and transportation has been studied extensively in literature. Yet, as mentioned
earlier, the purpose of this work is not to establish an exhaustive list of processes positively
affected by SCV and quantify the impact. Rather, it is to examine how some of the processes that
are important for the company and organizational structure are improved once the SCVS is
implemented.
11

2.3 Technology as SCV Enabler
ICTs play key role in SCV. From a practitioner's point of view, SCV initiatives are a
combination of process re-engineering and technology adoption (McIntire, 2014). Extensive
research documents that IT is an essential requirement for managing and improving efficiency of
multi-echelon networks (Auramo et al., 2005). Moreover, Simchi-Levi et al. suggest that the
objectives of IT in supply chain management are providing information availability and
visibility; enabling a single point of contact for data; allowing decisions based on total supply
chain information; and enabling collaboration with supply chain partners (2008). Therefore, this
work considers SCVS and the technology used, from the perspective of holistic systems that
create a single version of the truth by enabling companies to capture, store, analyze, share and
report end-to-end supply chain data across organizational boundaries.
While technology is at the core of SCV, data management, and collaboration, it should be
treated as an enabler and should not be equated with SCV itself. That is, the technology in itself
is not sufficient to provide visibility - as it does not include the relational factors such as partner
collaboration, corporate culture, and organizational design.
There are many initiatives on information sharing, such as sharing point-of-sale data (POS),
vendor managed inventory (VMI), collaborative planning forecast and replenishment (CPFR).
EDI and XML are examples of technologies that support sharing of information and inter-
organizational communication, while technologies such as RFID help in tracking and tracing
cargo.
In terms of holistic solutions for visibility, there are many different technology options and
providers for companies to choose from. McIntire classifies technology options to acquire SCV
capability into 4 groups - in-house development, off-the-shelf software, SaaS software, or a perk
12

from logistics service providers - and evaluates strengths and weaknesses of each, as
summarized in Table 2-1.
Table 2-1: "Matrix of supply chain technology approach and business fit"
Private Off the Shelf Technology TechnologyDevelopment Technology as a Service as a Perk
High Criticality of Business Needs Good Good Poor Poor
Likely Competitive Differentiator Good Poor Poor Poor
Business Needs are Mature for the Poor Good Good GoodIndustry
Minimal initial investment Poor Poor Good Good
Minimal long term costs Poor Good Poor Good
Source: McIntire, 2014.
Another recent development in the realm of SCV technology is cloud-based solutions and the
control tower approach. Control tower is a term popular with consulting companies - Capgemini
defines control tower as "a central hub with the required technology, organization and processes
to capture and use supply chain data to provide enhanced visibility for short and long term
decision making that is aligned with strategic objectives" (2011).
As implementation of new SCVS requires significant investment of resources and change
management, companies ought to carefully evaluate benefits and costs of various technology
options. Therefore, companies must first assess the current status of visibility, processes, and
objectives and then identify and implement the appropriate technology that fits the nature of their
business and processes the best.
For this thesis, we investigated companies at various stages of implementation and have
confirmed that they use different solutions depending on their needs and objectives.
13

3. Research Methodology
The research undertaken is qualitative and the main method used for analysis is the case
study approach. Yin defines a case study as "an empirical inquiry that investigates a
contemporary phenomenon within its real-life context, especially when the boundaries between
phenomenon and context are not clearly evident" (2003). Case studies are considered an
appropriate methodology for this research for several reasons. First, case study research is
considered most appropriate when the project aims to answer "how", "what", and "why"
questions. In this thesis, we primarily want to study the effect of implementation of SCVS, how
it happens, and why it occurs. This project also met two other conditions for the case study
methodology: that the researcher "is interested in contemporary events and does not have an
ability to control or manipulate behavioral events" (Swanson & Holton, 2005).
The overall case study methodology is structured into two phases - the initial exploratory
phase and the detailed investigation phase. The initial exploratory phase uses administration of
an internet survey, a roundtable, and multiple short extensive interviews, to review the state of
SCV practice in different industries as well as the state of technology. The detailed investigation
phase uses in-depth interviews to focus the research on analyzing the impact of SCVS
implementation on business processes and organizational structure. Figure 3-1 provides an
overview of the research process.
14

I IA I I
- Ieadth 100+ ~30 13 3-C P --- ------------------------------ - - --- ---------
30 questions 1 day 45-60 mins -2 hrs
Survey questions Survey report kicks Roundtable refines Deep dive on issues fromrefined off roundtable Interview questions extensive interviews
Figure 3-1: Research Design and Process
3.1 Survey
The first step was the administration of an internet survey to collect initial data on the state of
current practice of SCV, in particular on how shippers obtain end-to-end visibility for their ocean
bound products, and to identify the gaps in technology and processes. The survey was conducted
between April 10 and April 30, 2015 and administered to approximately 4,000 companies in the
MIT Center for Transportation and Logistics database. We received 160 responses, and most of
the survey analysis presented in this thesis is based on a subset of 78 complete responses.
Survey questions were segmented into three categories: SCV features and benefits, current
status of SCV, and visibility providers and technologies. The results of the survey were analyzed
in a few different ways: descriptive analysis to understand the features and benefits of SCV;
correlation analysis to identify the correlation of satisfaction with the features of SCV; cluster
analyses to identify user types and patterns. The key findings of the survey analysis are
summarized in the Results Section.
15
-9=

3.2 Becoming Location-Aware Roundtable
As part of the initial stage of the research, a roundtable to explore issues and approaches for
achieving end-to-end SCV was conducted by MIT Center for Transportation & Logistics. The
participants in the roundtable represented more than 30 shippers, some carriers, third-party
logistics providers, and a few technology vendors. While the primary focus was on ocean
visibility, the discussions encompassed a wide range of areas, including data collection,
collaboration, and technology.
The roundtable discussions confirmed visibility issues experienced by the shippers that were
identified by the survey, and also revealed some of the root causes. The discussion confirmed
problems in data availability, timeliness, and quality, with the highest gaps in performance
identified in transshipments and ocean freight in South America. For example, some shippers'
containers were "rolled" to the next sailing without notice.
The roundtable also helped understand the issues in the different aspects of technology as
used by each company. For example, one of the major obstacles to achieving holistic SCV stems
from fragmented IT systems across multiple business units and multiple data streams that need to
be consolidated. Some of the other key findings from the roundtable discussion were in the area
of managing big data and exceptions, collaboration with partners, especially carriers, and
evaluating benefits of SCV. The Results section will cover findings from the roundtable in detail.
3.3 Extensive Interviews
The next part of the initial exploratory phase was qualitative research interviews conducted
with 13 companies, across a variety of industries. The interviews were semi-structured with the
main objective to obtain a detailed understanding of the state of practice of supply chain
16

visibility in leading companies from a wide range of industries. Interviews were particularly
useful for in-depth investigation of participants' survey responses and understanding the
decision-making process behind the results.
Most of the interviewees expressed interest in being interviewed for the project in the Supply
Chain Visibility Survey. Some interviewees who did not participate in the initial survey were
selected based on their industry experience and specific knowledge of supply chain visibility.
The companies varied significantly by size as well as maturity of supply chain visibility
deployment. While the majority of interviewees were shippers, some interesting service
providers such as a 3PL, a data provider, and a research & consulting company were also
interviewed. Results Section provides the detailed description of industries and companies, as
well as the job title of each of the interviewees. Company names are not disclosed for
confidentiality purposes.
This phase of research prepared us for further in-depth interviews with the purpose of
addressing narrower and more defined research questions. The insights are based on both within-
case analysis and cross-case analysis and will be incorporated in the Results section of this
thesis.
3.4 Intensive Interviews
Intensive interviews were utilized to conduct a detailed investigation phase of research that
focused on changes in business processes and performance. This method allowed us to study in-
depth systems and changes at a couple of companies. Three multinational shippers and one
freight forwarder/4PL were interviewed.
17

This phase specifically utilizes a comparative case study method, which is characterized by a
small number of cases in their real life context with the data obtained from these cases being
analyzed in a qualitative manner (Dul & Hak, 2008). Interview structure was somewhat
systematic and comprehensive with an outline of topics and issues. However, the researchers
allowed for some variation and the tone of the interviews was fairly conversational and informal.
The research is also positivist in nature, as it is interested in facts and contains a lot of
information questions. Interviews were semi-structured and characterized by different types of
"what" and "how" questions, with most questions being open, simple, and neutral. The funnel
model was utilized, wherein the researcher starts with broad and open-ended questions first, and
as the interview progresses the questions become more specific with the detailed questions being
asked last.
Phone interviews were conducted over 1 hour and interview protocol was shared with
interviewees in advance in order to provide more context and make conversation more efficient.
These in-depth interviews were recorded, transcribed, and summarized in two report forms -
detailed bullet point notes and presentations summarizing key findings. Following the initial
analysis, companies were contacted again in order to obtain any missing information or
clarification and ensure the reliability of this thesis. Data triangulation was assured through the
use of multiple investigators and follow ups to validate data. Finally, the data collected via
intensive interviews was complemented and cross-validated with data either from previous
interviews, survey responses, or notes from the roundtable, depending on the company.
The companies for intensive interviews were selected based on theoretical considerations
rather than random sampling. Based on previous interviews and roundtables discussions, three
shippers that have implemented advanced supply chain visibility solutions were identified as
18

suitable candidates for intensive interviews and case study analysis. Notably, before interviewing
the shippers, the team interviewed a freight forwarder / 4PL who develops and implements
control tower visibility solutions for the shippers. This interviewee's extensive, diverse, and
practical expertise on SCVS helped the research team deepen their understanding of the subject
and prepare the questions for the shippers.
The first interviewed shipper is a manufacturer in hi-tech industry, who is completing a
transition from home-grown system to cloud-based solution. This company participated in both
the survey and the exploratory stage interview. The second shipper is a heavy equipment
manufacturer, who uses advance visibility system with multiple data warehouses and central data
storage. This company also participated in the exploratory stage interview. The third shipper is a
retail corporation that operates chains of stores. The company is proactive with respect to SCV
and heavily relies on advance analytics. This shipper participated at the roundtable.
When selecting the shippers, the research team also ensured that cases met several criteria
identified in academic literature. First, cases had to be exemplary instances of the phenomenon
being studied that provide different perspectives. Second, the process of interest had to be
"transparently observable." Lastly, two other requirements are convenience and accessibility.
The selected companies for the case study were representative in several respects and have some
important commonalities and differences. Specifically, all shippers recently implemented SCVS,
but are in different stages of progression with respect to solution implementation. Also, while
these companies represent different industries, they are all multinational, multibillion
corporations with headquarters in the US. Importantly, their competitiveness strongly depends on
their supply chain network and performance.
19

Once data was transcribed and validated, several methods of analysis were employed. The
first step was within-case analysis, where each individual case analyzed separately. Each
interview was structured in a "with and without" fonnat, which compared the company's major
business processes and organizational aspects both with and without the SCVS. This level of
analysis highlighted which processes were most impacted, to what extent, and why.
Second level of analysis was performed through cross-case synthesis, which is based on
comparison of the cases between each other and theory. All interviews were combined to
observe which processes were most impacted and to what extent, and what were the most
common causes.
Furthermore, the effect of SCVS implementation on the business processes was analyzed on
two performance dimensions - efficiency and effectiveness. For the purpose of this thesis,
effectiveness is broadly defined as the improvement in the quality of the output of the process
over the quality of the inputs to the process. Efficiency, on the other hand, is treated as the
amount of output of the process per unit of resource used by the process - in essence, it about
quantity and reflects how the organization utilizes the resources deployed. However, establishing
precise definition and quantifying these metrics for each business process are not part of this
thesis' objective. Instead, impact was broadly assigned by using a high-level indicator of the
extent of effect - high, medium, or low.
20

4. Results
In this section, we present the key findings from the survey, the roundtable, extensive
interviews, and the intensive interviews. At the initial exploratory stages of the research, we
identify features and benefits of SCV, the technology and solution providers, and the
implications of findings for the subsequent phase of research. In the final stage of intensive case
studies, we deep-dive into the systems implemented at three shippers, detailing the effects of
SCVS on the various business processes. These results are analyzed in the next section to
identify the insights and managerial implications.
4.1 Results from Initial Survey
Survey results were used to provide initial information on current state of SCV, kick off the
roundtable conversation, and identify potential participants for extensive interviews.
The survey questions and results are primarily focused on visibility over the ocean transit leg.
The survey covered the following topics: current status of SCV; the availability and quality of
data; regional variations in real-time visibility; visibility at various milestones during the ocean
transit; providers, technologies and communications channels used; and the features and benefits
of SCV. The survey examined SCV status and capabilities at various milestones during the ocean
transit: gate in, loaded on board, vessel depart, status of assets in transit, vessel arrive, container
discharge, and gate out.
The results for the survey section are presented as follows: current status of SCV, technology
and solutions providers, and features and benefits of SCV.
21

4.1.1 Current Status of SCV
The study revealed many problems in data availability, timeliness and quality. On average,
participants were moderately satisfied with current ocean transit visibility. While nearly half of
the respondents (45%) were less than moderately satisfied with current visibility solutions, only
less than 5% of respondents were "very satisfied" with current visibility solutions.
Correlation analysis was used to identify correlations between different factors and variables.
For example, a higher level of satisfaction is associated with a better access to real-time data and
on-time delivery rate. Bigger companies seem to have better visibility in comparison to smaller
companies. Also, European and NA exporters and importers can be distinguished by the value
they place on different visibility benefits, e.g. "collaboration" is the most important benefit for
European exporters, while "data improvement" is the most important for NA exporters.
Access to real-time end-to-end visibility is also at a moderate level overall, but varies by
trade lane. Very few shippers have exceptional end-to-end visibility across all trade lanes. North
America to Europe has the best visibility across all trade lanes, whereas South America to Asia
has less visibility.
The final delivery of the cargo is reported to be mostly on time with almost a third of the
shippers enjoying 90-100% average on-time delivery across all trade lanes. Notably, shippers
have varying definitions of "on-time" delivery, which is very context specific. However, when
delays happen there is a huge difference in receiving delay notifications depending on the trade
lane. Across all trade lanes shippers typically receive either very low (0-24%) or very high (75-
100%) percentage of advance notifications for delayed shipments.
Overall milestone event updates are mostly accurate across all milestones, but their
availability and timeliness varies by milestone. Only around 40% of respondents receive updates
22

within 12 hours across all events. Very few shippers receive near real-time updates across all
milestones.
Vessel arrival and departure are the most consistent update notifications received by shippers
with respect to both availability and accuracy. However, visibility when assets are in transit on
water is the lowest on both metrics. Moreover, updates on the status of assets in transit take the
longest time to receive (more than 24 hours). This could be either due to port-to-port transit leg
being the most reliable or due to lack of appropriate technology.
4.1.2 Technology and Solutions Providers
Wide variety of communication modes and visibility solutions is available, but only a few are
used. Overall awareness of software solutions for visibility is relatively low with less than 5% of
shippers using integrated automated systems across all milestones. Nearly a third of all updates
are still manual (phone, email) across all shipping events.
SAP and Oracle are the most well-known solutions, though their popularity may not be based
purely on their visibility solutions, while INTTRA and GT Nexus are popular specialized
solutions. In-house systems are quite common and in the absence of strong ROI studies, they
may be hard to dislodge by the specialist software companies. Specialized tracking devices such
as RFID and GPS are rarely used.
Cost concerns and complexity are the main reasons for not implementing visibility solutions,
while security concerns is a secondary reason for not implementing visibility software. This
might be an opportunity for better ROI modeling, as companies are struggling to quantify the
cost and benefits of better end-to-end supply chain visibility.
23

4.1.3 Features and Benefits of SCV
Nearly 60% of respondents identified features such as exception alerts, internal and external
collaboration, enhanced analytics and planning functions, continuous in-transit visibility,
dynamic ETA, and event tracking as at least "very important" (highest rating being "extremely
important"). More than 60% of respondents claim that "exception alerts" are "extremely
important," whereas comprehensive updates such as dynamic ETA and event tracking are less
important, potentially due to information overload.
Benefits of SCV were categorized as cost reduction, risk management, internal and external
collaboration, performance improvement, and enhanced data for planning and decision-making.
Survey results revealed that "performance improvement" and "cost reduction" are the most
important benefits for the shippers. More than half the respondents see reduction in
transportation cost as the source of overall cost reduction. This could be due to high expediting
costs. Despite the ability of supply chain visibility to address exceptions and variability, it is
surprising that risk management is least popular. The survey confirmed that shippers struggle to
quantify the benefits of supply chain visibility.
Correlation and cluster analyses provided additional insights. Participants who evaluate
benefits as important also rank features high. Companies that focus on cost reduction and place
high importance on all features are the largest user groups. Collaboration is the most important
benefit for European exporters, while data improvement is of greatest importance for North
American exporters. The bigger the company the higher the perceived importance of features. It
seems that there is a low correlation between volume of shipments and benefits.
24

4.2 Results from Roundtable
The results from the roundtable conducted in May 2015 are summarized below. They are
categorized into 4 main sections: pre-requisites for SCV, technology and solutions providers,
data and exception management, and benefits of SCV. The roundtable discussion was used to
corroborate initial findings from the survey, expand research topics within SCV, and shape
questions for extensive interviews.
4.2.1 Pre-requisites for SCV
Systematic solutions are required in order to achieve SCV and obtain its full benefits.
Internally, this entails streamlining and standardizing processes across business divisions. Many
roundtable participants, however, noted that this process is complicated by multiple ERP systems
or different IT initiatives across divisions. One of manufacturers revealed that many of the
performance problems it was having with its carriers were caused by problems in their own
systems.
External factors such as issues in upstream and downstream processes also greatly affect
visibility and variability. As summarized by one participant, there are many different fragmented
players, different technologies, and no single standard. Therefore, collaboration with partners is
crucial for achieving SCV and improving supply chain processes overall. Collaboration can help
align parties' interests by sharing risks, costs, and value. For example, a shipper sharing forecasts
with the carrier brings value to both parties by reducing the chance that the shipper's containers
are bumped, while also improving utilization of the carrier's capacity.
25

4.2.2 Technology and Solutions Providers
Companies are looking for tools to process the large amounts of data generated by current
technology, and convert them into actionable information in order to produce data-driven
performance improvement. However, some companies emphasized that in the quest to acquire
advanced SCV solutions, it is important to first assess the readiness of the supply chain. In other
words, without basic pre-requisites such as reduction of internal complexity and willingness to
collaborate in place, pursuing an SCVS implementation may be premature.
When discussing the current SCV solutions used, many shippers highlighted that each
different technology came with its own limitations. While GPS cargo tracking technology
improves in-transit visibility, it is costly and does not provide any contextual data. When it
comes to information sharing, EDI messages are widely used, but can take time to reach the
shipper and also provide only limited set of information.
Other challenges with respect to technology remain. Current tools and technology typically
track only at the level of the entire vessel or a container, and not at the level of an individual
cargo. Supplementary data such as temperature, humidity, and shock, are much harder to obtain,
partly due to a lack of standards.
Four stages of track and trace functionality emerged out of the roundtable:
1. Manually calling the carrier
2. Check websites where shippers last updated the shipment status
3. Real-time information pushed to shippers
4. Event management systems that automatically trigger pre-set actions based on real-
time data
Both the roundtable and survey suggested that most companies were still in stage 1 or 2 (manual
checking of freight status), and there was no indication that stage 4 was successfully attained.
26

4.2.3 Data and Exception Management
The issue of data management received lots of attention, as participants debated where to
consolidate all data streams and how to determine the right types of data that could enable action.
Shippers took one of several approaches with respect to data aggregation: third-party cloud-
based platform, in-house centralized management system, and online portals. A few retailers
agreed that third-party platforms provided the service of aggregating data from multiple external
sources, handling data security, and performing basic analytics, such as highlighting exceptions.
Another shipper manages EDI messages within a centralized PO management system, though
this set up is too slow for real-time capabilities. Another option was online portals that provide
data aggregation and tracking capabilities, where the shipper logs in to a single portal without the
need to establish IT links with each service provider separately.
Another issue in the era of big data is finding the right balance between too much and too
little data. Excessive volumes of data come with excessive costs. In particular, there are
additional set-up and operating costs for the system that collects, processes, and presents the
various data flows. In addition, there are also potential overhead costs due to the excessive data.
Ideally, companies would prefer the capability of managing by exception, but instead they are
inundated with a firehose of data that does not easily enable action.
Shippers at the roundtable found exception management to be crucial. Many companies
emphasized that more information and data does not necessarily help manage shipments and
exceptions, unless accompanied by the capability to drive adaptive actions. Data gaps, delays,
and inaccuracies obscure the real picture of the operational situation and thereby delay adaptive
actions. Predictive tools that allow anticipating disruptive events and exceptions, rather than just
react to events and fix after the fact, are becoming important.
27

There are two different approaches that companies can take to managing exceptions. First,
shippers may prefer to receive raw data from carriers and 3PLs, and analyze the data and detect
problems in-house. For example, one shipper starts with identifying common performance
problems and creating alerts for them. The next step for this shipper would be to codify
responses to an exception, evaluate success of the response, and then to automate it. However, as
one participant cautioned, "perfect" is the enemy of "good enough," and it might be best practice
to focus on the business need rather than the IT functionality. For example, developing business
rules for common categories of exceptions, such as the seasonal fog problem, might be more
cost-effective than investing in an expensive, optimized weather-forecasting system.
A second option for shippers would be to delegate exception management to carriers and
other third party providers, who would take full responsibility for door-to-door movement of the
goods. This option comes down to whether shippers want transportation service as a black box
service. This option requires shippers to inform providers on business rules and exception
thresholds; however, shippers are typically cautious regarding sharing of detailed rules with
carriers.
4.2.4 Benefits of SCV
Since companies cannot manage what they cannot see, all participants agreed that SCV is
crucial to improve supply chain performance and operations. Despite evident benefits of SCV
and the proliferation of solutions, shippers still need to do comprehensive cost-benefit analysis in
order to evaluate if the benefits outweigh costs of a particular implementation of SCVS.
In the roundtable discussion, the benefits of SCV fell into three broad categories. First,
visibility helps companies make short-term decisions such as when managing exceptions. When
28

deviations from the scheduled plan occur, SCV allows shippers to take timely alternate
corrective actions in order to offset negative effect of the exception, thereby reducing expedited
costs such as airfreight. SCV can also help lower local inventory buffers by reducing transit time
variability and giving shippers more certainty about in-transit inventory. Another short-term
benefit is improving compliance, especially for goods that require careful handling, such as food
or pharmaceuticals. More accurate data on the contents of shipments reduces the chances of both
customs penalties and physical inspections.
Second, SCV enables long-term continuous improvements in the supply chain, such as
optimization of network design, reduction in buffers, and streamlining support activities.
Analysis of long-running SCV data on lanes, carriers, and transit times, allows companies
improve their decisions on freight allocation, modes of transportation, and inventory buffers. In
the long run, SCV can also impact overhead costs by replacing manual tracking and reporting of
in-transit inventory and arrival dates with automated visibility. Availability of accurate data on
movement of the cargo can also facilitate more accurate billing of demurrage and detention
charges.
Lastly, some participating companies saw benefits in a one-time diagnostic visibility project.
Even though the picture provided by a one-time diagnostic is only a snapshot of an ever-
changing landscape, it can still uncover correctable flaws in supply chain processes and
operations of the company, its providers, and partners. Most importantly, a short-term diagnostic
application of visibility has much lower costs than the implementation of full-time full-scale
visibility solution, making it a viable option.
29

4.3 Results from Extensive Interviews
The results from the extensive interviews conducted between May and June 2015 are
summarized below. They are categorized into 4 main sections: current status of SCV, technology
and solutions providers, features and benefits of SCV, and methods to evaluate benefits of SCV.
The extensive interviews contributed to the research team's understanding of how SCVS affected
different companies and helped to narrow down questions and participants for the intensive
interviews.
4.3.1 Companies Selected for Interviews
Most of the companies selected for the extensive interviews are large shippers with
headquarters either in the US or Europe. Shippers were from a wide range of industries,
including hi-tech, retail, manufacturing, and energy. In addition to shippers, we also covered
SCV from the perspectives of a 3PL & freight forwarder, a research & consulting company, and
an IT solutions provider. Table 4-1 provides a detailed summary of the interviewed companies.
30

Table 4-1: Details of Participants in Extensive Interviews
# SC Role
1 Shipper
2 Shipper
3 jShipper
4 Shipper
5 Shipper
6 Shipper
7 3PL / FF
8 IT Provider
9 Shipper
10 Consulting
11 Shipper
12 Shipper
13 Shipper
Industry
Hi Tech
Electrical Equipment
Retail
Manufacturing
Processed Food_
Chemical Manufacturing
Freight Forwarding
IT
Manufacturing
IResearch / Consulting
Manufacturing
Freight Forwarding
Energyand equipmenLseCLor
4.3.2 Current Status of SCV
The interviews confirmed some previous findings from the survey and the literature review.
For example, supply chain visibility is not a one-size-fit-all solution, and companies vary
significantly in the maturity of their supply chain visibility systems. However, all companies
recognize the growing importance of visibility into their supply chains and several common
themes emerged during the in-depth conversations.
Real-time or near-real-time visibility is still rare despite the growth of technology and
software solutions in the recent years. The key challenges to attaining real-time visibility and
obtaining a full picture are the integration of supply chain partners into a single system and the
blending or synchronization of different visibility solutions.
31
HQ Company Description IntervieweeSr. Manager, Global Supply Chain Systems;
US Multinational corporation in IT sector IT members
Multinational corporation in electrical Manager, North America Logistics Supplyequipment sector Chain
US Multinational specialty retailer Director, International Logistics
Australia Multinational manufacturer, protection VP, Supply Chainsolutions
US Multinational food production and distribution Sr. Manager, International Logisticscompany ___ - - - -- - -____ _
US Multinational developer and manufacturer of Sr. Manager, Logisticspetroleum additives
Supply chain management and freightEurope [ Implementation Project Managerforwarding solutions provider
US IT / International trade data provider Data Scientist, CTO
I Worldwide manufacturer of rubber flooring Manager, Purchasing and materialGermany
Gma for commercial industry planning
US IT research and advisory firm Research Director
Multinational manufacturer of heavy industry Innovator, Logistics' Research &U equi p ment Innovation; Procurement Managers
Europe Supply chain management and freight Senior Director, Supply Chainforwarding solutions provider Development
US Multinational corporation in oilfield servicesus '~Sr. Manager, Regional Logistics

Information on just the ETA is no longer sufficient. The goal of a well-functioning system
now is to connect not only all sources of data into one system, but also to match the different
shipping references used by various actors, such as purchase orders, bills of lading, or the
container number. Moreover, visibility is required not only of the physical location of the cargo,
but also for the financial, information, and documentation flows.
Data quality and format compatibility are both essential in order to attain supply chain
visibility, irrespective of the sophistication of the software. Multiple interviewees reported that
data inconsistencies in both format and rules are a significant challenge to data interpretation and
reporting. Interviewees noted that there are almost always "multiple versions of the truth" for
any shipment. This is especially true for systems using EDI for milestone reporting. Selecting the
most appropriate "version" is an on-going challenge that technology does not seem to address.
4.3.3 Technology and Solutions Providers
In terms of visibility solutions, the interviewed shippers and forwarders use a wide range of
software and technology solutions to attain visibility into their shipments. Many companies
indicated the use of a combination of solutions and methods instead of a single, standardized
mechanism for ocean freight visibility.
Shippers seem to have three routes with respect to visibility: (1) build their own in-house
visibility system (customized), (2) implement cloud-based solution like GT Nexus, or (3) use a
platform developed by a freight forwarder or 3PL. The traditional software trade-off debate
between customized / in-house vs. standard / Commercial-Off-The-Shelf (COTS) systems is
front and center for visibility solutions as well. All solutions have their certain advantages and
limitations and most of them require both significant up front capital investment and time to fine-
32

tune the system architecture. Therefore, shippers should carefully evaluate the different
approaches to software and select the solution that works the best for them, and is consistent with
their supply chain needs and goals.
Despite a growing number of software solutions on the market, 3PL offerings remain a
relevant intermediary for many shippers. While many companies reported that visibility becomes
worse when they book via 3PL than when they book directly with an ocean carrier, they also
acknowledged that 3PLs fill the gap between the shippers' expectations and the ocean carrier's
capabilities with respect to visibility. Even when the 3PL is not an intermediary link to book with
the ocean carrier on the shipper's behalf, the 3PL has the unique capability to bring all other
pieces together. Recently, more and more 3PLs are acting as a 4PL and offer control tower
solutions or sell their internal visibility capabilities to external partners.
Ocean carriers are also increasingly becoming key players in supply chain visibility. A recent
development is that carriers are trying to differentiate themselves based on visibility service.
Some shippers reported that they have strict scorecards to evaluate carrier performance and
observed varying levels of visibility service from different carriers. Other shippers observed
significant performance deterioration when working with niche carriers and on shipments
involving transshipments.
While survey results indicated that on-time delivery and notification availability vary by
carrier and by lane, interviews reported that they vary also by port conditions. Moreover, lead
times at ports are typically the most variable in the end-to-end ocean-shipping journey, making
visibility at ports quite valuable. This is partly due to widespread port congestions because of
port infrastructure lagging behind proliferation of large post-Panamax vessels. In an extreme
33

case, the recent 2014/15 disruption of the West Coast ports in the US caused shippers to lose
visibility almost entirely, over a long and uncertain period of time.
As per both the survey results and the interviews, EDI emerged as a commonly used
technology, even though it has certain limitations. The primary challenge for EDI is its lack of
timeliness. However, some forwarders noted that the processing speed largely depends on the
logic that is embedded in the systems of customers and providers. If the logic is well aligned,
EDI should not be a stumbling block.
Both shippers and carriers alike revealed that continuous real-time status updates may not be
ideal for high volume shippers, since real-time status updates slow down the system. Therefore,
some companies prefer to work with raw data and static updates that are sent a few times per day
rather than more complex real-time systems. Also, a lower frequency of updates may reduce
costs and thereby be more efficient in terms of outcomes obtained per dollar invested. However,
as a general rule, the frequency of updates preferred by shippers depends on the value associated
with the decisions that they make with the data.
Similarly to survey results, very few companies reported using GPS or Satellite devices as
the technology behind the tracking feature of visibility systems. These technologies are
considered to be an incomplete answer to visibility problems since they have limitations such as
lack of context beyond cargo location. Also, cheaper alternatives such as websites like
MarineTraffic.com can replace some of their key functions. The few firms that use GPS devices,
use them on high-value products over high-risk lanes where the needs and benefits are the
greatest.
34

4.3.4 Features and Benefits of SCV
One of the central topics in the interviews was the various benefits of visibility and the
evaluation of ROI for visibility. While companies agree that supply chain visibility is important
for their businesses, many still struggle to quantify the benefits, and come up with a meaningful
ROL. Overall, expected supply chain visibility benefits appear to be similar across different
regions and industries.
Benefits play a key role on operational, tactical, and strategic levels. Several companies
mentioned that responsive decision-making and timely corrective action are the key benefits of
operational visibility. Visibility at the purchase order level allows for consolidation and
optimization of loads, thereby and increasing container utilization. In general, greater automation
in the tracking process and reduction in manual entries help shippers reduce error.
Benefits at the tactical level focus on better data quality and reliability, which in turn open up
potential improvements in planning and execution. For companies with high holding costs, better
data can lead to significant savings in inventory by reducing variability, providing more insight
into lead times, and improving company's overall control over inventory. Some shippers also use
better supply chain visibility to monitor the performance of service providers that in turn allows
them to make adjustments and reduce transit times by identifying better routes and carriers, thus
improving overall supply chain design.
At the strategic level, some shippers identified improved customer service as one of the key
benefits of visibility. Improved visibility also helps reduce silos within the organization and
enhances strategic decision-making. Also, as risk management becomes more important for
mature organizations, the value that supply chain visibility provides towards managing risk is
becoming more significant.
35

4.3.5 Methods to Evaluate Effect of SCV
Two main methods are observed to quantify the benefits of visibility. Some shippers use
aggregate cost-benefit analysis, while others use profitability metrics for each individual
visibility component. The various components used are automation, standardized data format for
all partners, efficiency in man hours by eliminating manual tasks, additional data availability and
analysis capability, and quicker decision-making. We observe that as operations become more
efficient, companies are more likely to focus on profitability metrics, and perform comparative
"before vs. after" analysis (or "without vs. with" SCVS) to evaluate the margins that each
customer or shipment generates.
Overall, the savings realized from supply chain visibility depend on the maturity of the
company's visibility capability. For companies stuck on the basic transactional point of view of
visibility (managing only where and when cargo should be shipped), the KPIs used do not have
strong financial effect. More sophisticated levels of visibility in a company allows it to focus on
KPIs that reveal waste in the system and thus improve efficiency and translate it into savings.
However, this is not easily done and many shippers struggle to translate visibility into actual
savings and are at best able to only address obvious short-term costs.
4.4 Results from Intensive Case Studies
The results from the intensive interviews conducted between September and October 2015
are summarized below. The section starts with an overview of the companies and their existing
systems and then presents findings on the effect of SCVS implementation on key business
processes at each company.
36

4.4.1 Company and System Description
A. Shipper 1
Company Description: The first shipper is a multinational corporation in the IT sector, and
is a manufacturer and also a provider of consulting and cloud computing services. The company
is headquartered in the US and reported revenues of more than $100 billion in 2014. The
research team conducted one brief 30 minutes interview with the senior manager in global supply
chain network design division, which was followed by an in-depth hour-long interview with him
and four other managers / directors from supply chain, logistics services, and supply chain
architecture and development.
System Description: The company has been working on the implementation of a cloud
platform since 2012 with a focus on logistics visibility and transportation management.
Currently, the old system is still in the process of being phased out and being replaced by the
new SCVS. The old system covered all modes of transportation and received status updates and
information from ERP. The information from the old system was then fed into application
modules to create visibility for customers.
The new SCVS is currently used mainly for ocean shipments, but will be extended for air and
ground transportation as well in the near future. The solution is viewed as a single central
platform that will be used both internally and externally by logistics partners who provide
services and execute operations in different regions. The new SCVS is expected to cover a wide
range of processes, such as inventory transfer, carrier evaluation, and customer ETA updates,
though it currently has only limited functionality from an operations perspective (Figure 4-1).
37

Currently limited Current focus on ocean transportationoperational functionality
Data Management Key Operational Processes
Procurement: Contracts andI Data Collection Carrier EvaluationE l i - * Data Storage & Inventory and Shipment
Reporting Management
Figure 4-1: Scheme of the current SCV system at Shipper 1
Benefits sought from SCVS: The primary concern that prompted the company towards
implementation of the new solution was poor data quality due to complexity and the lack of
standardization on a large scale. The new SCVS has already shown improvement in the
company's data quality, reducing complexity, and driving the company closer towards industry
standards. The interviewees felt that had the company possessed data of good quality, they might
not need a platform of this type.
Shipper 1 feels that internal complexity reduction and having a leaner system are both pre-
requisites and also potential benefits of the SCVS implementation. Specifically, the company
emphasized that implementation of the new solution involved significant business process re-
engineering and change management, in particular working to manage the company's
organization culture and obtaining stakeholder buy-in.
B. Shipper 2
Company Description: The second shipper is a multinational manufacturer of industry
equipment. The company is headquartered in the US and reported revenues over $50 billion in
2014. The research team interviewed a global technology leader, who is directly involved in the
development of the supply chain visibility system.
38

System Description: The current system has been evolving over the years. The current
interface was prototyped approximately three years ago, and is now in the production phase. The
solution comprises multiple systems and providers, including a proprietary homegrown system
that serves as a visibility interface (Figure 4-2). Data is received from approximately 40 different
satellite data warehouses and stored in a format-neutral "central data warehouse." The data in the
centralized warehouse is compatible with the different applications and is used to create visibility
and generate reports.
The visibility system is created and evolves with the goal to provide one integrated view into
the health of the company. The system design supports holistic view and departure from
transactional data towards considering all elements in the context of entire network performance.
Logistics /Transport Shipper
(Internal Business Units)
Set of KPIsRisk Events Situation & Event Module
ProprietarySupplier Data Visibility System
inventory / Sh r's Internalorders AaisGup(internal, External, Curriers)OrdersAnalytics Group
Set of KPIs
Total - 40 DatabaseWarehouses
Figure 4-2: Scheme of the current SCV system at Shipper 2
Benefits sought from SCVS: Shipper 2 has developed a significant portion of the system
without presenting a formal business case, since management was of the opinion that the
potential benefits of the system massively out-weighed the cost. Moreover, the presence of a
39
_1111

supplier-related issue for which SCVS was seen as the solution, prompted the company to take a
"let's go ahead and get it done" approach. Therefore, supplier management is at the center of this
system. In addition, the shipper also sought to create a coordinated view across multiple aspects
of logistics.
There is a recognition that some KPIs are easier to measure and translate into financial
impact than others. For example, inventory turns and expediting costs are easy to track and
translate into financial impact, while impact of higher collaboration is hard to capture. Therefore,
the primary investment justification mechanism was based on inventory calculations, which
evaluated the benefit of reducing inventory by a certain percentage over a certain period of time.
C. Shipper 3
Company Description: The third shipper is a multinational retail corporation with large
number of stores worldwide. The company is also headquartered in the US. The research team
interviewed a senior manager in the global logistics systems division, who is involved in
developing advanced analytics and visibility solutions for the company.
System Description: Most of the current systems and tools that create visibility have been in
use by the company for approximately 12-18 months. The three main systems include an
interface for ocean carriers with a six-week rolling forecast, a database for transactional data, and
internal visibility systems. The internal visibility system has software tools that blend data of
different formats and also analyze it to be used for PO and inventory management. The output
can be transformed into different formats and used for custom visualization through various
other software.
40

Visibility creation is seen as a multi-step process for shipper 3, where the company receives
data from various sources, analyzes it, and uses it to create visibility and manage its supply chain
(Figure 4-3). The first step is to identify business processes and the data needed to support them.
Next, data aggregation is done by the third party providers, such as 4PL or cloud platform
providers, who act as data warehouses. In addition to data aggregation, the providers enforce
contractual data requirements and manage data methodology for obtaining the data. The
providers also help leverage technology to capture all types of data even from supply chain
participants who still provide data manually.
Finally, the company's data division works with internal and external "customers" to
understand their data needs and create customized visibility. Internal visibility management
system creates customized layer on top of the data to present data in a manner that customer
would like to see or understands it. Company systems are set to create full visibility by cross-
referencing different pieces of data.
------------: Original J 3rd Party Data Visibility Systems Users of
Data Aggregators with Custom Views Visibility
Carriers Transactional
Internal Data Datas s
i~ther~~ ~Warehouse ISuppliers W Rolling Forecast Service(Ocean) Providers
Ptner Internal Visibility OtherAnalytics Group Views & Reports Partners
Figure 4-3: Scheme of the current SCV system at Shipper 3
41

Benefits sought from SCVS: Shipper 3 evaluates benefits both in terms of monetary
savings, which for supply chain processes are primarily based on cost or cycle time reduction, as
well as intangible benefits such as collaboration.
One of the primary mechanisms for realizing financial impact is through inventory reduction
by reducing variability in shipments. The new SCVS tool assesses the true cycle time in the
supply chain based on origin-destination, type of cargo, seasonality, etc. This helps manage and
reduce variability and lead time, which in turn reduces replenishment cycle and takes inventory
dollars out of the network.
For intangible benefits, the analytics group in the company provides comprehensive
information to operators, who use it to improve the supply chain. By offering better processes
and better visibility to operators, the system enables them to focus on important issues and
exceptions.
4.4.2 Key Processes Identified in Intensive Interviews
Following the procedure outlined in the methodology section, the intensive interviews phase
focused on the major business processes affected by the implementation of SCVS. During the
interviews, the processes were identified as data management, shipment and inventory
management, procurement and partner collaboration, and risk management. Data management
process emerged as an antecedent process, which acted as an input and enabler to the key
operational processes.
Each business process is further broken down into sub-categories of supply chain processes,
which vary across companies (Table 4-2).
42

Table 4-2: List of Key Business Processes and Sub-Processes
Data management (Antecedent Process)Data collection & storage
Data AnalysisMetrics and Reporting
Key Operational ProcessesShipment and InventoyManagement
Shipment planning and inventory policy
Tracking & Tracing Cargo
Cargo ownershjp transfer
Procurement and Partner CollaborationPartner collaborationPerformance evaluation of carrier / supplierCarrier/ supplier nomination and contract negotiations
Risk ManagementEvent monitoring & exception management
Response and contingency planningDocumentation & Compliance
The data management process includes data collection and storage, data analysis, and metrics
& reporting. During the interviews, data management emerged as the process that was directly
and to the largest degree affected by the implementation of SCVS. In turn, the changes to other
processes were mainly the result of enhanced data management rather than a direct result of new
SCVS. Therefore, we analyze data management as an antecedent process.
Inventory & Shipment Management includes tracking and tracing cargo (especially for ocean
shipments), cargo ownership transfer, shipment planning and cargo consolidation, and lead time
policy review and adjustment. Interviewees differ in the emphasis they place on the various sub-
processes.
Procurement and partner collaboration includes partner collaboration, carrier nominations
and contract negotiation, and carrier and supplier performance evaluation. All interviewed
companies reported greater collaboration with their supply chain partners after SCVS
implementation.
43

Risk management includes exception and variability management, event monitoring,
response and contingency planning, and documentation and compliance. The interviewed
companies were found to be at different stages of utilizing SCV for risk management.
4.4.3 Capturing the Effect of SCVS on Key Business Processes
The data collected from each interview was organized by process, and the effect of SCVS on
each process was captured using the "with and without" framework (Figure 4-4). Specifically,
the framework compares the characteristics of each process, both without SCVS (before
implementation) and with SCVS (after implementation).
The performance of the processes, both with and without SCVS, is based on the outputs over
the inputs and measured on both the efficiency and effectiveness dimensions (as defined earlier
in the methodology section). The effect of SCVS on any process is given by the difference in
performance between with and without SCVS.
Major findings that emerged during the interviews are summarized in a separate table for
each company. This framework of results forms the basis for the analysis in the next section.
Focus I - - - - - - - - - - - - - - - - - - - - - - - - - --Operations WITH SCVS Efficiency & Effectiveness
with SCVSEnhanced Antecedent Process: Enhanced Key Operational Ehne
Inputs Enhanced Data Mgmt Processes I oupt
Enhanced Dat ColctoData Collection Inventory & Shipment
Modified - Data Storage Management -
Organization - Data Analysis Partner Collaboration- Meta is and Procurement A Effidency
Infrastructure, * Metrics & RikMngm tCapital etc. Reporting Ris Managemen A Effectiveness
0Ant n Prces: .eKey Operational Processes M
- -- -- - - - L---Efficiency & Effectiveness
Operations WITHOUT SCVS without SCVS
-4:-F------k---- Asssst---------------------------
Figure 4-4: Framework for Assessing Effect of SCVS
44

4.4.3.1 "With and Without" Results for Shipper 1
A. Data Management
The new system with SCVS has allowed shipper 1 to change the way they manage data and
"discover a lot about the data that they receive." The company has a lot of internal complexity
and a deeply embedded culture of customization based on user needs. Thus, the original system
was extensively customized to meet the specific needs of each user, leading to a multitude of
unique processes for different business units. This had a significant negative impact on data
quality. Moreover, as employees changed positions, eventually often nobody knew how exactly
the system was customized. The new platform, on the other hand, is more about standardization.
Management has set clear expectations that changing one piece affects all customers, thus
customization is done more carefully.
Becoming a data "owner" and changing data collection process was another important
transformation for the company. Before SCVS implementation the company had to ask logistics
providers and carriers to provide updates and relevant shipment information. Thus, process of
data collection was semi-manual with data coming in a variety of formats, often resulting in
"apples to oranges" comparison. After implementation, this need to inquire multiple sources
every time for different pieces of data was largely eliminated, as now the company has direct
access to shipment information stored on a single platform. With the process of data collection
being automated, data receipt is timelier and the company sees a more complete picture on the
shipments. Format inconsistency, data entry mistakes, and manual tasks associated with original
data collection method have decreased.
On a higher level, the new system facilitates "one version of the truth" and consensus within
organization as everyone makes decisions based on the same data. Previously, arguments within
company were not about overall validity of recommendations that business units make, but rather
45

were about underlying data used for analysis. It was common for business units to ask each other
such questions as "where did you get data," "can we trust your data," and "how come my data is
different," which would delay reaching the consensus and making decisions.
Also, the company being a large complex organization, the new solution provides an
important tool to make global divisions to work in a consistent way. Moreover, moving from a
legacy system to a commonly used cloud platform, provides an opportunity to align with
industry standards and benchmark.
The new system has also altered how reporting is done in company 1. The shipper
historically relied on the main report that covered various aspects of ocean shipments coming
into Americas. It had approximately sixty different pieces of information and was used by many
functions, including planning and finance, all of which wanted to include different information.
After detailed evaluation and surveying stakeholders what the information is used for and why,
the report was reduced to the major fifty data fields that were actually used. Thus, the improved
report in the new SCVS provided better and more detailed information.
Overall, the company seeks to migrate from reporting perspective and replace legacy
processes. Employees are encouraged to shift away from exclusively relying on static reports
towards using new SCVS in a more dynamic way now that the system has this capability. At the
same time this shift in reporting culture is expected to drive adoption of the new SCVS.
B. Shipment and Inventory Management
Shipper 1 has improved its tracking and tracing capabilities after SCVS implementation. In
particular, it has achieved better visibility on water by accessing live GPS updates, status alerts,
and better information on shipment arrival. Before, the company had to rely on turnaround time
and the most certain milestone it had - container departure from the port, as a basis for
46
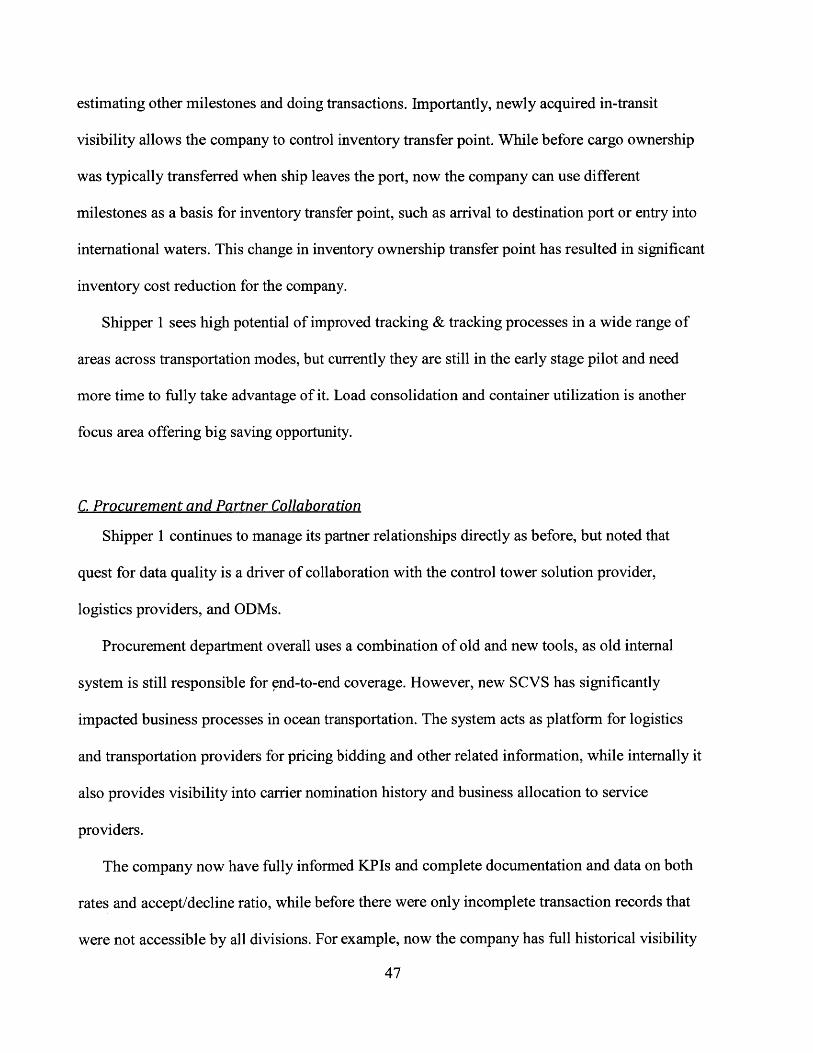
estimating other milestones and doing transactions. Importantly, newly acquired in-transit
visibility allows the company to control inventory transfer point. While before cargo ownership
was typically transferred when ship leaves the port, now the company can use different
milestones as a basis for inventory transfer point, such as arrival to destination port or entry into
international waters. This change in inventory ownership transfer point has resulted in significant
inventory cost reduction for the company.
Shipper 1 sees high potential of improved tracking & tracking processes in a wide range of
areas across transportation modes, but currently they are still in the early stage pilot and need
more time to fully take advantage of it. Load consolidation and container utilization is another
focus area offering big saving opportunity.
C. Procurement and Partner Collaboration
Shipper 1 continues to manage its partner relationships directly as before, but noted that
quest for data quality is a driver of collaboration with the control tower solution provider,
logistics providers, and ODMs.
Procurement department overall uses a combination of old and new tools, as old internal
system is still responsible for end-to-end coverage. However, new SCVS has significantly
impacted business processes in ocean transportation. The system acts as platform for logistics
and transportation providers for pricing bidding and other related information, while internally it
also provides visibility into carrier nomination history and business allocation to service
providers.
The company now have fully informed KPIs and complete documentation and data on both
rates and accept/decline ratio, while before there were only incomplete transaction records that
were not accessible by all divisions. For example, now the company has full historical visibility
47

into situations when procurement team received good rates from carrier, but carrier did not
allocate any space for company's cargo. This additional easily accessible information on freight
cost and nominations allows the company to optimize its ocean transportation spend and supplier
portfolios.
D. Risk Management
Shipper 1 has not yet actively used new SCVS for risk management, but the system helps to
pre-define parameters and thus better manage exceptions. Specifically, better visibility into
processes allows to define expectations, for example on how shipment moves, and thus fine-tune
exception management processes, such as on-route changes and contingency planning.
48

Table 4-3: Summary of "With and Without" Results for Shipper 1
Key Processes (Shipper 1)
Data management (Antecedent Process)
Data collection & storage
Metrics and Reporting
Key Operational ProcessesShipment and Inventory Management
Tracking & Tracing Cargo
Cargo ownership transfer
Shipment planning and inventory policy
Procurement & Partner Collaboration
Partner collaboration
Performance evaluation of carrier /supplier
Carrier / supplier nomination andcontract negotiations
- Via 3rd party
- Manual / semi-manualexecution
- Data at multiple locationsand in different formats
- Limited data
- Inconsistent data andformats across reports andfunctions- Non-standard metrics- Static report- Has to be requested
- Limited on-water visibility- Manual sporadic updates- Multiple information sources
- Poor visibility into containerlocation in-transit leads tocargo ownership transferwhen cargo leaves port
- Limited consolidationleading to sub-optimalcontainer utilization
- Inventory policy andplanning with limited data
- Limited collaboration
- Own data
- Automated receipt
- Multiple sources feeding intosingle platform
- More data available
- Consistent format and dataused across organization
- Standardized metrics- Dynamic data- Readily accessible
- Extensive visibility with livetracking & status updates- Automated / semi-manual- Single source & platform
- Extensive visibility intocontainer location allows forownership transfer at differentmilestones
- Visibility increasesconsolidation and containerutilization
- Inventory policy andplanning done in-house withmore comprehensive data
- SCV forces higher levels ofcollaboration
- System too complex to easily I - Easy to add new providers toadd new provders to thesystem
- Limited record ofcommunication / transactiondata
- Semi-manual process
- Contract negotiation basedon limited data
the system
- Full documentation in acentralized location
- More automation for oceansegment- Based on fully-informed KPIs
Process
- Timely data without need tomake external inquiry- Reduction in manual jobs
- Easy to access and use data
- More complete picture of thesuplly chain
- Improved data quality- Consistent with industrystandards- Complexity reduction- Ease of comparison
- Timely and accurate locationdata- Milestones validation- Ability to provide updates topartners
- Significant cost savings
- Optimized consolidationleads to higher containerutilization ("big & easy" savingopportunities)
- Improved inventorymanagement
- More overall collaborationwith providers and ODMs
- Reduced time, effort to addpartners to system- Reduced cost for partners todo business with shipper
- Extensive capabilities toevaluate and trackperformance- More informed KPIs
- Better contracts- Fully-informed decisions- More optimized cargoallocation to carriers
49
Process without SCV Process jit SCV

4.4.3.2 "With and Without" Results for Shipper 2
A. Data Management
The shipper's system tracks data quality metrics, such as data accuracy and coverage /
availability. The central piece of the SCVS, however, is a closely monitored set of KPIs used for
every element in a supply base and accessible by both internal and external suppliers. These
KPIs cover not only timeliness of shipping out and delivering, but also metrics related to
expediting, inventory, demand, payment, and collaboration.
The metrics have very detailed categorization, for example company tracks late, early, and
without notification shipments. KPIs provide good indication of supply network performance
problems on transportation side. Moreover, interface is designed like a diagnostic tree - if high
level metrics are not right, an employee can easily drill into details of each KPI to investigate the
issue at a much deeper level.
The company realizes that they deal with a complex network of choices on a daily basis, thus
in a new SCVS all metrics are tied together and designed to catch tradeoffs and inefficiencies.
For example, the company does not just want inventory situation to improve, it wants it to
improve in a right way and not at the expense of KPIs in other areas.
The shipper has also leveraged data and process standardization with the implemented
visibility system. Standard data format and business rules facilitate interpretation and decision-
making. For example, rates calculation can be based on different terms and rules, and definition
of "on-time delivery" can mean different things to different partners. The SCVS helps to
establish clear data requirements and manage partner and supplier expectations.
50

B. Shipment and Inventory Management
Shipper 2 has high holding cost, so even a small improvement in inventory management can
have a significant direct impact on financial performance. The system allows to closely monitor
and take into account inventory turns at the company and its suppliers. Reducing uncertainty and
variability looking forward through better visibility and processes helps to reduce inventory.
The company also has better capability to live track inventory with more advanced SCVS.
Tracking and tracing, which is mostly automated with exception for high priority cargo, helps to
make decisions and fine-tune network. Also, accumulating this type of historical data allows to
do more advance analysis, for example on closing probability window vs. distance. In addition,
accurate port arrival information allows to better prepare and synchronize inland port-to-door
delivery, especially for over-dimensional break bulk and ro-ro cargo.
The company currently receives good reports on ocean milestones and events from the third
party visibility provider. The interviewees, however, consider information on physical location
of cargo in transit and milestones not as important as velocity and time frame parameters, such as
days until arrival and deviation from schedule. While traditional data transfer mechanisms, such
as EDI, do not provide this information, new system is supposed to address this shortcoming.
However, even the new system currently has blind spot in terms of reporting velocity and live
updates on location and dynamic ETA. The promised live update service from third party
provider does not work consistently, as it largely depends on the carrier and the lack of standards
in this area further contributes to the problem. This can prevent the company from acting in
advance and taking proactive approach to fix problems.
51

C. Procurement and Partner Collaboration
Shipper 2 places a strong emphasis on collaboration with suppliers and the new visibility
system reflects this. Majority of company's suppliers (more than $15 billion of spend) are
already connected to the visibility system and the company progressively moves towards
connecting entire supplier base. The company provides system access and training to its
suppliers. Notably, both internal and external suppliers have access to the same interface and KPI
information as the company.
Moreover, now performance tracking and evaluation is primarily used to support the
collaborative work towards mutual goals rather than for punitive purposes. The company wants
their suppliers to achieve overall improvement rather than improve one metric at the expense of
another. The portal helps to monitor this type of tradeoffs, as it provides full visibility into all
KPIs that are interconnected.
Importantly, the company reports metrics for both sides, tracking not only supplier
performance, but also its own actions that have impact on the network. For example, one of the
KPIs tracks change in company's demand, which in turn affects parameters for the supplier and
thus may impact its performance. Also, "collaboration" KPI demonstrates what percentage of
time either party deviated from the original plan.
The system also helps to keep track of carrier acceptance / consignment rates. More
importantly, the company is shifting the conversation with ocean carriers from port-to-port
transit time to more a holistic one that covers carrier's consistency in departing and delivering on
schedule and its impact on inventory stock that they carry. For example, carrier can be perfect on
port-to-port time, but still negatively affect inventory metrics because of delayed discharge at the
port. The SCVS not only helps the company to collaborate with carriers as with providers of
ocean service, but also places the interaction in the context of overall company performance.
52

The new system has a positive impact in several ways. First, everyone operates off the same
definitions and knows exactly how each metric, such as on-time delivery, is calculated. While
suppliers' performance have always been measured by the company, only now suppliers have
full visibility into exactly the same information as the company. This helps to create one version
of the truth and eliminates previously relevant argument of "my KPI vs. your KPI." In addition,
new system helps suppliers to understand their role in a larger system. This facilitates the process
of the company and supplier agreeing on what and how to improve together.
Moreover, the portal allows to create additional supplier metrics by tracking how suppliers
interact with the system (e.g. how often they use portal, which information they use the most,
etc.). This is closely monitored by newly created analytics group within supply network space
and allows to provide additional feedback to the suppliers. As a result of all of the above, the
company reported ratio of supplier KPI improvement with visibility vs. without visibility as 4:1
on all 9 metrics.
D. Risk Management
SCVS helps shipper 2 to be more proactive in risk management, enabling managers to detect
and deal with disruptions. The company specifically implemented "situation and event" feature
for active risk management globally. The feature demonstrates all types of past, current, and
anticipated events that can disrupt the transportation and supplier network along with
calculations of anticipated impact and potentially affected shipments or parts. Company's system
receives updates from external sources on a wide range of events, such as natural disasters,
storms, fire alarms, and police calls. It also allows to project time before running out, inventory
levels, consumption rate, and time to replenish. The information is provided both on high level
and local level with an option to drill down into granular details. This information not only
53

triggers internal system to look into event and evaluate the impact, but is also tied to suppliers'
KPIs.
This type of visibility allows the shipper to take proactive approach. For example, the
company closely monitored West Coast port strike situation and was able to re-plan most of
ocean traffic to avoid delays. From operations stand point, the company typically does not re-
route shipments in transit, but rather changes the strategy going forward on handling next orders.
Better visibility also allows reduction in expensive expediting, especially airfreight. Full
visibility and as a result better situation control, prevents over-reaction and allows the company
to focus on more strategic issues rather than "firefighting."
54

Table 4-4: Summary of "With and Without" Results for Shipper 2
Key Processes (Shipper 2)
Data management (Antecedent Process)Data collection & storage
Data analysis & reporting
Process without SCV
- Time-consuming to collect all data forevaluation
- Based on transactional data
- Takes time to perform limited analytics
Process with SCV
- Quick access to all data- More data available for decision-making
- Data in the context of entire network providesintegrated view across multiple dimensions- Data is in standard format and standard
business rules are being applied- New functions within analytics group analyzeadditional data
- Facilitates faster and informed decision-making
- Holistic approach to metrics and visibility- Facilitates interpretation & decision-making- Heps understand why system behaves in acertain way- New organizational capabilities, e.g. a newanalytics group was formed
'Key Operational Processes
Shipment and Inventory ManagementTrack & Trace - Insufficient live-tracking capability - Improved, though not perfect live tracking of - Helps make decisions and fine-tune network
inventory
- Basic inventory planning capability - System allows to project inventory levels,
Shipment and inventory planning consumption rate, replenishment time - Helps to reduce uncertainty and variability- Lack of visbility into internal and - Close monitoring and incorporation of looking forward, thereby reducing inventory
external inventory turns inventory turns at the shipper and its suppliers
Procurement and Partner Collaboration- Suppliers are not connected to the - Majority of suppliers connected to shipper's - Suppliers have better understanding of the
Partner collaboration shipper's system system requirements and the overall network- Supplier performance improves dramatically
- Limited ability to collaborate holistically - Common platform supports close once they use the systemcollaboration - Collaboration increased
- Limited number of KPIs and limited - Set of comprehensive KPIs tracks actions and - Integrated, holistic metrics with insights into
Performance evaluation of carrier / ability to monitor supplier performance performance of both suppliers & the shipper entire enterprise performance
supplier - Covers both high-level information and lower- Different definitions and metrics used by level details - "One version of the truth": suppliers anddifferent parties, since suppliers don't have - Suppliers have access to the same KPI data as shipper work with the same data andaccess to KPI data shipper definitions
Carrier / supplier nominations and - Purchasing based purely on lower cost Purchasing dept. evaluates all relevant - Holistic purchasing strategy
contract negotiation supplier data and impact on the entire network - New goals and metrics for purchasingon multiple dimensions function
Risk Management- No defined process for monitoring - Single system with data on past, current, and - Enables proactive approach with
Event monitoring & exception events that may disrupt network anticipated events that may disrupt network and contingency planning done in advance
management - No single platform available to store their potential impact - Allows altering strategies for futureevent data shipments
Response and contingency planning - Limited ability to do proactive Incoming data on events alerts the system - Minimizes impact of disruptive events
contingency planning - Less expediting costs such as airfreight
55

4.4.3.3 "With and Without" Results for Shipper 3
A. Data Management
SCVS system in company 3 helps to create analytics and metrics that are needed by
customers and end users. Data management and analysis largely relied on Excel in the past.
Analysts used to spend significant part of their work day pulling data, uploading it in Excel,
filtering and interpreting. Moving away from Excel towards more automated tools to aggregate
and analyze large amount of data has allowed to perform a more detailed analysis.
After system implementation, analysts now have to work with small percentage of relevant
data and can start with managing exceptions rather than spending half of the day trying to get
from 100% of data to small percent of important data. Significantly, new tools allow to perform
analysis and make decisions based on all data, while before the system could only process data
sample that is not necessarily a representative dataset. This new capability allows to answer
questions that have never been asked before and change the way business units make decisions.
The primary prerequisite for visibility is obtaining managed data that is clean, accurate, and
contractually stipulated. The company wants the best data in all areas of business and sets
contractual expectations about data timelessness and accuracy. While the company's system is
set up such that it is the sole owner of the data, it recognizes that sometimes the party that is the
closest to the data is better placed to deal with that data. For example, ocean carriers are
perceived to be in the best position to provide data on cargo during ocean transit.
The company has also focused on getting their providers and partners to manage and provide
data in a standardized way. In particular, before many partner companies used to transfer data
manually and in a variety of formats (e.g. email or flat file). As part of the effort to improve
visibility and data systems, the company required and helped its partners to transition to EDI
56

with automated transfer. This transition not only provided the company with better data, but also
helped many of their partners to modernize with respect to data standards, which helped to move
forward larger business community.
B. Shipment and Inventory Management
Shipper 3 has visibility across various event milestones (when factory booked cargo, when it
was loaded, etc.) and currently reviews all international cargo coming to the US, with plans to
extend coverage to other regions as well. In addition to this, it also allows to see how long it
takes on average for a distribution node to unload and receive product into computer system,
moving it from in-transit state to inventory state.
The new SCVS and data management tools also enabled shipper 3 to improve its inventory
policy decision-making process. Process of reviewing and adjusting lead times has been in place
for about 20 years, but the availability of data to benchmark supply chain effectiveness and
ability to do a quarterly review based on comprehensive data has been in place for international
piece for only a year. Previously, adjustments were not made on a routine basis, but only when a
significant event or variation occurred. It was more of an ad hoc process based on "tribal
knowledge" using spreadsheet analysis that took time, which was largely due to the lack of data
to support tool on the required level.
The system has supported implementation of a holistic process with recommendations being
made based on data analysis and reviewed by key stakeholders before final policy adjustments.
The company now has both more data and systematic powerful tools that enable quicker and
easier analysis. As a result, the company is able to make inventory policy and particularly lead
time adjustments quarterly. In this case, availability and usability of data helps to effectively use
57

it to manage supply chain. As a result, it helped to improve internal metrics in the past year - for
example, percentage of on time arrival went from 45-55% to within 97%.
C. Procurement and Partner Collaboration
The system in company 3 allows to scorecard carriers based on more data and advise them on
their performance relative to other carriers. Thanks to holistic data system and visibility into end-
to-end network, the company often has better data on carrier performance and shipments (e.g.
on-time reliability, offload rates, etc.) than carriers themselves. The feedback from the shipper
helps carriers to identify issues within their network and improve.
In terms of carrier nomination, SCVS with more data and well-informed metrics helps to
evaluate and make business decisions on whether to utilize carrier for a certain business or not.
For annual ocean contracts, procurement team is now armed with a complete set of metrics on
how carriers perform overtime.
As mentioned in the section on data management, company 3 also worked with its service
providers and partners to foster transition to automated data transfer in a standardized format.
While the participation rate in the first year was less than expected, since many partner
companies did not want to invest in new technology, in the long run it is expected to benefit all
parties.
D. Risk Management
Shipper 3 uses visibility to manage variability due to both seasonal known events and
unexpected disruptive events. The company tracks seasonal weather events globally and either
develops mitigation strategy or creates a window where supply chain becomes more extended to
58

account for variability. For disruptive events the system helps to get quick visibility into
potentially affected shipments - their location, POs, and expected impact.
On a daily basis, the new SCVS helps to manage exceptions, in particular shipments that fall
out of arrival range. Before the system was not capturing reason behind late or early arrival, so
the exception went either unexplained or analysts had to spend time to determine reasons. The
new system has reason coding built behind exceptions, which allows to quickly address them and
plan better for future shipments.
While compliance improvement was not one of the goals when implementing new system,
additional data naturally helps company 3 with documentation and compliance. First, visibility
and clean data from partners helps to kick off processes within customs compliance realm.
Second, the system helps to manage safety and health regulations, in particular for perishable
cargo, as now the company has quick access to detailed information on pick up time, location,
temperature, packing and can associate it with POs.
59

Table 4-5: Summary of "With and Without" Results for Shipper 3
Key Processes (Shipper _
Data management (Antecedent Process)
Data collection
Data analysis
Process without SCV Process with SCV
- Data exchanged in various formats - Data transferred automatically inmanually standardized EDI format
- Analysis based on small data samples - Consider and process comprehensive- Spreadsheet based analysis - Replaced spreadsheets with more
powerful tools
oltProc
- Better, standardized data for both the shipper andpartners
data - Able to do more detailed analysis on full data- Eliminated many day-to-day tasks related to data
analysis, allowing focus on exception managementand process improvement
Key Operational ProcessesShipment and Inventory Management
Track & Trace
Lead time review and policy adjustment
Procurement and Partner Collaboration
Partner collaboration
Performance evaluation of carrier /supplier
- Limited visibilty on only a fewmilestones
- Lead time adjustment done on adhoc basis when large variation noticedor big event occurs
- Process based more on "tribalknowledge" and spreadsheet analysis
- Data exchanged in various formatsmanually
- Less informed metrics based onlimited or sub-optimal data
- Visibility into all major milestones
- Routine lead time adjustment on aquarterly basis
- Standardized process supported by dataand powerful analytics tools
- Partners required to transfer dataautomatically in a standard EDI format
- More data that is easier to process
- Performance tracking over time
- Ability to tie metrics from differentpartners / shipping legs together
- Know how long it takes to move inventory from in-transit to in-stock state
- Lead time analysis done faster and in a moresystematic way- Availability and usability of data helps to createmore holistic process to create inventory policy- Informed recommendations based on data has
helped improve performance metrics
- Helped partners modernize their datamanagement systems
- Able to create complete set of fully-informedmetrics & holistic view of the system- Fully informed scorecard & benchmark system forcarrier evaluation- Partners are provided with detailed holisticfeedback- Carrier selection & ocean contracts are based onfully-informed metrics
Risk Management
Exception management - System didn't capture reason behind - Reason coding behind exceptions - Able to quickly find and address reasons behindshipment falling out of arrival range implemented exceptions
Variability management & contingency - Limited and sup-optimal data to - For known & seasonal events system - More prepared to mitigate variability
planning support the contingency-planning allows to better track & evaluate variability - Able to create full picture on particular unit ofprocess - For unexpected disruptive events, able to cargo
quickly associate all pieces of information - Better & faster visibility into cargo affected byfrom different sources disruptive events
Documentation & Compliance - Limited and sup-optimal data to - More data of higher quality & better - Clean and timely data helps to manage compliancesupport the compliance process access to support compliance processes & documentation more effectively
60
0

5. Analysis
In this section we analyze the results observed in the previous section to develop insights and
implications.
The framework proposed in the results section identified data management as an antecedent
process to the operational processes. Therefore, we utilize slightly different approaches to
analyze the effects of SCVS on data management vs. key operational processes. For the
antecedent data management processes, we analyze the effect of SCVS on process performance
across two dimensions - efficiency and effectiveness; and for the key operational processes, we
analyze the consolidated effect of SCVS on business performance.
SCVS affects data management processes and key operational processes via enabling factors.
Enabling factors are the mechanism by which these processes are improved, thereby providing
the benefit of implementing an SCVS.
As an example, shipper 2 acquired many companies over the last few years, which
significantly increased the complexity of the supply chain network. Total spend for logistics and
transportation approximately doubled over the last 8 years. However, despite added complexity
and volume, the company did not have to add more staff to manage everything moving on the
network - which was due to increased efficiencies. Therefore, the effect on performance for
shipper 2 is "high" under "efficiency" and enabled by such factors as "better tools" and "better
data."
The rest of the analysis section first describes analysis for data management process; then
analyzes the effect of SCVS on key operational process at both the individual company level and
at the aggregate level; and finally, presents a summary of insights and implications.
61

5.1 Analysis of the Effect of SCVS on Data Management Processes
The various enabling factors for improving the data management processes that emerged
during conversations with the companies are listed in Table 5-1.
Table 5-1: Enabling Factor Mechanisms
Enabling Factors Description
Transformation of manual tasks in the process into a more automatedAutomation md
.r a Single platform for data storage and availability in a central location asopposed to multiple platforms and many locations
Internal standardization Standardization of data and processes within the organization
EAlignment of the company's data standards and processes with industryExternal standarization standards and best practices
Better data Improved availability and/or quality of relevant data
Better tools Improved tools to manage the available data and other processes
On-demand access Easy access to readily available information
Table 5-2 provides a summary of the effect of SCVS on the various data management
processes, with its corresponding enabling factors. Since the effect of SCVS on the various data
management processes was somewhat consistent across companies, we do not break out the
effect across each company. However, we aggregate the magnitude of the observed effect across
all interviewed companies, in order to provide a sense for which data management processes are
affected the most, and which enabling factors are more common. The aggregated analysis allows
us to infer the likelihood of expected effects on various data management processes and the
enabling factors in any new SCVS implementation.
62

Table 5-2: Effect of SCVS on Process Performance
Data Management Effggss PeormancePatcMssemeEfficiency EffectivenessProcesses -FEfcE____ ___
Enabling Factors Effect Enablig Factors EffectAutomation
Data collection & storage Centralization High I External standarization HighInternal standardization
Data Analysis Better tools ig Better dataOn-demand access Better tools
Metrics and Reporting On-demand access Med Internal standardization HighInternal standardization External standarization
The effect of SCVS on the data management processes was generally high for all processes
on both the efficiency and effectiveness dimensions. This is because better data performance is
one of the key benefits of SCVS, which has a direct and primary impact on the data management
processes.
Within the data collection and storage process, the commonly occurring enabling factors for
improving efficiency are automation and centralization, whereas for effectiveness it is external
standardization. Across all three companies, replacing manual data collection with automated
process helped reduce the time employees spend on this task - freeing up time for more value
added tasks and reduces errors due to manual data entry. Furthermore, centralized data storage
facilitates access and reduces the time employees spend on accessing and gathering various
pieces of information. Internal standardization also contributes to greater efficiency, as
employees have to deal with fewer data formats on a daily basis. External standardization helps
companies move closer to best practices, thus improving the quality of outputs.
The next stage of the data management process is the data analysis process. Firstly, the
SCVS provides better data quality and availability across all three companies, allowing for more
informed decisions, thereby impacting effectiveness. Better tools seem to impact both efficiency
and effectiveness. Two companies at a later stage of SCV software implementation found that
63
LU
I

better tools help significantly with day-to-day data analytics, allowing employees to manage only
exceptions. Therefore, the SCVS helps to improve efficiency by increasing time utilization and
the return on an individual's time. In terms of effectiveness, better tools which have more
functionalities and greater capabilities leads to better quality outputs. Lastly, on-demand access
affects efficiency by reducing cycle time for analysis to be completed, and making faster
decision-making possible.
For the metrics and reporting process, the main efficiency enabling factors are on-demand
access and internal standardization, while for effectiveness, they are internal and external
standardization. For example, shipper 2 noted that employees can consume more information and
make more decisions in the same amount of time. Here system design, in particularly on-demand
access that provides all critical information fast, plays a crucial role. In particular, without SCVS,
a comprehensive evaluation of a single supplier could take up to two months for one person to
gather the required information, whereas it now takes only "two clicks."
Internal standardization also positively affects both the efficiency and effectiveness. It leads
to rationalization of metrics and reports, which is significant for improving efficiency in
companies, since they do not have to track multiple variations of metrics. This enabling factor
also facilitates silo reduction and helps internal business units and external partners operate off
the same metrics and reports, which can be used to make both operational, tactical, and strategic
decisions. As mentioned earlier, external standardization allows for aligning with industry best
practices, thereby improving the effectiveness of the process.
64

5.2 Analysis of the Effect of SCVS on Key Operational Processes
A slightly different approach is taken for analysis of effect of SCVS on key operational
processes. First, efficiency and effectiveness are not distinguished for evaluation of operational
processes, because they are closely related and hard to distinguish based on the information
available. Second, most of the enablement occurs through the improvement of the antecedent
data management process - therefore, we do not identify any other enabling factors separately.
Instead, based on the findings identified in the results section, we first evaluate for each
company whether there was a significant (High), moderate (Medium), or marginal (Low) effect
of SCVS on each key operational process. We then aggregate the results across all case studies in
order to identify the typical magnitude of the effect of SCVS implementation on company
performance that can be expected for a new SCVS. Table 5-3 provides a summary of the effect
of SCVS on all key operational processes across all shippers, as well as aggregate effect on
company performance.
Table 5-3: Effect of SCVS on Company Performance
Effect of SCVS on Company Performance Aggregate Effect of
Key Operational Processes SCVS on CompanyShipper I Shipper 2 Shipper 3 Performance
Shipment and Inventory Management
Shipment planning and inventory policy H H H H
Tracking & Tracing Cargo H M H H
Cargo ownership transfer H - - L
Procurement and Partner Collaboration
Partner collaboration M H M M
Performance evaluation of carrier / supplier H H H H
Carrier / supplier nomination & contract negotiations H H L H
Risk ManagementEvent monitoring & exception management L H H H
Response and contingency planning L H M M
Documentation & Compliance L L M L
65

At the aggregate level across all three case studies, risk management processes seem to be
slightly less affected by SCVS implementation than both shipment & inventory management and
procurement & partner collaboration processes. This might partly be due to risk management
being improved typically only at the more advanced stages of SCVS implementation. This is also
consistent with the survey finding that the risk management category is perceived among
companies as the least important benefit, since most of them are at early stages of SCVS
adoption.
Within risk management, event monitoring and exception management sub-processes seem
to be strongly affected by SCVS. This might be because companies are actively looking for this
feature in SCVS, as confirmed by shippers' rating of exception alerts as the most important
feature of SCV in the survey, which was also echoed during roundtable discussions.
At the level of each company, within the shipment and inventory management process,
shipment planning and inventory policymaking was affected significantly across all companies,
albeit in slightly different ways. Shipper 1 was able to improve container utilization and
consolidation metrics, as well as utilize more comprehensive data to inform its inventory policy
overall. Shipper 2 highlighted how more and better data on inventory metrics helps reduce
uncertainty and variability. Shipper 3 is now able to utilize more data and better tools to improve
lead time analysis and inventory policy overall, which is reflected by improved performance
metrics.
Within the cargo tracking & tracing sub-process, shipper 1, whose system focused on ocean
shipping, noted a significant improvement in its ocean transit capabilities. Shipper 3 was also
able to take advantage of the improvements that SCVS offered in this area. Shipper 2, however,
66

found the improvements to be moderate, due to gaps in what the company needed vs. what the
SCVS provided.
Shipper 1 also had significant benefit from improved performance of the cargo ownership
transfer sub-process. However, due to the nature of the contractual terms with their suppliers, the
other two shippers did not experience a significant impact.
Within the risk management process, SCVS had a significant effect on the event monitoring
& exception management sub-process for both shipper 2 and shipper 3, but not for shipper 1.
This is largely due to shipper 1 being in early stages of implementation with a focus on only a
few modules of software. On the other hand, shipper 2 has recently added risk management
module with extensive capabilities, including response and contingency planning, which helps
shipper 2 to manage network risks more efficiently and effectively.
All sub-processes within the procurement and partner collaboration process are affected by
SCVS across all cases. In particular, performance evaluation of carriers and other suppliers was
significantly impacted in all interviewed companies. This is because after SCVS implementation,
shippers have full data on provider's performance and therefore more informed comprehensive
KPIs. Notably, shipper 2 experienced high effect of SCVS on all 3 sub-processes, reflecting the
emphasis that shipper 2 places on partner collaboration and work with suppliers.
5.3 Analysis Summary and Managerial Implications
Overall, the findings from the analysis of intensive interviews have been consistent with
findings from previous stages of research. The cross-study analysis shows how some processes
were strongly affected by SCVS across all companies, while for other processes, the effects were
varied. Data management process, being one of the primary features and targets of SCVS, has
67

been strongly affected across all companies via multiple enabling mechanisms. Improvements in
data management enable key operational processes, which in turn can translate into superior
company performance.
Among operational processes, we observed greater variability in terms of the impact. One of
the reasons is that the type of company and products it ships dictates which processes are
prioritized and affected more. For example, for a company shipping food products or
pharmaceuticals, documentation and compliance is priority issue, and therefore the visibility
solution would reflect that. On the other hand, inventory policy improvement would be a priority
for company with high inventory costs.
Another factor that explains the variation in impact of SCVS on key operational processes is
the stage at which the company is at with respect to solution implementation and current state of
data management. If a company recently started an SCVS implementation, then we do not expect
it to prioritize more advanced features of visibility such as compliance or contingency planning.
For example, shipper 1 is still in the pilot stage with most of the implementation only on the
ocean segment of transportation. Therefore, it has not yet seen dramatic change across business
processes in terms of headcount, types of roles, effectiveness and duration.
Overall, for new SCVS implementations, we can typically expect high impact on both
efficiency and effectiveness across all data management processes. For shipment & inventory
management and procurement & partner collaboration processes, companies can expect
significant impact, while for risk management, the effects depend on how advanced is its data
management process and the stage of implementation.
68

6. Conclusion and Further Research
This research covered several aspects of SCV solutions, including their effect on key
operational processes and antecedent processes, tracing through multiple stages of research from
survey to roundtable and in depth case studies.
This work found that SCVS has a direct positive effect on efficiency and effectiveness of
data management process via multiple enabling factors, such as automation, standardization, and
better raw data. Key operational processes were affected by SCVS mostly indirectly via data
management process. The research identified shipment and inventory management, procurement
and partner collaboration, and risk management processes as operational processes that were
affected by SCVS the most. However, the strength of impact on these processes, and therefore on
company performance, typically vary by company characteristics and stage of implementation.
The in-depth case studies were limited to only three shippers. However, since a significant
overlap in the areas of impact was observed among the three companies, we do not expect to see
any substantial increase in the areas of impact with the addition of more case-studies. However, a
larger dataset will provide a more robust analysis and statistical significance of the relative
importance of affected processes and their enabling factors.
Furthermore, causal analysis on a larger dataset of companies varying by industry, size, and
the stage of SCVS implementation could provide more specific managerial insights on what a
particular company could expect when considering SCVS implementation, based on its operating
characteristics.
Another area of research that would be useful to companies considering implementing SCVS
is evaluation of the financial benefits of SCVS. During the various stages of research, companies
repeatedly mentioned the difficulties of building a business case for SCVS implementation.
69

While this work attempted to evaluate the effect of SCVS at a high level by looking at process
efficiency and effectiveness, it would be of interest to also quantify the financial impact of SCVS
on a company, utilizing a similar "with and without" framework.
The insights developed in this thesis will help companies that are considering implementation
of SCV solutions, or in early stages of implementation, to understand what type of benefits they
may expect and why.
70

Appendix 1: Definitions of Supply Chain Visibility
Supply Chain Visibility Definition
A process of four meta-steps: capture data, integrate data, create intelligence, andinterrupt decisions. Either the data being collected or the decisions beinginterrupted should be supply-chain oriented, and should span outside of a singleorganization's boundaries.
SC visibility relates to the ability of the focal company, i.e. the supply chain leader, toaccess / share information related to the SC strategy and the operations of SCpartners.
The ability, usefulness, usability, timeliness, trust, and accuracy to exchangeinformation between supply chain partners.
The capability of a supply chain player to have access to or to provide the requiredtimely information/knowledge about the entities involved in the supply chainfrom/to relevant supply chain partners for better decision support.
The identity, location and status of entities transiting the supply chain, captured intimely messages about events, along with the planned and actual dates/times forthese events.
The ability to provide the latest relevant information/knowledge to all supply chainpartners for collaborative decision making.
The extent to which actors within a SC have access to or share information whichthey consider as key or useful to their operations and which they consider will be ofmutual benefit _________ _________
The degree to which supply chain partners have on-hand information related todemand and supply for planning and control management.
The sharing of all relevant information between supply chain partners, also overechelons in the chain.
The ability to be alerted to exceptions in supply chain execution (sense), and enableaction based on this information (respond).
Capturing and analyzing supply chain data that informs decision-making, mitigatesrisk, and improves processes.
Visibility means that important information is readily available to those who need it,inside and outside the organization, for monitoring, controlling and changing supplychain strategy and operations, from service acquisition to delivery.
Direct insight into the status of orders, inventory and shipments across the supply
chain.
Reference
McIntire (2014)
Caridi et al. (2014)
Pidun and Felden (2012)
Goh et al. (2009)
Francis (2008)
Zhang et al. (2008)
Barratt and Oke (2007)
Hsiao-Lan and Wang
(2007)
Kaipia and Hartiala (2006)
McCrea (2005)
Tohamy (2003)
Schoenthaler (2003)
Bradley (2002)
A capability that provides controlled access and transparency to accurate, timely
and complete plans, events and data - transactions, content and relevant supply Gartner (2015)chain information - within and across organizations and services to support
effective planning and execution of supply chain operations.
The awareness of, and control over, specific information related to product orders
and physical shipments, including transport and logistics activities, and the statuses Aberdeen Group (2013)
of events and milestones that occur prior to and in-transit.
Supply Chain Visibility is all about how organizations capture and interconnect data
to extract critical supply chain execution information. It provides a single view for
tracking information, material and/ or cost by monitoring key dimensions in a Capgemini (2011)
global supply chain, such as inventory positions or shipment in-transit status and
real-time order movements in order to make informed and fact based decisions.
71
09M

References
Auramo, J., Kauremaa, J., & Tanskanen, K. (2005). Benefits of IT in supply chain management:An explorative study of progressive companies. International Journal ofPhysical Distribution &Logistics Management, 35(2), 82-100.
Barratt, M., Oke, A. (2007). Antecedents of supply chain visibility in retail supply chains: Aresource-based theory perspective. Journal of Operations Management.
Bradley, P. (2002). How far can you see? Logistics Management, 27-34.
Capgemini Consulting. (2011). Global Supply Chain Control Towers: Achieving End-to-EndSupply Chain Visibility.
Caridi, M., Crippa, L., Perego, A., Sianesi, A., & Tumino, A. (2010). Measuring visibility toimprove supply chain performance: A quantitative approach. Benchmarking: An InternationalJournal, 17(4), 593-615.
Caridi, M., Moretto, A., Perego, A., & Tumino, A. (2014). The benefits of supply chainvisibility: A value assessment model. International Journal ofProduction Economics.
Dul, J., Hak, T. (2008). Case Study Methodology in Business Research. Oxford: Butterworth-Heinemann/Elsevier.
Eisenhardt, K. M. (1989). Building Theories from Case Study Research. Academy ofManagement Review, 14(4), 532-550.
Eisenhardt, K. M., & Graebner, M. E. (2007). Theory building from cases: Opportunities andchallenges. Academy ofManagement Journal, 50(1), 25-32.
Eriksson, P., Kovalainen, A. (2008). Qualitative methods in business research. London, UK:Sage.
Francis, V. (2008). Supply chain visibility: Lost in translation? Supply Chain Management: AnInternational Journal, 13(3), 180-184.
Goh, M., De Souza, R., Zhang, A. N., He, W., & Tan, P. S. (2009). Supply chain visibility: Adecision making perspective. Industrial Electronics and Applications, ICIEA 2009, 4th IEEEConference, 2546-2551.
Heaney, B. (2013). Supply Chain Visibility: A Critical Strategy to Optimize Cost and Service.Aberdeen Group.
Holcomb, M. C., Ponomarov, S. Y., & Manrodt, K. B. (2011). The Relationship of Supply ChainVisibility to Firm Performance. An International Journal, 12(2).
72

Kaipia, R., Hartiala, H. (2006). How to benefit from visibility in supply chains. InternationalJournal ofAgile Manufacturing, 9(1), 9-17.
McCrea, B. (2005). EMS completes the visibility picture. Logistics Management, vol.44, pp.57-61.
McIntire, J. S. (2014). Supply chain visibility: From theory to practice. Surrey, England: Gower.
Pidun, T., Felden, C. (2012). Two cases on how to improve the visibility of business processperformance. International Journal of Intelligent Information Technologies, 8(2), 59-74.
Schoenthaler, R. (2003). Creating real-time supply chain visibility. Electronic Business.
Simchi-Levi, D., Kaminsky, P. and Simchi-Levi, E. (2008). Designing and Managing the SupplyChain: Concepts, strategies, and case studies. Boston: McGraw-Hill/Irwin.
Stuart, I., McCutcheon, D., Handfield, R., McLachlin, R., & Samson, D. (2002). Effective caseresearch in operations management: A process perspective. Journal of Operations Management,20, 419-433.
Swanson, R. A., & Holton III, E. F. (2005). Research in organizations: Foundations andmethods of inquiry. San Francisco: Berrett-Koehler Publishers.
Titze, C., Barger, R. (2015). Evolving Concepts in Supply Chain Visibility. Gartner.
Tohamy, N., Orlov, L.M., Herbert, L. (2003). Supply chain visibility defined. Research Report.Forrester Research, Cambridge, MA.
Yin, R. K. (2003). Case study research: Design and methods. Thousand Oaks, Calif: SagePublications.
73