the effect of the mixing region geometry and collector
TRANSCRIPT
1
The Effect of the Mixing Region Geometry and Collector Distance
on Microbubble Formation using a Microfluidic Device coupled with
AC-DC Electric Fields
Anjana Kothandaraman *1¥, Yasir Alfadhl 2, Muhammad Qureshi 2, Mohan Edirisinghe 1, Yiannis
Ventikos 1
1 Department of Mechanical Engineering, University College London, London WC1E 7JE, United
Kingdom 2 School of Electronic Engineering and Computer Science, Queen Mary University of London, London
E1 4NS, United Kingdom
¥ Present address: Department of Mechanical Engineering, University of Birmingham,
Birmingham B15 2TT, UK.
Corresponding author: [email protected]
Tel: +44 121 414 4147
Abstract
In this work we report a significant advance in the preparation of monodisperse microbubbles using a
combination of microfluidic and electric field technologies. Microbubbles have been employed in
various fields such as biomedical engineering, water purification and food engineering. Many
techniques have been investigated for their preparation. Of these, the microfluidic T-Junction has
shown great potential due to the high degree of control it has over processing parameters and the
ability to produce monodisperse microbubbles. Two main lines of investigation were conducted in this
work – the effect of varying the mixing region distance (Mx) and the influence of altering the tip-to-
collector distance (Dx) when an AC-DC field is applied. It was found that when Mx was decreased from
200µm to 100µm, the microbubble size also decreased from 128 ± 3 µm to 88 ± 5 µm due to an
increase in shear stress as a result of a reduction in surface area. Similarly, decreasing the tip-to-
collector distance results in an increase in electric field strength experienced at the nozzle, facilitating
further reduction of bubble size from 111 ± 1 µm to 86 ± 1µm at an AC voltage of 6kV P-P and an
applied DC voltage of 6kV. Experiments conducted with the optimal parameters identified from the
previous experiments enabled further reduction of the microbubble size to 18 ± 2 µm. These results
suggest that a unique combination of parameters can be employed to achieve particular
microbubble sizes to suit various applications.
2
1. Introduction
Microbubbles are being increasingly used in a variety of key advanced technologies including food
engineering, water purification and biosensing applications. Microbubbles play a vital role in the
manufacturing of a plethora of food products such as: ice creams, beverages and cakes. Aeration of
food also benefits from low costs and form novel structures that play a vital role in oral sensory
perception 1. Their versatility is incorporated in beverages to enhance the visual appeal of soft drinks,
beers and wine 2. They are also used as texture modifiers and fat replacers, which can potentially pave
way for the development of healthier food products without compromising their taste 3-4.
Furthermore, substituting conventional microbubbles with microbubbles coated with nutritional
ingredients or drugs can increase the nutritional value and introduce medicinal properties in food.
Their applications extend beyond the realm of food engineering into waste water treatment in
processes such as ozonation and floatation 5-6. Due to the steady decline in the availability of water
resources, alternative procedures to obtain purified water, such as sea water desalination, have
gained substantial interest 7. Microbubbles have also been introduced into bioreactors to extract
biogases such as methane in waste water 8. The microbubbles provide a gas-liquid interface where the
methane aggregates, thus providing a means to exit the system. Dissolved air flotation (DAF) employs
microbubbles of diameters < 150µm to separate particulates from potable water by harnessing on
their high surface area to volume ratio which improves the mass transfer rate9. Shu et al.10 added that
incorporating microbubbles into active sludge results in sludge flotation and accumulation at the
surface. Consequently, there is a decrease in sludge volume in the main tank for subsequent
eradication or purification processes 11. Biosensors are used in food safety measurements to detect
bacteria such as Escherichia Coli (E-Coli) due to their high level of sensitivity and accurate detection of
harmful pathogens 12. Recent developments indicate that gas microbubbles coated with an albumin,
lipid, phospholipid or polymer shell influence the electroacoustic response of the microbubble,
therefore being a feasible option for acoustic biosensing platforms 13.
In order to cater to the numerous applications, it is essential to have optimal control over the
microbubble production process and tailor their diameter to suit specific applications. Microfluidic
configurations have established their versatility in various fields for effective microbubble generation.
Specifically, the use of a T-Junction device has been widely investigated due to the exquisite control it
offers over processing parameters such as solution flow rate and gas pressure, which govern the
dynamics of droplet formation and detachment at the junction. This device also benefits from low set-
up costs, natural scalability and the convenience to replace capillaries in the event of blockage. Fluid
flow in the capillaries is controlled by high precision mechanical pumps and gas pressure is controlled
by adjusting the regulator on a gas tank. An ideal range and combination of parameters exist in order
to attain the desired microbubble diameters to suit specific applications. At a constant liquid flow rate,
minimum and maximum inlet gas pressures can be defined as Pgmin and Pgmax respectively14. Any
pressure below Pgmin would cause the liquid stream to push the gas stream back up the capillary, as a
result of the capillary force of the liquid. Increasing the pressure past Pgmax disturbs the overall laminar
flow of both streams in the outlet capillary and pushes the liquid stream back into the liquid inlet
capillary. The mixing of both fluid media takes place in the gap where the two inlet tubes meet which
will be referred to herewith as the mixing region.
Gupta et al.15 investigated the effect of altering the width and depth of junction capillaries on the
bubble size. They studied the effect of manipulating the channels height (wl) and width (wc). When
the emerging bubble blocks the main channel; obstruction of the channel causes an increase in

3
pressure upstream16. Due to the presence of interfacial tension retaining the curvature of the droplet,
when wc is increased; the pressure upstream needs to overcome a higher Laplace pressure difference
denoted by:
∆𝑃𝐿 = 𝜎 (1
𝑅𝑎+
1
𝑅𝑟) (1)
where σ is the surface tension, Ra and Rr are the principal radii of curvature respectively17. The
increased duration of time results in the emerging bubble filling a larger section of the channel. Once
the pressure is sufficient to overcome the interfacial tension, the droplet neck pinches off forming a
larger bubble. The opposite effect was observed with lower wc.
Microbubble size reduction is limited under this small window of parameter manipulation, especially
when viscous solutions are used. For this reason, the idea of merging electrohydrodynamics into the
set-up was explored by introducing a DC electric field at the outlet capillary 18. When an electric field
is applied, electrical charge accumulates at the gas liquid interface, which behaves as a capacitor. As
the voltage increases, the charge build up at the interface increases resulting in a higher attraction of
the gas stream downstream. The resulting elongation of the gas column and radial compression
accelerates the breakup process causing a reduction of bubble size which was also observed by
Parhizkar et al.18. However, microbubble size reduction ceased at voltages above 12kV.
Another idea that has been explored in literature is the superimposition of an AC on a DC electric field 19-21 to generate liquid droplets by electrospraying. Jaworek et al. 19 indicated that this divides the
waveform into two components – the AC and the DC. The DC component is applied by shifting the
zero line up to a specific voltage, which acts as the new time base. The AC component is introduced
as a waveform oscillating about this new time base at a (P-P) voltage. For instance, setting the DC
voltage to 5kV with a superimposed AC voltage of 4kV P—P , oscillates the waveform between 3kV and
7kV. Balachandran et al.20 superimposed an AC on DC electric field to facilitate liquid droplet
formation in their electrospraying apparatus. They noticed that increasing the frequency of the
applied signal resulted in an increase in droplet formation rate and a subsequent decrease in droplet
size suggesting that frequency is an important contributor to droplet break-up. Although the
behaviour of a bubble subjected to oscillating fields has been investigated, preparation of bubbles has
not been reported using this method.
Various experimental configurations have been employed to introduce an oscillating electric field to
an electrospraying set-up and extensive research has been conducted on the various channel
configurations. However, to the best of the authors’ knowledge, oscillating electric fields have not
been integrated into microfluidic arrangements and the effect of the separation gap between the gas
inlet and the liquid inlet (referred to as Mx (figure 1b) herewith) has not been studied. In this work, a
novel apparatus to superimpose an AC on DC electric field was utilised. We investigate the effect of
varying Mx, followed by varying the distance between the ground collector and nozzle tip (Dx) when
an oscillating electric field is introduced into the experimental set-up to identify optimal parameters
to facilitate bubble size reduction.
2. Materials and Methods

4
Solutions
For simplicity, a model system comprising of bovine serum albumin (BSA) and water was used. BSA
(molecular weight: 66000gmol-1) was purchased from Sigma Aldrich (Poole, UK). Solutions of 10% w/w
and 15% w/w were prepared by dissolving BSA in distilled water using magnetic stirrers for 24 hours.
Table 1: Physical Properties of 15% BSA and 10% BSA
Characterisation of Solutions
The density of the solutions was measured using a 25ml DIN ISO 3507 Gay-Lussac type density bottle
(VWR International, Lutterworth, UK). The viscosity was measured using an Ostwald Viscometer
(Schott Instruments GmbH, Mainz, Germany). The surface tension of the solution was measured using
a Wilhelmy Plate tensiometer (Kruss, Hamburg, Germany) and the electrical conductivity was studied
using a Jenway 3540 conductivity meter (Bibby Scientific, Stone, UK). The dielectric properties of BSA
10% and 15% were measured using an open ended coaxial probe method combined with an Agilent
network analyser. Measurements of the complex permittivity (*) comprising of both real and
imaginary components i.e. ’ (relative permittivity), and ” (loss factor) were carried out over the
frequency band 0.4GHz up to 20GHz. The choice of the frequency band was influenced by the available
measurement kit, however, the required properties at the desired lower frequencies were deduced
from the measured values. The Cole-Cole model22 was applied on the measured data by generating
relaxation parameters at measured frequency range in order to predict the dielectric properties at low
frequency range. The physical properties of the solutions used to prepare the microbubbles are
summarised in table 1.
Experimental Set-up
Two experimental configurations were utilised in this work, one with and without an electric field. In
order to introduce the superimposed AC on DC field, a waveform generator was used to drive the
input of a High Voltage Amplifier (HVA) (Trek, Lockport, New York,USA) as shown in figure 1a23. This
enables applying an offset to the output signal forming the DC component, and is coupled with a Peak-
to-Peak (P-P) AC voltage. This resultant signal ranging from 0-10V is amplified to 0-10kV.
Solution Viscosity
(mPa s)
Surface
Tension
(mN m-1)
Electrical
Conductivity
( µS m-1)
Relative
permittivity
at 25.3°C
Density
(kg m3)
10% w/w BSA 1.0 56 5.00 x 10⁶ 67.3 1065
15% w/w BSA 1.6 51 6.44 x 10⁶ 81.5 1070

5
Bubble Generation
The first series of experiments were conducted using the T-Junction only in order to investigate the
effect of varying the geometry of the mixing region on the bubble size. Two Fluorinated Ethylene
Propylene (FEP) tubes of 100µm were arranged coaxially and a third FEP tube was connected
perpendicular to the first pair, to form the T-Junction. The top inlet was connected to a pressurised
gas tank containing nitrogen, and the second inlet was connected to a syringe holding the solution
driven by a mechanical pump. The fluid was injected at a constant flowrate of 100µl/min and the gas
was at a constant pressure of 256kPa. These two fluids meet at the junction area, where bubbles form,
which traverse through the outlet capillary and are collected on a glass slide. The mixing region
geometry was varied by altering the gap distance between the gas inlet and outlet capillary from
100µm-220µm. The superimposed electric field was introduced into the system by replacing the FEP
tube outlet with a stainless steel outlet to provide a conductive surface. All experiments were
conducted in cleanroom conditions under an ambient temperature of 20°C and a relative humidity of
40%. Supplementary information (1 and 2) illustrates bubble generation with and without the electric
field, respectively.
Characterisation of Bubbles
Microbubbles were collected on a glass slide and observed under an optical microscope (Nikon Co,
Tokyo, Japan) immediately after generation. The optical micrographs were studied using ImageJ 1.48v
imaging software (National Institute of Health, Maryland, USA).
3. Results and Discussion
Effect of varying mixing region geometry
Figure 1: a) Experimental set-up to superimpose an AC on a DC electric field, indicating Dx, which is the distance between the nozzle tip and collector b) Schematic of T-junction indicating Mx
a) b)
Outlet
Liquid Inlet
Gas Inlet
Mx
Waveform Generator
10.78 Hz
Nitrogen Gas Tank
Syringe Pump
Syringe
Grounded platform
High voltage amplifier
Oscilloscope
T-Junction with stainless steel outlet
Collecting vial
Dx

6
Many have investigated the effect of solution properties and various processing parameters on bubble
formation previously; however not much relevance has been given to junction where both fluid media
meet.
The gap size was varied by altering the distance between the top inlet and the stainless steel capillary
between 100µm-200µm. The effect of varying Mx on the bubble diameter was investigated using two
different concentrations of BSA. The first series of experiments were conducted using 15% wt.
Figure 2: Optical Micrographs of bubbles of 15% BSA obtained at Mx of a) 200µm b) 180µm c) 160µm d) 140µm e) 120µm f) 100µm
Figure 3: Optical Micrographs of bubbles of 10% BSA obtained at Mx of a) 200µm b) 180µm c) 160µm d) 140µm e) 120µm f) 100µm
a) b) c)
d) e) f)
d)
a) c) b)
e) f)
a) b) c)
d) e) f)

7
concentration of BSA. A constant gas pressure of 106.7kPa and a liquid flow rate of 130µl/min were
retained for all values of Mx. Figure 2 displays optical micrographs of microbubbles collected at various
Mx values; it can be observed that there is a constant and progressive decrease in diameter with
decreasing Mx. The microbubbles produced at an Mx distance of 200µm were 128 ± 3µm, when Mx is
reduced to 160µm, the bubble size was reduced to 98 ± 1µm. Setting the gap distance to 100µm, in
line with the inner diameter of all the tubes accelerates reduction to yield microbubbles of 71 ± 4 µm.
However, the FEP tubes were blocked, and had to be replaced frequently, due to the high viscosity of
the 15% wt. BSA solution.
The experiments were repeated using a 10% wt BSA solution, the optical micrographs obtained at
different values of Mx are shown in figure 3. Similar to the trend displayed in figure 2, a solution of
10% displays a more refined and steady decrease in bubble size as shown in figure 3. When Mx is
reduced from 200µm to 140µm, a microbubble diameter reduction from 128 ± 2µm to 108 ± 1µm is
observed. Setting the gap size to 100µm, promotes a further descent in bubble diameter to 88 ± 5µm.
This reduction is not as steep in comparison with the 15% wt. BSA solution which has a higher viscosity
than the latter.
Solutions of higher viscosities have shown to produce bubbles of smaller size in previous studies14, which suggested that this was due the relative increase in the shear force over the capillary force at the channel junction. Microflows are characterised by low Reynolds numbers24 for the liquid:
𝑅𝑒 =𝑄𝑙𝜌𝑙
𝜇𝑙𝐷 (2)
And for the gas:
𝑅𝑒 =𝑄𝑔𝜌𝑔
𝜇𝑔𝐷 (3)
where 𝑄𝑙, 𝜌𝑙, μ𝑙, 𝑄𝑔, 𝜌𝑔, μ𝑔 and 𝐷 are the volumetric flow rate of the liquid, liquid density, dynamic
viscosity of the liquid, volumetric flowrate of the gas, gas density, dynamic viscosity of the gas and the hydraulic diameter of the capillaries respectively), hence the flow is laminar and the fluid flow is governed by viscous forces rather than inertial forces. This indicates that altering either gas pressure or liquid flow rate will have an impact on the bubble size. The FEP tubes utilised in these experiments have a hydraulic diameter of 100µm, Garstecki et al. 24 elaborated that for microchannels of this diameter, flows typically have very low capillary numbers ( 𝐶𝑎 < 10−2):
𝐶𝑎 = 𝜇𝑢
𝜎 (4)
where 𝑢 is the average velocity of the continuous phase and 𝜎 is the interfacial tension; therefore the size of the bubbles produced is governed by the pressure balance between the gas and the liquid. The emerging droplet/slug occupies the entire channel geometry leading to an increase of pressure
8
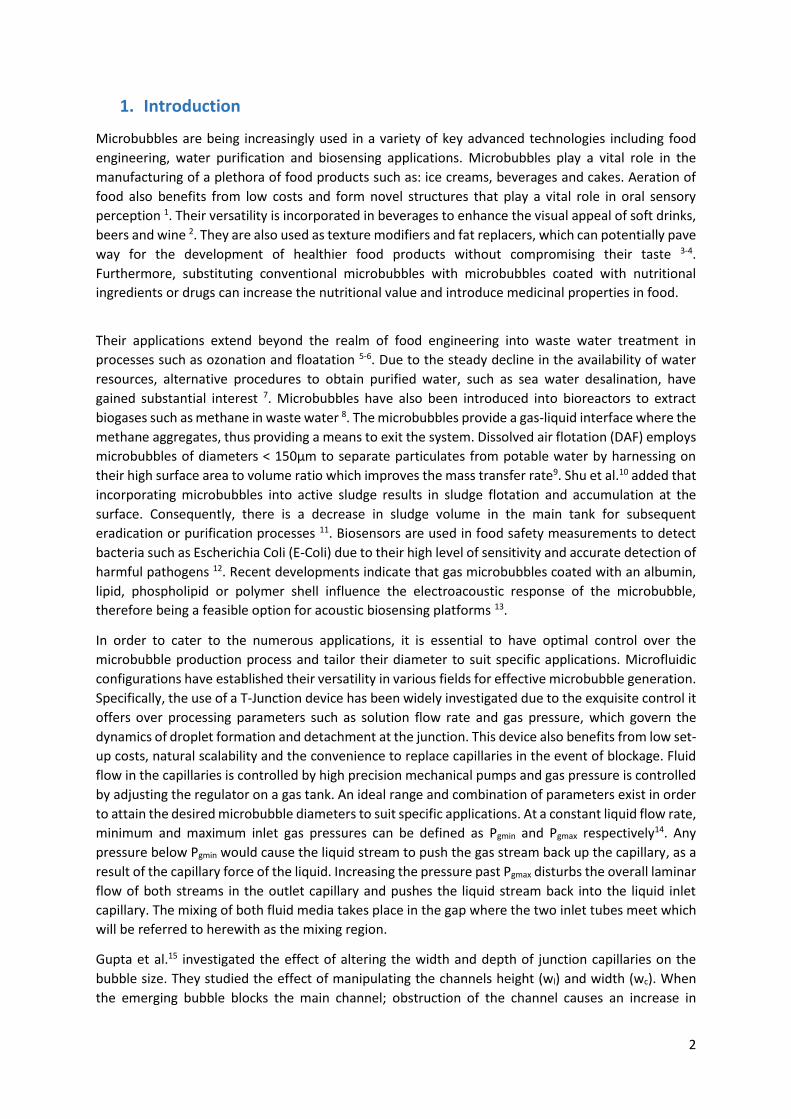
upstream, which consequently leads to bubble growth and a generation of a neck where the bubble is trying to pinch off from the continuous phase. Baroud et al. 25 added that droplet break-up occurs when the viscous shear stress overcomes the surface tension that retains the curvature of the emerging bubble. This suggests that an increase in viscosity further increases this shear force at the junction area, thus resulting in the formation of smaller bubbles. Based on these theories, decreasing the value of Mx, consequently reduces the surface area which also results in an increase of the shear force across the mixing region in the junction contributing the formation of smaller bubbles. A summary of the bubble size with different values Mx for both concentrations of solution is shown in figure 4.
Although, utilising a solution of higher viscosity with a smaller Mx produced smaller bubbles, the
capillaries were easily blocked hence required to be replaced regularly, as experienced by other
researchers14, 18, 26. Therefore, it is essential to employ solutions of lower viscosities such that the
liquid and air pressures required can be reduced27. These results indicate that to obtain
microbubbles of ~60µm diameter without an external field employing a 10% wt. solution, the
separation distance between the co-axially aligned capillary channels must be 100µm, which is the
same as the internal diameter of all the capillary channels.
Effect of Varying Electric Field Strength
Bubble size reduction experiences limitations in experimental configurations without external electric
fields. Electrohydrodynamic techniques have also been used to generate microbubbles using a dual
needle configuration called coaxial electrohydrodynamic atomisation (CEHDA)28. This allows the
formation of multi-layered bubbles, particles and capsules. Electrohydrodynamic theory encompasses
the behaviour of a liquid stream when subjected to an electric field 29. When the liquid stream reaches
the nozzle, the hemispherical meniscus is held together by interfacial tension which Zeleny29 described
by the following equation:
Figure 4: Graph of Bubble Diameter versus Mx for 15% wt. and 10% wt. Bovine Serum Albumin Solutions.
0
20
40
60
80
100
120
140
100120140160180200
Bu
bb
le D
iam
eter
(μ
m)
Mx (μm)
15% BSA
10% BSA
9
𝜎 =𝑟ℎ𝜌𝑔
2 (5)
where r is the radius of the nozzle, h is the height of the liquid required to cause the hemispherical
shape of the meniscus and g is the gravity constant. When an electric field is applied at the nozzle, the
liquid is gradually charged up, and the electric field intensity (f) experienced at the liquid surface is
given by:
𝑓 = √8𝜋𝑥𝜌𝑔 (6)
where x is the length of the liquid column whose hydrostatic pressure counteracts the elongation
caused by the electric field acting on the liquid surface. Once the electric field overcomes the
interfacial tension, the meniscus releases a thin jet to produce fibres or breaks up to form fine
droplets. Introducing an electric field in the form of a steady state DC constrained parameter
manipulation to only variation of the applied voltage18. Parhizkar et al.18 observed significant bubble
reduction at very high voltages of 12kV. This may be due to the fact that the distance between the
ground collector and the nozzle was too large, thus generating a lower electric field strength. We
would like to add that this is limited to particular geometric configurations of the channels.
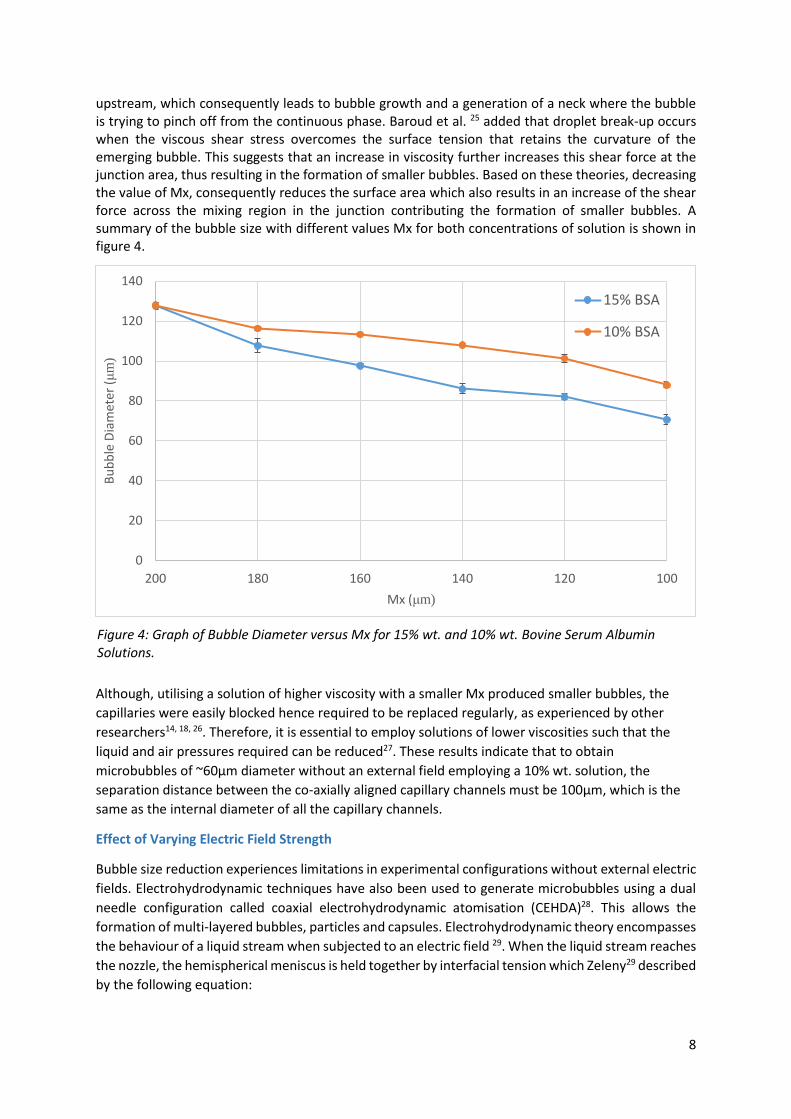
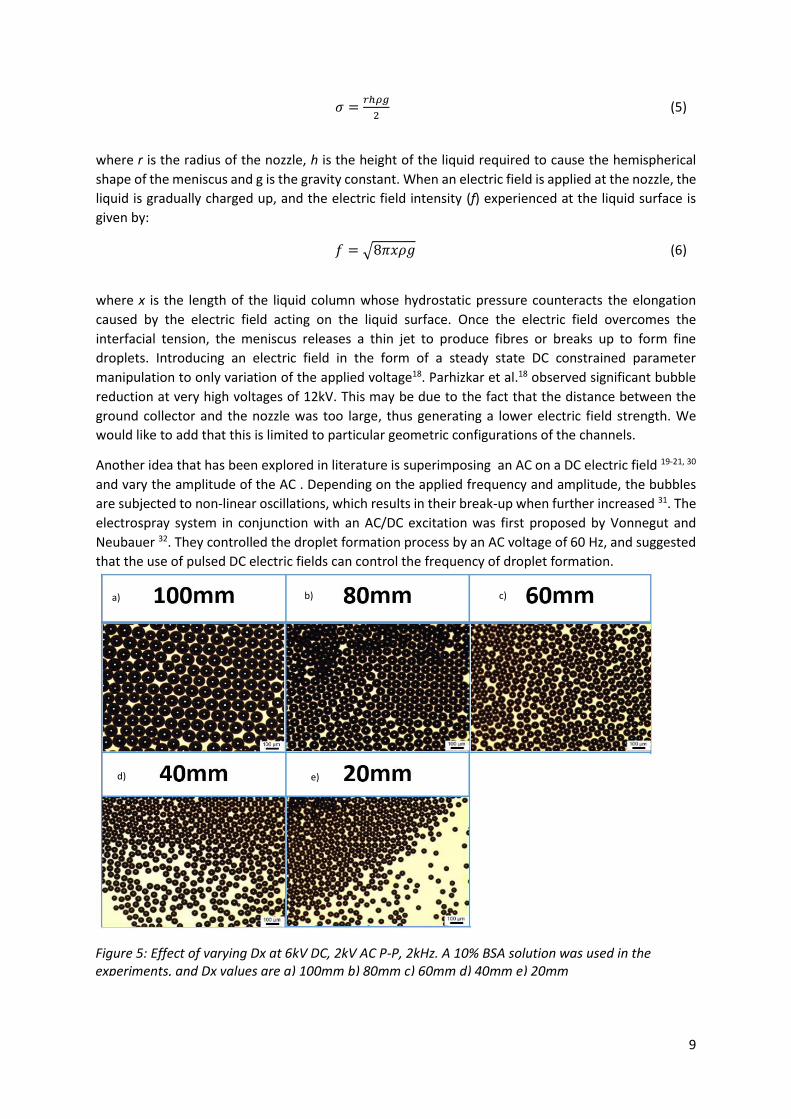
Another idea that has been explored in literature is superimposing an AC on a DC electric field 19-21, 30
and vary the amplitude of the AC . Depending on the applied frequency and amplitude, the bubbles
are subjected to non-linear oscillations, which results in their break-up when further increased 31. The
electrospray system in conjunction with an AC/DC excitation was first proposed by Vonnegut and
Neubauer 32. They controlled the droplet formation process by an AC voltage of 60 Hz, and suggested
that the use of pulsed DC electric fields can control the frequency of droplet formation.
Figure 5: Effect of varying Dx at 6kV DC, 2kV AC P-P, 2kHz. A 10% BSA solution was used in the experiments, and Dx values are a) 100mm b) 80mm c) 60mm d) 40mm e) 20mm
a) c) b)
e) d)
10
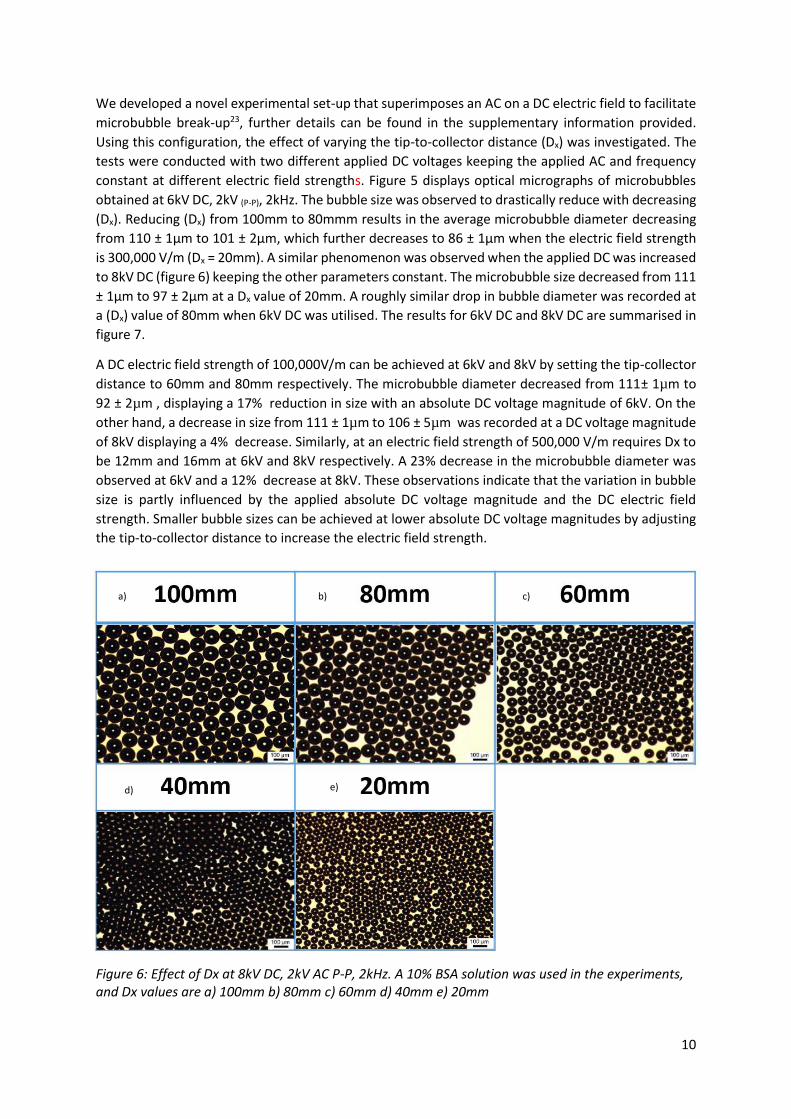
We developed a novel experimental set-up that superimposes an AC on a DC electric field to facilitate
microbubble break-up23, further details can be found in the supplementary information provided.
Using this configuration, the effect of varying the tip-to-collector distance (Dx) was investigated. The
tests were conducted with two different applied DC voltages keeping the applied AC and frequency
constant at different electric field strengths. Figure 5 displays optical micrographs of microbubbles
obtained at 6kV DC, 2kV (P-P), 2kHz. The bubble size was observed to drastically reduce with decreasing
(Dx). Reducing (Dx) from 100mm to 80mmm results in the average microbubble diameter decreasing
from 110 ± 1µm to 101 ± 2µm, which further decreases to 86 ± 1µm when the electric field strength
is 300,000 V/m (Dx = 20mm). A similar phenomenon was observed when the applied DC was increased
to 8kV DC (figure 6) keeping the other parameters constant. The microbubble size decreased from 111
± 1µm to 97 ± 2µm at a Dx value of 20mm. A roughly similar drop in bubble diameter was recorded at
a (Dx) value of 80mm when 6kV DC was utilised. The results for 6kV DC and 8kV DC are summarised in
figure 7.
A DC electric field strength of 100,000V/m can be achieved at 6kV and 8kV by setting the tip-collector
distance to 60mm and 80mm respectively. The microbubble diameter decreased from 111± 1µm to
92 ± 2µm , displaying a 17% reduction in size with an absolute DC voltage magnitude of 6kV. On the
other hand, a decrease in size from 111 ± 1µm to 106 ± 5µm was recorded at a DC voltage magnitude
of 8kV displaying a 4% decrease. Similarly, at an electric field strength of 500,000 V/m requires Dx to
be 12mm and 16mm at 6kV and 8kV respectively. A 23% decrease in the microbubble diameter was
observed at 6kV and a 12% decrease at 8kV. These observations indicate that the variation in bubble
size is partly influenced by the applied absolute DC voltage magnitude and the DC electric field
strength. Smaller bubble sizes can be achieved at lower absolute DC voltage magnitudes by adjusting
the tip-to-collector distance to increase the electric field strength.
Figure 6: Effect of Dx at 8kV DC, 2kV AC P-P, 2kHz. A 10% BSA solution was used in the experiments, and Dx values are a) 100mm b) 80mm c) 60mm d) 40mm e) 20mm
a) c) b)
e) d)

11
Movassat et al.31 modelled the oscillatory behaviour of a bubble when subjected to large vibrations.
The bubble begins to deform, resulting in the formation of a dimple in its centre as shown in figure
8a. When this oscillatory force increases, the bubble undergoes break up. These authors suggested
that this break-up is facilitated by a thin liquid jet that forms within the core of the bubble (figure
8b).
1
In bubble dynamics, the resistance to change in velocity (inertia) of the liquid penetrates towards the
centre of the bubble, altering the bubble volume. Jagannathan et al. 33 added that when bubbles
suspended in liquid are subjected to an acoustic vibration of specified frequencies, they experience
1 Reprinted from Oscillation and breakup of a bubble under forced vibration, 54 , Mohammad Movassat, Nasser Ashgriz, Markus Bussmann, Oscillation and
breakup of a bubble under forced vibration, Pages 211-219, Copyright (2015), with permission from Elsevier
Figure 8: a) Cavitation of bubble resulting in the formation of a slight depression in the centre of the bubble b) a cut forms through the centre of the bubble due to increase in oscillatory force, the two halves are held together by a thin liquid jet (extracted from Movassat et al.) 1
a) b)
Figure 7: Graph summarising the effect of the electric field at 6kV DC and 8kV DC at 2kV AC P-P, 2 kHz for 10%wt. BSA Solution
0.00
20.00
40.00
60.00
80.00
100.00
120.00
0 50000 100000 150000 200000 250000 300000 350000 400000 450000 500000
Mic
rob
ub
ble
Dia
met
er (
µm
)
Electric Field Strength V/m
6 kV
8 kV

12
variations in the surrounding pressure. They observed rapid fragmentation of bubbles at high
frequencies as a result of the cavitation and subsequent deformation of the larger bubbles which is in
accordance with the research conducted by Movassat et al. 31.
From figure 7, it can be observed that the greatest reduction in microbubble diameter was at 400,000
V/m. The ideal parameters for microbubble reduction obtained in the previous investigations, were
incorporated for the next set of experiments using 10% wt BSA BSA, Mx=100 µm and Dx= 400,000
V/m. The experiments were conducted at a constant applied AC voltage of 2kV (P-P) and varying the
frequency between 1 kHz-10kHz at an applied DC voltage of 6kV. The corresponding optical
micrographs obtained are presented in figure 9. It can be observed by incorporating the optimised
parameters and steadily increasing the applied frequency further causes a reduction of 111±1µm to
18±2µm. These results are summarised in figure 10.
Developing a methodology to reduce microbubble diameter paves way to address the biomedical
applications of microbubbles i.e. in ultrasound contrast agents and in targeted drug delivery which
require microbubbles to range between 2-10µm in order to traverse through minor capillaries in the
body and to avoid the risk of embolism34.
There is similarity in the behaviour of the microbubbles observed in this work in comparison with
other electrohydrodynamic procedures such as electrohydrodynamic forming. Doshi and
Reneker35observed in their work on electrospinning, that the jet diameter decreased with increasing
nozzle-to-collector distance displaying and inversely proportional relationship. Hekmati et al.36
recorded that reducing the nozzle-to-collector distance also contributed to jet instability and an
increase in the polydispersity of the fibres produced, this could be due to incomplete solvent
evaporation and also the increase in the field strength when the applied electric field is constrained
to a smaller gap, where the latter contributed to the formation of smaller bubbles in the research
entailed in this manuscript.
a) b) c)
d) e)
Figure 9: Optical Micrographs at 6kV at frequencies of a) 2 kHz b) 4kH c) 6kHz d) 8kHz e) and 10kHz

13
Henriques et al.37 suggested that apart from incomplete solvent evaporation, larger nozzle-to-
collector distances sustain weaker electric field strength. Ghelich et al.38 recorded a similar occurrence
of incomplete solvent evaporation as the aforementioned authors. At a distance of 80mm, fibres
formed were not fine and residual fluid was present at the collector indicating incomplete solvent
evaporation, increasing the distance to 100mm generated fine fibres without any influence on the
fibre diameter from the sample collected at 80mm. However, further increasing the distance between
the nozzle and collector to 150mm had a pronounced effect on fibre diameter increase owing to the
reduction of electrostatic field strength hindering the stretching of the fibres. In this work, there was
no specific attempt to study bubble stability as only a simple BSA-water model system was used,
however the monodisperse microbubbles prepared were stable (I.e. no diameter range) for at least
60-90 minutes.
Conclusions
Two major lines of investigation were conducted in this work in order to understand additional factors
that enable further control over microbubble size. Firstly, varying the Mx between the coaxially
aligned channels had a pronounced effect in bubble size reduction, especially at Mx=100 . A decrease
in bubble diameter from 128 ± 3µm to 71 ± 4µm was observed when 15% BSA was used as the
continuous fluid medium. Bubble break up occurs when viscous shear overcomes the surface tension,
as the Mx is reduced, the surface area of the junction region also reduces thus elevating the shear
forces experienced at the junction, hence facilitating the break-up of bubbles into smaller bubbles.
Finally, it was observed that constraining the electric field to a smaller area by decreasing Dx resulted
in a reduction in microbubble diameter from 111 ± 1µm to 97 ± 2µm. This is due to an increase in
electric field strength suggesting that very high voltages need not be utilised to facilitate bubble break-
up, but constraining the electric field to a smaller region, can potentially promote bubble break-up as
the effect of the electric field on the fluid stream is intensified. An optimised set-up employing the
parameters from the previously discussed investigations enabled formation of microbubbles with
diameters of 18 ± 2µm. The results achieved in this study suggest that a unique combination of
Figure 10 : Graph summarising the effect of frequency on microbubble diameter with optimised parameters of Mx= 20mm, Dx= 400 V/m, 2kV AC P-P at 6kV DC and 8kV DC
0
20
40
60
80
100
120
0 1 2 3 4 5 6 7 8 9 10
Mic
rob
ub
ble
Dia
met
er (
µm
)
Frequency (kHz)
6kV
8kV

14
parameters can be selected to achieve particular bubble sizes to suit various applications. This novel
apparatus presents a viable and innovative methodology to prepare monodisperse microbubbles with
precision and provides the user with control over the bubble diameter and overall process.

15
References
1. Minor, M.; Vingerhoeds, M. H.; Zoet, F. D.; De Wijk, R.; Van Aken, G. A., Preparation and sensory perception of fat-free foams – effect of matrix properties and level of aeration. International Journal of Food Science & Technology 2009, 44 (4), 735-747. 2. Campbell, G. M.; Mougeot, E., Creation and characterisation of aerated food products. Trends in Food Science & Technology 1999, 10 (9), 283-296. 3. Ahmad, B.; Stride, E.; Edirisinghe, M., Calcium Alginate Foams Prepared by a Microfluidic T-Junction System: Stability and Food Applications. Food Bioprocess Technol 2012, 5 (7), 2848-2857. 4. Shen, Y.; Longo, M. L.; Powell, R. L., Stability and rheological behavior of concentrated monodisperse food emulsifier coated microbubble suspensions. Journal of Colloid and Interface Science 2008, 327 (1), 204-210. 5. Jabesa, A.; Ghosh, P., Removal of diethyl phthalate from water by ozone microbubbles in a pilot plant. Journal of Environmental Management 2016, 180, 476-484. 6. Wen, L. H.; Ismail, A. B.; Menon, P.; Saththasivam, J.; Thu, K.; Choon, N. K., Case studies of microbubbles in wastewater treatment. Desalination and Water Treatment 2011, 30 (1-3), 10-16. 7. Gwenaelle, M. P. O.; Jung, J.; Choi, Y.; Lee, S., Effect of microbubbles on microfiltration pretreatment for seawater reverse osmosis membrane. Desalination 2017, 403, 153-160. 8. Al-mashhadani, M. K. H.; Wilkinson, S. J.; Zimmerman, W. B., Carbon dioxide rich microbubble acceleration of biogas production in anaerobic digestion. Chemical Engineering Science 2016, 156, 24-35. 9. Hanotu, J.; Bandulasena, H. C. H.; Chiu, T. Y.; Zimmerman, W. B., Oil emulsion separation with fluidic oscillator generated microbubbles. International Journal of Multiphase Flow 2013, 56, 119-125. 10. Liu, S.; Wang, Q.; Sun, T.; Wu, C.; Shi, Y., The effect of different types of micro-bubbles on the performance of the coagulation flotation process for coke waste-water. Journal of Chemical Technology & Biotechnology 2012, 87 (2), 206-215. 11. Liu, C.; Tanaka, H.; Ma, J.; Zhang, L.; Zhang, J.; Huang, X.; Matsuzawa, Y., Effect of microbubble and its generation process on mixed liquor properties of activated sludge using Shirasu porous glass (SPG) membrane system. Water Research 2012, 46 (18), 6051-6058. 12. Ten, S. T.; Hashim, U.; Gopinath, S. C. B.; Liu, W. W.; Foo, K. L.; Sam, S. T.; Rahman, S. F. A.; Voon, C. H.; Nordin, A. N., Highly sensitive Escherichia coli shear horizontal surface acoustic wave biosensor with silicon dioxide nanostructures. Biosensors and Bioelectronics 2017, 93, 146-154. 13. Zhou, Y.; Seshia, A. A.; Hall, E. A. H. In Microfluidics-based acoustic microbubble biosensor, 2013 IEEE SENSORS, 3-6 Nov. 2013; 2013; pp 1-4. 14. Parhizkar, M.; Edirisinghe, M.; Stride, E., Effect of operating conditions and liquid physical properties on the size of monodisperse microbubbles produced in a capillary embedded T-junction device. Microfluid Nanofluid 2013, 14 (5), 797-808. 15. Gupta, A.; Kumar, R., Effect of geometry on droplet formation in the squeezing regime in a microfluidic T-junction. Microfluid Nanofluid 2010, 8 (6), 799-812. 16. Fu, T.; Ma, Y.; Funfschilling, D.; Zhu, C.; Li, H. Z., Squeezing-to-dripping transition for bubble formation in a microfluidic T-junction. Chemical Engineering Science 2010, 65 (12), 3739-3748. 17. Wang, X.; Riaud, A.; Wang, K.; Luo, G., Pressure drop-based determination of dynamic interfacial tension of droplet generation process in T-junction microchannel. Microfluid Nanofluid 2015, 18 (3), 503-512. 18. Parhizkar, M.; Stride, E.; Edirisinghe, M., Preparation of monodisperse microbubbles using an integrated embedded capillary T-junction with electrohydrodynamic focusing. Lab on a Chip 2014, 14 (14), 2437-2446. 19. Jaworek, A.; Machowski, W.; Krupa, A.; Balachandran, W. In Viscosity effect on EHD spraying using AC superimposed on DC electric field, Industry Applications Conference, 2000. Conference Record of the 2000 IEEE, IEEE: 2000; pp 770-776.

16
20. Balachandran, W.; Machowski, W.; Ahmad, C. N. In Electrostatic atomisation of conducting liquids using AC superimposed on DC fields, Industry Applications Society Annual Meeting, 1992., Conference Record of the 1992 IEEE, 4-9 Oct. 1992; 1992; pp 1369-1373 vol.2. 21. Huneiti, Z.; Machowski, W.; Balachandran, W. In Excitation of electrohydrodynamic surface waves on a conducting liquid jet employing AC field, Industry Applications Conference, 1996. Thirty-First IAS Annual Meeting, IAS'96., Conference Record of the 1996 IEEE, IEEE: 1996; pp 1768-1774. 22. Said, T.; Varadan, V. V. In Variation of Cole-Cole model parameters with the complex permittivity of biological tissues, Microwave Symposium Digest, 2009. MTT'09. IEEE MTT-S International, IEEE: 2009; pp 1445-1448. 23. Kothandaraman, A.; Harker, A.; Ventikos, Y.; Edirisinghe, M., Novel Preparation of Monodisperse Microbubbles by Integrating Oscillating Electric Fields with Microfluidics. Micromachines 2018, 9 (10), 497. 24. Garstecki, P.; Fuerstman, M. J.; Stone, H. A.; Whitesides, G. M., Formation of droplets and bubbles in a microfluidic T-junction—scaling and mechanism of break-up. Lab on a Chip 2006, 6 (3), 437-446. 25. Baroud, C. N.; Gallaire, F.; Dangla, R., Dynamics of microfluidic droplets. Lab on a Chip 2010, 10 (16), 2032-2045. 26. Pancholi, K.; Stride, E.; Edirisinghe, M., Dynamics of bubble formation in highly viscous liquids. Langmuir 2008, 24 (8), 4388-4393. 27. Stride, E.; Edirisinghe, M., Novel microbubble preparation technologies. Soft matter 2008, 4 (12), 2350-2359. 28. Ahmad, Z.; Zhang, H. B.; Farook, U.; Edirisinghe, M.; Stride, E.; Colombo, P., Generation of multilayered structures for biomedical applications using a novel tri-needle coaxial device and electrohydrodynamic flow. Journal of the Royal Society Interface 2008, 5 (27), 1255-1261. 29. Zeleny, J., The Electrical Discharge from Liquid Points, and a Hydrostatic Method of Measuring the Electric Intensity at Their Surfaces. Physical Review 1914, 3 (2), 69-91. 30. Sarkar, S.; Deevi, S.; Tepper, G., Biased AC electrospinning of aligned polymer nanofibers. Macromolecular rapid communications 2007, 28 (9), 1034-1039. 31. Movassat, M.; Ashgriz, N.; Bussmann, M., Oscillation and breakup of a bubble under forced vibration. International Journal of Heat and Fluid Flow 2015, 54 (0), 211-219. 32. Vonnegut, B.; Neubauer, R. L., Production of monodisperse liquid particles by electrical atomization. Journal of Colloid Science 1952, 7 (6), 616-622. 33. Jagannathan, T. K.; Nagarajan, R.; Ramamurthi, K., Effect of ultrasound on bubble breakup within the mixing chamber of an effervescent atomizer. Chemical Engineering and Processing: Process Intensification 2011, 50 (3), 305-315. 34. Farook, U.; Stride, E.; Edirisinghe, M. J.; Moaleji, R., Microbubbling by co-axial electrohydrodynamic atomization. Medical & Biological Engineering & Computing 2007, 45 (8), 781-789. 35. Doshi, J.; Reneker, D. H. In Electrospinning process and applications of electrospun fibers, Industry Applications Society Annual Meeting, 1993., Conference Record of the 1993 IEEE, IEEE: 1993; pp 1698-1703. 36. Hekmati, A. H.; Rashidi, A.; Ghazisaeidi, R.; Drean, J.-Y., Effect of needle length, electrospinning distance, and solution concentration on morphological properties of polyamide-6 electrospun nanowebs. Textile Research Journal 2013, 0040517512471746. 37. Henriques, C.; Vidinha, R.; Botequim, D.; Borges, J.; Silva, J., A systematic study of solution and processing parameters on nanofiber morphology using a new electrospinning apparatus. Journal of nanoscience and nanotechnology 2009, 9 (6), 3535-3545. 38. Ghelich, R.; Keyanpour-Rad, M.; Yuzbashi, A., Study on morphology and size distribution of electrospun NiO–GDC composite nanofibers. J. Eng. Fibers Fabr 2013.