the effect of the step height on energy dissipation in stepped spillways using numerical simulation
TRANSCRIPT

Arab J Sci EngDOI 10.1007/s13369-013-0900-y
RESEARCH ARTICLE - CIVIL ENGINEERING
The Effect of the Step Height on Energy Dissipationin Stepped Spillways Using Numerical Simulation
Alireza Attarian · Khosrow Hosseini · Hassan Abdi ·Moein Hosseini
Received: 15 February 2012 / Accepted: 30 November 2012© King Fahd University of Petroleum and Minerals 2013
Abstract From 1970s, studies have been conducted on thehydraulic design of stepped spillways and many empiricalformulas were developed. Despite the simple geometry ofthese spillways, their hydraulic behavior is complicated. Asa result, for many cases, the physical models are studied toverify the design. Numerical simulation is considered as atool to reduce the laboratory tests, in order to save time andmoney. Furthermore, the parameters which are not investi-gated or measured in physical models could be evaluated. Inthis paper, the results of numerical simulations are comparedwith the results of physical models and empirical formu-las for the spillway of Renwick dam studied in a 1/8 scalemodel by Hunt and Kadavy (World Environmental and WaterResources Congress. ASCE, Great Rivers, pp. 3061–3071,2009). Numerical simulation of flow is achieved by a mix-ture multi-phase flow model and a realizable k-ε turbulencemodel proposed by Qian et al. (Sci China Ser E-Tech Sci52(7), 1958–1965, 2009). Grid sensitivity is accomplishedand the size of mesh is reduced in locations where a highgradient of certain parameters exists or a higher precision
A. AttarianHydraulic Structures, Semnan University, Semnan, Irane-mail: [email protected]
K. HosseiniCivil Engineering Faculty, Semnan University, Semnan, Irane-mail: [email protected]
H. Abdi (B)Hydraulic Structures Department, Institute of Tose-e ConsultingEngineering, Tehran, Irane-mail: [email protected]
M. HosseiniSchool of Civil Engineering, Sharif University of Technology (SUT),Tehran, Irane-mail: [email protected]
is required. The numerical simulation results conform to thephysical model tests. The velocity profile, energy dissipation,and the location of inception point where air entrainmentin the flow is guaranteed, are investigated and compared tothe scale model results. Also, thanks to this satisfaction, wecould obtain the parameters such as pressure field which arenot measured in the physical model.
Keywords Stepped spillway · Turbulence model ·Multi phase flow · Inception point of air entrainment ·Numerical simulation
123

Arab J Sci Eng
1 Introduction
Stepped spillways are widely used in Roller Compacted Con-crete (RCC) dams since 1970, as an energy dissipation struc-ture, because of their simple geometry, ease of construc-tion and maintenance, and high energy dissipation alongthe steps, and also the reduced size in their stilling basin.The vortices formed between the step faces and the pseudo-bottom cause high turbulence and air entrainment to the flow.Air entrainment along the spillway lowers the potential ofcavitation damages. Many experimental researches are per-formed to determine the flow pattern, air entrainment, airconcentration, energy dissipation, velocity and pressure fieldon stepped spillways and the empirical formulas are devel-oped from the model studies. To minimize the scale effects,minimum Reynolds and Weber numbers must be satisfied inscale model. Boes and Hager [3] recommended a minimumReynolds number of 105 and Weber number of 100. Theseconstraints decrease the scale number and increase the cost ofthe model and also cause the limitations in discharge supplyat laboratory.
Computational fluid dynamics (CFD) is used to simu-late the flow in hydraulic structures. Tongratoke et al. [4]attained reliable and integrated results by simulating the flowover stepped spillways numerically using different turbu-lence models and two-phase models. The cost of physicalmodel includes: construction of the initial model, labora-tory tests, and modifications. Numerical models are utilizedto minimize the number of modifications performed on thephysical model.
In this paper two objectives are followed. The first is toshow that different modifications could be applied to thenumerical model, and afterwards the best choice could betested on the physical model, which reduces the costs. Thesecond is to obtain certain parameters which are not mea-sured or could not be measured on the physical model.
2 Skimming Flow Characteristics over SteppedSpillways
Regarding the discharge and geometry of spillway, flowover stepped spillways is classified into three categories;nape flow, transition flow and skimming flow. Since thestepped spillway encounters the skimming flow at high dis-charges, this category is of high interest in design and stud-ies. An inequality relation (Eq. (1)) proposed by Chanson [5]describes the skimming flow conditions.
yc
h> 1.2 − 0.325
h
l(1)
where h is step height, l is step length and yc is critical depthof flow.
Also, an empirical relation is proposed for inception pointof air entrainment as illustrated in Eq. (2).
Li
h cos α= 9.719(sin θ)0.0796 F∗0.713 (2)
where F∗ = qw√g sin θ(h cos θ)3
, L i is the length between the
inception point of air entrainment and the crest of spillway,θ is chute angle, qw is water discharge per unit width and F∗is the step roughness Froude number.
Considering the above equation, the inception point of airentrainment moves downstream, as the discharge increasesand the step height decreases. Beyond certain discharges, theinception point occurs in stilling basin, which is not desirable.
Hunt and Kadavy [6] evaluated the energy loss withrespect to the inception point location. They reported thatthe energy loss varies linearly and reaches 30 % of the totalin the inception point of air entrainment (Eq. (3)). The energyloss follows a logarithmic trend from 30 to 73 % when L/Li
equals 3.5.
�H
H0= 0.3
L
Li(3)
where �H is total energy loss, L is distance downstreamfrom the crest of spillway and H0 is maximum head of waterflow.
The velocity profile from the nape of step and the turbulentboundary layer follows a power function as shown in Eq. (4).
V
Vmax=
(y
δbl
)1/N
(4)
where Vmax = √2g(H0 − d cos θ), d is depth of flow, δbl is
boundary layer thickness, y is distance from pseudo-bottomand V is velocity magnitude at y.
3 Physical Model
Hunt and Kadavy [1] have studied the stepped spillway ofRenwick dam with 40 steps in a two-dimensional 1:8 scalemodel. The primary objectives of the model study were toevaluate the inception point, energy losses over every stepand the velocities associated with the flood.
The specifications of the model are: chute slope 4H :1V ,steps with 38 mm (1.5 in.) in height, 152 mm (6 in.) in lengthand 1.8 m in width. In Fig. 1 a schematic of the model isillustrated. The unit discharge in the model varies from 0.11to 0.82 m2/s. The measurement probes to determine the flowvelocity are Acoustic Doppler Velocimeter (ADV), pitot tubeand Fiber Optic probe (FO). In order to eliminate the walleffects, the measures are realized on the centerline of thespillway.
The tests in the model were organized for different unitdischarges as 0.11, 0.28 and 0.82 m2/s and the velocity pro-
123

Arab J Sci Eng
Fig. 1 Schematic of steppedspillway model with 38 mm(1.5 in.) high steps
files and flow depths along the centerline of the spillway arereported. Each of the measurement devices has been utilizedfor a unique range of velocities during operation. Velocityprofile has been taken normal to the spillway crest surfaceand the chute slope. The model studies were consistent withBoes, Tukahashi and Gonsalez criteria [3,7,8] for Reynoldsnumber (Re > 105) and Weber number (W b > 100) asdescribed by Eqs. 5a and 5b.
Re = FI
Fμ
= ρV R
μ= V R
ν(5a)
W b = FI
Fσ
= ρV 2 D
σ(5b)
In the above equations, FI is the inertia force, Fμ is the vis-cose force, Fσ is the surface tension force, μ is the dynamicviscosity of water, ν is the kinematic viscosity of water, σ isthe surface tension of water, V is the mean velocity of flowover the pseudo bottom of chute, R is the hydraulic radiusof flow considered the depth of water in this study and Dis the hydraulic depth considered four times of depth in thisstudy.
In the physical model the Reynolds numbers ranged from9.6 × 105 to 7.3 × 10⁵, and the Weber numbers ranged from112 to 234 for unit discharges ranging from 0.11 to 0.82 m2/s,respectively.
The second objective was to determine the effect of thestep height on energy dissipation.
The stations where the measurements are realized andnumerical simulations are derived, are located downstream ofevery four steps for a stepped spillway having 38 mm heightand every two steps for a stepped spillway having 76 mmheight.
4 Numerical Model
The stepped spillway of Renwick dam is simulated numer-ically and its results are compared with the physical modeltest. Since the effect of walls is negligible on the measure-ments performed in the physical model, a two-dimensionalnumerical model is built up. The flow is considered in a steadystate. Other parameters of the model are given below:
4.1 Turbulence Model
As the flow over the steps is highly turbulent, the defini-tion of a correct turbulence model is fundamental to get reli-able results. Some of the turbulent models are: realizable k-εmodel, k-ω model, ν2- f model, RMS model and LES model.Motamedi et al. [9] showed that the choice of the turbulencemodel depends on the nature of dominant phenomena. Themost utilized models for stepped spillways are k-ε and k-ωmodels. k-ω model is more convenient for the viscose flowin the vicinity of the wall [10]. RSM model is more suitablefor modeling the vorticity and high gradient in geometry andacceleration [11,12].
Qian et al. [2] using different turbulence models, based oncomparison of the results of numerical simulation with thoseobtained from a scale model, proposed that the realizablek-ε model provides the best performance for the air–watertwo-phase flow over stepped spillways. The k-ε model is alsoconsidered as the turbulence model in this study.
4.2 Two-Phase Model
Since 2006, the VOF and mixture two-phase models arevested applied in the numerical models. Using the VOFmodel, one can produce the flow depth accurately [13]. How-ever, in stepped spillway the air enters the water and the twophases of the fluid are mixed with each other and a net inter-face could not be distinguished between water and air. Thistype of flow can be modeled by a mixture two-phase flowmodel as considered in this study.
5 Analysis and Results
In the scale model the velocity profiles, energy losses andvoid concentrations are reported for the unit discharges 0.11,0.28 and 0.8 m2/s.
We have compared the numerical results with the resultsobtained from scale model studies.
5.1 Velocity Profile
Velocity profiles in the scale model and numerical simulationare compared in Fig. 2 for a unit discharge of 0.28 m2/s. In
123

Arab J Sci Eng
Fig. 2 Comparison the velocity profile in numerical and physicalmodel in five stations for q = 0.28 m2/s
this figure, the velocity profile over spillway crest and also forsteps No. 4, 8, 12 and 20 are presented. In Table 1, the veloc-ity at different depths on each step are calculated and com-pared with experimental data. As shown in Fig. 2; Table 1,a good adjustment between the scale model and numericalmodel exists. The mean error over five profiles in 50 pointsis about 3.2 %. In Fig. 3, the velocity profiles obtained fromthe numerical simulation are compared by power profile sug-
Fig. 3 Comparison the velocity profile in numerical model and thepower equation
gested in Eq. (4). It seems that power equation is not a conve-nient formula for the velocity profile over stepped spillways.
5.2 Energy Dissipation
In order to evaluate the energy dissipation over each step andto investigate its process along the spillway, the energy loss in
Table 1 Comparison the velocity in 50 points for q = 0.28 m2/s
st 0.0 st 0.61 st 1.22
y (m) V (exp) m/s V (cfd) m/s e % y (m) V (exp) ms V (cfd) ms e% v (m) V (exp) m/s V (cfd) m/s e %
0.000 0.00 0.00 0.0 0.000 0.00 0.00 0.0 0.000 0.00 0.00 0.0
0.004 1.83 1.90 3.8 0.004 1.65 1.69 2.4 0.011 2.40 2.15 10.4
0.015 1.96 1.94 1.0 0.007 1.76 1.80 2.2 0.017 2.63 2.45 6.7
0.023 2.01 1.93 4.1 0.020 2.38 2.35 1.3 0.023 2.78 2.69 3.2
0.053 1.95 1.87 4.4 0.032 2.58 2.50 3.1 0.032 3.00 2.93 2.3
0.083 1.89 1.83 3.2 0.063 2.58 2.58 0.2 0.047 3.16 3.09 2.4
0.098 1.86 1.81 2 7 0.080 2.58 2.59 0.1 0.063 3 IS 3.12 1.9
0.129 1.81 1.80 0.6 0.095 2.58 2.59 0.3 0.078 3.17 3.12 1.6
0.147 1.78 1.81 1.4 0.110 2.58 2.61 1.1 0.093 3.16 3.14 0.6
0.154 1.78 1.81 1.7 0.114 2.58 2.61 1.1 0.098 3.16 3.14 0.6
st 1.83 st 3.05
y (m) V (exp) m/s V (cfd) m/s e % y (m) V (exp) m/s V (cfd) m/s e%
0.000 0.00 0.00 0.0 0.000 0.00 0.00 0.0
0.008 2.30 2.21 3.9 0.002 2.54 2.58 1.6
0.013 2.55 2.37 7.1 0.003 2.59 2.61 0.8
0.024 2.88 2.90 0.7 0.008 2.70 2.78 3.0
0.032 3.19 3.13 1.7 0.013 2.95 2.90 1.7
0.047 3.46 3.47 0.3 0.023 3.18 3.14 1.3
0.063 3.60 3.59 0.3 0.032 3.43 3.27 4.7
0.078 3.63 3.59 1.1 0.047 3.80 3.38 11.1
0.084 3.61 3.58 0.8 0.078 3.97 3.44 13.4
0.091 3.61 3.58 1.0 0.083 3.97 3.46 12.8
Maximum error for all points: 13.4 %, mean error for all points: 3.2 %
123

Arab J Sci Eng
each station is determined and compared with experimentaldata.
Fig. 4 a Comparison the energy dissipation in numerical model andscale model for q = 0.11 m2/s. b Comparison the energy dissipation innumerical model and scale model for q = 0.82 m2/s
The total energy loss in every point of chute can be deter-mined as illustrated in Eq. (6).
�H = H0 − H, (6)
where H0 = z0 + y0 + α0V 2
02g , H = z + y cos θ + α V 2
2g , V ismean velocity, V0 is approach mean velocity, y0 is approachdepth above datum z0, y is depth above datum z, θ is chuteslope, α is kinematic energy correction coefficient and g isgravitational acceleration.
Figure 4a, b illustrates a comparison of energy loss forstep height of 38 and 76 mm and unit discharges of 0.11and 0.82 m2/s with respect to horizontal stationing for bothnumerical and physical models. As shown, the energy lossincreases with the step height in both numerical and physicalmodels.
Energy dissipation is affected considerably by air entrain-ment into flow. Physical model studies revealed that instepped spillways the point of air entrainment coincides with30 % of total energy losses. Hence, the point at which 30 %of energy dissipation occurs is considered as an index for airentrainment to flow in stepped spillways.
As illustrated in Fig. 4a, the inception point locations ofair entrainment are 1.4 and 1.1 m downstream of the crest ofspillway for the 38 and 76 mm step height configuration inboth models. Also, the inception point moves downstream asthe step height decreases.
As represented in Fig. 4b, the inception point is located inthe stilling basin in both numerical and physical models for38 and 76 mm step heights.
The mean relative error over 17 points along the spillway,as argued in Table 2, is 6.8 %.
Therefore, we have deduced from Fig. 4a, b, and Table 2that a good adjustment between the results of physical andnumerical models is provided. By this adjustment, the numer-
Table 2 Comparison the energydissipation along the spillwayfor q = 0.11 and 0.83 m
q = 0.11 (m2/s) q = 0.82 (m2/s)
X (m) h = 38 (mm) h = 76 (mm) X (m) h = 38 (mm) h = 76 (mm)
cfd exp cfd exp cfd exp cfd exp
0 0 0 0 0 0 0 0 0 0
0.608 12.9 10 4 3 1.976 11.6 9 7.5 7
1.216 25.8 25 26.7 30.5 2.432 12 11 12.5 10
1.976 42 40 45 3.04 13.5 13 13.5 12.5
2.432 48.9 50 54.9 55 3.648 16.8 15 15.9 17
3.04 55.5 56 61.9 61 4.256 17.4 17 16.4 18
3.648 60.3 65 65.2 66 4.864 18.9 19 20.1 22
4.256 65.6 67 71.2 70 5.472 19.5 20 22.7 26
4.864 69.4 70 75.6 73
5.472 72 72 78.4 75 Mean average 6.8 %
123
Arab J Sci Eng
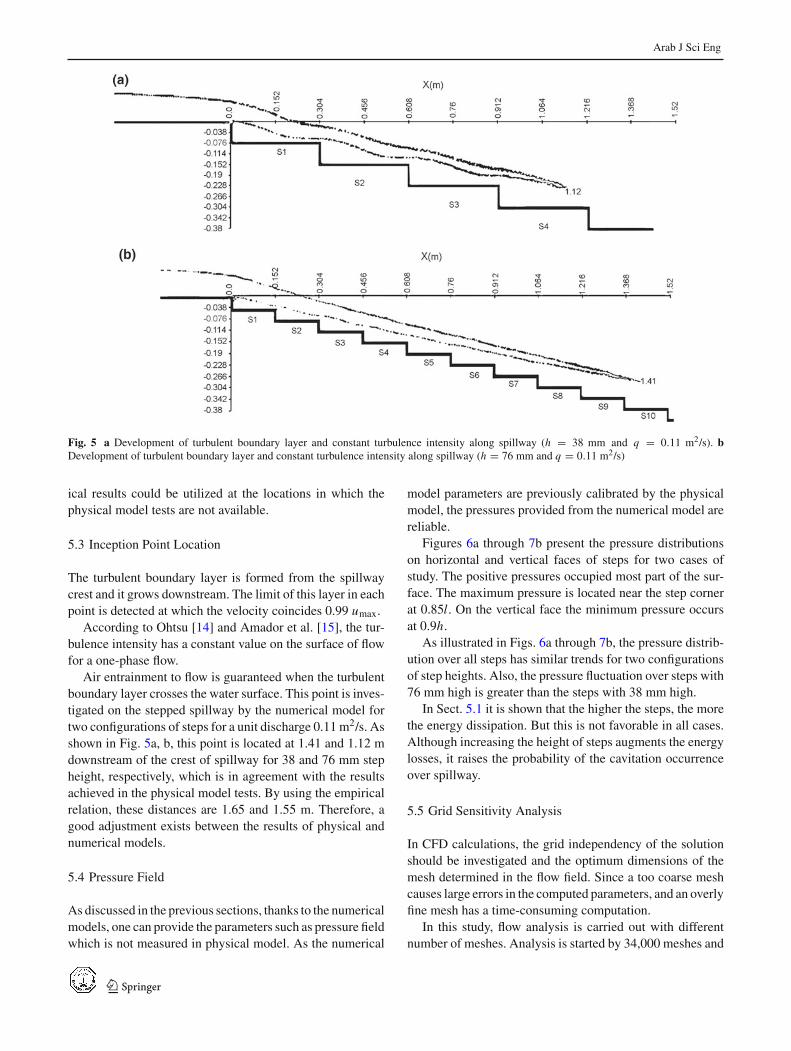
Fig. 5 a Development of turbulent boundary layer and constant turbulence intensity along spillway (h = 38 mm and q = 0.11 m2/s). bDevelopment of turbulent boundary layer and constant turbulence intensity along spillway (h = 76 mm and q = 0.11 m2/s)
ical results could be utilized at the locations in which thephysical model tests are not available.
5.3 Inception Point Location
The turbulent boundary layer is formed from the spillwaycrest and it grows downstream. The limit of this layer in eachpoint is detected at which the velocity coincides 0.99 umax.
According to Ohtsu [14] and Amador et al. [15], the tur-bulence intensity has a constant value on the surface of flowfor a one-phase flow.
Air entrainment to flow is guaranteed when the turbulentboundary layer crosses the water surface. This point is inves-tigated on the stepped spillway by the numerical model fortwo configurations of steps for a unit discharge 0.11 m2/s. Asshown in Fig. 5a, b, this point is located at 1.41 and 1.12 mdownstream of the crest of spillway for 38 and 76 mm stepheight, respectively, which is in agreement with the resultsachieved in the physical model tests. By using the empiricalrelation, these distances are 1.65 and 1.55 m. Therefore, agood adjustment exists between the results of physical andnumerical models.
5.4 Pressure Field
As discussed in the previous sections, thanks to the numericalmodels, one can provide the parameters such as pressure fieldwhich is not measured in physical model. As the numerical
model parameters are previously calibrated by the physicalmodel, the pressures provided from the numerical model arereliable.
Figures 6a through 7b present the pressure distributionson horizontal and vertical faces of steps for two cases ofstudy. The positive pressures occupied most part of the sur-face. The maximum pressure is located near the step cornerat 0.85l. On the vertical face the minimum pressure occursat 0.9h.
As illustrated in Figs. 6a through 7b, the pressure distrib-ution over all steps has similar trends for two configurationsof step heights. Also, the pressure fluctuation over steps with76 mm high is greater than the steps with 38 mm high.
In Sect. 5.1 it is shown that the higher the steps, the morethe energy dissipation. But this is not favorable in all cases.Although increasing the height of steps augments the energylosses, it raises the probability of the cavitation occurrenceover spillway.
5.5 Grid Sensitivity Analysis
In CFD calculations, the grid independency of the solutionshould be investigated and the optimum dimensions of themesh determined in the flow field. Since a too coarse meshcauses large errors in the computed parameters, and an overlyfine mesh has a time-consuming computation.
In this study, flow analysis is carried out with differentnumber of meshes. Analysis is started by 34,000 meshes and
123

Arab J Sci Eng
Fig. 6 a Pressure distribution on vertical face of steps (h = 38 mm).b Pressure distribution on horizontal face of steps (h = 38 mm)
Fig. 7 a Pressure distribution on vertical face of steps (h = 76 mm).b Pressure distribution on horizontal face of steps (h = 76 mm)
during the adaption processes, the number of meshes areincreased to 60,000 until 110,000 in different cases. In the
Fig. 8 Sketch of mesh generated in the flow field
adaption process, the number of meshes is increased in thefollowing locations:
– Where reduction of gradient in certain parameters suchas velocity, pressure, density, turbulence intensity, etc. isrequired.
– Where high precision in certain parameters such as watersurface is required.
A sketch of the mesh generated in the flow field is presentedin Fig. 8.
6 Modeling and Similitude
The parameters measured in a scale model could be appliedto prototype by proper scale ratios. Similarly, the parame-ters attained in a numerical model which is adjusted to thephysical model could be applied to the prototype.
In this study the numerical model corresponds appropri-ately to the physical model in the domain of the labora-tory results. Therefore the numerical model can be utilizedto observe the prototype behavior, especially in conditionswhich are impractical in laboratory, by applying the properscale ratio of each parameter. In this study, the pressure fieldin the vicinity of steps is obtained from the numerical analysiswhich is not measured in the scale model.
Also, in order to reduce the scale model costs, one can testdifferent alternatives with the aid of numerical model.
7 Conclusions
In this paper, the hydraulics of stepped spillways is studiedby numerical model. In order to get closer to reality, a mesh
123

Arab J Sci Eng
sensitivity analysis is executed and an optimum number ofgrids are adapted for the flow field. The number of meshesis increased in locations where a high gradient in hydraulicparameters is observed or a higher precision is required. Theinception point of air entrainment, the energy losses and thevelocity profiles over the stepped spillways are investigatedand compared in physical and numerical models. The orderof errors in energy losses and velocity profile between thephysical and numerical models is about 5 %.
Unlike the physical model which is highly limited dueto restrictions of laboratory equipments and measurementapparatus, and dependent on the scale of model, by meansof the numerical model immeasurable parameters could beobtained. Also, the advantages and disadvantages of differentsolutions could be evaluated by considering all parametershaving their own roles in the phenomena. Certain parametersare measured in the scale model and the others are obtainedfrom a numerical model adapted to the scale model.
Also this study represented that the energy losses overstepped spillway increases with the height of steps and viceversa. But according to the numerical model this is not alwaysdesirable, because the pressure field and its fluctuation arehighly dependent on the height of steps.
References
1. Hunt, S.L.; Kadavy, K.C.: The effect of step height on energydissipation in stepped spillways. World Environmental and WaterResources Congress. ASCE, Great Rivers, pp. 3061–3071 (2009)
2. Qian, Z.; XiaoQing, H.; WenXin, H.; AMADOR, A.: Numericalsimulation and analysis of water flow over stepped spillways. SciChina Ser. E-Tech. Sci. 52(7), 1958–1965 (2009)
3. Boes, R.M.; Hager, W.H.: Hydr aulic design of stepped spillways.J. Hydrol. Eng. ASCE 129(9), 671–679 (2003)
4. Tongkratoke, A.; Chinnarasri, C.; Pornprommin, A.;Dechaumphai, P.; Juntasaro, V.: Non-linear turbulence mod-els for multiphase recirculating free-surface flow over steppedspillways. Int. J. Comput. Fluid Dyn. 23(5), 401–409 (2009)
5. Chanson, H.: The Hydraulics of Stepped Chutes and Spillways.Bulkema Publ., The Netherlands, pp. 140–180 (2002)
6. Hunt, S.L.; Kadavy, K.C.: Velocities and energy dissipation on aflatsloped stepped spillway. In: Proceedings of American Societyof Agriculutral and Biological Engineers (ASABE) Annual Inter-national Meeting, Paper No. 084151. ASABE, St. Joesph (2008)
7. Takahashi, M.; Gonzalez, C.A.; Chanson, H.: Self-aeration and tur-bulence in a stepped channel: influence of cavity surface roughness.Int. J. Multiphase Flow 32, 1370–1385 (2006)
8. Boes, R.M.; Hager, W.H.: Two-phase flow characteristics ofstepped spillways. J. Hydrol. Eng. ASCE 129(9), 661–670 (2003)
9. Motamedi Zoka, H.; Omidian, A.; Kholghi, H.: A comparativeassessment of compressible Reynolds Stress model and some vari-ant k-ε for engine flow applications. Arab. J. Sci. Eng. 37(6), 1737–1749 (2012)
10. Karimi, M.; Jahromi, H.: Turbulence models in skimming flowsimulation. 9th Iranian Conference of Hydraulics, Tarbiat ModarresUniversity, Tehran (2010)
11. Kavianpoor, M.; Moshtaghian, A.; Shamloo, H.; Najafi, M.: Airentrainment mechanism in stepped spillways. 7th Iranian Confer-ence of Hydraulics, Power and Water University of Technology,Tehran (2008)
12. Hosseini, M.; Kavianpoor, M.: Characteristics of two-phase flowover stepped spillways. 9th Iranian Conference of Hydraulics, Tar-biat Modarres University, Tehran (2010)
13. Mirzaeian, A.; Javan, M.: Comparison VOF and Mixture models inskimming flow simulation. 9th Iranian Conference of Hydraulics,Tarbiat Modarres University, Tehran (2010)
14. Ohtsu, I.; Yasuda, Y.: Characteristics of flow conditions on steppedchannels. In: Proceedings of 27th IAHR Biennal Congress, ThemeD, San Francisco, pp. 583–588 (1997)
15. Amador, A.; Sanchez-Juny, M.; Dolz, J.; Sanchez-Tembleque, F.;Puertas, J.: Velocity and pressure measurements in skimming flowin stepped spillways. In: Yazdandoost, F.; Attari, J. (eds.) Proceed-ings of the International Conference on Hydraulics of Dams andRiver Structures. Balkema Publ., Tehran, pp. 279–285 (2004)
123