the effect of using concept mapping on student’s …after ideas were arranged in categories, it...
TRANSCRIPT

European J of Physics Education Volume 5 Issue 4 2014 Luchembe, Chinyama, Jumbe
10
The Effect of Using Concept Mapping on Student’s Attitude and Achievement When Learning the Physics Topic of Circular and Rotational Motion
Dennis Luchembe1
Kaumba Chinyama2
Jack Jumbe3
1Mukuba University Natural Sciences Department
Kitwe, Zambia [email protected]
2,3The Copperbelt University
School of Mathematics and Natural Sciences Kitwe, Zambia
(Received: 11.08. 2014, Accepted: 25.11.2014)
Abstract The study was conducted to show the effectiveness of concept mapping as a teaching strategy to undergraduate students taking introductory physics course. A number of researchers have investigated the effectiveness of concept mapping on student academic achievement. The main focus of these studies have been on comparing the effectiveness of concept mapping to traditional teaching practices such as the lecture method. This research, however, compared concept mapping to tutorial sheets strategy in teaching circular and rotational motion. A sample of seventy (70) students participated in the experiment. An equivalent number of thirty five (35) students were assigned to the control and experimental group. The control group used tutorial sheets while the experimental group used concept mapping. A pre-test and post-test was administered to the two groups. A t-test was used to compare the means of the group’s test scores. The mean score for the experimental group’s post test was higher than the mean score of the control group. This showed that concept mapping was more effective than the tutorial sheet strategy. Questionnaires and interviews were also used to determine the attitude of students towards concept mapping. The findings showed that students had a positive attitude towards the use of concept mapping. Key words: concept mapping, tutorial sheet, link words, mixed method research Introductory Students face a number of challenges grasping topics involving circular and rotational motion. This problem is not unique to Mukuba University students. Dileep (2001) stated that sadly, the observation of educationists made in the last quarter of the 20th century showed that there was a global problem in learning of circular and rotational motion. This problem has continued. For example Mashood and Singh (2012) observed that even the elementary concepts of rotation like angular velocity )(ω prove difficult for students as well as teachers. The two gentlemen went further to observe that the domain of circular and rotational motion poses serious challenges for students and the topic has not yet received much attention from physics education research community.
Traditional learning instructions focuses on learning strategies that are intended to teach specific course content. Currently the emphasis is on learner centred strategies or strategies which teach learners how to learn. According to Sealfon (2012), some of these strategies are small group discussion, peer instruction, computer simulations and games, interactive lecture demonstrations, case studies, concept mapping and tutorial worksheets.

European J of Physics Education Volume 5 Issue 4 2014 Luchembe, Chinyama, Jumbe
11
This research presents and compares two ways of overcoming challenges faced by undergraduate students in understanding concepts when learning circular and rotational motion. These methods under study are concept mapping and tutorial sheet. Novak and Gowin (1984) claimed that concept mapping can increase the capacity for meaningful learning. It will, therefore, be interesting to determine the effectiveness of concept mapping over the tutorial sheet strategy. Research Questions
i. What is the student’s attitude towards the use of concept mapping in learning circular and rotational motion?
ii. What is the effect of using concept mapping on students’ learning achievement in the topic “circular and rotational motion”?
Participants The participants for the research were first year prospective teachers of physics taking introductory physics course (Phy 100) at Mukuba University. All members of the class were involved in the research. The number of students taking this course was seventy )70( =N . Out of this figure only three students were female. The experimental and control group had thirty-five students each )35( =n . Methodology A mixed method approach was used in this research. Qualitative and quantitative data were collected and analysed. According to Wisdom and Mihas (2014) mixed methods usually refers to contexts in which a researcher collects, analyses, and integrates both qualitative and quantitative data within a single study. A pretest-posttest experimental design was employed in this study. Students were assigned randomly to the experimental and control groups. This gave the study internal validity. Consequently, factors such as ability, age and maturation were controlled. Random selection, however, was not carried out in picking a particular class. This was because Mukuba University had only one class of introductory physics. Though appropriate in this case, not carrying out random selection had weaknesses. The major weakness was its lack of external validity. The following instruments were used:
1. Pre-test and post-test 2. Questionnaires 3. Semi-structured interviews
Student’s achievement in both pre-test and post-test made up the quantitative data while the interview and questionnaire responses made up the qualitative data. The research started in October 2013 and ended March 2014.
The experimental group used concept mapping while the control group used tutorial sheet. The first step in the experiment was to present a lecture to the entire class followed by a pre-test. Teaching of circular and rotational motion to the class took a week. This was equivalent to six hours of lecturing. The class was then divided into two tutorial groups before a post test was administered. The students were allocated to the control group and experimental group by random assignment which was in form of a lottery. Students were asked to pick one piece of paper from a box. The box had a total of seventy small rolled up pieces of papers corresponding to the number of students in the class. The papers were labeled one up to seventy. Each student draws a number out of this box. All students who draw odd

European J of Physics Education Volume 5 Issue 4 2014 Luchembe, Chinyama, Jumbe
12
numbers were put in the control group and those who draw even number were put in the experimental group.
Control group This tutorial group was taught using tutorial sheets - a method common at Mukuba University. The group was divided into seven sub-groups composed of five members per group. Dividing of students into sub-groups was done as students entered the tutorial class. The first student to enter was allocated group one, the second to enter was given group two until the fifth student who was allocated group five. The process was repeated until every student was assigned to a sub group.
Tutorial sheets were then distributed to members of the group to work on for four days. During this period, students were free to seek clarification on the questions contained in the tutorial sheet. These questions were deliberately set to elicit some discussion on particular concepts which were viewed to be problematic to students. In the next tutorial session, students were expected to present their solutions to the class. Any member of the class was free to chip in and make a contribution. A student giving solutions was asked to pause from time to time so that the class can discuss particular concepts that arose in the presentation. Additionally, presenter’s problems were easily identified and rectified. Tutorial discussions, therefore, helped clear student’s doubts and misconceptions. During this session the researcher was the moderator.
Experimental group This group was taught how to construct concept maps. The objectives of this lesson were to make students be able to;
(i) define a concept map (ii) construct a concept map on a given topic (iii) correctly link one concept to another (iv) correctly use link phrases
The topic, which was chosen for the purpose of teaching how to construct concept maps, was
Ohm’s law. This is a familiar topic to students also learned at secondary school O-level. With student input, the researcher organised ideas on Ohm’s law on the board. Ideas, expressions or terms students presented are shown in table1.
Table 1. Ideas and terms students presented to the class
Conductor Resistance Parallel connection Effect of thickness
Ohm’s law Ohmic conductor Series connection Current
Potential difference Non-Ohmic conductor Oppose flow of charge
Resistor Electron flow
The ideas presented by students were further put into categories. Table 2 shows how the
researcher and the students arranged them in three categories.
European J of Physics Education Volume 5 Issue 4 2014 Luchembe, Chinyama, Jumbe
13
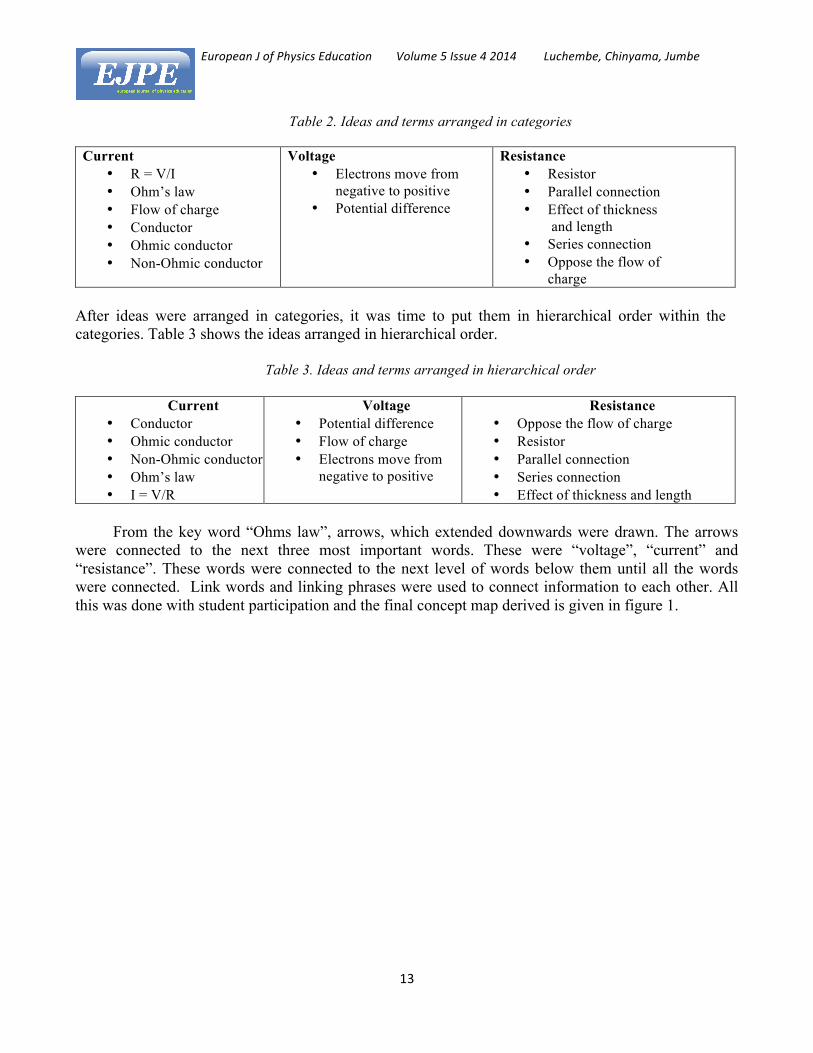
Table 2. Ideas and terms arranged in categories
Current • R = V/I • Ohm’s law • Flow of charge • Conductor • Ohmic conductor • Non-Ohmic conductor
Voltage • Electrons move from
negative to positive • Potential difference
Resistance • Resistor • Parallel connection • Effect of thickness
and length • Series connection • Oppose the flow of
charge After ideas were arranged in categories, it was time to put them in hierarchical order within the categories. Table 3 shows the ideas arranged in hierarchical order.
Table 3. Ideas and terms arranged in hierarchical order
Current • Conductor • Ohmic conductor • Non-Ohmic conductor • Ohm’s law • I = V/R
Voltage • Potential difference • Flow of charge • Electrons move from
negative to positive
Resistance • Oppose the flow of charge • Resistor • Parallel connection • Series connection • Effect of thickness and length
From the key word “Ohms law”, arrows, which extended downwards were drawn. The arrows
were connected to the next three most important words. These were “voltage”, “current” and “resistance”. These words were connected to the next level of words below them until all the words were connected. Link words and linking phrases were used to connect information to each other. All this was done with student participation and the final concept map derived is given in figure 1.

European J of Physics Education Volume 5 Issue 4 2014 Luchembe, Chinyama, Jumbe
14
Figure 1. Concept map with link-words and phrases
After the concept map was completed as shown in figure 1, students were asked to identify cross-
links. The cross-links were included resulting into the concept map shown in figure 2.

European J of Physics Education Volume 5 Issue 4 2014 Luchembe, Chinyama, Jumbe
15
Figure 2. Concept map with cross-links
A cross-link is a relationship that exists between two concepts in different vertical segments of the map (Dorough & Rye, 1997). These cross-links were a necessary measure of what students understood about the relationships between different concepts in the map.
Students were then asked to practice the construction of concept maps by constructing concept maps on any physics topic or topics. This was done within the class and students were able to construct

European J of Physics Education Volume 5 Issue 4 2014 Luchembe, Chinyama, Jumbe
16
their concept maps in about 45 minutes. During this process, the researcher went round checking student’s progress and gave advice where necessary.
The group was then divided into seven sub-groups composed of five members each. Dividing of students into sub-groups was done following the procedure outlined under the control group section. Finally, students were given an assignment to construct concept maps on circular and rotational motion. They were instructed to work on this assignment in their groups and present their concept maps after four days. Additionally, they were provided with markers, sheets of paper and bostic glue for sticking paper to the board during the presentation. The presentation was done during a tutorial session which lasted 3 hours. Pre-Test and Post-Test Measurements The pre-test was administered to the class. This test was given before the intervention was administered. This test helped to establish the homogeneity of the experimental and control groups. Achievement of students in the pre-test was the dependent variable while the independent variable in this case was the teaching approach used. A post-test was administered to the class after the intervention. The results were compared. The comparison was done between the experimental group and the control group’s post test scores. This was done in order to determine the group which achieved higher than the other. Achievement of students in this test was the dependent variable while the independent variable was the teaching approach used. Questionnaire A questionnaire was administered to the experimental group immediately after the post test. The questionnaire consisted of 14 Likert items with the following responses to choose from; ‘strongly disagree’, ‘disagree’, ‘neutral’, ‘agree’ and ‘strongly agree’. Scores of 1,2,3,4 and 5 corresponded to the responses. All the items on the questionnaire were meant to test student attitude towards concept mapping. Semi-structured interviews Interviews were conducted on members of the experimental group. The sampling procedure used in this section of the research was purposive. This is a very important procedure in that it can help a researcher get information, which could be helpful to the study. Mcmillan (1996) admitted that in purposive sampling the researcher selects particularly elements from the population that will be representative or informative about the topic. He went further to explain that based on the researcher’s knowledge of the population, a judgment is made about which cases should be selected to provide the best information to address the purpose of the research.
The selection of interviewees in this case depended on the student’s performance in the pre-test and post-test. The selection, therefore, was not based on representation but information that could be provided by the selected student.
The range between the highest score and the lowest score for each student was considered. This was done so as to get information from higher, medium and lower achievers. It helped in getting information from students of diverse achievement levels. The following categories of students were picked for this purpose:

European J of Physics Education Volume 5 Issue 4 2014 Luchembe, Chinyama, Jumbe
17
i. Two students who showed great improvement in performance (Higher achievers). ii. Two students whose performance appeared stagnant (Medium achievers).
iii. Two students whose performance dropped (Lower achievers).
A smart phone was used to record the interviews which were later transcribed and analysed. The interviews helped in gaining an in-depth understanding of student’s attitude to the use of concept maps.
Data analysis Descriptive and inferential statistics were computed for both pre-test and post-test. Data collected was entered into Statistical Package for Social Sciences (SPSS) statistics 20 program for Windows. Percentages, mean, standard deviation and frequencies where generated under descriptive statistics. Descriptive statistics made no predictions, but just reported on what had been observed. Descriptive statistics provides simple summaries about the sample (Trochim, 2006).
Before a t-test was performed the data was first tested to determine if it was normally distributed. The normality check was necessary. If not checked, the interpretations and inferences of results based on the data may not be reliable. A t-test is effective for data which is normally distributed. The Shapiro-Wilks test was chosen for this purpose because of the small sample size. Boyer (2013) suggested that the Shapiro-Wilk test of normality is valid only for a small number of observations of say between 5 and 38. The null hypothesis of this test is that the scores are normally distributed. Consequently, if the p-value is less than the chosen alpha level, then the null hypothesis is rejected. This would imply that the data is not normally distributed.
The analysis of data was done with the help of SPSS. Shapiro-Wilk normality test was then carried out for the control and the experimental group. On the output the column labeled "Sig" which is the p-value was checked. If the column displayed a number above 0.05, then the data was considered to be normally distributed. In other words the significance level for two-tailed was set to 0.05. This value was chosen because it is the most used value in educational research. For the Shapiro-Wilk test, the closer the "Sig" value is to 1, the more normal the sample is.
According to Institute for Digital Research and Education (2014) an independent t-test is designed to compare means of same variable between two groups. Independent sample t-test was carried out on the pre-test scores for both the control and experimental group. This procedure was to compare the mean score of both the control and experimental groups. Independent sample t-test was also carried out on the post-test scores for both the control and experimental group. This procedure was meant to compare the mean scores of both the control and experimental groups.
Semi-Structured Interviews analysis was approached as described by Rallis and Rossman (2003) in the following words, “Qualitative data analysis requires that the researcher approach the texts with an open mind, accepting the meanings and structures that emerge from it” (p. 62). Data presented includes some important illustrations. Hannan (2007) supports this approach by suggesting that qualitative analysis may include illustrations drawn from data of particularly significant.
European J of Physics Education Volume 5 Issue 4 2014 Luchembe, Chinyama, Jumbe
18
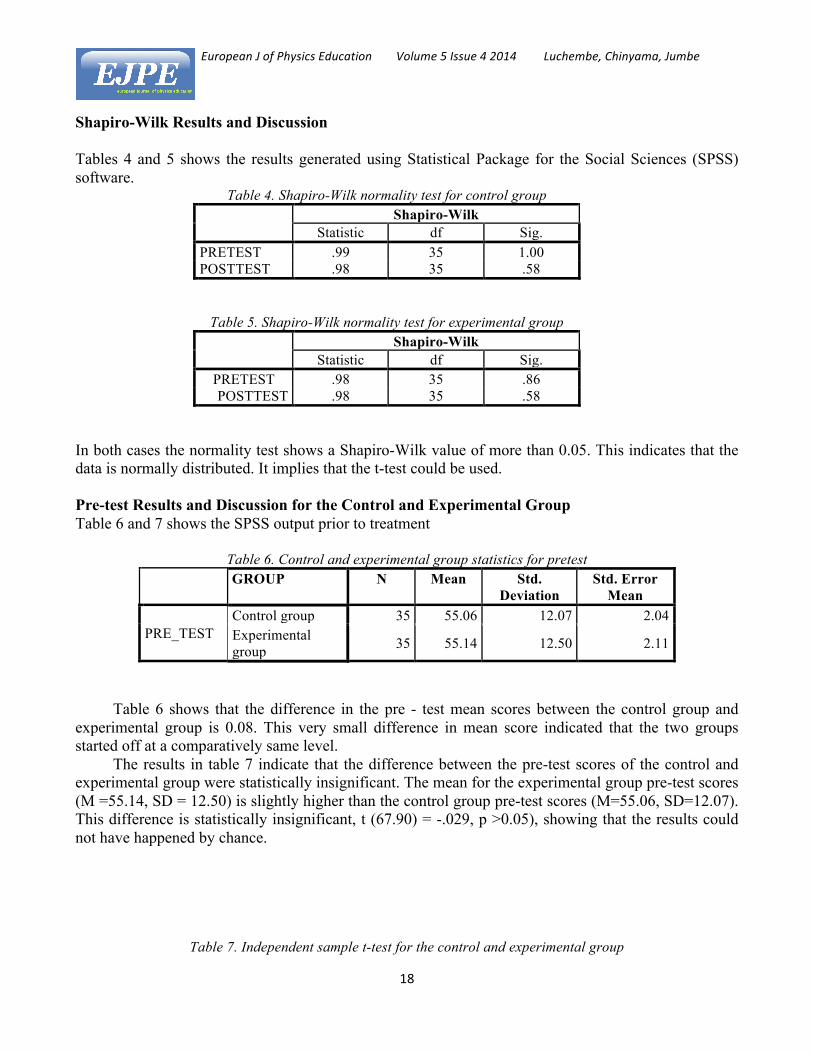
Shapiro-Wilk Results and Discussion Tables 4 and 5 shows the results generated using Statistical Package for the Social Sciences (SPSS) software.
In both cases the normality test shows a Shapiro-Wilk value of more than 0.05. This indicates that the data is normally distributed. It implies that the t-test could be used. Pre-test Results and Discussion for the Control and Experimental Group Table 6 and 7 shows the SPSS output prior to treatment
Table 6. Control and experimental group statistics for pretest
GROUP N Mean Std. Deviation
Std. Error Mean
PRE_TEST Control group 35 55.06 12.07 2.04 Experimental group 35 55.14 12.50 2.11
Table 6 shows that the difference in the pre - test mean scores between the control group and experimental group is 0.08. This very small difference in mean score indicated that the two groups started off at a comparatively same level.
The results in table 7 indicate that the difference between the pre-test scores of the control and experimental group were statistically insignificant. The mean for the experimental group pre-test scores (M =55.14, SD = 12.50) is slightly higher than the control group pre-test scores (M=55.06, SD=12.07). This difference is statistically insignificant, t (67.90) = -.029, p >0.05), showing that the results could not have happened by chance.
Table 7. Independent sample t-test for the control and experimental group
Table 4. Shapiro-Wilk normality test for control group Shapiro-Wilk
Statistic df Sig. PRETEST .99 35 1.00 POSTTEST .98 35 .58
Table 5. Shapiro-Wilk normality test for experimental group Shapiro-Wilk
Statistic df Sig. PRETEST .98 35 .86 POSTTEST .98 35 .58

European J of Physics Education Volume 5 Issue 4 2014 Luchembe, Chinyama, Jumbe
19
t-test for Equality of Means
t
df Sig.
(2-tailed) Mean
Difference
95% Confidence Interval of the
Difference Lower Upper
PRE_TESTT
Equal variances assumed -.029 68.00 .977 -.09 -5.95 5.77 Equal variances not
assumed -.029 67.90 .977 -.09 -5.95 5.77
Because there is no significant difference on the pre-test scores, it is therefore, an indication that the two groups started off with similar means. Post-test Results and Discussion for the Control and Experimental Group Table 8 and 9 shows the SPSS output after treatment
Table 8. Control and experimental group statistics
GROUP N Mean Std.
Deviation Std. Error
Mean
POST_TEST Control group 35 63.03 13.79 2.33 Experimental group 35 69.37 10.70 1.81
Table 8 shows that the difference in the post - test mean scores between the control group and experimental group is 6.34. This comparatively large difference in mean scores indicated that the experimental group achieved high than the control group.
Table 9. Independent sample t-test for the control and experimental group
t-test for Equality of Means
t df Sig. (2-tailed)
Mean Difference
95% Confidence Interval of the
Difference Lower Upper
POST_TEST Equal variances assumed -2.15 68.00 .035 -6.34 -12.23 -.46 Equal variances not assumed -2.15 64.05 .035 -6.34 -12.23 -.45
The results in table 9 indicate that the difference between the post-test scores of the control and
experimental group are statistically significant. The mean for the experimental group post test scores (M=69.37, SD=10.70) is higher than the mean for the control group post test scores (63.03, SD =13.79).This difference is statistically significant, t(64.05) = -2.15 , p < 0.05, indicating that the higher post-test scores by the experimental group is more than what would have been expected due to chance.

European J of Physics Education Volume 5 Issue 4 2014 Luchembe, Chinyama, Jumbe
20
Figure 3 shows the bar chats of the pre-test and post-test mean score results for the control and experimental group.
Figure 3. Pre-Test and Post-Test Results
In this study it was shown, therefore, that the experimental group achieved significantly higher
than the control group. The significant difference in mean score between the two groups is an indication of the effectiveness of the use of concept maps in teaching circular and rotational motion. The group that used concept mapping, therefore, performed better in the test than the group that used the tutorial sheet. This is in line with the research done by Horton et al (1993) who concluded that in general concept mapping had positive effect on student’s achievement. Questionnaire Results and Discussion Attitude of students towards the use of concept maps was determined by making use of questionnaires. According to Survey Monkey (2014), a Likert scale measures attitudes and behaviors using answer choices that range from one extreme to another. Students were asked to indicate on a 5‐point Likert scale whether they strongly agree, agree, neutral, disagree and strongly disagree. In this study strongly disagree = 1, disagree = 2, neutral = 3, agree = 4, strongly agree = 5. This helped to determine the degree of agreement with statement about the use of concept maps. Table 10 shows the frequency of responses for each Likert item.
55.06
63.03
55.14
69.37
0
10
20
30
40
50
60
70
80
pre-‐test post-‐test
Mean score
Control group
Experimental group

European J of Physics Education Volume 5 Issue 4 2014 Luchembe, Chinyama, Jumbe
21
Table 10. Frequency of responses
Strongly disagree
Disagree
Neutral
Agree Strongly agree
I enjoyed constructing concept maps. 0
0
3
12
20
I now enjoy solving problems involving circular and rotational motion.
0
0
11
6
18
After learning this topic-using concept mapping, I feel encouraged to study the topic.
0
0
1
3
31
I understand how to construct concept maps.
0
0
10
9
16
I felt comfortable preparing for the test.
0
0
9
12
14
I felt comfortable writing the test. 0
0
6
12
17
I will use concept maps when revising other physics topics.
0
0
3
9
23
I want many more physics topics to be taught using concept maps.
0
2
4
9
20
I will teach some topics using concept maps when I start my teaching at secondary school.
0
0
3
9
23
Reasoning skills learnt through this topic can help me in everyday life.
0
0
2
12
21
I connect what I learnt to everyday life.
0
2
9
9
15
In understanding this topic, I related new information to what I already knew.
0
0
7
16
12
I have discussed concept maps with friends.
0
0
6
15
14
All Likert items in this study were formulated with a view to expose learners’ attitude to concept mapping. For example interest towards concept mapping was investigated by using the Likert item that asked students’ opinion on whether or not they enjoyed constructing concept maps. The result of this investigation was that most students enjoyed concept mapping. Enjoying ones work is seen to be very
European J of Physics Education Volume 5 Issue 4 2014 Luchembe, Chinyama, Jumbe
22
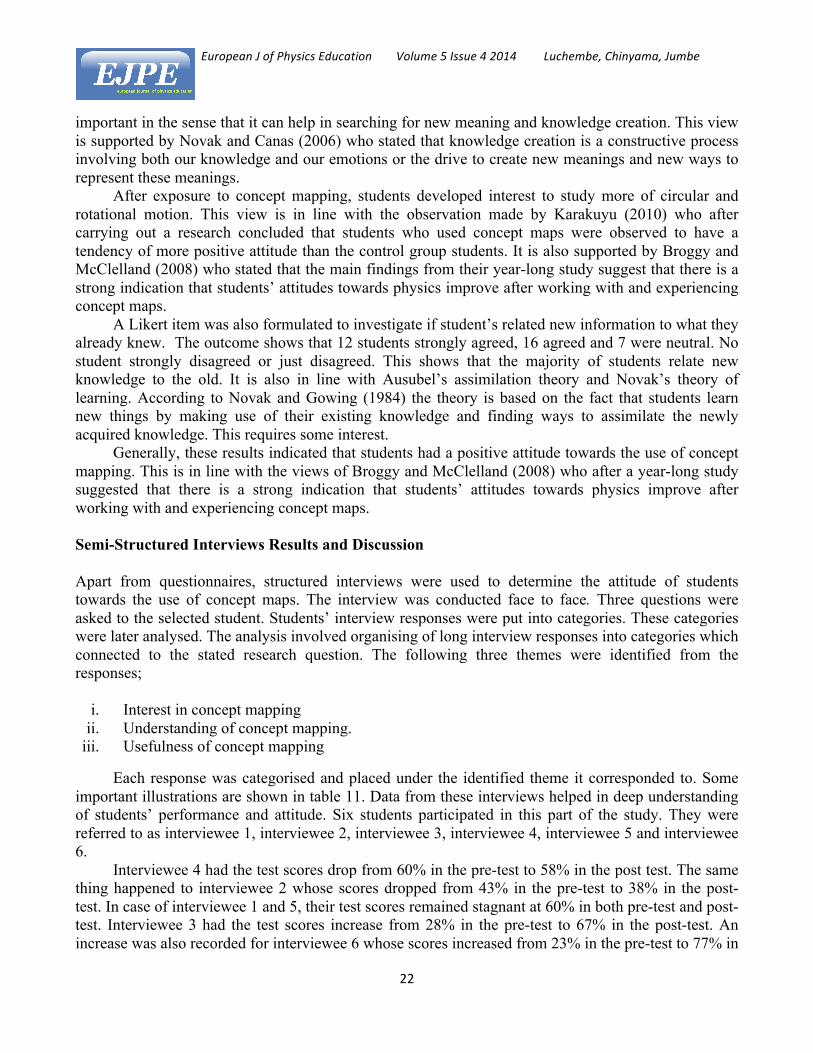
important in the sense that it can help in searching for new meaning and knowledge creation. This view is supported by Novak and Canas (2006) who stated that knowledge creation is a constructive process involving both our knowledge and our emotions or the drive to create new meanings and new ways to represent these meanings.
After exposure to concept mapping, students developed interest to study more of circular and rotational motion. This view is in line with the observation made by Karakuyu (2010) who after carrying out a research concluded that students who used concept maps were observed to have a tendency of more positive attitude than the control group students. It is also supported by Broggy and McClelland (2008) who stated that the main findings from their year-long study suggest that there is a strong indication that students’ attitudes towards physics improve after working with and experiencing concept maps.
A Likert item was also formulated to investigate if student’s related new information to what they already knew. The outcome shows that 12 students strongly agreed, 16 agreed and 7 were neutral. No student strongly disagreed or just disagreed. This shows that the majority of students relate new knowledge to the old. It is also in line with Ausubel’s assimilation theory and Novak’s theory of learning. According to Novak and Gowing (1984) the theory is based on the fact that students learn new things by making use of their existing knowledge and finding ways to assimilate the newly acquired knowledge. This requires some interest.
Generally, these results indicated that students had a positive attitude towards the use of concept mapping. This is in line with the views of Broggy and McClelland (2008) who after a year-long study suggested that there is a strong indication that students’ attitudes towards physics improve after working with and experiencing concept maps. Semi-Structured Interviews Results and Discussion
Apart from questionnaires, structured interviews were used to determine the attitude of students towards the use of concept maps. The interview was conducted face to face. Three questions were asked to the selected student. Students’ interview responses were put into categories. These categories were later analysed. The analysis involved organising of long interview responses into categories which connected to the stated research question. The following three themes were identified from the responses;
i. Interest in concept mapping ii. Understanding of concept mapping.
iii. Usefulness of concept mapping
Each response was categorised and placed under the identified theme it corresponded to. Some important illustrations are shown in table 11. Data from these interviews helped in deep understanding of students’ performance and attitude. Six students participated in this part of the study. They were referred to as interviewee 1, interviewee 2, interviewee 3, interviewee 4, interviewee 5 and interviewee 6.
Interviewee 4 had the test scores drop from 60% in the pre-test to 58% in the post test. The same thing happened to interviewee 2 whose scores dropped from 43% in the pre-test to 38% in the post- test. In case of interviewee 1 and 5, their test scores remained stagnant at 60% in both pre-test and post- test. Interviewee 3 had the test scores increase from 28% in the pre-test to 67% in the post-test. An increase was also recorded for interviewee 6 whose scores increased from 23% in the pre-test to 77% in

European J of Physics Education Volume 5 Issue 4 2014 Luchembe, Chinyama, Jumbe
23
the post test. It was, therefore, interesting to find out the attitude these students had towards concept mapping. In this part of the research, the performance in the test of interviewee 4 and 2 was described as poor. That of interviewee 1 and 5 was described as fair and the performance of interviewee 3 and 6 were considered as good.
The first category discusses the findings of the study which sought to investigate the interest which students had in regards to the use of concept maps. All the students interviewed indicated some interest in learning concept mapping. The interview revealed that students whose post test scores improved or remained the same had showed interest in the use of concept maps. This result is shown by the responses of interviewee 1, 3 5 and 6 under interest. The study also brought to light the fact that students who did not show interest in concept maps performed poorly in the post test. This applies to interviewee 2 and 4.
Table 11. Interview responses under the themes Interest, understanding and usefulness
Interviewee Responses Interest Understanding Usefulness
1 I think, since we are going into the holiday, I will try to work with friends.
The formulas may have confused me. I got mixed up.
I think it was ok. I just need more time to go through.
2 We were three in the group. We had all the formulas and necessary data, but we never agreed on how to draw the maps
The problem could have been that I didn’t know how to use concept maps. That could be the reason why our concept map was not drawn that entire well.
But when I was preparing I thought concept mapping would make things easy for me.
3 I expected to do better than that. At first I found concept mapping to be very much challenging. But when I started using it, I found it to be very much helpful.
Concept maps helped me summarise the topics
4 I think I relaxed a bit in terms of studying.
With the idea of concept mapping - I think it is a good idea in the sense that it helped me understand the topic.
Concept mapping helped me understand the topic
5 I liked concept maps I didn’t know such things exist it is unfortunate I didn’t do well
For the second test I was not feeling well so I did not get things right
I used concept mapping when I was going through my work.
6 My group was interested in concept maps. That is why, I think, we come up with a very good map.
We wanted to draw a good map. It was simple for us. The part for cross- links was initially challenging.
I used the same concept map we presented in class do study.
Interviewee 2 indicated that there was some disagreement in their group. Members of the group
failed to accommodate all voices. This made the group not to come to a collective agreement on their concept map. This is the disadvantage of collaborative concept mapping which was observed by Tyler and De George-Walker (2013) when they stated that concept mapping is not without its challenges such as how to maintain the presence and contributions of the many member voices and, how to deal with the barriers to developing complete and meaningful concepts and propositions. The group were
European J of Physics Education Volume 5 Issue 4 2014 Luchembe, Chinyama, Jumbe
24
interviewee 2 belonged did not show a lot of interest in concept mapping exercise. Interviewee 4 on the other hand relaxed and did not study the topic. This may explain the poor results.
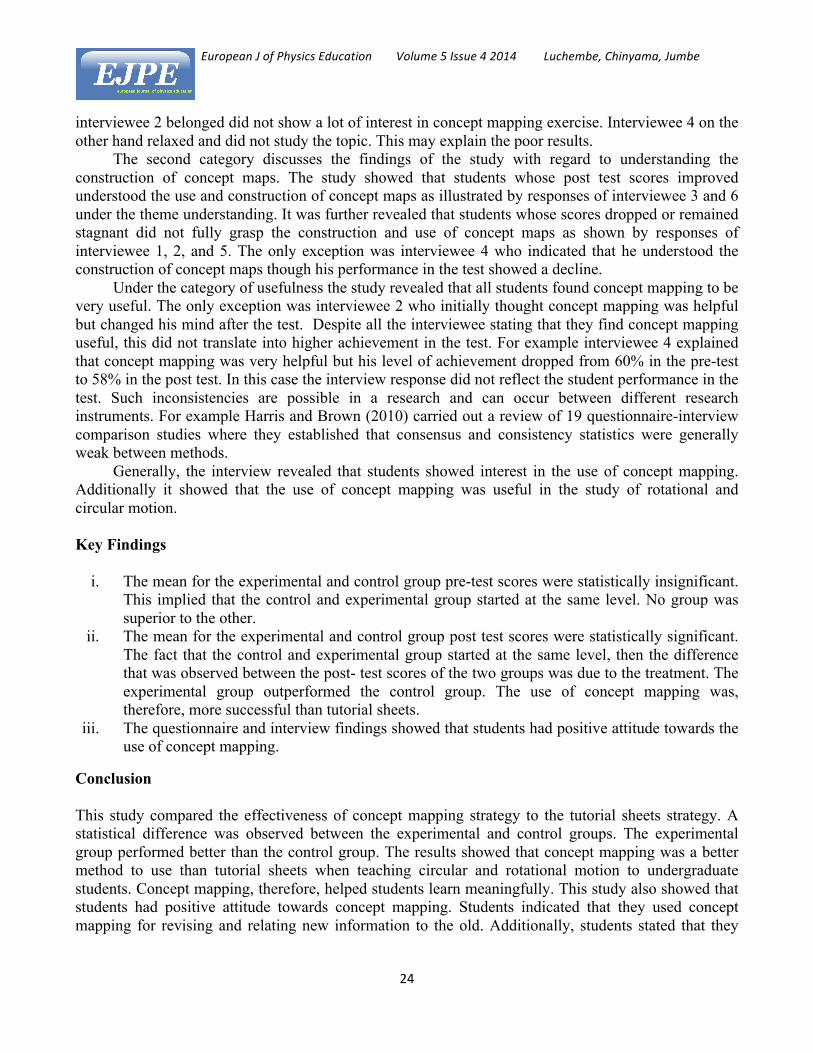
The second category discusses the findings of the study with regard to understanding the construction of concept maps. The study showed that students whose post test scores improved understood the use and construction of concept maps as illustrated by responses of interviewee 3 and 6 under the theme understanding. It was further revealed that students whose scores dropped or remained stagnant did not fully grasp the construction and use of concept maps as shown by responses of interviewee 1, 2, and 5. The only exception was interviewee 4 who indicated that he understood the construction of concept maps though his performance in the test showed a decline.
Under the category of usefulness the study revealed that all students found concept mapping to be very useful. The only exception was interviewee 2 who initially thought concept mapping was helpful but changed his mind after the test. Despite all the interviewee stating that they find concept mapping useful, this did not translate into higher achievement in the test. For example interviewee 4 explained that concept mapping was very helpful but his level of achievement dropped from 60% in the pre-test to 58% in the post test. In this case the interview response did not reflect the student performance in the test. Such inconsistencies are possible in a research and can occur between different research instruments. For example Harris and Brown (2010) carried out a review of 19 questionnaire-interview comparison studies where they established that consensus and consistency statistics were generally weak between methods.
Generally, the interview revealed that students showed interest in the use of concept mapping. Additionally it showed that the use of concept mapping was useful in the study of rotational and circular motion. Key Findings
i. The mean for the experimental and control group pre-test scores were statistically insignificant. This implied that the control and experimental group started at the same level. No group was superior to the other.
ii. The mean for the experimental and control group post test scores were statistically significant. The fact that the control and experimental group started at the same level, then the difference that was observed between the post- test scores of the two groups was due to the treatment. The experimental group outperformed the control group. The use of concept mapping was, therefore, more successful than tutorial sheets.
iii. The questionnaire and interview findings showed that students had positive attitude towards the use of concept mapping.
Conclusion This study compared the effectiveness of concept mapping strategy to the tutorial sheets strategy. A statistical difference was observed between the experimental and control groups. The experimental group performed better than the control group. The results showed that concept mapping was a better method to use than tutorial sheets when teaching circular and rotational motion to undergraduate students. Concept mapping, therefore, helped students learn meaningfully. This study also showed that students had positive attitude towards concept mapping. Students indicated that they used concept mapping for revising and relating new information to the old. Additionally, students stated that they

European J of Physics Education Volume 5 Issue 4 2014 Luchembe, Chinyama, Jumbe
25
would use concept maps in other physics topics and would further use concept mapping when they start teaching in schools. References
Boyer, M. M. (2013).Underwriting apophenia and cryptids: Are cycles statistical figments of our imaginations? Retrieved April 10, 2014 from http://www.cirano.qc.ca/pdf/publication/2013s-07.pdf Broggy, J., & Mcclelland, G.(2008). Undergraduate students’ attitudes towards physics after a concept mapping experience: University of Limerick, Ireland Dileep, V.S. (2001). A problem in learning Bohr’s theory of hydrogen atom: Chemical Education International, vol. 2, no 1, pp 26-27. Retrieved August 31, 2013 from http://www.docstoc.com/docs/20848975/A-problem-in-learning-Bohrs-theory-of- hydrogen-atom Dorough, D.K., & Rye, J.A. (1997). Mapping for understanding-using concept maps as windows to students minds’ Science Teacher, vol.64, no.1, pp 36-41 Harris, L. R., & Brown. T. L. (2010). Mixing interview and questionnaire methods: Practical assessment, Research and Evaluation, vol.15, no.1 Hannan, A. (2007). Interviews in education research. Retrieved February 28, 2014 from http://www.edu.plymouth.ac.uk/resined/interviews/inthome.htm Horton, P. B., McConney, A. A., Gallo, M., Woods, A. L., Senn, G. J. & Hamelin, D.
(1993). An investigation of the effectiveness of concept mapping as an instructional tool. Science Education, 77(1), 95-111.
Institute for Digital Research and Education. (2014). Annotated SPSS Output: t-test. Retrieved February 25, 2014 from http://search.yahoo.com/search;_ylt=A0LEVzxcnwxTjVIAmD1XNyoA?p=indepented+a nd+paired+t+tests&ei=UTF-8&type=501549&fr=chr-greentree_ff&b=41&pstart=5 Mashood, K. K., & Singh, V, A. (2012). Rotational kinematics of a particle in rectilinear motion: Perceptions and Pitfalls: The American Journal of Physics: American Association of Physics Teachers. Vol. 80, no.8, pp720-723. Retrieved October 14, 2013 from http://www.deepdyve.com/lp/american-association-of-physics-teachers/rotational- kinematics-of-a-particle-in-rectilinear-motion-perceptions-mMpwxWCWUc/fulltext Mcmillan, H. (1996). Educational Research Fundamentals for the Consumer. Harper Collins College Publishers: NewYork Novak, J. D., & Gowin, D. B. (1984). Learning how to learn. New York: Cambridge University
Press. Rallis, R., & Rossman, G. (2003). Learning in the field: An introduction to qualitative research (2nded). London: Sage Publications, Inc. Sealfon, C. (2012). Student-Centered Teaching Methods: Council on Science and Technology, Retrieved on April 10, 2014 from http://www.princeton.edu/~csealfon/resources SurveyMonkey. (2014). Likert scale for rating Questionnaire Responses. Retrieved on October 28, 2014 from http://search.yahoo.com/search;_ylt=A0LEVxU91BBTeGkAj75XNyoA?p=likerd+scale &ei=UTF-8&type=501549&fr=chr-greentree_ff&b=11&pstart=4 Trochim, W. M. (2006). The Research Methods Knowledge Base.(2nd Edition). Retrieved October 03, 2013from http://www.socialresearchmethods.net/kb/

European J of Physics Education Volume 5 Issue 4 2014 Luchembe, Chinyama, Jumbe
26
Tyler M. A and De George-Walker. L. (2013).Repurposing collaborative concept mapping: from enriching student learning to strengthening an education research team. Retrieved on December 21, 2013 from http://www.aare.edu.au/ Wisdom, J., & Mihas,P. (2009). Mixed methods: approaches for combining qualitative and quantitative research: ICPSR Summer Program in Quantitative Methods of Social Research, vol. 1, pp 1- 12. Retrieved on February 20, 2014 from http://search.yahoo.com/search?p=mixed+method+approach&ei=UTF-8&fr=chr- greentree_ff&ilc=12&type=501549
European J of Physics Education Volume 5 Issue 4 2014 Luchembe, Chinyama, Jumbe
27
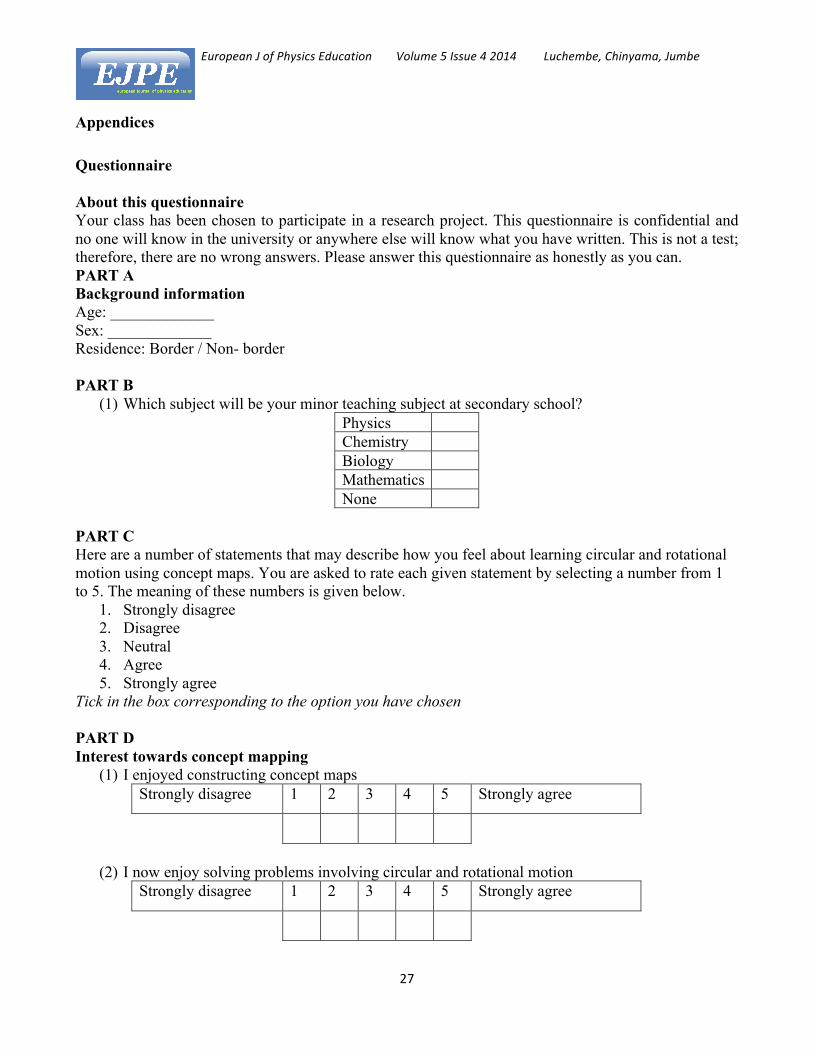
Appendices Questionnaire About this questionnaire Your class has been chosen to participate in a research project. This questionnaire is confidential and no one will know in the university or anywhere else will know what you have written. This is not a test; therefore, there are no wrong answers. Please answer this questionnaire as honestly as you can. PART A Background information Age: _____________ Sex: _____________ Residence: Border / Non- border PART B
(1) Which subject will be your minor teaching subject at secondary school? Physics Chemistry Biology Mathematics None
PART C Here are a number of statements that may describe how you feel about learning circular and rotational motion using concept maps. You are asked to rate each given statement by selecting a number from 1 to 5. The meaning of these numbers is given below.
1. Strongly disagree 2. Disagree 3. Neutral 4. Agree 5. Strongly agree
Tick in the box corresponding to the option you have chosen PART D Interest towards concept mapping
(1) I enjoyed constructing concept maps Strongly disagree 1 2 3 4 5 Strongly agree
(2) I now enjoy solving problems involving circular and rotational motion
Strongly disagree 1 2 3 4 5 Strongly agree

European J of Physics Education Volume 5 Issue 4 2014 Luchembe, Chinyama, Jumbe
28
(3) After learning this topic using concept maps, I feel encourage to study the topic more.
Strongly disagree 1 2 3 4 5 Strongly agree
PART E Usage of concept mapping
(1) I understand how to construct concept maps Strongly disagree 1 2 3 4 5 Strongly agree
PART F Anxiety in preparing the test
(1) I felt comfortable preparing for the test Strongly disagree 1 2 3 4 5 Strongly agree
(2) I felt comfortable writing the test
Strongly disagree 1 2 3 4 5 Strongly agree
PART G Studying other physic topics using concept maps
(1) I will use concept maps when revising other physics topics. Strongly disagree 1 2 3 4 5 Strongly agree
(2) I what many more physics topics to be taught using concept maps
Strongly disagree 1 2 3 4 5 Strongly agree
PART H Utilizing concept maps when employed as a teacher
(1) I will teach some topics using concept maps when I start my teaching at secondary school. Strongly disagree 1 2 3 4 5 Strongly agree

European J of Physics Education Volume 5 Issue 4 2014 Luchembe, Chinyama, Jumbe
29
PART I Help in everyday life
(1) Reasoning skills learnt through this topic can help me in everyday life Strongly disagree 1 2 3 4 5 Strongly agree
(2) I connect what I learnt to everyday life
Strongly disagree 1 2 3 4 5 Strongly agree
PART J Relating new information to the old
(1) In understanding this topic I related new information to what I already knew. Strongly disagree 1 2 3 4 5 Strongly agree
PART K I discussed concept maps with friends
(1) I have discussed concept maps with friends Strongly disagree 1 2 3 4 5 Strongly agree