the effectiveness of working capital management … 136/kaczmarek.pdf · 31 working capital...
TRANSCRIPT
S I L E S I A N U N I V E R S I T Y O F T E C H N O L O G Y P U B L I S H I N G H O U S E
SCIENTIFIC PAPERS OF SILESIAN UNIVERSITY OF TECHNOLOGY 2019
ORGANIZATION AND MANAGEMENT SERIES NO. 136
http://dx.doi.org/10.29119/1641-3466.2019.136.16 https://www.polsl.pl/Wydzialy/ROZ/Strony/Zeszytynaukowe.aspx
THE EFFECTIVENESS OF WORKING CAPITAL MANAGEMENT 1
STRATEGIES IN MANUFACTURING ENTERPRISES 2
Jarosław KACZMAREK 3
Cracow University of Economics; [email protected], ORCID: 0000-0002-2554-814X 4
Abstract: The paper presents the results of a study aimed at identifying and assessing the 5
efficiency of working capital management strategies in enterprises. The analysis focuses on the 6
volumes of net working capital and its cycle (dependent variable), as well as the conversion 7
cycles of its main components (independent variables). The study comprises the entire 8
population of manufacturing enterprises in Poland covered by public statistics (nearly 9
14 thousand entities), divided into size categories (small, medium and large). The long-term 10
analysis covers the period of 2007-2018. The study makes use of the measures that characterise 11
working capital management strategies and their effects including net working capital volumes 12
and working capital cycles. The study also employs measures related to correlations, similarity, 13
density, positioning and classifying, as well as descriptive statistics. The effect of the study is 14
the verification of three research hypotheses related to the characteristics, correlations, profile 15
similarities and identification of working capital strategies in manufacturing enterprises. 16
Keywords: working capital management, efficiency, strategies. 17
1. Introduction 18
The paper aims to identify corporate working capital strategies and assess their 19
effectiveness. The study is based on the long-standing research of the entire population of 20
manufacturing enterprises in Poland (13,857 entities, accounting for 81.5% of all profitable 21
entities, 2,045 in operation, representing PLN 1,368bn revenues from sales, 41.0% of value 22
added of the sector of enterprises, with more than 9 employees), included in public statistics, 23
divided into size categories (small, medium and large). The paper gives special attention to net 24
working capital strategies and their cycles (dependent variable), as well as the conversion cycles 25
of working capital components (independent variables). 26
27
192 J. Kaczmarek
The main objective of the empirical part of the paper is to present a comparative assessment 1
of manufacturing enterprises in 2007-2018, and, in particular, to: 2
identify relevant characteristics and correlations, 3
present a comparative assessment of profiles, 4
identify working capital management strategies. 5
The effectiveness of working capital management is assessed on the basis of a number of 6
measures which are presented in the methodological part of this paper, including the cycles and 7
conversion cycles of working capital components. The existing correlations are analysed with 8
the use of a correlation measure, and the movement of objects is assessed using a density 9
measure. Company profiles (size categories: small, medium and large) are analysed using 10
a similarity measure. The identification of working capital strategies is based on positioning in 11
relation to cycles and conversion cycles, as well as descriptive statistics. 12
The scope of the research study (all manufacturing enterprises) and its long-term character 13
justifies formulating conclusions of a general and universal character. 14
The verification of the hypotheses related to research objectives are presented in the 15
summary. The hypotheses related to the population of manufacturing enterprises are as follows: 16
H1 – Net working capital cycle is correlated with: a) financial liquidity, b) cash position (short-17
term investment), and c) profitability of sales, 18
H2 – Company profiles according to PKD (Polish Classification of Activities) have the greatest 19
impact on the net working capital cycle and its components in the case of small and large 20
companies, 21
H3 – The dominating working capital strategy is a moderate strategy adopted in the majority of 22
small and medium enterprises. 23
The presented results and considerations constitute part of an extensive research study of 24
the institutional sector of enterprises in Poland and part of a series of publications. 25
2. Literature review 26
An important role in a company’s short–term management is played by working capital. 27
It is part of a company’s equity engaged in financing current assets (Brigham, and Houston, 28
2007). The objective of working capital is to mitigate risks resulting from the lack of use of or 29
losses in current assets (Gołębiowski, and Tłaczała, 2009). It is identified (related to) with 30
working capital management, as well as financial liquidity measures (Wędzki, 2003). 31
Working capital management is a process of influencing the volume and structure of current 32
assets and the relevant sources of financing (Adam, 2007). In the first place, the process aims 33
to maintain financial liquidity, but it also affects a company’s efficiency (Filbeck, and Krueger, 34
2005). Its objective is to optimise the costs of maintaining and financing current assets (Andrew, 35
The effectiveness of working capital management strategies… 193
and Gallagher, 2007). All these activities are conditioned by ensuring low risk, enhancing the 1
effectiveness of working capital management (Groppelli, and Nikbakht, 2006). 2
The effectiveness of working capital management is measured by the working capital cycle, 3
which results from its circulation movement – going through all circulation phases creates 4
a cash circulation cycle (Richards, and Laughlin, 1980). The increased effectiveness of working 5
capital management is achieved through the shortening of its cycle (Czekaj, and Dresler, 2002). 6
Activities related to working capital management are reflected in strategies. The choice of 7
strategy implies specific profit-risk relations, and is strongly correlated with managers’ attitudes 8
(management styles) (Brounen, De Jong, and Koedijk, 2004), while a company’s financial 9
standing is an objective factor (Graham, and Harvey, 2001). Possible strategies (conservative, 10
aggressive) (Kreczmańska-Gigol, 2015) with regard to current asset management do not 11
determine the choice of the same financing strategies and vice versa (Sierpińska, and Wędzki, 12
2001). It leads to adopting combinations of strategies, including the adoption of moderate 13
strategies (Cicirko, 2010). 14
A review of the results of research studies of the conditions, effectiveness and efficiency of 15
working capital management does not offer explicit solutions which mainly concern relations 16
between the effects of management strategies and financial liquidity levels (Deloof, 2003) 17
(Garcia-Teurel, and Martinez-Solano, 2007) with implications for profitability at a company’s 18
general level (return on equity, assets and sales) (Raheman, and Nasr, 2007; Shin, and Soenen, 19
1998), and not only with regard to working capital. The authors also seek to determine the 20
impact of investment (a surrogate of corporate development) on financial liquidity and the 21
adopted working capital strategies (Oppler, et al., 1999). Attention is also given to the 22
implications of the level of indebtedness and financial leverage for the choice of receivable and 23
inventory management strategies (Chiou, Cheng, and Wu, 2006). Other publications show that 24
working capital requirements are strongly correlated with and directly proportional to company 25
size (Hill, Kelly, and Highfields, 2010; Petersen, and Rajan, 1997). 26
Empirical research in the field of working capital management, adopted strategies and 27
resulting correlations is also conducted in Poland (e.g. Jędrzejczak-Gas, 2014; Zimon, 2014, 28
Michalski, 2007; Bolek, and Pastusiak, 2014; Koralun-Bereźnicka, 2013). 29
Generally, literatures do not offer sufficient empirical research on the conditions and 30
determinants of working capital management strategies, especially with regard to the combined 31
impact of its components. Quantitative research focuses on specific individual relationships 32
with some attention given to qualitative aspects; research studies are not comprehensive in 33
character and are based on small groups of objects, which does not allow for formulating 34
general and universal conclusions. 35
36
194 J. Kaczmarek
3. Methods 1
The conducted analysis assumes that gross working capital (WCG) represents all the sources 2
of current asset financing. In other words, it is the total sum composed of inventories (INV), 3
short-term receivables (REC) and cash (i.e. short-term investments – STI). This capital, when 4
reduced by short term liabilities (STL), represents net working capital (NWC). In other words, 5
it is part of a company’s equity (EQ) increased by long-term liabilities (LTL), engaged in 6
financing current assets (CA), thus beyond fixed assets financing (FA). Changes in net working 7
capital are also calculated (dNWC=NWCt–NWCt–1), having an impact on cash flows. 8
𝑊𝐶𝐺 = 𝐼𝑁𝑉 + 𝑅𝐸𝐶 + 𝑆𝑇𝐼; 𝑁𝑊𝐶 = 𝑊𝐶𝐺 − 𝑆𝑇𝐿
𝑁𝑊𝐶 = 𝐸𝑄 + 𝐿𝑇𝐿 − 𝐹𝐴 (1)
The effectiveness of net working capital management is measured by the net working 9
capital cycle (NWCC) and the cycles of its components: days of inventory coverage (IT), 10
days of short–term receivables coverage (CP) and days of short–term liabilities coverage (PL). 11
𝐶𝐴𝐶 = 𝐼𝑇 + 𝑃𝐿 ; 𝑁𝑊𝐶𝐶 = 𝐶𝐴𝐶 − 𝑃𝐿 ; 𝐼𝑇 =𝐼𝑁𝑉̅̅ ̅̅ ̅ ∙ 𝑑
𝐶𝑆 ; 𝐶𝑃 =
𝑅𝐸𝑉̅̅ ̅̅ ̅̅ ∙ 𝑑
𝑆 ; 𝑃𝐿 =
𝑆𝑇𝐿̅̅ ̅̅ ̅ ∙ 𝑑
𝐶𝑀 (2)
where: 12
CAC – days of current assets coverage, 13
CS – costs of sales of products, goods and materials, 14
CM – cost of materials, energy, services, etc. (operating expenses), 15
S – net revenues from sales of products, goods and materials, 16
d – number of days in period. 17
Note: geometric average of quarterly values INV, REV, STL. 18
19
The following values are considered in the analysis of working capital correlation measures: 20
financial liquidity ratios – current ratio (CR) and quick ratio (QR), return on revenues from 21
sales (RRS), revenue from sales (S) and operating costs (C) (i.e. costs of sales of products, 22
goods and materials, selling costs and overheads – operating expenses), and cash (i.e. short-23
term investments – STI). 24
𝐶𝑅 =𝐶𝐴̅̅ ̅̅
𝑆𝑇𝐿̅̅ ̅̅ ̅ ; 𝑄𝑅 =
𝐶𝐴̅̅ ̅̅ − 𝐼𝑁𝑉̅̅ ̅̅ ̅
𝑆𝑇𝐿̅̅ ̅̅ ̅ ; 𝑅𝑅𝑆 =
𝐺𝑃𝑆
𝑆 (3)
where: 25
GPS – gross profit (loss) from sales. 26
Note: geometric average of quarterly values CA, INV, STL. 27
The occurrence of correlations is analysed with the use of a correlation measure – Pearson’s 28
coefficient (r). The statistical testing assumes critical level of significance = 0.05, which is 29
referred to the value of test probability (p-value). 30
The effectiveness of working capital management strategies… 195
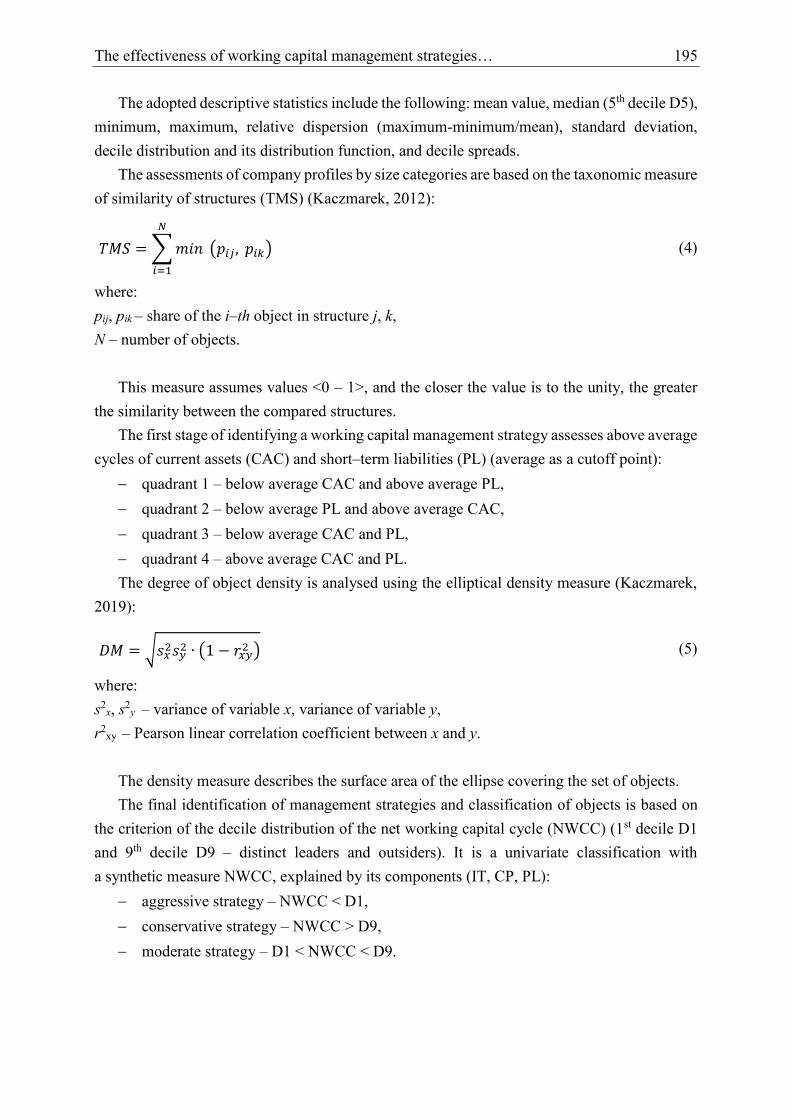
The adopted descriptive statistics include the following: mean value, median (5th decile D5), 1
minimum, maximum, relative dispersion (maximum-minimum/mean), standard deviation, 2
decile distribution and its distribution function, and decile spreads. 3
The assessments of company profiles by size categories are based on the taxonomic measure 4
of similarity of structures (TMS) (Kaczmarek, 2012): 5
𝑇𝑀𝑆 = ∑ 𝑚𝑖𝑛
𝑁
𝑖=1
(𝑝𝑖𝑗, 𝑝𝑖𝑘) (4)
where: 6
pij, pik – share of the i–th object in structure j, k, 7
N – number of objects. 8
9
This measure assumes values <0 – 1>, and the closer the value is to the unity, the greater 10
the similarity between the compared structures. 11
The first stage of identifying a working capital management strategy assesses above average 12
cycles of current assets (CAC) and short–term liabilities (PL) (average as a cutoff point): 13
quadrant 1 – below average CAC and above average PL, 14
quadrant 2 – below average PL and above average CAC, 15
quadrant 3 – below average CAC and PL, 16
quadrant 4 – above average CAC and PL. 17
The degree of object density is analysed using the elliptical density measure (Kaczmarek, 18
2019): 19
𝐷𝑀 = √𝑠𝑥2𝑠𝑦
2 ∙ (1 − 𝑟𝑥𝑦2 ) (5)
where: 20
s2x, s
2y – variance of variable x, variance of variable y, 21
r2xy – Pearson linear correlation coefficient between x and y. 22
23
The density measure describes the surface area of the ellipse covering the set of objects. 24
The final identification of management strategies and classification of objects is based on 25
the criterion of the decile distribution of the net working capital cycle (NWCC) (1st decile D1 26
and 9th decile D9 – distinct leaders and outsiders). It is a univariate classification with 27
a synthetic measure NWCC, explained by its components (IT, CP, PL): 28
aggressive strategy – NWCC < D1, 29
conservative strategy – NWCC > D9, 30
moderate strategy – D1 < NWCC < D9. 31
196 J. Kaczmarek
The adoption of this classification is preceded by a test of compliance of the result of 1
discriminating companies which implement the same working capital strategy, based on 2
criterion NWCC, as well as CAC and PL (median as a cutoff point). 3
The following company size categories are employed: small (10-49 employees), medium 4
(50-249), large (250 and more). 5
4. Results and discussion 6
4.1. General characteristics of working capital management 7
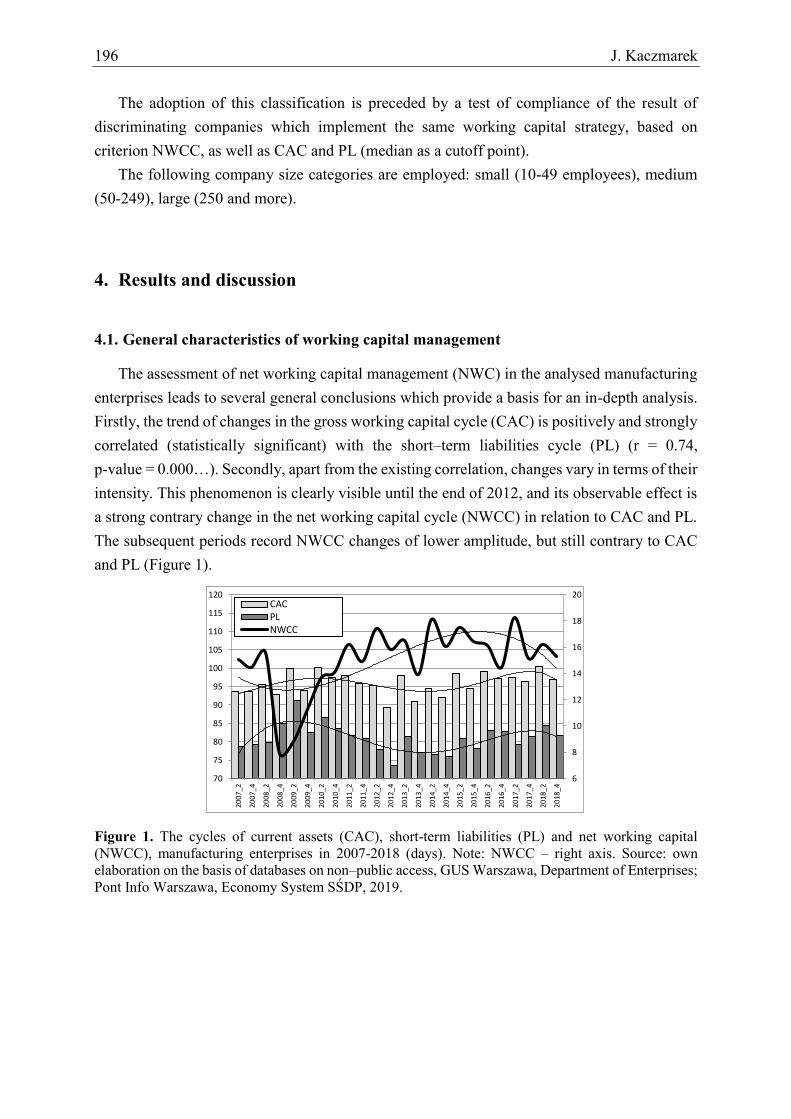
The assessment of net working capital management (NWC) in the analysed manufacturing 8
enterprises leads to several general conclusions which provide a basis for an in-depth analysis. 9
Firstly, the trend of changes in the gross working capital cycle (CAC) is positively and strongly 10
correlated (statistically significant) with the short–term liabilities cycle (PL) (r = 0.74, 11
p-value = 0.000…). Secondly, apart from the existing correlation, changes vary in terms of their 12
intensity. This phenomenon is clearly visible until the end of 2012, and its observable effect is 13
a strong contrary change in the net working capital cycle (NWCC) in relation to CAC and PL. 14
The subsequent periods record NWCC changes of lower amplitude, but still contrary to CAC 15
and PL (Figure 1). 16
17
Figure 1. The cycles of current assets (CAC), short-term liabilities (PL) and net working capital 18 (NWCC), manufacturing enterprises in 2007-2018 (days). Note: NWCC – right axis. Source: own 19 elaboration on the basis of databases on non–public access, GUS Warszawa, Department of Enterprises; 20 Pont Info Warszawa, Economy System SŚDP, 2019. 21
22
6
8
10
12
14
16
18
20
70
75
80
85
90
95
100
105
110
115
120
2007_2
2007_4
2008_2
2008_4
2009_2
2009_4
2010_2
2010_4
2011_2
2011_4
2012_2
2012_4
2013_2
2013_4
2014_2
2014_4
2015_2
2015_4
2016_2
2016_4
2017_2
2017_4
2018_2
2018_4
CACPLNWCC
The effectiveness of working capital management strategies… 197
The characteristics of NWCC components are different in manufacturing enterprises. 1
The inventories cycle shows the highest relative stability (standard deviation SD 3.6%). 2
Changes occur in two stages, with a considerably high increase in IT after the period of stability 3
as of 2015. CP is characterised by two periods of increase and two periods of decrease 4
(sinusoidal pattern), higher changeability (SD 4.5%), and seasonality – the first six months 5
usually show higher values. PL is characterised by two periods of increase and one period of 6
decrease (sinusoidal pattern), and the highest changeability (SD 4.6%). 7
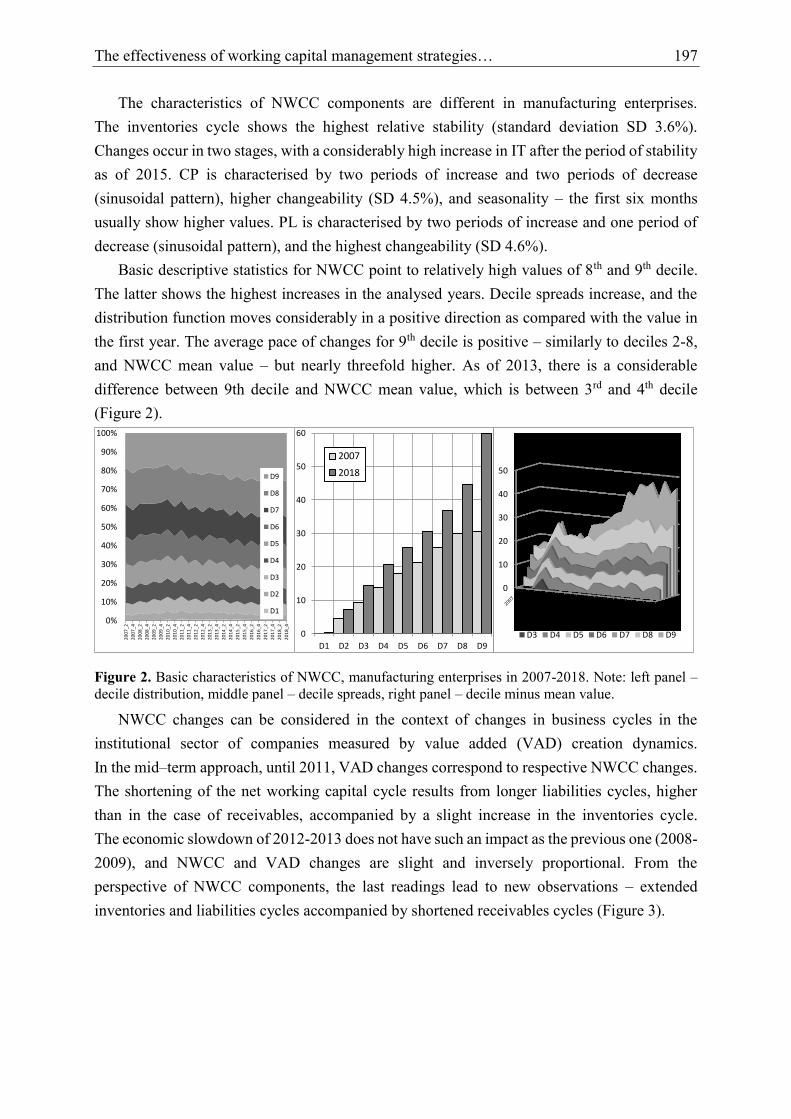
Basic descriptive statistics for NWCC point to relatively high values of 8th and 9th decile. 8
The latter shows the highest increases in the analysed years. Decile spreads increase, and the 9
distribution function moves considerably in a positive direction as compared with the value in 10
the first year. The average pace of changes for 9th decile is positive – similarly to deciles 2-8, 11
and NWCC mean value – but nearly threefold higher. As of 2013, there is a considerable 12
difference between 9th decile and NWCC mean value, which is between 3rd and 4th decile 13
(Figure 2). 14
15
Figure 2. Basic characteristics of NWCC, manufacturing enterprises in 2007-2018. Note: left panel – 16 decile distribution, middle panel – decile spreads, right panel – decile minus mean value. 17
NWCC changes can be considered in the context of changes in business cycles in the 18
institutional sector of companies measured by value added (VAD) creation dynamics. 19
In the mid–term approach, until 2011, VAD changes correspond to respective NWCC changes. 20
The shortening of the net working capital cycle results from longer liabilities cycles, higher 21
than in the case of receivables, accompanied by a slight increase in the inventories cycle. 22
The economic slowdown of 2012-2013 does not have such an impact as the previous one (2008-23
2009), and NWCC and VAD changes are slight and inversely proportional. From the 24
perspective of NWCC components, the last readings lead to new observations – extended 25
inventories and liabilities cycles accompanied by shortened receivables cycles (Figure 3). 26
27
0%
10%
20%
30%
40%
50%
60%
70%
80%
90%
100%
2007_2
2007_4
2008_2
2008_4
2009_2
2009_4
2010_2
2010_4
2011_2
2011_4
2012_2
2012_4
2013_2
2013_4
2014_2
2014_4
2015_2
2015_4
2016_2
2016_4
2017_2
2017_4
2018_2
2018_4
D9
D8
D7
D6
D5
D4
D3
D2
D1
0
10
20
30
40
50
60
D1 D2 D3 D4 D5 D6 D7 D8 D9
2007
2018
0
10
20
30
40
50
D3 D4 D5 D6 D7 D8 D9

198 J. Kaczmarek
1
Figure 3. Pace of changes in value added (VAD) and net working capital cycle (NWCC), manufacturing 2 enterprises in 2008-2018. Note: VAD – right axis. Source: same as Figure 1. 3
4.2. Basic correlations in the area of working capital management 4
The cycle of net working capital and its components is linked by the volumes of sales (S) 5
and costs (C), inventory volumes (INV), receivables (REC) and short–term liabilities (STL). 6
These three categories determine the volume of net working capital (NWC) and its changes 7
(dNWC) and, consequently, the volume of required funds for financing its growth and release 8
in the periods of decline. 9
The analysis of changes in manufacturing enterprises’ inventories (INV), receivables (REC) 10
and short-term liabilities (STL) points to their steady growth with the average pace of changes 11
at 3.26%, 2.25% and 2.69%, respectively. These paces are close to the average pace of sales 12
(S – 2.56%) and costs (C – 2.64%) – the respective curves show their steady growth. 13
The “S – REC” correlation is 0.97, and for “C – STL” 0.96, while for “C – INV” 0.99 (for each 14
pair p-value = 0.000…). 15
Changes in net working capital dNWC are not correlated with sales or costs. 16
Simultaneously, net working capital cycle NWCC is characterised by its positive, statistically 17
significant and moderate correlation with sales and costs (in both cases r = 0.57, p-value = 18
0.004). Its component IT is correlated with costs (C) (r = 0.76, p-value = 0.000…), while for 19
“CP – S” and “PL – C” pairs correlation does not exist (Figure 4). 20
21
0%
1%
2%
3%
4%
5%
6%
7%
8%
6
8
10
12
14
16
18
20
2007_2
2007_4
2008_2
2008_4
2009_2
2009_4
2010_2
2010_4
2011_2
2011_4
2012_2
2012_4
2013_2
2013_4
2014_2
2014_4
2015_2
2015_4
2016_2
2016_4
2017_2
2017_4
2018_2
2018_4
VAD
NWCC

The effectiveness of working capital management strategies… 199
1
Figure 4. Changes in net working capital (dNWC), inventories (INV), receivables (REC) and short-2 term liabilities (STL) in manufacturing enterprises in 2007-2018. Note: dNWC – right axis. Source: 3 same as Figure 1. 4
The effects of NWC management with regard to changes in current assets and short-term 5
liabilities should be correlated with measures related to financial liquidity – current (CR) and 6
quick (QR). Manufacturing enterprises are characterised by a very strong correlation of NWCC 7
and CR (r = 0.80, p-value = 0.000…). For “NWCC – QR”, correlation is slightly weaker 8
(r = 0.68, p-value = 0.000…). The study shows that NWCC components IT and CP are not 9
correlated with current liquidity (CR) (r = 0.29; = 0.26, p-value = 0.111; = 0.225). 10
For “PL – CR”, a correlation is moderate and inversely proportional (r = -0.59, p-value = 0.002) 11
(Figure 5). 12
13
Figure 5. Cycles of inventories (IT), receivables (CP), short-term liabilities (PL), net working capital 14 (NWCC) and current liquidity (CR) in manufacturing enterprises in 2007-2018. Note: CR – right axis. 15 IT, CP, PL, NWCC – pace of changes (initial period=1). Source: same as Figure 1. 16
NWCC is a cash cycle which determines the time of converting engaged capital to cash. 17
Manufacturing enterprises do not record a statistically significant correlation between NWCC 18
and cash (short-term investments – STI) (r = 0.36, p-value = 0.080). However, ¾ of the analysed 19
periods confirm the principle that NWCC changes, from period to period, lead to contrary 20
STI changes, which is clearly visible after 2011. 21
-15000
-10000
-5000
0
5000
10000
15000
20000
0
50000
100000
150000
200000
250000
300000
350000
2007_2
2007_4
2008_2
2008_4
2009_2
2009_4
2010_2
2010_4
2011_2
2011_4
2012_2
2012_4
2013_2
2013_4
2014_2
2014_4
2015_2
2015_4
2016_2
2016_4
2017_2
2017_4
2018_2
2018_4
dNWC INV
REC STL
1,35
1,4
1,45
1,5
1,55
1,6
0,8
0,9
1
1,1
1,2
1,3
1,4
2007_2
2007_4
2008_2
2008_4
2009_2
2009_4
2010_2
2010_4
2011_2
2011_4
2012_2
2012_4
2013_2
2013_4
2014_2
2014_4
2015_2
2015_4
2016_2
2016_4
2017_2
2017_4
2018_2
2018_4
CR
NWCC
IT
PL
CP

200 J. Kaczmarek
Correlations between NWCC and the profitability of sales (RRS) are not recorded in 1
manufacturing enterprises (r = 0.07, p-value = 0.975) (Figure 6). 2
3
Figure 6. Net working capital cycle (NWCC) and revenue from sales (S), short-term investments (STI) 4 and profitability of sales (RRS) in manufacturing enterprises in 2007-2018. Note: RRS – right axis. 5 STI – dimensionless values. Source: same as Figure 1. 6
4.3. The profile of manufacturing enterprises in the context of working capital 7
management 8
The profiling of manufacturing enterprises is based on two criteria – according to their 9
position in 24 divisions of PKD – Polish Classification of Activities, and according to PKD 10
sections by size categories (small, medium and large). 11
Companies differ considerably from the point of view of PKD divisions with regard to IT, 12
CP and PL components. This concerns the receivables cycle (CP) to the smallest extent, for 13
which the level of diversification is also the lowest (standard deviation 9.6% – time axis). 14
It is followed by the inventories cycle (IT) at 12.1%, while the lowest level is recorded for the 15
receivables cycle (14.0%). The relative spread (maximum–minimum/mean) is also the lowest 16
for CP (1.43), and it is at the level of 2.46 for IT and 2.20 for PL. 17
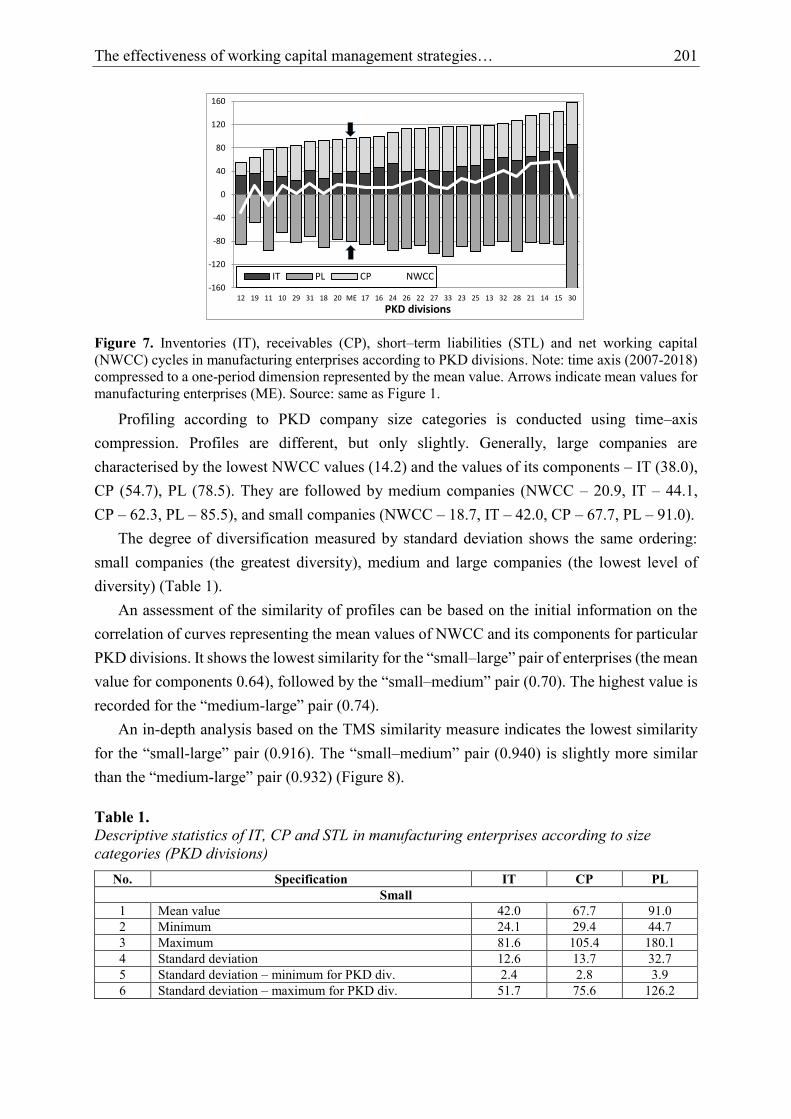
The translation of the above conclusions to profile images (as a result of the time–axis 18
compression of 2007–2018 to one–period dimension represented by the mean value) confirms 19
the hypothesis that differences between PKD divisions with regard to the current assets cycle 20
(CAC) result from the inventories cycle (IT) rather than the receivables cycle (CP). Because PL 21
differences are smaller than those for CAC, PKD divisions differ with respect to NWCC due to 22
the former factor. Only a few PKD divisions are characterised by a negative NWCC cycle: 23
(PKD 11) production of beverages, (PKD 12) tobacco products, (PKD 30) production of other 24
transport equipment (Figure 7). 25
26
4%
5%
5%
6%
6%
7%
7%
8%
8%
4
6
8
10
12
14
16
18
20
2007_2
2007_4
2008_2
2008_4
2009_2
2009_4
2010_2
2010_4
2011_2
2011_4
2012_2
2012_4
2013_2
2013_4
2014_2
2014_4
2015_2
2015_4
2016_2
2016_4
2017_2
2017_4
2018_2
2018_4
RRSSTINWCC
The effectiveness of working capital management strategies… 201
1
Figure 7. Inventories (IT), receivables (CP), short–term liabilities (STL) and net working capital 2 (NWCC) cycles in manufacturing enterprises according to PKD divisions. Note: time axis (2007-2018) 3 compressed to a one-period dimension represented by the mean value. Arrows indicate mean values for 4 manufacturing enterprises (ME). Source: same as Figure 1. 5
Profiling according to PKD company size categories is conducted using time–axis 6
compression. Profiles are different, but only slightly. Generally, large companies are 7
characterised by the lowest NWCC values (14.2) and the values of its components – IT (38.0), 8
CP (54.7), PL (78.5). They are followed by medium companies (NWCC – 20.9, IT – 44.1, 9
CP – 62.3, PL – 85.5), and small companies (NWCC – 18.7, IT – 42.0, CP – 67.7, PL – 91.0). 10
The degree of diversification measured by standard deviation shows the same ordering: 11
small companies (the greatest diversity), medium and large companies (the lowest level of 12
diversity) (Table 1). 13
An assessment of the similarity of profiles can be based on the initial information on the 14
correlation of curves representing the mean values of NWCC and its components for particular 15
PKD divisions. It shows the lowest similarity for the “small–large” pair of enterprises (the mean 16
value for components 0.64), followed by the “small–medium” pair (0.70). The highest value is 17
recorded for the “medium-large” pair (0.74). 18
An in-depth analysis based on the TMS similarity measure indicates the lowest similarity 19
for the “small-large” pair (0.916). The “small–medium” pair (0.940) is slightly more similar 20
than the “medium-large” pair (0.932) (Figure 8). 21
Table 1. 22 Descriptive statistics of IT, CP and STL in manufacturing enterprises according to size 23
categories (PKD divisions) 24
No. Specification IT CP PL
Small
1 Mean value 42.0 67.7 91.0
2 Minimum 24.1 29.4 44.7
3 Maximum 81.6 105.4 180.1
4 Standard deviation 12.6 13.7 32.7
5 Standard deviation – minimum for PKD div. 2.4 2.8 3.9
6 Standard deviation – maximum for PKD div. 51.7 75.6 126.2
25
-160
-120
-80
-40
0
40
80
120
160
12 19 11 10 29 31 18 20 ME 17 16 24 26 22 27 33 23 25 13 32 28 21 14 15 30
PKD divisions
IT PL CP NWCC

202 J. Kaczmarek
Cont. table 1. 1 Medium
1 Mean value 44.1 62.3 85.5
2 Minimum 25.2 46.9 67.3
3 Maximum 74.9 79.7 166.4
4 Standard deviation 8.5 11.9 20.7
5 Standard deviation – minimum for PKD div. 2.2 2.1 3.2
6 Standard deviation – maximum for PKD div. 23.0 34.6 82.2
Large
1 Mean value 38.0 54.7 78.5
2 Minimum 17.8 21.5 47.5
3 Maximum 91.3 76.6 158.8
4 Standard deviation 7.3 8.7 16.9
5 Standard deviation – minimum for PKD div. 1.8 2.2 4.3
6 Standard deviation – maximum for PKD div. 16.6 11.4 31.6
Note: cycles of inventories (IT), receivables (CP) and short-term liabilities (PL). Source: same as 2 Figure 1. 3
4
Figure 8. Profiles of manufacturing enterprises with regard to the cycle of inventories (IT), receivables 5 (CP) and short-term liabilities (PL) by size categories and PKD divisions. Note: arrows indicate the 6 mean value for manufacturing enterprises (ME). Source: same as Figure 1. 7
IT, CP and PL components determine the net working capital cycle (NWCC). Its length 8
shows considerable differences between PKD divisions by size categories, bringing the profiles 9
of small and medium enterprises closer to each other and widening gaps between small and 10
large entities. The assessment of profiles based on TMS leads to the following results – “small-11
large” (0.533), “small-medium” (0.649), and “medium-large” (0.684). 12
4.4. Identification of working capital management strategies 13
The length of NWCC and its components determines the adoption of working capital 14
management strategies, as doing so allows for the ordering and classification of manufacturing 15
enterprises. The first step of the analysis assesses above average CAC and PL values. The mean 16
value is a cutoff point, which also divides objects into uniform subsets (quadrants). Above 17
-200 -100 0 100 200
33
32
31
30
29
28
27
26
25
24
23
22
21
20
19
18
17
16
15
14
13
12
11
10
ME
Small
IT
PL
CP
-200 -100 0 100 200
33
32
31
30
29
28
27
26
25
24
23
22
21
20
19
18
17
16
15
14
13
12
11
10
ME
Medium
IT
PL
CP
-200 -100 0 100 200
33
32
31
30
29
28
27
26
25
24
23
22
21
20
19
18
17
16
15
14
13
12
11
10
ME
Large
IT
PL
CP

The effectiveness of working capital management strategies… 203
average CAC and PL values occur in 53.9% of all enterprises (quadrant 4). It can be assumed 1
that such values correspond to a moderate and relatively less profitable strategy. Below average 2
CAC and PL values are recorded in 16.7% of all enterprises – a moderate strategy with 3
relatively higher profits (quadrant 3). Quadrant 1 corresponds to enterprises (11.4%) with below 4
average CAC and above average PL values (aggressive strategy). Quadrant 2 represents 5
enterprises (18.0%) with contrary characteristics (conservative strategy). 6
Changes in 2007-2018 relate to a greater dispersion of objects (dispersion measure 7
ZG +51.1%) – gaps between enterprises are widened. The balance of differences (the sum of 8
deviations) with regard to CAC is positive (+7.1% in relation to the base year) but lower for PL 9
(+2.4%), which brings the trend of dispersion closer to the CAC axis (Figure 9). 10
11
Figure 9. Classification of manufacturing enterprises (left panel) and movements and changes in density 12 (right panel) in 2007–2018 (grouping into PKD classes). Notes: the graphic presentation takes into 13 account the merging into uniform groups by PKD classes – the anonymity of individual data necessitated 14 by statistical confidentiality. Source: same as Figure 1. 15
The above approach raises doubts as to the merging of two variables (IT and CP) into one 16
CAC criterion. An alternative solution could be offered by measure systems, which, in turn, 17
lead to difficulties in their presentation and application. Hence, the second step of the analysis 18
makes use of a synthetic measure – NWCC (univariate classification with a synthetic measure 19
explained by its 3 components, with attention given to decile distributions). 20
The conducted test confirms the classification of companies according to NWCC, as well 21
as its components – CAC (IT and CP), and PL. The median (5th decile D5) is used as a cutoff 22
point. 23
The consistency of the obtained results allows for the identification and classification of 24
enterprises from the perspective of adopted working capital strategies. The adopted criterion is 25
the value of 1st decile (D1) and 9th decile (D9). As a result, the following subsets of enterprises 26
are identified: enterprises adopting an aggressive strategy (NWCC < D1 – 19.9%), conservative 27
strategy (NWCC > D9 – 16.7%), and the dominant subset – moderate strategy (D1 < NWCC < 28
D9 – 63.4%) (Figure 10). 29
30
30
50
70
90
110
130
150
170
190
30 50 70 90 110 130 150 170 190
PL
CAC
1
23
4
53,9%11,4%
18,0%16,7%30
90
150
210
270
30 90 150 210 270
PL
CAC
2007 2018
204 J. Kaczmarek
1
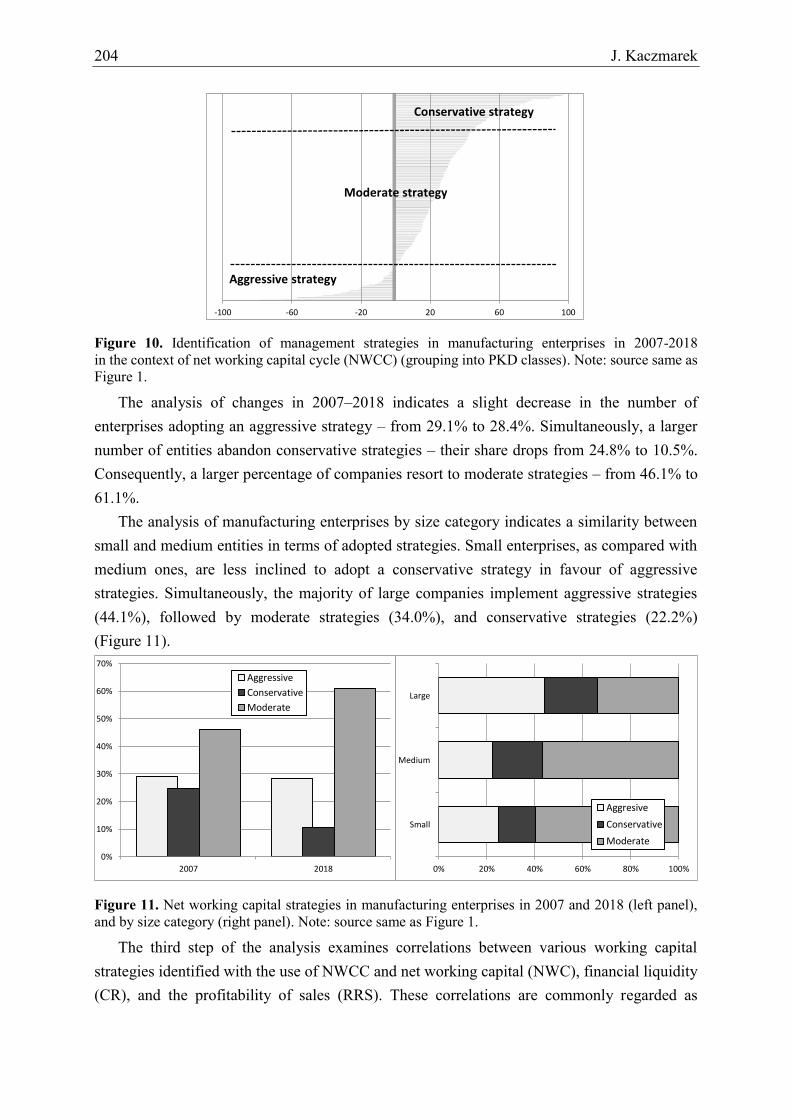
Figure 10. Identification of management strategies in manufacturing enterprises in 2007-2018 2 in the context of net working capital cycle (NWCC) (grouping into PKD classes). Note: source same as 3 Figure 1. 4
The analysis of changes in 2007–2018 indicates a slight decrease in the number of 5
enterprises adopting an aggressive strategy – from 29.1% to 28.4%. Simultaneously, a larger 6
number of entities abandon conservative strategies – their share drops from 24.8% to 10.5%. 7
Consequently, a larger percentage of companies resort to moderate strategies – from 46.1% to 8
61.1%. 9
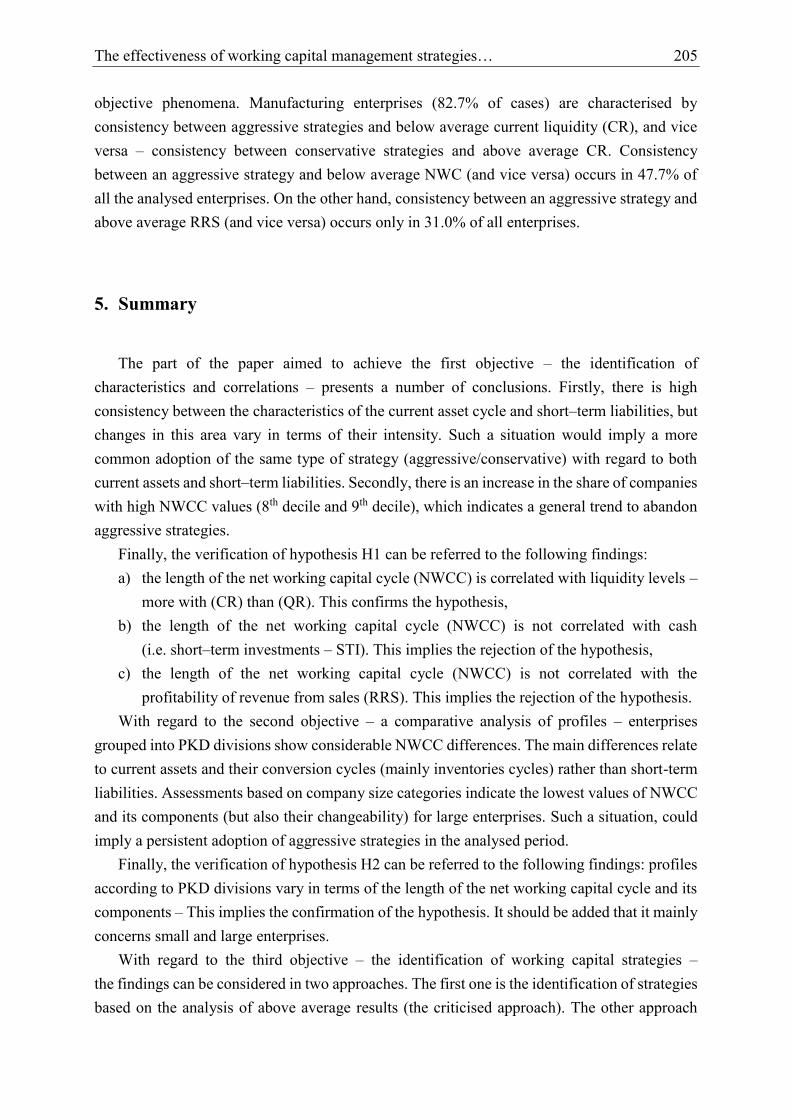
The analysis of manufacturing enterprises by size category indicates a similarity between 10
small and medium entities in terms of adopted strategies. Small enterprises, as compared with 11
medium ones, are less inclined to adopt a conservative strategy in favour of aggressive 12
strategies. Simultaneously, the majority of large companies implement aggressive strategies 13
(44.1%), followed by moderate strategies (34.0%), and conservative strategies (22.2%) 14
(Figure 11). 15
16
Figure 11. Net working capital strategies in manufacturing enterprises in 2007 and 2018 (left panel), 17 and by size category (right panel). Note: source same as Figure 1. 18
The third step of the analysis examines correlations between various working capital 19
strategies identified with the use of NWCC and net working capital (NWC), financial liquidity 20
(CR), and the profitability of sales (RRS). These correlations are commonly regarded as 21
-100 -60 -20 20 60 100
Aggressive strategy
Moderate strategy
Conservative strategy
2007 2018
0%
10%
20%
30%
40%
50%
60%
70%
Aggressive
Conservative
Moderate
Small
Medium
Large
0% 20% 40% 60% 80% 100%
Aggresive
Conservative
Moderate
The effectiveness of working capital management strategies… 205
objective phenomena. Manufacturing enterprises (82.7% of cases) are characterised by 1
consistency between aggressive strategies and below average current liquidity (CR), and vice 2
versa – consistency between conservative strategies and above average CR. Consistency 3
between an aggressive strategy and below average NWC (and vice versa) occurs in 47.7% of 4
all the analysed enterprises. On the other hand, consistency between an aggressive strategy and 5
above average RRS (and vice versa) occurs only in 31.0% of all enterprises. 6
5. Summary 7
The part of the paper aimed to achieve the first objective – the identification of 8
characteristics and correlations – presents a number of conclusions. Firstly, there is high 9
consistency between the characteristics of the current asset cycle and short–term liabilities, but 10
changes in this area vary in terms of their intensity. Such a situation would imply a more 11
common adoption of the same type of strategy (aggressive/conservative) with regard to both 12
current assets and short–term liabilities. Secondly, there is an increase in the share of companies 13
with high NWCC values (8th decile and 9th decile), which indicates a general trend to abandon 14
aggressive strategies. 15
Finally, the verification of hypothesis H1 can be referred to the following findings: 16
a) the length of the net working capital cycle (NWCC) is correlated with liquidity levels – 17
more with (CR) than (QR). This confirms the hypothesis, 18
b) the length of the net working capital cycle (NWCC) is not correlated with cash 19
(i.e. short–term investments – STI). This implies the rejection of the hypothesis, 20
c) the length of the net working capital cycle (NWCC) is not correlated with the 21
profitability of revenue from sales (RRS). This implies the rejection of the hypothesis. 22
With regard to the second objective – a comparative analysis of profiles – enterprises 23
grouped into PKD divisions show considerable NWCC differences. The main differences relate 24
to current assets and their conversion cycles (mainly inventories cycles) rather than short-term 25
liabilities. Assessments based on company size categories indicate the lowest values of NWCC 26
and its components (but also their changeability) for large enterprises. Such a situation, could 27
imply a persistent adoption of aggressive strategies in the analysed period. 28
Finally, the verification of hypothesis H2 can be referred to the following findings: profiles 29
according to PKD divisions vary in terms of the length of the net working capital cycle and its 30
components – This implies the confirmation of the hypothesis. It should be added that it mainly 31
concerns small and large enterprises. 32
With regard to the third objective – the identification of working capital strategies – 33
the findings can be considered in two approaches. The first one is the identification of strategies 34
based on the analysis of above average results (the criticised approach). The other approach 35
206 J. Kaczmarek
(univariate classification with a synthetic measure) confirms the dominance of a moderate 1
strategy despite the use of aggressive strategies in most large enterprises. 2
Finally, the verification of hypothesis H3 can be referred to the following findings: 3
a moderate strategy prevails in working capital management – this implies the confirmation of 4
the hypothesis. In addition to that, this strategy is implemented in small and medium enterprises. 5
Further analyses can focus on a wide field of research aimed to identify and assess working 6
capital strategies by size categories and activities (PKD divisions and classes), and to refer the 7
obtained results to similar analyses for trading and service companies. Doing so can lead to 8
creating a comprehensive picture of the status of and changes in implementing working capital 9
strategies in the entire institutional sector, as well as to offering recommendations for 10
improvements and development trends in the implemented solutions (based on questionnaire 11
surveys). 12
References 13
1. Adam, A. (2007). Handbook of assets and liability management – From models to optimal 14
strategies. Chichester: John Wiley & Sons, 201. 15
2. Andrew, J., and Gallagher, T. (2007). Financial Management: Principles and Practice. 16
New Jersey: Freeload Press, Pearson Education, 512. 17
3. Bolek, M., and Pastusiak, R. (2014). Wpływ strategii zarządzania kapitałem pracującym na 18
płynność przedsiębiorstwa na przykładzie spółek notowanych na GPW w Warszawie 19
[Impact of working capital management strategy on the liquidity of an enterprise on the 20
example of companies listed on the Warsaw Stock Exchange]. Finanse, Rynki Finansowe, 21
Ubezpieczenia. Working papers of the University of Szczecin, 66, 271-283. Retrieved from 22
http://wneiz.pl/nauka_wneiz/frfu/66–2014/FRFU–66–271.pdf, 20.07.2019. 23
4. Brigham, E.F., and Gapenski, L.C. (2007). Financial Management: Theory and Practice. 24
Fort Worth: Dryden Press, 119. 25
5. Brounen, D., De Jong, A., and Koedijk, K. (2004). Corporate Finance in Europe. 26
Confronting Theory with Practice. Financial Management, 33(4), 71-102. doi: 10.2139/ 27
ssrn.559415. 28
6. Chiou, J., Cheng, L., and Wu, H. (2006). The determinants of working capital management. 29
The Journal of American Academy of Business, 10(1), 149-155. Retrieved from 30
http://www.journalbrc.com/jaabcv10n1preview.html, 20.07.2019. 31
7. Cicirko, T. (ed.) (2010). Podstawy zarządzania płynnością finansową przedsiębiorstwa 32
[Fundamentals of corporate liquidity management]. Warszawa: Oficyna Wydawnicza 33
SGH, 118-119. 34
The effectiveness of working capital management strategies… 207
8. Czekaj, J., and Dresler, Z. (2002). Zarządzanie finansami przedsiębiorstw – podstawy teorii 1
[Corporate finance management – the fundamentals of theory]. Warszawa: PWN, 128. 2
9. Deloof, M. (2003). Does Working Capital Management Affect profitability of Belgian 3
Firms. Journal of Business &Accounting, 30(3-4), 573-588. doi: 10.1111/1468–4
5957.00008. 5
10. Filbeck, G., and Krueger, T. (2005). An analysis of working capital management results 6
across industries. Mid-American Journal of Business, 20(2), 11–-0. doi: 10.1108/ 7
19355181200500007. 8
11. Garcia-Teurel, P.J., and Martinez-Solano, P. (2007). Effects of Working Capital 9
Management on SME Profitability. International Journal of Managerial Finance, 3(2), 10
164-177. doi: 10.1108/17439130710738718. 11
12. Gołębiowski, G., and Tłaczała, A. (2009). Analiza finansowa w teorii i w praktyce 12
[Financial analysis in theory and practice]. Warszawa: Difin, 87. 13
13. Graham, J.R., and Harvey, C.R (2001). The theory and practice of corporate finance: 14
evidence from the field. Journal of Financial Economics, 60(2-3), 187-243. doi: 15
10.1016/S0304–405X(01)00044–7. 16
14. Groppelli, A., and Nikbakht, E. (2006). Finance. New York: Barrons, 119. 17
15. Hill, M.D., Kelly, G.W., and Highfield, M.J. (2010). Net operating working capital 18
behavior: a first look. Financial Management, 39(2), 783-805. doi: 10.1111/j.1755–19
053X.2010.01092.x. 20
16. Jędrzejczak-Gas, J. (2014). Zarządzanie kapitałem obrotowym netto w przedsiębiorstwach 21
sektora telekomunikacyjnego notowanych na rynku NewConnect [Management of net 22
working capital in enterprises of the telecommunications sector listed on the NewConnect 23
market]. Finanse, Rynki Finansowe, Ubezpieczenia. Working papers University of Szczecin, 24
67, 49-59. Retrieved from http://www.wneiz.pl/nauka_wneiz/frfu/67–2014/FRFU–67–25
49.pdf, 20.07.2019. 26
17. Kaczmarek, J. (2012). Mezostruktura gospodarki Polski w okresie transformacji. 27
Uwarunkowania, procesy, efektywność [Mesostructure of the Polish economy in the period 28
of transformation. Conditions, processes, efficiency]. Warszawa: Difin, 103-137. 29
18. Kaczmarek, J. (2019). The Mechanisms of Creating Value vs. Financial Security of Going 30
Concern – Sustainable Management. Sustainability – Open Access Journal, 11(8), 2278 31
(1-24). doi: 10.3390/su11082278. 32
19. Koralun–Bereźnicka, J. (2013). Strategie kapitału pracującego w Europie – analiza 33
prawidłowości w krajach i grupach wielkościowych przedsiębiorstw [Strategies of working 34
capital in Europe – analysis of regularity in countries and size groups of enterprises]. 35
Zarządzanie i Finanse, 2(2), 189-201. Retrieved from http://zif.wzr.pl/pim/ 36
2013_2_2_15.pdf, 20.07.2019. 37
208 J. Kaczmarek
20. Kreczmańska-Gigol, K. (ed.) (2015). Płynność finansowa przedsiębiorstwa – istota, 1
pomiar, zarządzanie [Financial liquidity of the company – essence, measurement, 2
management]. Warszawa: Difin, 182. 3
21. Michalski, G. (2007). Wpływ decyzji w zakresie strategii zarządzania kapitałem 4
obrotowym netto na wartość przedsiębiorstwa [Impact of the decision on the net working 5
capital management strategy on the value of the company]. In P. Karpuś, and J. Węcławski 6
(eds.), Problemy rozwoju rynku finansowego w aspekcie wzrostu gospodarczego [Problems 7
in the development of the financial market in terms of economic growth] (pp. 564-570). 8
Lublin: UMCS. 9
22. Oppler, T., Pinkowitz, L., Stulz, R., and Williamson, R. (1999). The determinants and 10
implications of corporate cash holdings. Journal of Financial Economics, 52(1), 3-46. 11
doi: 10.3386/w6234. 12
23. Petersen, M., and Rajan, R. (1997). Trade credit: theories and evidence. Review of Financial 13
Studies, 10(3), 661-691. doi: 10.1093/rfs/10.3.661. 14
24. Raheman, A., and Nasr, M. (2007). Working Capital Management and Profitability – Case 15
of Pakistani Firms. International Review of Business Research Paper, 3(1), 279-300. 16
Retrieved from https://www.researchgate.net/publication/228727444_Working_capital_ 17
management_and_profitability–case_of_Pakistani_Firms, 20.07.2019. 18
25. Richards, V.D., and Laughlin E.J. (1980). A. Cash Conversion Cycle Approach to Liquidity 19
Analysis. Financial Management, 9(1), 32-38. doi: 10.2307/3665310. 20
26. Shin, H.H., and Soenen, L. (1998). Efficiency of working capital and corporate 21
profitability. Financial Practice and Education, 8(2), 37-45. Retrieved from 22
http://connection.ebscohost.com/c/articles/1712459/efficiency–working–capital–23
management–corporate–profitability, 20.07.2019. 24
27. Sierpińska, M., and Wędzki, D. (2001). Zarządzanie płynnością finansową w przedsię-25
biorstwie [Management of financial liquidity in the enterprise]. Warszawa: PWN, 102-103. 26
28. Wędzki, D. (2003). Strategie płynności finansowej przedsiębiorstwa – przepływy pieniężne 27
a wartość dla właścicieli [Corporate financial liquidity strategies – cash flows and value 28
for owners]. Kraków: Oficyna Ekonomiczna, 40. 29
29. Zimon, G. (2014). Strategie zarządzania kapitałem obrotowym a płynność finansowa 30
przedsiębiorstw [Working capital management strategies and financial liquidity of 31
enterprises]. Rachunkowość a controlling – Working papers of the Wrocław University of 32
Economics, 344, 591-603. doi: 10.15611/pn.2014.344.54. 33