the effects of altering discharge policies to alternate
TRANSCRIPT

The Effects of Altering Discharge Policies to Alternate Level of CarePatient Flow
by
Lata Grover
A thesis submitted in conformity with the requirementsfor the degree of Master of Health Science
Graduate Department of Institute for Biomedical and Biomaterials EngineeringUniversity of Toronto
c© Copyright 2012 by Lata Grover

Abstract
The Effects of Altering Discharge Policies to Alternate Level of Care Patient Flow
Lata Grover
Master of Health Science
Graduate Department of Institute for Biomedical and Biomaterials Engineering
University of Toronto
2012
Alternate Level of Care (ALC) patients are patients that stay in the acute care setting while waiting to
be transferred to an ALC facility. They are not receiving the appropriate type of care and are occupying
acute care resources. ALC patients occupy 5,200 patient beds everyday in Canada, and 12 percent of these
ALC patients die during their waiting period. This study evaluates Toronto General Hospital’s (TGH)
discharge policy in the General Surgery and General Internal Medicine (GIM) departments using a discrete-
event simulation. For Long-term Care ALC patients, it was found that applying to one extra application
or maximizing the number of short waiting list facilities in their total number of applications significantly
reduces the number of ALC days and the number of died in hospital patients. Knowing if discharge policies
can decrease ALC days is not only significant to TGH but also to other health care institutions.
ii

Acknowledgements
I would like to express my gratitude to my supervisors Dr. David Urbach and Professor Dionne Aleman
for their guidance throughout the whole thesis process. They provided me with the opportunity to do an
operations research project because of my interest in the area, although I came from a Mechanical Engineering
background. They were always available to answer my questions and dedicated a lot of time to improving
my research and writing skills.
I would also like to thank my committee members Professor Michael Carter and Professor Timothy
Chan. Professor Michael Carter’s writings in health care operations research initially sparked my interest
in the area. It was great to receive his comments on my own research. Additionally, using Professor Chan’s
thoughtful feedback considerably helped improve the quality of my analysis.
At the beginning of my project when I was learning about the Alternate Level of Care process, Hsin-
Yi Yang of the University Health Network’s Discharge Office spent several hours explaining details of the
process to me and also managed to match patients with beds simultaneously.
The Division of Clinical Decision Making and Healthcare group provided me with feedback throughout
my Master’s thesis on presentations and ongoing results. They were also a great group to generate ideas
with as well as learn about current health care epidemiology research. I would also like to thank Dr. Urbach
for the opportunity to be part of this group.
I would like to thank Megan Chen and Rossini Yue for their support and giving me opportunities to
learn from other students’ research experiences. My appreciation goes to my classmate Caroline Chen for
proofreading my thesis right after she finished her own thesis defense. Finally, I would like to thank my
family for their continuous support as well.
iii

Contents
1 Introduction 1
1.1 Motivation . . . . . . . . . . . . . . . . . . . . . . . . . . . . . . . . . . . . . . . . . . . . . . 2
1.2 Institutional priorities and strategies . . . . . . . . . . . . . . . . . . . . . . . . . . . . . . . . 2
1.2.1 Ontario . . . . . . . . . . . . . . . . . . . . . . . . . . . . . . . . . . . . . . . . . . . . 2
1.2.2 Local Health Integration Networks . . . . . . . . . . . . . . . . . . . . . . . . . . . . . 3
1.3 Using simulations for decision-making . . . . . . . . . . . . . . . . . . . . . . . . . . . . . . . 3
2 Objectives 4
3 Literature review 5
3.1 Simulations in the health care setting . . . . . . . . . . . . . . . . . . . . . . . . . . . . . . . 5
3.1.1 Reducing wait times through health care resource modifications . . . . . . . . . . . . . 5
3.1.2 Reducing wait times through policy change . . . . . . . . . . . . . . . . . . . . . . . . 6
3.1.3 Incorporating human behaviours to simulation . . . . . . . . . . . . . . . . . . . . . . 7
3.2 ALC patients . . . . . . . . . . . . . . . . . . . . . . . . . . . . . . . . . . . . . . . . . . . . . 7
3.2.1 Appropriate ALC patient discharge . . . . . . . . . . . . . . . . . . . . . . . . . . . . . 8
3.2.2 Reasons for high ALC days . . . . . . . . . . . . . . . . . . . . . . . . . . . . . . . . . 8
4 Methods 9
4.1 Flowchart generation and validation . . . . . . . . . . . . . . . . . . . . . . . . . . . . . . . . 9
4.1.1 General Surgery social worker . . . . . . . . . . . . . . . . . . . . . . . . . . . . . . . . 9
4.1.2 GIM social worker . . . . . . . . . . . . . . . . . . . . . . . . . . . . . . . . . . . . . . 10
4.1.3 General Surgery nurse manager . . . . . . . . . . . . . . . . . . . . . . . . . . . . . . . 10
4.1.4 Toronto Central CCAC’s client services manager . . . . . . . . . . . . . . . . . . . . . 10
4.1.5 Performance Management representative at SIMS . . . . . . . . . . . . . . . . . . . . 10
4.1.6 Discharge Planning Office . . . . . . . . . . . . . . . . . . . . . . . . . . . . . . . . . . 11
4.2 Sources of data . . . . . . . . . . . . . . . . . . . . . . . . . . . . . . . . . . . . . . . . . . . . 13
4.2.1 Combined database . . . . . . . . . . . . . . . . . . . . . . . . . . . . . . . . . . . . . 14
4.2.2 Process times . . . . . . . . . . . . . . . . . . . . . . . . . . . . . . . . . . . . . . . . . 17
4.2.3 Distribution developments . . . . . . . . . . . . . . . . . . . . . . . . . . . . . . . . . . 17
4.3 Model construction and validation . . . . . . . . . . . . . . . . . . . . . . . . . . . . . . . . . 17
4.3.1 Validation process . . . . . . . . . . . . . . . . . . . . . . . . . . . . . . . . . . . . . . 20
4.3.2 Models attempted to be validated . . . . . . . . . . . . . . . . . . . . . . . . . . . . . 20
4.3.3 Description of validated model . . . . . . . . . . . . . . . . . . . . . . . . . . . . . . . 25
4.3.4 Determining number of model replications required . . . . . . . . . . . . . . . . . . . . 26
4.3.5 Scenarios modelled . . . . . . . . . . . . . . . . . . . . . . . . . . . . . . . . . . . . . . 26
iv

5 Results 28
5.1 Varying the fixed number of facilities . . . . . . . . . . . . . . . . . . . . . . . . . . . . . . . . 28
5.2 Varying the minimum number of facilities . . . . . . . . . . . . . . . . . . . . . . . . . . . . . 28
5.3 Defining a short waiting list . . . . . . . . . . . . . . . . . . . . . . . . . . . . . . . . . . . . . 31
5.4 Varying the minimum number of facilities with a short waiting list . . . . . . . . . . . . . . . 33
5.5 Increasing the frequency of waiting list updates . . . . . . . . . . . . . . . . . . . . . . . . . . 33
5.6 Varying the facility popularity distribution . . . . . . . . . . . . . . . . . . . . . . . . . . . . 33
5.7 Varying the minimum number of facilities with a short waiting lists with varying short waiting
list definitions . . . . . . . . . . . . . . . . . . . . . . . . . . . . . . . . . . . . . . . . . . . . . 35
6 Discussion 38
6.1 Trends for varying the number of applications and short waiting list facilities . . . . . . . . . 38
6.1.1 CCC . . . . . . . . . . . . . . . . . . . . . . . . . . . . . . . . . . . . . . . . . . . . . . 38
6.1.2 Convalescent care . . . . . . . . . . . . . . . . . . . . . . . . . . . . . . . . . . . . . . . 39
6.1.3 LTC . . . . . . . . . . . . . . . . . . . . . . . . . . . . . . . . . . . . . . . . . . . . . . 39
6.1.4 Palliative . . . . . . . . . . . . . . . . . . . . . . . . . . . . . . . . . . . . . . . . . . . 41
6.1.5 Rehabilitation . . . . . . . . . . . . . . . . . . . . . . . . . . . . . . . . . . . . . . . . 41
6.2 Overall trends . . . . . . . . . . . . . . . . . . . . . . . . . . . . . . . . . . . . . . . . . . . . . 41
6.3 Increasing the frequency of waiting list updates . . . . . . . . . . . . . . . . . . . . . . . . . . 43
6.4 Varying the facility popularity distributions . . . . . . . . . . . . . . . . . . . . . . . . . . . . 44
6.5 Varying the definition of a short waiting list and the number of short waiting list facilities . . 46
6.6 Data recording improvements . . . . . . . . . . . . . . . . . . . . . . . . . . . . . . . . . . . . 46
6.7 Limitations of model outputs . . . . . . . . . . . . . . . . . . . . . . . . . . . . . . . . . . . . 47
6.7.1 Applying findings in the real system . . . . . . . . . . . . . . . . . . . . . . . . . . . . 48
6.8 Other methods to improve ALC process . . . . . . . . . . . . . . . . . . . . . . . . . . . . . . 48
6.9 Recommendations for policy changes . . . . . . . . . . . . . . . . . . . . . . . . . . . . . . . . 49
7 Significance and Conclusions 50
Bibliography 50
A Popularity distributions and patient facility discharge histograms 55
A.1 CCC data . . . . . . . . . . . . . . . . . . . . . . . . . . . . . . . . . . . . . . . . . . . . . . . 55
A.2 Convalescent data . . . . . . . . . . . . . . . . . . . . . . . . . . . . . . . . . . . . . . . . . . 57
A.3 LTC data . . . . . . . . . . . . . . . . . . . . . . . . . . . . . . . . . . . . . . . . . . . . . . . 58
A.4 Palliative data . . . . . . . . . . . . . . . . . . . . . . . . . . . . . . . . . . . . . . . . . . . . 60
A.5 Rehabilitation data . . . . . . . . . . . . . . . . . . . . . . . . . . . . . . . . . . . . . . . . . . 61
B CCC Results 63
C Convalescent results 67
D Palliative results 71
E Rehabilitation results 75
F Pairwise comparison charts - varying the total number of applications 79
G Pairwise comparison charts - varying quantity of short waiting list facilities 85
v

H Pairwise comparison charts - updating short waiting lists daily 96
I Pairwise comparison charts - varying the definition of a short waiting list 102
J Pairwise comparison charts - varying the facility popularity distribution 108
vi

Chapter 1
Introduction
When an acute care patient no longer requires acute care services, s/he is designated as an Alternate Level
of Care (ALC) patient until s/he leaves the acute care facility. The patient uses the bed as a waiting area
until s/he is able to transfer to the appropriate ALC facility. The types of ALC facilities patients can apply
to include home (with or without support), rehabilitation, complex continuing care (CCC), long-term care
(LTC), group home, a transitional care bed, convalescent care, palliative care, hospice care, retirement home,
shelter, or supportive housing (Cancer Care Ontario, 2009).
This study focuses on ALC patient flow in Toronto General Hospital (TGH)’s General Surgery and
General Internal Medicine (GIM) departments. In TGH, an inter-professional care team and the patient or
his/her substitute decision maker (SDM) determine the appropriate type of facility for the patient (UHN
ALC Discharge Planning Committee, 2010). The Community Care Access Centre (CCAC) becomes involved
if the patient is transferring to LTC and convalescent care. The patient or his/her SDM with a social worker
select which specific facilities to send applications.
The first University Health Network (UHN) Discharge Policy was created on March 30, 2005. It was valid
until May 11, 2010. The second version was valid until December 22, 2010. The third version is currently
still in practice. The policies incorporate applying to a certain number of facilities with short waiting lists.
The wait times are determined by CCAC every 60 days. The policies for each type of ALC facility are
described in Table 1.1.
After the application submissions, the patient waits for the ALC facility’s approval. If approved, s/he
waits for a bed offer. With the CCAC, the patient has 24 hours to accept a bed offer before it expires. For
other types of beds, there is no fixed time but is approximately a few hours. However, for all types of beds,
TGH advises a patient to accept his/her first bed offer (UHN ALC Discharge Planning Committee, 2010).
This study analyzes the effects of changing acute care discharge policies on ALC patient flow. Although
the problem is Canada wide, TGH’s General Surgery and GIM departments are selected as an example to
analyze modified discharge policies.
ALC Facility Policy 1 Policy 2 Policy 3CCC Apply to all – –LTC 3 F with 2 SWL 3 F with 2 SWL 5 F with 3 SWLPalliative Minimum 3 F Apply to all Apply to allRehab Apply to all Apply to all Apply to all
Table 1.1: Progression of UHN discharge policy (F = facilities and SWL = facilities that have a short waitinglist)
1

Chapter 1. Introduction 2
1.1 Motivation
ALC patients using acute care as a waiting area has systemic effects on the health care system. Since acute
care beds are being occupied as a waiting area, patients who do require the acute care setting cannot be
admitted, leading to longer wait times (Burton et al., 2006). Long surgery and emergency room (ER) wait
times can result from post-operative beds being fully occupied (Burton et al., 2006). Patients waiting for
transfer from the ER to another hospital department, which is fully occupied by patients, including ALC
patients, consumes the ER’s resources. The main determinant to urban ER overcrowding is the availability
of staffed acute care beds and intensive care beds (Burton et al., 2006). In Ontario, there is an average of
2,874 ALC patients daily and 823 ER patients waiting for an inpatient bed at any time. This represents 18
percent and 5.2 percent of all acute care beds respectively (excluding paediatric and obstetric beds) (Ontario
Hospital Association, 2011). In the Toronto Central Local Health Integration Network (LHIN), where TGH
is located, the Ontario Hospital Association (2011) reported that ten percent of beds are occupied by ALC
patients.
ALC patients have a 12 percent death rate while waiting (Canadian Institute for Health Information,
2009). They experience increased functional impairment and complex health needs in comparison to a LTC
facility patient (Costa and Hirdes, 2010).
Additionally, ALC patients preoccupy acute care human resources. In a hospital, approximately 50
percent of nurses and 60 percent of caregivers provide care to ALC patients (Ostry et al., 2001). In terms
of caregiver safety, an ALC patient designated area of the hospital will reduce the risk of worker’s injuries.
Through interviews, the injured workers identified the principal reasons for injury as unpredictable and
aggressive behaviour, dementia, heavy lifting and transferring, and higher work loads (Ostry et al., 2001).
The ALC issue affects not only ALC patients, but other patients and health care providers as well.
Furthermore, LTC waits contribute to 39 percent of the total number of ALC days in Ontario (Burton
et al., 2006) where ALC days is defined as the total number of days ALC patients are waiting in acute care.
The second highest contributor to wait times is CCC, which is 20.7 percent of ALC days (Burton et al.,
2006).
Carey et al. (2005) found that in their hospital, 63 percent of all unnecessary length of stay (LOS) days
were due to non-medical delays (discharge planning and discharge destination unavailable). Of the non-
medical delays, 84 percent were due to unavailable nursing facility beds, which shows the possible impact
of improved discharge policies. The efficacy of TGH’s discharge policy to ALC facilities has not previously
been determined, so this study investigates potential patient flow improvements to the policy.
1.2 Institutional priorities and strategies
1.2.1 Ontario
In the Ministry of Health and Long-Term Care (MOHLTC)’s Result Based Plans for 2009- 2010 and 2010-
2011, reducing ER wait times is in its top two priorities (Ministry of Health and Long-Term Care, 2009-2010,
2010-2011). The plan highlights that to reduce ER wait times, ALC patient wait times are to be decreased.
The MOHLTC’s Expert Panel on Alternate Level of Care, established in May 2006, proposed solutions
to solve the ALC problem for Ontario (Burton et al., 2006). The panel grouped its recommendations, and
the following are those that affect acute care facilities: improving system access, integration and patient
flow; provider, patient and family education; best practices within and across health care organizations; and
data, benchmarks and accountability suggestions (Burton et al., 2006).
To improve system flow, integration and patient flow, Burton et al. (2006) suggests to modify discharge

Chapter 1. Introduction 3
policies. TGH has already modified its discharge policies from MOHLTC’s imposed policies by requiring
patients to choose more than one facility with some facilities having short waiting lists. However, varying
policy options should be further analyzed to determine superior discharge policies for reducing ALC days
(Burton et al., 2006).
The Centre for Healthcare Quality Improvement (CHQI) introduced the Flo Collaborative program in
September 2007 to reduce Ontario ALC days. The program promotes preliminary discharge planning and
removing unnecessary delays in the discharge process (Centre for Healthcare Quality Improvement, 2009).
The Flo Collaborative lists primary drivers and secondary drivers that affect the overall goal of decreasing
ALC days. Examples of primary drivers include design of care processes, community capacity, and placement
policies and practices. Examples of secondary drivers include removing unnecessary steps in care, having
the appropriate number of LTC beds, and modifying policies related to patient choice for LTC (Centre for
Healthcare Quality Improvement, 2009).
The MOHLTC’s Expert Panel on Alternate Level of Care and the CHQI both suggest exploring varying
discharge policies, which this research study investigates.
1.2.2 Local Health Integration Networks
The LHINs have created Integrated Health Service Plans (IHSP) for the years 2010-2013. Each LHIN has
identified reducing ALC days as one of its main priorities for the four years (Central East LHIN, 2009; Central
LHIN, 2010-2013; Hamilton Niagara Haldimand Brant LHIN ALC Steering Committee, 2008; North East
LHIN, 2009; North Simcoe Muskoka LHIN, 2009; South East LHIN, 2009; Toronto Central LHIN, 2009).
Many of the recommendations proposed to decrease ALC days involve investing in additional facilities
and beds. The Central, Central East, Hamilton Niagara Haldimand Brant, North Simcoe Muskoka, North
East, South East, and Toronto Central LHINs have identified improving discharge processes as an approach
to reducing ALC days (Central East LHIN, 2009; Central LHIN, 2010-2013; Hamilton Niagara Haldimand
Brant LHIN ALC Steering Committee, 2008; North East LHIN, 2009; North Simcoe Muskoka LHIN, 2009;
South East LHIN, 2009; Toronto Central LHIN, 2009).
It is advantageous to determine if the recommendations proposed will be effective before implementation.
This study uses operations research tools to make this determination.
1.3 Using simulations for decision-making
Models in operations research can be created analytically or through simulation. With more complex sys-
tems, simulations are commonly used (Winston, 2004). Simulations are advantageous because they require
fewer assumptions than analytical methods, some allow monitoring of system interactions for bottleneck
identification, and lengthy simulations can be created. It may be disadvantageous because it can be time-
consuming to build a reliable model, and simulations do not optimize the situation but create “what-if”
scenarios instead (Banks et al., 1996).
Simulation models can be static or dynamic, deterministic or stochastic, and discrete or continuous.
The ALC process is dynamic, as waiting lists vary over time. It is stochastic because patient decisions,
arrival rates, and lengths of care are random. It is discrete because each event such as a patient decision
or transfer is discontinuous. A dynamic, stochastic, discrete simulation is classified as a discrete-event
simulation (Winston, 2004). Discrete-event simulations are common in the health care sector (Angelis et al.,
2003; Brailsford and Schmidt, 2003; Davies and Davies, 1987; Duguay and Chetouane, 2007; Harper and
Gamlin, 2003; Ratcliffe et al., 2001; VanBerkel and Blake, 2007).

Chapter 2
Objectives
The objective of this study is to determine the effects of changing discharge policies imposed on patients
when choosing ALC facilities with the intention of improving patient flow. The study will measure the
total number of ALC days and the number of died in hospital patients in the General Surgery and GIM
departments at TGH using a discrete-event simulation. Discharge policies will vary by the total number of
facilities patients are required to choose and the number of facilities required with short waiting lists.
4

Chapter 3
Literature review
3.1 Simulations in the health care setting
No studies have been found that simulate the wait times between acute care and ALC facilities. The only
simulation studies found to address ALC are a study by Lane and Husemann (2008) and Xie et al. (2006).
Lane and Husemann (2008) mapped out the process from general practitioner referral to dismissal from
ward, including wait times to community services. However, Lane and Husemann (2008) focused on different
routes patients can take in the acute care facility and classify all ALC facilities into one category called
community care. The authors indicated the intention to incorporate system dynamics, but time constraints
only allowed for a generated flow diagram to be used for provoking discussion with health care managers in
a workshop.
Xie et al. (2006) created a model depicting flow on the LTC side between residential care and nursing care
in England using a continuous Markov model. Possible transferring patterns included transferring between
the two types of care, from short to LTC within a facility, or being discharged. Both of these studies did
not simulate the waiting process from acute care to an ALC facility and only model the existing flow, not
possible improvements.
However, researchers have studied decreasing wait times in other health care areas. Wait times can be
reduced by the modification of health care resources (Duguay and Chetouane, 2007; Lane et al., 2000; Perez
et al., 2008; Shim and Kumar, 2010; VanBerkel and Blake, 2007). Studies have also shown that wait times
can be reduced by the modification of policies. It is an appealing way to reduce wait times, as it does
not usually require reallocating resources or additional capital investment in equipment or human resources
(Harper and Gamlin, 2003; Patrick and Puterman, 2007; Ratcliffe et al., 2001; Rohleder and Klassen, 2000;
Tuft and Gallivan, 2001; Vasilakis et al., 2007; Wijewickrama, 2006).
3.1.1 Reducing wait times through health care resource modifications
Shim and Kumar (2010) created a simulation of the Accident and Emergency (A&E) department in a
Singapore hospital. It was found that by adding another payment station and a new ward dedicated to
short-term patients, wait times can be reduced. Duguay and Chetouane (2007) simulated a New Brunswick
ER’s busiest pathways and times to discover that, with a specified budget, one additional nurse and one
additional physician resulted in the largest average reduction in wait times. Furthermore, Lane et al. (2000)
identified that without emergency patients having beds to transfer to in another department, wait times in
the ER will increase. Increasing ward bed capacity in the simulation minimized the problem and avoids
having to cancel elective cases caused by full ward bed occupancy. This problem may be reflected in the
5

Chapter 3. Literature review 6
ALC situation as well. As emergency patients occupy beds intended for elective case patients, ALC patients
can be occupying ward beds.
Perez et al. (2008) modelled a Medellın, Columbia health center to discover that the bottleneck of high
wait times in the health center is the admission center’s low staff level. To solve the problem, staff levels
were increased.
Kumar (2011) created a system dynamics model with elective and non-elective patients entering a ward
and varied the number of beds on weekly waiting lists. The effects on the rejection rate for elective patients
and daily bed waiting lists for non-elective patients were determined.
As a more cost-effective strategy to decrease wait times, existing resources can be reallocated, rather
than added. Bed management is the alteration of bed resources to alter operations. For example, a discrete-
event simulation was used to redistribute beds in the General Surgery department of Capital District Health
Authority in Halifax, Nova Scotia by VanBerkel and Blake (2007). The hospital has two sites where it
performs general surgery with one receiving more non-elective cases because of the site’s ER. By keeping the
total number of beds the same but distributing the beds between the sites, the total wait time for patients
would increase or decrease depending on the bed configuration.
3.1.2 Reducing wait times through policy change
Policy changes can be implemented in scheduling systems to decrease wait times. Through simulation
modelling, Vasilakis et al. (2007) discovered that scheduling patients for a surgery rather than a surgery
with a certain surgeon can decrease wait times. Similarly, Harper and Gamlin (2003) found that in an
ear, nose, and throat clinic simulation, starting appointments earlier and by scheduling patients based off
an algorithm that schedules patients sequentially rather than in blocks, the wait time for a patient’s first
service decreased. Szecket et al. (2012) found that by changing an admission policy to promote more evenly
distributed admissions, there was a reduction in the variance in discharge rates and the LOS time. However,
it is mentioned the reduction in LOS time is mostly for shorter stay patients, and may not apply to the
sicker patients who are applying to other types of facilities after discharge.
A Japan outpatient clinic scheduling system was simulated by Wijewickrama (2006) to reduce patient
wait times but also to minimize the effect on physician idle time. The research study claims to be an
improved model to previous models because of its consideration of walk-in patients, interrelated subunits,
patients who use the clinic other than outpatients, second time consultations, and the dynamic characteristic
of a physician’s schedule. Four tested scheduling policies revealed that the policies that minimized patient
wait times and minimized physician idle times were not the same. Therefore, a hybrid policy that reduced
both outcomes was recommended. Rohleder and Klassen (2000) produced a scheduling simulation that also
reduces patient wait times and physician idle times but addresses patient’s special requests for appointments
at a certain time.
Patrick and Puterman (2007) simulated a diagnostic imaging clinic that images inpatients within a day
and schedules outpatients. Scheduling diagnostic imaging by providing a designated priority to inpatients
reduces outpatient wait times (Patrick and Puterman, 2007). This may be practical for a diagnostic imaging
model but would be impractical in the ALC model, as the patients are waiting to get out of beds required
for high priority patients. The prioritization would have to be based on the patients that potentially enter
their beds.
Several other studies have explored changing scheduling policies. LaGanga and Lawrence (2007) and
Giachetti (2008) simulated reducing wait times by decreasing problems associated with patients missing
outpatient clinic appointments. Zhou et al. (2008) modelled scheduling for the purpose of increasing profit
for a clinic. Tuft and Gallivan (2001) modelled cataract surgery scheduling and measured success using a

Chapter 3. Literature review 7
priority weighted measure that benefits reduced wait times for the most critical patients.
Policy changes, in relation to transplant allocation, have also been studied to address health care wait
times. Ratcliffe et al. (2001) studied policy changes related to selecting alcoholic liver disease or primary
biliary cirrhosis patients for liver transplant. The policies were evaluated based on the long-term survival
rate of patients with end stage liver disease and the overall cost effectiveness. From the nine policies
tested, the lowest incremental cost effectiveness ratio (total costs with transplantation minus total costs
without transplantation divided by life years gained with transplantation minus life years gained without
transplantation) occurred in a policy where the highest severity patients are given the lowest priority. Zenios
et al. (2000) use a quality-adjusted life years per patient measure to determine the efficacy of a transplantation
allocation policy. The highest rated policy found in this study determines transplant allocation by matching
certain patient characteristics.
Wong et al. (2010) have showed that by changing the daily discharge rates to the average daily discharge
rate or the average weekday discharge rate, the amount of inpatients who occupy the ER can decrease
significantly, thus allowing more ER patients to be admitted. Furthermore, discharge patterns were altered
to find their effects on bed occupancy rates and bed wait times by Zhu (2011). Earlier discharges and varying
discharge distributions were analyzed throughout the day.
No simulation studies have been found that simulate discharge policies with patient choice.
3.1.3 Incorporating human behaviours to simulation
Probability distributions and randomization are currently used to display human behaviour in discrete-event
simulations. Gonsalves and Itoh (2009), Brailsford and Schmidt (2003), and Sanders et al. (2008) have
researched ways to improve this method’s validity. Gonsalves and Itoh (2009) incorporated psychology into
wait time models to highlight that the reason for reducing wait times is to improve patient satisfaction.
However, a patient’s perception of satisfaction can also be improved by factors such as nurses’ consider-
ateness and entertainment facilities, which were incorporated into their simulation model. Brailsford and
Schmidt (2003) also attempted to improve discrete-event simulation through human psychology in a diabetic
retinopathy screening model. Instead of assuming a certain patient percentage will not attend their appoint-
ments, patients would have attributes that would define compliance. The authors indicated that there is
still more research required to make a realistic simulation with human psychology without having several
assumptions. Sanders et al. (2008) discussed using radio frequency identification cards (RFID) in an ER in
order to gather more accurate patient flow information to be used in simulation modelling. However, it is
a proof-of-concept and has not been implemented in a health care setting. Therefore, stochastic behaviour
demonstrated through probability distributions will still be used in this study to model human behaviour.
3.2 ALC patients
ALC is an area within Ontario’s health care system that has not commonly been addressed in the literature,
perhaps because of its fairly new classification. No studies could be found that simulate the process of a
patient leaving from an acute care facility to an ALC facility. However, studies have looked at characteristics
of ALC patients. The mean age of an ALC patient in Ontario is 75.4 years old, and approximately 50 percent
of ALC patients enter the acute care facility for either trauma, neurological and mental illness or disorders,
and cardiovascular and respiratory diseases (Burton et al., 2006). For ALC patients across Canada, 83
percent come into the hospital through the ER (Canadian Institute for Health Information, 2009).
Other areas of ALC patient research include ensuring proper facility placement after acute care (Brosseau
et al., 1996; Chang et al., 2004; Rivlin, 1990; Unsworth, 2001) and determining factors that increase the ALC

Chapter 3. Literature review 8
problem (Chang et al., 2004; Forrest et al., 2002).
3.2.1 Appropriate ALC patient discharge
ALC patients should be transferred to the appropriate type of facility in order to avoid future transportations
(Chang et al., 2004). In Canada, readmission occurs with 17 percent of ALC patients (Canadian Institute
for Health Information, 2009).
Unsworth (2001) researched types of information required from an orthopaedic or stroke patient to
determine his/her potential appropriate ALC facility between a nursing home, a rehabilitation centre, or the
patient’s home. Similarly, Brosseau et al. (1996) concluded that based on an acute stroke patient’s functional
status at admission, social support and gait status, it can be determined if the patient should go to a private
home, rehabilitation center, or LTC facility.
More specifically, decision models were created by Rivlin (1990) and Chang et al. (2004) to identify the
most appropriate type of care for a patient. Based on the patient’s symptoms, Rivlin (1990) developed, in
the United Kingdom, an assistive tool for deciding acute care patient destination between a nursing home,
a residential home, or a long-stay bed in a nursing environment. Chang et al. (2004) created a flowchart for
discharge planning using an analytical hierarchy model combined with case-based reasoning. An analytical
hierarchy model is a model used for decision-making involving several different stakeholders. It combines
different attributes with appropriate weightings to determine the solution to a problem (Winston, 2004).
The factors Chang et al. (2004) used to generate the decision-making model are based on historical data of
discharges and patient information.
The studies discussed have determined how to ensure appropriate patient transfer after acute care, but
have not explored if this has an effect on ALC days.
3.2.2 Reasons for high ALC days
Forrest et al. (2002) determined that reasons to be transferred to an LTC facility include increasing age,
no spouse or children, and having a psychiatric or neurologic diagnosis. As for reasons for high ALC days,
Forrest et al. (2002) found that the determining factors are longer hospital stays and a requirement for an
LTC facility at the end of acute care. They also found that factors that increase the LOS are no children, a
neurologic or psychiatric diagnosis, and surgery not due to the original reason for admission. However, this
study does not investigate methods to reduce the high ALC days.
Furthermore, Chang et al. (2004) used modelling to predict LTC facility demand until 2020 and LTC’s
financial viability. Chang et al. (2004) used information such as patient and patient family incomes, family
assets, recovery from disability, nursing home services, eligibilities for public programs, and public and
private LTC finances. The study predicted a larger proportion of the population entering LTC facilities, this
population being more financially stable, and increases to LTC expenses (Chang et al., 2004). The study
demonstrates a need to discover methods to reduce ALC days to accommodate the upcoming increasing
demand.

Chapter 4
Methods
A discrete-event simulation was developed to model ALC patient flow. In a simulation model, the system and
its boundary must be clearly distinguished from its environment before modelling can begin. This research
study’s system is the patient flow after finishing receiving acute care services to when the patient transfers
to an ALC facility, goes home, further requires acute care, or dies. The ALC facilities include home, home
with services, respite care, convalescent care, palliative care, retirement homes, CCC, rehabilitation centres,
or LTC.
4.1 Flowchart generation and validation
To model ALC patient flow in TGH’s General Surgery and GIM departments, interviews were performed to
understand the flow. This was done with system experts, including a social worker from General Surgery
and GIM, the General Surgery’s nurse manager, the Toronto Central CCAC’s client services manager,
a Performance Management representative at Shared Information Management Services (SIMS), and the
Discharge Planning Office. Information about the admission and discharge process was also gathered from
the UHN Discharge Planning and Admission Policy and Procedure Manuals.
Following the initial development of the flowchart, a qualitative flowchart review was performed with
each of the system experts. This ensured that any of the revisions were agreed upon by all of the system
experts.
A summary of new information gained from each system expert is listed below. Some information helped
in the development of the final flowchart and others helped determine how the data would be gathered.
4.1.1 General Surgery social worker
• When deciding if a patient should be designated as ALC, a decision is made with all appropriate
health care professionals (occupational therapists, physiotherapists, speech pathologists, respiralogists,
nurses, physicians, and social workers).
• The Discharge Planning Office will provide social workers with bed offer information.
• Patients are first encouraged to travel home. This can be done without services, through the Home at
Last program, home with community services, or the Waiting at Home program. They can also go to
retirement homes if they are financially capable. If these are not appropriate, the patient may then
apply to rehabilitation, convalescent care, palliative care, LTC, or CCC.
9

Chapter 4. Methods 10
• LTC is for patients who require ongoing medications and Personal Support Workers (PSWs). Conva-
lescent care is for those who meet LTC needs but only require care for less than 60 days. For CCC,
patients have a chronic condition that would require physicians daily and probably more advanced
technology than LTC.
• Patients in General Surgery who are non-elective will more likely be the patients who have longer
ALC days. These patients are not as thoroughly assessed to determine if they are good candidates for
surgery.
4.1.2 GIM social worker
The GIM social worker had stated that the flowchart created with the General Surgery department is the
same process experienced in GIM.
4.1.3 General Surgery nurse manager
• The kind of information that is recorded in the Electronic Patient Record (EPR) by General Surgery
during the ALC process was outlined. These fields are summarized in Table 4.1.
• The ALC data in the EPR goes back approximately two years.
4.1.4 Toronto Central CCAC’s client services manager
• When reviewing the developed flowchart with CCAC, it was discovered that the flowchart was de-
scribing more of what the system is supposed to look like opposed to what actually happens in the
system.
• All other types of ALC facilities should be considered before looking at LTC.
• The client services manager deals with patients who are not following the UHN discharge policy. This
is approximated as 20-25 percent of ALC patients. This would include patients who continually refuse
to go home when it is appropriate or to go into an appropriate facility. However, the client services
manager emphasized, that according to Ontario legislation, the patient only has to apply to one facility.
• In the UHN discharge policy, it is indicated that some of the LTC facilities patient choose must have
a short waiting list. Patients are encouraged to apply to all suitable facilities for rehabilitation and
CCC.
• CCAC believes that the process of applying to facilities can pose a large time delay. Therefore, it is
important to involve CCAC as early on in the process as possible.
4.1.5 Performance Management representative at SIMS
• Performance Management performs traditional reporting. Information is reported to CIHI 25 days after
it occurs. Because of the incompleteness of the EPR, they rely on additional sources of information. It
is approximated that the compliance for ALC procedure ordering on the EPR is 75 percent. Within this
data, error exists. Because of this error and compliance rate, the Performance Management department
manually goes through and compares data in the EPR and a database maintained by the Discharge
Planning Office.

Chapter 4. Methods 11
• The Performance Management department does not feel that ALC data entry should be entered by
physicians. As social workers are more integrated in the discharge process, they should be given access
to the EPR.
4.1.6 Discharge Planning Office
• Social workers prepare ALC applications and then submit the applications to the Discharge Planning
Office.
• The Waiting at Home program is available for patients in Toronto Central LHIN who are waiting for
LTC and can go home safely with CCAC services for a maximum of eight hours per day of services.
When the patient applies to the Waiting at Home program, s/he must have at least one open application
for a facility and CCAC will assess them in 24-48 hours. If the patient does not get accepted to a
facility within 60 days, s/he is then considered a crisis patient and has to maximize their number of
applications. The Waiting at Home program also existed with rehabilitation and convalescent care
from December 2, 2009 to December 13, 2010.
• The different types of patients types were categorized by the Discharge Planning Office based on their
symptoms. Palliative care is for patients who are dying. Rehabilitation patients are starting to get
better. Convalescent care has a shorter duration than LTC and is not as intense. It is expected that
convalescent care patients will eventually be going home. LTC and CCC are meant for patients who’s
functional status is steady.
• For outpatient rehabilitation, it is likely that the patient can go home and wait to be admitted to these
facilities.
• When applying to LTC, the application will be reviewed by CCAC and then by the actual facility.
When the facility is outside of the Toronto Central LHIN, the application is sent to the Toronto Central
CCAC, then to the appropriate CCAC, and then to the LTC facility.
• There are some CCAC rules that make the system more complex. If the patient gets accepted to a
LTC facility that was not his/her first choice, s/he can go to the facility and keep his/her choices for
higher priority facilities open. S/he is able to transfer to this facility when s/he gets the bed offer.
This rule does not apply if these higher priority facilities are outside of Toronto Central LHIN.
• The convalescent care type was introduced to decrease ALC days, but, from the opinion of the Discharge
Planning Office, it seems like it has actually increased ALC days since its development. For St. Hilda’s,
there are beds open but not filled because of the institutional layers required to navigate through. It
sometimes takes two to three weeks to hear back from a facility.
• Once the Discharge Planning Office sends the application to a facility, the facility can either accept,
reject or request additional information about the patient. The patient can be rejected if s/he may be
medically too active or not be motivated.
The final flowchart is shown in Figure 4.1. The discrete-event simulation was constructed based on this
flowchart.

Chapter 4. Methods 12
Doe
s pa
tient
requ
ire s
uppo
rt?
Can
pat
ient
go
toa
retir
emen
t hom
e?A
pplic
atio
nac
cept
ed?
Doe
s pa
tient
re
quire
reha
bilit
atio
n?
Doe
s pa
tient
requ
ire c
ompl
ex
med
ical
and
car
ene
eds?
Doe
s pa
tient
requ
ire e
nd-o
f-life
care
?
Doe
s pa
tient
requ
ire s
hort-
term
ca
re?
Reh
abili
tatio
n A
pplic
atio
n
Ret
irem
ent H
ome
App
licat
ion
CC
C A
pplic
atio
n
Pal
liativ
e C
are
App
licat
ion
Con
vale
scen
t Car
e A
pplic
atio
n
Long
-Ter
m C
are
App
licat
ion
Doe
s pa
tient
wan
t h
ome
care
?
App
licat
ion
acce
pted
?
No
No No
No
No
No
Yes
Yes
Yes
Yes
Yes
Yes
Pat
ient
ALC
Des
igna
tion
Yes
No
No
Pro
toco
l for
Man
agin
g C
ompl
ex D
isch
arge
s
Pat
ient
fini
shed
rece
ivin
g ac
ute
care
Can
pat
ient
go h
ome?
Hom
e w
ithou
t ser
vice
s
Yes
No
A
Doe
s pa
tient
requ
ire s
uppo
rt?
Yes
Del
ay in
se
rvic
es?
CC
AC
Ass
essm
ent Ye
s
Pat
ient
ALC
Des
igna
tion
Del
ay in
ser
vice
s?
Yes
No
No
Hom
e w
ith s
ervi
ces
Qua
lify
for W
@H
?
No
No
App
licat
ion
acce
pted
?
No
Yes
Yes
App
licat
ion
acce
pted
?
No
App
licat
ion
acce
pted
?
No
A
W
ait l
ist?
No
Wor
sene
dco
nditi
on?
Que
ue No
Yes
Yes
Exi
t ALC
Des
igna
tion
Exi
t ALC
Des
igna
tion
App
licat
ion
acce
pted
?
No
A
Yes
A
Yes
A
Yes
A
Yes
A
Exi
t ALC
Des
igna
tion
No
Exi
t ALC
Des
igna
tion
Fig
ure
4.1:
Flo
wch
art
dev
elop
edfr
om
dis
cuss
ion
sw
ith
AL
Cp
ati
ent
flow
syst
emex
per
ts

Chapter 4. Methods 13
RM&R EPR SWDBMedical record number Medical record number
OHIP Number OHIP numberALC designation date Ready for discharge date
Rehab/CCC/LTCH/CCAC Disposition Level of careReferral date Faxed dateAccepted/denied dateAdmitted date Discharge date Discharged dateALC facility Refer facility
Institution Facility
Table 4.1: Names of data fields in the RM&R, EPR and SWDB compared against each other
4.2 Sources of data
Three sources of information were used to gather patient information. The first source of information is
the Record Matching & Referral (RM&R) system, which is maintained by the Discharge Planning Office,
CCAC, and ALC facilities for CCC, rehabilitation, and LTC. It began in 2009 in Toronto Central LHIN and
has progressively gained the usage of eight rehabilitation or CCC facilities and 37 LTC facilities. The second
source of information is the EPR, and the third is a Microsoft Access database maintained by the Discharge
Planning Office. The Discharge Planning Office collects all of the offline information from social workers and
puts it into the this Microsoft Access database, which will be called the social worker’s database (SWBD).
It was not widely used until 2006.
Only data for patients who had their entire ALC status between 2009 and 2010 were gathered. It was
assumed the number of ALC days found from patients who were designated as ALC before January 1, 2009
and still an ALC patient after January 1, 2009 and patients who were designated as ALC before December
31, 2010 but discharged after December 31, 2010 do not contribute significantly to the total number of ALC
days between 2009 and 2010.
The SWDB data was extracted from the Microsoft Access database to an excel file. The excel file was
organized in order to be compared to the other sources of information. The RM&R and EPR data was
requested from SIMS.
After getting access to the three sources, it was discovered that the SWDB included the most patient
entries for TGH General Surgery and GIM and included more data fields required for the model.
The RM&R contained fewer patients, as it only included the patients from CCC, rehabilitation, and LTC.
The information in the RM&R was compared against the SWDB using patient’s Ontario Health Insurance
Plan (OHIP) numbers as a reference.
The EPR categorized the patient as either TGH, Toronto Western Hospital, or Princess Margaret Hospital
with no further departmental information. This set of data could not be treated as its own independent set,
so it had to be compared against the SWDB using Medical Record Numbers (MRNs).
MRNs and OHIP numbers were then be removed and replaced with randomized identification numbers
in order to keep anonymity of the data. To ensure confidentiality, all of the files with patient identifiable data
were kept on the research student’s account on the UHN server. The files were backed up on an encrypted
USB key. Table 4.1 demonstrates which data fields were compared against each other between the three
sources of data.
There were 3920 TGH General Surgery and GIM entries in the SWDB. 2975 entries had ALC designation
dates before 2009 and 162 of the entries after 2010, leaving 783 entries. Entries without an ALC designation
date were kept incase this date could be found from the other two data sources.
There were 1314 entries exported from the EPR between 2006 and 2010. 217 entries had unrecognizable

Chapter 4. Methods 14
Mismatch field QuantityAcute care admission date 6Applied facility 23Discharged location 18ALC designation date 97Discharge date 23
Table 4.2: Frequency of mismatched fields between the EPR and SWDB. More than one type of error canoccur in an entry
Health characteristic Quantity Health characteristic QuantityBehavioural Issues Present 163 Mobility scooter 0Dialysis 162 Mobility walker 0Eternal feeding 135 Mobility wheelchair manual 3Equipment needs 135 Mobility wheelchair auto 0Intravenous 128 Respiratory BIPAP 0Oxygen bipap 0 Respiratory CPAC 1Oxygen constant O2 7 Respiratory nebulizer 0Oxygen CPAP 2 Respiratory tracheotomy 0Oxygen intermittent 15 Oxygen therapy 26Oxygen O2 at exercise 0 Bladder 26Oxygen at rest 2 Excretion appliance 26Tracheostomy 89 Suctioning 26Ventilation 89 Wandering support 26Skin condition 89 Smoker/smoking history 25Mobility immobile 13 Transfers 25
Table 4.3: Frequency of patient properties in RM&R
MRNs. Low MRNs were found with only six digits. These were unrecognizable so had to be omitted from
the comparison process. 418 MRNs entries could be matched against the SWDB. However, mismatches were
found in the data fields listed in Table 4.1. The frequency of mismatched fields are listed in Table 4.2.
The RM&R contained 7464 entries with a separate entry for each facility applied to by a patient. 7452
entries had OHIP numbers. Two entries were removed because the OHIP number had less than ten digits.
The dataset included all departments, so entries in the SWDB were used to compare against the RM&R in
order to find discrepancies. 835 of the RM&R entries could be matched against entires in the SWDB.
The RM&R contained fields for patient health characteristics such as whether s/he required dialysis or
ventilation. However, this information was not provided consistently. As well, because the RM&R was
not inclusive of all facility types, these properties would not be available for all patients in the discrete-
event model. Each health characteristic and the number of entries that had information on this health
characteristic are listed in Table 4.3.
When comparing everything against the SWDB, 190 SWDB patient entries could be matched against
EPR and the RM&R. 150 SWDB patient entries could be matched against just the RM&R. 228 SWDB
patient entries could be matched against just the EPR. 215 SWDB patient entries could not be matched
against either of the other two databases.
4.2.1 Combined database
Now that all of the data sources were compared against each other, discrepancies had to be resolved and the
data had to be analyzed to ensure it was realistic.
The combined database only included entries that had the entire ALC status within 2009 and 2010 and
entries without an ALC designation date. If this date was unknown after comparison between the three

Chapter 4. Methods 15
Issue Possible reason Assumption/resolutionInconsistent numbering of the fa-cilities in the Refer facility field
These numbers may be prioritiesfor the patient or an arbitrary setof numbers.
Facility priorities were excludedfrom the study.
Mismatched ALC designationdates
Staff delayed recording of date. Earlier date is assumed.
Additional applied facilities inSWDB
There are some cases where thepatient specifies that s/he maywant to apply to a certain appli-cation but does not actually ap-ply to it.
Model assumes the SWDB num-ber of applied facilities is accu-rate and may have an inflated ac-tual number of applications.
Patient does not have any ap-plied facilities but was admittedto an ALC facility
Entry error occurred. Patient must apply to the facilitys/he is discharged to.
SWDB missing information forsome patients with a few ALCdays
If a discharge card was not re-quired, the patients may justbe taken care of and dischargedwithin the General Surgery orGIM unit.
If the patient is found in anotherdata source, they are added tothe combined database.
High rate of discharges to acutecare in EPR
In the EPR, it is quick tochoose a facility with a preced-ing “Acute care - ” term.
If SWDB had the same facilitywithout the prefix, the patient isassumed to go to the ALC facil-ity.
Discrepancies of whether patientwent home with or without ser-vices between data sources
As long as the patient was notdischarged to an ALC facility,the field was not reliable onwhether the patient was goinghome with or without services.
Model does not differentiate be-tween going home with or with-out services.
Table 4.4: Issues found while comparing data sources, possible reasons, and assumptions or resolutions
sources of information, the entry was removed (16 entires). Five duplicate entries were removed. The seven
respite and retirement patents are removed, as these patients do not largely contribute to the total number
of ALC days.
The total ALC LOS was determined by the number of days between the ALC designation date and the
discharge date. If the ALC LOS value was below zero, the entry was removed (six entries).
Unmatched fields were discussed with the Discharge Planning Office. Issues, their possible reasons, and
assumptions that were made to overcome the discrepancies are outlined in Table 4.4.
Finally, six entries are removed due to unexplainable information after discussion with the Discharge
Planning Office. Therefore, 743 entries are used to model the ALC patient flow.
The breakdown of total number of ALC patients can be seen in Figure 4.2 and number of ALC days in
Figure 4.3. The most number of patients apply to rehabilitation facilities, but the most number of ALC days
is for LTC.
The total number of unique facilities that all patients previously applied to in 2009 and 2010 are outlined
in Table 4.5. This is also the number of facilities that will be available for a patient to apply to in the model.

Chapter 4. Methods 16
Figure 4.2: Distribution of number of ALC patients applying to each ALC facility type in TGH GeneralSurgery and GIM in 2009 and 2010
Figure 4.3: Distribution of number of ALC days for each ALC facility type in TGH General Surgery andGIM in 2009 and 2010
ALC facility type Total number of facilitiesCCC 12Convalescent 14LTC 67Palliative 17Rehabilitation 27
Table 4.5: Total number of unique facilities patients applied to in 2009 and 2010 for each ALC facility type
Chapter 4. Methods 17
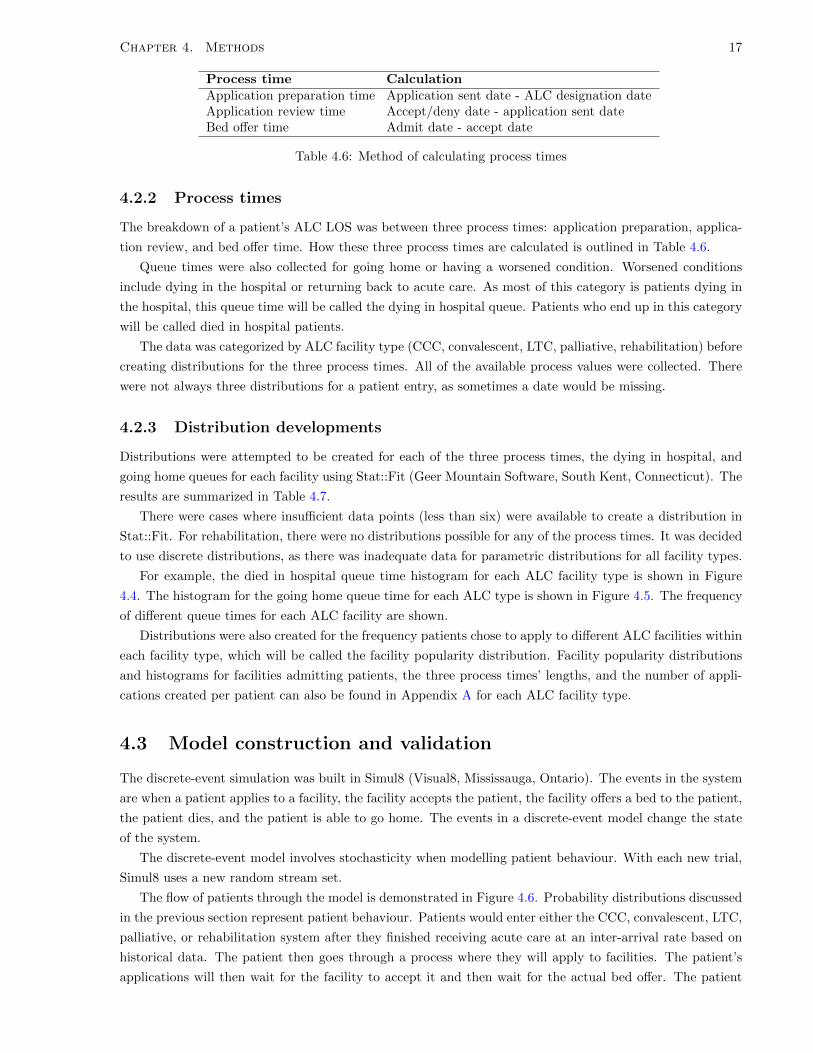
Process time CalculationApplication preparation time Application sent date - ALC designation dateApplication review time Accept/deny date - application sent dateBed offer time Admit date - accept date
Table 4.6: Method of calculating process times
4.2.2 Process times
The breakdown of a patient’s ALC LOS was between three process times: application preparation, applica-
tion review, and bed offer time. How these three process times are calculated is outlined in Table 4.6.
Queue times were also collected for going home or having a worsened condition. Worsened conditions
include dying in the hospital or returning back to acute care. As most of this category is patients dying in
the hospital, this queue time will be called the dying in hospital queue. Patients who end up in this category
will be called died in hospital patients.
The data was categorized by ALC facility type (CCC, convalescent, LTC, palliative, rehabilitation) before
creating distributions for the three process times. All of the available process values were collected. There
were not always three distributions for a patient entry, as sometimes a date would be missing.
4.2.3 Distribution developments
Distributions were attempted to be created for each of the three process times, the dying in hospital, and
going home queues for each facility using Stat::Fit (Geer Mountain Software, South Kent, Connecticut). The
results are summarized in Table 4.7.
There were cases where insufficient data points (less than six) were available to create a distribution in
Stat::Fit. For rehabilitation, there were no distributions possible for any of the process times. It was decided
to use discrete distributions, as there was inadequate data for parametric distributions for all facility types.
For example, the died in hospital queue time histogram for each ALC facility type is shown in Figure
4.4. The histogram for the going home queue time for each ALC type is shown in Figure 4.5. The frequency
of different queue times for each ALC facility are shown.
Distributions were also created for the frequency patients chose to apply to different ALC facilities within
each facility type, which will be called the facility popularity distribution. Facility popularity distributions
and histograms for facilities admitting patients, the three process times’ lengths, and the number of appli-
cations created per patient can also be found in Appendix A for each ALC facility type.
4.3 Model construction and validation
The discrete-event simulation was built in Simul8 (Visual8, Mississauga, Ontario). The events in the system
are when a patient applies to a facility, the facility accepts the patient, the facility offers a bed to the patient,
the patient dies, and the patient is able to go home. The events in a discrete-event model change the state
of the system.
The discrete-event model involves stochasticity when modelling patient behaviour. With each new trial,
Simul8 uses a new random stream set.
The flow of patients through the model is demonstrated in Figure 4.6. Probability distributions discussed
in the previous section represent patient behaviour. Patients would enter either the CCC, convalescent, LTC,
palliative, or rehabilitation system after they finished receiving acute care at an inter-arrival rate based on
historical data. The patient then goes through a process where they will apply to facilities. The patient’s
applications will then wait for the facility to accept it and then wait for the actual bed offer. The patient

Chapter 4. Methods 18
Process time ALC facility type Available distributionsApplication preparation CCC None
Convalescent TriangularLTC NonePalliative NoneRehab None
Application Review CCC Beta,Chi-squared,Power function,Triangular,Uniform,Weibull
Convalescent TriangularLTC ExponentialPalliative NoneRehab None
Bed offer CCC NoneConvalescent Exponential,
Power function,Triangular
LTC Lognormal,Pearson 5,Pearson 6
Palliative NoneRehab None
Going home CCC NoneConvalescent Gamma,
Pearson 6,Weibull,Lognormal,Erlang
LTC Lognormal,Beta
Palliative NoneRehab Weibull
Dying in hospital CCC NoneConvalescent NonePalliative Lognormal,
Pearson 6,Pearson 5
Rehab Triangular,Rayleigh,Weibull,Power function
Table 4.7: Distributions with Kolmogorov-Smirnov test p-values above 0.05

Chapter 4. Methods 19
Figure 4.4: Histogram of died in hospital queue times for each ALC facility type
Figure 4.5: Histogram of going home queue times for each ALC facility type

Chapter 4. Methods 20
Figure 4.6: Process of patients travelling through the model
will also have properties representing when s/he may die in the hospital or when s/he will travel home.
Depending on which facility s/he gets admitted to first or if s/he reaches his/her queue time for going home
or dying it the hospital, s/he will go to the appropriate destination type. Each process time was chosen from
a distribution for that process time and that ALC facility type.
Distributions to go home and die in hospital queues are made based on each ALC facility type. Therefore,
it is assumed that there is a trend between these times within an ALC facility type, but this cannot be
extrapolated to all ALC patients.
4.3.1 Validation process
The model outputs are compared against validation values to ensure that the model closely represents the
actual ALC process at TGH’s General Surgery and GIM departments. The values to be validated against
are shown in Table 4.8.
To validate the model, results from various models with the same general flow were compared to the
validated data. Data distributions types, rejection rates, and randomness varied.
4.3.2 Models attempted to be validated
These test scenarios were done for one ALC facility type at a time in order to evaluate and understand the
model outputs. The following are done for CCC. The average ALC LOS per patients would be 30.81 days

Chapter 4. Methods 21
Type of ALC facility ALC days Number of died in hospital ALCpatients
CCC 955 4Convalescent care 351 1LTC 4092 11Palliative care 1317 32Rehabilitation care 3601 23
Table 4.8: Values to be validated against for each type of ALC facility over two years for General Surgeryand GIM
Distribution type Average ALC LOS (days)Exponential 16.32Triangular 15.53Uniform 15.66Beta 17.46Weibull 16.44Lognormal 17.03Pearson 6 16.13Pearson 17.03
Table 4.9: CCC average ALC LOS model outputs when varying the application review distribution
for the actual system (955 days and 31 patients).
The outputs of the first model were an average of 15.93 days per patient and 30 patients, not equal to
the validation values. To overcome the lower average ALC LOS, parametric distributions were to be used,
as higher values could be captured from the distribution tails. It was only possible to create parametric
distributions for the application review time in Stat::Fit because of the low number of available process times.
Various application review time distributions that had a p-value above 0.05 from the Stat::Fit goodness of
fit test were modelled. The average ALC LOS model outputs are listed in Table 4.9.
Although varying the distribution type increased the average ALC LOS, the model outputs are still far
from the 30.81 day validation value.
A flaw was realized in the logic. In the model, a patient waits in a queue until s/he reaches his or her
going home or dying in hospital queue time or if s/he receives a bed offer. There are some high values for
bed offer process times, but because there are no dying in hospital or going home queue times longer than
this, the patient will always have another queue time before s/he can reach the long bed offer process times.
In reality, there will be patients who will not want or be able to go home and who are healthy enough to
not die while waiting. A certain percentage of patients will not reach his/her dying in hospital or going home
queue time and will wait for a bed. During a previous meeting with the CCAC Client Services Manager,
she mentioned that she dealt with approximately 20-25 percent of patients who were the more “difficult”
patients to discharge, who are patients who continually refuse to go home when appropriate or reject bed
offers from suitable ALC facilities. Not allowing 25 percent of patients to go home was incorporated into
the model, and this increased the average ALC LOS to 24.69 days for CCC. This methodology was carried
over to the other four ALC facility types. The results were inconsistent (Table 4.10).
It was decided to move focus onto palliative care since the results were 23 percent of the validation
average ALC LOS value. To represent the system more accurately, it was decided to use distributions for
each facility rather than each facility type. Therefore, if bed offer times tended to by higher for Facility A
than Facility B, then this would be represented in the system through individual process time distributions.
However, application preparation times were kept general to each ALC facility type.
Because there was not an appropriate parametric distribution for every process time for each ALC facility

Chapter 4. Methods 22
ALC facility type Model output (days) Validation value (days)Convalescent 10.00 11.32LTC 17.85 41.76Palliative 1.38 5.93Rehabilitation 9.77 9.97
Table 4.10: Comparison of model and actual average ALC LOS values when not providing 25 percent ofpatients a died in hospital/home queue time
type, there would not be a parametric distribution for each ALC facility. Discrete distributions were used
again. Although there was an increase in the average LOS, the results were still not close to the expected
validation values.
The next attempt was to go back to the data sources and expand how much information was extracted
from it. Previously, if one of the two dates that determined a process time were unavailable, the data would
be omitted from the discrete distributions. However, all of the total ALC LOS values were known because
each entry had at least an ALC designation date and a discharge date. However, if the only other available
date was the application sent date, from the previous method, an application preparation time would be
extracted, but no other process times. The application review time and bed offer wait time both require
the accept/deny date. Therefore, the total ALC LOS would not be represented in the generated discrete
distributions. To overcome this issue, some assumptions were made when re-extracting process times from
the data. In the previous case, if only the application sent date was known, then it was assumed that the
application review time would be zero and the remainder of the LOS value was due to the bed offer time.
If only the ALC designation date and the discharged date were known, the application preparation and
application review times would be assumed to be zero. The total LOS time would be assumed to be the bed
offer wait time.
If any other process times can be formed, the time difference between the total ALC LOS and the process
time would be assumed to be in the bed offer wait time. If the bed offer wait time is known, the time would
be assumed in the preceding unknown process time.
Therefore, there are two sets of process times created from the combined database. The application
dataset is formed from all of the process times that were possible to create with the available dates. The
method just described that creates three process times for each patient entry will be called the patient
dataset.
The model was still not producing reliable outputs with the patient dataset. Therefore, all of the logic
was removed from the model, and only randomization was retained. Therefore, the patient would only
produce one application, and all of the application process times would be randomly chosen. The shortest
queue logic is removed. Then the factors described below were varied individually to find their effects on the
model outputs.
• Using the patient or application dataset
• Using rejection rates Perhaps, applications with low queue times remained in the system when not
intended to because these applications were actually supposed to be rejected. To determine rejection
rates, the total number of patients admitted to a facility was subtracted from the total number of
applicants to the facility and this calculated number was divided by the number of applicants to the
facility and then multiplied by 100. The rejection rate was applied when the patient was going from
the queue for waiting for an acceptance to the queue for waiting for a bed offer.
• Separating patients going home It is the first priority to send patients home with or without
services, if applicable. Generally, it is where a patient would like to be cared for and is more economical

Chapter 4. Methods 23
Model Dataset Rejection rate Going home patientsModel 1 Patient No IntegratedModel 2 Patient Yes IntegratedModel 3 Application No IntegratedModel 4 Application Yes IntegratedModel 5 Application No SeparatedModel 6 Patient Yes SeparatedModel 7 Patient No Separated
Table 4.11: Model developed in palliative care for validation process
Figure 4.7: Percentage of error for average ALC LOS over two years compared to validation values
for the health care system. It also lowers the load on the waiting lists. The delays for going home may
be because of renovations, inadequate care resources, unavailability of family members, or time required
to arrange services. Therefore, varying the ALC discharge policies may not affect this pathway. The
patients who are going home will be separated right after entering the ALC system and would not
create other applications.
Table 4.11 outlines which of the preceding properties are used in each experimented model.
The percentage of error found for each facility’s average ALC LOS values over two years to the expected
validation value are reported in Figure 4.7. The base model only has randomization and not the shortest
queue logic (the shortest queue depicts where the patient goes after acute care).
An issue found with the rejection rate is that it is actually the non-acceptance rate. This rate is higher
than a rejection rate. This was because the non-acceptance rate would include not only patients who were
rejected but also patients who decided to go to another facility. For example, after including the rejection
rate in some instances, all of the items representing a patient would be deleted, and the patient would not
actually exit the system. This method was discarded, as there was no further information available from the
data in order to get an accurate rejection rate.

Chapter 4. Methods 24
Figure 4.8: Percentage of error for ALC LOS of model outputs when randomizing each process time andassociating or disassociating all randomized process times
Overall, it was found that the model outputs were less than the expected ALC LOS values. This is most
likely because the system always uses the item with the shortest ALC LOS to represent the patient.
There are two issues that had to be resolved. The first is that there is too much randomization in the
model. This can be seen by the high variability of the base model in Figure 4.7. The second is that the
shortest queue does not always represent the patient’s preferences accurately.
To determine the reason for the high variability, all of the randomization and logic was removed from the
model. The results for randomizing each process time individually and then randomizing all three process
simultaneously are shown in Figure 4.8. The randomization of process times can either be associated or
unassociated. Therefore, the patient can either receive the same three process times a previous patient did,
or s/he will independently receive an application preparation, application review, and bed offer time from
possibly three different patients.
From Figure 4.8, much less variability can be seen with associating process times rather than disasso-
ciating them. Therefore, when adding the next area of randomization when patients choose where to send
their applications, it is added to the model with the three process times randomized and associated with
each other. In Figure 4.9, the results of incorporating the shortest queue logic are shown. Finally, the model
adds the died in hospital and the travelling home queues to the shortest queue logic.
From Figures 4.8 and 4.9, the randomization and the added shortest queue logic were main reasons for
the unvalidated values. There is insufficient information in order to generate reliable datasets to represent
how a patient behaves. The system has to be more deterministic and use as much of the available information
for individual patient preferences. The model should include the same patients from the dataset, and when
further choices are made beyond what is known for that specific patient, then the discrete distributions

Chapter 4. Methods 25
Figure 4.9: Percentage of error for ALC LOS of model outputs when introducing the shortest queue logicand the died in hospital and going home pathways
should be used.
4.3.3 Description of validated model
The final model has the same patients for 2009 and 2010 enter the system rather than assuming a new
randomized set of patients. Therefore, the patient’s previous choices of facilities and queue times are known.
When the patient enters the ALC system, either the number of applications required to apply to will be
less than, equal to, or more than how many facilities the patient actually previously applied to. These three
scenarios are explained below.
Number of applications is less than previously applied to The applications will be chosen from
the subset of facilities previously applied to. If the patient was previously discharged to the facility, then the
ALC LOS (sum of the three process times) is known. If the patient previously applied but was discharged
elsewhere, the ALC LOS is not known but it is known that it is more than the previous ALC LOS. This
constraint is applied when choosing process times.
Number of applications is the number previously applied to The applications will be the set of
applications previously applied to. If the patient was previously discharged to the facility, then the ALC
LOS is known. If the patient previously applied but was discharged elsewhere, the ALC LOS is not known
but it is known that it is more than the previous ALC LOS. This constraint is applied when choosing process
times. However, the shortest ALC LOS application is where s/he was admitted to, so this will be where
s/he is discharged.
Number of applications is more than previously applied to The applications will be the appli-
cations applied to and the remainder will be chosen from the facility popularity distribution for the ALC

Chapter 4. Methods 26
type. If the patient was previously discharged to the facility, then the ALC LOS is known. If the patient
previously applied to the facility but was discharged elsewhere, the ALC LOS is not known but it is known
that it is more than the previous ALC LOS. This constraint is applied when choosing process times. If the
patient did not previously apply to the facility, there is no known association between the facility and the
patient. The process times are determined from the general distribution for that ALC facility in the ALC
facility type.
Determining died in hospital queue time If a patient died during the ALC process, the patient’s
queue time for dying in hospital would be known. If s/he did not, then it is known that their dying in
hospital queue time would be more than their previous ALC LOS.
Determining going home queue time If a patient previously went home during the ALC process,
the patient’s going home queue time would be known. If s/he did not, then it is known that their going
home queue time would be more than their previous ALC LOS.
If there are no available process time that exceed the minimum constraints, it is assumed the process
times would be a maximum set value. The maximum set value is a value more than the maximum ALC
LOS previously experienced for that ALC facility type.
The bed capacities of facilities are represented by the size of the facility’s bed offer times. The bed offer
times are for TGH General Surgery and GIM patients. Therefore, if the bed offer time is low, then there is a
high turnover rate that allows TGH General Surgery and GIM patients to enter at a faster rate. If the bed
offer time is large, then there is a low turnover rate that makes it less favourable for TGH General Surgery
and GIM patients to enter that facility.
Short waiting list facilities were also incorporated. This was done by subtracting the surpassed time of all
patients in a facility queue from the expected original queue times of all patients in that facility’s waiting list.
The wait times are updated every 60 days, as this is how often CCAC updates their queues. These times are
used to determine whether the facility’s waiting list is considered to be long or short. The definition of a short
waiting list is currently undefined. The ideal short waiting list definition will be determined by modelling
the two previous UHN discharge policies for LTC and varying the short waiting list definition between ten
and 25 days to determine the definition that minimizes ALC days and number of died in hospital patients.
4.3.4 Determining number of model replications required
A certain number of replications of the model have to run to ensure the model outputs have reached steady
state. To determine when steady state had been reached, the model was run in trials sets of ten replications.
For each facility’s average ALC LOS and total number of admitted patients, Student’s t-tests were performed
to compare the averages of trial outputs of n×10 and (n-1)×10 replications to the average of the trial outputs
of (n-1)×10, (n-2)×10, and (n-3)×10 replications. If the p-value was less than 0.05, it would indicate that
there was no significant difference between the model outputs of the two sets of trials, with 95 percent
confidence. Therefore, the model outputs had reached steady state. If the p-value was more than 0.05, n
was increased until steady state was reached.
4.3.5 Scenarios modelled
The two key performance indicators (KPIs) analyzed are the number of ALC days and the number of died
in hospital patients over a one-year period.
Discharge policy scenarios were experimented by changing the fixed number of facilities patients can
apply to, the minimum number of facilities patients can apply to, and the number of facilities with short
waiting lists that can be applied to with varying the total number of applications. This was done for each

Chapter 4. Methods 27
Type of discharge policy Number of applications in policyTotal number of applications 0A
1A2A3A4A5A
Minimum number of applications 0A1A2A3A4A5A
Number of facilities with a short waiting list 3A 0SWL3A 1SWL3A 2SWL3A 3SWL4A 0SWL4A 1SWL4A 2SWL4A 3SWL4A 4SWL5A 0SWL5A 1SWL5A 2SWL5A 3SWL5A 4SWL5A 5SWL
Table 4.12: All scenarios modelled (A = number of facilities, SWL = number of facilities with a short waitinglist)
ALC facility type: CCC, convalescent care, LTC, palliative, and rehabilitation. The list of scenarios modelled
is in Table 4.12.

Chapter 5
Results
LTC has the highest number of ALC days per patient. LTC results will be provided in this section. Results
for the other four ALC facility types can be found in the Appendix. Appendix B has CCC results, Appendix
C has convalescent care results, Appendix D has palliative care results, and Appendix E has rehabilitation
results. Appendices F, G, H, and I have pairwise comparison charts that will be referred to later in this
section.
Results in tables and figures will show 95 percent confidence intervals. In tables, the lower and upper
limits of the confidence intervals are shown in brackets. Figures show the intervals with error bars.
5.1 Varying the fixed number of facilities
The total fixed number of facilities required was varied between zero and five. The effects on the ALC system
over a one-year period are reported for the two KPIs. The summary for LTC is found in Table 5.1. Results
for the other ALC facility types are in the Appendix.
5.2 Varying the minimum number of facilities
The total minimum number of facilities required was varied between zero and five. This would be requiring
patients to apply to at least zero, one, two, three, four, or five facilities. The effects on the ALC system over
a one-year period are reported for the two KPIs in Table 5.2. Results for the other ALC facility types are
in the Appendix.
Pairwise comparison charts were made to compare between the scenarios of varying the fixed number of
facilities and minimum number of facilities. The difference of the KPI between the scenario of the row to
the scenario in the column with 95 percent confidence intervals are shown. The pairwise comparison chart
for the number of ALC days in LTC can be found in Table 5.3. The results with a significant difference are
Scenario ALC days Number of died in hospital patients0A 3576.18 (3501.47, 3651.68) 23.49 (23.23, 23.74)1A 2908.92 (2763.80, 3067.72) 15.01 (14.76, 15.25)2A 2331.59 (2128.58, 2552.40) 10.90 (10.67, 11.13)3A 1985.78 (1808.53, 2173.18) 7.22 (7.06, 7.37)4A 1455.56 (1295.11, 1627.59) 4.48 (4.33, 4.63)5A 1112.18 (963.71, 1274.38) 3.18 (3.04, 3.32)
Table 5.1: LTC results for varying the total fixed number of applications
28
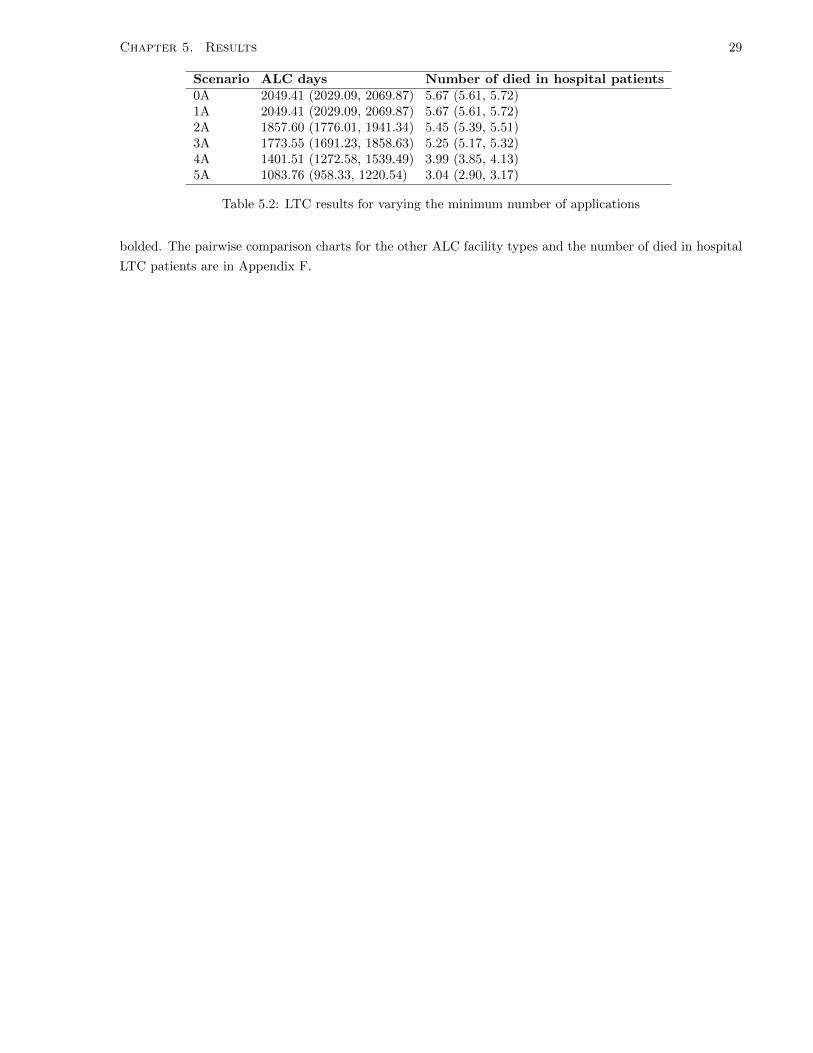
Chapter 5. Results 29
Scenario ALC days Number of died in hospital patients0A 2049.41 (2029.09, 2069.87) 5.67 (5.61, 5.72)1A 2049.41 (2029.09, 2069.87) 5.67 (5.61, 5.72)2A 1857.60 (1776.01, 1941.34) 5.45 (5.39, 5.51)3A 1773.55 (1691.23, 1858.63) 5.25 (5.17, 5.32)4A 1401.51 (1272.58, 1539.49) 3.99 (3.85, 4.13)5A 1083.76 (958.33, 1220.54) 3.04 (2.90, 3.17)
Table 5.2: LTC results for varying the minimum number of applications
bolded. The pairwise comparison charts for the other ALC facility types and the number of died in hospital
LTC patients are in Appendix F.

Chapter 5. Results 30
0A
1A
2A
3A
4A
5A
Orig
inal
Min
1A
Min
2A
Min
3A
Min
4A
Min
5A
0A
0(0,0)
536.9
(506.7
,567.1
)
1110.6
(1071.6
,1149.6
)1555.7
(1523.8
,1587.7
)2050.6
(2019.1
,2082.1
)2395
(2362.5
,2427.6
)1512.6
(1487.4
,1537.8
)1524.3
(1498.8
,1549.8
)1711.1
(1682.2
,1740)
1802
(1774.4
,1829.7
)2131.9
(2102.1
,2161.8
)2433.9
(2404.7
,2463.1
)
1A
–0
(0,0)
573.7
(526.5
,620.8
)1018.8
(978.6
,1059)
1513.7
(1473.7
,1553.6
)1858.1
(1821.7
,1894.6
)975.7
(942.7
,1008.7
)987.4
(954.1
,1020.6
)1174.2
(1138.5
,1209.9
)1265.1
(1230.5
,1299.7
)1595
(1557,
1633)
1896.9
(1861.5
,1932.4
)2A
––
0(0,0)
445.1
(399.8
,490.4
)940
(898.2
,981.8
)1284.4
(1240,
1328.9
)402
(364,440)
413.7
(375.6
,451.8
)600.5
(566.2
,634.8
)691.4
(653.4
,729.4
)1021.3
(979,
1063.7
)1323.3
(1280.8
,1365.7
)3A
––
–0
(0,0)
494.9
(461.4
,528.3
)839.3
(805.2
,873.4
)-43.1
(-73.2
,-13)-31.4
(-61.7
,-1.1
)155.4
(122.2
,188.5
)246.3
(216.5
,276.1
)576.2
(543,
609.4
)878.1
(845.6
,910.7
)4A
––
––
0(0,0)
344.4
(318.7
,370.1
)-538
(-558.2
,-517.8
)-526.3
(-546.6
,-506)
-339.5
(-364.4
,-314.6
)-248.6
(-271.4
,-225.8
)81.3
(58,104.7
)383.3
(358.5
,408.1
)5A
––
––
–0
(0,0)
-882.4
(-903.1
,-861.7
)-870.7
(-891.3
,-850.1
)-683.9
(-710.2
,-657.7
)-593
(-615.2
,-570.8
)-263.1
(-288.6
,-237.6
)38.8
(18.5
,59.2
)
Orig
inal
––
––
––
0(0,0)
11.7
(9.8
,13.6
)198.5
(182.6
,214.4
)289.4
(278.8
,300)
619.3
(602.2
,636.4
)921.2
(904.7
,937.8
)M
in1A
––
––
––
–0
(0,0)
186.8
(170.8
,202.8
)277.7
(267.1
,288.3
)607.6
(590.5
,624.7
)909.6
(892.9
,926.2
)M
in2A
––
––
––
––
0(0,0)
90.9
(76.5
,105.3
)420.8
(398.6
,443)
722.8
(699.7
,745.8
)M
in3A
––
––
––
––
–0
(0,0)
329.9
(311.9
,347.9
)631.9
(612.3
,651.4
)M
in4A
––
––
––
––
––
0(0,0)
301.9
(279.5
,324.4
)M
in5A
––
––
––
––
––
–0
(0,0)
Tab
le5.
3:P
airw
ise
com
par
ison
char
tfo
rLT
Cfo
rva
ryin
gth
efi
xed
an
dm
inim
um
nu
mb
erof
ap
pli
cati
on
son
tota
lnu
mb
erof
AL
Cd
ays

Chapter 5. Results 31
Figure 5.1: Number of LTC ALC days when varying the fixed and minimum number of facilities
Graphical results comparing varying a fixed number of applications, a minimum number of applications,
and the actual historical data are shown in Figure 5.1 and 5.2. Similar graphs for the other ALC facility
types can be found in the Appendix.
5.3 Defining a short waiting list
Before varying the minimum number of facilities required with a short waiting list, the definition of a short
waiting list must be determined. This was done by varying the definition between ten and 25 days with
UHN’s previous two discharge policies for LTC. These policies are to choose five facilities with at least three
having a short waiting list and to choose three facilities with at least two having a short waiting list. The
number of ALC days and the number of died in hospital patients were analyzed for these discharge policy
scenarios over a two-year period. The results are shown in Figure 5.3.
There are no significant changes in either of the two KPIs. However, with the policy of a total of five
applications, the number of ALC days is decreasing until a short waiting list definition of 16 days and then
begins to steady. With the policy with a total of three applications, the ALC days reaches a minimum range
between a short waiting list definition of 13 and 16 days. The number of died in hospital patients decreases
as the short waiting list definition increases.
Although there are no significant changes in the KPIs, based on the model outputs, to minimize the
number of ALC days and number of died in hospital patients, a short waiting list definition of 16 days is
chosen to model varying the number of short waiting lists facilities in new discharge policies.

Chapter 5. Results 32
Figure 5.2: Number of LTC died in hospital patients when varying the fixed and minimum number of facilities
Figure 5.3: The effects when varying the definition of a short waiting list for UHN’s previous two dischargepolicies are shown when updating wait lists every 60 days and daily. Figure 5.3 (left) shows the effects onthe number of ALC days for LTC patients, and Figure 5.3 (right) shows the effects on the number of diedin hospital patients over one-year.

Chapter 5. Results 33
Scenario ALC days Number of died in hospital patients3A 0SWL 1999.88 (1821.87, 2187.97) 7.46 (7.28, 7.64)3A 1SWL 2004.38 (1827.91, 2190.97) 7.47 (7.30, 7.63)3A 2SWL 2000.29 (1823.68, 2187.59) 7.76 (7.58, 7.94)3A 3SWL 1932.41 (1736.67, 2140.46) 7.77 (7.58, 7.95)4A 0SWL 1475.13 (1314.70, 1647.03) 4.65 (4.50, 4.80)4A 1SWL 1491.71 (1331.09, 1663.58) 4.65 (4.49, 4.80)4A 2SWL 1470.99 (1308.18, 1645.64) 4.64 (4.48, 4.80)4A 3SWL 1446.72 (1272.68, 1634.30) 4.76 (4.59, 4.93)4A 4SWL 1344.74 (1156.01, 1550.14) 4.84 (4.64, 5.04)5A 0SWL 1138.76 (987.59, 1303.91) 3.35 (3.20, 3.49)5A 1SWL 1138.76 (987.59, 1303.91) 3.35 (3.20, 3.49)5A 2SWL 1127.27 (975.30, 1293.52) 3.33 (3.19, 3.47)5A 3SWL 1093.41 (944.66, 1256.31) 3.31 (3.16, 3.455A 4SWL 1055.81 (908.98, 1216.24) 3.28 (3.13, 3.42)5A 5SWL 952.07 (805.73, 1113.13) 3.01 (2.86, 3.15)
Table 5.4: LTC results for varying the number of applications for facilities with short waiting lists (SWL)
5.4 Varying the minimum number of facilities with a short waiting
list
The minimum required number of facilities with a short waiting list is varied with a total of three, four, and
five applications. The number of facilities with short waiting lists is varied between zero and the maximum
number of applications in each situation.
A summary of the the effects of changing short waiting lists required for LTC is shown in Table 5.4 and
graphically in Figures 5.4 and 5.5. The summaries for the other ALC facility types can be found in the
Appendix. It should be noted that the waiting lists are currently not tracked by other ALC facility types,
but the situations are modelled to see what happens if they were tracked and used in discharge policies.
Pairwise comparison charts were created to demonstrate the differences when varying the number of short
waiting list facilities on the two KPIs and can be found in Appendix G.
5.5 Increasing the frequency of waiting list updates
CCAC updates waiting lists every 60 days, and this was reflected in the model. The effects of increasing the
frequency of updating the waiting lists to a daily basis is found on the two KPIs. Daily updates were chosen
as an extreme example to find the largest impact of changing the frequency of updating waiting lists. The
results are shown in Table 5.5 for LTC. Pairwise comparison charts comparing updating waiting lists daily
and every 60 days for each ALC facility type can be found in Appendix H.
5.6 Varying the facility popularity distribution
The facility popularity distribution was varied to determine if the KPI results previously found from the
model were dependent on facilities’ previous popularities. Facilities are now chosen based on the inverse of
the previous popularity distribution or chosen randomly.
The original popularity distribution is a histogram of the frequency of applications to each facility within
the ALC facility type. To create the inverse distribution, the inverse of the frequency to each ALC facility
is taken. The distribution of the inverse frequencies is then normalized. Lastly, each of the normalized

Chapter 5. Results 34
Figure 5.4: Number of ALC days for LTC when varying the required number of short waiting list (SWL)facilities
Figure 5.5: Number of died in hospital patients for LTC when varying the required number of short waitinglist (SWL) facilities

Chapter 5. Results 35
Scenario ALC days Number of died in hospital patients3A 0SWL 1982.63 (1806.91, 2168.25) 7.44 (7.26, 7.62)3A 1SWL 1986.29 (1812.28, 2170.05) 7.44 (7.27, 7.61)3A 2SWL 1960.44 (1773.76, 2159.06) 7.76 (7.58, 7.93)3A 3SWL 1806.65 (1606.75, 2021.73) 7.51 (7.29, 7.73)4A 0SWL 1486.97 (1326.20, 1659.36) 4.73 (4.60, 4.86)4A 1SWL 1486.90 (1326.53, 1658.80) 4.73 (4.60, 4.86)4A 2SWL 1486.26 (1324.58, 1659.67) 4.71 (4.57, 4.85)4A 3SWL 1442.06 (1265.43, 1633.10) 4.65 (4.46, 4.84)4A 4SWL 1316.50 (1135.41, 1514.44) 4.61 (4.42, 4.79)5A 0SWL 1159.93 (1011.67, 1321.35) 3.39 (3.25, 3.53)5A 1SWL 1159.89 (1011.65, 1321.30) 3.39 (3.25, 3.53)5A 2SWL 1157.00 (1008.75, 1318.48) 3.39 (3.25, 3.53)5A 3SWL 1141.62 (992.29, 1304.67) 3.36 (3.20, 3.51)5A 4SWL 1092.75 (941.45, 1258.37) 3.44 (3.30, 3.57)5A 5SWL 950.86 (804.19, 1112.25) 3.01 (2.85, 3.17)
Table 5.5: LTC results for varying the number of applications for facilities with short waiting lists whenupdating the waiting lists daily
Scenario ALC days Number of died in hospital patients3A 0SWL 2180.18 (2017.51, 2350.46) 8.09 (7.92, 8.25)3A 1SWL 2196.63 (2034.55, 2366.28) 8.07 (7.91, 8.23)3A 2SWL 2211.68 (2045.45, 2385.99) 8.29 (8.12, 8.46)3A 3SWL 2250.63 (2071.66, 2438.69) 8.92 (8.73, 9.11)4A 0SWL 1929.35 (1773.12, 2092.56) 6.23 (6.09, 6.37)4A 1SWL 1944.97 (1790.71, 2105.91) 6.23 (6.09, 6.37)4A 2SWL 1951.00 (1785.61, 2124.07) 6.24 (6.10, 6.38)4A 3SWL 1971.58 (1795.01, 2157.20) 6.55 (6.40, 6.69)4A 4SWL 1943.96 (1748.29, 2150.57) 7.16 (6.96, 7.35)5A 0SWL 1745.17 (1574.14, 1925.98) 5.30 (5.16, 5.44)5A 1SWL 1745.11 (1573.82, 1926.20) 5.30 (5.16, 5.44)5A 2SWL 1742.39 (1570.43, 1924.13) 5.27 (5.13, 5.41)5A 3SWL 1734.52 (1552.81, 1927.07) 5.31 (5.17, 5.45)5A 4SWL 1714.64 (1522.86, 1918.49) 5.68 (5.50, 5.85)5A 5SWL 1639.20 (1437.41, 1855.18) 6.12 (5.93, 6.31)
Table 5.6: LTC results for varying the number of applications for facilities with short waiting lists with theinverse facility popularity distribution
frequencies are then multiplied by the total number of original applications. The random distribution has
an equal probability of applying to each facility.
The effects of changing patient facility selections to the inverse facility popularity distribution and to
random selections for LTC patients are shown in Table 5.6 and Table 5.7, respectively.
Pairwise comparison charts comparing using the actual, inverse, or random popularity distributions for
each ALC facility type can be found in Appendix J.
5.7 Varying the minimum number of facilities with a short waiting
lists with varying short waiting list definitions
To determine if varying the short waiting list definition has an effect on other discharge policies other than
UHN’s previous two, the discharge policies of a total of three, four, and five applications with varying the
number of short waiting lists facilities required was modelled with a short waiting list definition of ten and

Chapter 5. Results 36
Scenario ALC days Number of died in hospital patients3A 0SWL 2180.18 (1923.89, 2350.46) 7.76 (7.60, 7.92)3A 1SWL 2196.63 (1934.17, 2366.28) 7.78 (7.62, 7.94)3A 2SWL 2211.68 (1953.06, 2385.99) 7.90 (7.72, 8.08)3A 3SWL 2250.63 (1921.49, 2438.69) 8.45 (8.27, 8.63)4A 0SWL 1929.35 (1567.10, 2092.56) 5.43 (5.28, 5.58)4A 1SWL 1944.97 (1583.79, 2105.91) 5.45 (5.30, 5.60)4A 2SWL 1951.00 (1571.60, 2124.07) 5.45 (5.29, 5.61)4A 3SWL 1971.58 (1550.75, 2157.20) 5.84 (5.68, 6.00)4A 4SWL 1943.96 (1486.72, 2150.57) 6.27 (6.08, 6.45)5A 0SWL 1474.84 (1289.58, 1674.56) 4.42 (4.25, 4.59)5A 1SWL 1474.84 (1289.58, 1674.56) 4.42 (4.25, 4.59)5A 2SWL 1464.53 (1277.34, 1666.61) 4.41 (4.24, 4.58)5A 3SWL 1449.07 (1259.20, 1654.51) 4.39 (4.24, 4.55)5A 4SWL 1416.70 (1224.39, 1624.52) 4.63 (4.43, 4.82)5A 5SWL 1332.01 (1131.44, 1550.51) 4.39 (4.21, 4.58)
Table 5.7: LTC results for varying the number of applications for facilities with short waiting lists whenselecting facilities randomly
Scenario ALC days Number of died in hospital patients3A 0SWL 1982.63 (1806.91, 2168.25) 7.44 (7.26, 7.62)3A 1SWL 1992.04 (1816.31, 2177.73) 7.48 (7.3, 7.65)3A 2SWL 1989.19 (1804.33, 2185.26) 7.59 (7.4, 7.77)3A 3SWL 1946.49 (1755.81, 1074.80) 7.51 (7.31, 7.7)4A 0SWL 1486.97 (1326.20, 1659.36) 4.73 (4.6, 4.86)4A 1SWL 1509.39 (1348.98, 1680.92) 4.73 (4.6, 4.86)4A 2SWL 1484.26 (1323.99, 1656.11) 4.7 (4.57, 4.83)4A 3SWL 1483.84 (1309.03, 1672.25) 4.74 (4.57, 4.9)4A 4SWL 1400.11 (1222.16, 1593.16) 4.6 (4.41, 4.79)5A 0SWL 1159.93 (1011.67, 1321.35) 3.39 (3.25, 3.53)5A 1SWL 1159.24 (1011.08, 1320.57) 3.39 (3.25, 3.53)5A 2SWL 1139.30 (990.25, 1301.90) 3.38 (3.24, 3.51)5A 3SWL 1113.63 (964.93, 1275.94) 3.32 (3.17, 3.47)5A 4SWL 1070.09 (917.51, 1237.12) 3.36 (3.20, 3.51)5A 5SWL 982.27 (831.68, 1148.82) 2.82 (2.66, 2.98)
Table 5.8: LTC results for varying the number of applications for facilities with a short waiting list definitionof ten days
25 days.
The results are shown for a short waiting list definition of ten days and 25 days in Table 5.8 and 5.9,
respectively.
Pairwise comparison charts comparing certain scenarios for the three short waiting list definitions for
each ALC facility type can be found in Appendix I.

Chapter 5. Results 37
Scenario ALC days Number of died in hospital patients3A 0SWL 1982.63 (1806.91, 2168.25) 7.44 (7.26, 7.62)3A 1SWL 1992.25 (1816.60, 2177.85) 7.48 (7.30, 7.65)3A 2SWL 1995.30 (1811.64, 2190.03) 7.58 (7.40, 7.76)3A 3SWL 1911.26 (1715.26, 2119.77) 7.48 (7.27, 7.69)4A 0SWL 1486.97 (1326.20, 1659.36) 4.73 (4.60, 4.86)4A 1SWL 1509.50 (1349.11, 1680.99) 4.73 (4.60, 4.86)4A 2SWL 1486.50 (1325.10, 1659.63) 4.72 (4.59, 4.86)4A 3SWL 1461.62 (1286.42, 1650.93) 4.63 (4.44, 4.81)4A 4SWL 1351.39 (1169.96, 1548.48) 4.57 (4.40, 4.73)5A 0SWL 1159.93 (1326.20, 1321.35) 3.39 (3.25, 3.53)5A 1SWL 1159.44 (1011.26, 1320.79) 3.39 (3.25, 3.53)5A 2SWL 1141.23 (992.77, 1303.17) 3.38 (3.24, 3.52)5A 3SWL 1121.08 (972.63, 1283.17) 3.34 (3.20, 3.48)5A 4SWL 1078.67 (928.17, 1243.71) 3.22 (3.08, 3.35)5A 5SWL 988.67 (837.51, 1155.05) 2.89 (2.72, 3.06)
Table 5.9: LTC results for varying the number of applications for facilities with a short waiting list definitionof 25 days

Chapter 6
Discussion
6.1 Trends for varying the number of applications and short wait-
ing list facilities
The significant trends from the outputs of the models will be discussed in the section. Short waiting lists
are currently not part of the UHN discharge policy for any ALC facility type, except for LTC. However, the
possibility of them being included were modelled, and the results are discussed.
6.1.1 CCC
There is a significant decrease in ALC days when applying to one extra application when either applying
to a minimum or fixed number of facilities with the exception of applying to a minimum of one application
instead of zero. This is because there were no previous CCC patients who did not apply to at least one
facility.
Applying to a minimum number of applications instead of a fixed number for zero, one, two, and three
applications significantly decreases the number of ALC days. Previously, 96.7 percent of patients applied to
three or fewer facilities (Figure A.3). Therefore, patients would mostly be applying to the same number of
applications with both policies for four or more applications.
By changing the policy to one extra fixed or minimum application, the number of died in hospital patients
significantly decreases. However, there is no significant difference with this KPI between requiring patients
to apply to a certain fixed number or minimum number of applications.
When varying the number of short waiting list facilities, with three facilities, there is a significant decrease
in ALC days when applying to all short waiting list facilities opposed to any fewer. With four and five
applications, there were never more than three short waiting list facilities at a time, so it was not possible
to model selecting four or five facilities with short waiting lists.
When applying to a total of five applications, there is a 255 percent decrease in ALC days from the actual
system, and by having the short waiting list policy, ALC days can decrease up to 261 percent. By applying
to four facilities, there is a 208 decrease in ALC days, and introducing a short waiting list policy does not add
any extra benefit. For three facilities, the same figures decrease by 109 percent and 117 percent. Introducing
a short waiting list policy does not have large impact on CCC ALC days.
Currently, CCC patients apply to 1.7 applications on average. If they are required to apply to five, the
number of died in hospital patients can decrease fourfold. There is no effect on number of died in hospital
patients when varying the number of short waiting list facilities.
38

Chapter 6. Discussion 39
6.1.2 Convalescent care
There is a significant decrease in ALC days when applying to one extra application with both a minimum
number and fixed number of applications, except when applying to a minimum of one facility instead of zero
facilities. This is because all convalescent care patients previously applied to at least one facility (Figure
A.6). There is also a significant decrease in ALC days when applying to a minimum number of facilities
versus a fixed number.
With the number of died in hospital patients, the same trend does not follow. The only change of policies
that decreases the number of died in hospital patients by at least one with 95 percent confidence is when
applying to at least one facility instead of applying to none.
The previous average number of applications was 2.64 for convalescent care. By applying to four facilities,
ALC days decrease by about 119 percent, and introducing short waiting lists does not further reduce ALC
days. By applying to five facilities, ALC days decrease by 153 percent, and with short waiting list policies,
ALC days can decrease by an extra 30 percent.
6.1.3 LTC
The effects of applying to a new facility significantly decreases the number of ALC days and the number of
died in hospital patients in one-year, whether the discharge policy is for a fixed number of applications or a
minimum number of applications. There is a significant decrease in ALC days and number of died in hospital
patients when applying to a minimum number of applications versus a fixed number of applications for one,
two, three, and four applications. The magnitude of the change decreases as the number of applications
increases in the discharge policy. When applying to a minimum of five applications versus exactly five
applications, there is a significant decrease in the number of ALC days, but not the number of died in
hospital patients.
In Figure 6.1, the number of short waiting list facilities a patient would apply to without having a shorting
waiting list policy is shown. Patients already independently apply to almost all short waiting list facilities.
However, the average number of facilities with long waiting lists actually applied to increases as the total
number of applications increases. Therefore, there is less of an impact with maximizing the number of short
waiting lists facilities when applying to three facilities versus five facilities.
The previous average number of applications was 2.74 for LTC. By applying to three facilities, ALC days
do not decrease by a notable amount. However, with three facilities all having short waiting lists, ALC days
can decrease by 212 percent. With four applications, ALC days can decrease by 139 percent, and with all
short waiting lists, ALC days decrease by an extra 13 percent. With five applications, ALC days decrease
by 180 percent, and short waiting lists increases this percentage to 215.
In Figure 6.2, the frequency of applications to facilities with various waiting list lengths is shown when
the waiting lists are updated every 60 days or daily. Approximately 65 percent of the popularity distribution
is for facilities with an average waiting list less than 16 days. There will be less of an impact of encouraging
patients to apply to a short waiting list facility until there is a stricter definition of a short waiting list.
Figure 6.2 also shows that by updating waiting lists daily instead of every 60 days, there is a lower frequency
of larger waiting lists (above 45 days).
For LTC, it would be beneficial to encourage patients to apply to as many facilities as possible. There
is a significant decrease in ALC days when applying to short waiting list facilities when applying to at least
four facilities, with the largest changes seen with having all facilities with short waiting lists.

Chapter 6. Discussion 40
Figure 6.1: Number of facilities with short waiting lists that are applied to without having a requirementfor a certain number of short waiting list facilities in the discharge policy for LTC
Figure 6.2: Frequency of applications to facilities of varying average waiting list sizes in LTC
Chapter 6. Discussion 41
6.1.4 Palliative
When changing the discharge policy to require one extra application, it decreases both KPIs when requiring
a minimum or fixed number of facilities. There is a significant decrease in the number of ALC days when
applying to a minimum number of facilities versus a fixed number. This trend is only true for the number of
died in hospital patients with zero, one, two, or three applications. Previously, 85.7 percent of palliative care
patients applied to three or fewer facilities (Figure A.12). Therefore, when requiring patients to apply to
more than three facilities, there is a small or no impact between having a fixed number or minimum number
of total facilities in the policy.
The previous average number of applications to palliative care facilities was 2.68. By applying to three
facilities, ALC days decrease to 119 percent, and if all have short waiting lists, ALC days decrease by
another 44 percent. Applying to four facilities decreases ALC days by 194 percent and another 53 percent
with all short waiting lists. ALC days decrease to 277 percent with five facilities and no short waiting list
requirements and to 334 percent with five short waiting list facilities.
With the number of died in hospital patients, by having four applications, the number of patients decreases
by 175 percent from the actual system and to 230 percent with all short waiting lists. Five facilities allows
the figure to decrease by 272 percent and another 78 percent with all short waiting lists.
6.1.5 Rehabilitation
When requiring one extra application in the discharge policy, it decreases both KPIs when applying to a
minimum and fixed number of facilities. There is a significant decrease in both KPIs when applying to a
minimum number of facilities versus a fixed number.
Previously, rehabilitation patients were applying to an average of 2.42 facilities. By applying to three
facilities, ALC days decrease by 146 percent and another 52 percent with all short waiting list facilities. With
four applications, ALC days decrease by approximately 200 percent from the actual ALC days and another
50 percent with all short waiting list facilities. With five facilities, ALC days decrease by 267 percent and
enforcing short waiting lists increases this figure by another 67 percent.
Large changes can be seen with the number of died in hospital patients. By applying to four applications,
there is a 307 decrease in died in hospital patients and this increases to 423 percent by having all short
waiting lists. With five applications, number of died in hospital patients decreases to 680 percent of the
actual figure. By having all five facilities with short waiting list facilities, the number of died in hospital
decreases by another 215 percent.
The larger magnitude of changes for rehabilitation is thought to be because there are many possible
facilities that patients can apply to but the popularity of facilities is not well distributed. By encouraging
patients to apply to other facilities with shorter waiting lists, patients will more quickly be able to leave the
acute care system. However, there is a limitation in the model that does not distinguish rehabilitation types
from each other, so the number of facilities that would appear to be available for the patient are inflated.
This is elaborated later in the discussion.
6.2 Overall trends
Overall trends are shown for varying the minimum and fixed total number of applications and the required
number of short waiting list facilities in Figures 6.3, 6.4, and 6.5. The first column for each ALC facility
type represents the actual number of ALC days.
For CCC, convalescent care, and palliative care, a reduced number of ALC days is seen with the new
discharge policies, but the largest decrease in ALC days is seen in LTC and rehabilitation. By requiring

Chapter 6. Discussion 42
Figure 6.3: Number of ALC days for all ALC facility types with varying the total fixed number of applications
Figure 6.4: Number of ALC days for all ALC facility types with varying the total minimum number ofapplications

Chapter 6. Discussion 43
Figure 6.5: Number of ALC days for all ALC facility types with varying the total number of applications(A) and number of required short waiting list (SWL) facilities
patients to apply to five applications, LTC ALC days reduce by about 900 and rehabilitation ALC days by
1200 a year. However, CCC, convalescent, and palliative care ALC days reduced by approximately 300, 80,
and 400 respectively.
When varying the number of short waiting list facilities, the same trends exist. LTC and rehabilitation
can reduce ALC days by approximately 1100 and 1300 days a year, respectively. CCC, convalescent, and
palliative can be reduced up to about 300, 80, and 500 days, respectively with the chosen experimented
discharge policies.
From these numbers just presented, it can be seen that the incorporation of short waiting lists does not
largely affect the number of ALC days. When there are many different available facilities, there is more of
an impact of short waiting lists. This is seen with LTC, palliative care, and rehabilitation.
6.3 Increasing the frequency of waiting list updates
The changes in ALC days for LTC when updating waiting lists daily instead of every 60 days with 95 percent
confidence intervals are outlined in Table 6.1.
For LTC, there is a significant decrease in ALC days when updating waiting lists daily and applying to
a total of three applications or to a total of four applications with three short waiting list facilities. When
there are more than three short waiting list facilities, there is no longer a significant decrease in ALC days
when updating waiting lists daily. When having a smaller total number of facilities, it is more critical where
the patient’s applications are being sent. If a patient is applying to a short waiting list when wait lists are
updated every 60 days, s/he may be applying to a facility that used to but no longer has a short waiting
list. The trend in Table 6.1 is inconsistent with the discharge policies 4A 4SWL, 5A 4SWL, and 5A 5SWL.
However, these results are either insignificant or have a small magnitude of significant change.

Chapter 6. Discussion 44
Scenario Difference in number of ALC days3A 2SWL -485.1 (-520.7, -449.5)3A 3SWL -474.8 (-517.1, -432.5)4A 3SWL -105.7 (-138.0, -73.8)4A 4SWL -19.1 (-51.2, 12.9)5A 4SWL 38.7 (15.6, 61.7)5A 5SWL -23.2 (-48.1, 1.8)
Table 6.1: Number of LTC ALC days when updating short waiting lists daily minus number of ALC dayswhen updating short waiting lists every 60 days
For CCC and convalescent care, there are several scenarios where an insufficient number of short waiting
list facilities are available when updating the lists daily. For CCC, there is reduction of ALC days when
updating lists daily only when applying to three applications with all of them having short waiting lists.
There is an average reduction of approximately 30 days annually. For convalescent care, ALC days can
significantly decrease up to 30 days annually. There are no significant reductions in number of died in
hospital patients with these two types of care.
For palliative care, there is actually an increase in ALC days when updating lists daily. However, the
maximum significant increase is 10 days a year. The changes in update frequency do not have a large change
in the number of died in hospital patients.
With rehabilitation care facilities, it is not possible to apply to all five short waiting list facilities when
updating the lists daily. However, with the other scenarios, reduction in ALC days can go up to 20 days
a year. There is not a consistent significant reduction in the number of died in hospital patients, and the
magnitudes of the reductions are not high.
Overall, increasing the waiting list update frequency does not have a large impact on the system for
CCC, rehabilitation, convalescent and palliative care. For LTC, the impact of updating waiting lists more
frequently when a small number of short waiting list facilities is required is large. However, it is unknown if
CCAC can manage this increased frequency.
6.4 Varying the facility popularity distributions
Varying facility popularity distributions were attempted in order to determine if the model results were
affected by how patients were previously selecting facilities.
For LTC, the two KPIs were analyzed for a total of three, four, and five applications with either zero short
waiting list facilities or all short waiting list facilities with three facility popularity distribution types: the
original facility popularity distribution, the inverse popularity distribution, and randomly choosing facilities.
The change of KPIs for LTC are summarized with 95 percent confidence intervals in Table 6.2.
There is a significant increase in the number of ALC days and the number of died in hospital patients
when using either the inverse facility popularity distribution or selecting the facilities randomly with a larger
increase using the inverse distribution.
When using the inverse facility popularity distribution, there is a significant decrease in ALC days when
applying to one extra application. When applying to a total of four applications, there is a significant
decrease in ALC facilities when applying to all short waiting list facilities. When applying to a total of five
applications, there is a significant decrease in ALC days when changing the discharge policy to apply to one
extra short waiting list facility after applying to at least one short waiting list facility.
When selecting facilities randomly, for every extra application, there is a significant decrease in ALC
days. When changing the policy from having a total of three or four applications and requiring zero facilities

Chapter 6. Discussion 45
Scenario Difference in number of ALC days Difference in number of died inhospital patients
3A 3SWL I 315.8 (274.5, 357.0) 1.2 (0.9, 1.4)4A 0SWL I 431.4 (401.5, 461.3) 1.6 (1.4, 1.8)4A 4SWL I 566.3 (533.7, 598.9) 2.3 (2.0, 2.6)5A 0SWL I 598.8 (567.4, 630.2) 2.0 (1.8, 2.2)5A 5SWL I 690.0 (653.2, 726.9) 3.1 (2.9, 3.4)3A 3SWL R 175.8 (132.1, 219.5) 0.7 (0.4, 0.9)4A 0SWL R 262.4 (231.5, 293.3) 0.8 (0.6, 1.0)4A 4SWL R 329.5 (291.9, 367.1) 1.4 (1.2, 1.7)5A 0SWL R 344.7 (310.4, 379.0) 1.0 (0.9, 1.3)5A 5SWL R 381.3 (350.5, 412.1) 1.4 (1.2, 1.6)
Table 6.2: Difference of KPIs annually when either using the inverse facility popularity distribution or arandom distribution instead of the original facility popularity distribution while varying the discharge policyfor the total number of applications with all or none having short waiting lists (I = inverse, R = random)
with a short waiting list to any positive number of short waiting list facilities, there is a significant decrease
in the number of ALC days. With a discharge policy of a total of five applications and two short waiting list
facilities, there is a significant decrease in ALC days when applying to any more short waiting list facilities.
However, none of the average decreases in ALC days have a magnitude of more than 100 days a year.
For LTC, independent of how patients select facilities, one extra application and maximizing the number
of short waiting list facilities will decrease ALC days. However, the way that patients currently select facilities
produces the least amount of ALC days.
For CCC and rehabilitation, there is an increase in ALC days and died in hospital patients when using
the inverse or a random facility popularity distribution. For CCC, using the inverse distribution increases
ALC days up to 120 days annually and 100 days for the random distribution. The number of died in hospital
patients never significantly increases by at least one patient. For rehabilitation, ALC days when using the
inverse and random distribution can increase up to 615 and 440 days, respectively. The average increase in
number of died in hospital patients can go up to eight patients (inverse) and five patients (random) annually.
For convalescent and palliative care, using the inverse and random facility popularity distribution reduces
the number of ALC days and number of died in hospital patients. For convalescent care, the number of ALC
days can be reduced up to 40 days annually, and there is not a large reduction in number of died in hospital
patients. The average reduction in ALC days for palliative care can go up to 130 days with the inverse
distribution and 60 days for the random distribution. The average reduction in the number of died in
hospital patients can be up to four patients (inverse) and two patients (random) annually.
The impact of varying the facility popularity distribution is largest for LTC and rehabilitation. The
method of choosing LTC is already affected by short waiting list policies, so if patients choose facilities by
the inverse facility popularity distribution, they may just be choosing the long waiting list facilities. For
rehabilitation, patients may already be applying to the shorter waiting time facilities as well.
For CCC and convalescent care, there is generally a reduction in ALC days when applying to one extra
application but not when applying to more short waiting list facilities. For palliative and rehabilitation care,
there is a reduction in ALC days when applying to an extra application and an extra short waiting list
facility.

Chapter 6. Discussion 46
6.5 Varying the definition of a short waiting list and the number
of short waiting list facilities
The definition of a short waiting list was varied between 10, 16, and 25 days with the scenarios: 3A 3SWL,
4A 4SWL, and 5A 5SWL.
For CCC, having more than three short waiting list facilities was not possible.
For convalescent care, having a smaller definition of a short waiting list reduces ALC days (maximum of
16 days annually) and does not have a large change on the number of died in hospital patients.
For LTC, the average change of ALC days ranges from decreasing by 31.5 (95% 4.2, 58.8) days (changing
to a 10 day definition with scenario 4A 4SWL) to increasing by 34.2 (95% 10.65, 57.75) days (changing
to a 25 day definition with scenario 5A 5SWL). The number of died in hospital patients can reduce up to
two patients annually (changing to 10 day definition with 5A 5SWL) by using a smaller short waiting list
definition.
By using a 25 day short waiting list definition in palliative care, ALC days can increase up to 11 days
and has no effect on the number of died in hospital patients. Lowering the definition to 10 days will not
affect ALC days and has inconsistent effects on the number of died in hospital patients.
For rehabilitation, there is a significant increase in ALC days of ten days when using a 25 day short
waiting list definition only when applying to three applications. There are no large changes in the number
of died in hospital patients.
Between all ALC facility types, generally, changing the definition to ten days will improve the two KPIs
or keep them the same. However, the magnitude of the change is smaller than requiring more facilities to
be applied to, having facilities with short waiting list, and varying the popularity of facilities.
6.6 Data recording improvements
There are several assumptions that were required when compiling data between the three sources of data
because of mismatched or missing information summarized in the Methods section. The most probable
scenario was assumed when not enough information was available. This makes the data not as reliable, and
the unreliability may be reflected in the model results.
To remove the assumptions from the data, the following changes in the SWDB are recommended.
• Adding patient preferences It can then be modelled properly which of all applied facilities a
patient would have picked if s/he could only pick one. Also, if a patient had to pick a new facility,
the distribution would include preferences on top of general popularity of facilities, more accurately
reflecting patients’ choices.
• Adding facility rejection rates It would be beneficial to know how often a facility rejects a patient.
In the model, rejections are represented by very long waits that would never be reached.
• Adding patient rejection rates The model does not have any patient rejection rates incorporated.
Therefore, there may be a facility that patients are encouraged to apply to, but once they receive the
offer, they decide to reject the facility.
To improve future data quality, it is encouraged that the SWDB be kept up-to-date, as this is the most
reliable source for ALC information between the three sources. It is recommended that social workers be
provided access to the EPR for ALC designation dates and discharge dates, as they are the most involved in
the ALC discharge process among the inter-professional care team. Signifiant reduced discharge rates have
been found on days that social workers commonly take off (Galati et al., 2011; Wong et al., 2010).

Chapter 6. Discussion 47
Type of ALC facility SubtypesCCC Low Tolerance Long Duration (LTLD)
Non Low Tolerance Low DurationHome Home with CCAC Services
Home with Community ServicesHome without Services
Palliative Palliative hospital placementResidential hospice care
Rehabilitation CardiacGeriatricLow Tolerance Long Duration (LTLD)Musculoskeletal (MSK)Neurological
Table 6.3: Types of care within main ALC facility types (Cancer Care Ontario, 2010)
There is also a high amount of variability with randomizing the dataset demonstrated in the validation
process. This may be contributed to the small dataset. Because of the late start of the RM&R and the
incorporation of ALC data in the EPR, it was chosen to restrict data collection from entries after its intro-
duction. The RM&R and EPR did not provide much additional information, so it would be recommended
for similar studies to look at a dataset of a larger duration from just the SWDB.
6.7 Limitations of model outputs
It is assumed that a patient can go to any facility in his/her facility type (CCC, convalescent, LTC, palliative,
and rehabilitation). Additional patterns of patient flow may have been found by separating the facilities into
the categories described in Table 6.3. However, there were not enough entries or patient information to go
into this level of detail. Additionally, patients may be limited in the number of facilities they can apply to
based on their specific health needs. However, this data was not available for all patients. The frequency of
available characteristics is described in Table 4.3. If this data was available, the number of ALC days would
most likely increase, as the applications would not be as evenly distributed among all the ALC facilities.
This model assumed that patients will take their first bed offers. If this does not occur, the number of
ALC days would be underestimated in the system.
It was found that some patients would transfer internally within TGH but still remain an ALC patient.
Therefore, they would travel from GIM to department X. These further details could only be found when
discussing case to case with the Discharge Planning Office. Because this was unrealistic, it had to be assumed
that these scenarios were insignificant when calculating the KPIs.
In the developed model, the died in hospital queue time is assumed to be a time from the died in hospital
distribution. The distribution only includes values from patients who did die in TGH from General Surgery
or GIM between 2009 and 2010, and the probability distribution has no information about the patients who
ended up going to an ALC facility or going home. Therefore, the patients may have a lower life expectancy
than in reality. The Kaplan-Meier survival curve is a method that may have overcome this. The survival
curves have a survival rate that decreases with increasing time (Goel et al., 2010). The steepness of the
curve in the ALC system could be an indicator of the health state of the patient type (Utley et al., 2000).
The Kaplan-Meier survival curve is able to censor patients as they go to an ALC facility or home. Therefore,
when a patient exits the ALC system, s/he decreases the survival rate if s/he dies, or s/he will decrease the
denominator of patients the curve is analyzing from if s/he goes to an ALC facility or home (Goel et al.,
2010). The incorporation of the Kaplin-Meier survival curve would no longer give the patients a died in

Chapter 6. Discussion 48
hospital queue time. Instead, everyday, for each patient, the model would determine if the patient will die
or stay in his/her current queue based on the survival rate of that day s/he is in the ALC system.
Varying discharge rates between days of the week have not been taken into account. Significant variation
between weekends, holidays, and regular weekdays exist (Wong et al., 2009). Therefore, if a patient was
discharged before on a Monday, and their ALC LOS decreases by two in the simulation, s/he may not be able
to be admitted to a certain LTC facility on that day. Similarly, if a patient was previously discharged on a
weekend, and the simulation allows them to be discharged on a weekday, the possible reduced discharge time
is not incorporated in the results. It is assumed that balancing these two scenarios will allow the varying
discharge rates to be insignificant in the model outputs.
However, these assumptions exist in all simulated discharge policy scenarios. Therefore, the policies can
still be compared against each other.
6.7.1 Applying findings in the real system
According to the Ontario legislation, patients are only obligated to pick one facility and can decline any
facilities that they do not want. The UHN discharge policy and the simulated policies promote patients to
apply to more facilities in order to improve the efficiency of the system. However, it is the patient’s right
to pick the facility that s/he prefers. This underestimates the model output’s ALC days. However, this
limitation exists in all scenarios, so the scenarios may still be comparable against each other.
All of the discharge policies experimented are best case scenarios if the discharge policies are followed
by every TGH General Surgery and GIM patient. In practice, the policies will not always be followed. The
patient may only want to apply to facilities close to his/her home, there may not be enough appropriate
facilities for the patient, and sometimes in practice, policies are just not followed. Therefore, in reality, for
each of the experimented policies, the number of ALC days will be higher than what is found in the model.
The results better represent changes of practice rather than changes of policy.
CCAC indicates that if a patient has a first, second, and third choice, and s/he gets admitted and
discharged to a facility other than his/her first, s/he may go to this facility and keep his/her application
for his/her preference open. The Discharge Planning Office is unsure if this is actually followed by CCAC,
as CCAC’s attention may be emphasized on acute care discharges. This study’s results would be of higher
significance if this option is available since patients can still eventually get into their first choice even if
initially, they are discharged to another facility.
As for the economic impact, OHIP pays $225 for each day for each patient in a semi- private or ward bed.
From this model, in LTC, if all patients apply to four beds instead of three, it will save the MOHLTC an
average of $111,240 a year. If all patients apply to five instead of three, it will save the MOHLTC an average
of $188,843 per year. This is only for TGH General Surgery and GIM. Thomas et al. (2005) found that for
University of Alabama’s Birmingham Trauma Center, the annual cost of delayed patients is $715,403 with
an average delay of six days.
The model does not take into account of any future fluctuations in ALC patient designation rates or
facility popularities. This is based on an ALC patient population leaving a teaching acute care facility.
Some of the patient behaviour may not be similar to other hospitals.
6.8 Other methods to improve ALC process
This study explores ways to change the ALC system without changing the ALC system infrastructure
(number of beds, health care human resources etc.) but only changing acute care discharge policies. This is
not the only solution that is needed to completely reduce the number of ALC days to zero.

Chapter 6. Discussion 49
Another method to improve the ALC system is to remove institutional layers. As suggested by the
Discharge Planning Office, some of the delays in the application process are because it takes time for a LTC
facility to receive an application because CCAC reviews it first. For St. Hilda’s facility, in 2009 it was not
regulated by CCAC, but in 2010, when it did enter its legislation, the number of ALC days for patients going
to St. Hilda’s increased.
However, CCAC feels that by introducing them in the process even before the ALC designation, they
will be able to accelerate the application process.
The Waiting at Home program was created to encourage patients to travel home if they are willing and
able to with services. This reduces the load on the acute care side as well as the ALC facilities. Additionally,
patients have the opportunity to receive care in their own home. Some of the patients who are in the Waiting
at Home program are waiting for a bed offer, and others remain at home if they find that the services are
adequate for their needs.
6.9 Recommendations for policy changes
It is recommended that social workers try to maximize the number of applications their patients are applying
to. There are also reductions in the number of ALC days found when maximizing the number of short waiting
list facilities. However, social workers should prioritize increasing the number of total facilities as this has
a larger reduction in the number of ALC days and number of died in hospital patients than altering the
number of short waiting list facilities.
These quantitative effects are for TGH General Surgery and GIM. However, it is believed that the
trends can be extrapolated to other facilities. The behaviours of patients are assumed to be generalizable
for other CCC, convalescent, LTC, palliative, or rehabilitation patients, not just TGH General Surgery or
GIM patients. The results for the specific number of ALC days or died in hospital patients will not be
generalizable, but the comparison between discharge policies can be. Therefore, it is still recommended to
maximize the number of facilities patients are applying to and also to increase the number of short waiting
list facilities.

Chapter 7
Significance and Conclusions
Through modification of discharge policies in a simulation study, the effects of systemic changes can be
measured by total ALC days and number of died in hospital patients. Exploring and analyzing model
variations showed that it is important to maximize the number of applications that patients apply to,
regardless of what type of care s/he is applying to in order to reduce the number of ALC days and number of
died in hospital patients for the system. It is also beneficial to examine if the facilities patients are applying
to have long or short waiting lists.
This conclusion is based on the available ALC data. This data was not consistently reliable and limited
in how it depicted patients’ behaviour. There is a need to improve the quality and reliability of ALC data.
Every LHIN has reducing ALC days on their 2010-2013 IHSP list of priorities. In addition, the Toronto
Central LHIN and many other LHINs intend to reduce ALC days by improving discharge planning. Deter-
mining if changing discharge policies actually decreases ALC days is valuable for TGH’s General Surgery
department, in addition to other departments and other institutions.
50

Bibliography
Angelis, Vanda De, Giovanni Felici, Paolo Impelluso. 2003. Integrating simulation and optimisation in health
care centre management. European Journal of Operational Research 150 101–114.
Banks, Jerry, John S. Carson II, Barry L. Nelson. 1996. Discrete-Event System Simulation. 2nd ed. Prentice-
Hall Inc.
Brailsford, Sally, Bernd Schmidt. 2003. Towards incorporating human behaviour in models of health care
systems: An approach using discrete event simulation. European Journal of Operational Research 150
19–31.
Brosseau, Lucie, Louise Potvin, Pierre Philippe, Yves-Louis Boulanger. 1996. Post-stroke inpatient rehabili-
tation: Ii. predicting discharge disposition. American Journal of Physical Medicine and Rehabilitation 75
431–436.
Burton, Mary Kardos, Dr. Robert Cushman, Darlene Barnes, Enza Ferro, Cathy Danbrook, Doug Gowans,
Susan Thorning, David Kelly, Nancy Mongeon, Astrida Plorins, Krista Robinson-Holt, Wendy Kirkpatrick,
Wendy Robb, Donna Rubin, Marian Walsh, Barb MacKinnon, Mohamed Badsha, Tim Burns. 2006.
Appropriate level of care: a patient flow, system integration and capacity solution. Tech. rep.
Canadian Institute for Health Information. 2009. Alternate level of care in canada. Tech. rep.
Cancer Care Ontario. 2009. Alternate level of care. Tech. rep. URL http://www.cancercare.on.ca/cms/
One.aspx?portalId=1377&pageId=43214.
Cancer Care Ontario. 2010. Wait time information system alternate level of care data defintions. Powerpoint.
Carey, Mark R., Heena Sheth, R. Scott Braithwaite. 2005. A prospective study of reasons for prolonged
hospitalizations on a general medicine teaching service. Journal of General Internal Medicine 20 108–115.
Central East LHIN. 2009. Integrated health service plan: 2010-2013. Tech. rep.
Central LHIN. 2010-2013. Integrated health service plan: 2010-2013. Tech. rep.
Centre for Healthcare Quality Improvement. 2009. The flo collaborative: Quality transitions for better care
final report. Tech. rep.
Chang, Chun-Lang, Bor-Wen Cheng, Juin-Lin Su. 2004. Using case-based reasoning to establish a continuing
care information system of discharge planning. Expert Systems with Applications 26 601–613.
Costa, Andrew P., John P. Hirdes. 2010. Clinical characteristics and service needs of alternate-level-of-care
patients waiting for long-term care in ontario hospitals. Healthcare Policy 6 32–46.
Davies, Huw, Ruth Davies. 1987. A simulation model for planning services for renal patients in europe. The
Journal of Operational Research Society 38 693–799.
51

BIBLIOGRAPHY 52
Duguay, Christine, Fatah Chetouane. 2007. Modeling and improving emergency department systems using
discrete event simulation. Simulation 83 311–320.
Forrest, George, Ariel Schwam, Eve Cohen. 2002. Time of care required by patients discharged from a
rehabilitation unit. American journal of physical medicine rehabilitation 81 57–62.
Galati, Monika, Hannah J. Wong, Dante Morra, Robert C. Wu. 2011. An evidence-based case for the an
evidence-based case for the value of social workers in efficient hospital discharge. The Health Care Manager
30 242–246.
Giachetti, Ronald E. 2008. A simulation study of interventions to reduce appointment lead-time and patient
no-show rate. S. J. Mason, R.R. Hill, L. Monch, O. Rose, T. Jefferson, J.W. Fowler, eds., Winter Simulation
Conference. 1463–1438.
Goel, Manish, Pardeep Khanna, Jugal Kishore. 2010. Understanding survival analysis: Kaplan-meier esti-
mate. International Journal of Ayurveda Research 274.
Gonsalves, T., K. Itoh. 2009. Service optimization with patient satisfaction in healthcare systems. Journal
of Simulation 3 150–162.
Hamilton Niagara Haldimand Brant LHIN ALC Steering Committee. 2008. The right level of care: A
strategy for standardization and measurement. Tech. rep.
Harper, P.R., H.M. Gamlin. 2003. Reduced outpatient waiting times with improved appointment scheduling:
a simulation modelling approach. OR Spectrum 25 207–222.
Kumar, Sameer. 2011. Modeling hospital surgical delivery process design using system simulation: Optimiz-
ing patient flow and bed capacity as an illustration. Technology and Health Care 19 1–20.
LaGanga, Linda R., Stephen R. Lawrence. 2007. Clinic overbooking to improve patient access and increase
provider productivity. Decision Sciences Institute 38 251–276.
Lane, D.C., E. Husemann. 2008. System dynamics mapping of acute patient flows. Journal of Operational
Research Society 59 213–224.
Lane, D.C., C. Monefeldt, J.V.Rosenhead. 2000. Looking in the wrong place for healthcare improvements:
A system dynamics study of an accident and emergency department. Journal of the Operational Research
Society 51 518–531.
Ministry of Health and Long-Term Care. 2009-2010. Results-based plan briefing book 2009-2010. Tech. rep.
Ministry of Health and Long-Term Care. 2010-2011. Results-based plan briefing book 2010-11. Tech. rep.
North East LHIN. 2009. Integrated health service plan: 2010-2013. Tech. rep.
North Simcoe Muskoka LHIN. 2009. Integrated health service plan: 2010-2013. Tech. rep.
Ontario Hospital Association. 2011. Alternative level of care (alc). Tech. rep.
Ostry, Aleck S., Katrina M. Tomlin, Yuri Cvitkovich, Pamela A. Ratner, Il Hyeok Park, Robert B. Tate,
Annalee Yassi. 2001. Choosing a model of care for alternate level care patients: Caregivers’ perspectives
with respect to staff injury. Canadian Journal of Nursing Research .

BIBLIOGRAPHY 53
Patrick, J., M.L. Puterman. 2007. Improving resource utilization for diagnostic services through flexible
inpatient scheduling: A method for improving resource utilization. Journal of the Operational Research
Society 58 235–245.
Perez, Karol, Laura Cardona, Sebastian Gomez, Tomas Olarte, Paula Escudero. 2008. Simulation and
optimization in a health center in medellin, columbia. S. J. Mason, R. R. Hill, L. Monch, O. Rose,
T. Jefferson, J. W. Fowle, eds., Winter Simulation Conference. 1362–1367.
Ratcliffe, Julie, Tracey Young, Martin Buxton, Tillal Eldabi, Ray Paul, Andrew Burroughs, George Pap-
atheodoridis, Keith Rolles. 2001. A simulation modelling approach to evaluating alternative policies for
the management of the waiting list for liver transplantation. Health Care Management Science 4 117–124.
Rivlin, Alice M. 1990. Simulating policy alternatives for long-term care: an example of the orcutt approach.
Journal of Economic Behavior and Organization 14 53–64.
Rohleder, Thomas R., Kenneth J. Klassen. 2000. Using client-variance information to improve dynamic
appointment scheduling performance. Omega 28 293–302.
Sanders, D., S. Mukhi, M. Laskowski, M. Khan, B.W. Podaima, R.D. McLeod. 2008. A network-enabled
platform for reducing hospital emergency department waiting times using an rfid proximity location system.
19th International Conference on Systems Engineering .
Shim, Sung J., Arun Kumar. 2010. Simulation for emergency care process reengineering in hospitals. Business
Process Management Journal 16 795–805.
South East LHIN. 2009. Integrated health service plan: 2010-2013. Tech. rep.
Szecket, Nicolas, Hannah J. Wong, Robert C. Wu, Hershi D. Berman, Dante Morra. 2012. Implementation
of a continuous admission model reduces the length of stay of patients on an internal medicine clinical
teaching unit. Journal of Hospital Medicine 7 55–59.
Thomas, Shakira N., Gerald McGwin, Loring W. Rue. 2005. The financial impact of delayed discharge at a
level i the financial impact of delayed discharge at level 1 trauma center. The Journal of Trauma, Injury,
Infection, and Critical Care 58 121–125.
Toronto Central LHIN. 2009. The toronto central local health integration network’s 2010-2013 integrated
health service plan. Tech. rep.
Tuft, Stephen, Stephen Gallivan. 2001. Computer modelling of a cataract waiting list. British Journal of
Ophthalmology 85 582–585.
UHN ALC Discharge Planning Committee. 2010. University health network policy and procedure manual
clinical-discharge planning. Tech. rep.
Unsworth, C.A. 2001. Selection for rehabilitation: Acute care discharge patterns for stroke and orthopaedic
patients. International Journal of Rehabilitation Research 24 103–114.
Utley, M., S. Gallivan, A. Young, N. Cox, P. Davies, J. Dixey, P. Emery, A. Gough, D. James, P. Prouse,
P. Williams, J. Winfield. 2000. Potential bias in kaplan-meier survival analysis applied to rheumatology
drug studies. Rheumatology 39 1–6.
VanBerkel, Peter T., John T. Blake. 2007. A comprehensive simulation for wait time reduction and capacity
planning applied in general surgery. Health Care Management Science 10 373–385.
BIBLIOGRAPHY 54
Vasilakis, C., B.G. Sobolev, L. Kuramoto, A.R. Levy. 2007. A simulation study of scheduling clinic appoint-
ments in surgical care: Individual surgeon versus pooled lists. Journal of the Operational Research Society
58 202–211.
Wijewickrama, A.K.A. 2006. Simulation analysis for reducing queues in mixed-patients’ outpatient depart-
ment. International Journal of Simulation Modelling 5 56–68.
Winston, Wayne L. 2004. Operations research: applications and algorithms. 4th ed. Brooks/Cole/CENGAGE
Learning.
Wong, Hannah, Robert C. Wu, George Tomlinson, Michael Caesar, Howard Abrams, Michael W. Carter,
Dante Morra. 2009. How much do operational processes affect hospital inpatient discharge rates? Journal
of Public Health 31 546–553.
Wong, Hannah J., Robert C. Wu, Michael Caesar, Howard Abrams, Dante Morra. 2010. Smoothing inpatient
discharges decreases emergency department congestion: a system dynamics simulation model. Emergency
Medicine Journal 27 593–598.
Xie, Haifeng, Thierry J. Chaussalet, Peter H. Millard. 2006. A model-based approach to the analysis of
patterns of length of stay in institutional long-term care. IEEE Transactions on Information Technology
in Biomedicine 10 512–518.
Zenios, Stefanos A., Glenn M. Chertow, Lawrence M. Wein. 2000. Dynamic allocation of kidneys to candi-
dates on the transplant waiting list. Operations Research 48 549–569.
Zhou, Yue, Jiahua Li, Fukuya Ishino. 2008. Re-building a new algorithm of the out-patient appointment
system to reduce long waiting-time-a case study. International Conference on Service Systems and Service
Management . 1–5.
Zhu, Zhecheng. 2011. Impact of different discharge patterns on bed occupancy rate and bed waiting time: a
simulation approach. Journal of Medical Engineering and Technology 35 338–343.

Appendix A
Popularity distributions and patient
facility discharge histograms
A.1 CCC data
Figure A.1: Histogram of applications and admissions to CCC facilities
55

Appendix A. Popularity distributions and patient facility discharge histograms 56
Figure A.2: Histogram of CCC application preparation, application review, and bed offer queue times
Figure A.3: Histogram of the total number of CCC facilities applied to by a patient
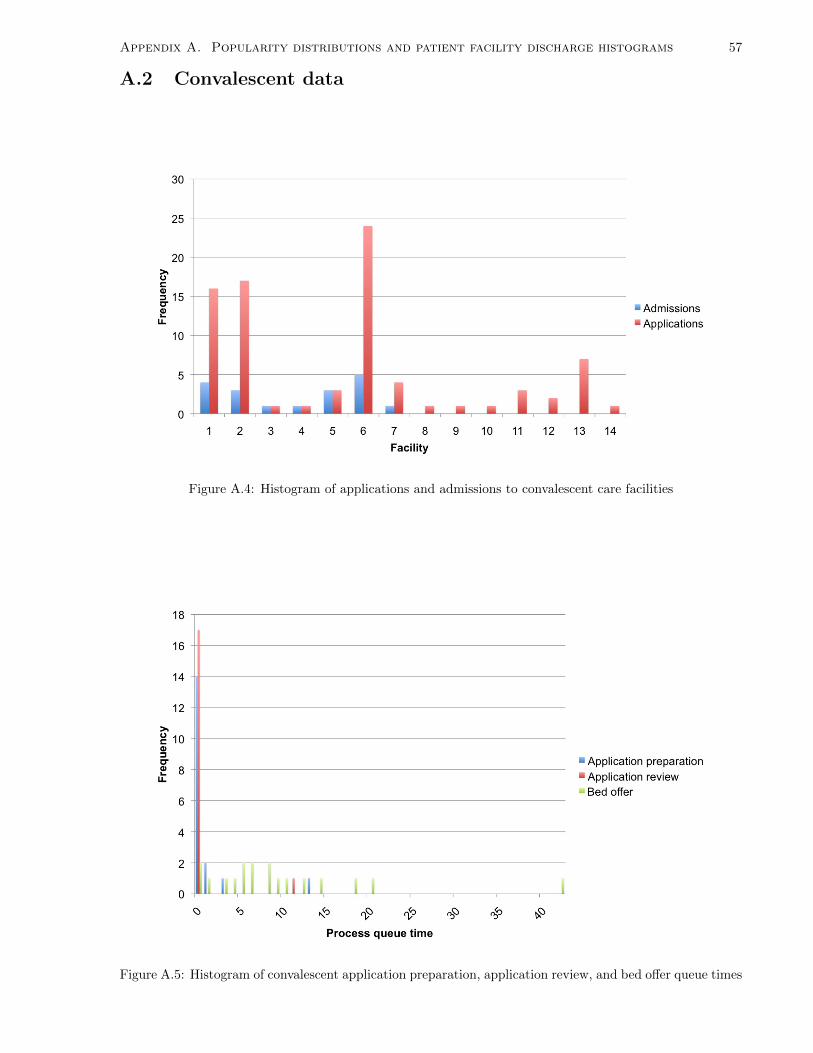
Appendix A. Popularity distributions and patient facility discharge histograms 57
A.2 Convalescent data
Figure A.4: Histogram of applications and admissions to convalescent care facilities
Figure A.5: Histogram of convalescent application preparation, application review, and bed offer queue times

Appendix A. Popularity distributions and patient facility discharge histograms 58
Figure A.6: Histogram of the total number of convalescent care facilities applied to by a patient
A.3 LTC data
Figure A.7: Histogram of applications and admissions to LTC facilities

Appendix A. Popularity distributions and patient facility discharge histograms 59
Figure A.8: Histogram of LTC application preparation, application review, and bed offer queue times
Figure A.9: Histogram of the total number of LTC facilities applied to by a patient

Appendix A. Popularity distributions and patient facility discharge histograms 60
A.4 Palliative data
Figure A.10: Histogram of applications and admissions to palliative care facilities
Figure A.11: Histogram of palliative application preparation, application review, and bed offer queue times

Appendix A. Popularity distributions and patient facility discharge histograms 61
Figure A.12: Histogram of the total number of palliative care facilities applied to by a patient
A.5 Rehabilitation data
Figure A.13: Histogram of applications and admissions to rehabilitation facilities
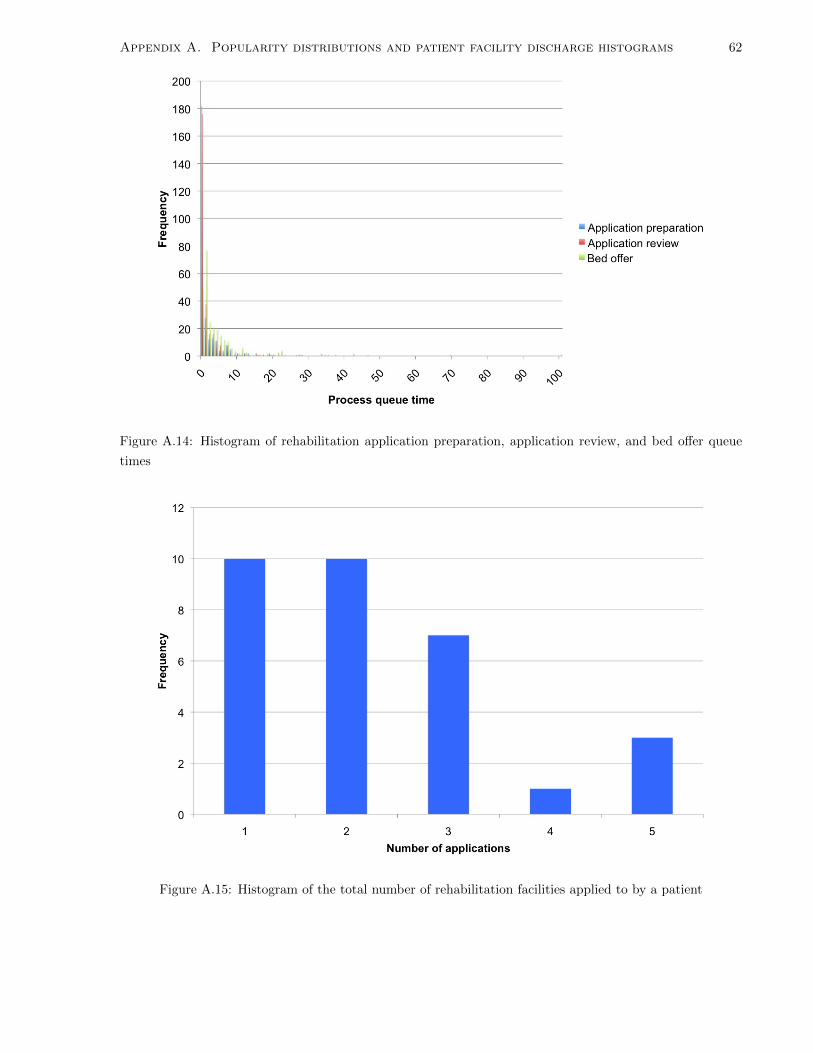
Appendix A. Popularity distributions and patient facility discharge histograms 62
Figure A.14: Histogram of rehabilitation application preparation, application review, and bed offer queue
times
Figure A.15: Histogram of the total number of rehabilitation facilities applied to by a patient

Appendix B
CCC Results
Scenario ALC days Number of died in hospital patients
0 A 601.18 (568.86, 634.38) 9.29 (9.06, 9.52)
1 A 487.74 (401.49, 580.97) 2.36 (2.28, 2.43)
2 A 463.82 (372.89, 563.02) 1.72 (1.66, 1.77)
3 A 436.34 (376.52, 500.18) 1.24 (1.19, 1.29)
4 A 230.04 (189.45, 274.61) 0.72 (0.66, 0.77)
5 A 187.29 (163.24, 213.95) 0.46 (0.41, 0.51)
Table B.1: CCC results for varying fixed number of applications
Scenario ALC days Number of died in hospital patients
0 A 477.50 (477.50, 477.50) 2.00 (2.00, 2.00)
1 A 477.50 (477.50, 477.50) 2.00 (2.00, 2.00)
2 A 478.31 (450.95, 506.64) 1.64 (1.59, 1.68)
3 A 431.09 (389.63, 474.88) 1.18 (1.12, 1.23)
4 A 236.42 (201.99, 273.95) 0.73 (0.67, 0.79)
5 A 187.29 (163.24, 213.95) 0.46 (0.41, 0.51)
Table B.2: CCC results for varying the minimum number of applications
63

Appendix B. CCC Results 64
Figure B.1: Number of ALC days for CCC when varying the fixed and minimum number of facilities
Figure B.2: Number of died in hospital patients for CCC when varying the fixed and minimum number of
facilities

Appendix B. CCC Results 65
Scenario ALC days Number of died in hospital patients
3A 0SWL 436.34 (376.52, 500.18) 1.24 (1.19, 1.29)
3A 1SWL 437.39 (376.65, 502.27) 1.24 (1.19, 1.29)
3A 2SWL 431.64 (372.19, 495.12) 1.24 (1.19, 1.29)
3A 3SWL 406.83 (341.06, 478.41) 1.25 (1.16, 1.34)
4A 0SWL 230.04 (189.45, 274.61) 0.72 (0.66, 0.77)
4A 1SWL 230.14 (189.41, 274.89) 0.72 (0.66, 0.77)
4A 2SWL 236.10 (193.81, 282.46) 0.76 (0.70, 0.82)
4A 3SWL 236.55 (194.94, 282.24) 0.82 (0.75, 0.89)
4A 4SWL Not enough SWL facilities Not enough SWL facilities
5A 0SWL 187.29 (163.24, 213.95) 0.46 (0.41, 0.51)
5A 1SWL 187.46 (163.34, 214.19) 0.46 (0.41, 0.51)
5A 2SWL 184.74 (160.98, 211.06) 0.45 (0.40, 0.50)
5A 3SWL 182.65 (157.52, 210.50) 0.42 (0.37, 0.47)
5A 4SWL Not enough SWL facilities Not enough SWL facilities
5A 5SWL Not enough SWL facilities Not enough SWL facilities
Table B.3: CCC results for varying the number of applications for facilities with short waiting lists
Figure B.3: Number of ALC days for CCC when varying the required number of SWL facilities

Appendix B. CCC Results 66
Figure B.4: Number of died in hospital patients for CCC when varying the required number of SWL facilities

Appendix C
Convalescent results
Scenario ALC days Number of died in hospital patients
0 A 288.08 (279.99, 296.26) 4.07 (3.96, 4.18)
1 A 217.32 (194.17, 242.44) 2.36 (2.28, 2.43)
2 A 202.21 (180.51, 225.32) 0.82 (0.75, 0.88)
3 A 184.14 (168.50, 200.50) 0.57 (0.54, 0.60)
4 A 148.34 (128.98, 169.25) 0.50 (0.50, 0.50)
5 A 95.43 (78.66, 114.25) 0.43 (0.40, 0.46)
Table C.1: Convalescent care results for varying fixed number of applications
Scenario ALC days Number of died in hospital patients
0 A 175.50 (175.50, 175.50) 0.50 (0.50, 0.50)
1 A 175.50 (175.50, 175.50) 0.50 (0.50, 0.50)
2 A 174.42 (169.33, 179.60) 0.50 (0.50, 0.50)
3 A 171.65 (163.74, 179.79) 0.50 (0.50, 0.50)
4 A 138.09 (124.37, 152.51) 0.50 (0.50, 0.50)
5 A 111.74 (96.37, 128.33) 0.39 (0.35, 0.43)
Table C.2: Convalescent care results for varying the minimum number of applications
67

Appendix C. Convalescent results 68
Figure C.1: Number of ALC days for convalescent care when varying the fixed and minimum number of
facilities
Figure C.2: Number of died in hospital patients for convalescent care when varying the fixed and minimum
number of facilities

Appendix C. Convalescent results 69
Scenario ALC days Number of died in hospital patients
3A 0SWL 184.03 (168.34, 200.46) 0.58 (0.54, 0.61)
3A 1SWL 183.71 (168.34, 199.81) 0.57 (0.54, 0.60)
3A 2SWL 181.13 (165.78, 197.19) 0.57 (0.54, 0.60)
3A 3SWL 185.45 (169.70, 201.82) 0.59 (0.55, 0.63)
4A 0SWL 147.34 (128.66, 167.40) 0.51 (0.50, 0.51)
4A 1SWL 148.18 (128.90, 168.99) 0.50 (0.50, 0.50)
4A 2SWL 145.87 (126.99, 166.20) 0.50 (0.50, 0.50)
4A 3SWL 143.77 (125.00, 164.02) 0.50 (0.50, 0.50)
4A 4SWL 147.64 (129.07, 167.54) 0.51 (0.50, 0.51)
5A 0SWL 114.56 (96.40, 134.65) 0.38 (0.34, 0.42)
5A 1SWL 113.70 (95.75, 133.56) 0.38 (0.34, 0.42)
5A 2SWL 111.69 (94.14, 131.12) 0.39 (0.35, 0.43)
5A 3SWL 110.71 (93.66, 129.49) 0.39 (0.35, 0.43)
5A 4SWL 110.07 (91.20, 131.04) 0.43 (0.40, 0.46)
5A 5SWL 95.43 (78.66, 114.25) 0.43 (0.40, 0.46)
Table C.3: Convalescent care results for varying the number of applications for facilities with short waiting
lists
Figure C.3: Number of ALC days for convalescent care when varying the required number of SWL facilities

Appendix C. Convalescent results 70
Figure C.4: Number of died in hospital patients for convalescent care when varying the required number of
SWL facilities

Appendix D
Palliative results
Scenario ALC days Number of died in hospital patients
0 A 1206.42 (1176.76, 1236.43) 43.52 (43.10, 43.93)
1 A 852.13 (775.10, 934.91) 25.47 (25.06, 25.88)
2 A 678.27 (625.16, 734.55) 18.47 (18.22, 18.71)
3 A 555.27 (519.48, 592.99) 14.21 (14.05, 14.36)
4 A 245.88 (216.61, 277.43) 9.11 (8.91, 9.31)
5 A 245.88 (216.61, 277.43) 9.11 (8.91, 9.31)
Table D.1: Palliative results for varying fixed number of applications
Scenario ALC days Number of died in hospital patients
0 A 658.50 (658.50, 658.50) 16.00 (16.00, 16.00)
1 A 656.98 (651.50, 662.49) 16.00 (16.00, 16.00)
2 A 610.35 (592.52, 628.67) 15.21 (15.13, 15.29)
3 A 541.12 (517.31, 565.84) 13.88 (13.75, 14.00)
4 A 332.44 (303.54, 362.88) 9.05 (8.84, 9.26)
5 A 240.33 (218.36, 263.51) 5.93 (5.73, 6.12)
Table D.2: Palliative results for varying the minimum number of applications
71

Appendix D. Palliative results 72
Figure D.1: Number of ALC days for palliative care when varying the fixed and minimum number of facilities
Figure D.2: Number of died in hospital patients for palliative care when varying the fixed and minimum
number of facilities

Appendix D. Palliative results 73
Scenario ALC days Number of died in hospital patients
3A 0SWL 555.27 (519.48, 592.99) 14.21 (14.05, 14.36)
3A 1SWL 542.41 (503.03, 584.13) 13.96 (13.78, 14.13)
3A 2SWL 483.91 (439.39, 531.07) 13.23 (13.01, 13.45)
3A 3SWL 405.07 (362.98, 449.99) 11.82 (11.58, 12.06)
4A 0SWL 340.00 (306.39, 375.61) 9.11 (8.91, 9.31)
4A 1SWL 351.36 (315.40, 389.59) 9.16 (8.95, 9.36)
4A 2SWL 346.37 (308.50, 386.67) 9.17 (8.96, 9.38)
4A 3SWL 309.01 (272.19, 348.30) 8.61 (8.37, 8.84)
4A 4SWL 266.67 (233.91, 302.01) 6.97 (6.71, 7.23)
5A 0SWL 245.88 (216.61, 277.43) 5.87 (5.66, 6.08)
5A 1SWL 247.21 (218.46, 278.11) 5.98 (5.78, 6.17)
5A 2SWL 250.25 (221.40, 281.12) 6.16 (5.94, 6.37)
5A 3SWL 244.56 (214.06, 277.40) 5.65 (5.43, 5.87)
5A 4SWL 227.54 (197.09, 260.45) 5.50 (5.29, 5.71)
5A 5SWL 196.92 (173.10, 222.70) 4.57 (4.38, 4.75)
Table D.3: Palliative results for varying the number of applications for facilities with short waiting lists
Figure D.3: Number of ALC days for palliative care when varying the required number of SWL facilities

Appendix D. Palliative results 74
Figure D.4: Number of died in hospital patients for palliative care when varying the required number of
SWL facilities

Appendix E
Rehabilitation results
Scenario ALC days Number of died in hospital patients
0 A 3190.94 (3134.34, 3248.06) 59.04 (58.26, 59.81)
1 A 2193.82 (2102.43, 2288.46) 24.28 (23.83, 24.72)
2 A 1572.51 (1487.59, 1661.21) 11.20 (10.85, 11.54)
3 A 1226.63 (1162.15, 1294.01) 6.63 (6.45, 6.81)
4 A 874.86 (821.20, 930.68) 3.75 (3.61, 3.88)
5 A 613.91 (579.22, 650.03) 1.69 (1.56, 1.82)
Table E.1: Rehabilitation results for varying fixed number of applications
Scenario ALC days Number of died in hospital patients
0 A 1800.50 (1800.50, 1800.50) 11.50 (11.50, 11.50)
1 A 1800.09 (1796.90, 1803.29) 11.50 (11.50, 11.50)
2 A 1416.62 (1379.51, 1454.55) 6.43 (6.30, 6.56)
3 A 1182.01 (1145.56, 1219.32) 4.98 (4.89, 5.06)
4 A 860.81 (824.94, 897.68) 3.24 (3.15, 3.32)
5 A 609.60 (578.33, 642.00) 1.47 (1.36, 1.57)
Table E.2: Rehabilitation results for varying the minimum number of applications
75

Appendix E. Rehabilitation results 76
Figure E.1: Number of ALC days for rehabilitation care when varying the fixed and minimum number of
facilities
Figure E.2: Number of died in hospital patients for rehabilitation care when varying the fixed and minimum
number of facilities

Appendix E. Rehabilitation results 77
Scenario ALC days Number of died in hospital patients3A 0SWL 1240.07 (1173.92, 1309.22) 6.37 (6.17, 6.57)3A 1SWL 1203.57 (1129.81, 1280.66) 6.45 (6.24, 6.65)3A 2SWL 1069.76 (987.46, 1156.07) 5.62 (5.42, 5.82)3A 3SWL 949.13 (863.13, 1039.81) 5.75 (5.52, 5.98)4A 0SWL 901.50 (847.64, 957.37) 3.75 (3.62, 3.88)4A 1SWL 896.29 (839.01, 955.73) 3.46 (3.32, 3.60)4A 2SWL 846.58 (784.93, 910.64) 3.40 (3.24, 3.56)4A 3SWL 763.21 (697.09, 832.43) 3.05 (2.85, 3.24)4A 4SWL 684.28 (619.08, 753.05) 2.78 (2.59, 2.96)5A 0SWL 650.34 (615.30, 686.46) 1.59 (1.48, 1.70)5A 1SWL 645.94 (610.50, 682.58) 1.65 (1.52, 1.77)5A 2SWL 614.12 (574.38, 655.49) 1.36 (1.24, 1.48)5A 3SWL 563.60 (521.07, 608.11) 1.38 (1.25, 1.51)5A 4SWL 519.31 (478.41, 562.21) 1.08 (0.94, 1.21)5A 5SWL 478.07 (439.10, 518.87) 1.18 (1.03, 1.32)
Table E.3: Rehabilitation results for varying the number of applications for facilities with short waiting lists
Figure E.3: Number of ALC days for rehabilitation care when varying the required number of SWL facilities

Appendix E. Rehabilitation results 78
Figure E.4: Number of died in hospital patients for rehabilitation care when varying the required number of
SWL facilities

Appendix F
Pairwise comparison charts - varying
the total number of applications
79

Appendix F. Pairwise comparison charts - varying the total number of applications 80
0A
1A
2A
3A
4A
5A
Orig
inal
Min
1A
Min
2A
Min
3A
Min
4A
Min
5A
0A
0(0,0)
48.1
(40.4
,55.8
)
97.9
(91.2
,104.6
)164.8
(159.6
,170.1
)346.2
(334.9
,357.5
)398.3
(390.2
,406.4
)113.4
(110.5
,116.3
)113.4
(110.5
,116.3
)123.6
(120.5
,126.7
)172.5
(167.7
,177.4
)347
(335.8
,358.2
)398.3
(390.2
,406.4
)
1A
–0
(0,0)
49.8
(42.2
,57.4
)116.7
(107.8
,125.7
)298.1
(283.6
,312.7
)350.2
(339.7
,360.7
)65.3
(58,72.7
)65.3
(58,72.7
)75.5
(68,83)
124.4
(115.7
,133.1
)298.9
(284.7
,313.2
)350.2
(339.7
,360.7
)2A
––
0(0,0)
66.9
(59.4
,74.5
)248.3
(235,
261.6
)300.4
(290.9
,309.9
)15.6
(9.6
,21.5
)15.6
(9.6
,21.5
)25.7
(19.7
,31.7
)74.7
(66.9
,82.4
)249.1
(236,
262.3
)300.4
(290.9
,309.9
)3A
––
–0
(0,0)
181.4
(169.3
,193.5
)233.5
(224.3
,242.7
)-51.4
(-55.9
,-46.8
)-51.4
(-55.9
,-46.8
)-41.2
(-45.8
,-36.7
)7.7
(2.2
,13.2
)182.2
(170.4
,194)
233.5
(224.3
,242.7
)4A
––
––
0(0,0)
52.1
(39.9
,64.3
)-232.8
(-244.2
,-221.4
)-232.8
(-244.2
,-221.4
)-222.6
(-234,
-211.3
)-173.7
(-185.2
,-162.1
)0.8
(-2
.3,3.9
)52.1
(39.9
,64.3
)
5A
––
––
–0
(0,0)
-284.9
(-292.7
,-277.1
)-284.9
(-292.7
,-277.1
)-274.7
(-282.6
,-266.9
)-225.8
(-234.7
,-216.9
)-51.3
(-63.6
,-39.1
)0
(0,0)
Orig
inal
––
––
––
0(0,0)
0(0,0)
10.1
(9.4
,10.9
)59.1
(54.9
,63.3
)233.6
(222.3
,244.8
)284.9
(277.1
,292.7
)M
in1A
––
––
––
–0
(0,0)
10.1
(9.4
,10.9
)59.1
(54.9
,63.3
)233.6
(222.3
,244.8
)284.9
(277.1
,292.7
)M
in2A
––
––
––
––
0(0,0)
49
(44.7
,53.2
)223.4
(212.2
,234.7
)274.7
(266.9
,282.6
)M
in3A
––
––
––
––
–0
(0,0)
174.5
(162.9
,186)
225.8
(216.9
,234.7
)M
in4A
––
––
––
––
––
0(0,0)
51.3
(39.1
,63.6
)M
in5A
––
––
––
––
––
–0
(0,0)
Tab
leF
.1:
CC
Cre
sult
sfo
rva
ryin
gth
efi
xed
an
dm
inim
um
nu
mb
erof
ap
pli
cati
on
son
the
tota
lnu
mb
erof
AL
Cd
ays
0A
1A
2A
3A
4A
5A
Orig
inal
Min
1A
Min
2A
Min
3A
Min
4A
Min
5A
0A
0(0,0)
6.9
(6.7
,7.2
)7.6
(7.4
,7.8
)8.1
(7.8
,8.3
)8.6
(8.3
,8.8
)8.8
(8.6
,9.1
)7.3
(7.1
,7.5
)7.3
(7.1
,7.5
)7.7
(7.4
,7.9
)8.1
(7.9
,8.4
)8.6
(8.3
,8.8
)8.8
(8.6
,9.1
)
1A
–0
(0,0)
0.6
(0.6
,0.7
)1.1
(1,1.2
)1.6
(1.5
,1.7
)1.9
(1.8
,2)
0.4
(0.3
,0.4
)0.4
(0.3
,0.4
)0.7
(0.6
,0.8
)1.2
(1.1
,1.3
)1.6
(1.5
,1.7
)1.9
(1.8
,2)
2A
––
0(0,0)
0.5
(0.4
,0.6
)1
(0.9
,1.1
)1.3
(1.2
,1.3
)-0.3
(-0.3
,-0.2
)-0.3
(-0.3
,-0.2
)0.1
(0,0.2
)0.5
(0.5
,0.6
)1
(0.9
,1.1
)1.3
(1.2
,1.3
)3A
––
–0
(0,0)
0.5
(0.4
,0.6
)0.8
(0.7
,0.9
)-0.8
(-0.8
,-0.7
)-0.8
(-0.8
,-0.7
)-0.4
(-0.5
,-0.3
)0.1
(0,0.1
)0.5
(0.4
,0.6
)0.8
(0.7
,0.9
)4A
––
––
0(0,0)
0.3
(0.2
,0.3
)-1.3
(-1.3
,-1.2
)-1.3
(-1.3
,-1.2
)-0.9
(-1,-0.8
)-0.5
(-0.5
,-0.4
)0
(-0
.1,0)
0.3
(0.2
,0.3
)5A
––
––
–0
(0,0)
-1.5
(-1.6
,-1.5
)1.5
(-1.6
,-1.5
)-1.2
(-1.2
,-1.1
)-0.7
(-0.8
,-0.6
)-0.3
(-0.4
,-0.2
)0
(0,0)
Orig
inal
––
––
––
0(0,0)
0(0,0)
0.4
(0.3
,0.4
)0.8
(0.8
,0.9
)1.3
(1.2
,1.3
)1.5
(1.5
,1.6
)M
in1A
––
––
––
–0
(0,0)
0.4
(0.3
,0.4
)0.8
(0.8
,0.9
)1.3
(1.2
,1.3
)1.5
(1.5
,1.6
)M
in2A
––
––
––
––
0(0,0)
0.5
(0.4
,0.5
)0.9
(0.8
,1)
1.2
(1.1
,1.2
)M
in3A
––
––
––
––
–0
(0,0)
0.4
(0.4
,0.5
)0.7
(0.6
,0.8
)M
in4A
––
––
––
––
––
0(0,0)
0.3
(0.2
,0.4
)M
in5A
––
––
––
––
––
–0
(0,0)
Tab
leF
.2:
CC
Cre
sult
sfo
rva
ryin
gth
efi
xed
an
dm
inim
um
nu
mb
erof
ap
pli
cati
on
son
tota
lnu
mb
erof
die
din
hosp
ital
pati
ents

Appendix F. Pairwise comparison charts - varying the total number of applications 81
0A
1A
2A
3A
4A
5A
Orig
inal
Min
1A
Min
2A
Min
3A
Min
4A
Min
5A
0A
0(0,0)
62.5
(57.4
,67.6
)
85.4
(80.3
,90.5
)101
(96.4
,105.6
)140.7
(135.6
,145.9
)185.3
(179.8
,190.8
)112
(107.7
,116.4
)112
(107.7
,116.4
)114.4
(110,
118.8
)118.5
(114,
122.9
)151.4
(146.6
,156.2
)177.1
(171.9
,182.3
)
1A
–0
(0,0)
22.9
(18,27.8
)38.5
(34,42.9
)78.2
(73,83.4
)122.8
(117.5
,128)
49.5
(45.2
,53.8
)49.5
(45.2
,53.8
)51.9
(47.5
,56.2
)55.9
(51.6
,60.3
)88.9
(84.4
,93.4
)114.6
(110.1
,119.1
)2A
––
0(0,0)
15.6
(12.2
,19)
55.3
(51.3
,59.4
)99.9
(95.5
,104.3
)26.6
(24,29.3
)26.6
(24,29.3
)29
(26.4
,31.6
)33.1
(30.4
,35.7
)66
(62.5
,69.6
)91.7
(88.2
,95.2
)
3A
––
–0
(0,0)
39.7
(35.5
,44)
84.3
(79.4
,89.2
)11
(8.8
,13.3
)11
(8.8
,13.3
)13.4
(11.2
,15.7
)17.5
(15.3
,19.7
)50.4
(47.3
,53.5
)76.1
(73,79.2
)4A
––
––
0(0,0)
44.6
(39.4
,49.7
)-28.7
(-32.3
,-25.1
)-28.7
(-32.3
,-25.1
)-26.3
(-29.9
,-22.7
)-22.3
(-26,-18.6
)10.7
(7.4
,14)
36.4
(32.6
,40.2
)
5A
––
––
–0
(0,0)
-73.3
(-77.3
,-69.2
)-73.3
(-77.3
,-69.2
)-70.9
(-74.9
,-66.9
)-66.8
(-70.9
,-62.8
)-33.9
(-38.4
,-29.4
)-8.2
(-12.6
,-3.8
)
Orig
inal
––
––
––
0(0,0)
0(0,0)
2.4
(2,2.8
)6.4
(5.8
,7.1
)39.4
(37,41.7
)65.1
(62.4
,67.7
)M
in1A
––
––
––
–0
(0,0)
2.4
(2,2.8
)6.4
(5.8
,7.1
)39.4
(37,41.7
)65.1
(62.4
,67.7
)M
in2A
––
––
––
––
0(0,0)
4.1
(3.3
,4.8
)37
(34.7
,39.3
)62.7
(60.1
,65.3
)M
in3A
––
––
––
––
–0
(0,0)
33
(30.5
,35.4
)58.6
(56,61.3
)M
in4A
––
––
––
––
––
0(0,0)
25.7
(22.6
,28.8
)M
in5A
––
––
––
––
––
–0
(0,0)
Tab
leF
.3:
Con
vale
scen
tre
sult
sfo
rva
ryin
gth
efi
xed
an
dm
inim
um
nu
mb
erof
ap
pli
cati
on
son
tota
lnu
mb
erof
AL
Cd
ays
0A
1A
2A
3A
4A
5A
Orig
inal
Min
1A
Min
2A
Min
3A
Min
4A
Min
5A
0A
0(0,0)
2.9
(2.8
,3)
3.3
(3.1
,3.4
)3.5
(3.4
,3.6
)3.6
(3.5
,3.7
)3.6
(3.5
,3.8
)3.6
(3.5
,3.7
)3.6
(3.5
,3.7
)3.6
(3.5
,3.7
)3.6
(3.5
,3.7
)3.6
(3.5
,3.7
)3.7
(3.6
,3.8
)
1A
–0
(0,0)
0.4
(0.3
,0.5
)0.6
(0.5
,0.7
)0.7
(0.6
,0.8
)0.8
(0.7
,0.8
)0.7
(0.6
,0.8
)0.7
(0.6
,0.8
)0.7
(0.6
,0.8
)0.7
(0.6
,0.8
)0.7
(0.6
,0.8
)0.8
(0.7
,0.9
)2A
––
0(0,0)
0.2
(0.2
,0.3
)0.3
(0.3
,0.4
)0.4
(0.3
,0.5
)0.3
(0.3
,0.4
)0.3
(0.3
,0.4
)0.3
(0.3
,0.4
)0.3
(0.3
,0.4
)0.3
(0.3
,0.4
)0.4
(0.3
,0.5
)3A
––
–0
(0,0)
0.1
(0,0.1
)0.1
(0.1
,0.2
)0.1
(0,0.1
)0.1
(0,0.1
)0.1
(0,0.1
)0.1
(0,0.1
)0.1
(0,0.1
)0.2
(0.1
,0.2
)4A
––
––
0(0,0)
0.1
(0,0.1
)0
(0,0)
0(0,0)
0(0,0)
0(0,0)
0(0,0)
0.1
(0.1
,0.2
)5A
––
––
–0
(0,0)
-0.1
(-0
.1,0)
-0.1
(-0
.1,0)
-0.1
(-0
.1,0)
-0.1
(-0
.1,0)
-0.1
(-0
.1,0)
0(0,0.1
)
Orig
inal
––
––
––
0(0,0)
0(0,0)
0(0,0)
0(0,0)
0(0,0)
0.1
(0.1
,0.2
)M
in1A
––
––
––
–0
(0,0)
0(0,0)
0(0,0)
0(0,0)
0.1
(0.1
,0.2
)M
in2A
––
––
––
––
0(0,0)
0(0,0)
0(0,0)
0.1
(0.1
,0.2
)M
in3A
––
––
––
––
–0
(0,0)
0(0,0)
0.1
(0.1
,0.2
)M
in4A
––
––
––
––
––
0(0,0)
0.1
(0.1
,0.2
)M
in5A
––
––
––
––
––
–0
(0,0)
Tab
leF
.4:
Con
vale
scen
tre
sult
sfo
rva
ryin
gth
efi
xed
an
dm
inim
um
nu
mb
erof
ap
pli
cati
on
son
tota
lnu
mb
erof
die
din
hosp
ital
pati
ents

Appendix F. Pairwise comparison charts - varying the total number of applications 82
0A
1A
2A
3A
4A
5A
Orig
inal
Min
1A
Min
2A
Min
3A
Min
4A
Min
5A
0A
0(0,0)
8.5
(8.2
,8.8
)12.6
(12.3
,12.9
)16.3
(16,16.6
)19
(18.7
,19.3
)20.3
(20,20.6
)17.5
(17.2
,17.7
)17.8
(17.6
,18.1
)18
(17.8
,18.3
)18.2
(18,18.5
)19.5
(19.2
,19.8
)20.5
(20.1
,20.8
)
1A
–0
(0,0)
4.1
(3.8
,4.4
)7.8
(7.5
,8.1
)10.5
(10.2
,10.8
)11.8
(11.5
,12.1
)9
(8.8
,9.3
)9.3
(9.1
,9.6
)9.6
(9.3
,9.8
)9.8
(9.5
,10)
11
(10.7
,11.3
)12
(11.7
,12.3
)2A
––
0(0,0)
3.7
(3.4
,4)
6.4
(6.2
,6.7
)7.7
(7.4
,8)
4.9
(4.7
,5.1
)5.2
(5,5.5
)5.5
(5.2
,5.7
)5.7
(5.4
,5.9
)6.9
(6.6
,7.2
)7.9
(7.6
,8.1
)3A
––
–0
(0,0)
2.7
(2.5
,2.9
)4
(3.8
,4.2
)1.2
(1.1
,1.4
)1.6
(1.4
,1.7
)1.8
(1.6
,1.9
)2
(1.8
,2.1
)3.2
(3,3.4
)4.2
(4,4.4
)4A
––
––
0(0,0)
1.3
(1.1
,1.5
)-1.5
(-1.7
,-1.4
)-1.2
(-1.3
,-1)
-1
(-1.1
,-0.8
)-0.8
(-0.9
,-0.6
)0.5
(0.3
,0.7
)1.4
(1.2
,1.6
)5A
––
––
–0
(0,0)
-2.8
(-3,-2.7
)-2.5
(-2.6
,-2.3
)-2.3
(-2.4
,-2.1
)-2.1
(-2.2
,-1.9
)-0.8
(-1,-0.6
)0.1
(0,0.3
)
Orig
inal
––
––
––
0(0,0)
0.3
(0.3
,0.4
)0.6
(0.5
,0.6
)0.8
(0.7
,0.8
)2
(1.9
,2.1
)3
(2.8
,3.1
)M
in1A
––
––
––
–0
(0,0)
0.2
(0.1
,0.3
)0.4
(0.3
,0.5
)1.7
(1.5
,1.8
)2.6
(2.5
,2.8
)M
in2A
––
––
––
––
0(0,0)
0.2
(0.1
,0.3
)1.5
(1.3
,1.6
)2.4
(2.3
,2.6
)M
in3A
––
––
––
––
–0
(0,0)
1.3
(1.1
,1.4
)2.2
(2.1
,2.4
)M
in4A
––
––
––
––
––
0(0,0)
1(0.8
,1.2
)M
in5A
––
––
––
––
––
–0
(0,0)
Tab
leF
.5:
LT
Cre
sult
sfo
rva
ryin
gth
efi
xed
an
dm
inim
um
nu
mb
erof
ap
pli
cati
on
son
tota
lnu
mb
erof
die
din
hosp
ital
pati
ents

Appendix F. Pairwise comparison charts - varying the total number of applications 83
0A
1A
2A
3A
4A
5A
Orig
inal
Min
1A
Min
2A
Min
3A
Min
4A
Min
5A
0A
0(0,0)
343.2
(329.9
,356.6
)
518.4
(503.3
,533.5
)649.8
(633.1
,666.4
)863.8
(846.6
,881)
959.3
(942.8
,975.8
)547.4
(531.1
,563.7
)549.4
(533.1
,565.7
)597.4
(581.2
,613.6
)668.1
(651.5
,684.7
)873.3
(855.5
,891.1
)964.1
(947.7
,980.5
)
1A
–0
(0,0)
175.2
(163.9
,186.4
)306.5
(295.1
,318)
520.6
(509,
532.2
)616.1
(605.1
,627)
204.2
(193.6
,214.8
)206.2
(195.5
,216.8
)254.2
(243.5
,264.9
)324.9
(313.8
,336)
530.1
(517.9
,542.3
)620.9
(609.8
,632)
2A
––
0(0,0)
131.4
(123.9
,138.8
)345.4
(336.9
,354)
440.9
(433.3
,448.5
)29
(22.3
,35.8
)31
(24.2
,37.8
)79
(72.1
,86)
149.7
(142.8
,156.7
)354.9
(346.1
,363.7
)445.7
(438.4
,453.1
)3A
––
–0
(0,0)
214.1
(207.5
,220.6
)309.5
(304.3
,314.8
)-102.3
(-106.2
,-98.5
)-100.4
(-104.3
,-96.5
)-52.3
(-56.8
,-47.9
)18.4
(14,22.7
)223.5
(217.1
,229.9
)314.4
(309.4
,319.3
)4A
––
––
0(0,0)
95.5
(89,102)
-316.4
(-321.5
,-311.3
)-314.5
(-319.5
,-309.4
)-266.4
(-271.6
,-261.2
)-195.7
(-201.4
,-190)
9.5
(4.6
,14.4
)100.3
(93.9
,106.8
)5A
––
––
–0
(0,0)
-411.9
(-415.3
,-408.4
)-409.9
(-413.4
,-406.5
)-361.9
(-365.8
,-357.9
)-291.2
(-295.7
,-286.6
)-86
(-91.8
,-80.2
)4.8
(2.6
,7.1
)
Orig
inal
––
––
––
0(0,0)
2(1.6
,2.3
)50
(48.3
,51.7
)120.7
(118.1
,123.3
)325.9
(321.3
,330.5
)416.7
(413.5
,420)
Min
1A
––
––
––
–0
(0,0)
48.1
(46.3
,49.8
)118.8
(116.1
,121.4
)323.9
(319.3
,328.5
)414.8
(411.5
,418)
Min
2A
––
––
––
––
0(0,0)
70.7
(67.7
,73.7
)275.9
(271,
280.7
)366.7
(362.8
,370.6
)M
in3A
––
––
––
––
–0
(0,0)
205.2
(199.8
,210.5
)296
(291.8
,300.2
)M
in4A
––
––
––
––
––
0(0,0)
90.8
(85.1
,96.6
)M
in5A
––
––
––
––
––
–0
(0,0)
Tab
leF
.6:
Pal
liat
ive
resu
lts
for
vary
ing
the
fixed
an
dm
inim
um
nu
mb
erof
ap
pli
cati
on
son
tota
lnu
mb
erof
AL
Cd
ays
0A
1A
2A
3A
4A
5A
Orig
inal
Min
1A
Min
2A
Min
3A
Min
4A
Min
5A
0A
0(0,0)
18
(17.6
,18.5
)
25.1
(24.6
,25.5
)29.3
(28.9
,29.7
)34.4
(33.9
,34.9
)37.6
(37.2
,38.1
)27.5
(27.1
,27.9
)27.5
(27.1
,27.9
)28.3
(27.9
,28.7
)29.6
(29.2
,30.1
)34.5
(34,34.9
)37.6
(37.1
,38)
1A
–0
(0,0)
7(6.6
,7.4
)11.3
(10.9
,11.7
)16.4
(15.9
,16.8
)19.6
(19.2
,20)
9.5
(9.1
,9.9
)9.5
(9.1
,9.9
)10.3
(9.8
,10.7
)11.6
(11.2
,12)
16.4
(16,16.9
)19.5
(19.1
,20)
2A
––
0(0,0)
4.3
(4,4.5
)9.4
(9.1
,9.7
)12.6
(12.3
,12.9
)2.5
(2.2
,2.7
)2.5
(2.2
,2.7
)3.3
(3,3.5
)4.6
(4.3
,4.9
)9.4
(9.1
,9.7
)12.5
(12.3
,12.8
)3A
––
–0
(0,0)
5.1
(4.8
,5.3
)8.3
(8.1
,8.6
)-1.8
(-1.9
,-1.6
)-1.8
(-1.9
,-1.6
)-1
(-1.2
,-0.8
)0.3
(0.2
,0.5
)5.2
(4.9
,5.4
)8.3
(8,8.5
)4A
––
––
0(0,0)
3.2
(2.9
,3.5
)-6.9
(-7.1
,-6.7
)-6.9
(-7.1
,-6.7
)-6.1
(-6.3
,-5.9
)-4.8
(-5,-4.5
)0.1
(-0
.2,0.3
)3.2
(2.9
,3.4
)5A
––
––
–0
(0,0)
-10.1
(-10.3
,-9.9
)-10.1
(-10.3
,-9.9
)-9.3
(-9.6
,-9.1
)-8
(-8.2
,-7.8
)-3.2
(-3.4
,-2.9
)-0
.1(-0
.3,0.1
)
Orig
inal
––
––
––
0(0,0)
0(0,0)
0.8
(0.7
,0.9
)2.1
(2,2.2
)7
(6.7
,7.2
)10.1
(9.9
,10.3
)M
in1A
––
––
––
–0
(0,0)
0.8
(0.7
,0.9
)2.1
(2,2.2
)7
(6.7
,7.2
)10.1
(9.9
,10.3
)M
in2A
––
––
––
––
0(0,0)
1.3
(1.2
,1.5
)6.2
(5.9
,6.4
)9.3
(9.1
,9.5
)M
in3A
––
––
––
––
–0
(0,0)
4.8
(4.6
,5.1
)8
(7.7
,8.2
)M
in4A
––
––
––
––
––
0(0,0)
3.1
(2.9
,3.4
)M
in5A
––
––
––
––
––
–0
(0,0)
Tab
leF
.7:
Pal
liat
ive
resu
lts
for
vary
ing
the
fixed
an
dm
inim
um
nu
mb
erof
ap
pli
cati
ons
on
tota
lnu
mb
erof
die
din
hosp
ital
pati
ents

Appendix F. Pairwise comparison charts - varying the total number of applications 84
0A
1A
2A
3A
4A
5A
Orig
inal
Min
1A
Min
2A
Min
3A
Min
4A
Min
5A
0A
0(0,0)
988.4
(974.7
,1002.1
)
1606.3
(1590.3
,1622.3
)1958
(1943.4
,1972.5
)2316.9
(2300.7
,2333.1
)2577.8
(2561.7
,2594)
1391.2
(1376.1
,1406.4
)1391.7
(1376.5
,1406.8
)1775.6
(1759.5
,1791.7
)2013.4
(1998,
2028.8
)2334.7
(2318.8
,2350.7
)2582.8
(2566.5
,2599)
1A
–0
(0,0)
617.9
(609.1
,626.7
)969.6
(960.7
,978.4
)1328.5
(1318.6
,1338.5
)1589.5
(1579.6
,1599.3
)402.8
(394.8
,410.9
)403.3
(395.2
,411.4
)787.2
(778.1
,796.3
)1025
(1015.8
,1034.3
)1346.3
(1336.9
,1355.8
)1594.4
(1584.8
,1604)
2A
––
0(0,0)
351.6
(343.1
,360.2
)710.6
(700.9
,720.3
)971.5
(961.8
,981.2
)-215.1
(-222.7
,-207.5
)-214.6
(-222.2
,-207)
169.3
(160,
178.5
)407.1
(398.5
,415.8
)728.4
(718.8
,738)
976.4
(967.8
,985.1
)3A
––
–0
(0,0)
358.9
(352.5
,365.4
)619.9
(613.2
,626.6
)-566.7
(-571.5
,-562)
-566.3
(-571.1
,-561.5
)-182.4
(-188.1
,-176.6
)55.5
(49.7
,61.3
)376.8
(370.2
,383.4
)624.8
(618.2
,631.4
)4A
––
––
0(0,0)
260.9
(253.3
,268.6
)-925.7
(-931.1
,-920.2
)-925.2
(-930.7
,-919.8
)-541.3
(-547.8
,-534.9
)-303.5
(-310.6
,-296.4
)17.8
(10.7
,25)
265.9
(258.3
,273.4
)5A
––
––
–0
(0,0)
-1186.6
(-1191.6
,-1181.7
)-1186.2
(-1191.1
,-1181.2
)-802.3
(-809.1
,-795.4
)-564.4
(-570.8
,-558)
-243.1
(-249.5
,-236.8
)4.9
(-0
.5,10.3
)
Orig
inal
––
––
––
0(0,0)
0.5
(0.3
,0.6
)384.4
(379.8
,388.9
)622.2
(617.8
,626.6
)943.5
(938.6
,948.4
)1191.5
(1186.8
,1196.3
)M
in1A
––
––
––
–0
(0,0)
383.9
(379.3
,388.5
)621.8
(617.4
,626.1
)943.1
(938.2
,947.9
)1191.1
(1186.3
,1195.8
)M
in2A
––
––
––
––
0(0,0)
237.8
(232,
243.7
)559.1
(552.5
,565.8
)807.2
(800.4
,813.9
)M
in3A
––
––
––
––
–0
(0,0)
321.3
(314.3
,328.3
)569.3
(562.8
,575.9
)M
in4A
––
––
––
––
––
0(0,0)
248
(241.9
,254.2
)M
in5A
––
––
––
––
––
–0
(0,0)
Tab
leF
.8:
Reh
abil
itat
ion
resu
lts
for
vary
ing
the
fixed
and
min
imu
mnum
ber
of
ap
pli
cati
on
son
the
nu
mb
erof
AL
Cd
ays
0A
1A
2A
3A
4A
5A
Orig
inal
Min
1A
Min
2A
Min
3A
Min
4A
Min
5A
0A
0(0,0)
34.8
(34.1
,35.5
)
47.8
(47.1
,48.6
)52.4
(51.6
,53.2
)55.3
(54.5
,56.1
)57.3
(56.6
,58.1
)47.5
(46.8
,48.3
)47.5
(46.8
,48.3
)52.6
(51.8
,53.4
)54.1
(53.3
,54.8
)55.8
(55,56.6
)57.6
(56.8
,58.4
)
1A
–0
(0,0)
13.1
(12.6
,13.5
)17.6
(17.2
,18.1
)20.5
(20.1
,21)
22.6
(22.1
,23)
12.8
(12.3
,13.2
)12.8
(12.3
,13.2
)17.8
(17.4
,18.3
)19.3
(18.9
,19.7
)21
(20.6
,21.5
)22.8
(22.4
,23.3
)2A
––
0(0,0)
4.6
(4.2
,4.9
)7.5
(7.1
,7.8
)9.5
(9.2
,9.9
)-0
.3(-0
.7,0)
-0.3
(-0
.7,0)
4.8
(4.4
,5.1
)6.2
(5.9
,6.6
)8
(7.6
,8.3
)9.7
(9.4
,10.1
)3A
––
–0
(0,0)
2.9
(2.7
,3.1
)4.9
(4.7
,5.2
)-4.9
(-5.1
,-4.7
)-4.9
(-5.1
,-4.7
)0.2
(0,0.4
)1.7
(1.5
,1.8
)3.4
(3.2
,3.6
)5.2
(5,5.4
)4A
––
––
0(0,0)
2.1
(1.9
,2.2
)-7.8
(-7.9
,-7.6
)-7.8
(-7.9
,-7.6
)-2.7
(-2.9
,-2.5
)-1.2
(-1.4
,-1.1
)0.5
(0.3
,0.7
)2.3
(2.1
,2.4
)5A
––
––
–0
(0,0)
-9.8
(-9.9
,-9.7
)-9.8
(-9.9
,-9.7
)-4.7
(-4.9
,-4.6
)-3.3
(-3.4
,-3.1
)-1.5
(-1.7
,-1.4
)0.2
(0.1
,0.3
)
Orig
inal
––
––
––
0(0,0)
0(0,0)
5.1
(4.9
,5.2
)6.5
(6.4
,6.6
)8.3
(8.2
,8.4
)10
(9.9
,10.1
)M
in1A
––
––
––
–0
(0,0)
5.1
(4.9
,5.2
)6.5
(6.4
,6.6
)8.3
(8.2
,8.4
)10
(9.9
,10.1
)M
in2A
––
––
––
––
0(0,0)
1.5
(1.3
,1.6
)3.2
(3,3.4
)5
(4.8
,5.1
)M
in3A
––
––
––
––
–0
(0,0)
1.7
(1.6
,1.9
)3.5
(3.4
,3.6
)M
in4A
––
––
––
––
––
0(0,0)
1.8
(1.6
,1.9
)M
in5A
––
––
––
––
––
–0
(0,0)
Tab
leF
.9:
Reh
abil
itat
ion
resu
lts
for
vary
ing
the
fixed
an
dm
inim
um
nu
mb
erof
ap
pli
cati
on
son
tota
lnu
mb
erof
die
din
hosp
ital
pati
ents

Appendix G
Pairwise comparison charts - varying
quantity of short waiting list facilities
85

Appendix G. Pairwise comparison charts - varying quantity of short waiting list facilities86
3A
-0SW
L3A
-1SW
L3A
-2SW
L3A
-3SW
L4A
-0SW
L4A
-1SW
L4A
-2SW
L4A
-3SW
L4A
-4SW
L5A
-0SW
L5A
-1SW
L5A
-2SW
L5A
-3SW
L5A
-4SW
L5A
-5SW
L
3A
-0SW
L0
(0,0)
0.7
(-2
.8,
4.3
)2
(-3
.7,7.7
)19.8
(10.2
,29.5
)183.8
(171.9
,195.7
)183.7
(171.7
,195.6
)228.8
(218.6
,239.1
)178.1
(165,
191.2
)N/A
247.8
(237,
258.5
)234.7
(225.5
,243.9
)238.1
(229,
247.3
)301
(293.3
,308.8
)N/A
N/A
3A
-1SW
L–
0(0,0
)1.3
(-4
.3,6.8
)19.1
(9.6
,28.6
)183
(171.1
,194.9
)182.9
(171,
194.9
)228.1
(218,
238.2
)177.4
(164.4
,190.4
)N/A
247
(236.7
,257.4
)234
(225.4
,242.6
)237.4
(228.8
,246)
300.3
(292.6
,308)
N/A
N/A
3A
-2SW
L–
–0
(0,0)
17.8
(7.1
,28.6
)181.7
(168.9
,194.6
)181.7
(168.8
,194.6
)226.8
(215.9
,237.7
)176.1
(162.6
,189.7
)N/A
245.8
(234.9
,256.6
)232.7
(223.3
,242.2
)236.1
(226.9
,245.3
)299
(291.8
,306.3
)N/A
N/A
3A
-3SW
L–
––
0(0,0
)163.9
(151.1
,176.7
)163.8
(150.9
,176.7
)209
(196.8
,221.1
)158.3
(144.2
,172.4
)N/A
227.9
(215.5
,240.3
)214.9
(203.2
,226.5
)218.3
(207.5
,229.1
)281.2
(269.7
,292.7
)N/A
N/A
4A
-0SW
L–
––
–0
(0,0)
-0.1
(-1
.1,
0.9
)45.1
(33.1
,57)
-5.6
(-1
4.5
,3.2
)N/A
64
(50.7
,77.3
)51
(39.1
,62.9
)54.4
(42.5
,66.2
)117.3
(104.9
,129.6
)N/A
N/A
4A
-1SW
L–
––
––
0(0,0)
45.1
(33.1
,57.2
)-5
.5(-1
4.3
,3.2
)N/A
64.1
(50.7
,77.5
)51
(39,63.1
)54.4
(42.4
,66.4
)117.4
(104.9
,129.8
)N/A
N/A
4A
-2SW
L–
––
––
–0
(0,0)
-50.7
(-64.9
,-36.4
)N/A
19
(7.7
,30.2
)5.9
(-0
.9,
12.7
)9.3
(3,15.6
)72.2
(63.1
,81.4
)N/A
N/A
4A
-3SW
L–
––
––
––
0(0,0)
N/A
69.6
(54.8
,84.5
)56.6
(42.7
,70.5
)60
(46.1
,73.8
)122.9
(109,
136.8
)N/A
N/A
4A
-4SW
L–
––
––
––
–N/A
N/A
N/A
N/A
N/A
N/A
N/A
5A
-0SW
L–
––
––
––
––
0(0,0)
-13
(-19.5
,-6.6
)-9.6
(-16.6
,-2.7
)53.3
(40,
66.6
)N/A
N/A
5A
-1SW
L–
––
––
––
––
–0
(0,0)
3.4
(-1
,7.7
)66.3
(56.9
,75.7
)N/A
N/A
5A
-2SW
L–
––
––
––
––
––
0(0,0)
62.9
(53.4
,72.4
)N/A
N/A
5A
-3SW
L–
––
––
––
––
––
–0
(0,0)
N/A
N/A
5A
-4SW
L–
––
––
––
––
––
––
N/A
N/A
5A
-5SW
L–
––
––
––
––
––
––
–N/A
Tab
leG
.1:
CC
Cre
sult
sfo
rva
ryin
gth
enu
mb
erof
short
wait
ing
list
faci
liti
eson
the
nu
mb
erof
AL
Cd
ays

Appendix G. Pairwise comparison charts - varying quantity of short waiting list facilities87
3A
-0SW
L3A
-1SW
L3A
-2SW
L3A
-3SW
L4A
-0SW
L4A
-1SW
L4A
-2SW
L4A
-3SW
L4A
-4SW
L5A
-0SW
L5A
-1SW
L5A
-2SW
L5A
-3SW
L5A
-4SW
L5A
-5SW
L
3A
-0SW
L0
(0,0)
0(0,0)
0(-0
.1,0.1
)0
(-0
.1,0.1
)0.5
(0.4
,0.6
)0.5
(0.4
,0.6
)0.5
(0.4
,0.6
)0.4
(0.3
,0.5
)N/A
0.8
(0.7
,0.9
)0.8
(0.7
,0.9
)0.8
(0.7
,0.9
)0.8
(0.7
,0.9
)N/A
N/A
3A
-1SW
L–
0(0,0
)0
(-0
.1,0.1
)0
(-0
.1,0.1
)0.5
(0.4
,0.6
)0.5
(0.4
,0.6
)0.5
(0.4
,0.6
)0.4
(0.3
,0.5
)N/A
0.8
(0.7
,0.9
)0.8
(0.7
,0.9
)0.8
(0.7
,0.9
)0.8
(0.7
,0.9
)N/A
N/A
3A
-2SW
L–
–0
(0,0)
0(-0
.1,0.1
)0.5
(0.4
,0.6
)0.5
(0.4
,0.6
)0.5
(0.4
,0.6
)0.4
(0.3
,0.5
)N/A
0.8
(0.7
,0.9
)0.8
(0.7
,0.9
)0.8
(0.7
,0.9
)0.8
(0.7
,0.9
)N/A
N/A
3A
-3SW
L–
––
0(0,0
)0.5
(0.4
,0.6
)0.5
(0.4
,0.6
)0.5
(0.4
,0.6
)0.4
(0.3
,0.5
)N/A
0.8
(0.7
,0.9
)0.8
(0.7
,0.9
)0.8
(0.7
,0.9
)0.8
(0.7
,0.9
)N/A
N/A
4A
-0SW
L–
––
–0
(0,0)
0(0,0)
0(-0
.1,0)
-0.1
(-0
.2,0)
N/A
0.3
(0.2
,0.3
)0.3
(0.2
,0.3
)0.3
(0.2
,0.3
)0.3
(0.2
,0.4
)N/A
N/A
4A
-1SW
L–
––
––
0(0,0)
0(-0
.1,0)
-0.1
(-0
.2,0)
N/A
0.3
(0.2
,0.3
)0.3
(0.2
,0.3
)0.3
(0.2
,0.3
)0.3
(0.2
,0.4
)N/A
N/A
4A
-2SW
L–
––
––
–0
(0,0)
-0.1
(-0
.1,0)
N/A
0.3
(0.2
,0.4
)0.3
(0.2
,0.4
)0.3
(0.2
,0.4
)0.3
(0.3
,0.4
)N/A
N/A
4A
-3SW
L–
––
––
––
0(0,0)
N/A
0.4
(0.3
,0.4
)0.4
(0.3
,0.4
)0.4
(0.3
,0.5
)0.4
(0.3
,0.5
)N/A
N/A
4A
-4SW
L–
––
––
––
–N/A
N/A
N/A
N/A
N/A
N/A
N/A
5A
-0SW
L–
––
––
––
––
0(0,0)
0(0,0)
0(0,0)
0(0,0.1
N/A
N/A
5A
-1SW
L–
––
––
––
––
–0
(0,0)
0(0,0)
0(0,0.1
)N/A
N/A
5A
-2SW
L–
––
––
––
––
––
0(0,0)
0(0,0.1
)N/A
N/A
5A
-3SW
L–
––
––
––
––
––
–0
(0,0)
N/A
N/A
5A
-4SW
L–
––
––
––
––
––
––
N/A
N/A
5A
-5SW
L–
––
––
––
––
––
––
–N/A
Tab
leG
.2:
CC
Cre
sult
sfo
rva
ryin
gth
enu
mb
erof
short
wait
ing
list
faci
liti
eson
the
nu
mb
erof
die
din
hosp
ital
pati
ents

Appendix G. Pairwise comparison charts - varying quantity of short waiting list facilities88
3A
-0SW
L3A
-1SW
L3A
-2SW
L3A
-3SW
L4A
-0SW
L4A
-1SW
L4A
-2SW
L4A
-3SW
L4A
-4SW
L5A
-0SW
L5A
-1SW
L5A
-2SW
L5A
-3SW
L5A
-4SW
L5A
-5SW
L
3A
-0SW
L0
(0,0)
-0.3
(-0
.9,
0.4
)
-0.5
(-1
.7,
0.7
)-0
.6(-1
.6,
0.4
)41.2
(38.2
,44.2
)40.8
(38,
43.7
)40.3
(37.3
,43.3
)41.3
(38.5
,44.2
)41.5
(38.6
,44.4
)70.9
(67.5
,74.3
)70.6
(67.2
,74.1
)72.1
(68.9
,75.3
)71.2
(67.4
,75)
74.2
(70.2
,78.2
)85.2
(80.6
,89.8
)
3A
-1SW
L–
0(0,0)
-0.2
(-1
.3,
0.8
)-0
.3(-1
.2,
0.5
)41.5
(38.5
,44.5
)41.1
(38.3
,44)
40.6
(37.6
,43.5
)41.6
(38.8
,44.4
)41.8
(38.8
,44.7
)71.2
(67.9
,74.5
)70.9
(67.6
,74.3
)72.4
(69.3
,75.5
)71.4
(67.7
,75.2
)74.5
(70.5
,78.4
)85.5
(81,90)
3A
-2SW
L–
–0
(0,0)
-0.1
(-0
.5,
0.3
)41.7
(38.6
,44.8
)41.3
(38.3
,44.4
)40.8
(37.9
,43.8
)41.8
(39.2
,44.5
)42
(39.3
,44.8
)71.4
(68,
74.8
)71.2
(67.7
,74.6
)72.6
(69.4
,75.8
)71.7
(67.9
,75.4
)74.7
(70.8
,78.6
)85.7
(81.3
,90.1
)3A
-3SW
L–
––
0(0,0)
41.8
(38.8
,44.9
)41.5
(38.5
,44.4
)40.9
(38.1
,43.8
)42
(39.3
,44.6
)42.1
(39.4
,44.9
)71.5
(68.2
,74.9
)71.3
(67.9
,74.7
)72.7
(69.6
,75.9
)71.8
(68.1
,75.5
)74.8
(70.9
,78.7
)85.8
(81.5
,90.1
)
4A
-0SW
L–
––
–0
(0,0)
-0.4
(-1
.2,
0.4
)-0
.9(-2
.2,
0.4
)0.1
(-1
.4,1.6
)0.3
(-1
.3,1.9
)29.7
(25.1
,34.3
)29.4
(24.8
,34)
30.9
(26.6
,35.2
)29.9
(25.1
,34.8
)33
(28.3
,37.6
)44
(38.5
,49.4
)4A
-1SW
L–
––
––
0(0,0)
-0.5
(-1
.8,
0.8
)0.5
(-0
.9,1.9
)0.7
(-0
.8,2.2
)30.1
(25.6
,34.6
)29.8
(25.3
,34.3
)31.3
(27.1
,35.5
)30.3
(25.6
,35.1
)33.4
(28.6
,38.1
)44.4
(39,
49.7
)4A
-2SW
L–
––
––
–0
(0,0)
1(0,2.1
)1.2
(0.1
,2.3
)30.6
(26.1
,35)
30.3
(25.9
,34.8
)31.8
(27.7
,35.9
)30.9
(26.3
,35.4
)33.9
(29.2
,38.6
)44.9
(39.7
,50)
4A
-3SW
L–
––
––
––
0(0,0)
0.2
(-0
.4,0.7
)29.6
(25.3
,33.8
)29.3
(25,
33.6
)30.8
(26.8
,34.8
)29.8
(25.4
,34.3
)32.9
(28.3
,37.4
)43.9
(38.8
,48.9
)4A
-4SW
L–
––
––
––
–0
(0,0)
29.4
(25.1
,33.7
)29.1
(24.8
,33.4
)30.6
(26.6
,34.6
)29.7
(25.1
,34.2
)32.7
(28.2
,37.2
)43.7
(38.5
,48.8
)
5A
-0SW
L–
––
––
––
––
0(0,0)
-0.3
(-0
.9,
0.4
)1.2
(-0
.3,2.7
)0.3
(-2
.6,3.2
)3.3
(-0
.8,7.4
)14.3
(9.4
,19.2
)5A
-1SW
L–
––
––
––
––
–0
(0,0)
1.5
(-0
.2,3.1
)0.5
(-2
.5,3.5
)3.5
(-0
.5,7.6
)14.6
(9.7
,19.4
)5A
-2SW
L–
––
––
––
––
––
0(0,0)
-0.9
(-3
.8,
1.9
)2.1
(-1
.8,6)
13.1
(8.2
,17.9
)5A
-3SW
L–
––
––
––
––
––
–0
(0,0)
3(-1
.2,7.2
)14
(9.2
,18.8
)5A
-4SW
L–
––
––
––
––
––
––
0(0,0)
11
(6.5
,15.5
)5A
-5SW
L–
––
––
––
––
––
––
–0
(0,0)
Tab
leG
.3:
Con
vale
scen
tre
sult
sfo
rva
ryin
gth
enu
mb
erof
short
wait
ing
list
faci
liti
eson
the
nu
mb
erof
AL
Cd
ays

Appendix G. Pairwise comparison charts - varying quantity of short waiting list facilities89
3A
-0SW
L3A
-1SW
L3A
-2SW
L3A
-3SW
L4A
-0SW
L4A
-1SW
L4A
-2SW
L4A
-3SW
L4A
-4SW
L5A
-0SW
L5A
-1SW
L5A
-2SW
L5A
-3SW
L5A
-4SW
L5A
-5SW
L
3A
-0SW
L0
(0,0)
0(0,0)
0(0,0)
0(-0
.1,0)
0.1
(0,0.1
)0.1
(0,0.1
)0.1
(0,0.1
)0.1
(0,0.1
)0.1
(0,0.1
)0.2
(0.1
,0.2
)0.2
(0.1
,0.2
)0.2
(0.1
,0.2
)0.2
(0.1
,0.2
)0.1
(0.1
,0.2
)0.1
(0.1
,0.2
)
3A
-1SW
L–
0(0,0)
0(0,0)
0(-0
.1,0)
0.1
(0,0.1
)0.1
(0,0.1
)0.1
(0,0.1
)0.1
(0,0.1
)0.1
(0,0.1
)0.2
(0.1
,0.2
)0.2
(0.1
,0.2
)0.2
(0.1
,0.2
)0.2
(0.1
,0.2
)0.1
(0.1
,0.2
))
0.1
(0.1
,0.2
)
3A
-2SW
L–
–0
(0,0)
0(-0
.1,0)
0.1
(0,0.1
)0.1
(0,0.1
)0.1
(0,0.1
)0.1
(0,0.1
)0.1
(0,0.1
)0.2
(0.1
,0.2
)0.2
(0.1
,0.2
)0.2
(0.1
,0.2
)0.2
(0.1
,0.2
)0.1
(0.1
,0.2
)0.1
(0.1
,0.2
)
3A
-3SW
L–
––
0(0,0)
0.1
(0,0.1
)0.1
(0,0.1
)0.1
(0,0.1
)0.1
(0,0.1
)0.1
(0,0.1
)0.2
(0.2
,0.3
)0.2
(0.2
,0.3
)0.2
(0.1
,0.3
)0.2
(0.1
,0.3
)0.2
(0.1
,0.2
)0.2
(0.1
,0.2
)
4A
-0SW
L–
––
–0
(0,0)
0(0,0)
0(0,0)
0(0,0)
0(0,0)
0.1
(0.1
,0.2
)0.1
(0.1
,0.2
)0.1
(0.1
,0.2
)0.1
(0.1
,0.2
)0.1
(0,0.1
)0.1
(0,0.1
)
4A
-1SW
L–
––
––
0(0,0)
0(0,0)
0(0,0)
0(0,0)
0.1
(0.1
,0.2
)0.1
(0.1
,0.2
)0.1
(0.1
,0.2
)0.1
(0.1
,0.2
)0.1
(0,0.1
)0.1
(0,0.1
)
4A
-2SW
L–
––
––
–0
(0,0)
0(0,0)
0(0,0)
0.1
(0.1
,0.2
)0.1
(0.1
,0.2
)0.1
(0.1
,0.2
)0.1
(0.1
,0.2
)0.1
(0,0.1
)0.1
(0,0.1
)
4A
-3SW
L–
––
––
––
0(0,0)
0(0,0)
0.1
(0.1
,0.2
)0.1
(0.1
,0.2
)0.1
(0.1
,0.2
)0.1
(0.1
,0.2
)0.1
(0,0.1
)0.1
(0,0.1
)
4A
-4SW
L–
––
––
––
–0
(0,0)
0.1
(0.1
,0.2
)0.1
(0.1
,0.2
)0.1
(0.1
,0.2
)0.1
(0.1
,0.2
)0.1
(0,0.1
)0.1
(0,0.1
)
5A
-0SW
L–
––
––
––
––
0(0,0)
0(0,0)
0(0,0)
0(0,0)
-0.1
(-0
.1,0)
-0.1
(-0
.1,0)
5A
-1SW
L–
––
––
––
––
–0
(0,0)
0(0,0)
0(0,0)
-0.1
(-0
.1,0)
-0.1
(-0
.1,0)
5A
-2SW
L–
––
––
––
––
––
0(0,0)
0(0,0)
0(-0
.1,0)
0(-0
.1,0)
5A
-3SW
L–
––
––
––
––
––
–0
(0,0)
0(-0
.1,0)
0(-0
.1,0)
5A
-4SW
L–
––
––
––
––
––
––
0(0,0)
0(0,0)
5A
-5SW
L–
––
––
––
––
––
––
–0
(0,0)
Tab
leG
.4:
Con
vale
scen
tre
sult
sfo
rva
ryin
gth
enu
mb
erof
short
wait
ing
list
faci
liti
eson
the
nu
mb
erof
die
din
hosp
ital
pati
ents

Appendix G. Pairwise comparison charts - varying quantity of short waiting list facilities90
3A
-0SW
L3A
-1SW
L3A
-2SW
L3A
-3SW
L4A
-0SW
L4A
-1SW
L4A
-2SW
L4A
-3SW
L4A
-4SW
L5A
-0SW
L5A
-1SW
L5A
-2SW
L5A
-3SW
L5A
-4SW
L5A
-5SW
L
3A
-0SW
L0
(0,0)
-6.9
(-1
5.9
,2.1
)
-4.4
(-3
0.6
,21.8
)53.9
(16.1
,91.8
)490.7
(458.7
,522.7
)477.1
(444.8
,509.3
)493.8
(461.9
,525.8
)524
(488.8
,559.3
)612.8
(576.3
,649.4
)826.3
(793.2
,859.3
)826.3
(793.2
,859.3
)836
(803.4
,868.6
)864.9
(831.8
,898)
902
(869,
935)
996.4
(961.3
,1031.4
)
3A
-1SW
L–
0(0,0)
2.5
(-2
2.1
,27.1
)60.8
(23.7
,98)
497.6
(466.3
,528.9
)484
(452.6
,515.4
)500.7
(469.6
,531.8
)530.9
(497.1
,564.8
)619.7
(583.8
,655.6
)833.2
(801,
865.4
)833.2
(801,
865.4
)842.9
(811.2
,874.6
)871.8
(840,
903.6
)908.9
(877,
940.8
)1003.3
(968.6
,1038)
3A
-2SW
L–
–0
(0,0)
58.3
(25.1
,91.5
)495.1
(464,
526.2
)481.5
(449.6
,513.4
)498.2
(466.1
,530.4
)528.4
(493.9
,563)
617.2
(579.5
,655)
830.7
(799.3
,862.1
)830.7
(799.3
,862.1
)840.4
(808.7
,872.1
)869.3
(837.6
,901)
906.4
(873.9
,938.9
)1000.8
(964.2
,1037.3
)3A
-3SW
L–
––
0(0,0)
436.8
(400.9
,472.6
)423.2
(387,
459.3
)439.9
(403.1
,476.7
)470.1
(431,
509.2
)558.9
(517.5
,600.3
)772.3
(736.7
,808)
772.3
(736.7
,808)
782.1
(746.1
,818.1
)811
(773.6
,848.4
)848.1
(810.5
,885.7
)942.4
(901,
983.9
)
4A
-0SW
L–
––
–0
(0,0)
-13.6
(-18.2
,-9.1
)3.1
(-6
.5,
12.8
)33.3
(15.3
,51.4
)122.1
(97.5
,146.8
)335.6
(309,
362.1
)335.6
(309,
362.1
)345.3
(319.1
,371.5
)374.2
(347.8
,400.6
)411.3
(387.5
,435.1
)505.7
(481.4
,529.9
)4A
-1SW
L–
––
––
0(0,0)
16.7
(7.3
,26.1
)47
(29.7
,64.2
)135.7
(111,
160.5
)349.2
(322.1
,376.2
)349.2
(322.1
,376.2
)358.9
(332.3
,385.5
)387.8
(360.9
,414.8
)424.9
(401.1
,448.8
)519.3
(494.5
,544.1
)4A
-2SW
L–
––
––
–0
(0,0)
30.2
(13.6
,46.8
)119
(93.5
,144.5
)332.4
(306.5
,358.4
)332.4
(306.5
,358.4
)342.2
(316.6
,367.7
)371.1
(345.5
,396.6
)408.2
(384.4
,432)
502.5
(478,
527)
4A
-3SW
L–
––
––
––
0(0,0)
88.8
(63.2
,114.4
)302.2
(271.4
,333)
302.2
(271.4
,333)
312
(281.8
,342.1
)340.9
(310.3
,371.4
)378
(349.6
,406.3
)472.3
(444.9
,499.8
)4A
-4SW
L–
––
––
––
–0
(0,0)
213.4
(181.1
,245.8
)213.4
(181.1
,245.8
)223.2
(191.2
,255.1
)252.1
(219.8
,284.3
)289.2
(259.8
,318.6
)383.5
(355.2
,411.9
)
5A
-0SW
L–
––
––
––
––
0(0,0)
0(0,0)
9.7
(5.1
,14.3
)38.6
(28.9
,48.3
)75.7
(59.6
,91.9
)170.1
(148.9
,191.3
)5A
-1SW
L–
––
––
––
––
–0
(0,0)
9.7
(5.1
,14.3
)38.6
(28.9
,48.3
)75.7
(59.6
,91.9
)170.1
(148.9
,191.3
)5A
-2SW
L–
––
––
––
––
––
0(0,0)
28.9
(19.7
,38.1
)66
(50.2
,81.8
)160.4
(140.3
,180.4
)5A
-3SW
L–
––
––
––
––
––
–0
(0,0)
37.1
(22.2
,52)
131.5
(111.7
,151.2
)5A
-4SW
L–
––
––
––
––
––
––
0(0,0)
94.4
(75.8
,113)
5A
-5SW
L–
––
––
––
––
––
––
–0
(0,0)
Tab
leG
.5:
LT
Cre
sult
sfo
rva
ryin
gth
enu
mb
erof
short
wait
ing
list
faci
liti
eson
the
nu
mb
erof
AL
Cd
ays

Appendix G. Pairwise comparison charts - varying quantity of short waiting list facilities91
3A
-0SW
L3A
-1SW
L3A
-2SW
L3A
-3SW
L4A
-0SW
L4A
-1SW
L4A
-2SW
L4A
-3SW
L4A
-4SW
L5A
-0SW
L5A
-1SW
L5A
-2SW
L5A
-3SW
L5A
-4SW
L5A
-5SW
L
3A
-0SW
L0
(0,0)
0(-0
.1,
0.1
)-0.3
(-0.5
,-0.1
)-0.3
(-0.5
,-0.1
)2.8
(2.6
,3)
2.8
(2.6
,3)
2.8
(2.6
,3)
2.7
(2.5
,2.9
)2.6
(2.4
,2.9
)4.1
(3.9
,4.3
)4.1
(3.9
,4.3
)4.1
(3.9
,4.3
)4.2
(3.9
,4.4
)4.2
(4,4.4
)4.5
(4.2
,4.7
)
3A
-1SW
L–
0(0,0)
-0.3
(-0.5
,-0.1
)-0.3
(-0.5
,-0.1
)2.8
(2.6
,3)
2.8
(2.6
,3)
2.8
(2.6
,3)
2.7
(2.5
,2.9
)2.6
(2.4
,2.9
)4.1
(3.9
,4.3
)4.1
(3.9
,4.3
)4.1
(3.9
,4.3
)4.2
(3.9
,4.4
)4.2
(4,4.4
)4.5
(4.2
,4.7
)
3A
-2SW
L–
–0
(0,0)
0(-0
.2,0.2
)3.1
(2.9
,3.3
)3.1
(2.9
,3.3
)3.1
(2.9
,3.3
)3
(2.8
,3.2
)2.9
(2.7
,3.2
)4.4
(4.2
,4.6
)4.4
(4.2
,4.6
)4.4
(4.2
,4.7
)4.5
(4.2
,4.7
)4.5
(4.2
,4.7
)4.8
(4.5
,5)
3A
-3SW
L–
––
0(0,0)
3.1
(2.9
,3.3
)3.1
(2.9
,3.3
)3.1
(2.9
,3.4
)3
(2.8
,3.2
)2.9
(2.6
,3.2
)4.4
(4.2
,4.7
)4.4
(4.2
,4.7
)4.4
(4.2
,4.7
)4.5
(4.2
,4.7
)4.5
(4.2
,4.7
)4.8
(4.5
,5)
4A
-0SW
L–
––
–0
(0,0)
0(0,0)
0(-0
.1,0.1
)-0
.1(-0
.3,0)
-0.2
(-0
.4,0)
1.3
(1.1
,1.5
)1.3
(1.1
,1.5
)1.3
(1.1
,1.5
)1.3
(1.1
,1.6
)1.4
(1.2
,1.6
)1.6
(1.4
,1.8
)
4A
-1SW
L–
––
––
0(0,0)
0(-0
.1,0.1
)-0
.1(-0
.3,0)
-0.2
(-0
.4,0)
1.3
(1.1
,1.5
)1.3
(1.1
,1.5
)1.3
(1.1
,1.5
)1.3
(1.1
,1.6
)1.4
(1.2
,1.6
)1.6
(1.4
,1.8
)
4A
-2SW
L–
––
––
–0
(0,0)
-0.1
(-0
.3,0)
-0.2
(-0
.4,0)
1.3
(1.1
,1.5
)1.3
(1.1
,1.5
)1.3
(1.1
,1.5
)1.3
(1.1
,1.6
)1.4
(1.2
,1.6
)1.6
(1.4
,1.8
)
4A
-3SW
L–
––
––
––
0(0,0)
-0.1
(-0
.3,
0.1
)1.4
(1.2
,1.7
)1.4
(1.2
,1.7
)1.4
(1.2
,1.7
)1.5
(1.2
,1.7
)1.5
(1.3
,1.7
)1.8
(1.5
,2)
4A
-4SW
L–
––
––
––
–0
(0,0)
1.5
(1.3
,1.7
)1.5
(1.3
,1.7
)1.5
(1.3
,1.7
)1.5
(1.3
,1.8
)1.6
(1.4
,1.8
)1.8
(1.6
,2.1
)
5A
-0SW
L–
––
––
––
––
0(0,0)
0(0,0)
0(0,0.1
)0
(0,0.1
)0.1
(-0
.1,0.2
)0.3
(0.1
,0.5
)
5A
-1SW
L–
––
––
––
––
–0
(0,0)
0(0,0.1
)0
(0,0.1
)0.1
(-0
.1,0.2
)0.3
(0.1
,0.5
)
5A
-2SW
L–
––
––
––
––
––
0(0,0)
0(0,0.1
)0.1
(-0
.1,0.2
)0.3
(0.1
,0.5
)
5A
-3SW
L–
––
––
––
––
––
–0
(0,0)
0(-0
.1,0.2
)0.3
(0.1
,0.5
)
5A
-4SW
L–
––
––
––
––
––
––
0(0,0)
0.3
(0.1
,0.4
)
5A
-5SW
L–
––
––
––
––
––
––
–0
(0,0)
Tab
leG
.6:
LT
Cre
sult
sfo
rva
ryin
gth
enu
mb
erof
short
wait
ing
list
faci
liti
eson
the
nu
mb
erof
die
din
hosp
ital
pati
ents

Appendix G. Pairwise comparison charts - varying quantity of short waiting list facilities92
3A
-0SW
L3A
-1SW
L3A
-2SW
L3A
-3SW
L4A
-0SW
L4A
-1SW
L4A
-2SW
L4A
-3SW
L4A
-4SW
L5A
-0SW
L5A
-1SW
L5A
-2SW
L5A
-3SW
L5A
-4SW
L5A
-5SW
L
3A
-0SW
L0
(0,0)
12.1
(6.5
,17.6
)
69.6
(62.1
,77.2
)148.2
(141.8
,154.7
)214.1
(207.5
,220.6
)203.3
(196.7
,209.9
)207.6
(200.7
,214.5
)245.1
(239.2
,251.1
)288.4
(282.3
,294.4
)309.5
(304.3
,314.8
)308.1
(302.8
,313.4
)303.9
(298.4
,309.5
)309.5
(304.1
,314.8
)329.1
(323.5
,334.6
)355.2
(350.8
,359.7
)
3A
-1SW
L–
0(0,0)
57.5
(49.2
,65.9
)136.2
(128.8
,143.5
)202
(194.3
,209.7
)191.2
(183.6
,198.8
)195.5
(187.6
,203.4
)233
(226,
240.1
)276.3
(269.9
,282.7
)297.5
(291.4
,303.5
)296
(289.9
,302.2
)291.9
(285.4
,298.3
)297.4
(291.1
,303.7
)317
(310.8
,323.2
)343.2
(337.5
,348.9
)3A
-2SW
L–
–0
(0,0)
78.6
(71.7
,85.5
)144.5
(136.8
,152.1
)133.7
(125.3
,142.1
)138
(129.8
,146.2
)175.5
(167.8
,183.2
)218.8
(211.2
,226.3
)239.9
(232.4
,247.5
)238.5
(230.9
,246.2
)234.3
(226.9
,241.8
)239.9
(232.8
,246.9
)259.5
(252,
266.9
)285.6
(278.7
,292.6
)3A
-3SW
L–
––
0(0,0)
65.8
(59,
72.6
)55.1
(47.6
,62.5
)59.3
(52,
66.7
)96.9
(90.5
,103.3
)140.1
(134.3
,146)
161.3
(155.4
,167.2
)159.9
(154.2
,165.6
)155.7
(149.2
,162.1
)161.2
(156.2
,166.2
)180.8
(175.4
,186.3
)207
(201.5
,212.5
)
4A
-0SW
L–
––
–0
(0,0)
-10.8
(-15.5
,-6.1
)-6.5
(-12.7
,-0.3
)31.1
(24.9
,37.2
)74.3
(67.8
,80.8
)95.5
(89,
102)
94.1
(87.5
,100.7
)89.9
(83.8
,95.9
)95.4
(89.5
,101.3
)115
(109,
121)
141.2
(135.3
,147)
4A
-1SW
L–
––
––
0(0,0)
4.3
(-2
.8,
11.4
)41.8
(35.5
,48.1
)85.1
(78.8
,91.4
)106.2
(99.7
,112.8
)104.8
(98.2
,111.5
)100.6
(94.6
,106.7
)106.2
(99.8
,112.6
)125.8
(119.2
,132.4
)151.9
(145.9
,157.9
)4A
-2SW
L–
––
––
–0
(0,0)
37.5
(31.2
,43.9
)80.8
(73.6
,88)
101.9
(95.4
,108.5
)100.5
(93.9
,107.2
)96.3
(89.2
,103.5
)101.9
(95.2
,108.5
)121.5
(115.2
,127.8
)147.7
(141.4
,153.9
)4A
-3SW
L–
––
––
––
0(0,0)
43.2
(37.9
,48.6
)64.4
(58.8
,70)
63
(57.6
,68.4
)58.8
(53.3
,64.3
)64.3
(59.5
,69.2
)83.9
(78.2
,89.6
)110.1
(105.2
,115.1
)4A
-4SW
L–
––
––
––
–0
(0,0)
21.2
(16.1
,26.3
)19.8
(14.6
,24.9
)15.6
(10.3
,20.8
)21.1
(16.2
,26)
40.7
(35.4
,46)
66.9
(62.3
,71.4
)
5A
-0SW
L–
––
––
––
––
0(0,0)
-1.4
(-4
.1,
1.3
)-5.6
(-9.8
,-1.4
)-0
.1(-4
.5,
4.4
)19.5
(15.1
,23.9
)45.7
(41.6
,49.8
)5A
-1SW
L–
––
––
––
––
–0
(0,0)
-4.2
(-8,
-0.4
)1.3
(-2
.9,5.6
)20.9
(16.7
,25.2
)47.1
(43.4
,50.8
)5A
-2SW
L–
––
––
––
––
––
0(0,0)
5.5
(1.1
,9.9
)25.1
(20.5
,29.8
)51.3
(47.4
,55.3
)5A
-3SW
L–
––
––
––
––
––
–0
(0,0)
19.6
(15.4
,23.8
)45.8
(42,
49.6
)5A
-4SW
L–
––
––
––
––
––
––
0(0,0)
26.2
(22.4
,30)
5A
-5SW
L–
––
––
––
––
––
––
–0
(0,0)
Tab
leG
.7:
Pal
liat
ive
resu
lts
for
vary
ing
the
nu
mb
erof
short
wait
ing
list
faci
liti
eson
the
nu
mb
erof
AL
Cd
ays

Appendix G. Pairwise comparison charts - varying quantity of short waiting list facilities93
3A
-0SW
L3A
-1SW
L3A
-2SW
L3A
-3SW
L4A
-0SW
L4A
-1SW
L4A
-2SW
L4A
-3SW
L4A
-4SW
L5A
-0SW
L5A
-1SW
L5A
-2SW
L5A
-3SW
L5A
-4SW
L5A
-5SW
L
3A
-0SW
L0
(0,0)
0.3
(0.1
,0.4
)1
(0.7
,1.2
)2.4
(2.1
,2.6
)5.1
(4.8
,5.3
)5.1
(4.8
,5.3
)5
(4.8
,5.3
)5.6
(5.3
,5.9
)7.2
(6.9
,7.5
)8.3
(8.1
,8.6
)8.2
(8,8.5
)8.1
(7.8
,8.3
)8.6
(8.3
,8.8
)8.7
(8.5
,8.9
)9.6
(9.4
,9.9
)
3A
-1SW
L–
0(0,0)
0.7
(0.5
,1)
2.1
(1.8
,2.4
)4.8
(4.6
,5.1
)4.8
(4.5
,5.1
)4.8
(4.5
,5.1
)5.4
(5.1
,5.6
)7
(6.7
,7.3
)8.1
(7.8
,8.3
)8
(7.7
,8.2
)7.8
(7.5
,8.1
)8.3
(8,8.6
)8.5
(8.2
,8.7
)9.4
(9.1
,9.7
)
3A
-2SW
L–
–0
(0,0)
1.4
(1.1
,1.7
)4.1
(3.8
,4.4
)4.1
(3.8
,4.4
)4.1
(3.7
,4.4
)4.6
(4.3
,4.9
)6.3
(5.9
,6.6
)7.4
(7.1
,7.6
)7.3
(7,7.5
)7.1
(6.7
,7.4
)7.6
(7.3
,7.9
)7.7
(7.4
,8)
8.7
(8.4
,8.9
)
3A
-3SW
L–
––
0(0,0)
2.7
(2.4
,3)
2.7
(2.3
,3)
2.7
(2.3
,3)
3.2
(2.9
,3.6
)4.9
(4.5
,5.2
)6
(5.6
,6.3
)5.8
(5.5
,6.2
)5.7
(5.4
,6)
6.2
(5.8
,6.5
)6.3
(6,6.6
)7.3
(6.9
,7.6
)
4A
-0SW
L–
––
–0
(0,0)
0(-0
.2,0.1
)-0
.1(-0
.3,
0.2
)0.5
(0.2
,0.8
)2.1
(1.8
,2.4
)3.2
(2.9
,3.5
)3.1
(2.8
,3.4
)3
(2.7
,3.2
)3.5
(3.1
,3.8
)3.6
(3.3
,3.9
)4.5
(4.3
,4.8
)
4A
-1SW
L–
––
––
0(0,0)
0(-0
.3,0.3
)0.6
(0.3
,0.8
)2.2
(1.9
,2.5
)3.3
(3,3.6
)3.2
(2.9
,3.5
)3
(2.7
,3.3
)3.5
(3.2
,3.8
)3.7
(3.4
,4)
4.6
(4.3
,4.9
)
4A
-2SW
L–
––
––
–0
(0,0)
0.6
(0.3
,0.9
)2.2
(1.9
,2.5
)3.3
(3,3.6
)3.2
(2.9
,3.4
)3
(2.7
,3.3
)3.5
(3.2
,3.8
)3.7
(3.4
,4)
4.6
(4.3
,4.9
)
4A
-3SW
L–
––
––
––
0(0,0)
1.6
(1.3
,1.9
)2.7
(2.4
,3)
2.6
(2.3
,3)
2.5
(2.1
,2.8
)3
(2.6
,3.3
)3.1
(2.8
,3.4
)4
(3.7
,4.3
)
4A
-4SW
L–
––
––
––
–0
(0,0)
1.1
(0.8
,1.4
)1
(0.7
,1.3
)0.8
(0.5
,1.1
)1.3
(1,1.7
)1.5
(1.1
,1.8
)2.4
(2.1
,2.7
)
5A
-0SW
L–
––
––
––
––
0(0,0)
-0.1
(-0
.3,
0.1
)-0
.3(-0
.6,0)
0.2
(0,0.5
)0.4
(0.1
,0.6
)1.3
(1,1.6
)
5A
-1SW
L–
––
––
––
––
–0
(0,0)
-0.2
(-0
.5,
0.1
)0.3
(0.1
,0.6
)0.5
(0.2
,0.7
)1.4
(1.2
,1.7
)
5A
-2SW
L–
––
––
––
––
––
0(0,0)
0.5
(0.2
,0.8
)0.7
(0.4
,1)
1.6
(1.3
,1.9
)
5A
-3SW
L–
––
––
––
––
––
–0
(0,0)
0.2
(-0
.1,0.4
)1.1
(0.8
,1.4
)
5A
-4SW
L–
––
––
––
––
––
––
0(0,0)
0.9
(0.7
,1.2
)
5A
-5SW
L–
––
––
––
––
––
––
–0
(0,0)
Tab
leG
.8:
Pal
liat
ive
resu
lts
for
vary
ing
the
nu
mb
erof
short
wait
ing
list
faci
liti
eson
the
nu
mb
erof
die
din
hosp
ital
pati
ents

Appendix G. Pairwise comparison charts - varying quantity of short waiting list facilities94
3A
-0SW
L3A
-1SW
L3A
-2SW
L3A
-3SW
L4A
-0SW
L4A
-1SW
L4A
-2SW
L4A
-3SW
L4A
-4SW
L5A
-0SW
L5A
-1SW
L5A
-2SW
L5A
-3SW
L5A
-4SW
L5A
-5SW
L
3A
-0SW
L0
(0,0)
39.5
(32.7
,46.3
)
175.8
(166.1
,185.5
)299
(288.7
,309.2
)344.2
(336.4
,351.9
)352
(344.4
,359.6
)400.5
(390.9
,410)
485.3
(475.8
,494.8
)563
(553.2
,572.9
)597.8
(590.9
,604.7
)599.2
(592.2
,606.2
)629.1
(620.5
,637.7
)677.1
(669.1
,685)
724
(716.6
,731.5
)765.9
(758.4
,773.4
)
3A
-1SW
L–
0(0,0)
136.3
(126.1
,146.6
)259.5
(248.5
,270.5
)304.7
(296.7
,312.7
)312.5
(304.2
,320.9
)361
(351,
371)
445.8
(436.2
,455.5
)523.6
(513.8
,533.4
)558.4
(550.8
,565.9
)559.7
(552,
567.5
)589.7
(580.2
,599.1
)637.6
(628.4
,646.8
)684.6
(676.7
,692.4
)726.4
(717.9
,734.9
)3A
-2SW
L–
–0
(0,0)
123.2
(110.5
,135.8
)168.4
(158.2
,178.5
)176.2
(165.5
,186.8
)224.7
(212.8
,236.5
)309.5
(297,
322)
387.2
(375.5
,398.9
)422
(411.2
,432.8
)423.4
(413.1
,433.8
)453.3
(441.2
,465.5
)501.3
(489.5
,513)
548.2
(538.4
,558.1
)590.1
(579.7
,600.5
)3A
-3SW
L–
––
0(0,0)
45.2
(34.8
,55.6
)53
(42.8
,63.3
)101.5
(90.7
,112.3
)186.3
(173.3
,199.4
)264.1
(252,
276.2
)298.9
(289.3
,308.4
)300.3
(290.3
,310.2
)330.2
(318.6
,341.7
)378.1
(367.1
,389.1
)425.1
(414.6
,435.6
)466.9
(458,
475.9
)
4A
-0SW
L–
––
–0
(0,0)
7.8
(1.5
,14.2
)56.3
(47.7
,64.9
)141.1
(131,
151.3
)218.9
(209.7
,228)
253.7
(247.2
,260.1
)255.1
(247.9
,262.2
)285
(276.4
,293.6
)332.9
(324.8
,341)
379.9
(372.9
,386.9
)421.7
(414.7
,428.8
)4A
-1SW
L–
––
––
0(0,0)
48.5
(40.1
,56.9
)133.3
(123,
143.6
)211
(201.9
,220.2
)245.8
(239.7
,252)
247.2
(239.9
,254.5
)277.1
(268.2
,286.1
)325.1
(317.2
,332.9
)372.1
(364.2
,379.9
)413.9
(406.6
,421.2
)4A
-2SW
L–
––
––
–0
(0,0)
84.8
(73.7
,95.9
)162.6
(152.7
,172.5
)197.4
(188.4
,206.3
)198.8
(189.6
,208)
228.7
(218.3
,239)
276.6
(267.8
,285.4
)323.6
(314.6
,332.6
)365.4
(356.8
,374)
4A
-3SW
L–
––
––
––
0(0,0)
77.7
(65.7
,89.8
)112.5
(102.8
,122.2
)113.9
(103.5
,124.3
)143.8
(132.2
,155.4
)191.8
(180.9
,202.6
)238.7
(228.9
,248.6
)280.6
(270.1
,291.1
)4A
-4SW
L–
––
––
––
–0
(0,0)
34.8
(25.1
,44.5
)36.2
(27.4
,45)
66.1
(54.5
,77.7
)114
(104,
124.1
)161
(152.1
,169.9
)202.8
(194,
211.7
)
5A
-0SW
L–
––
––
––
––
0(0,0)
1.4
(-3
.5,6.2
)31.3
(23.9
,38.7
)79.2
(71.8
,86.6
)126.2
(119.4
,133)
168
(161.4
,174.7
)5A
-1SW
L–
––
––
––
––
–0
(0,0)
29.9
(22,
37.8
)77.8
(70.4
,85.3
)124.8
(118.5
,131.2
)166.7
(159.7
,173.6
)5A
-2SW
L–
––
––
––
––
––
0(0,0)
47.9
(38.9
,57)
94.9
(86.7
,103.1
)136.7
(127.8
,145.7
)5A
-3SW
L–
––
––
––
––
––
–0
(0,0)
47
(39.6
,54.4
)88.8
(80.7
,96.9
)5A
-4SW
L–
––
––
––
––
––
––
0(0,0)
41.8
(34.7
,48.9
)5A
-5SW
L–
––
––
––
––
––
––
–0
(0,0)
Tab
leG
.9:
Reh
abil
itat
ion
resu
lts
for
vary
ing
the
nu
mb
erof
short
wait
ing
list
faci
liti
eson
the
nu
mb
erof
AL
Cd
ays

Appendix G. Pairwise comparison charts - varying quantity of short waiting list facilities95
3A
-0SW
L3A
-1SW
L3A
-2SW
L3A
-3SW
L4A
-0SW
L4A
-1SW
L4A
-2SW
L4A
-3SW
L4A
-4SW
L5A
-0SW
L5A
-1SW
L5A
-2SW
L5A
-3SW
L5A
-4SW
L5A
-5SW
L
3A
-0SW
L0
(0,0)
-0.1
(-0
.3,
0.2
)
0.8
(0.5
,1)
0.6
(0.3
,0.9
)2.6
(2.4
,2.9
)2.9
(2.7
,3.1
)3
(2.7
,3.2
)3.3
(3.1
,3.6
)3.6
(3.3
,3.9
)4.8
(4.5
,5)
4.7
(4.5
,5)
5(4.8
,5.2
)5
(4.8
,5.2
)5.3
(5,5.6
)5.2
(4.9
,5.5
)
3A
-1SW
L–
0(0,0)
0.8
(0.6
,1.1
)0.7
(0.4
,1)
2.7
(2.5
,2.9
)3
(2.8
,3.2
)3
(2.8
,3.3
)3.4
(3.1
,3.7
)3.7
(3.4
,3.9
)4.9
(4.6
,5.1
)4.8
(4.6
,5)
5.1
(4.9
,5.3
)5.1
(4.8
,5.3
)5.4
(5.1
,5.6
)5.3
(5,5.5
)
3A
-2SW
L–
–0
(0,0)
-0.1
(-0
.4,
0.2
)1.9
(1.6
,2.1
)2.2
(1.9
,2.4
)2.2
(2,2.4
)2.6
(2.3
,2.9
)2.8
(2.6
,3.1
)4
(3.8
,4.3
)4
(3.8
,4.2
)4.3
(4,4.5
)4.2
(4,4.5
)4.5
(4.3
,4.8
)4.4
(4.2
,4.7
)
3A
-3SW
L–
––
0(0,0)
2(1.8
,2.2
)2.3
(2,2.5
)2.4
(2.1
,2.6
)2.7
(2.4
,3)
3(2.7
,3.2
)4.2
(3.9
,4.4
)4.1
(3.9
,4.3
)4.4
(4.1
,4.6
)4.4
(4.1
,4.6
)4.7
(4.4
,4.9
)4.6
(4.3
,4.8
)
4A
-0SW
L–
––
–0
(0,0)
0.3
(0.1
,0.5
)0.4
(0.2
,0.5
)0.7
(0.5
,0.9
)1
(0.8
,1.2
)2.2
(2,2.3
)2.1
(1.9
,2.3
)2.4
(2.2
,2.6
)2.4
(2.2
,2.5
)2.7
(2.5
,2.8
)2.6
(2.4
,2.8
)
4A
-1SW
L–
––
––
0(0,0)
0.1
(-0
.1,0.3
)0.4
(0.2
,0.6
)0.7
(0.5
,0.9
)1.9
(1.7
,2)
1.8
(1.7
,2)
2.1
(1.9
,2.3
)2.1
(1.9
,2.2
)2.4
(2.2
,2.6
)2.3
(2.1
,2.5
)
4A
-2SW
L–
––
––
–0
(0,0)
0.4
(0.1
,0.6
)0.6
(0.4
,0.9
)1.8
(1.6
,2)
1.8
(1.6
,1.9
)2
(1.8
,2.2
)2
(1.8
,2.2
)2.3
(2.1
,2.5
)2.2
(2,2.5
)
4A
-3SW
L–
––
––
––
0(0,0)
0.3
(0,0.5
)1.5
(1.2
,1.7
)1.4
(1.2
,1.6
)1.7
(1.5
,1.9
)1.7
(1.4
,1.9
)2
(1.8
,2.2
)1.9
(1.6
,2.1
)
4A
-4SW
L–
––
––
––
–0
(0,0)
1.2
(1,1.4
)1.1
(0.9
,1.3
)1.4
(1.2
,1.6
)1.4
(1.2
,1.6
)1.7
(1.5
,1.9
)1.6
(1.4
,1.8
)
5A
-0SW
L–
––
––
––
––
0(0,0)
-0.1
(-0
.2,
0.1
)0.2
(0.1
,0.4
)0.2
(0,0.4
)0.5
(0.3
,0.7
)0.4
(0.2
,0.6
)
5A
-1SW
L–
––
––
––
––
–0
(0,0)
0.3
(0.1
,0.5
)0.3
(0.1
,0.4
)0.6
(0.4
,0.7
)0.5
(0.3
,0.7
)
5A
-2SW
L–
––
––
––
––
––
0(0,0)
0(-0
.2,0.2
)0.3
(0.1
,0.5
)0.2
(0,0.4
)
5A
-3SW
L–
––
––
––
––
––
–0
(0,0)
0.3
(0.1
,0.5
)0.2
(0,0.4
)
5A
-4SW
L–
––
––
––
––
––
––
0(0,0)
-0.1
(-0
.3,
0.1
)5A
-5SW
L–
––
––
––
––
––
––
–0
(0,0)
Tab
leG
.10:
Reh
abil
itat
ion
resu
lts
for
vary
ing
the
nu
mb
erof
short
wait
ing
list
faci
liti
eson
the
nu
mb
erof
die
din
hosp
ital
pati
ents

Appendix H
Pairwise comparison charts - updating
short waiting lists daily
96

Appendix H. Pairwise comparison charts - updating short waiting lists daily 97
3A
-2SW
L60
3A
-3SW
L60
4A
-3SW
L60
4A
-4SW
L60
5A
-4SW
L60
5A
-5SW
L60
3A
-2SW
LD
3A
-3SW
LD
4A
-3SW
LD
4A
-4SW
LD
5A
-4SW
LD
5A
-5SW
LD
3A
-2SW
L60
0(0,0)
13.9
(3.9
,23.9
)171.2
(156.6
,185.9
)N/A
N/A
N/A
0.5
(-5
.5,6.6
)41.1
(28,54.1
)176.9
(163.2
,190.5
)N/A
N/A
N/A
3A
-3SW
L60
–0
(0,0)
157.3
(142.5
,172.1
)N/A
N/A
N/A
-13.4
(-23.2
,-3.5
)27.1
(13.6
,40.7
)162.9
(149,
176.9
)N/A
N/A
N/A
4A
-3SW
L60
––
0(0,0)
N/A
N/A
N/A
-170.7
(-184.5
,-156.9
)-130.2
(-147.6
,-112.7
)5.6
(-2
.6,13.9
)N/A
N/A
N/A
4A
-4SW
L60
––
–N/A
N/A
N/A
N/A
N/A
N/A
N/A
N/A
N/A
5A
-4SW
L60
––
––
N/A
N/A
N/A
N/A
N/A
N/A
N/A
N/A
5A
-5SW
L60
––
––
–N/A
N/A
N/A
N/A
N/A
N/A
N/A
3A
-2SW
LD
––
––
––
0(0,0)
40.5
(27.7
,53.4
)176.3
(163.1
,189.5
)N/A
N/A
N/A
3A
-3SW
LD
––
––
––
–0
(0,0)
135.8
(118.6
,153)
N/A
N/A
N/A
4A
-3SW
LD
––
––
––
––
0(0,0)
N/A
N/A
N/A
4A
-4SW
LD
––
––
––
––
–N/A
N/A
N/A
5A
-4SW
LD
––
––
––
––
––
N/A
N/A
5A
-5SW
LD
––
––
––
––
––
–N/A
Tab
leH
.1:
CC
Cre
sult
sfo
ru
pd
atin
gth
esh
ort
wait
ing
list
sd
ail
y(D
)co
mp
are
dto
the
up
dati
ng
ever
y60
day
s(6
0)
on
the
nu
mb
erof
AL
Cd
ays
3A
-2SW
L60
3A
-3SW
L60
4A
-3SW
L60
4A
-4SW
L60
5A
-4SW
L60
5A
-5SW
L60
3A
-2SW
LD
3A
-3SW
LD
4A
-3SW
LD
4A
-4SW
LD
5A
-4SW
LD
5A
-5SW
LD
3A
-2SW
L60
0(0,0)
0(-0
.1,0.1
)0.4
(0.3
,0.5
)N/A
N/A
N/A
-0.1
(-0
.1,0)
0.1
(0,0.2
)0.5
(0.4
,0.6
)N/A
N/A
N/A
3A
-3SW
L60
–0
(0,0)
0.4
(0.3
,0.5
)N/A
N/A
N/A
0(-0
.1,0.1
)0.1
(0,0.2
)0.5
(0.4
,0.6
)N/A
N/A
N/A
4A
-3SW
L60
––
0(0,0)
N/A
N/A
N/A
-0.5
(-0.6
,-0.4
)-0.3
(-0.4
,-0.2
)0.1
(0,0.2
)N/A
N/A
N/A
4A
-4SW
L60
––
–N/A
N/A
N/A
N/A
N/A
N/A
N/A
N/A
N/A
5A
-4SW
L60
––
––
N/A
N/A
N/A
N/A
N/A
N/A
N/A
N/A
5A
-5SW
L60
––
––
–N/A
N/A
N/A
N/A
N/A
N/A
N/A
3A
-2SW
LD
––
––
––
0(0,0)
0.1
(0,0.2
)0.6
(0.5
,0.6
)N/A
N/A
N/A
3A
-3SW
LD
––
––
––
–0
(0,0)
0.4
(0.3
,0.5
)N/A
N/A
N/A
4A
-3SW
LD
––
––
––
––
0(0,0)
N/A
N/A
N/A
4A
-4SW
LD
––
––
––
––
–N/A
N/A
N/A
5A
-4SW
LD
––
––
––
––
––
N/A
N/A
5A
-5SW
LD
––
––
––
––
––
–N/A
Tab
leH
.2:
CC
Cre
sult
sfo
ru
pd
atin
gth
esh
ort
wai
tin
gli
sts
dail
y(D
)co
mp
are
dto
the
up
dati
ng
ever
y60
day
s(6
0)
on
the
nu
mb
erof
die
din
hosp
ital
pati
ents
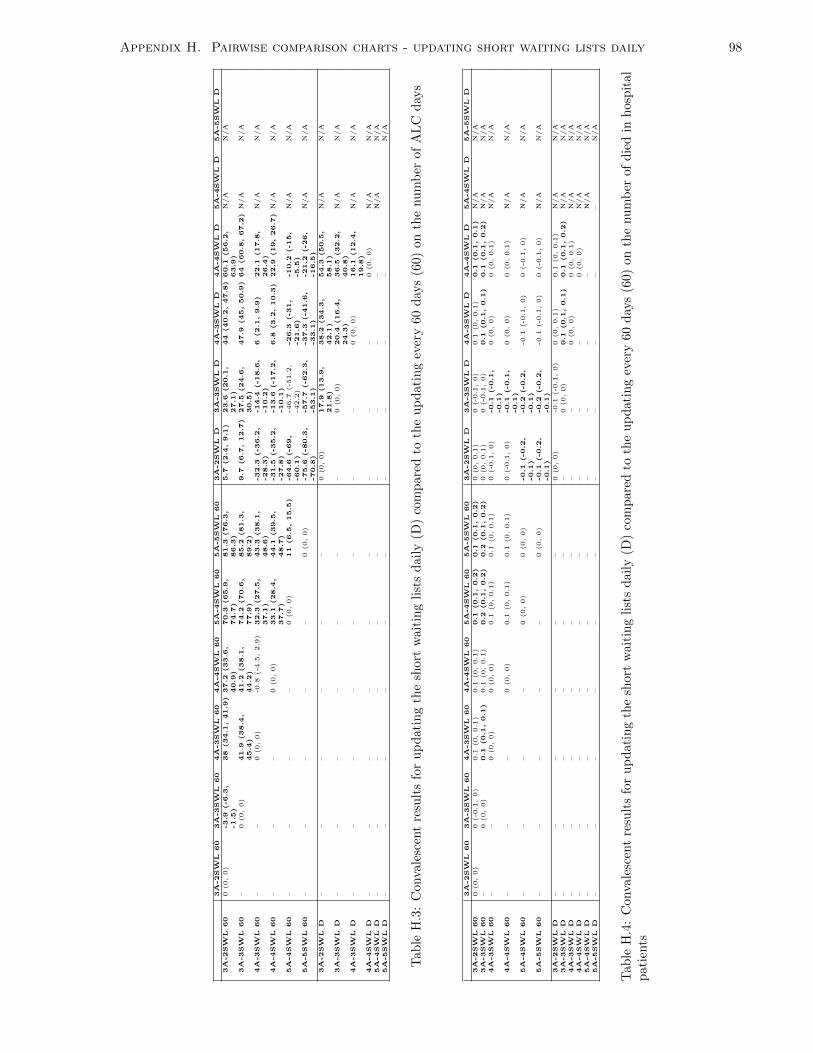
Appendix H. Pairwise comparison charts - updating short waiting lists daily 98
3A
-2SW
L60
3A
-3SW
L60
4A
-3SW
L60
4A
-4SW
L60
5A
-4SW
L60
5A
-5SW
L60
3A
-2SW
LD
3A
-3SW
LD
4A
-3SW
LD
4A
-4SW
LD
5A
-4SW
LD
5A
-5SW
LD
3A
-2SW
L60
0(0,0)
-3.9
(-6.3
,-1.5
)38
(34.1
,41.9
)37.2
(33.6
,40.9
)70.3
(65.9
,74.7
)81.3
(76.3
,86.3
)5.7
(2.4
,9.1
)23.6
(20.1
,27.1
)44
(40.2
,47.8
)60.1
(56.2
,63.9
)N/A
N/A
3A
-3SW
L60
–0
(0,0)
41.9
(38.4
,45.4
)41.2
(38.1
,44.2
)74.2
(70.6
,77.9
)85.2
(81.3
,89.2
)9.7
(6.7
,12.7
)27.5
(24.6
,30.5
)47.9
(45,50.9
)64
(60.8
,67.2
)N/A
N/A
4A
-3SW
L60
––
0(0,0)
-0.8
(-4
.5,2.9
)32.3
(27.5
,37.1
)43.3
(38.1
,48.6
)-32.3
(-36.2
,-28.3
)-14.4
(-18.6
,-10.2
)6
(2.1
,9.9
)22.1
(17.8
,26.4
)N/A
N/A
4A
-4SW
L60
––
–0
(0,0)
33.1
(28.4
,37.7
)44.1
(39.5
,48.7
)-31.5
(-35.2
,-27.8
)-13.6
(-17.2
,-10.1
)6.8
(3.2
,10.3
)22.9
(19,26.7
)N/A
N/A
5A
-4SW
L60
––
––
0(0,0)
11
(6.5
,15.5
)-64.6
(-69,
-60.1
)-4
6.7
(-5
1.2
,-4
2.2
)-26.3
(-31,
-21.6
)-10.2
(-15,
-5.5
)N/A
N/A
5A
-5SW
L60
––
––
–0
(0,0)
-75.6
(-80.3
,-70.8
)-57.7
(-62.3
,-53.1
)-37.3
(-41.6
,-33.1
)-21.2
(-26,
-16.5
)N/A
N/A
3A
-2SW
LD
––
––
––
0(0,0)
17.9
(13.9
,21.8
)38.2
(34.3
,42.1
)54.3
(50.5
,58.1
)N/A
N/A
3A
-3SW
LD
––
––
––
–0
(0,0)
20.4
(16.4
,24.3
)36.5
(32.2
,40.8
)N/A
N/A
4A
-3SW
LD
––
––
––
––
0(0,0)
16.1
(12.4
,19.8
)N/A
N/A
4A
-4SW
LD
––
––
––
––
–0
(0,0)
N/A
N/A
5A
-4SW
LD
––
––
––
––
––
N/A
N/A
5A
-5SW
LD
––
––
––
––
––
N/A
Tab
leH
.3:
Con
vale
scen
tre
sult
sfo
ru
pd
atin
gth
esh
ort
wait
ing
list
sd
ail
y(D
)co
mp
are
dto
the
up
dati
ng
ever
y60
day
s(6
0)
on
the
nu
mb
erof
AL
Cd
ays
3A
-2SW
L60
3A
-3SW
L60
4A
-3SW
L60
4A
-4SW
L60
5A
-4SW
L60
5A
-5SW
L60
3A
-2SW
LD
3A
-3SW
LD
4A
-3SW
LD
4A
-4SW
LD
5A
-4SW
LD
5A
-5SW
LD
3A
-2SW
L60
0(0,0)
0(-0
.1,0)
0.1
(0,0.1
)0.1
(0,0.1
)0.1
(0.1
,0.2
)0.1
(0.1
,0.2
)0
(0,0.1
)0
(-0
.1,0)
0.1
(0,0.1
)0.1
(0.1
,0.1
)N/A
N/A
3A
-3SW
L60
–0
(0,0)
0.1
(0.1
,0.1
)0.1
(0,0.1
)0.2
(0.1
,0.2
)0.2
(0.1
,0.2
)0
(0,0.1
)0
(-0
.1,0)
0.1
(0.1
,0.1
)0.1
(0.1
,0.2
)N/A
N/A
4A
-3SW
L60
––
0(0,0)
0(0,0)
0.1
(0,0.1
)0.1
(0,0.1
)0
(-0
.1,0)
-0.1
(-0.1
,-0.1
)0
(0,0)
0(0,0.1
)N/A
N/A
4A
-4SW
L60
––
–0
(0,0)
0.1
(0,0.1
)0.1
(0,0.1
)0
(-0
.1,0)
-0.1
(-0.1
,-0.1
)0
(0,0)
0(0,0.1
)N/A
N/A
5A
-4SW
L60
––
––
0(0,0)
0(0,0)
-0.1
(-0.2
,-0.1
)-0.2
(-0.2
,-0.1
)-0
.1(-0
.1,0)
0(-0
.1,0)
N/A
N/A
5A
-5SW
L60
––
––
–0
(0,0)
-0.1
(-0.2
,-0.1
)-0.2
(-0.2
,-0.1
)-0
.1(-0
.1,0)
0(-0
.1,0)
N/A
N/A
3A
-2SW
LD
––
––
––
0(0,0)
-0.1
(-0
.1,0)
0(0,0.1
)0.1
(0,0.1
)N/A
N/A
3A
-3SW
LD
––
––
––
–0
(0,0)
0.1
(0.1
,0.1
)0.1
(0.1
,0.2
)N/A
N/A
4A
-3SW
LD
––
––
––
––
0(0,0)
0(0,0.1
)N/A
N/A
4A
-4SW
LD
––
––
––
––
–0
(0,0)
N/A
N/A
5A
-4SW
LD
––
––
––
––
––
N/A
N/A
5A
-5SW
LD
––
––
––
––
––
–N/A
Tab
leH
.4:
Con
vale
scen
tre
sult
sfo
ru
pd
atin
gth
esh
ort
wait
ing
list
sd
ail
y(D
)co
mp
are
dto
the
up
dati
ng
ever
y60
day
s(6
0)
on
the
nu
mb
erof
die
din
hosp
ital
pat
ients

Appendix H. Pairwise comparison charts - updating short waiting lists daily 99
3A
-2SW
L60
3A
-3SW
L60
4A
-3SW
L60
4A
-4SW
L60
5A
-4SW
L60
5A
-5SW
L60
3A
-2SW
LD
3A
-3SW
LD
4A
-3SW
LD
4A
-4SW
LD
5A
-4SW
LD
5A
-5SW
LD
3A
-2SW
L60
0(0,0)
58.3
(25.1
,91.5
)528.4
(493.9
,563)
617.2
(579.5
,655)
906.4
(873.9
,938.9
)1000.8
(964.2
,1037.3
)485.1
(449.5
,520.7
)533.1
(497.9
,568.3
)634.1
(595.2
,673)
636.4
(597.5
,675.2
)867.7
(836.8
,898.7
)1023.9
(990.5
,1057.3
)3A
-3SW
L60
–0
(0,0)
470.1
(431,
509.2
)558.9
(517.5
,600.3
)848.1
(810.5
,885.7
)942.4
(901,
983.9
)426.8
(384.2
,469.4
)474.8
(432.5
,517.1
)575.8
(529.6
,622)
578
(532.4
,623.7
)809.4
(772.5
,846.3
)965.6
(928.9
,1002.2
)4A
-3SW
L60
––
0(0,0)
88.8
(63.2
,114.4
)378
(349.6
,406.3
)472.3
(444.9
,499.8
)-43.3
(-73.8
,-12.9
)4.7
(-2
7.4
,36.7
)105.7
(73.3
,138)
107.9
(75.1
,140.7
)339.3
(310.4
,368.1
)495.5
(465.6
,525.3
)4A
-4SW
L60
––
–0
(0,0)
289.2
(259.8
,318.6
)383.5
(355.2
,411.9
)-132.1
(-162.4
,-101.8
)-84.1
(-115.7
,-52.5
)16.9
(-1
5,48.7
)19.1
(-1
2.9
,51.2
)250.5
(221.5
,279.5
)406.7
(375.9
,437.5
)5A
-4SW
L60
––
––
0(0,0)
94.4
(75.8
,113)
-421.3
(-448.5
,-394.1
)-373.3
(-398.6
,-348)
-272.3
(-300.4
,-244.2
)-270
(-298.4
,-241.7
)-38.7
(-61.7
,-15.6
)117.5
(94.1
,141)
5A
-5SW
L60
––
––
–0
(0,0)
-515.6
(-543.7
,-487.6
)-467.6
(-493.7
,-441.6
)-366.7
(-392.6
,-340.8
)-364.4
(-390.5
,-338.3
)-133
(-157.3
,-108.8
)23.2
(-1
.8,48.1
)
3A
-2SW
LD
––
––
––
0(0,0)
48
(25.2
,70.8
)149
(115.3
,182.6
)151.2
(116.7
,185.8
)382.6
(350.6
,414.6
)538.8
(507.8
,569.8
)3A
-3SW
LD
––
––
––
–0
(0,0)
101
(72.2
,129.7
)103.2
(73.6
,132.8
)334.6
(306.4
,362.7
)490.8
(461.4
,520.1
)4A
-3SW
LD
––
––
––
––
0(0,0)
2.3
(-2
.2,6.7
)233.6
(203.6
,263.6
)389.8
(359.1
,420.5
)4A
-4SW
LD
––
––
––
––
–0
(0,0)
231.3
(201,
261.7
)387.5
(356.6
,418.5
)5A
-4SW
LD
––
––
––
––
––
0(0,0)
156.2
(135.1
,177.3
)5A
-5SW
LD
––
––
––
––
––
–0
(0,0)
Tab
leH
.5:
LT
Cre
sult
sfo
ru
pd
atin
gth
esh
ort
wait
ing
list
sdail
y(D
)co
mp
are
dto
the
up
dati
ng
ever
y60
day
s(6
0)
on
the
nu
mb
erof
AL
Cd
ays
3A
-2SW
L60
3A
-3SW
L60
4A
-3SW
L60
4A
-4SW
L60
5A
-4SW
L60
5A
-5SW
L60
3A
-2SW
LD
3A
-3SW
LD
4A
-3SW
LD
4A
-4SW
LD
5A
-4SW
LD
5A
-5SW
LD
3A
-2SW
L60
0(0,0)
0(-0
.2,0.2
)3
(2.8
,3.2
)3.1
(2.8
,3.4
)4.5
(4.2
,4.7
)4.8
(4.5
,5)
0(-0
.2,0.2
)0.3
(0,0.5
)3.1
(2.9
,3.3
)3.2
(2.9
,3.4
)4.3
(4.1
,4.5
)4.8
(4.5
,5)
3A
-3SW
L60
–0
(0,0)
3(2.8
,3.2
)3.1
(2.8
,3.4
)4.5
(4.2
,4.7
)4.8
(4.5
,5)
0(-0
.2,0.2
)0.3
(0,0.5
)3.1
(2.9
,3.4
)3.2
(2.9
,3.4
)4.3
(4.1
,4.6
)4.8
(4.5
,5)
4A
-3SW
L60
––
0(0,0)
0.1
(-0
.2,0.4
)1.5
(1.3
,1.7
)1.8
(1.5
,2)
-3
(-3.2
,-2.8
)-2.8
(-3,-2.5
)0.1
(-0
.1,0.3
)0.2
(-0
.1,0.4
)1.3
(1.1
,1.6
)1.8
(1.5
,2)
4A
-4SW
L60
––
–0
(0,0)
1.4
(1.1
,1.7
)1.6
(1.3
,1.9
)-3.1
(-3.4
,-2.8
)-2.9
(-3.2
,-2.5
)0
(-0
.3,0.3
)0
(-0
.3,0.3
)1.2
(0.9
,1.5
)1.6
(1.3
,1.9
)
5A
-4SW
L60
––
––
0(0,0)
0.3
(0.1
,0.4
)-4.5
(-4.7
,-4.2
)-4.2
(-4.5
,-4)
-1.4
(-1.6
,-1.1
)-1.3
(-1.6
,-1.1
)-0
.2(-0
.3,0)
0.3
(0.1
,0.5
)
5A
-5SW
L60
––
––
–0
(0,0)
-4.8
(-5,-4.5
)-4.5
(-4.8
,-4.2
)-1.6
(-1.9
,-1.4
)-1.6
(-1.8
,-1.4
)-0.4
(-0.6
,-0.2
)0
(-0
.2,0.2
)
3A
-2SW
LD
––
––
––
0(0,0)
0.2
(0,0.5
)3.1
(2.9
,3.4
)3.2
(2.9
,3.4
)4.3
(4.1
,4.6
)4.7
(4.5
,5)
3A
-3SW
LD
––
––
––
–0
(0,0)
2.9
(2.6
,3.1
)2.9
(2.6
,3.2
)4.1
(3.8
,4.3
)4.5
(4.2
,4.8
)4A
-3SW
LD
––
––
––
––
0(0,0)
0(-0
.2,0.3
)1.2
(1,1.5
)1.6
(1.4
,1.9
)4A
-4SW
LD
––
––
––
––
–0
(0,0)
1.2
(1,1.4
)1.6
(1.3
,1.8
)5A
-4SW
LD
––
––
––
––
––
0(0,0)
0.4
(0.2
,0.6
)5A
-5SW
LD
––
––
––
––
––
–0
(0,0)
Tab
leH
.6:
LT
Cre
sult
sfo
ru
pd
atin
gth
esh
ort
wai
tin
glist
sdail
y(D
)co
mp
are
dto
the
up
dati
ng
ever
y60
day
s(6
0)
on
the
nu
mb
erof
die
din
hosp
ital
pati
ents

Appendix H. Pairwise comparison charts - updating short waiting lists daily 100
3A
-2SW
L60
3A
-3SW
L60
4A
-3SW
L60
4A
-4SW
L60
5A
-4SW
L60
5A
-5SW
L60
3A
-2SW
LD
3A
-3SW
LD
4A
-3SW
LD
4A
-4SW
LD
5A
-4SW
LD
5A
-5SW
LD
3A
-2SW
L60
0(0,0)
78.6
(71.7
,85.5
)175.5
(167.8
,183.2
)218.8
(211.2
,226.3
)259.5
(252,
266.9
)285.6
(278.7
,292.6
)-10.2
(-18.5
,-1.8
)88.2
(79.6
,96.9
)171
(162,
179.9
)223.9
(216.8
,230.9
)258
(250.6
,265.4
)292.7
(285.8
,299.5
)3A
-3SW
L60
–0
(0,0)
96.9
(90.5
,103.3
)140.1
(134.3
,146)
180.8
(175.4
,186.3
)207
(201.5
,212.5
)-88.8
(-95.9
,-81.6
)9.6
(2.2
,17)
92.3
(84.7
,99.9
)145.2
(139.7
,150.8
)179.4
(173.6
,185.1
)214
(208.4
,219.6
)4A
-3SW
L60
––
0(0,0)
43.2
(37.9
,48.6
)83.9
(78.2
,89.6
)110.1
(105.2
,115.1
)-185.7
(-192.9
,-178.5
)-87.3
(-94.1
,-80.4
)-4
.6(-1
1.1
,2)
48.3
(43.1
,53.6
)82.5
(77.1
,87.9
)117.1
(112.1
,122.2
)4A
-4SW
L60
––
–0
(0,0)
40.7
(35.4
,46)
66.9
(62.3
,71.4
)-228.9
(-236.6
,-221.2
)-130.5
(-137.6
,-123.4
)-47.8
(-53.9
,-41.6
)5.1
(0.2
,10)
39.2
(34,44.5
)73.9
(69.1
,78.7
)5A
-4SW
L60
––
––
0(0,0)
26.2
(22.4
,30)
-269.6
(-276.7
,-262.5
)-171.2
(-177.8
,-164.6
)-88.5
(-94.6
,-82.4
)-35.6
(-40.2
,-31)
-1.5
(-5
.8,2.9
)33.2
(28.5
,37.9
)5A
-5SW
L60
––
––
–0
(0,0)
-295.8
(-302.4
,-289.2
)-197.4
(-203.6
,-191.1
)-114.7
(-120.3
,-109)
-61.8
(-66.2
,-57.4
)-27.6
(-31.3
,-24)
7(3.2
,10.8
)
3A
-2SW
LD
––
––
––
0(0,0)
98.4
(89.7
,107.1
)181.1
(173.2
,189)
234
(226.9
,241.2
)268.1
(260.8
,275.5
)302.8
(296,
309.6
)3A
-3SW
LD
––
––
––
–0
(0,0)
82.7
(75.2
,90.3
)135.6
(129.3
,142)
169.7
(163.6
,175.9
)204.4
(198.6
,210.2
)4A
-3SW
LD
––
––
––
––
0(0,0)
52.9
(47.1
,58.7
)87
(81.5
,92.6
)121.7
(115.8
,127.6
)4A
-4SW
LD
––
––
––
––
–0
(0,0)
34.1
(29,39.3
)68.8
(64.6
,73)
5A
-4SW
LD
––
––
––
––
––
0(0,0)
34.7
(30.5
,38.8
)5A
-5SW
LD
––
––
––
––
––
–0
(0,0)
Tab
leH
.7:
Pal
liat
ive
resu
lts
for
up
dat
ing
the
short
wait
ing
list
sd
ail
y(D
)co
mp
are
dto
the
up
dati
ng
ever
y60
day
s(6
0)
on
the
nu
mb
erof
AL
Cd
ays
3A
-2SW
L60
3A
-3SW
L60
4A
-3SW
L60
4A
-4SW
L60
5A
-4SW
L60
5A
-5SW
L60
3A
-2SW
LD
3A
-3SW
LD
4A
-3SW
LD
4A
-4SW
LD
5A
-4SW
LD
5A
-5SW
LD
3A
-2SW
L60
0(0,0)
1.4
(1.1
,1.7
)4.6
(4.3
,4.9
)6.3
(5.9
,6.6
)7.7
(7.4
,8)
8.7
(8.4
,8.9
)0.4
(0.1
,0.7
)2.3
(1.9
,2.6
)5.2
(4.9
,5.5
)6.6
(6.3
,7)
8(7.6
,8.3
)11.2
(10.9
,11.5
)3A
-3SW
L60
–0
(0,0)
3.2
(2.9
,3.6
)4.9
(4.5
,5.2
)6.3
(6,6.6
)7.3
(6.9
,7.6
)-1
(-1.3
,-0.7
)0.9
(0.5
,1.2
)3.8
(3.5
,4.1
)5.2
(4.9
,5.5
)6.5
(6.2
,6.9
)9.8
(9.5
,10.1
)4A
-3SW
L60
––
0(0,0)
1.6
(1.3
,1.9
)3.1
(2.8
,3.4
)4
(3.7
,4.3
)-4.2
(-4.5
,-3.9
)-2.4
(-2.7
,-2)
0.6
(0.3
,0.9
)2
(1.7
,2.3
)3.3
(3,3.6
)6.6
(6.4
,6.7
)
4A
-4SW
L60
––
–0
(0,0)
1.5
(1.1
,1.8
)2.4
(2.1
,2.7
)-5.9
(-6.2
,-5.5
)-4
(-4.3
,-3.6
)-1
(-1.4
,-0.7
)0.4
(0.1
,0.7
)1.7
(1.3
,2)
5(4.7
,5.2
)
5A
-4SW
L60
––
––
0(0,0)
0.9
(0.7
,1.2
)-7.3
(-7.6
,-7)
-5.5
(-5.8
,-5.1
)-2.5
(-2.8
,-2.2
)-1.1
(-1.4
,-0.8
)0.2
(-0
.1,0.5
)3.5
(3.2
,3.7
)
5A
-5SW
L60
––
––
–0
(0,0)
-8.3
(-8.5
,-8)
-6.4
(-6.7
,-6.1
)-3.5
(-3.8
,-3.1
)-2
(-2.3
,-1.7
)-0.7
(-1,-0.4
)2.5
(2.2
,2.8
)
3A
-2SW
LD
––
––
––
0(0,0)
1.9
(1.6
,2.2
)4.8
(4.5
,5.1
)6.2
(6,6.5
)7.6
(7.3
,7.8
)10.8
(10.6
,11)
3A
-3SW
LD
––
––
––
–0
(0,0)
2.9
(2.6
,3.3
)4.4
(4,4.7
)5.7
(5.3
,6)
8.9
(8.6
,9.2
)4A
-3SW
LD
––
––
––
––
0(0,0)
1.4
(1.1
,1.7
)2.7
(2.4
,3.1
)6
(5.7
,6.3
)4A
-4SW
LD
––
––
––
––
–0
(0,0)
1.3
(1,1.6
)4.6
(4.3
,4.8
)5A
-4SW
LD
––
––
––
––
––
0(0,0)
3.3
(3,3.5
)5A
-5SW
LD
––
––
––
––
––
–0
(0,0)
Tab
leH
.8:
Pal
liat
ive
resu
lts
for
up
dat
ing
the
shor
tw
ait
ing
list
sd
ail
y(D
)co
mp
are
dto
the
up
dati
ng
ever
y60
day
s(6
0)
on
the
nu
mb
erof
die
din
hosp
ital
pat
ients

Appendix H. Pairwise comparison charts - updating short waiting lists daily 101
3A
-2SW
L60
3A
-3SW
L60
4A
-3SW
L60
4A
-4SW
L60
5A
-4SW
L60
5A
-5SW
L60
3A
-2SW
LD
3A
-3SW
LD
4A
-3SW
LD
4A
-4SW
LD
5A
-4SW
LD
5A
-5SW
LD
3A
-2SW
L60
0(0,0)
139.2
(124.4
,154)
313.5
(301.3
,325.8
)386.7
(375.3
,398.1
)535.8
(525.3
,546.3
)581.2
(570.1
,592.2
)-9
.2(-2
0.4
,2.1
)130.4
(119.3
,141.5
)323.1
(311.7
,334.5
)404
(392.5
,415.5
)545.2
(535.7
,554.6
)N/A
3A
-3SW
L60
–0
(0,0)
174.3
(161.2
,187.4
)247.5
(234.9
,260.1
)396.6
(383.9
,409.3
)441.9
(430.1
,453.7
)-148.4
(-160.8
,-136)
-8.8
(-2
1.3
,3.7
)183.9
(171.8
,195.9
)264.8
(252.5
,277)
405.9
(393.9
,417.9
)N/A
4A
-3SW
L60
––
0(0,0)
73.2
(61.8
,84.6
)222.3
(212.6
,232.1
)267.7
(256.7
,278.6
)-322.7
(-334,
-311.4
)-183.1
(-194.5
,-171.7
)9.6
(-1
,20.2
)90.5
(80.4
,100.5
)231.6
(222,
241.3
)N/A
4A
-4SW
L60
––
–0
(0,0)
149.1
(139.4
,158.9
)194.5
(184.9
,204)
-395.9
(-405.9
,-385.8
)-256.3
(-266.3
,-246.3
)-63.6
(-72.7
,-54.5
)17.3
(7.8
,26.8
)158.4
(149.2
,167.7
)N/A
5A
-4SW
L60
––
––
0(0,0)
45.3
(36.9
,53.7
)-545
(-554.2
,-535.8
)-405.4
(-414.8
,-396.1
)-212.8
(-221.9
,-203.6
)-131.8
(-140.3
,-123.4
)9.3
(1.6
,17)
N/A
5A
-5SW
L60
––
––
–0
(0,0)
-590.3
(-599.8
,-580.9
)-450.7
(-461.7
,-439.8
)-258.1
(-267.7
,-248.4
)-177.2
(-186.6
,-167.7
)-36
(-44.1
,-27.9
)N/A
3A
-2SW
LD
––
––
––
0(0,0)
139.6
(128.8
,150.4
)332.3
(322.7
,341.9
)413.2
(402.8
,423.5
)554.3
(545.6
,563.1
)N/A
3A
-3SW
LD
––
––
––
0(0,0)
192.7
(182.5
,202.8
)273.6
(263.1
,284)
414.7
(405,
424.4
)N/A
4A
-3SW
LD
––
––
––
–0
(0,0)
80.9
(71.9
,89.9
)222.1
(213.6
,230.5
)N/A
4A
-4SW
LD
––
––
––
––
0(0,0)
141.2
(133.1
,149.2
)N/A
5A
-4SW
LD
––
––
––
––
–0
(0,0)
N/A
5A
-5SW
LD
––
––
––
––
––
N/A
Tab
leH
.9:
Reh
abil
itat
ion
resu
lts
for
up
dat
ing
the
short
wait
ing
list
sd
ail
y(D
)co
mp
are
dto
the
up
dati
ng
ever
y60
day
s(6
0)
on
the
nu
mb
erof
AL
Cd
ays
3A
-2SW
L60
3A
-3SW
L60
4A
-3SW
L60
4A
-4SW
L60
5A
-4SW
L60
5A
-5SW
L60
3A
-2SW
LD
3A
-3SW
LD
4A
-3SW
LD
4A
-4SW
LD
5A
-4SW
LD
5A
-5SW
LD
3A
-2SW
L60
0(0,0)
0.5
(0.2
,0.8
)2.9
(2.7
,3.2
)3.2
(2.9
,3.5
)4.8
(4.6
,5.1
)4.7
(4.4
,4.9
)-0
.2(-0
.5,0.2
)0.2
(-0
.2,0.5
)3.3
(3,3.6
)2.9
(2.6
,3.2
)4.7
(4.4
,4.9
)N/A
3A
-3SW
L60
–0
(0,0)
2.4
(2.2
,2.7
)2.7
(2.4
,3)
4.3
(4,4.6
)4.1
(3.9
,4.4
)-0.7
(-1,-0.3
)-0
.4(-0
.7,0)
2.8
(2.5
,3.1
)2.4
(2.1
,2.7
)4.1
(3.9
,4.4
)N/A
4A
-3SW
L60
––
0(0,0)
0.3
(0,0.6
)1.9
(1.7
,2.1
)1.7
(1.5
,1.9
)-3.1
(-3.4
,-2.8
)-2.8
(-3.1
,-2.5
)0.4
(0.1
,0.6
)0
(-0
.2,0.3
)1.7
(1.5
,2)
N/A
4A
-4SW
L60
––
–0
(0,0)
1.6
(1.4
,1.8
)1.4
(1.2
,1.7
)-3.4
(-3.7
,-3.1
)-3.1
(-3.4
,-2.8
)0.1
(-0
.2,0.3
)-0
.3(-0
.6,0)
1.4
(1.2
,1.7
)N/A
5A
-4SW
L60
––
––
0(0,0)
-0.2
(-0
.4,0)
-5
(-5.3
,-4.7
)-4.7
(-4.9
,-4.4
)-1.5
(-1.8
,-1.3
)-1.9
(-2.1
,-1.7
)-0
.2(-0
.4,0)
N/A
5A
-5SW
L60
––
––
–0
(0,0)
-4.8
(-5.1
,-4.5
)-4.5
(-4.8
,-4.2
)-1.4
(-1.6
,-1.1
)-1.7
(-2,-1.5
)0
(-0
.2,0.2
)N/A
3A
-2SW
LD
––
––
––
0(0,0)
0.3
(0,0.7
)3.5
(3.2
,3.7
)3.1
(2.8
,3.4
)4.8
(4.5
,5.1
)N/A
3A
-3SW
LD
––
––
––
–0
(0,0)
3.1
(2.8
,3.4
)2.8
(2.5
,3.1
)4.5
(4.2
,4.8
)N/A
4A
-3SW
LD
––
––
––
––
0(0,0)
-0.4
(-0.6
,-0.1
)1.4
(1.1
,1.6
)N/A
4A
-4SW
LD
––
––
––
––
–0
(0,0)
1.7
(1.5
,2)
N/A
5A
-4SW
LD
––
––
––
––
––
0(0,0)
N/A
5A
-5SW
LD
––
––
––
––
––
–N/A
Tab
leH
.10:
Reh
abil
itat
ion
resu
lts
for
up
dat
ing
the
short
wait
ing
list
sd
ail
y(D
)co
mp
are
dto
the
up
dati
ng
ever
y60
day
s(6
0)
on
the
nu
mb
erof
die
din
hosp
ital
pat
ients

Appendix I
Pairwise comparison charts - varying
the definition of a short waiting list
102

Appendix I. Pairwise comparison charts - varying the definition of a short waiting list103
3A
-3
SW
L10
days
3A
-3
SW
L16
days
3A
-3
SW
L25
days
4A
-4
SW
L10
days
4A
-4
SW
L16
days
4A
-4
SW
L25
days
5A
-5
SW
L10
days
5A
-5
SW
L16
days
5A
-5
SW
L25
days
3A
-3
SW
L10
days
0(0,0)
1(-1
.8,3.8
)1
(-1
.8,3.8
)N/A
N/A
N/A
N/A
N/A
N/A
3A
-3
SW
L16
days
–0
(0,0)
-0.1
(-0
.1,0)
N/A
N/A
N/A
N/A
N/A
N/A
3A
-3
SW
L25
days
––
0(0,0)
N/A
N/A
N/A
N/A
N/A
N/A
4A
-4
SW
L10
days
––
–N/A
N/A
N/A
N/A
N/A
N/A
4A
-4
SW
L16
days
––
––
N/A
N/A
N/A
N/A
N/A
4A
-4
SW
L25
days
––
––
–N/A
N/A
N/A
N/A
5A
-5
SW
L10
days
––
––
––
N/A
N/A
N/A
5A
-5
SW
L16
days
––
––
––
–N/A
N/A
5A
-5
SW
L25
days
––
––
––
––
N/A
Tab
leI.
1:C
CC
resu
lts
for
vary
ing
the
defi
nit
ion
ofa
short
wait
ing
list
bet
wee
n10,
16
an
d25
day
son
the
dis
charg
ep
oli
cysc
enari
os
wit
ha
hig
hnu
mb
erof
faci
liti
esw
ith
ash
ort
wai
tin
gli
stre
qu
ired
onth
enu
mb
erof
AL
Cd
ays
3A
-3
SW
L10
days
3A
-3
SW
L16
days
3A
-3
SW
L25
days
4A
-4
SW
L10
days
4A
-4
SW
L16
days
4A
-4
SW
L25
days
5A
-5
SW
L10
days
5A
-5
SW
L16
days
5A
-5
SW
L25
days
3A
-3
SW
L10
days
0(0,0)
0(0,0)
0(0,0)
N/A
N/A
N/A
N/A
N/A
N/A
3A
-3
SW
L16
days
–0
(0,0)
0(0,0)
N/A
N/A
N/A
N/A
N/A
N/A
3A
-3
SW
L25
days
––
0(0,0)
N/A
N/A
N/A
N/A
N/A
N/A
4A
-4
SW
L10
days
––
–N/A
N/A
N/A
N/A
N/A
N/A
4A
-4
SW
L16
days
––
––
N/A
N/A
N/A
N/A
N/A
4A
-4
SW
L25
days
––
––
–N/A
N/A
N/A
N/A
5A
-5
SW
L10
days
––
––
––
N/A
N/A
N/A
5A
-5
SW
L16
days
––
––
––
–N/A
N/A
5A
-5
SW
L25
days
––
––
––
––
N/A
Tab
leI.
2:C
CC
resu
lts
for
vary
ing
the
defi
nit
ion
ofa
short
wait
ing
list
bet
wee
n10,
16
an
d25
day
son
the
dis
charg
ep
oli
cysc
enari
os
wit
ha
hig
hnu
mb
erof
faci
liti
esw
ith
ash
ort
wai
tin
gli
stre
qu
ired
onth
enu
mb
erof
die
din
hosp
ital
pati
ents

Appendix I. Pairwise comparison charts - varying the definition of a short waiting list104
3A
-3
SW
L10
days
3A
-3
SW
L16
days
3A
-3
SW
L25
days
4A
-4
SW
L10
days
4A
-4
SW
L16
days
4A
-4
SW
L25
days
5A
-5
SW
L10
days
5A
-5
SW
L16
days
5A
-5
SW
L25
days
3A
-3
SW
L10
days
0(0,0)
0(-0
.6,0.6
)-1
.1(-2
.3,0.1
)45.1
(41.1
,49.2
)41.1
(38.1
,44.1
)39.3
(36,42.6
)95.9
(92.1
,99.8
)85.2
(81.3
,89.2
)79.7
(75.9
,83.5
)3A
-3
SW
L16
days
–0
(0,0)
-1.1
(-2
.2,0)
45.2
(41.1
,49.2
)41.2
(38.1
,44.2
)39.3
(35.9
,42.6
)96
(92.1
,99.8
)85.2
(81.3
,89.2
)79.7
(75.9
,83.5
)3A
-3
SW
L25
days
––
0(0,0)
46.2
(42.2
,50.2
)42.2
(39.2
,45.3
)40.4
(37,43.7
)97
(93.1
,101)
86.3
(82.3
,90.3
)80.8
(76.9
,84.7
)
4A
-4
SW
L10
days
––
–0
(0,0)
-4
(-6.8
,-1.2
)-5.9
(-9.7
,-2.1
)50.8
(45.5
,56.1
)40.1
(34.9
,45.3
)34.5
(29.8
,39.3
)4A
-4
SW
L16
days
––
––
0(0,0)
-1.9
(-4
.6,0.8
)54.8
(50.6
,59)
44.1
(39.5
,48.7
)38.5
(34.5
,42.6
)4A
-4
SW
L25
days
––
––
–0
(0,0)
56.7
(51.7
,61.6
)46
(40.9
,51)
40.4
(35.9
,45)
5A
-5
SW
L10
days
––
––
––
0(0,0)
-10.7
(-14.4
,-7)
-16.3
(-20.7
,-11.8
)5A
-5
SW
L16
days
––
––
––
–0
(0,0)
-5.5
(-8.9
,-2.2
)5A
-5
SW
L25
days
––
––
––
––
0(0,0)
Tab
leI.
3:C
onva
lesc
ent
resu
lts
for
vary
ing
the
defi
nit
ion
of
ash
ort
wait
ing
list
bet
wee
n10,
16
an
d25
day
son
the
dis
charg
ep
oli
cysc
enari
os
wit
ha
hig
hnu
mb
erof
faci
liti
esw
ith
ash
ort
wai
tin
gli
stre
qu
ired
on
the
nu
mb
erof
AL
Cd
ays
3A
-3
SW
L10
days
3A
-3
SW
L16
days
3A
-3
SW
L25
days
4A
-4
SW
L10
days
4A
-4
SW
L16
days
4A
-4
SW
L25
days
5A
-5
SW
L10
days
5A
-5
SW
L16
days
5A
-5
SW
L25
days
3A
-3
SW
L10
days
0(0,0)
0(-0
.1,0)
0(0,0)
0.1
(0,0.1
)0.1
(0,0.1
)0.1
(0,0.1
)-0.4
(-0.5
,-0.4
)0.1
(0.1
,0.2
)0.2
(0.1
,0.2
)3A
-3
SW
L16
days
–0
(0,0)
0(0,0.1
)0.1
(0,0.1
)0.1
(0,0.1
)0.1
(0,0.1
)-0.4
(-0.4
,-0.4
)0.2
(0.1
,0.2
)0.2
(0.1
,0.2
)3A
-3
SW
L25
days
––
0(0,0)
0(0,0.1
)0
(0,0.1
)0
(0,0.1
)-0.5
(-0.5
,-0.4
)0.1
(0.1
,0.2
)0.1
(0.1
,0.2
)
4A
-4
SW
L10
days
––
–0
(0,0)
0(0,0)
0(0,0)
-0.5
(-0.5
,-0.5
)0.1
(0,0.1
)0.1
(0.1
,0.1
)4A
-4
SW
L16
days
––
––
0(0,0)
0(0,0)
-0.5
(-0.5
,-0.5
)0.1
(0,0.1
)0.1
(0.1
,0.1
)4A
-4
SW
L25
days
––
––
–0
(0,0)
-0.5
(-0.5
,-0.5
)0.1
(0,0.1
)0.1
(0.1
,0.1
)
5A
-5
SW
L10
days
––
––
––
0(0,0)
0.6
(0.5
,0.6
)0.6
(0.6
,0.6
)5A
-5
SW
L16
days
––
––
––
–0
(0,0)
0(0,0)
5A
-5
SW
L25
days
––
––
––
––
0(0,0)
Tab
leI.
4:C
onva
lesc
ent
resu
lts
for
vary
ing
the
defi
nit
ion
of
ash
ort
wait
ing
list
bet
wee
n10,
16
an
d25
day
son
the
dis
charg
ep
oli
cysc
enari
os
wit
ha
hig
hnu
mb
erof
faci
liti
esw
ith
ash
ort
wai
tin
gli
stre
qu
ired
on
the
nu
mb
erof
die
din
hosp
ital
pati
ents

Appendix I. Pairwise comparison charts - varying the definition of a short waiting list105
3A
-3
SW
L10
days
3A
-3
SW
L16
days
3A
-3
SW
L25
days
4A
-4
SW
L10
days
4A
-4
SW
L16
days
4A
-4
SW
L25
days
5A
-5
SW
L10
days
5A
-5
SW
L16
days
5A
-5
SW
L25
days
3A
-3
SW
L10
days
0(0,0)
3.2
(-3
1.7
,38.1
)28.3
(5.8
,50.7
)530.6
(497.3
,563.9
)562.1
(527,597.2
)566.1
(532,600.3
)917.5
(883.1
,952)
945.6
(911.8
,979.4
)911.4
(876,946.8
)
3A
-3
SW
L16
days
–0
(0,0)
25.1
(-1
2.7
,62.9
)527.4
(489.1
,565.7
)558.9
(517.5
,600.3
)563
(521.3
,604.6
)914.3
(873.7
,955)
942.4
(901,983.9
)908.2
(868.6
,947.9
)3A
-3
SW
L25
days
––
0(0,0)
502.3
(465.2
,539.5
)533.8
(496.8
,570.8
)537.9
(502.3
,573.5
)889.3
(853.7
,924.8
)917.4
(882.5
,952.2
)883.1
(845.6
,920.7
)
4A
-4
SW
L10
days
––
–0
(0,0)
31.5
(4.2
,58.8
)35.6
(14.3
,56.8
)386.9
(358.2
,415.7
)415
(388.8
,441.3
)380.8
(351.3
,410.3
)4A
-4
SW
L16
days
––
––
0(0,0)
4.1
(-2
4.5
,32.6
)355.4
(326.3
,384.6
)383.5
(355.2
,411.9
)349.3
(316.8
,381.9
)4A
-4
SW
L25
days
––
––
–0
(0,0)
351.4
(322.3
,380.5
)379.5
(355.1
,403.9
)345.3
(316.8
,373.8
)
5A
-5
SW
L10
days
––
––
––
0(0,0)
28.1
(1.5
,54.7
)-6
.1(-2
6.5
,14.2
)5A
-5
SW
L16
days
––
––
––
–0
(0,0)
-34.2
(-57.8
,-10.7
)5A
-5
SW
L25
days
––
––
––
––
0(0,0)
Tab
leI.
5:LT
Cre
sult
sfo
rva
ryin
gth
ed
efin
itio
nof
ash
ort
wait
ing
list
bet
wee
n10,
16
an
d25
day
son
the
dis
charg
ep
oli
cysc
enari
os
wit
ha
hig
hnu
mb
erof
faci
liti
esw
ith
ash
ort
wai
tin
gli
stre
qu
ired
onth
enu
mb
erof
AL
Cd
ays
3A
-3
SW
L10
days
3A
-3
SW
L16
days
3A
-3
SW
L25
days
4A
-4
SW
L10
days
4A
-4
SW
L16
days
4A
-4
SW
L25
days
5A
-5
SW
L10
days
5A
-5
SW
L16
days
5A
-5
SW
L25
days
3A
-3
SW
L10
days
0(0,0)
-0.3
(-0
.5,0)
0(-0
.1,0.2
)2.9
(2.6
,3.2
)2.7
(2.4
,2.9
)2.9
(2.7
,3.2
)2.5
(2.3
,2.7
)4.5
(4.3
,4.7
)4.6
(4.4
,4.9
)3A
-3
SW
L16
days
–0
(0,0)
0.3
(0.1
,0.5
)3.2
(2.9
,3.4
)2.9
(2.6
,3.2
)3.2
(2.9
,3.5
)2.8
(2.6
,3)
4.8
(4.5
,5)
4.9
(4.6
,5.1
)3A
-3
SW
L25
days
––
0(0,0)
2.9
(2.6
,3.2
)2.6
(2.4
,2.9
)2.9
(2.7
,3.2
)2.5
(2.3
,2.7
)4.5
(4.2
,4.7
)4.6
(4.3
,4.9
)
4A
-4
SW
L10
days
––
–0
(0,0)
-0.2
(-0
.5,0)
0(-0
.1,0.2
)-0.4
(-0.6
,-0.2
)1.6
(1.3
,1.8
)1.7
(1.5
,2)
4A
-4
SW
L16
days
––
––
0(0,0)
0.3
(0.1
,0.5
)-0
.2(-0
.4,0)
1.8
(1.6
,2.1
)2
(1.7
,2.2
)4A
-4
SW
L25
days
––
––
–0
(0,0)
-0.4
(-0.6
,-0.3
)1.6
(1.3
,1.8
)1.7
(1.4
,1.9
)
5A
-5
SW
L10
days
––
––
––
0(0,0)
2(1.9
,2.1
)2.1
(1.9
,2.3
)5A
-5
SW
L16
days
––
––
––
–0
(0,0)
0.1
(-0
.1,0.3
)5A
-5
SW
L25
days
––
––
––
––
0(0,0)
Tab
leI.
6:LT
Cre
sult
sfo
rva
ryin
gth
ed
efin
itio
nof
ash
ort
wait
ing
list
bet
wee
n10,
16
an
d25
day
son
the
dis
charg
ep
oli
cysc
enari
os
wit
ha
hig
hnu
mb
erof
faci
liti
esw
ith
ash
ort
wai
tin
gli
stre
qu
ired
onth
enu
mb
erof
die
din
hosp
ital
pati
ents

Appendix I. Pairwise comparison charts - varying the definition of a short waiting list106
3A
-3
SW
L10
days
3A
-3
SW
L16
days
3A
-3
SW
L25
days
4A
-4
SW
L10
days
4A
-4
SW
L16
days
4A
-4
SW
L25
days
5A
-5
SW
L10
days
5A
-5
SW
L16
days
5A
-5
SW
L25
days
3A
-3
SW
L10
days
0(0,0)
0.4
(-5
.7,6.4
)-10.7
(-16.6
,-4.8
)140.7
(134.1
,147.4
)140.5
(133.9
,147.1
)131.6
(125.1
,138.1
)210
(204.2
,215.8
)207.4
(201.2
,213.6
)203.1
(197.1
,209)
3A
-3
SW
L16
days
–0
(0,0)
-11.1
(-16.3
,-5.9
)140.4
(134.4
,146.3
)140.1
(134.3
,146)
131.2
(125.7
,136.8
)209.6
(204,215.2
)207
(201.5
,212.5
)202.7
(196.6
,208.8
)3A
-3
SW
L25
days
––
0(0,0)
151.5
(146.1
,156.8
)151.2
(145.2
,157.2
)142.3
(136.1
,148.5
)220.7
(215,226.5
)218.1
(212.8
,223.4
)213.8
(208.4
,219.2
)
4A
-4
SW
L10
days
––
–0
(0,0)
-0.3
(-4
.6,4.1
)-9.2
(-14.1
,-4.2
)69.3
(64.1
,74.5
)66.6
(62.3
,71)
62.3
(57.2
,67.4
)4A
-4
SW
L16
days
––
––
0(0,0)
-8.9
(-13.4
,-4.4
)69.5
(64.6
,74.5
)66.9
(62.3
,71.4
)62.6
(57.4
,67.8
)4A
-4
SW
L25
days
––
––
–0
(0,0)
78.4
(73.5
,83.3
)75.8
(70.8
,80.8
)71.5
(65.8
,77.2
)
5A
-5
SW
L10
days
––
––
––
0(0,0)
-2.6
(-6
,0.8
)-7
(-10.7
,-3.2
)5A
-5
SW
L16
days
––
––
––
–0
(0,0)
-4.3
(-7.8
,-0.8
)5A
-5
SW
L25
days
––
––
––
––
0(0,0)
Tab
leI.
7:P
alli
ativ
ere
sult
sfo
rva
ryin
gth
ed
efin
itio
nof
ash
ort
wait
ing
list
bet
wee
n10,
16
an
d25
day
son
the
dis
charg
ep
oli
cysc
enari
os
wit
ha
hig
hnu
mb
erof
faci
liti
esw
ith
ash
ort
wai
tin
gli
stre
qu
ired
onth
enu
mb
erof
AL
Cd
ays
3A
-3
SW
L10
days
3A
-3
SW
L16
days
3A
-3
SW
L25
days
4A
-4
SW
L10
days
4A
-4
SW
L16
days
4A
-4
SW
L25
days
5A
-5
SW
L10
days
5A
-5
SW
L16
days
5A
-5
SW
L25
days
3A
-3
SW
L10
days
0(0,0)
-0.4
(-0.8
,-0.1
)-0.4
(-0.7
,-0.2
)4.5
(4.2
,4.8
)4.4
(4.1
,4.7
)4.5
(4.2
,4.8
)2.4
(2.2
,2.6
)6.8
(6.5
,7.1
)7
(6.7
,7.3
)3A
-3
SW
L16
days
–0
(0,0)
0(-0
.3,0.3
)5
(4.6
,5.3
)4.9
(4.5
,5.2
)4.9
(4.6
,5.2
)2.8
(2.6
,3.1
)7.3
(6.9
,7.6
)7.4
(7.1
,7.8
)3A
-3
SW
L25
days
––
0(0,0)
5(4.7
,5.3
)4.9
(4.5
,5.2
)4.9
(4.6
,5.3
)2.8
(2.6
,3.1
)7.3
(6.9
,7.6
)7.4
(7.1
,7.7
)
4A
-4
SW
L10
days
––
–0
(0,0)
-0.1
(-0
.4,0.2
)0
(-0
.4,0.3
)-2.2
(-2.4
,-1.9
)2.3
(2,2.6
)2.4
(2.1
,2.7
)4A
-4
SW
L16
days
––
––
0(0,0)
0.1
(-0
.2,0.4
)-2
(-2.3
,-1.8
)2.4
(2.1
,2.7
)2.6
(2.2
,2.9
)4A
-4
SW
L25
days
––
––
–0
(0,0)
-2.1
(-2.4
,-1.9
)2.3
(2,2.6
)2.5
(2.2
,2.8
)
5A
-5
SW
L10
days
––
––
––
0(0,0)
4.4
(4.3
,4.6
)4.6
(4.4
,4.8
)5A
-5
SW
L16
days
––
––
––
–0
(0,0)
0.2
(-0
.1,0.4
)5A
-5
SW
L25
days
––
––
––
––
0(0,0)
Tab
leI.
8:P
alli
ativ
ere
sult
sfo
rva
ryin
gth
ed
efin
itio
nof
ash
ort
wait
ing
list
bet
wee
n10,
16
an
d25
day
son
the
dis
charg
ep
oli
cysc
enari
os
wit
ha
hig
hnu
mb
erof
faci
liti
esw
ith
ash
ort
wai
tin
gli
stre
qu
ired
onth
enu
mb
erof
die
din
hosp
ital
pati
ents

Appendix I. Pairwise comparison charts - varying the definition of a short waiting list107
3A
-3
SW
L10
days
3A
-3
SW
L16
days
3A
-3
SW
L25
days
4A
-4
SW
L10
days
4A
-4
SW
L16
days
4A
-4
SW
L25
days
5A
-5
SW
L10
days
5A
-5
SW
L16
days
5A
-5
SW
L25
days
3A
-3
SW
L10
days
0(0,0)
-2.9
(-1
0.3
,4.6
)-12.8
(-22.5
,-3.1
)244.1
(230.9
,257.2
)244.6
(231.2
,258)
241.8
(227.9
,255.7
)440.1
(429,451.1
)439.1
(427.7
,450.5
)434.1
(422.8
,445.4
)3A
-3
SW
L16
days
–0
(0,0)
-9.9
(-17.8
,-2.1
)246.9
(234.3
,259.5
)247.5
(234.9
,260.1
)244.7
(231.5
,257.9
)442.9
(431.6
,454.2
)441.9
(430.1
,453.7
)436.9
(426,447.8
)
3A
-3
SW
L25
days
––
0(0,0)
256.9
(244.9
,268.9
)257.4
(245.6
,269.2
)254.6
(241.7
,267.5
)452.9
(442.5
,463.2
)451.9
(441.1
,462.7
)446.9
(436.2
,457.5
)
4A
-4
SW
L10
days
––
–0
(0,0)
0.6
(-4
.8,5.9
)-2
.2(-1
1,6.6
)196
(186.6
,205.4
)195
(185.2
,204.8
)190
(180.4
,199.6
)4A
-4
SW
L16
days
––
––
0(0,0)
-2.8
(-1
0.3
,4.8
)195.4
(186,204.9
)194.5
(184.9
,204)
189.5
(180.5
,198.4
)4A
-4
SW
L25
days
––
––
–0
(0,0)
198.2
(187.7
,208.8
)197.3
(186.4
,208.1
)192.3
(182.2
,202.3
)
5A
-5
SW
L10
days
––
––
––
0(0,0)
-1(-6
.5,4.6
)-6
(-1
2.5
,0.5
)5A
-5
SW
L16
days
––
––
––
–0
(0,0)
-5(-1
0.7
,0.7
)5A
-5
SW
L25
days
––
––
––
––
0(0,0)
Tab
leI.
9:R
ehab
ilit
atio
nre
sult
sfo
rva
ryin
gth
ed
efin
itio
nof
ash
ort
wait
ing
list
bet
wee
n10,
16
an
d25
day
son
the
dis
charg
ep
oli
cysc
enari
os
wit
ha
hig
hnu
mb
erof
faci
liti
esw
ith
ash
ort
wai
tin
gli
stre
qu
ired
on
the
nu
mb
erof
AL
Cd
ays
3A
-3
SW
L10
days
3A
-3
SW
L16
days
3A
-3
SW
L25
days
4A
-4
SW
L10
days
4A
-4
SW
L16
days
4A
-4
SW
L25
days
5A
-5
SW
L10
days
5A
-5
SW
L16
days
5A
-5
SW
L25
days
3A
-3
SW
L10
days
0(0,0)
0(-0
.1,0.2
)-0
.1(-0
.3,0.1
)2.7
(2.3
,3)
2.7
(2.4
,3.1
)2.9
(2.5
,3.2
)4.5
(4.2
,4.7
)4.2
(3.9
,4.4
)4.2
(3.9
,4.5
)3A
-3
SW
L16
days
–0
(0,0)
-0.1
(-0
.4,0.1
)2.6
(2.3
,2.9
)2.7
(2.4
,3)
2.8
(2.5
,3.2
)4.4
(4.2
,4.7
)4.1
(3.9
,4.4
)4.2
(3.9
,4.5
)3A
-3
SW
L25
days
––
0(0,0)
2.8
(2.5
,3.1
)2.9
(2.5
,3.2
)3
(2.6
,3.3
)4.6
(4.3
,4.8
)4.3
(4,4.6
)4.3
(4,4.6
)
4A
-4
SW
L10
days
––
–0
(0,0)
0.1
(0,0.2
)0.2
(0,0.4
)1.8
(1.6
,2)
1.5
(1.3
,1.8
)1.5
(1.3
,1.8
)4A
-4
SW
L16
days
––
––
0(0,0)
0.1
(0,0.3
)1.7
(1.5
,1.9
)1.4
(1.2
,1.7
)1.5
(1.2
,1.7
)4A
-4
SW
L25
days
––
––
–0
(0,0)
1.6
(1.4
,1.8
)1.3
(1.1
,1.6
)1.3
(1.1
,1.6
)
5A
-5
SW
L10
days
––
––
––
0(0,0)
-0.3
(-0.4
,-0.1
)-0.3
(-0.4
,-0.1
)5A
-5
SW
L16
days
––
––
––
–0
(0,0)
0(-0
.1,0.1
)5A
-5
SW
L25
days
––
––
––
––
0(0,0)
Tab
leI.
10:
Reh
abil
itat
ion
resu
lts
for
vary
ing
the
defi
nit
ion
of
ash
ort
wait
ing
list
bet
wee
n10,
16
an
d25
day
son
the
dis
charg
ep
oli
cysc
enari
os
wit
ha
hig
hnu
mb
erof
faci
liti
esw
ith
ash
ort
wai
tin
gli
stre
qu
ired
on
the
nu
mb
erof
die
din
hosp
ital
pati
ents

Appendix J
Pairwise comparison charts - varying
the facility popularity distribution
108

Appendix J. Pairwise comparison charts - varying the facility popularity distribution 109
3A
-3SW
L4A
-0SW
L4A
-4SW
L5A
-0SW
L5A
-5SW
L3A
-3SW
LI
4A
-0SW
LI
4A
-4SW
LI
5A
-0SW
LI
5A
-5SW
LI
3A
-3SW
LR
4A
-0SW
LR
4A
-4SW
LR
5A
-0SW
LR
5A
-5SW
LR
3A
-3SW
L0
(0,0)
163.9
(151.1
,176.7
)
N/A
227.9
(215.5
,240.3
)N/A
-17.5
(-31.4
,-3.6
)32.6
(16.5
,48.7
)N/A
105.8
(88.1
,123.4
)N/A
-5.9
(-1
9.7
,7.9
)60.3
(43.7
,76.8
)N/A
136
(119.3
,152.7
)N/A
4A
-0SW
L–
0(0,0)
N/A
64
(50.7
,77.3
)N/A
-181.4
(-196.4
,-166.4
)
-131.3
(-148.2
,-114.4
)
N/A
-58.2
(-77.4
,-38.9
)N/A
-169.8
(-184.8
,-154.8
)
-103.6
(-121.6
,-85.6
)
N/A
-27.9
(-45.6
,-10.2
)N/A
4A
-4SW
L–
–N/A
N/A
N/A
N/A
N/A
N/A
N/A
N/A
N/A
N/A
N/A
N/A
N/A
5A
-0SW
L–
––
0(0,0)
N/A
-245.4
(-258.1
,-232.8
)
-195.3
(-210.2
,-180.4
)
N/A
-122.2
(-138.4
,-105.9
)
N/A
-233.8
(-249.4
,-218.2
)
-167.6
(-185,
-150.3
)N/A
-91.9
(-108.5
,-75.3
)
N/A
5A
-5SW
L–
––
–N/A
N/A
N/A
N/A
N/A
N/A
N/A
N/A
N/A
N/A
N/A
3A
-3SW
LI
––
––
–0
(0,0)
50.1
(37.5
,62.8
)N/A
123.3
(106.1
,140.5
)N/A
11.6
(-4
,27.3
)77.8
(60.1
,95.4
)N/A
153.5
(136.2
,170.8
)N/A
4A
-0SW
LI
––
––
––
0(0,0)
N/A
73.1
(56.8
,89.4
)N/A
-38.5
(-55.4
,-21.6
)27.7
(8.8
,46.5
)N/A
103.4
(85.7
,121)
N/A
4A
-4SW
LI
––
––
––
–N/A
N/A
N/A
N/A
N/A
N/A
N/A
N/A
5A
-0SW
LI
––
––
––
––
0(0,0)
N/A
-111.6
(-130.9
,-92.4
)
-45.5
(-65.9
,-25)
N/A
30.2
(12.4
,48.1
)N/A
5A
-5SW
LI
––
––
––
––
–N/A
N/A
N/A
N/A
N/A
N/A
3A
-3SW
LR
––
––
––
––
––
0(0,0)
66.2
(48.6
,83.7
)N/A
141.9
(125.2
,158.5
)N/A
4A
-0SW
LR
––
––
––
––
––
–0
(0,0)
N/A
75.7
(57.7
,93.7
)N/A
4A
-4SW
LR
––
––
––
––
––
––
N/A
N/A
N/A
5A
-0SW
LR
––
––
––
––
––
––
–0
(0,0)
N/A
Tab
leJ.1
:C
CC
resu
lts
wh
enva
ryin
gth
enum
ber
ofsh
ort
wait
ing
list
faci
liti
es,
tota
lnu
mb
erof
ap
pli
cati
on
s,an
dth
ety
pe
of
faci
lity
pop
ula
rity
dis
trib
uti
on
(I=
inve
rse
ofac
tual
faci
lity
pop
ula
rity
dis
trib
uti
on,
R=
choosi
ng
faci
lity
ran
dom
ly)
on
the
nu
mb
erof
AL
Cd
ays

Appendix J. Pairwise comparison charts - varying the facility popularity distribution 110
3A
-3SW
L4A
-0SW
L4A
-4SW
L5A
-0SW
L5A
-5SW
L3A
-3SW
LI
4A
-0SW
LI
4A
-4SW
LI
5A
-0SW
LI
5A
-5SW
LI
3A
-3SW
LR
4A
-0SW
LR
4A
-4SW
LR
5A
-0SW
LR
5A
-5SW
LR
3A
-3SW
L0
(0,0)
0.5
(0.4
,0.6
)1.3
(1.2
,1.3
)0.8
(0.7
,0.9
)N/A
-0.3
(-0.4
,-0.2
)-0
.1(-0
.2,0)
N/A
0.2
(0.1
,0.3
)1.3
(1.2
,1.3
)-0.3
(-0.4
,-0.2
)0
(-0
.1,0.1
)N/A
0.5
(0.4
,0.6
)N/A
4A
-0SW
L–
0(0,0)
0.7
(0.7
,0.8
)0.3
(0.2
,0.3
)N/A
-0.8
(-0.9
,-0.7
)-0.6
(-0.7
,-0.5
)N/A
-0.4
(-0.4
,-0.3
)0.7
(0.7
,0.8
)-0.8
(-0.9
,-0.7
)-0.5
(-0.6
,-0.4
)N/A
-0.1
(-0
.2,0)
N/A
4A
-4SW
L–
–0
(0,0)
-0.5
(-0.5
,-0.4
)N/A
-1.5
(-1.6
,-1.4
)-1.3
(-1.4
,-1.3
)N/A
-1.1
(-1.2
,-1)
0(0,0)
-1.5
(-1.6
,-1.4
)-1.2
(-1.3
,-1.2
)N/A
-0.8
(-0.9
,-0.7
)N/A
5A
-0SW
L–
––
0(0,0)
N/A
-1.1
(-1.2
,-1)
-0.9
(-1,
-0.8
)N/A
-0.6
(-0.7
,-0.5
)0.5
(0.4
,0.5
)-1.1
(-1.2
,-1)
-0.8
(-0.9
,-0.7
)N/A
-0.3
(-0.4
,-0.2
)N/A
5A
-5SW
L–
––
–N/A
N/A
N/A
N/A
N/A
N/A
N/A
N/A
N/A
N/A
N/A
3A
-3SW
LI
––
––
–0
(0,0)
0.2
(0.1
,0.3
)N/A
0.5
(0.3
,0.6
)1.5
(1.4
,1.6
)0
(-0
.1,0.1
)0.3
(0.2
,0.4
)N/A
0.8
(0.6
,0.9
)N/A
4A
-0SW
LI
––
––
––
0(0,0)
N/A
0.3
(0.2
,0.4
)1.3
(1.3
,1.4
)-0.2
(-0.3
,-0.1
)0.1
(0,0.2
)N/A
0.6
(0.5
,0.7
)N/A
4A
-4SW
LI
––
––
––
–N/A
N/A
N/A
N/A
N/A
N/A
N/A
N/A
5A
-0SW
LI
––
––
––
––
0(0,0)
1.1
(1,1.2
)-0.5
(-0.6
,-0.3
)-0.2
(-0.3
,-0.1
)N/A
0.3
(0.2
,0.4
)N/A
5A
-5SW
LI
––
––
––
––
–0
(0,0)
-1.5
(-1.6
,-1.4
)-1.2
(-1.3
,-1.2
)N/A
-0.8
(-0.9
,-0.7
)N/A
3A
-3SW
LR
––
––
––
––
––
0(0,0)
0.3
(0.2
,0.4
)N/A
0.7
(0.6
,0.9
)N/A
4A
-0SW
LR
––
––
––
––
––
–0
(0,0)
N/A
0.5
(0.3
,0.6
)N/A
4A
-4SW
LR
––
––
––
––
––
––
N/A
N/A
N/A
5A
-0SW
LR
––
––
––
––
––
––
–0
(0,0)
N/A
Tab
leJ.2
:C
CC
resu
lts
wh
enva
ryin
gth
enum
ber
ofsh
ort
wait
ing
list
faci
liti
es,
tota
lnu
mb
erof
ap
pli
cati
on
s,an
dth
ety
pe
of
faci
lity
pop
ula
rity
dis
trib
uti
on
(I=
inve
rse
ofac
tual
faci
lity
pop
ula
rity
dis
trib
uti
on,
R=
choosi
ng
faci
lity
ran
dom
ly)
on
the
nu
mb
erof
die
din
hosp
ital
pati
ents

Appendix J. Pairwise comparison charts - varying the facility popularity distribution 111
3A
-3SW
L4A
-0SW
L4A
-4SW
L5A
-0SW
L5A
-5SW
L3A
-3SW
LI
4A
-0SW
LI
4A
-4SW
LI
5A
-0SW
LI
5A
-5SW
LI
3A
-3SW
LR
4A
-0SW
LR
4A
-4SW
LR
5A
-0SW
LR
5A
-5SW
LR
3A
-3SW
L0
(0,0)
41
(37.8
,44.2
)
41.2
(38.1
,44.2
)70.9
(67.6
,74.3
)85.2
(81.3
,89.2
)12.5
(10.8
,14.3
)52.7
(48.6
,56.9
)81.1
(76.5
,85.6
)91.5
(87.8
,95.2
)N/A
9(7.1
,10.9
)49.2
(45.7
,52.7
)64.8
(60.3
,69.2
)88.1
(84.4
,91.8
)123.6
(119.7
,127.4
)
4A
-0SW
L–
0(0,0)
0.1
(-1
.1,1.4
)29.9
(25.5
,34.3
)44.2
(39.7
,48.7
)-28.5
(-31.9
,-25.1
)11.7
(7.2
,16.2
)40
(34.6
,45.5
)50.5
(46,
54.9
)N/A
-32
(-35.4
,-28.6
)8.2
(4.3
,12.1
)23.7
(18.6
,28.9
)47.1
(42.5
,51.6
)82.6
(77.7
,87.5
)4A
-4SW
L–
–0
(0,0)
29.8
(25.4
,34.2
)44.1
(39.5
,48.7
)-28.6
(-31.8
,-25.4
)11.6
(7.3
,15.9
)39.9
(34.6
,45.2
)50.3
(46,
54.7
)N/A
-32.1
(-35.3
,-28.9
)8.1
(4.2
,11.9
)23.6
(18.3
,28.9
)46.9
(42.4
,51.5
)82.4
(77.6
,87.3
)5A
-0SW
L–
––
0(0,0)
14.3
(9.4
,19.2
)-58.4
(-61.9
,-55)
-18.2
(-23.6
,-12.9
)10.1
(4.9
,15.3
)20.6
(16.1
,25)
N/A
-61.9
(-65.3
,-58.5
)-21.7
(-26.3
,-17.1
)-6.2
(-11.2
,-1.1
)17.1
(12.7
,21.5
)52.6
(47.7
,57.6
)5A
-5SW
L–
––
–0
(0,0)
-72.7
(-77,
-68.4
)-32.5
(-37.9
,-27.1
)-4
.2(-9
.9,
1.5
)6.3
(1.1
,11.4
)N/A
-76.2
(-80.4
,-72)
-36
(-40.8
,-31.2
)-20.5
(-25.8
,-15.2
)2.8
(-2
.1,7.8
)38.3
(33.3
,43.4
)
3A
-3SW
LI
––
––
–0
(0,0)
40.2
(36,
44.4
)68.5
(64.1
,73)
79
(75.2
,82.7
)N/A
-3.5
(-5.2
,-1.7
)36.7
(33.1
,40.2
)52.2
(47.8
,56.6
)75.6
(72,
79.1
)111.1
(107.3
,114.8
)
4A
-0SW
LI
––
––
––
0(0,0)
28.3
(22.3
,34.4
)38.8
(33.8
,43.7
)N/A
-43.7
(-48,
-39.4
)-3
.5(-7
,0)
12
(6.5
,17.6
)35.4
(30,
40.7
)70.9
(65.2
,76.6
)
4A
-4SW
LI
––
––
––
–0
(0,0)
10.4
(5.4
,15.5
)N/A
-72
(-76.5
,-67.6
)-31.9
(-37.4
,-26.3
)-16.3
(-21.7
,-10.9
)7
(2,12)
42.5
(37.3
,47.7
)
5A
-0SW
LI
––
––
––
––
0(0,0)
N/A
-82.5
(-86.1
,-78.8
)-42.3
(-46.8
,-37.7
)-26.7
(-32,
-21.4
)-3
.4(-7
.7,
0.9
)32.1
(27.7
,36.5
)
5A
-5SW
LI
––
––
––
––
–N/A
N/A
N/A
N/A
N/A
N/A
3A
-3SW
LR
––
––
––
––
––
0(0,0)
40.2
(36.7
,43.7
)55.7
(51.5
,60)
79.1
(75.8
,82.3
)114.6
(110.7
,118.4
)
4A
-0SW
LR
––
––
––
––
––
–0
(0,0)
15.6
(10.7
,20.5
)38.9
(34.6
,43.1
)74.4
(69.3
,79.5
)
4A
-4SW
LR
––
––
––
––
––
––
0(0,0)
23.3
(18.9
,27.8
)58.8
(53.6
,64)
5A
-0SW
LR
––
––
––
––
––
––
–0
(0,0)
35.5
(30.5
,40.5
)
5A
-5SW
LR
––
––
––
––
––
––
––
0(0,0)
Tab
leJ.3
:C
onva
lesc
ent
resu
lts
wh
enva
ryin
gth
enu
mb
erof
short
wait
ing
list
faci
liti
es,
tota
lnum
ber
of
ap
pli
cati
on
s,an
dth
ety
pe
of
faci
lity
pop
ula
rity
dis
trib
uti
on(I
=in
vers
eof
actu
alfa
cili
typ
opu
lari
tyd
istr
ibu
tion
,R
=ch
oosi
ng
faci
lity
ran
dom
ly)
on
the
nu
mb
erof
AL
Cd
ays

Appendix J. Pairwise comparison charts - varying the facility popularity distribution 112
3A
-3SW
L4A
-0SW
L4A
-4SW
L5A
-0SW
L5A
-5SW
L3A
-3SW
LI
4A
-0SW
LI
4A
-4SW
LI
5A
-0SW
LI
5A
-5SW
LI
3A
-3SW
LR
4A
-0SW
LR
4A
-4SW
LR
5A
-0SW
LR
5A
-5SW
LR
3A
-3SW
L0
(0,0)
0.1
(0,
0.1
)0.1
(0,0.1
)0.2
(0.2
,0.3
)0.2
(0.1
,0.2
)0
(0,0.1
)0.1
(0.1
,0.1
)0.1
(0.1
,0.2
)0.3
(0.2
,0.3
)N/A
0(0,0.1
)0.1
(0.1
,0.1
)0.2
(0.1
,0.2
)0.3
(0.2
,0.3
)0.4
(0.3
,0.4
)
4A
-0SW
L–
0(0,0)
0(0,0)
0.1
(0.1
,0.2
)0.1
(0,0.1
)0
(-0
.1,0)
0(0,0)
0.1
(0,0.1
)0.2
(0.1
,0.2
)N/A
0(-0
.1,0)
0(0,0)
0.1
(0,0.1
)0.2
(0.2
,0.3
)0.3
(0.2
,0.3
)
4A
-4SW
L–
–0
(0,0)
0.1
(0.1
,0.2
)0.1
(0,0.1
)0
(-0
.1,0)
0(0,0)
0.1
(0,0.1
)0.2
(0.1
,0.2
)N/A
0(-0
.1,0)
0(0,0)
0.1
(0,0.1
)0.2
(0.2
,0.3
)0.3
(0.2
,0.3
)
5A
-0SW
L–
––
0(0,0)
-0.1
(-0
.1,0)
-0.2
(-0.2
,-0.1
)-0.1
(-0.2
,-0.1
)-0
.1(-0
.1,0)
0(0,0.1
)N/A
-0.2
(-0.2
,-0.1
)-0.1
(-0.2
,-0.1
)0
(-0
.1,0)
0.1
(0,0.1
)0.1
(0.1
,0.2
)
5A
-5SW
L–
––
–0
(0,0)
-0.1
(-0.2
,-0.1
)-0
.1(-0
.1,0)
0(-0
.1,0)
0.1
(0,0.2
)N/A
-0.1
(-0.2
,-0.1
)-0
.1(-0
.1,0)
0(0,0.1
)0.1
(0.1
,0.2
)0.2
(0.1
,0.3
)
3A
-3SW
LI
––
––
–0
(0,0)
0(0,0.1
)0.1
(0.1
,0.1
)0.2
(0.2
,0.3
)N/A
0(0,0)
0(0,0.1
)0.1
(0.1
,0.2
)0.2
(0.2
,0.3
)0.3
(0.3
,0.4
)
4A
-0SW
LI
––
––
––
0(0,0)
0.1
(0,0.1
)0.2
(0.1
,0.2
)N/A
0(-0
.1,0)
0(0,0)
0.1
(0,0.1
)0.2
(0.2
,0.2
)0.3
(0.2
,0.3
)
4A
-4SW
LI
––
––
––
–0
(0,0)
0.1
(0.1
,0.2
)N/A
-0.1
(-0.1
,-0.1
)-0
.1(-0
.1,0)
0(0,0.1
)0.2
(0.1
,0.2
)0.2
(0.2
,0.3
)
5A
-0SW
LI
––
––
––
––
0(0,0)
N/A
-0.2
(-0.3
,-0.2
)-0.2
(-0.2
,-0.1
)-0
.1(-0
.2,0)
0(0,0.1
)0.1
(0,0.2
)
5A
-5SW
LI
––
––
––
––
–N/A
N/A
N/A
N/A
N/A
N/A
3A
-3SW
LR
––
––
––
––
––
0(0,0)
0(0,0.1
)0.1
(0.1
,0.2
)0.2
(0.2
,0.3
)0.3
(0.3
,0.4
)
4A
-0SW
LR
––
––
––
––
––
–0
(0,0)
0.1
(0,0.1
)0.2
(0.2
,0.2
)0.3
(0.2
,0.3
)
4A
-4SW
LR
––
––
––
––
––
––
0(0,0)
0.1
(0.1
,0.2
)0.2
(0.1
,0.3
)
5A
-0SW
LR
––
––
––
––
––
––
–0
(0,0)
0.1
(0,0.1
)
5A
-5SW
LR
––
––
––
––
––
––
––
0(0,0)
Tab
leJ.4
:C
onva
lesc
ent
resu
lts
wh
enva
ryin
gth
enu
mb
erof
short
wait
ing
list
faci
liti
es,
tota
lnum
ber
of
ap
pli
cati
on
s,an
dth
ety
pe
of
faci
lity
pop
ula
rity
dis
trib
uti
on(I
=in
vers
eof
actu
alfa
cili
typ
opu
lari
tyd
istr
ibu
tion
,R
=ch
oosi
ng
faci
lity
ran
dom
ly)
on
the
nu
mb
erof
die
din
hosp
ital
pati
ents

Appendix J. Pairwise comparison charts - varying the facility popularity distribution 113
3A
-3SW
L4A
-0SW
L4A
-4SW
L5A
-0SW
L5A
-5SW
L3A
-3SW
LI
4A
-0SW
LI
4A
-4SW
LI
5A
-0SW
LI
5A
-5SW
LI
3A
-3SW
LR
4A
-0SW
LR
4A
-4SW
LR
5A
-0SW
LR
5A
-5SW
LR
3A
-3SW
L0
(0,0)
436.8
(400.9
,472.6
)
558.9
(517.5
,600.3
)772.3
(736.7
,808)
942.4
(901,
983.9
)-315.8
(-357,
-274.5
)5.3
(-3
5.7
,46.4
)-7
.4(-5
0.4
,35.6
)173.6
(133.9
,213.2
)252.4
(211.5
,293.3
)-175.8
(-219.5
,-132.1
)
174.4
(126.3
,222.5
)229.4
(182.2
,276.7
)427.7
(381.7
,473.6
)561.1
(520.1
,602.1
)
4A
-0SW
L–
0(0,0)
122.1
(97.5
,146.8
)335.6
(309,
362.1
)505.7
(481.4
,529.9
)-752.5
(-789.7
,-715.4
)
-431.4
(-461.3
,-401.5
)
-444.2
(-479.8
,-408.7
)
-263.2
(-297.5
,-228.9
)
-184.4
(-218.3
,-150.5
)
-612.6
(-648.4
,-576.7
)
-262.4
(-293.3
,-231.5
)
-207.3
(-246.4
,-168.3
)
-9.1
(-4
1.6
,23.4
)124.4
(94,
154.8
)
4A
-4SW
L–
–0
(0,0)
213.4
(181.1
,245.8
)383.5
(355.2
,411.9
)-874.7
(-910.2
,-839.1
)
-553.6
(-585.5
,-521.6
)
-566.3
(-598.9
,-533.7
)
-385.3
(-421.4
,-349.3
)
-306.5
(-341.8
,-271.2
)
-734.7
(-771.5
,-697.8
)
-384.5
(-418.5
,-350.6
)
-329.5
(-367.1
,-291.9
)
-131.2
(-166.1
,-96.3
)
2.2
(-3
1.2
,35.7
)
5A
-0SW
L–
––
0(0,0)
170.1
(148.9
,191.3
)-1088.1
(-1124,
-1052.2
)
-767
(-796.2
,-737.8
)-779.8
(-813.6
,-745.9
)
-598.8
(-630.2
,-567.4
)
-519.9
(-553.8
,-486)
-948.1
(-989.3
,-906.9
)
-598
(-634.6
,-561.3
)-542.9
(-578.5
,-507.3
)
-344.7
(-379,
-310.4
)-211.2
(-245.1
,-177.3
)5A
-5SW
L–
––
–0
(0,0)
-1258.2
(-1295.9
,-1220.5
)
-937.1
(-964.6
,-909.6
)
-949.9
(-981.9
,-917.8
)
-768.9
(-802,
-735.7
)-690
(-726.9
,-653.2
)-1118.2
(-1158.1
,-1078.4
)
-768.1
(-798.1
,-738)
-713
(-747.7
,-678.3
)-514.8
(-544.6
,-484.9
)
-381.3
(-412.1
,-350.5
)
3A
-3SW
LI
––
––
–0
(0,0)
321.1
(283.8
,358.4
)308.3
(268.2
,348.5
)489.3
(449.3
,529.3
)568.2
(531.4
,605)
140
(102,
177.9
)490.1
(448.5
,531.8
)545.2
(503.6
,586.7
)743.4
(700.3
,786.6
)876.9
(834.5
,919.3
)
4A
-0SW
LI
––
––
––
0(0,0)
-12.8
(-4
1.2
,15.7
)168.2
(137.1
,199.3
)247.1
(214.6
,279.5
)-181.1
(-222.3
,-139.9
)
169
(138.1
,200)
224.1
(185.1
,263.1
)422.3
(390.3
,454.3
)555.8
(522.2
,589.4
)
4A
-4SW
LI
––
––
––
–0
(0,0)
181
(147.7
,214.3
)259.8
(225,
294.7
)-168.4
(-210.3
,-126.4
)
181.8
(144.2
,219.4
)236.9
(199.6
,274.1
)435.1
(398.9
,471.3
)568.6
(532.1
,605.1
)
5A
-0SW
LI
––
––
––
––
0(0,0)
78.9
(52.6
,105.1
)-349.4
(-395,
-303.7
)0.8
(-4
1,42.6
)55.9
(16,
95.8
)254.1
(219.3
,288.9
)387.6
(355.2
,420)
5A
-5SW
LI
––
––
––
––
–0
(0,0)
-428.2
(-471.2
,-385.2
)
-78
(-120.4
,-35.7
)-2
3(-6
3.1
,17.1
)175.3
(138,
212.5
)308.7
(274,
343.5
)
3A
-3SW
LR
––
––
––
––
––
0(0,0)
350.2
(313.4
,386.9
)405.2
(365.1
,445.4
)603.5
(565,
641.9
)736.9
(696.4
,777.4
)
4A
-0SW
LR
––
––
––
––
––
–0
(0,0)
55.1
(21.5
,88.6
)253.3
(222.3
,284.3
)386.8
(354.5
,419)
4A
-4SW
LR
––
––
––
––
––
––
0(0,0)
198.2
(159.7
,236.8
)331.7
(294.1
,369.3
)
5A
-0SW
LR
––
––
––
––
––
––
–0
(0,0)
133.5
(106.4
,160.5
)
5A
-5SW
LR
––
––
––
––
––
––
––
0(0,0)
Tab
leJ.5
:LT
Cre
sult
sw
hen
vary
ing
the
nu
mb
erof
short
wait
ing
list
faci
liti
es,
tota
lnu
mb
erof
ap
pli
cati
ons,
an
dth
ety
pe
of
faci
lity
pop
ula
rity
dis
trib
uti
on
(I=
inve
rse
ofac
tual
faci
lity
pop
ula
rity
dis
trib
uti
on,
R=
choosi
ng
faci
lity
ran
dom
ly)
on
the
nu
mb
erof
AL
Cd
ays

Appendix J. Pairwise comparison charts - varying the facility popularity distribution 114
3A
-3SW
L4A
-0SW
L4A
-4SW
L5A
-0SW
L5A
-5SW
L3A
-3SW
LI
4A
-0SW
LI
4A
-4SW
LI
5A
-0SW
LI
5A
-5SW
LI
3A
-3SW
LR
4A
-0SW
LR
4A
-4SW
LR
5A
-0SW
LR
5A
-5SW
LR
3A
-3SW
L0
(0,0)
3.1
(2.9
,3.3
)2.9
(2.6
,3.2
)4.4
(4.2
,4.7
)4.8
(4.5
,5)
-1.2
(-1.4
,-0.9
)1.5
(1.3
,1.8
)0.6
(0.4
,0.8
)2.5
(2.2
,2.7
)1.6
(1.4
,1.9
)-0.7
(-0.9
,-0.4
)2.3
(2.1
,2.6
)1.5
(1.2
,1.8
)3.3
(3.1
,3.6
)3.4
(3.1
,3.6
)
4A
-0SW
L–
0(0,0)
-0.2
(-0
.4,0)
1.3
(1.1
,1.5
)1.6
(1.4
,1.8
)-4.3
(-4.5
,-4)
-1.6
(-1.8
,-1.4
)-2.5
(-2.7
,-2.3
)-0.7
(-0.9
,-0.4
)-1.5
(-1.7
,-1.2
)-3.8
(-4,
-3.6
)-0.8
(-1,
-0.6
)-1.6
(-1.9
,-1.4
)0.2
(0,0.4
)0.3
(0,0.5
)
4A
-4SW
L–
–0
(0,0)
1.5
(1.3
,1.7
)1.8
(1.6
,2.1
)-4.1
(-4.4
,-3.8
)-1.4
(-1.6
,-1.1
)-2.3
(-2.6
,-2)
-0.5
(-0.7
,-0.2
)-1.3
(-1.6
,-1)
-3.6
(-3.9
,-3.3
)-0.6
(-0.8
,-0.3
)-1.4
(-1.7
,-1.2
)0.4
(0.2
,0.7
)0.4
(0.2
,0.7
)
5A
-0SW
L–
––
0(0,0)
0.3
(0.1
,0.5
)-5.6
(-5.8
,-5.3
)-2.9
(-3.1
,-2.7
)-3.8
(-4.1
,-3.6
)-2
(-2.2
,-1.8
)-2.8
(-3,
-2.5
)-5.1
(-5.4
,-4.8
)-2.1
(-2.3
,-1.9
)-2.9
(-3.2
,-2.7
)-1.1
(-1.3
,-0.9
)-1.1
(-1.3
,-0.8
)5A
-5SW
L–
––
–0
(0,0)
-5.9
(-6.2
,-5.7
)-3.2
(-3.4
,-3)
-4.2
(-4.4
,-3.9
)-2.3
(-2.5
,-2.1
)-3.1
(-3.4
,-2.9
)-5.4
(-5.7
,-5.2
)-2.4
(-2.6
,-2.2
)-3.3
(-3.5
,-3)
-1.4
(-1.6
,-1.2
)-1.4
(-1.6
,-1.2
)
3A
-3SW
LI
––
––
–0
(0,0)
2.7
(2.5
,2.9
)1.8
(1.5
,2)
3.6
(3.4
,3.9
)2.8
(2.5
,3.1
)0.5
(0.2
,0.7
)3.5
(3.3
,3.7
)2.7
(2.4
,2.9
)4.5
(4.2
,4.8
)4.5
(4.3
,4.8
)
4A
-0SW
LI
––
––
––
0(0,0)
-0.9
(-1.1
,-0.7
)0.9
(0.7
,1.1
)0.1
(-0
.1,0.3
)-2.2
(-2.4
,-2)
0.8
(0.6
,1)
0(-0
.3,0.2
)1.8
(1.6
,2)
1.8
(1.6
,2.1
)
4A
-4SW
LI
––
––
––
–0
(0,0)
1.9
(1.6
,2.1
)1
(0.8
,1.3
)-1.3
(-1.5
,-1)
1.7
(1.5
,2)
0.9
(0.6
,1.1
)2.7
(2.5
,3)
2.8
(2.5
,3)
5A
-0SW
LI
––
––
––
––
0(0,0)
-0.8
(-1.1
,-0.6
)-3.2
(-3.4
,-2.9
)-0
.1(-0
.3,
0.1
)-1
(-1.2
,-0.7
)0.9
(0.7
,1.1
)0.9
(0.7
,1.1
)
5A
-5SW
LI
––
––
––
––
–0
(0,0)
-2.3
(-2.6
,-2.1
)0.7
(0.5
,0.9
)-0
.1(-0
.4,
0.1
)1.7
(1.5
,1.9
)1.7
(1.5
,2)
3A
-3SW
LR
––
––
––
––
––
0(0,0)
3(2.8
,3.2
)2.2
(1.9
,2.4
)4
(3.8
,4.3
)4.1
(3.8
,4.3
)
4A
-0SW
LR
––
––
––
––
––
–0
(0,0)
-0.8
(-1,
-0.6
)1
(0.8
,1.2
)1
(0.8
,1.3
)
4A
-4SW
LR
––
––
––
––
––
––
0(0,0)
1.8
(1.6
,2.1
)1.9
(1.6
,2.1
)
5A
-0SW
LR
––
––
––
––
––
––
–0
(0,0)
0(-0
.2,0.2
)
5A
-5SW
LR
––
––
––
––
––
––
––
0(0,0)
Tab
leJ.6
:LT
Cre
sult
sw
hen
vary
ing
the
nu
mb
erof
short
wait
ing
list
faci
liti
es,
tota
lnu
mb
erof
ap
pli
cati
ons,
an
dth
ety
pe
of
faci
lity
pop
ula
rity
dis
trib
uti
on
(I=
inve
rse
ofac
tual
faci
lity
pop
ula
rity
dis
trib
uti
on,
R=
choosi
ng
faci
lity
ran
dom
ly)
on
the
nu
mb
erof
die
din
hosp
ital
pati
ents

Appendix J. Pairwise comparison charts - varying the facility popularity distribution 115
3A
-3SW
L4A
-0SW
L4A
-4SW
L5A
-0SW
L5A
-5SW
L3A
-3SW
LI
4A
-0SW
LI
4A
-4SW
LI
5A
-0SW
LI
5A
-5SW
LI
3A
-3SW
LR
4A
-0SW
LR
4A
-4SW
LR
5A
-0SW
LR
5A
-5SW
LR
3A
-3SW
L0
(0,0)
65.8
(59,
72.6
)
140.1
(134.3
,146)
161.3
(155.4
,167.2
)207
(201.5
,212.5
)108.8
(102.2
,115.3
)184.1
(178.4
,189.8
)271.4
(265.9
,276.9
)285
(279.7
,290.3
)328
(322.6
,333.4
)57.2
(50.8
,63.6
)118
(111.9
,124)
203.6
(197.6
,209.6
)213.1
(207.7
,218.5
)262
(256.3
,267.7
)
4A
-0SW
L–
0(0,0)
74.3
(67.8
,80.8
)95.5
(89,
102)
141.2
(135.3
,147)
42.9
(35.9
,49.9
)118.2
(111.8
,124.7
)205.6
(199.7
,211.4
)219.2
(214,
224.3
)262.2
(256.9
,267.5
)-8.6
(-15.4
,-1.8
)52.2
(45.7
,58.6
)137.8
(131.4
,144.2
)147.3
(141.7
,152.9
)196.2
(190.6
,201.7
)4A
-4SW
L–
–0
(0,0)
21.2
(16.1
,26.3
)66.9
(62.3
,71.4
)-31.4
(-37.7
,-25)
43.9
(38.7
,49.2
)131.3
(126.3
,136.2
)144.9
(140.3
,149.4
)187.9
(183.7
,192.1
)-82.9
(-89.2
,-76.6
)-22.1
(-27.5
,-16.8
)63.5
(58.4
,68.6
)73
(68.3
,77.7
)121.9
(117.1
,126.6
)5A
-0SW
L–
––
0(0,0)
45.7
(41.6
,49.8
)-52.5
(-58.3
,-46.7
)22.8
(17.9
,27.6
)110.1
(105.7
,114.5
)123.7
(119.8
,127.6
)166.8
(162.9
,170.6
)-104.1
(-109.2
,-99)-43.3
(-48.4
,-38.2
)42.3
(38.1
,46.5
)51.8
(47.6
,56)
100.7
(96.4
,104.9
)5A
-5SW
L–
––
–0
(0,0)
-98.2
(-103.1
,-93.3
)
-22.9
(-27,
-18.9
)64.4
(60.8
,67.9
)78
(74.7
,81.3
)121
(117.6
,124.4
)-149.8
(-154.8
,-144.8
)
-89
(-93.7
,-84.3
)-3
.4(-7
.6,
0.8
)6.1
(2.5
,9.7
)55
(51.7
,58.3
)
3A
-3SW
LI
––
––
–0
(0,0)
75.3
(69.7
,80.9
)162.6
(157.4
,167.8
)176.2
(170.9
,181.5
)219.3
(214.2
,224.3
)-51.6
(-57.4
,-45.8
)9.2
(2.8
,15.6
)94.8
(89.4
,100.3
)104.3
(98.8
,109.9
)153.2
(148,
158.4
)
4A
-0SW
LI
––
––
––
0(0,0)
87.3
(83.3
,91.4
)100.9
(97,
104.9
)144
(140,
148)
-126.9
(-132.2
,-121.5
)
-66.1
(-71.2
,-61)
19.5
(14.7
,24.4
)29
(24.8
,33.3
)77.9
(73.7
,82.1
)
4A
-4SW
LI
––
––
––
–0
(0,0)
13.6
(10.4
,16.8
)56.7
(53.3
,60)
-214.2
(-219.1
,-209.3
)
-153.4
(-158.4
,-148.4
)
-67.8
(-71.9
,-63.7
)-58.3
(-62.3
,-54.3
)-9.4
(-13.3
,-5.5
)
5A
-0SW
LI
––
––
––
––
0(0,0)
43.1
(40.6
,45.5
)-227.8
(-232.5
,-223.1
)
-167
(-171.4
,-162.7
)-81.4
(-85.5
,-77.3
)-71.9
(-75.6
,-68.2
)-23
(-26.3
,-19.7
)
5A
-5SW
LI
––
––
––
––
–0
(0,0)
-270.8
(-275.5
,-266.2
)
-210.1
(-214.4
,-205.7
)
-124.4
(-128.2
,-120.7
)
-114.9
(-118.5
,-111.4
)
-66.1
(-69.2
,-62.9
)
3A
-3SW
LR
––
––
––
––
––
0(0,0)
60.8
(55,
66.5
)146.4
(141,
151.8
)155.9
(150.6
,161.1
)204.8
(199.9
,209.7
)
4A
-0SW
LR
––
––
––
––
––
–0
(0,0)
85.6
(80.5
,90.7
)95.1
(90.4
,99.8
)144
(139.2
,148.8
)
4A
-4SW
LR
––
––
––
––
––
––
0(0,0)
9.5
(5.5
,13.5
)58.4
(54.5
,62.2
)
5A
-0SW
LR
––
––
––
––
––
––
–0
(0,0)
48.9
(45.4
,52.4
)
5A
-5SW
LR
––
––
––
––
––
––
––
0(0,0)
Tab
leJ.7
:P
alli
ativ
ere
sult
sw
hen
vary
ing
the
nu
mb
erof
short
wait
ing
list
faci
liti
es,to
talnu
mb
erof
ap
pli
cati
on
s,an
dth
ety
pe
of
faci
lity
pop
ula
rity
dis
trib
uti
on
(I=
inve
rse
ofac
tual
faci
lity
pop
ula
rity
dis
trib
uti
on,
R=
choosi
ng
faci
lity
ran
dom
ly)
on
the
nu
mb
erof
AL
Cd
ays

Appendix J. Pairwise comparison charts - varying the facility popularity distribution 116
3A
-3SW
L4A
-0SW
L4A
-4SW
L5A
-0SW
L5A
-5SW
L3A
-3SW
LI
4A
-0SW
LI
4A
-4SW
LI
5A
-0SW
LI
5A
-5SW
LI
3A
-3SW
LR
4A
-0SW
LR
4A
-4SW
LR
5A
-0SW
LR
5A
-5SW
LR
3A
-3SW
L0
(0,0)
2.7
(2.4
,3)
4.9
(4.5
,5.2
)6
(5.6
,6.3
)7.3
(6.9
,7.6
)3.3
(3,3.6
)6.1
(5.8
,6.4
)8.6
(8.3
,8.9
)8.9
(8.7
,9.2
)9.9
(9.6
,10.1
)1.8
(1.4
,2.1
)4.2
(4,4.5
)6.8
(6.5
,7.1
)7.3
(7,7.6
)8.6
(8.3
,8.9
)
4A
-0SW
L–
0(0,0)
2.1
(1.8
,2.4
)3.2
(2.9
,3.5
)4.5
(4.3
,4.8
)0.6
(0.3
,0.8
)3.4
(3.1
,3.6
)5.9
(5.6
,6.1
)6.2
(6,6.4
)7.1
(6.9
,7.4
)-0.9
(-1.3
,-0.6
)1.5
(1.3
,1.8
)4.1
(3.8
,4.4
)4.6
(4.4
,4.9
)5.9
(5.6
,6.1
)
4A
-4SW
L–
–0
(0,0)
1.1
(0.8
,1.4
)2.4
(2.1
,2.7
)-1.6
(-1.9
,-1.2
)1.2
(0.9
,1.5
)3.7
(3.5
,4)
4.1
(3.8
,4.3
)5
(4.7
,5.3
)-3.1
(-3.4
,-2.7
)-0.6
(-0.9
,-0.3
)2
(1.6
,2.3
)2.5
(2.2
,2.8
)3.7
(3.4
,4)
5A
-0SW
L–
––
0(0,0)
1.3
(1,1.6
)-2.7
(-3,
-2.4
)0.1
(-0
.1,0.4
)2.6
(2.4
,2.9
)3
(2.7
,3.2
)3.9
(3.7
,4.1
)-4.2
(-4.5
,-3.9
)-1.7
(-2,
-1.4
)0.9
(0.6
,1.1
)1.4
(1.1
,1.7
)2.6
(2.4
,2.9
)
5A
-5SW
L–
––
–0
(0,0)
-4
(-4.3
,-3.7
)-1.2
(-1.4
,-1)
1.3
(1.1
,1.6
)1.7
(1.4
,1.9
)2.6
(2.4
,2.8
)-5.5
(-5.8
,-5.1
)-3
(-3.3
,-2.7
)-0.4
(-0.7
,-0.2
)0.1
(-0
.2,0.3
)1.3
(1.1
,1.6
)
3A
-3SW
LI
––
––
–0
(0,0)
2.8
(2.6
,3)
5.3
(5.1
,5.6
)5.7
(5.4
,5.9
)6.6
(6.4
,6.8
)-1.5
(-1.8
,-1.2
)1
(0.7
,1.2
)3.5
(3.3
,3.8
)4.1
(3.8
,4.3
)5.3
(5.1
,5.6
)
4A
-0SW
LI
––
––
––
0(0,0)
2.5
(2.3
,2.7
)2.8
(2.6
,3)
3.8
(3.6
,4)
-4.3
(-4.6
,-4)
-1.8
(-2.1
,-1.6
)0.7
(0.5
,1)
1.3
(1,1.5
)2.5
(2.3
,2.7
)
4A
-4SW
LI
––
––
––
–0
(0,0)
0.3
(0.2
,0.5
)1.3
(1.1
,1.4
)-6.8
(-7.1
,-6.5
)-4.3
(-4.6
,-4.1
)-1.8
(-2,
-1.5
)-1.3
(-1.5
,-1)
0(-0
.2,0.2
)
5A
-0SW
LI
––
––
––
––
0(0,0)
0.9
(0.8
,1.1
)-7.1
(-7.4
,-6.9
)-4.7
(-4.9
,-4.5
)-2.1
(-2.3
,-1.9
)-1.6
(-1.8
,-1.4
)-0.3
(-0.5
,-0.1
)
5A
-5SW
LI
––
––
––
––
–0
(0,0)
-8.1
(-8.3
,-7.8
)-5.6
(-5.8
,-5.4
)-3
(-3.3
,-2.8
)-2.5
(-2.7
,-2.3
)-1.3
(-1.4
,-1.1
)
3A
-3SW
LR
––
––
––
––
––
0(0,0)
2.5
(2.2
,2.8
)5
(4.7
,5.4
)5.5
(5.2
,5.9
)6.8
(6.5
,7.1
)
4A
-0SW
LR
––
––
––
––
––
–0
(0,0)
2.6
(2.3
,2.8
)3.1
(2.8
,3.3
)4.3
(4.1
,4.6
)
4A
-4SW
LR
––
––
––
––
––
––
0(0,0)
0.5
(0.3
,0.8
)1.8
(1.5
,2)
5A
-0SW
LR
––
––
––
––
––
––
–0
(0,0)
1.3
(1.1
,1.5
)
5A
-5SW
LR
––
––
––
––
––
––
––
0(0,0)
Tab
leJ.8
:P
alli
ativ
ere
sult
sw
hen
vary
ing
the
nu
mb
erof
short
wait
ing
list
faci
liti
es,to
talnu
mb
erof
ap
pli
cati
on
s,an
dth
ety
pe
of
faci
lity
pop
ula
rity
dis
trib
uti
on
(I=
inve
rse
ofac
tual
faci
lity
pop
ula
rity
dis
trib
uti
on,
R=
choosi
ng
faci
lity
ran
dom
ly)
on
the
nu
mb
erof
die
din
hosp
ital
pati
ents
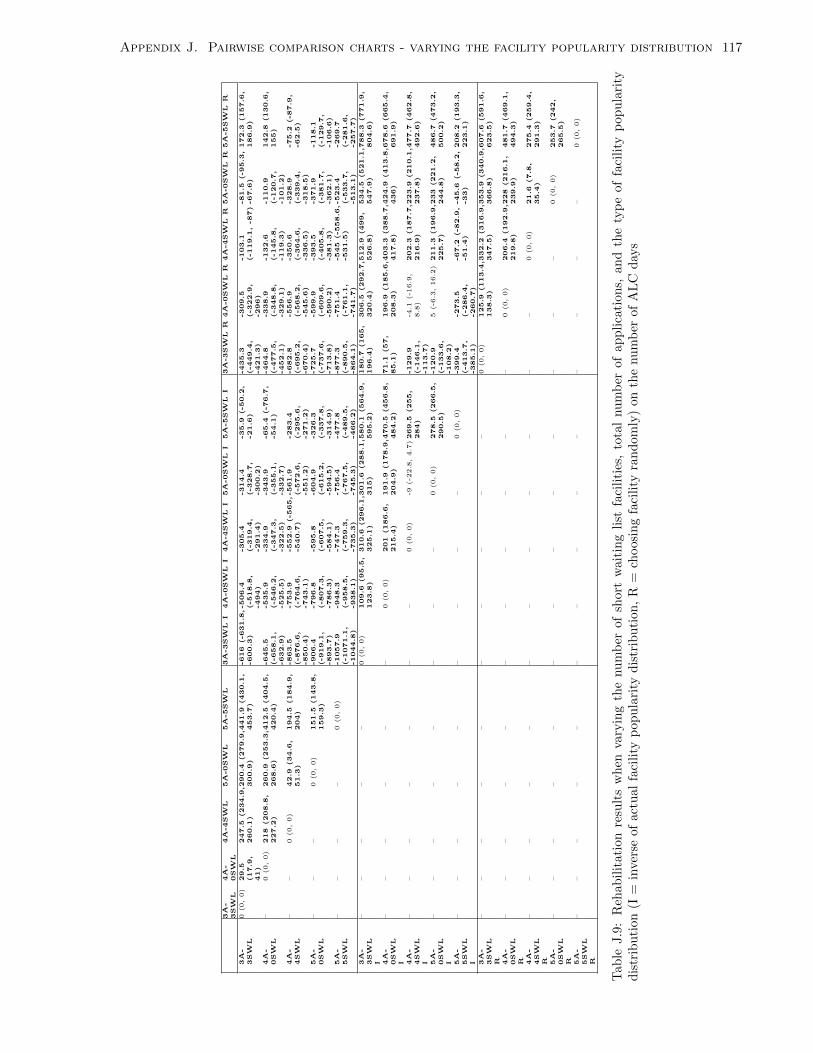
Appendix J. Pairwise comparison charts - varying the facility popularity distribution 117
3A
-3SW
L4A
-0SW
L4A
-4SW
L5A
-0SW
L5A
-5SW
L3A
-3SW
LI
4A
-0SW
LI
4A
-4SW
LI
5A
-0SW
LI
5A
-5SW
LI
3A
-3SW
LR
4A
-0SW
LR
4A
-4SW
LR
5A
-0SW
LR
5A
-5SW
LR
3A
-3SW
L0
(0,0)
29.5
(17.9
,41)
247.5
(234.9
,260.1
)290.4
(279.9
,300.9
)441.9
(430.1
,453.7
)-616
(-631.8
,-600.3
)-506.4
(-518.8
,-494)
-305.4
(-319.4
,-291.4
)
-314.4
(-328.7
,-300.2
)
-35.9
(-50.2
,-21.6
)-435.3
(-449.4
,-421.3
)
-309.5
(-322.9
,-296)
-103.1
(-119.1
,-87)-81.5
(-95.3
,-67.6
)172.3
(157.6
,186.9
)
4A
-0SW
L–
0(0,0)
218
(208.8
,227.2
)260.9
(253.3
,268.6
)412.5
(404.5
,420.4
)-645.5
(-658.1
,-632.9
)
-535.9
(-546.2
,-525.5
)
-334.9
(-347.3
,-322.5
)
-343.9
(-355.1
,-332.7
)
-65.4
(-76.7
,-54.1
)-464.8
(-477.5
,-452.1
)
-338.9
(-348.8
,-329.1
)
-132.6
(-145.8
,-119.3
)
-110.9
(-120.7
,-101.2
)
142.8
(130.6
,155)
4A
-4SW
L–
–0
(0,0)
42.9
(34.6
,51.3
)194.5
(184.9
,204)
-863.5
(-876.6
,-850.4
)
-753.9
(-764.6
,-743.1
)
-552.9
(-565,
-540.7
)-561.9
(-572.6
,-551.2
)
-283.4
(-295.6
,-271.2
)
-682.8
(-695.2
,-670.4
)
-556.9
(-568.2
,-545.6
)
-350.6
(-364.6
,-336.5
)
-328.9
(-339.4
,-318.5
)
-75.2
(-87.9
,-62.5
)
5A
-0SW
L–
––
0(0,0)
151.5
(143.8
,159.3
)-906.4
(-919.1
,-893.7
)
-796.8
(-807.3
,-786.3
)
-595.8
(-607.5
,-584.1
)
-604.9
(-615.2
,-594.5
)
-326.3
(-337.8
,-314.9
)
-725.7
(-737.6
,-713.8
)
-599.9
(-609.6
,-590.2
)
-393.5
(-405.8
,-381.3
)
-371.9
(-381.7
,-362.1
)
-118.1
(-129.7
,-106.6
)5A
-5SW
L–
––
–0
(0,0)
-1057.9
(-1071.1
,-1044.8
)
-948.3
(-958.5
,-938.1
)
-747.3
(-759.3
,-735.3
)
-756.4
(-767.5
,-745.3
)
-477.8
(-489.5
,-466.2
)
-877.3
(-890.5
,-864.1
)
-751.4
(-761.1
,-741.7
)
-545
(-558.6
,-531.5
)-523.4
(-533.7
,-513.1
)
-269.7
(-281.6
,-257.7
)
3A
-3SW
LI
––
––
–0
(0,0)
109.6
(95.5
,123.8
)310.6
(296.1
,325.1
)301.6
(288.1
,315)
580.1
(564.9
,595.2
)180.7
(165,
196.4
)306.5
(292.7
,320.4
)512.9
(499,
526.8
)534.5
(521.1
,547.9
)788.3
(771.9
,804.6
)
4A
-0SW
LI
––
––
––
0(0,0)
201
(186.6
,215.4
)191.9
(178.9
,204.9
)470.5
(456.8
,484.2
)71.1
(57,
85.1
)196.9
(185.6
,208.3
)403.3
(388.7
,417.8
)424.9
(413.8
,436)
678.6
(665.4
,691.9
)
4A
-4SW
LI
––
––
––
–0
(0,0)
-9(-2
2.8
,4.7
)269.5
(255,
284)
-129.9
(-146.1
,-113.7
)
-4.1
(-1
6.9
,8.8
)202.3
(187.7
,216.9
)223.9
(210.1
,237.8
)477.7
(462.8
,492.6
)
5A
-0SW
LI
––
––
––
––
0(0,0)
278.5
(266.5
,290.5
)-120.9
(-133.6
,-108.2
)
5(-6
.3,16.2
)211.3
(196.9
,225.7
)233
(221.2
,244.8
)486.7
(473.2
,500.2
)
5A
-5SW
LI
––
––
––
––
–0
(0,0)
-399.4
(-413.7
,-385.1
)
-273.5
(-286.4
,-260.7
)
-67.2
(-82.9
,-51.4
)-45.6
(-58.2
,-33)
208.2
(193.3
,223.1
)
3A
-3SW
LR
––
––
––
––
––
0(0,0)
125.9
(113.4
,138.3
)332.2
(316.9
,347.5
)353.9
(340.9
,366.8
)607.6
(591.6
,623.5
)
4A
-0SW
LR
––
––
––
––
––
–0
(0,0)
206.4
(192.9
,219.8
)228
(216.1
,239.9
)481.7
(469.1
,494.3
)
4A
-4SW
LR
––
––
––
––
––
––
0(0,0)
21.6
(7.8
,35.4
)275.4
(259.4
,291.3
)
5A
-0SW
LR
––
––
––
––
––
––
–0
(0,0)
253.7
(242,
265.5
)
5A
-5SW
LR
––
––
––
––
––
––
––
0(0,0)
Tab
leJ.9
:R
ehabil
itat
ion
resu
lts
wh
enva
ryin
gth
enu
mb
erof
short
wait
ing
list
faci
liti
es,
tota
lnu
mb
erof
ap
pli
cati
on
s,an
dth
ety
pe
of
faci
lity
pop
ula
rity
dis
trib
uti
on(I
=in
vers
eof
actu
alfa
cili
typ
opu
lari
tyd
istr
ibu
tion
,R
=ch
oosi
ng
faci
lity
ran
dom
ly)
on
the
nu
mb
erof
AL
Cd
ays

Appendix J. Pairwise comparison charts - varying the facility popularity distribution 118
3A
-3SW
L4A
-0SW
L4A
-4SW
L5A
-0SW
L5A
-5SW
L3A
-3SW
LI
4A
-0SW
LI
4A
-4SW
LI
5A
-0SW
LI
5A
-5SW
LI
3A
-3SW
LR
4A
-0SW
LR
4A
-4SW
LR
5A
-0SW
LR
5A
-5SW
LR
3A
-3SW
L0
(0,0)
1.7
(1.4
,1.9
)2.7
(2.4
,3)
3.7
(3.5
,4)
4.1
(3.9
,4.4
)-7.6
(-8,
-7.2
)-2
(-2.3
,-1.7
)-3.2
(-3.6
,-2.7
)0.1
(-0
.2,0.3
)0.3
(-0
.1,0.6
)-5.3
(-5.7
,-5)
-0.4
(-0.7
,-0.1
)-0.9
(-1.4
,-0.5
)1.7
(1.4
,2)
2(1.7
,2.3
)
4A
-0SW
L–
0(0,0)
1(0.8
,1.3
)2.1
(1.9
,2.2
)2.5
(2.2
,2.7
)-9.3
(-9.7
,-9)
-3.7
(-3.9
,-3.5
)-4.9
(-5.2
,-4.5
)-1.6
(-1.9
,-1.4
)-1.4
(-1.7
,-1.1
)-7
(-7.4
,-6.7
)-2.1
(-2.3
,-1.9
)-2.6
(-3,
-2.3
)0
(-0
.2,0.2
)0.3
(0,0.5
)
4A
-4SW
L–
–0
(0,0)
1(0.8
,1.2
)1.4
(1.2
,1.7
)-10.3
(-10.7
,-10)
-4.7
(-5,
-4.5
)-5.9
(-6.3
,-5.5
)-2.7
(-2.9
,-2.4
)-2.4
(-2.8
,-2.1
)-8
(-8.4
,-7.7
)-3.1
(-3.4
,-2.9
)-3.7
(-4,
-3.3
)-1
(-1.3
,-0.7
)-0.7
(-1,
-0.4
)5A
-0SW
L–
––
0(0,0)
0.4
(0.2
,0.6
)-11.4
(-11.7
,-11)
-5.8
(-6,
-5.5
)-6.9
(-7.3
,-6.5
)-3.7
(-3.9
,-3.5
)-3.5
(-3.8
,-3.1
)-9.1
(-9.4
,-8.7
)-4.2
(-4.4
,-3.9
)-4.7
(-5,
-4.3
)-2
(-2.3
,-1.8
)-1.8
(-2,
-1.5
)5A
-5SW
L–
––
–0
(0,0)
-11.8
(-12.2
,-11.4
)-6.2
(-6.4
,-5.9
)-7.3
(-7.7
,-6.9
)-4.1
(-4.3
,-3.9
)-3.9
(-4.2
,-3.6
)-9.5
(-9.8
,-9.1
)-4.6
(-4.8
,-4.3
)-5.1
(-5.4
,-4.7
)-2.4
(-2.7
,-2.2
)-2.2
(-2.4
,-1.9
)
3A
-3SW
LI
––
––
–0
(0,0)
5.6
(5.2
,6)
4.5
(4,4.9
)7.7
(7.3
,8.1
)7.9
(7.5
,8.3
)2.3
(1.8
,2.8
)7.2
(6.8
,7.6
)6.7
(6.3
,7.1
)9.3
(8.9
,9.7
)9.6
(9.2
,10)
4A
-0SW
LI
––
––
––
0(0,0)
-1.1
(-1.5
,-0.8
)2.1
(1.8
,2.3
)2.3
(2,2.6
)-3.3
(-3.7
,-2.9
)1.6
(1.3
,1.8
)1.1
(0.8
,1.4
)3.7
(3.5
,4)
4(3.7
,4.3
)
4A
-4SW
LI
––
––
––
–0
(0,0)
3.2
(2.8
,3.7
)3.5
(3,3.9
)-2.2
(-2.7
,-1.7
)2.7
(2.3
,3.1
)2.2
(1.8
,2.7
)4.9
(4.4
,5.3
)5.1
(4.7
,5.6
)
5A
-0SW
LI
––
––
––
––
0(0,0)
0.2
(-0
.1,0.6
)-5.4
(-5.8
,-5)
-0.5
(-0.7
,-0.2
)-1
(-1.4
,-0.6
)1.7
(1.4
,1.9
)1.9
(1.6
,2.2
)
5A
-5SW
LI
––
––
––
––
–0
(0,0)
-5.6
(-6,
-5.2
)-0.7
(-1.1
,-0.4
)-1.2
(-1.6
,-0.8
)1.4
(1.1
,1.7
)1.7
(1.3
,2)
3A
-3SW
LR
––
––
––
––
––
0(0,0)
4.9
(4.5
,5.3
)4.4
(4,4.8
)7
(6.7
,7.4
)7.3
(7,7.7
)
4A
-0SW
LR
––
––
––
––
––
–0
(0,0)
-0.5
(-0.9
,-0.2
)2.1
(1.9
,2.4
)2.4
(2.1
,2.7
)
4A
-4SW
LR
––
––
––
––
––
––
0(0,0)
2.6
(2.3
,3)
2.9
(2.5
,3.3
)
5A
-0SW
LR
––
––
––
––
––
––
–0
(0,0)
0.3
(0,0.5
)
5A
-5SW
LR
––
––
––
––
––
––
––
0(0,0)
Tab
leJ.1
0:R
ehab
ilit
atio
nre
sult
sw
hen
vary
ing
the
nu
mb
erof
short
wait
ing
list
faci
liti
es,
tota
lnu
mb
erof
ap
pli
cati
on
s,an
dth
ety
pe
of
faci
lity
pop
ula
rity
dis
trib
uti
on(I
=in
vers
eof
actu
alfa
cili
typ
opu
lari
tyd
istr
ibu
tion
,R
=ch
oosi
ng
faci
lity
ran
dom
ly)
on
the
nu
mb
erof
die
din
hosp
ital
pati
ents