the effects of cell phone distractions on cognitive ...jass.neuro.wisc.edu/2015/01/lab 601 group...
TRANSCRIPT

The Effects of Cell Phone Distractions on
Cognitive Flexibility
University of Wisconsin-Madison Department of Physiology
Lab 601 Group 12
Lina Nguyen, Stephanie Rosicki, Clayton Rowe, Haley Schoenberger
April 9, 2015
Key Words: cognitive flexibility, ECG, GSR, heart rate, Stroop test, color, mean arterial pressure
(MAP), pulse pressure (PP)

Abstract
The purpose of this experiment was to study the relationship between cognitive flexibility
and cell phone anxiety measured by changes in the physiological responses of the human body
often triggered by the sympathetic nervous system. 29 participants were randomly assigned to
three groups and were monitored while performing a Stroop test, during which two of the test
groups experienced distractions and the third group experienced no distraction. Heart rate, blood
pressure, and galvanic skin response were recorded throughout the process. It was hypothesized
that a measurable sympathetic response would occur in the group of participants who listened to
a video soundclip of whispering while taking the Stroop test, and that a similar sympathetic
response would occur in the group of participants who experienced vibrating cell phone
notifications. The participants that did not experience any distractions were found to have lower
final pulse pressures than either of the groups exposed to distractions during the test. Differences
in heart rate throughout the duration of the experiment were found to be different between the
group that experienced no distraction and the group that experienced cell phone vibrations, as
well as between the group that experienced no distraction and the group that listened to a
soundclip of whispering. Further experimentation is required to fully determine if there is a
physiological relationship between anxiety due to cell phone distractions and cognitive
flexibility. This study proposes a potential bridge between purely academic and physiological
studies and can serve to direct further study of this increasingly prevalent issue of technology use
in academic settings.
Introduction
The ability of humans to multitask, or the capacity to divide attention between multiple
tasks simultaneously, serves as a cornerstone of human cognition (Leber, et al. 2008). This type
of processing, known as cognitive flexibility, affords humans the capacity to alternate, or switch
between several tasks. Despite this adaption of the human mind to perform two functions
simultaneously, studies have shown that multitasking decreases human information processing,
as our brains are unable to attend to many tasks sufficiently (Junco 2012). Additionally,
cognitive processing becomes divided when sequential functions are added, therefore limiting
the storage of information in the brain (Naveh-Benjamin, et al. 2000). The advancement of
technology over the past 30 years has also contributed to the increased amount of time students
are choosing to spend multitasking between technology and education. Therefore, cognitive
flexibility has come to play an increasingly more important role in everyday life with the rise of
the technological era (Leber, et al. 2008). Prominent examples relative to students attending
universities include the use of mobile devices during lecture, while studying, or even while
socializing with peers. Students are able to process, encode, and store information completely
only when focusing on one task alone with uninterrupted attention. The application of these
results to college-specific situations predicts decreased retention of information learned during
lectures when students divide their attention between cell phone use and lecture engagement.
With the rise of the digital era, distractions in the form of cell phone notifications, such as
text messages, are playing an increasingly large role in the learning process of college students
(Tindell and Bohlander, 2011). More attention has been directed toward the use of technological
devices, and additionally since the sale of the first cell phone just over 30 years ago. This has an
affect on people of all ages, with particular emphasis on college-aged individuals (Massimini and
Peterson, 2009). At the university level, it was discovered that 95% of students travel to class
with their cell phones on a daily basis, and 92% of these students use their phones to send text
messages during class (Tindell and Bohlander, 2011). Smartphones in particular have increased
in popularity over the past 20 years leading to the ongoing challenge to define “normal” cell
phone usage. College students were found to spend an average of nine hours daily on their cell
phones divided between the use of various aspects of device functionality (Roberts, et al. 2014).
The distinction of cell phone addiction becomes harder to define as cell phone usage continues to
increase, and undoubtedly will continue to impact the learning atmosphere, and distractibility of
students (2014).
College students are presented with the challenge of dividing their attention between cell
phone use and their studies on a daily basis. In a 2011 study executed by Rosen et al., students
were asked to respond to texts sent out at even intervals during a 30 minute lecture. The students
were divided into three groups: low (1-7 texts), moderate (8-15 texts) and high (16 or more texts)
messaging. The high messaging group exhibited decreased academic performance, scoring on
average one letter grade worse than the low messaging group on a test given post-lecture.
Decreased academic performance can also negatively impact the student in terms of increased
anxiety. Anxiety has been shown to be associated with increased frequency of texting, which
may both indirectly and directly impact academic performance (Lepp et al. 2014). The
combination of these factors may lead to an overall lasting impact on the ability of students to
learn more effectively, and may make it difficult to sustain from cell phone use for the duration
of a class period.
Despite the abundance of published research characterizing cell phone usage and its
effects on learning, studies characterizing the direct effects of cell phone use on cognitive
function and sympathetic nervous system response are largely absent. The studies do not analyze

effects of cell phones at the physiological level of an individual, but are often based on surveys
and/or learning outcomes. This study seeks to remedy this absence through the analysis of
physiological consequences due to distractions associated with cell phone notifications in the
form of vibrations, and aims to discover how receiving cell phone notifications physiologically
impacts the response of the sympathetic nervous system and the ability of an individual to
maintain their focus.
Student participants will be subject to perform a Stroop test while galvanic skin response,
heart rate, and blood pressure are measured. The Stroop test is often used as a measure of the
mental capacity of an individual, as well as the cognitive flexibility through the performance
level on tasks that require cognitive processing. The classical Stroop test calls for the participant
to indicate the color in which a word is written. When the word and the color are incongruent
(e.g. the word red is written in blue ink) two concepts are simultaneously activated in the
memory forcing the participant to differentiate between the meaning of the word and the color of
the ink used (Flaudias and Llorca 2013). The purpose of using the Stroop test in this study is to
induce a sympathetic stress response in participants while they are simultaneously utilizing their
cognitive flexibility. We expect to see increased activation of the sympathetic nervous system in
the participants who are experiencing cell phone distraction in the form of iMessage vibrations.
Materials
Prior to active participation, students filled out a google survey (Appendix B) and read
through and signed a consent form modified from the University of Wisconsin-Madison
Department of Physiology (Appendix A). The physiological measurements required several
pieces of equipment, including an Omron 10 Plus Series Upper Arm Blood Pressure Monitor

with ComFit Cuff BP791IT (Kyoto, Japan) to measure blood pressure, Pulse Oximeter Model
9843 (Nonin Medical, Inc., Minneapolis, MN) to measure heart rate, and BSL Electrodermal
Activity (EDA) Finger Electrode Xdcr SS3LA (BIOPAC Systems, Inc., Aero Camino Goleta,
CA) in conjunction with BIOPAC Software (BIOPAC Systems Inc., Model MANBSL4, CA) on
a Dell Inspiron 530 computer to measure galvanic skin response. The modified Stroop test was
administered using Microsoft PowerPoint 2010 on a MacBook laptop computer.
Methods
The study allowed for participation by students attending the University of Wisconsin-
Madison. Participants were asked to fill out a google survey prior to participation regarding their
name, age, gender, type of cell phone, cell phone use in academic settings, and most common
cell phone notification mode (vibrate, silent, volume) (Appendix B). Students that did not have
an iPhone were unable to participate due to limitations in terms of the type of cell phone used by
the researchers. Prior to experimentation, all participants were given a consent form to read and
sign, which served as permission to use any data collected in our published paper (Appendix A).
29 eligible student participants were randomly assigned to one of our three treatment
options using Research Randomizer online software (Urbaniak, G. C., & Plous, S. 2013). Both
the positive control (Group C, 10 participants) and the experimental group (Group B, 9
participants) experienced different distractions throughout the experiment, while the negative
control (Group A, 10 participants) experienced no distraction. Each participant was individually
led into a study room, and was instructed to remain seated at a desk with legs uncrossed to
ensure accurate measurements. Additionally, the left arm with the pulse oximeter attached
remained facing palm upward. Participants were asked to switch their phones on vibrate and
surrender their phone to the researchers for the duration of the experiment. One of the
researcher’s iPhones was exchanged with the subject’s phone and placed in the top drawer of a
metal desk in the experimentation room.
Before beginning the experiment participants from all three groups were told they would
be taking a Stroop test, and were instructed to complete the entire test. Additionally, the pulse
oximeter, blood pressure cuff, and galvanic skin response were connected to the subject, and
initial baseline measurements were taken. Heart rate was recorded every 15 seconds for the
duration of the experiment, and galvanic skin response continuously recorded data throughout
the experiment. The positive control group listened to a YouTube video of whispering
(TheWaterwhispers, 2012), which was played after the baseline portion of the Stroop test (Group
C). The experimental group was subject to hear iMessage alerts, which were sent from one of the
researcher’s computer to the iPhone in the desk every 45 seconds beginning after the baseline
measurements. The negative control did not experience any auditory distractions while they were
taking the Stroop test. The mean and standard deviation was found for all physiological data
collected. ANOVA and Tukey tests were used to further analyze data when appropriate.
The Stroop test used in this study was adapted by combining aspects of the original
Stroop test as well as the Victoria version. The original version of the Stroop Test consisted of
four parts (Stroop 1935). In the first part, the subjects had to read the names of colors written in
black ink. In the second part, they read the names of colors written in colored ink, with no
correlation between the name written and the color of the ink. In the third part, they had to say
the name of the color of squares. Finally, in the fourth part, the same stimuli were presented as in
the second part, but the subjects had to say the color of the ink with which the words had been
written, disregarding the actual words.

The Victoria version (Regard 1984) of the Stroop test has three parts. In the first part,
names of colors are presented written in black ink; in the second part, colored circles (red, blue,
yellow, green); and, in the last part, written words (names of colors) printed in colored ink,
without any correlation between the color of the ink and the written word. In the first step, the
subject must read the words as quickly as possible. In the second and third steps, the subject
must say the color of the circles and printed words, respectively. The Stroop test used in this
experiment consists of two parts similar to that of the Victoria version of the test. In the first part,
subjects will say the written word (names of colors) presented. In the second part, the subject
will say the color of the presented series of X’s or the written word, regardless of what the word
says. The stimuli will be presented in a timed succession.
Figure 1. Representation of experimental timeline for each participant.
Set up equipment,
measure initial BP,
heart rate, galvanic
skin response
Participants
fill out
survey
regarding
cell phone
type and
usage
Begin experiment,
take measurements
after initial segment
of Stroop test
Variable Time 3 Minutes 1.5 minutes 3.5 Minutes
Perform
remainder of
Stroop test
Take final
measurements,
debrief
Approximate Experimental Time: 10 minutes

Results
To analyze blood pressure measurements, systolic and diastolic pressures were used to
find pulse pressure and mean arterial pressure (Figure 2, Figure 3). These values were chosen for
analysis founded on the knowledge that analysis of systolic and diastolic pressure alone should
not be performed, and that interpretation should focus on pulse pressure and mean arterial
pressure (Levitzky and Raff 2011). Pulse pressure represents the force generated by the heart
during each contraction, and can be calculated as the difference between the systolic and
diastolic pressure readings. Group A participants averaged an initial pulse of pressure of 31.0 ±
4.6 mmHg, a post-baseline pulse pressure of 35.6 ± 11.3 mmHg and a final pulse pressure of
30.5 mmHg. Participants in group B had an initial pulse pressure of 42.3 ± 17.1 mmHg, followed
by 34.3 ± 8.9 mmHg after the baseline and 44.3 ± 14.7 mmHg at the end of the experiment.
Analysis of group C participants revealed an average pulse pressure of 36.5 ± 10.0 mmHg
initially, 37.2 ± 10.6 mmHg after the baseline and 40.3 ± 10.6 mmHg after the administration of
the Stroop test. Statistical analysis by the use of a Tukey significant difference test did not show
any significant differences between the initial, post-baseline and final pulse pressures for any of
the groups (Table 1). However, the analysis did show that the differences between the final pulse
pressures were significantly different among the three treatment groups (p=0.032).
Mean arterial pressure (MAP) represents the average arterial pressure during a cardiac
cycle, and was estimated using the diastolic pressure + ⅓ pulse pressure (Levitzky and Raff
2011), and the values were assessed and statistically analyzed. Analysis revealed that group A

had an average initial pressure of 87.3 ± 4.7 mmHg, a post-baseline pressure of 88.6 ± 8.5
mmHg, and a final pressure of 85.7 ± 7.3 mmHg. Assessment of group B revealed an average
initial MAP of 89.2 ± 5.2 mmHg, a post-baseline MAP of 91.4 ± 6.1 mmHg, and a final MAP of
89.6 ± 5.3 mmHg. Group C participants were found to have an average initial pressure of 89.0 ±
7.7 mmHg, a post-baseline pressure of 90.0 ± 7.6 mmHg, and a final pressure of 87.7 ± 8.1
mmHg. Although none of our values were statistically significant by the use of a Tukey
significant difference test (Table 2).
Galvanic skin response measurements recorded throughout the entire duration of the
experiment were analyzed with regards to their average values, range of values during the
duration of the experiment, and the difference between initial and final readings recorded by the
equipment (Figure 4). Mean values included 6.85 ± 4.60 µS for group A, 6.72 ± 4.54 µS for
group B and 4.1 ± 2.4 µS for group C. The mean of the range of values for group A was 2.95 ±
2.48 µS, 1.84 ± 1.86 µS for group B, and 1.70 ± 0.93 µS for group C. Group A analysis
comparing the initial and final values averaged 0.13 ± 2.92 µS, while group B averaged 0.69 ±
1.24 µS and group C averaged 0.65 ± 0.78 µS. ANOVA analysis did not reveal any p values
below 0.05, and therefore imply that there is a lack of statistical evidence to suggest the GSR
means, GSR ranges, or GSR differences are significant (Table 3).
The final physiological parameter measured and analyzed was heart rate (Figure 5).
Although data was collected every fifteen seconds, four main time points were used for analysis:
once for the baseline (Time point zero to 1:15 minutes), and three time points corresponding to
the estimated time of texts sent and heard by the participants (2:30, 3:15 and 4:00 minutes). The
mean for group A during the baseline was 71.0 ± 5.1 beats/minute, while the mean for groups B
and C were 75.5 ± 11.4 beats/minute and 73.1 ± 10.2 beats/minute, respectively. The mean
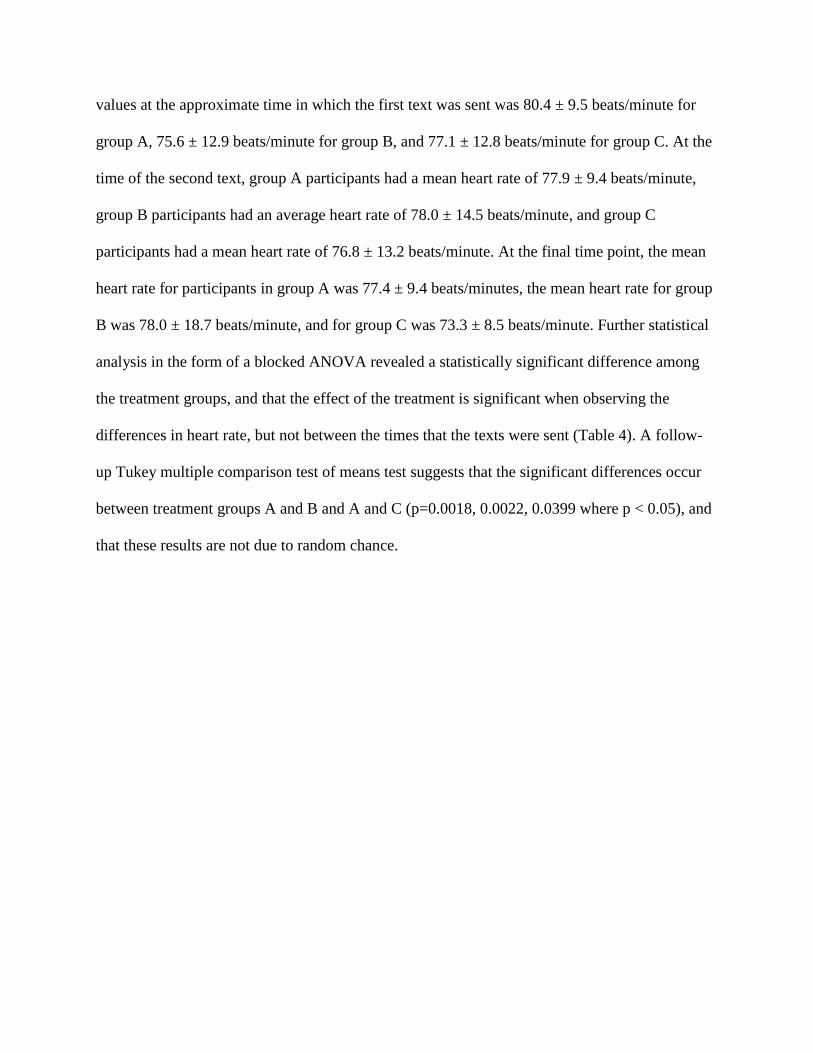
values at the approximate time in which the first text was sent was 80.4 ± 9.5 beats/minute for
group A, 75.6 ± 12.9 beats/minute for group B, and 77.1 ± 12.8 beats/minute for group C. At the
time of the second text, group A participants had a mean heart rate of 77.9 ± 9.4 beats/minute,
group B participants had an average heart rate of 78.0 ± 14.5 beats/minute, and group C
participants had a mean heart rate of 76.8 ± 13.2 beats/minute. At the final time point, the mean
heart rate for participants in group A was 77.4 ± 9.4 beats/minutes, the mean heart rate for group
B was 78.0 ± 18.7 beats/minute, and for group C was 73.3 ± 8.5 beats/minute. Further statistical
analysis in the form of a blocked ANOVA revealed a statistically significant difference among
the treatment groups, and that the effect of the treatment is significant when observing the
differences in heart rate, but not between the times that the texts were sent (Table 4). A follow-
up Tukey multiple comparison test of means test suggests that the significant differences occur
between treatment groups A and B and A and C (p=0.0018, 0.0022, 0.0399 where p < 0.05), and
that these results are not due to random chance.

Figure 2. Pulse pressure values obtained from the difference between systolic and diastolic
pressures taken at three times throughout the duration of the experiment for the three treatment
groups.
Group
Means Initial Post Final
ANOVA
p-values
A 31.0 35.6 30.5 0.290
B 42.3 34.3 44.3 0.336
C 36.5 37.2 40.3 0.701
ANOVA
p-values 0.149 0.841 0.032
Table 1. ANOVA P values comparing calculated values of pulse pressure among the three
experimental groups at initial, post-baseline and final time points.
0
10
20
30
40
50
60
70
Initial Post-Baseline Final
Pre
ssu
re (
mm
Hg)
Readings
Pulse Pressure
Group A
Group B
Group C

Figure 3. Mean arterial pressure values estimated as the sum of diastolic pressure plus one third
of the pulse pressure measured at three times throughout the duration of the experiment for the
three treatment groups.
Group
means Initial Post Final
ANOVA
p-values
A 87.3 88.6 85.7 0.681
B 89.2 91.4 89.6 0.694
C 89.0 90.0 87.7 0.829
ANOVA
p-values 0.779 0.735 0.532
Table 2. ANOVA P values comparing calculated values of mean arterial pressure among the
three experimental groups at initial, post-baseline and final time points.
0
20
40
60
80
100
120
Initial Post-Baseline Final
Pre
ssu
re (
mm
Hg)
Readings
Mean Arterial Pressure
Group A
Group B
Group C
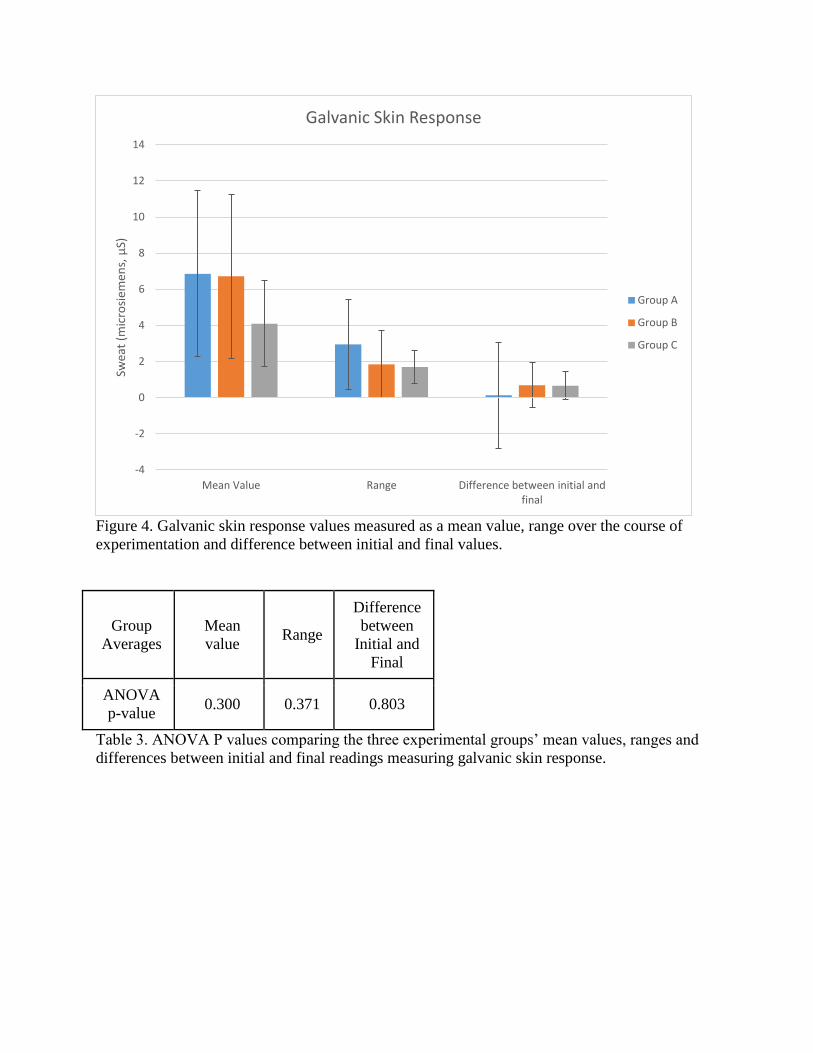
Figure 4. Galvanic skin response values measured as a mean value, range over the course of
experimentation and difference between initial and final values.
Group
Averages
Mean
value Range
Difference
between
Initial and
Final
ANOVA
p-value 0.300 0.371 0.803
Table 3. ANOVA P values comparing the three experimental groups’ mean values, ranges and
differences between initial and final readings measuring galvanic skin response.
-4
-2
0
2
4
6
8
10
12
14
Mean Value Range Difference between initial and final
Swea
t (m
icro
siem
ens,
µS)
Galvanic Skin Response
Group A
Group B
Group C

Figure 5. Heart rate gathered as a baseline, and at the approximate time period in which each text
message was sent. The baseline results were averaged over the course of the first 1:15 minutes of
the experiment.
ANOVA
Values
Initial
p- value
Post-
Baseline
p-value
Final
p-
value
Group A 0.0018 0.0022 0.0399
Group B 0.9085 0.7698 0.9858
Group C 0.0633 0.2594 0.9532
Table 4. P values gathered from blocked ANOVA testing for comparing the treatment groups at
the first, second and third text times.
Discussion
Study participants performed well on the Stroop test with the overwhelming number of
participants performing with 100% accuracy, and therefore this data was not analyzed. Reaction
time could not be accurately recorded due to the use of PowerPoint, coupled with the inability to
locate an affordable online Stroop test that would allow for the collection of significant data
0
20
40
60
80
100
120
Baseline 02:30 03:15 04:00
He
art
Rat
e (
be
ats/
min
ute
)
Time (minutes)
Heart Rate Over Time
Group A
Group B
Group C

points. Other computerized versions of the Stroop test, such as the Cengage Learning CogLab’s
Stroop test, include a reaction time from when the stimulus is presented to when the participant
responds, and/or a response by pressing the corresponding key on the keyboard for their answer,
rather than saying the color aloud. In the future, these two factors may provide more insight in
our study, as we would expect those who were in the B and C groups to have a longer response
time as well as more inaccuracy when compared compared to group A.
The environment of the testing room likely played a large role in the data collection
process. The testing room itself was surrounded by other testing rooms and also provided limited
cell phone service, which are two factors that may have significantly affected our data collection.
The testing room was located near other rooms where experiments were being conducted.
Several times throughout the experiment, there were unintentional disruptions such as other
groups conversing, people knocking, and individuals entering the room during a test. The room
was also located in a place where the experimenters had limited cell phone reception. This
resulted in times in which there was a delay in sending text messages, or even times in which the
messages were not able to be sent at all, which prevented accurate testing of the participants.
Future experimentation should seek to incorporate a location in which cell phone service is
readily available, and that is quiet enough to allow for differentiation between the control and
distraction groups.
Blood Pressure
Based on our results, there was no statistically significant difference between the initial,
post-baseline, and final blood pressure readings. From Figures 2 and 3, it can be inferred that
systolic and diastolic blood pressure remained relatively constant after the initial reading. Blood
pressure rises and falls throughout the day, and is affected by what you eat, how much you sleep,
how much you are moving and the level of stress you feel. We expected that the distractions
experienced by groups B and C would partially raise the third blood pressure reading, as
compared to group A. This was not evident in our data when comparing individual systolic and
diastolic pressures. There could be two reasons for this: either the participants were
concentrating on the Stroop test and not bothered by the distractions or that the study was too
short in duration to see a significant change in blood pressure.
After reviewing the blood pressure data, we found that it would be more meaningful to
analyze the pulse pressure, the pressure difference between the systolic and diastolic readings.
When compared between the experimental and control groups, there was not much of a
difference in pulse pressure before and after the baseline Stroop test. However, compared to
group A the final pulse pressure of groups B and C were significantly higher. For a healthy
person, the pulse pressure is around 40 mmHg. Group A was lower, group C was similar to that
number,and group B was slightly higher than that average number. While the data is not
statistically significant, an improved experimental design may be able to verify these observed
results.
Galvanic Skin Response
From Figure 5, the finger sweat accumulated between the initial and final reading was
very low across all groups. In conjunction with heart rate and blood pressure, the participants did
not indicate that they felt any anxiety from the distractions presented to groups B and C.
Therefore, they did not accumulate any significant amount of sweat after the initial reading. The
time frame between the initial reading and the end of the Stroop test averaged only about 5
minutes per test, and this may be an inadequate time frame to observe any appreciable difference
in the GSR to distractions.

Heart Rate
In Figure 6, the heart rate was recorded at the baseline and the estimated times at which
the first, second, and third text messages received by group B. The ANOVA analysis showed
that there was a statistically significant difference in heart rate between the initial baseline
reading compared to the fourth reading (third text message received) over time, but not in-
between the time the texts were sent (Table 3). Among all groups, the average heart rate
increased 30 seconds after the baseline, after the actual Stroop test began. By the end of the test,
their average heart rate had nearly returned to the baseline reading. This data suggests that the
participants felt some anxiety from the change in colored X’s to congruent and incongruent color
words. After they accustomed to the Stroop test, they no longer felt anxiety and their heart rates
returned to normal. Additionally, although the heart rate showed statistically significant
differences in the heart rate over time, it did not indicate that the participants’ heart rates
increased because they were distracted by the cell phone vibrations or whispering. Therefore, for
the purposes of this study the heart rate data was also statistically insignificant.
Overall, the differences in the data collected for blood pressure and GSR were
statistically insignificant. The ANOVA analysis for heart rate showed some statistical
significance for a change in heart rate over time among the groups, however, it did not show a
difference after the texts were sent successively in the experimental group. We hypothesized that
cell phone distractions in the form of vibrations would cause a sympathetic response to occur in
participants our experimental group similar to that of our positive control group who received the
whispering distraction. The data analysis for blood pressure, GSR, and heart rate, did not
reinforce our hypothesis, showing no statistical significant differences between the experimental
and control groups.

For future experiments, there are numerous adjustments that could be taken into
consideration to improve accuracy and assist in determining if a relationship exists between cell
phone vibrations and an increased sympathetic response. First, the environment should be in an
area free of disruptions and have sufficient cell phone reception to ensure that outside
interruptions could not influence testing. Secondly, a computerized Stroop test could be used to
record reaction time and accuracy of key responses. Reaction time and accuracy could provide
some insight on anxiety caused by cell phone distractions. We would expect that the
experimental group with the cell phone distractions and the positive control group would be
distracted causing a longer reaction time and more inaccurate responses. Thirdly, the survey
given to the participants before the experiment could be analyzed and connected to our
physiological data (Appendix B). This survey could provide useful information by comparing the
three participant groups and their response for the number of times they check their cell phones
while studying, or during lecture. We would predict that students who check their phones at a
higher frequency would experience more anxiety when exposed to a cell phone vibration. Also,
the survey could provide useful information by comparing the mode of notification (silent,
vibrate, loud) participants keep their cell phones on with the response that was experienced to a
cell phone vibration. It would be expected that the participants who keep their cell phones on
vibrate would experience a greater sympathetic response than the participants who keep their
phones on other modes.
It is important to mention that regardless of the type of Stroop test utilized, the duration
of the test should be extended. More time could provide some implications for physiological
responses that take time to occur. In a 2014 study by Cheever et. al, participants were split into a
control group where users were allowed to keep their cell phones on silent and placed out of
sight and an experimental group where their cell phones were taken away from them. The
State/Trait Anxiety Inventory was administered three times, twenty minutes apart from each
time. Their study implicated that heavy cell phone users and moderate cell phone users whose
phones were taken away felt more anxiety as each successive test was measured, due to their
dependency of their cell phones. This suggests that five minutes was not a sufficient amount of
time for frequent cell phone users to feel anxiety, and that this time should be extended to see if
it invokes a sympathetic response in participants.
We could also take a different route and use a different form of cognitive testing, such as
a format where participants read a passage and answer questions regarding that passage. The
Stroop test may have been too simple of a test, considering the 29 participants had almost 100%
accuracy overall. In a study by End et al., experimenters had participants take notes during a
video presentation and later take a multiple choice test. They had two groups, the control where
there were no cell phone rings and an experimental group that received cell phone rings. They
found that the group that received cell phone rings performed significantly worse than the control
group, with an average of 69% accuracy compared to 95% for the control group. This further
reinforces our notion that a different form of testing should be utilized to assess cell phone
distractions on cognitive flexibility.
A final consideration would be the type of physiological parameters chosen to measure
sympathetic responses. Future experimentation could employ an electroencephalogram (EEG) as
one of our physiological parameters. The EEG was discontinued from use in this study due to an
inability to obtain adequate data using the Biopac equipment. An EEG displays electrical activity
in response to a stimulus and could show changes in brain waves when presented with
distractions. Additionally, activation of a sympathetic response could have been measured by

using the Respiratory Cycle I Biopac System. According to the Biopac Systems lab manual, “the
Respiratory Cycle I is used to measure chest expansion and contraction and modifications in the
rate and depth of the breathing cycle due to cerebral influence and chemoreceptor influence on
the medullary control centers” (Kremer, P-1). We would predict that with an increased
sympathetic response due to cell phone anxiety, the subjects would experience an increased
respiration rate, while the depth of their breathing cycle would decrease. Overall, this experiment
presents a layout in which future experiments can abstract and modify to obtain better data in
hopes of proving the given hypothesis.
Citations
Cheever, N., Rosen, L., Carrier, M., Chavez, A. (2014). Out of sight is not out of mind: The
impact of restricting wireless mobile device use on anxiety levels among low,
moderate and high users. Computers in Human Behavior. 37, 290–297
End, C., Worthman, S., Mathews, M.B., and Wetterau, K. (2010). Costly Cell Phones: The
Impact of Cell Phone Rings on Academic Performance. Teaching of Psychology 37(1),
55-57.
Flaudias, V., & Llorca, P. (2014). A brief review of three manipulations of the Stroop task
focusing on the automaticity of semantic access, 54(2), 199–221.
Junco R (2012). In-class multitasking and academic performance. Comput Human Behav 28,
2236–2243.
Kremer, Jocelyn Mariah, et al. Biopac Student Laboratory Manual. Goleta: BIOPAC Systems
Inc, 2012. Print.
Leber, A. B., Turk-Browne, N. B., & Chun, M. M. (2008). Neural predictors of moment-to-
moment fluctuations in cognitive flexibility. Proceedings of the National Academy of
Sciences of the United States of America, 105(36), 13592–7. doi:10.1073/pnas.0805423105
Lepp A, Barkley JE & Karpinski AC (2014). The relationship between cell phone use, academic
performance, anxiety, and Satisfaction with Life in college students. Comput Human Behav
31, 343–350.

Levitzky MG and Raff H (2011). Medical Physiology: A Systems Approach. New York,
McGraw-Hill Medical pp. 261.
Naveh-Benjamin M, Craik FIM, Gavrilescu D & Anderson ND (2000). Asymmetry between
encoding and retrieval processes: Evidence from divided attention and a calibration
analysis. Mem Cognit 28, 965–976.
Regard, M. (1984). Cognitive rigidity and flexibility: A neuropsychological study. In O. Spreen
& E. Strauss (Eds.), A compendium of neuropsychological tests. Oxford, MA: Oxford
University Press.
Roberts JA, Yaya LHP & Manolis C (2014). The invisible addiction: Cell-phone activities and
addiction among male and female college students. J Behav Addict 3, 254–265.
Rosen LD, Lim AF, Carrier LM & Cheever NA (2011). An Empirical Examination of the
Educational Impact of Text Message-Induced Task Switching in the Classroom :
Educational Implications and Strategies to Enhance Learning Un Estudio Empírico del
Efecto de los Cambios de Tarea en el Aula Inducidos por los Mensajes de Texto :
Implicaciones para la Enseñanza y Estrategias para la Mejora del Aprendizaje. 17, 163–177.
Shambare R, Rugimbana R & Zhowa T (2012). Are mobile phones the 21st century addiction?
African J Bus Manag 6, 573–577.
Stroop J R (1935). Studies of interference in serial verbal reaction. Journal of Experimental
Psychology, 18, 643-662.
Urbaniak G C & Plous S (2013). Research Randomizer (Version 4.0) [Computer software].
Retrieved on March 3, 2015, from http://www.randomizer.org/.
TheWaterwhispers (2012, Dec. 09). ASMR Whispering - Old Jewellery Collection (Show &
Tell) [Video File]. Retrieved on March 3, 2015.
https://www.youtube.com/watch?v=AvSEdQ4aaTc
Tindell DR & Bohlander RW (2012). The Use and Abuse of Cell Phones and Text Messaging in
the Classroom: A Survey of College Students. Coll Teach 60, 1–9.

Appendix A
UNIVERSITY OF WISCONSIN-MADISON
Research Participant Information and Consent Form
Title of the Study: Physiological Response to Stroop Test
Principal Investigators: Lina Nguyen, Clayton Rowe, Stephanie Rosicki, Haley Schoenberger
DESCRIPTION OF THE RESEARCH
You are invited to participate in a research study about cognitive flexibility.
You have been asked to participate because you are a student enrolled at UW-Madison.
The purpose of the research is to test the physiological responses to a Stroop test by measuring
several physiological parameters, including heart rate, blood pressure and galvanic skin response.
This study will invite the participation of all students enrolled at UW-Madison.
This research will take place within Physiology 435 laboratory sections.
WHAT WILL MY PARTICIPATION INVOLVE?
If you decide to participate in this research you will be asked to perform a Stroop test.
Your participation will last approximately 15 minutes.
After the semester is completed, our results will be published in an online journal where you will
have the option to view our results.
No credit will be assigned for your complete and voluntary participation. If you do not wish to
participate, simply return this blank consent form.
.ARE THERE ANY RISKS TO ME?
There are no known risks associated with your participation.
ARE THERE ANY BENEFITS TO ME?
There are no known benefits associated with your participation.
HOW WILL MY CONFIDENTIALITY BE PROTECTED?

While there may be printed reports as a result of this study, your name will not be used. Only
group characteristics will be reported – that is results with no identifying information about
individuals will be used in any reported or publicly presented work.
WHOM SHOULD I CONTACT IF I HAVE QUESTIONS?
Haley Schoenberger, [email protected]
If you are not satisfied with response of research team, have more questions, or want to talk with
someone about your rights as a research participant, you should contact Dr. Andrew Lokuta,
608-263-7488, [email protected].
Your participation is completely voluntary. If you decide not to participate or to withdraw from
the study it will have no effect on your grade in this class.
Your signature indicates that you have read this consent form, had an opportunity to ask any
questions about your participation in this research and voluntarily consent to participate.
Name of Participant (please print):______________________________
_________________________________________________ ________________________
Signature Date

Appendix B