the effects of creatine supplementation on total work
TRANSCRIPT

Louisiana State UniversityLSU Digital Commons
LSU Historical Dissertations and Theses Graduate School
1995
The Effects of Creatine Supplementation on TotalWork Output and Metabolism During High-Intensity Intermittent Exercise.Michael Cory PrevostLouisiana State University and Agricultural & Mechanical College
Follow this and additional works at: https://digitalcommons.lsu.edu/gradschool_disstheses
This Dissertation is brought to you for free and open access by the Graduate School at LSU Digital Commons. It has been accepted for inclusion inLSU Historical Dissertations and Theses by an authorized administrator of LSU Digital Commons. For more information, please [email protected].
Recommended CitationPrevost, Michael Cory, "The Effects of Creatine Supplementation on Total Work Output and Metabolism During High-IntensityIntermittent Exercise." (1995). LSU Historical Dissertations and Theses. 6129.https://digitalcommons.lsu.edu/gradschool_disstheses/6129
INFORMATION TO USERS
This manuscript has been reproduced from the microfilm master. UMI films the text directly from the original or copy submitted. Thus, some thesis and dissertation copies are in typewriter face, while others may be from any type of computer printer.
The quality of this reproduction is dependent upon the quality of the copy submitted. Broken or indistinct print, colored or poor quality illustrations and photographs, print bleedthrough, substandard margins, and improper alignment can adversely affect reproduction.
In the unlikely, event that the author did not send UMI a complete manuscript and there are missing pages, these will be noted. Also, if unauthorized copyright material had to be removed, a note wiD indicate the deletion.
Oversize materials (e.g., maps, drawings, charts) are reproduced by sectioning the original, beginning at the upper left-hand comer and continuing from left to right in equal sections with small overlaps. Each original is also photographed in one exposure and is included in reduced form at the back of the book.
Photographs included in the original manuscript have been reproduced xerographically in this copy. Higher quality 6" x 9" black and white photographic prints are available for any photographs or illustrations appearing in this copy for an additional charge. Contact UMI directly to order.
A Beil & Howell Information Company 300 North Zeeb Road. Ann Arbor. Ml 48106-1346 USA
313/761-4700 800/521-0600

THE EFFECTS OF CREATINE SUPPLEMENTATION ON TOTAL WORK OUTPUT AND METABOLISM DURING
HIGH INTENSITY INTERM ITTENT EXERCISE
A Dissertation
Submitted to the Graduate Faculty of the Louisiana State University and
Agricultural and Mechanical College in partial fulfillment of the
requirements of the degree of Doctor of Philosophy
in
The Department of Kinesiology
byMichael Cory Prevost
B.A., University of Southwestern Louisiana, 1990 December 1995
UMI Number: 9618319
UMI Microform 9618319 Copyright 1996, by UMI Company. All rights reserved.
This microform edition is protected against unauthorized copying under Title 17, United States Code.
UMI300 North Zeeb Road Ann Arbor, MI 48103

TABLE OF CONTENTS
list of Tables
list of Figures... .....____ ....____*.__ ____.....____ ...._______ ..vi
Abstract ...____ .....____ ....__________ ......_____ .viii
Chapter1. Introduction ............ 1
1.1 Project Rationale.....________ ...____ ....._____ 51.2 Hypothesis... ______________ .61.3 Objectives
2. literature Review.................. 82.1 Intermittent Exercise ......................................... 82.2 Creatine and Control of the Creatine Pool 162.3 Creatine Supplementation Studies...................19
3. Materials and Methods.................................................243.1 Basic Design____________ 243.2 Subjects_______________________________253.3 Supplementation_______............. 273.4 V02 Peak.__________________________ 273.5 Standardized Exercise Bouts.....________ 283.6 Blood Draws and Analysis................................. 293.7 Oxygen Consumption.................................................303.8 Urinary Creatinine..........................._______ ........303.9 Statistical Analysis............................................. 31
4. Results ______ 324.1 Time to Exhaustion.............................................324.2 Oxygen Consumption.........................................344.3 Plasma Lactic Add_______________________394.4 Urinary Creatinine_______ ............... 394.5 Regression of Body Weight and Fitness on
Improvement in Total Work Output................44
5. Discussion 45
6. Summary and Condusions_______ .............. ......__ ....65

Bibliography. ..................______ .............. 69
Appendix A: Consent Form........................................._________ ....74
Appendix B: Physical Activity Readiness Questionnaire........77
Appendix C: Anova Tables.. ........_____ ......____..................78
Appendix D: Raw Data. «...____ .83
Vita 116
LIST OF TABLES
Table 3.1. Subject Characteristics.______________________ 26
Table C.1. A Lactate Creatine ......._____ _______ _____78
Table C.2. B Lactate Creatine............____......_____.....____ .......78
Table C.3. B Lactate Placebo. ......_______ ....____78
Table C.4. C Lactate Creatine....________________________ 78
Table C.5. C Lactate Placebo ...... 79
Table C.6. D Lactate Creatine.................................................... 79
Table C.7. D Lactate Placebo ......____ ......._____ ...____ 79
Table C.8. A V02 Creatine _________ 79
Table C.9. A V02 Placebo............... 80
Table C.10. B V02 Creatine.........................................................80
Table C.11. B V02 Placebo_________________ 80
Table C.12. C V02 Creatine____________________________ 80
Table C.13. C V02 Placebo._________ 81
Table C.14. D V02 Creatine......_____________ 81
Table C.15. D V02 Placebo__________________ 81
Table C.16. Creatine Time to Exhaustion.....................................81
Table C.17. Placebo Time to Exhaustion..................................... 82
Table C.18. Creatine Time to Exhaustion Gain........................... 82
Table D.l. Time to Exhaustion Data________ ...83
iv

Table D.2. V02 Data Bout A.______ .........___ ...............................86
Table D.3. V02 Data Bout B-----------------------------------------89
Table D.4. V02 Data Bout C___________________________ 91
Table D.5. V02 Data Bout D.................................. 96
Table D.6. Lactate Data Bout A............ .............................105
Table D.7. Lactate Data Bout B________ ...___ ..._________ 107
Table D.8. Lactate Data Bout C......_______________ 109
Table D.9. Lactate Data Bout D_______________________ 111
Table D.10. Urinary Creatinine................................................. 113
v
LIST OF FIGURES
Figure 3.1. Study Flowchart ............................................... 26
Figure 4.1. Time to Exhaustion - Phase x Bout, Creatine Group.._________________ ...________ — ___-33
Figure 4.2. Time to Exhaustion - Phase x Bout, Placebo G roup-.....—.-______________ ________ .— ________ 34
Figure 4.3. V02 For Phase 1 and 2, Bout D, Creatine Group________ — .35
Figure 4.4. V02 For Phase 1 and 2, Bout D, Placebo Group 35
Figure 4.5. V02 For Phase 1 and 2, Bout C, Creatine Group— ...— .— —.—36
Figure 4.6. V02 For Phase 1 and 2, Bout C, PlaceboGroup____________ 36
Figure 4.7. V02 For Phase 1 And 2, Bout B, CreatineGroup____________________ — 37
Figure 4.8. V02 For Phase 1 and 2, Bout B, Placebo G roup---...---.--..--.-...-— — .— —.— .— — .— — .37
Figure 4.9. V02 For Phase 1 and 2, Bout A, Creatine Group.____________________________________ —______ 38
Figure 4.10. V02 For Phase 1 and 2, Bout A, Placebo Group_______________ 38
Figure 4.11. Lactate For Phase 1 and 2, Bout D, Creatine Group__________________________ ...40
Figure 4.12. Lactate For Phase 1 and 2, Bout D, Placebo Group-__________ ...
Figure 4.13. Lactate For Phase 1 and 2, Bout C, Creatine Group______________ .— ________ — _____ — .41

Figure 4.14. Lactate For Phase 1 and 2, Bout C, Placebo Group- _________________________________ 41
Figure 4.15. Lactate For Phase 1 and 2, Bout B, Creatine Group ________ 42
Figure 4.16. Lactate For Phase 1 and 2, Bout B, Placebo Group________ „.42
Figure 4.17. Lactate For Phase 1 and 2, Bout A, Creatine Group ______________________ .43
Figure 4.18. Lactate For Phase 1 and 2, Bout A, Placebo Group ________________________ .43
Figure 4.19. Urinary Creatinine For the Creatine And Placebo Groups.... .44
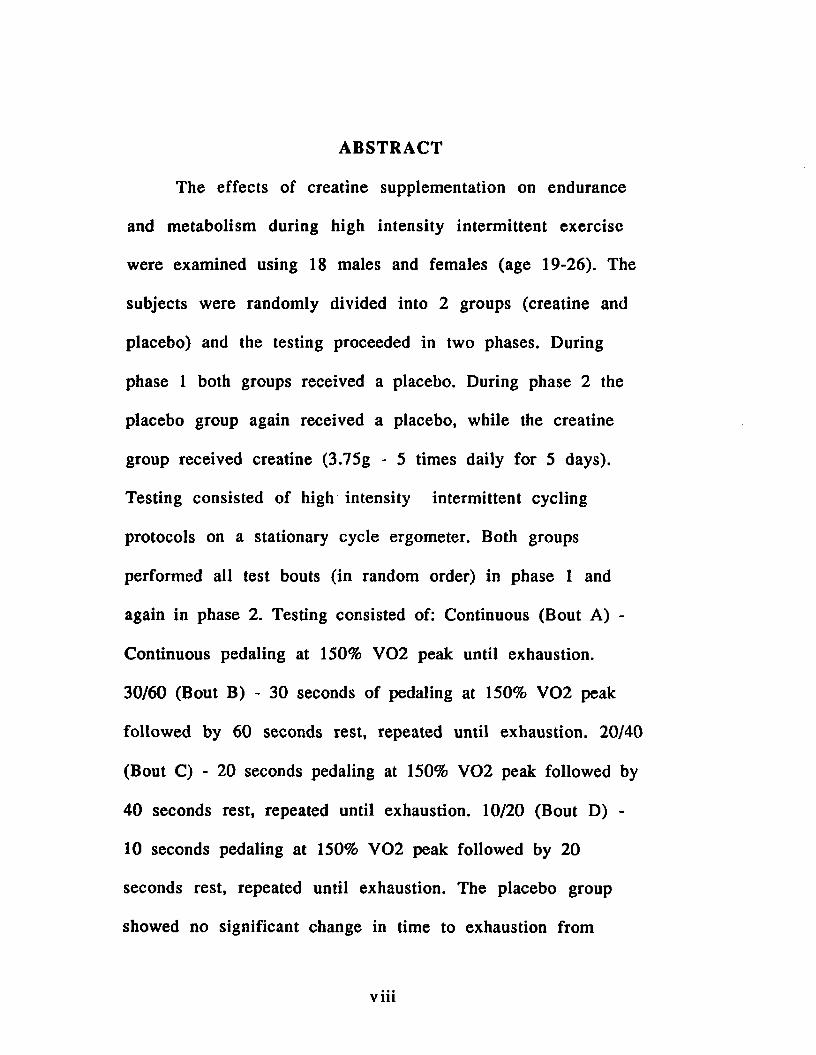
ABSTRACT
The effects of creatine supplementation on endurance
and metabolism during high intensity intermittent exercise
were examined using 18 males and females (age 19-26). The
subjects were randomly divided into 2 groups (creatine and
placebo) and the testing proceeded in two phases. During
phase 1 both groups received a placebo. During phase 2 the
placebo group again received a placebo, while the creatine
group received creatine (3.75g - 5 times daily for 5 days).
Testing consisted of high intensity intermittent cycling
protocols on a stationary cycle ergometer. Both groups
performed all test bouts (in random order) in phase 1 and
again in phase 2. Testing consisted of: Continuous (Bout A) -
Continuous pedaling at 150% V 02 peak until exhaustion.
30/60 (Bout B) - 30 seconds of pedaling at 150% V 02 peak
followed by 60 seconds rest, repeated until exhaustion. 20/40
(Bout C) - 20 seconds pedaling at 150% V 02 peak followed by
40 seconds rest, repeated until exhaustion. 10/20 (Bout D) -
10 seconds pedaling at 150% V 02 peak followed by 20
seconds rest, repeated until exhaustion. The placebo group
showed no significant change in time to exhaustion from

phase 1 to phase 2 for any of the bouts tested. The creatine
group, however, showed a significant increase in time to
exhaustion on all bouts. Bout D was impacted significantly
more than the other bouts with a more than twofold increase
in time to exhaustion, (note that bout D was truncated before
subjects reached exhaustion because even at twice the
performance time of phase 1 subjects reported feeling very
little fatigue and the ability to continue indefinitely). Oxygen
consumption did not change from phase 1 to phase 2 for the
placebo group, while the creatine group showed a significantly
lower rate of oxygen consumption on bouts D and C. Blood
lactic acid values were also lower on bouts C and D for the
creatine group only. Therefore creatine supplementation
significantly impacted performance of high intensity
interm ittent exercise.

CHAPTER 1 ■ INTRODUCTION
Short duration (5-20 second) maximal intensity
exercise relies mainly on the phosphagen system to meet
energy demands and anaerobic glycolysis to replenish
adenosine triphosphate (ATP) and phosphocreatine (PCr)
stores. This type of high intensity exercise can be maintained
for only brief periods unless it is performed in intermittent
fashion. Astrand et al. (1960) showed that when a subject
exercised at a very high intensity (412 watts), exercise could
be maintained for only 3 minutes. If the subject then
exercised at the same intensity for 1 minute and then rested
for 1 minute, exercise could be maintained for 24 minutes
before the subject became completely exhausted. However,
since rest periods were included, the total work done per unit
of time was reduced. Astrand et al. (1960) found that if both
the total work done in 30 minutes and the work to rest ratio
is held constant (1:2) that the most important factor in
determining the onset of fatigue is the length of the exercise
period. It was found that blood lactate levels increased with
work to rest ratios of 60:120 seconds and 30:60 seconds, but
not a ratio of 10:20 seconds. Therefore, high intensity exercise
of a 10 second duration could yield the same amount of work

in 30 minutes as the longer exercise periods with no blood
lactate accumulation and no feeling of fatigue. Astrand et al.
(1960) suggested that during the shorter work periods ATP
demand was met by oxidative metabolism utilizing myoglobin
oxygen stores, since lactate levels did not increase. Later
research (Saltin et al. 1976 and Essen 1978) showed that
during intense exercise lasting 5 to 20 seconds that ATP and
PCr levels were decreased. These ATP and PCr stores were
replenished during rest periods. More recent work by
Gaitanos et al. (1993) suggests that work bouts of only 6
seconds can proceed with a significant contribution from
anaerobic glycolysis. It was demonstrated that 6 second
maximal cycle sprints resulted in increased lactate levels
indicating a significant contribution from anaerobic glycolysis.
This is possibly because the ATP and PCr stores were depleted
more rapidly at this higher intensity level. These results
suggest that intermittent exercise with brief work periods
(10s) may rely mainly on the phosphagen system to meet
energy demands with anaerobic glycolysis contributing
significantly only during longer work periods (>30s) or during
shorter work periods if the intensity is high.

It has also been shown by Gaitanos et al. (1993) that
during the final bout (bout 10) of 6 second maximal cycle
sprints that the contribution of glycolysis to ATP resynthesis
was decreased and that the contribution from PCr to ATP
production was increased from 49.6% (bout 1) to 80% (bout
10). Also, Bogdanis et al. (1993) found that the recovery of
power output during 30 second cycle ergometer sprints is
correlated with muscle PCr levels and not lactate levels.
These findings suggest that PCr plays a dominant role in the
maintenance and recovery of power during high intensity
interm ittent exercise.
PCr levels can be increased in skeletal muscle through
oral creatine supplementation. Harris et al. (1992) found that
supplementation with 5g of creatine monohydrate four to six
times a day for a total of 20-30g for two or more days
resulted in a significant increase in total creatine content of
the quadriceps femoris muscle. Creatine uptake during the
first two days accounted for 32% of the administered dose
with 20% to 40% of the sequestered creatine present as PCr.
Total creatine content in skeletal muscle was increased by up
to 50%. Further work by Greenhaff et al. (1993) showed that

oral creatine supplementation accelerated PCr resynthesis
following intense isometric contractions.
Creatine supplementation has been shown to enhance
performance during high intensity exercise. Balsom et al.
(1993) found a smaller decline in work output during high
intensity intermittent cycling following creatine
supplementation. There was also a decrease in lactate and
hypoxanthine accumulation. In addition, Greenhaff et al.
(1993) showed that plasma ammonia accumulation was lower
during and after exercise during the final 10 contractions of
five bouts of 30 maximum voluntary isokinetic contractions.
These decreases in plasma ammonia and hypoxanthine
accumulation (indicating a reduced adenine nucleotide
degradation) indicate an increased reliance on creatine
phosphate rather than the myokinase reaction to remove
ADP. The increased PCr levels in skeletal muscle following
creatine supplementation may have enhanced performance of
intense exercise by increasing the rate of ATP resynthesis
during exercise (Greenhaff et al„ 1993A) and the rate of PCr
resynthesis during recovery from intense exercise (Greenhaff
et al. 1993B).

1.1 - Project Rationale
In normal daily activities muscular work is seldom
performed for an extended period of time and so steady state
is seldom achieved. Most muscular work involves short bursts
of activity followed by periods of rest (intermittent exercise).
Also many popular sports involve short bursts of activity
followed by a rest period or a period of reduced activity
(football, basketball, baseball, tennis) and so performance in
these sports may be related to the ability to maintain high
performance levels in intermittent exercise rather than
maximum aerobic power or endurance. Since many of these
activities involve extended performance of intermittent
exercise, any treatment that could prolong the onset of fatigue
during these activities would be of considerable benefit.
Although creatine has led to a greater amount of total work
during repeated Wingate tests (Earnest et al., 1993) and a
smaller decline in work output during high intensity cycling
(Balsom et al., 1993) it has not yet been demonstrated that
creatine supplementation can prolong the performance of high
intensity intermittent exercise.

1.2 - Hypothesis
1. Creatine supplementation will increase total work output
during all of the exercise bouts.
2. Plasma lactic acid accumulation will be lower during
exercise following creatine supplementation versus placebo.
3. Exercise will proceed with a lower rate of oxygen
consumption during the creatine supplementation period.
4. Response to creatine supplementation will be inversely
related to fitness level and body weight.
5. The 10/20 bout will be impacted by creatine
supplementation to a greater extent than the other bouts.
6. Urinary creatinine will be significantly increased by
creatine supplementation.
1.3 - Objectives
1. Determine if creatine supplementation increases total work
output during high intensity intermittent exercise by
examining time to exhaustion during several intermittent
exercise bouts on creatine versus placebo.
2. Determine if creatine supplementation leads to a lower
accumulation of lactic acid during high intensity intermittent
exercise.

4. Determine if oxygen consumption during intermittent
exercise is affected by creatine supplementation.
5. Determine which bout (continuous, 10/20, 20/40,30/60)
benefits the most from creatine supplementation.
6. Determine if body weight or fitness level is related to
magnitude of response to creatine supplementation.
7. Determine if urinary creatinine concentration is increased
following creatine supplementation.

CHAPTER 2 - LITERATURE REVIEW
2.1 - Intermittent exercise
Intermittent exercise can be defined as exercise
consisting of repeated bouts of work interspersed with
recovery periods. Intermittent exercise has an advantage over
continuous exercise in that it can be maintained for a longer
period of time before fatigue ensues. Astrand (1970) showed
that a subject whose V 02max was 4.6 liters.min'1 could
exercise at 350 watts for 8 minutes. If the same subject
exercised at 350 watts in an intermittent fashion, 3 minutes of
exercise alternated with 3 minute rest periods, the subject
could continue exercise for one hour. However, since rest
periods were included there was less work done per unit of
time than continuous exercise at the same intensity. In a
second series of experiments Astrand (1970) exercised the
same subject (same subject used in the previous study) at 412
watts for 30 minutes in several bouts; continuous, 60 sec.
work /120 sec. rest, 30 sec. work / 60 sec. rest, 10 sec. work /
20 sec. rest. By holding the work to rest ratio constant (1/2)
the same amount of work would be done per unit of time
during all of the bouts. This allowed Astrand to investigate the
effect of adjusting the length of the work period, while

9
maintaining the same work rate, on the performance of
intermittent exercise. Even though the same amount of work
was produced in 30 minutes (247 KJ) in all of the
intermittent bouts there was no feeling of fatigue and lactate
levels did not exceed 2 mM during the intermittent bout with
the shortest work period (10/20), while during the 60/120
bout lactate levels rose to 15.7 mM and the subject could
continue for only 24 minutes. Intermediate results were
found with the 30/60 intermittent bout. Thus the critical
factor in determining the onset of fatigue was the length of
the work bout. Astrand et al. (1970) suggested that during the
10/20 intermittent bout that ATP demand was met by
oxidative metabolism of myoglobin oxygen stores which were
replaced during the rest periods. In the longer bouts
myoglobin oxygen stores were not adequate to supply all of
the needed ATP and so anaerobic glycolysis was initiated to
generate the necessary ATP. There was a greater reliance on
anaerobic glycolysis to replenish ATP supplies as the length of
the bout increased and this lead to a greater production and
accumulation of lactate and a more rapid onset of fatigue.
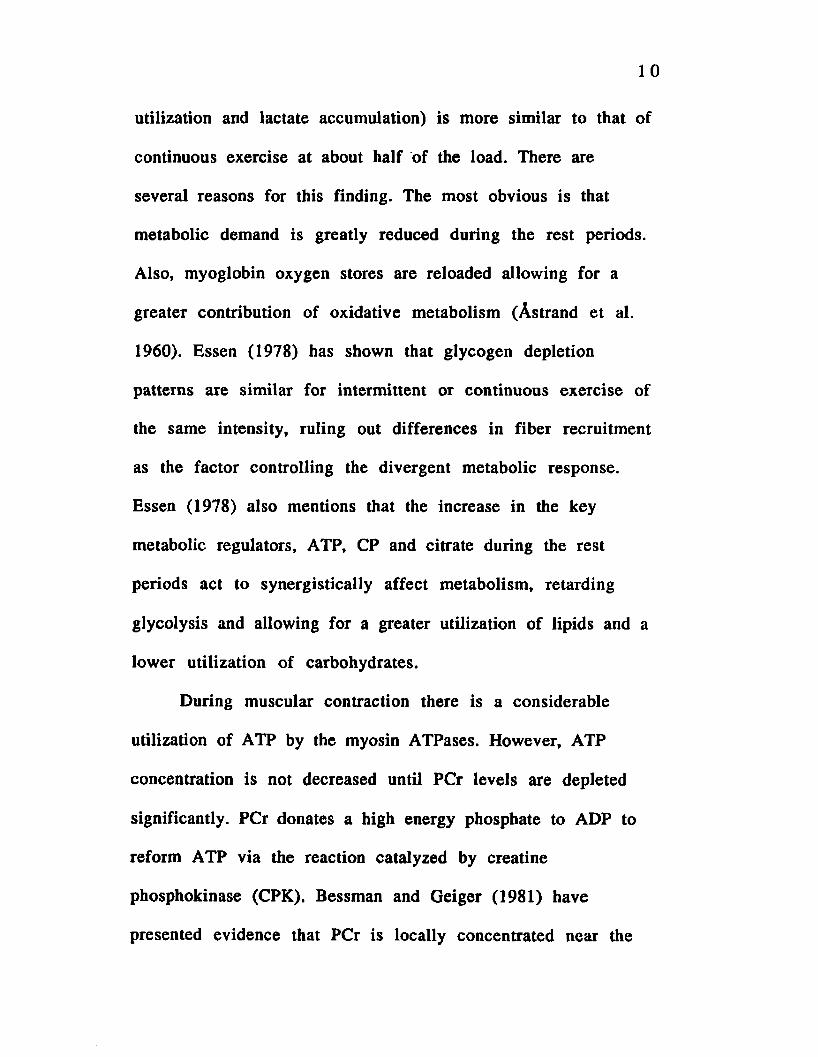
Essen (1978) has shown that the overall metabolic
response to intermittent exercise (in terms of substrate
1 0
utilization and lactate accumulation) is more similar to that of
continuous exercise at about half of the load. There are
several reasons for this finding. The most obvious is that
metabolic demand is greatly reduced during the rest periods.
Also, myoglobin oxygen stores are reloaded allowing for a
greater contribution of oxidative metabolism (Astrand et al.
1960). Essen (1978) has shown that glycogen depletion
patterns are similar for intermittent or continuous exercise of
the same intensity, ruling out differences in fiber recruitment
as the factor controlling the divergent metabolic response.
Essen (1978) also mentions that the increase in the key
metabolic regulators, ATP, CP and citrate during the rest
periods act to synergistically affect metabolism, retarding
glycolysis and allowing for a greater utilization of lipids and a
lower utilization of carbohydrates.
During muscular contraction there is a considerable
utilization of ATP by the myosin ATPases. However, ATP
concentration is not decreased until PCr levels are depleted
significantly. PCr donates a high energy phosphate to ADP to
reform ATP via the reaction catalyzed by creatine
phosphokinase (CPK). Bessman and Geiger (1981) have
presented evidence that PCr is locally concentrated near the

11
MM-isozyme of creatine phosphokinase (CPK) where it would
be positioned optimally for the replenishment of ATP during
muscle contraction. The skeletal muscle PCr stores provide
enough energy for about 10 seconds of maximal intensity
exercise (Miller, 1992).
In addition to the CPK reaction, the myokinase reaction
can buffer the increase in ADP by the following reaction: ADP
+ ADP —myokinase--> ATP + AMP. However, during low
intensity exercise the high affinity cytosolic CPK competes
better than myokinase for the available ADP and thus AMP
levels are not significantly increased. During high intensity
exercise, however, ADP levels rise significantly, providing
ample substrate for myokinase (Hochachka and Somero,
1984). The AMP formed is converted to IMP and NH4 via the
AMP deaminase reaction. This process is further enhanced by
a low pH (the pH optima for AMP deaminase is 6.1-
6.5)(Dobson et al., 1987). Therefore during high intensity
exercise IMP serves as an adenine nucleotide sink with the
net effect being a reduction in the total adenine nucleotide
pool. It has been shown that during high intensity
intermittent exercise ATP concentration decreases at the
beginning of each successive bout and that the drop in ATP is

stoichiometrically matched with the rise in IMP (Dobson et al.,
1987). A reduction in ATP concentration has been linked to
fatigue during high intensity exercise (Nagesser et al., 1992).
Also increased IMP concentration has been correlated with a
reduction in force production (Nagesser et al., 1992 and
Westra et al. 1986). Berden et al. (1986) have shown that
there is a binding site for IMP on the actin-myosin complex
and have suggested that IMP might have a direct influence on
the contractile apparatus. Therefore, during high intensity
intermittent exercise the decrease in ATP on successive bouts
and the concomitant increase in IMP may contribute to the
fatigue response.
The magnitude of high energy phosphate store (ATP and
PCr) restoration during recovery periods has also been linked
to performance during intermittent exercise. It was shown
that the recovery of PCr correlated with the recovery of
power output (r=.76, p<0.05) during repeated bouts of 30
second cycle ergometer sprints with 90 second recovery
periods (Bogdanis et al. , 1993).
During high intensity exercise it is the depletion of ATP
and the consequent accumulation of ADP and AMP that begins
to activate glycolysis by stimulating phosphofructokinase

(PFK) (Passonneau and Lowry, 1962). Also, glycogenolysis is
activated almost immediately due to the calcium calmodulin
stimulation of phosphorylase b (Miller, 1992). Although
anaerobic glycolysis can contribute significantly to ATP
production, the maximum rate of ATP production is at best
about half that of the phosphagen system. It has been
estimated by McGilvery (1975) that the maximum power
output for skeletal muscle utilizing ATP, ADP and PCr
(phosphagen system only) is 96-360 pmoles ATP gm wet
weight ’’ min For muscle using glycogen fermentation or
glycogen oxidation the values are 60.0 and 30.0 p moles ATP
gm wet weight '* min 1 respectively. Therefore if exercise
intensity is maximal, ATP utilization exceeds demand
resulting in a decrease in performance.
During very high intensity intermittent exercise, as
previously mentioned, the length of the work bout becomes a
primary factor in determining the onset of fatigue (Astrand,
1960). As the length of the work bout is increased the
contribution of glycolysis to ATP production increases.
Gaitanos et al. (1993) have shown that maximal intensity
intermittent exercise leads to a reduction in the ATP
production rate of glycolysis on each subsequent bout. This
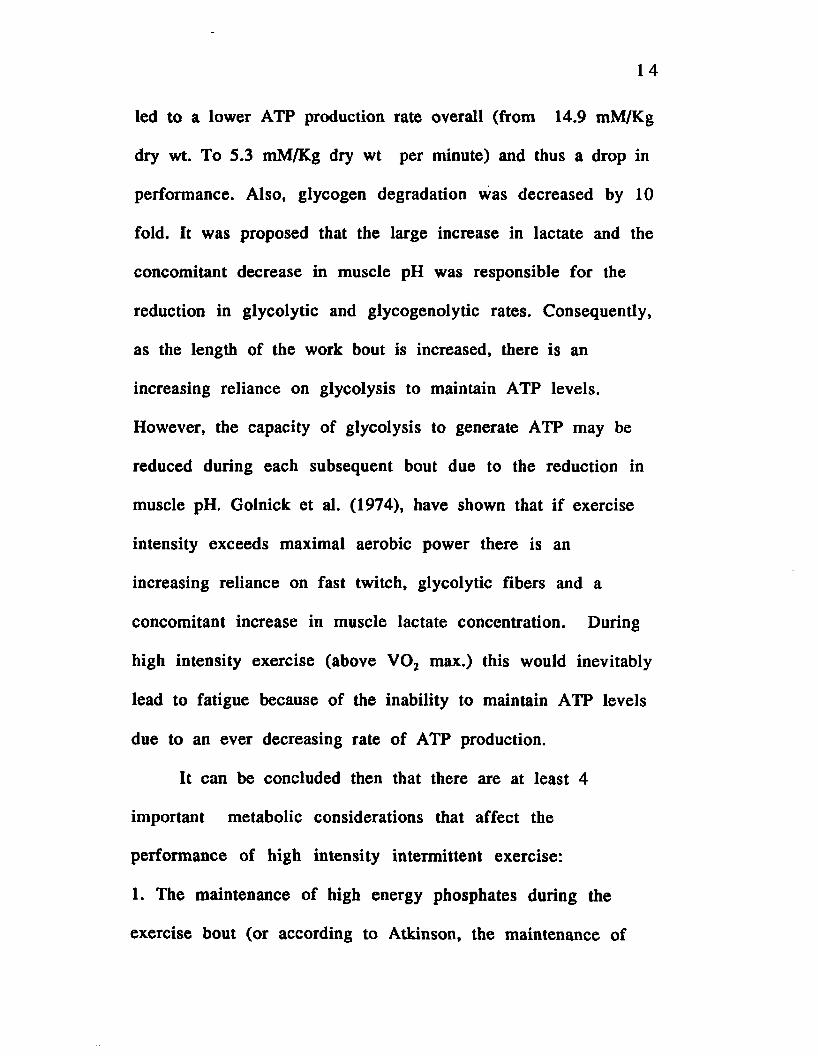
led to a lower ATP production rate overall (from 14.9 mM/Kg
dry wt. To 5.3 mM/Kg dry wt per minute) and thus a drop in
performance. Also, glycogen degradation was decreased by 10
fold. It was proposed that the large increase in lactate and the
concomitant decrease in muscle pH was responsible for the
reduction in glycolytic and glycogenolytic rates. Consequently,
as the length of the work bout is increased, there is an
increasing reliance on glycolysis to maintain ATP levels.
However, the capacity of glycolysis to generate ATP may be
reduced during each subsequent bout due to the reduction in
muscle pH. Golnick et al. (1974), have shown that if exercise
intensity exceeds maximal aerobic power there is an
increasing reliance on fast twitch, glycolytic fibers and a
concomitant increase in muscle lactate concentration. During
high intensity exercise (above V 02 max.) this would inevitably
lead to fatigue because of the inability to maintain ATP levels
due to an ever decreasing rate of ATP production.
It can be concluded then that there are at least 4
important metabolic considerations that affect the
performance of high intensity intermittent exercise:
1. The maintenance of high energy phosphates during the
exercise bout (or according to Atkinson, the maintenance of

the adenylate energy charge): This is accomplished by first
utilizing the stored phosphagens. Then as the phosphagens
become significantly depleted anaerobic glycolysis is activated
to resynthesize the store of high energy phosphates. (Recall
that the maximum rate of ATP production by anaerobic
glycolysis is 60 pmoles ATP gm wet weight ' ' min 1 . If the
rate of ATP utilization exceeds this rate then the ability to
maintain performance would be determined entirely by the
quantity of stored phosphagens.)
2. Adequate recovery of high energy phosphates during the
rest periods: (As previously mentioned the recovery of power
output during cycle ergometer sprints was correlated with the
recovery of PCr stores. )
3. The restoration of the ability to generate ATP during the
exercise bouts: Recall that Gaitanos et al. (1993) found that
repeated bouts led to a fall in the rate of ATP production
overall (14.9 mM/Kg dry wt. To 5.3 mM/Kg dry wt) and thus
a drop in performance. PCr recovery was not a limiting factor
(since the rate of ATP production from PCr was not reduced).
This would suggest that the recovery of glycolysis (the ability
to generate ATP at the desired rate) between bouts would also
be an important consideration (provided that the exercise

1 6
bout is of sufficient intensity or duration to require a
significant contribution from glycolysis.)
4. The management of adenine nucleotides: Recall that ATP
concentrations are decreased at the beginning of each bout
during intermittent exercise and the decrease in the
concentration of ATP is stoichiometrically matched with the
rise in IMP (Dobson et al., 1987).
2.2 _r_.Creatine and Control of the Creatine Pool
Creatine exists in skeletal muscle in a concentration of
approximately 125 mmol/kg dry weight and is present in
phosphorylated and free forms (Greenhaff, 1994). The two
forms of creatine are in a reversible equilibrium.
Approximately 60% of the muscle creatine in skeletal muscle
at rest is in the form of creatine phosphate (Greenhaff, 1994).
Creatine phosphate (PCr) is the primary high energy
phosphate store in vertebrate skeletal muscle. PCr has a AG of
-10.3 kcal/mole allowing it to donate a high energy phosphate
to ADP for ATP resynthesis in the following reaction catalyzed
by creatine phosphokinase: PCr + ADP <-----> ATP + Creatine.
PCr levels are highest in fast twitch skeletal muscle with
typical values approaching 30 pmoles/gm wet weight.
Bessman and Geiger (1981) have presented evidence that PCr

1 7
is locally concentrated near the MM-isozyme of creatine
phosphokinase (CPK) where it would be positioned optimally
for the replenishment of ATP during muscle contraction.
Skeletal muscle contains 95% of the body’s
approximately 120g of creatine (Greenhaff, 1994). The control
of this creatine pool is achieved primarily by the regulation of
the synthesis of creatine by the transamidinase enzyme.
Although skeletal muscle contains the primary creatine pool,
creatine is not synthesized in skeletal muscle. Exogenous
synthesis of creatine occurs in the kidney, liver and pancreas.
Creatine synthesis is controlled by negative feedback
inhibition of the transamidinase enzyme by creatine (Walker,
1973). Since the location of the bulk of the creatine pool
(skeletal muscle) and the sites of synthesis of creatine (liver,
kidney and pancreas) are physically separated, the control of
creatine synthesis must be regulated in part by the small
amount of circulating creatine. Additionally, it has been shown
by Crim et al. (1976) that feeding of the creatine precursors
glycine and arginine stimulated creatine synthesis in excess of
the amount required to maintain steady state. It was
proposed that (a) substrate limitation was controlling creatine
synthesis or (b) transamidinase enzyme inhibition by creatine

1 8
was reversed by the precursors or (c) synthesis of the
transamidinase enzyme was increased by precursor feeding or
(d) that insulin concentrations were elevated in the plasma
due to precursor feeding (insulin has been shown to enhance
creatine uptake into skeletal muscle by Koszalka et al. 1972).
Since creatine is not synthesized in skeletal muscle and
does not readily cross the cell membrane there must be a
second level of control of the size of the creatine pool in
skeletal muscle, the transport of creatine into skeletal muscle.
The Na+ dependent creatine transporter in skeletal muscle has
been identified and its cDNA has recently been cloned and
sequenced (Guimbal and Kilimann, 1993). The transporter
specifically interacts with the amidine group of creatine (Fitch
et al., 1968). Fitch and Shields (1966) have shown that
creatine uptake in rat skeletal muscle is an energy requiring
saturable process that is capable of replacing about 4% of the
total skeletal muscle creatine each day. It has been shown by
Loike et al. (1988) that creatine transport is down regulated
in the presence of extracellular creatine concentrations of 45
pM. It was also shown that there was a downregulation of
creatine transporters by extracellular creatine.

Although creatine can be synthesized de novo from the
precursors glycine and alanine, the skeletal muscle creatine
pool has been shown to respond to creatine supplementation.
In a recent study Harris et al. (1992) have shown that
supplementation with 5g of creatine monohydrate four to six
times a day for 2 or more days resulted in a significant
increase in the total creatine content of the quadriceps
femoris muscle in man. The increase in the total creatine pool
was in excess of 20% with 20% or more of the increase being
present as creatine phosphate. Uptake was greatest during the
first two days of supplementation accounting for 32% of the
administered dose. It was also shown that exercise
apparently increased the uptake of creatine. Creatine uptake
was greater in subjects with low initial levels of creatine.
2.3 - Creatine Supplementation Studies
Since Harris et al. (1992) demonstrated that skeletal
muscle creatine can be increased by creatine supplementation,
several studies have demonstrated the beneficial effects of
creatine supplementation. Using a high intensity intermittent
cycling protocol (880 watts) Balsom et al. (1993) showed that
oral creatine supplementation (5 6-g doses daily for 6 days)
led to a smaller decline in work output from baseline than a

placebo group. The creatine group also showed a decrease in
lactate accumulation (from 7.0 to S.l mmol I'1) and a lower
oxygen consumption (2.84 to 2.78 1 min*1). Plasma
hypoxanthine accumulation was also lowered (21 to 16.7 pm ol
l '1) indicating a reduced adenine nucleotide degradation. The
increased availability of PCr may have led to a preferential
use of creatine phosphokinase to rephosphorylate ADP to ATP
(ADP + PCr —creatine phosphokinase—> ATP + Cr) rather than
myokinase (ADP + ADP —myokinase—>ATP + AMP) with a
reduced production of NH4 and IMP (AMP —AMP deaminase—
> NH4 + IMP). These findings have been supported by
Greenhaff et al. (1993) who showed that during bouts of
maximal isokinetic contractions that there was a lower
accumulation of ammonia following creatine supplementation.
In the same study it was shown that during the final 10
contractions of each bout that torque was better preserved on
creatine vs. controls. Since it had been proposed that creatine
may be enhancing performance by increasing the rate of high
energy phosphate resynthesis during recovery (Balsom et al.
1993) this was investigated by Greenhaff et al. (1994). Muscle
biopsy samples were taken during recovery from intense

electrically evoked isometric contractions. Creatine increased
muscular creatine levels by 15-32% and substantially
increased PCr resynthesis during recovery (6%). It has also
been shown that creatine supplementation can lead to a
decrease in ATP degradation during exercise (Greenhaff et al.
1994). Cr supplementation had no effect on ATP degradation
during the first bout (30 second bouts of maximal isokinetic
contractions) but reduced ATP loss by 50% compared to pre
creatine values during the second bout even though more
work was done.
Creatine supplementation has not always been shown to
enhance performance, however. Cooke et al. (1995) showed
that during high-intensity short-duration cycle sprints
creatine supplementation (the same supplementation regime
shown by Harris et al. 1992 to increase muscle creatine levels)
did not lead to enhanced performance. However this study
used 15 second maximal sprints (as opposed to the 6 second
sprints used by Balsom et al., 1993). In maximal sprints of
this duration the large contribution of glycolysis may
overshadow any improvements in the phosphagen system due
to creatine supplementation. Recall that Gaitanos et al. (1993)
have shown that during 6 second maximal bouts that there is

22
a significant contribution of glycolysis. This would be expected
to increase as the duration of the bout is increased. Also,
Balsom et al. (1993) have shown that creatine
supplementation does not enhance endurance exercise. There
was no improvement in run times during a treadmill run to
exhaustion at supramaximal intensities (>V 02 max.) and
creatine supplementation actually led to an increase in run
times for a 6 km terrain run. It was proposed that this
increase in run times might be attributed to a 2.3 kg weight
gain for the creatine group.
Therefore creatine supplementation appears to enhance
exercise performance during very brief (<10 seconds) high
intensity exercise that stresses primarily the phosphagen
system. Creatine can also lead to a lower lactate accumulation
(because energy provision during the exercise bout can be
met by a larger contribution of the phosphagen system with
decreased reliance on glycolysis) and a lower accumulation of
N H 4 and hypoxanthine (due to a decreased reliance on
myokinase to replenish ATP and thus less substrate available
to AMP deaminase).
Although it seems likely that the increases in
performance due to creatine supplementation are due to an

increase in total creatine and phosphocreatine pools, other
possibilities have not been investigated. However, since
creatine clearance is a non saturable process and occurs very
rapidly (the half life of circulating creatine may be less than
two hours) (Crim et al. 1976), it is probable that during the
aforementioned performance studies that circulating creatine
levels would have been reduced to baseline levels during the
testing periods. Therefore the observed increases in
performance would have been due to some residual effect of
creatine supplementation. The most likely residual effect
would be an increase in skeletal muscle creatine and
phosphocreatine concentrations.

CHAPTER 3 - MATERIALS AND METHODS
3.1 - Basic Design
Eighteen subjects were divided into two groups, a
placebo-control and an experimental. The experimental group
was given a placebo before and during the first phase of
testing and was given creatine supplementation before and
during the second phase of testing. The control group received
a placebo before and during the first and second phases of
testing. Both groups underwent identical testing protocols. The
testing then proceeded in two phases (see figure 3.1) as
follows:
Phase l(p lacebo)
Day 1 - Begin placebo administration
- V 02 peak test
Day 5 - Exercise bout at 150% V 02 peak*
Day 7 - Exercise bout at 150% V 02 peak*
Day 9 - Exercise bout at 150% V 02 peak*
Day 11 - Exercise bout at 150% V 02 peak*
- end placebo supplementation regimen
Phase 2 (creatine-placebo)
Day 20 - begin creatine or placebo supplementation regimen
24

25
Day 25 - (two weeks following last test)
-(after 5 days on creatine supplement or placebo)
- Exercise bout at 150% V 02 peak*
Day 27 - Exercise bout at 150% V 02 peak*
Day 29 - Exercise bout at 150% V 02 peak*
Day 31 - Exercise bout at 150% V 02 peak*
- end supplementation regimen
*Exercise bouts consisted of four different protocols. One bout
was performed per testing session and the bouts were
assigned in random order during each phase. The bouts
consisted of:
Bout A-Continuous
Bout B-30 seconds work;60 seconds rest
Bout C-20 seconds work:40 seconds rest
Bout D-10 seconds work:20 seconds rest.
Also, finger prick blood draws and V 02 measurements were
taken during each test. Details on blood draws and analysis
and V 02 measures will be given in a later section.
3.2 - Subjects
Subjects were apparently healthy (apparently healthy =
satisfactory answers on PARQ - see appendix B) male and
female volunteers recruited from Kinesiology classes at LSU.

26
2 weeks
r <a . Phase 1 Phase 2
Testing Testing
Begin Begin creatine orplacebo placebo
Time linei 1....... i i 11 ■■ i
Day 1 5 11 25 30 35
Figure 3.1. S tudy F low chart
Both groups consisted of 5 males and 4 females (see table 3.1.
for subject characteristics). The Subjects gave written consent
to act as a subject in a research experiment and the
experiment proceeded following the approval of the LSU
Institutional Review Board.
Table 3.1. S ub jec t C h a ra c te ris tic s
GROUP Creatine Group Placebo GroupV02 PEAK 227 Watts 214.3 WattsV02 PEAK 41.76 ml/kgxmin-1 40.51 ml/kgxmin-1GENDER 5 male 4 female 5 male 4 femaleAGE 23.4 23.3 24.4 23.8
WEIGHT 205.4 lbs 119.5 lbs 206.2 lbs 128.3 lbs

27
3.3 - Supplementation
Creatine supplementation consisted of 3.75g creatine
monohydrate 5 times daily (5 tablets 5 times daily for a total
of 18.75 g/day) for 5 days followed by 2.25g creatine once
daily (3 tablets once daily) for 6 days. Creatine
supplementation was given to the creatine group only, before
phase 2 testing only. Placebo supplementation consisted of
l.Og of placebo (calcium) 5 times daily (5 tablets 5 times
daily) for 5 days followed by .6g placebo once daily (3 tablets
once daily) for 6 days. The placebo was indistinguishable in
appearance from the creatine supplement. Placebo regimen
administration began 5 days prior to phase 1 (both groups)
and phase 2 testing (placebo group) and ended following the
last testing session during each phase.
3.4 - V 07 peak
Subjects were instructed to refrain from intense
physical exercise the day before testing and fasted for at least
4 hours prior to the test session (Note - V 02 peak measures
were used to standardize the proceeding intermittent work
bouts and have no other experimental significance). The seat
height was adjusted to subject satisfaction and recorded to
standardize its position for each test. Subjects first engaged in

a standardized warm up procedure consisting of 5 minutes of
pedaling at a low tension level. Subjects began the test by
pedaling at 100 rpm against no load for 1 minute. The load
was then be increased by 50 watts each minute until the
subject was no longer able to maintain the required pedaling
rate of 100 rpm. The work rate associated with the last
completed stage (last 1 minute stage) was considered the V 02
peak. Expired respiratory data (V 02 and VC02) was collected
continuously using the Quinton Q-Plex I.
3.5 - Standardized Exercise Bouts
Bout A - Subjects repeated the standardized warm up
procedure administered before the V 02 peak test. Subjects
then pedaled at 100 rpm at 150% of their V 02 peak work rate
until exhaustion (the subject could no longer maintain the
required pedaling rate). Bout B - Subjects repeated the
standardized warm up procedure. Subjects then began
intermittent exercise consisting of repeated 100 rpm cycling
bouts at 150% V 02 peak for 30 seconds followed by 60
seconds rest. Bout C - Standardized warm up followed by 100
rpm cycling (150% V 02 peak) for 20 seconds followed by 40
seconds rest. Bout D - 100 rpm (150% V 02 peak) cycling for 10
seconds followed by 20 seconds rest. All intermittent bouts
29
were repeated until exhaustion (the subject could no longer
maintain the required pedaling rate).
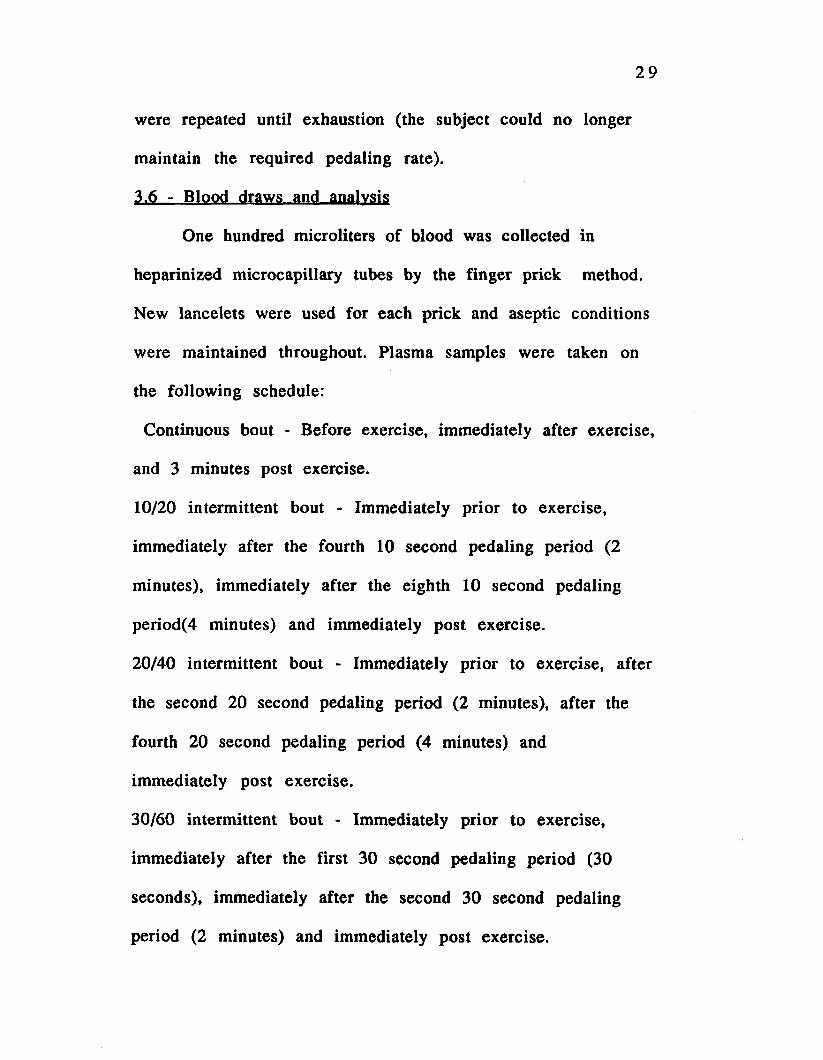
3.6 - Blood draws and analysis
One hundred microliters of blood was collected in
heparinized microcapillary tubes by the finger prick method.
New lancelets were used for each prick and aseptic conditions
were maintained throughout. Plasma samples were taken on
the following schedule:
Continuous bout - Before exercise, immediately after exercise,
and 3 minutes post exercise.
10/20 intermittent bout - Immediately prior to exercise,
immediately after the fourth 10 second pedaling period (2
minutes), immediately after the eighth 10 second pedaling
period(4 minutes) and immediately post exercise.
20/40 intermittent bout - Immediately prior to exercise, after
the second 20 second pedaling period (2 minutes), after the
fourth 20 second pedaling period (4 minutes) and
immediately post exercise.
30/60 intermittent bout - Immediately prior to exercise,
immediately after the first 30 second pedaling period (30
seconds), immediately after the second 30 second pedaling
period (2 minutes) and immediately post exercise.

Blood samples were placed in an ice water bath and
were centrifuged immediately following the test and stored at
-70° C for further analysis. Blood lactate concentration was
determined using the Analox GM7 micro-stat analyzer (Analox
Instruments Ltd. , 8 Godkhawk Industrial Estate, Brackenbury
Road, Hammersmith, London W6 OBQ, England). The micro-
stat analyzer functions by measuring the oxygen change when
oxyreductase enzymes react with their substrates under
controlled semi-anaerobic conditions. For lactate analysis the
reaction proceeds as follows:
L-lactate + 0 2 — Lactate oxyreductase—> pyruvate +H20 2
Lactate measures were performed in duplicates and were
repeated if measures differed by 0.3 mmol/1.
3.7 - Oxveen Consumption
Expired respiratory data (V 02 and VC02) was collected
continuously using the Quinton Q-Plex I during all exercise
tests.
3.8 - Urinary Creatinine
Urine samples were collected from both groups during
phase 2. The first sample was collected before the phase 2
supplementation period begins. Samples two and three were
collected on day 2 and 3 of supplementation respectively.

3 1
Urinary creatinine was determined by the use of Sigma kit
#555-A .
3.9 - Statistical Analysis
Time to exhaustion for each group was analyzed using
ANOVA with repeated measures (1 within=phase, 1
between=time). Post-ANOVA analysis involved, where
appropriate, the use of Tukey’s range test. The
experimentwise error rate was set at p<=0.05 and was
maintained throughout all post-ANOVA tests. Each bout was
analyzed independently for each group for differences in
lactate and respiratory data at specific time intervals using
ANOVA with repeated measures (1 within=phase, 1
between=time). Differences due to the supplementation
regime were determined by comparing Phase 1 (with all time
periods pooled) with phase 2 (with all time periods pooled).
Differences within groups in urinary creatinine concentration
were determined by using ANOVA with repeated measures.
Post ANOVA analysis involved the use of Tukey’s range test.
The relationship of fitness level and body weight with
increases in total work output was examined utilizing multiple
linear regression.

CHAPTER 4 - RESULTS
4.1 Time to Exhaustion
Creatine supplementation had a significant impact on
time to exhaustion (and thus total work output). The creatine
supplementation group showed a greater than 100% increase
in time to exhaustion on bout D, phase 2 (p<0.01) (see fig.4.1),
while the placebo group showed no significant change (see fig.
4.2). Bout D was impacted significantly more than the other
bouts with a greater than twofold increase in time to
exhaustion. Note that for all subjects on creatine, phase 2 bout
D was truncated at twice the performance time of phase 1. At
this time point all subjects on creatine reported feeling very
little fatigue and the ability to continue indefinitely. The bout
was truncated due to factors related to subject compliance and
because a twofold increase in time to exhaustion was
sufficient to show a significant impact of creatine
supplementation. Bout C was also significantly impacted by
creatine supplementation with a 61.9% increase in time to
exhaustion (PcO.Ol), while the placebo group showed no
significant change from phase 1 to phase 2 (see fig.4.1 and
4.2). The creatine group showed a 61.0% increase in time to
exhaustion (p<0.01) on bout B, Phase 2, while the placebo
32

group, again, showed no significant change. Finally, bout A
was also significantly impacted by creatine supplementation
(p<0.01) with a 23.5% increase in time to exhaustion, while
again, there was no significant change for the placebo group
(see fig.4.1 and 4.2). The gain in time to exhaustion was
significantly different for each bout (P<0.05) with the
magnitude of the increase being greater as the length of the
work period becomes shorter (ie. D>C>B>A).
450 -
400 ■
£ 350 ■C
g 300 ' wWg 250 ■P n5 200 --C £O 150 ■«£ 100 -h-
o -------A
Figure 4.1. Time to Exhaustion - Phase x Bout, C rea tine G roup. (Data are presented as means + standard deviations. ^Significantly different from phase1, p<0.01)
u iilit
- c
Bout
Phase 1
Phase 2

34
ooO)
225
2 DO -
175 -
150 ■
125 -
100 -
75 -
50 -
25 -
0
IESijipi
Bout
l~l Phase 1 EH Phase 2
Figure 4.2. Time to Exhaustion - Phase x Bout, P lacebo G roup. (Data are presented as means + standard deviations)
4,2 Oxygen Consumption
Oxygen consumption increased with time, as expected
for all exercise bouts. The creatine supplementation group,
however, showed a significantly lower oxygen consumption
rate (p<0.01) during bouts D (fig. 4.3) and C (fig. 4.5) for
phase 2. The placebo group showed no significant change in
oxygen consumption rate during these bouts (fig. 4.4 and 4.6).
Both groups showed a significantly lower rate of oxygen
consumption (p<0.01) during bout B, phase 2 (tig. 4.7 and
4.8). For bout A neither group showed a significantly lower
rate of oxygen consumption during phase 2. (fig. 4.9 and 4.10).

V02
(ml/k
gjni
n-1)
35
50
40 -
30 -
20 -
10 -
Phase 1
Phase 2
Time (Seconds)
Figure 4.3. V 02 For Phase 1 and 2, Bout D, Creatine Group
ic£
20 -
CMO>10 -
Phase 1
Phase 2
Time (Seconds)
Figure 4.4. V02 For Phase 1 and 2, Bout D,Placebo Group

V02
(ml/k
gjni
n-1)
V02
(ml/k
g.m
in-1
)
36
40
30 -
20 -
1 0 -
O 8 §
Phase 1
O Phase 2
Time (Seconds)
Figure 4.5. V 02 For Phase 1 and 2, Bout C, C re a tin e G roup
3 0 -
20 -
10 -
8 §
Phase 1
- O - — Phase 2
Time (Seconds)
Figure 4.6. V02 For Phase 1 and 2, Bout C,Placebo Group

V02
(ml/k
g.m
in-1
) V0
2 (m
l/kg.
min
-1)
37
25 -
20 -
1 5 -
10 -
8
Phase 1
O Phase 2
Time (Seconds)
Figure 4.7. V 02 For Phase 1 and 2, Bout B, C rea tin e G r o u p
30
2 5 -
20 -
15 -
8
“ O"
Phase 1
Phase 2
Time (Seconds)
Figure 4.8. V02 For Phase 1 and 2, Bout B,Placebo Group

V02
(ml/k
g.m
in-1
) V0
2 O
nl/k
gjni
n-1)
38
30
25 -
20 -
15 -
10 -
a 9
Phase 1
Phase 2
Time (Seconds)
Figure 4.9. V 02 For Phase 1 and 2, Bout A, Creatine Group
30
25 -
20 -
15 -
1 0 -
9 9 9 9
Phase 1
Phase 2
Time (Seconds)
Figure 4.10. V02 For Phase 1 and 2, Bout A,Placebo Group

39
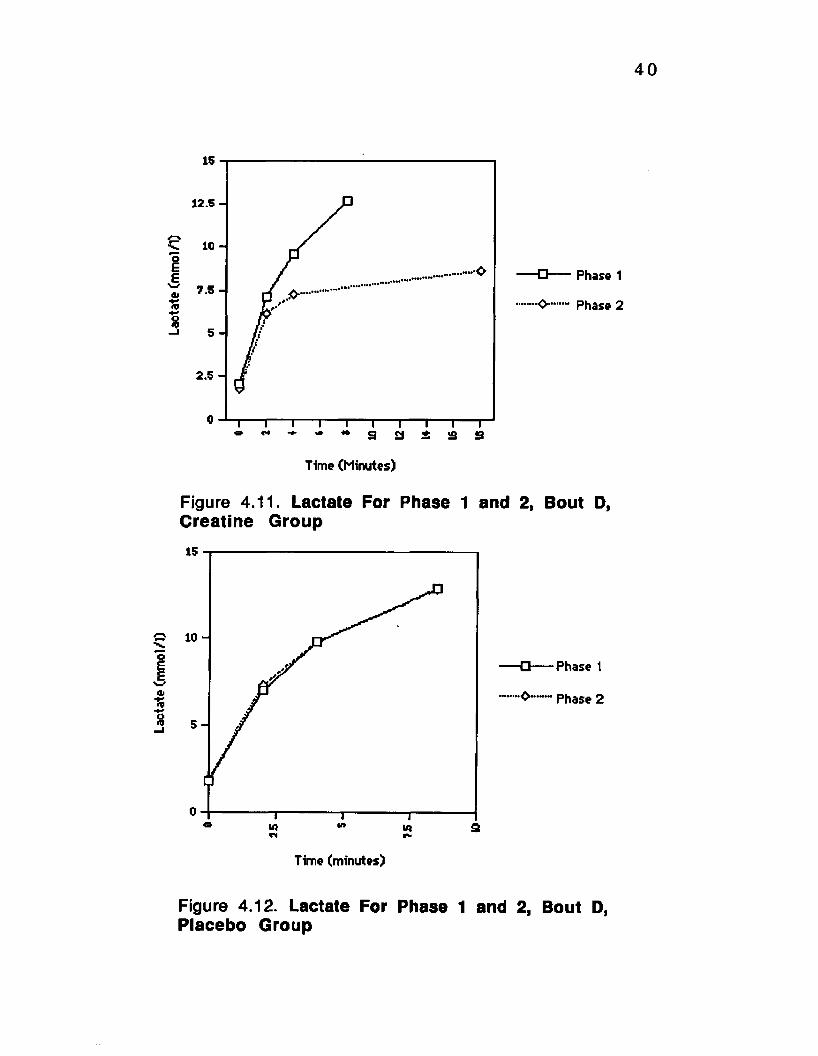
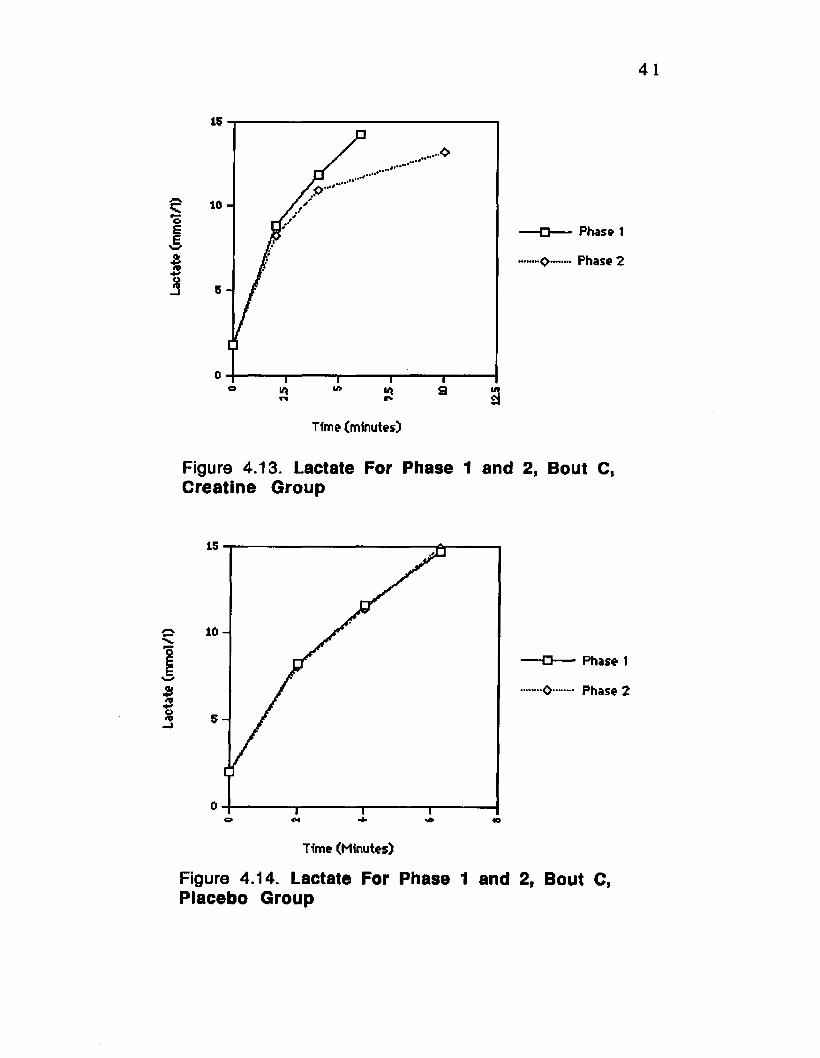
4.3 Plasma Lactic Acid
Plasm a lactic acid concentration increased with
exercise a s expected. Lactate concentration was significantly
lower (P<0.01) for the creatine group on bout D, phase 2 (fig.
4.11) while the placebo group showed no significant change
from phase 1 to 2 (fig. 4.12). Bout C also showed a significant
decrease (p<0.01) from phase 1 to phase 2 for the creatine
group only (fig. 4.13), while the placebo group showed no
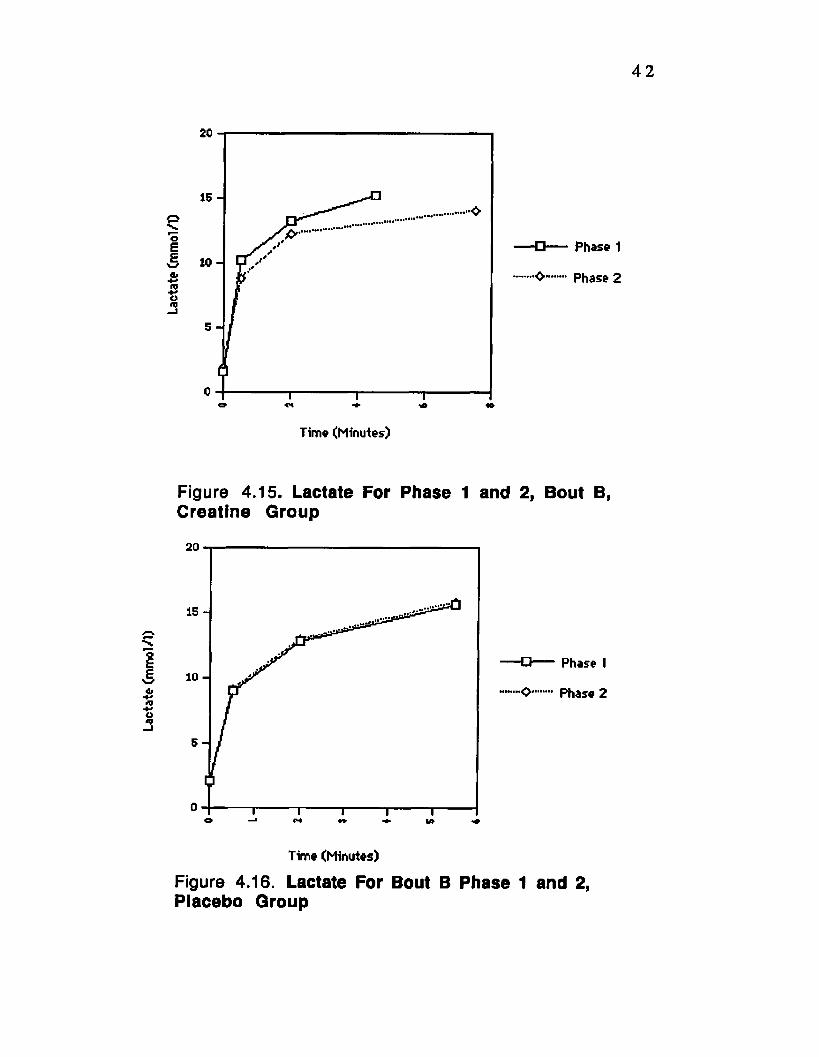
significant change (fig. 4.14). Also for bout B there was a
significant decrease in lactate concentration from phase 1 to
phase 2 (p<0.01) for the creatine group (fig. 4.15), while the
placebo group showed no change (fig.4.16). There was no
change by either group for bout A from phase 1 to 2 (fig.
4.17and 4.18).
4.4 Urinary Creatinine
Urinary creatinine concentration w as significantly
(p<0.01) elevated on day 2 and 3 of supplementation for the
creatine group (see fig. 4.19), while the placebo
supplementation group showed no change (see fig. 4.20). This
increased creatinine excretion suggests that subjects
complied with the supplementation regime.
Lact
ate
(mm
ol/1
)
40
12.5 -
1 0 -
I7.5 -
5 -
2.5 -
9 £S 2: 3 S3
Phase 1
Phase 2
Time (Minutes)
Figure 4.11. Lactate For Phase 1 and 2, Bout D, Creatine Group
10 -
o 9
•Phase 1
O-— Phase 2
Time (minutes)
Figure 4.12. Lactate For Phase 1 and 2, Bout D,Placebo Group
(I/IOU
JUJ)
41
o££
10 -
4̂++o—I 5 -
o 9 in
Phase 1
Phase 2
Time (minutes)
Figure 4.13. Lactate For Phase 1 and 2, Bout C, Creatine Group
1 0 -
Phase 1
•0...... Phase 2
Time (Minutes)
Figure 4.14. Lactate For Phase 1 and 2, Bout C,Placebo Group
42
1 5 -
V .oEEw*4̂
1 0 -
o
Phase 1
. — Phase 2
Time (Minutes)
Figure 4.15. Lactate For P hase 1 and 2, Bout B, C rea tin e G roup
20
15 -
1 0 -
5 -
y>
Phase 1
•O— Phase 2
Time (Minutes)
Figure 4.16. Lactate For Bout B Phase 1 and 2,Placebo Group

43
12.5 -
10 -
7 .6 -
5 -
2 .5 -
8 8 a
Phase I
Phase 2
Time (Seconds)
Figure 4 .17 . Lactate For Phase 1 and 2, Bout A, C rea tin e Group
12.5 -
10 -
7 .5 -
5 -
2.6
8 § 8
-O — Phase 1
Phase 2
Time (Seconds)
Figure 4.18. Lactate For Phase 1 and 2t Bout A,Placebo Group

44
2000 -
1800 -
? 1 6 0 ) - I1400
.c 1200
1 1000
£ 800 c
1~~1 Creatine (HI Placebo
3 600 "
400 -
200 -
0Pre SI S2
Figure 4.19. Urinary C reatin ine For C reatine And Placebo G roups (Data are presented as means + standard deviations. ‘Significantly different from p r e supplementation values, p<0.01)
4.5 Regression of Body Weight and Fitness on Improvement in Total Work Output
Neither body weight (r=0.074) nor fitness level
(maximum VOz during the VOz peak test)(r—0.038) or the
combination (r=0.076) were a good predictor of the magnitude
of improvement in total work output due to creatine
supplementation on bouts C, B and A (note that bout D was not
included because this bout was truncated a t twice the
performance time of phase 1.

CHAPTER 5 - DISCUSSION
Creatine supplementation (5g of creatine monohydrate
four to six times a day for 2 or more days) has been shown to
significantly increase the total creatine content of the
quadriceps femoris muscle in man (Harris et al. 1992). The
increase in the total creatine pool was in excess of 20%, with
20% or more of the increase being present as creatine
phosphate. Greenhaff et al. (1994) have also found a 25%
increase in total creatine content of the vastus lateralis after
creatine supplementation. Although skeletal muscle contains
95% of the body’s creatine pool (Greenhaff, 1994), creatine is
not synthesized in muscle. Therefore the size of the creatine
pool in skeletal muscle is regulated in part by blood creatine
concentrations (Crim et al., 1976). In the present study, all
subjects on creatine showed a significantly elevated urinary
creatinine concentration on day 2 and 3 of the
supplementation period. Subjects in the placebo group showed
no significant change. Assuming a daily urine output of .6 to
2.5 liters/day, creatine turnover averaged 1.2 - 5.0
grams/day for the placebo group, which agrees with Fitch and
Shield’s (1966) estimate of 2.0 grams/day under normal
conditions. Creatine turnover for the creatine group on
46
supplementation day 2 and 3, based on these estimates, would
be 6 to 10 times this value. This increase in urinary creatinine
indicates that creatine entered the bloodstream in significant
quantities and was subsequently eliminated by excretion in
the urine. It is therefore likely that the supplementation
regime used in the present study provided an increased
availability of circulating creatine and thus successfully
elevated skeletal muscle creatine content.
An increase in total creatine content and the
concomitant increase in PCr due to creatine supplementation
has been shown to:
1. Reduce the decrease in ATP concentration following high
intensity exercise (Greenhaff, 1994).
2. Increase the rate of PCr recovery following high intensity
exercise (Greenhaff, 1994B).
3. Reduce the decline in power output following repeated
bouts of maximal isokinetic cycling (Birch et al., 1994) .
4. Lower plasma lactic acid and hypoxanthine accumulation
during high intensity intermittent exercise (Balsom et al.,
1993).
As such, creatine supplementation may be able to blunt the
metabolic consequences of high intensity exercise and

47
therefore be of ergogenic benefit. Surprisingly, it has not yet
been demonstrated whether creatine supplementation can
enhance total work output during high intensity intermittent
exercise. Therefore the present study was undertaken to
investigate the effects of creatine supplementation on the
performance of 4 different high intensity intermittent work
bouts.
The most significant finding of the present study is that
creatine supplementation increased total work output (as
measured by time to exhaustion) during all exercise bouts (A,
6 , C, and D), with the greatest response occurring during bout
D. As previously mentioned, bout D was truncated at twice the
performance time of phase 1. The decision to truncate the
bout was based on the request by several subjects to
terminate the bout prior to exhaustion as they felt as though
they could continue indefinitely. For example, subject #7 (the
first subject on creatine to perform phase 2, bout D)
continued for 10 minutes to exhaustion on phase 1. On phase
2, at 29 minutes (nearly a threefold increase) the subject
reported feeling very little fatigue and felt capable of
continuing indefinitely. At the request of the subject the bout
was terminated. Based on this experience and due to the

48
request by several subjects to truncate the bout prior to
exhaustion, all of the subsequent phase 2, bout D tests for the
creatine group were truncated at twice the performance time
of phase 1. Supporting this decision was the fact that at this
time point all subjects experienced little fatigue and felt
capable of continuing indefinitely.
It is generally accepted that the energy requirements
(ATP) of brief (<20 seconds), high intensity exercise are met
by the available phosphagen stores (ATP, PCr), the resynthesis
of these phosphagens and the anaerobic degradation of
glucose. A reduction in performance occurs in this type of
physical activity when ATP and PCr stores become depleted
and lactate, the end product of anaerobic glycolysis, begins to
accumulate. It could be anticipated that any mechanism which
delays the occurrence of either of these events should extend
the time an individual can work at this intensity level i.e. be
of ergogenic benefit. Data from the current study
demonstrates that creatine supplementation substantially
delays the onset of fatigue. This ergogenic benefit may have
been achieved by better meeting the energy needs of the
exercising muscles through one or more of the following
mechanisms:

49
1. Increasing the concentration of stored phosphagens.
2. Increasing the rate of PCr resynthesis during the recovery
periods.
3. Decreasing the reliance on myokinase to buffer the drop in
ATP levels, thus lowering the production of IMP and the
concomitant loss in adenine nucleotides.
4. Decreasing the reliance on glycolysis to provide ATP during
the work bouts, hence reducing lactate accumulation and its
ergolytic effect of reduced pH.
Employing a dose similar to the present study (20g/day
versus 18.75g/day in the present study), Harris et al. (1992)
and Greenhaff et al. (1994) demonstrated a significant
increase in muscle creatine concentration (20% and 25%
respectively) due to supplementation. Therefore, it is most
probable that the supplementation regime used in the present
study resulted in an increase in muscle creatine and PCr
concentrations. An increased concentration of stored
phosphagens would have allowed more work to be done
before high energy phosphates were depleted significantly, or
a reduced depletion of high energy phosphates for same
amount of work. A reduced depletion of high energy
phosphates during the work periods would result in a reduced

50
activation of ATP generating metabolic pathways. Note that
this is supported by the fact that both aerobic (reduced V 02)
and anaerobic (reduced lactate) metabolism during the
exercise bouts were reduced following creatine
supplementation. Therefore the increased quantity of stored
phosphagens due to creatine supplementation may have
reduced the metabolic consequences of high intensity exercise
(reduced ATP and PCr concentrations and increased lactate)
and consequently delayed the onset of fatigue.
In addition, creatine supplementation may have
extended time to exhaustion by increasing the rate of PCr
resynthesis during the recovery periods of the intermittent
bouts. Greenhaff et al. (1993) have shown that creatine
supplementation accelerates the rate of phosphocreatine
resynthesis following intense muscle contractions. This
increase in PCr resynthesis resulted in a greater concentration
of PCr at the beginning of each subsequent exercise period
during intermittent exercise. Furthermore, the recovery of PCr
following exercise is highly correlated with the recovery of
power output during repeated cycle sprints (Bogdanis et al.,
1993). It was found that a higher concentration of PCr prior
to each subsequent work bout led to a greater power output

and thus more work done during the bouts. Therefore, in the
present study, creatine may have impacted performance by
accelerating the rate of PCr resynthesis during recovery, thus
increasing the concentration of PCr at the beginning of each
subsequent exercise period. With regards to increasing the
rate of PCr resynthesis, Greenhaff et al. (1993) suggested that
creatine feeding may have accelerated the rate of PCr
resynthesis from mitochondrial ATP. It is argued that the
increase in muscle creatine due to supplementation may have
increased the rate of flux through the CPK reaction at the
mitochondrial membrane. The availability of creatine may
possibly be a limiting factor in PCr resynthesis following
intense exercise because:
A) The Km of CPK for creatine (19mmol/l) is very close to the
concentration of creatine in skeletal muscle at rest and after
maximal exercise (Bergmeyer, 1965).
B) The affinity of CPK for creatine is much lower than for ATP.
As a result, even after high intensity exercise when creatine
levels are highest, CPK would not be operating near Vmax
because of a limiting supply of creatine (creatine
concentration at this time would still not be significantly
higher than the Km of CPK for creatine). Therefore the

52
sequestering of creatine by CPK might be rate limiting.
Greenhaff et al. (1993) argue that after supplementation
muscle Cr. levels may have reached 44 mmol/1, significantly
higher than the km for creatine (19 mmol/1). It is proposed
that this near saturation of CPK is the mechanism whereby
creatine supplementation accelerates the rate of PCr recovery
following high intensity exercise. This increased rate of PCr
resynthesis could have enhanced performance during the
present study by providing a greater high energy phosphate
pool for each succeeding work bout. Again, this increase in the
high energy phosphate pool would reduce the metabolic
impact of the exercise bouts.
Increased PCr levels caused by creatine
supplementation might also affect the management of adenine
nucleotide concentrations via the myokinase reaction. As
exercise is initiated ATP is degraded rapidly. PCr buffers this
drop in ATP concentration via the reaction catalyzed by CPK
(ADP + PCr—CPK-->ATP + Cr.). Therefore ATP concentration is
not significantly reduced until PCr levels are depleted. A
second reaction, catalyzed by myokinase (ADP + ADP—
myokinase-> ATP + AMP), competes with CPK for the
available ADP. During low intensity exercise the higher

53
affinity CPK competes more successfully than myokinase for
the available ADP. During high intensity exercise, however,
ADP levels rise significantly, providing ample substrate for
myokinase which converts two molecules of ADP to ATP and
AMP (Hochachka and Somero, 1984). The AMP formed is in
turn converted to IMP and NH4 via the AMP deaminase
reaction. Therefore, during high intensity exercise there is a
shunting of adenine nucleotides from ATP to IMP with the
result being a net loss of adenine nucleotides from the muscle
cell. This reaction shunts adenine nucleotides away from the
resynthesis of ATP.
Evidence is available which demonstrates that during
high intensity intermittent exercise, ATP concentration
continues to decrease with each successive exercise period
and that the drop in ATP levels is stoichiometrically matched
with a rise in IMP (Dobson et al., 1987). Some of the adenine
nucleotides lost in the production of IMP are restored during
the recovery periods via the purine nucleotide cycle. However,
there is likely to be a progressive loss of adenine nucleotides
during each successive bout of high intensity exercise.
Therefore there would be a shunting of adenine nucleotides
away from the pools available for ATP synthesis, leading to a
reduction in ATP levels during each subsequent exercise
period. A reduction in ATP concentration during exercise has
been linked to a decrease in force production (Nagesser et al.,
1992). In addition to this metabolically driven decrease in
force production (due to a decreased ATP concentration) an
increased IMP concentration may physically interfere with
force production of the actin-myosin complex (Nagesser et al.,
1992 and Westra et al. 1986). Berden et al. (1986) have
shown that there is a binding site for IMP on the actin-myosin
complex and have suggested that IMP might have a direct
influence on the contractile apparatus due to an, as yet
undetermined mechanism. Therefore, during high intensity
intermittent exercise there is a progressive decrease in ATP
levels on successive bouts due to the loss of adenine
nucleotides to the production of IMP. This decrease in ATP
levels at the beginning of each successive exercise period may
contribute to the fatigue response. Also, the increased IMP
concentration may physically interfere with force production
of the actin-myosin complex by an unknown mechanism. Due
to the high intensity nature of the exercise bouts, this cause of
fatigue is likely to have occurred during the placebo
supplementation regimen.

The aforementioned cause of fatigue (decrease in ATP
and an increase in IMP) might have been attenuated by
creatine supplementation due to a decreased reliance on
myokinase to buffer the rise in ADP (by providing more PCr
substrate for the competing CPK reaction). This would result in
a lower production of IMP and a lower total adenine
nucleotide loss. This reduced adenine nucleotide loss would
have resulted in better maintenance of ATP levels during
intermittent exercise by providing more adenine nucleotides
for ATP resynthesis rather than shunting the adenine
nucleotides to the synthesis of IMP. In support of this it has
been shown that creatine supplementation can reduce
hypoxanthine (Balsom et al., 1993) and ammonia (Greenhaff
et al., 1993) accumulation during high intensity intermittent
exercise. Plasma ammonia and hypoxanthine are established
markers of adenine nucleotide loss during high intensity
exercise (Harris et al., 1991). This reduced adenine nucleotide
loss due to creatine supplementation is associated with a
reduction in the decrease in ATP concentration following high
intensity exercise (Greenhaff, 1994). This also would result in
better maintenance of the high energy phosphate pool and

56
thus greater phosphagen stores preceeding each successive
bout of exercise.
Finally, creatine supplementation may have reduced the
reliance on glycolysis to replace ATP during the bouts. During
high intensity intermittent exercise the ability to generate
ATP rapidly via glycolysis may limit performance. As high
intensity exercise is initiated there is a rapid degradation of
high energy phosphates. Glycolysis is then engaged to buffer
the drop in ATP. It has been shown by Gaitanos et al. (1993)
that after a 6 second cycle sprint PCr levels were decreased
by 57%. Bogdanis et al. (1993) have found that after a 30
second cycle sprint both PCr and ATP contents were reduced
to 17.6 and 71% of their initial values respectively. This
decrease in PCr and ATP increases flux through glycolysis
almost immediately by the removal of the inhibitory effect of
these metabolites on PFK and phosphorylase (Morgan and
Parmeggiani, 1964, Mansour, 1963). Gaitanos et al. (1993)
have found that glycolysis can provide up to 50% of the ATP
required during maximal work bouts as short as 6 seconds. As
the length of the work period is increased the contribution
from glycolysis would be expected to increase as well. This
reliance on glycolysis to maintain ATP levels may be a

primary factor in determining the onset of fatigue (Astrand,
1960). Although glycolysis is required to replace the rapidly
diminishing ATP stores, maximal intensity intermittent
exercise leads to a reduction in the ATP production rate of
glycolysis for each subsequent bout. In a study by Gaitanos et
al. (1993) this reduction in the ability of glycolysis to generate
ATP during intermittent exercise led to a lower ATP
production rate overall (from 14.9 mM/Kg dry wt. to 5.3
mM/Kg dry wt per minute) after 10 six second sprints and
thus a drop in performance. Also, glycogen degradation was
decreased by 10 fold. It was proposed that the large increase
in lactate and the concomitant decrease in muscle pH was
responsible for the reduction in glycolytic and glycogenolytic
rates. Danforth (1965) has shown that a lowering of pH slows
glycolysis by inhibiting PFK and phosphorylase. Consequently,
as the volume of work is increased, there is an increasing
reliance on glycolysis to maintain ATP levels. However, the
capacity of glycolysis to generate ATP may be reduced during
each subsequent bout due to the reduction in pH. This would
inevitably lead to a reduction in performance because of an
inability to maintain the necessary ATP production rate.

In the present study plasma lactate accumulation was
reduced following creatine supplementation. Assuming that
lactate efflux and clearance were similar, this would suggest a
reduced reliance on anaerobic glycolysis due to creatine
supplementation. As previously mentioned creatine
supplementation has been shown to:
A) Reduce the decline in ATP concentration following high
intensity exercise (Greenhaff, 1994).
B) Increase the rate of PCr recovery following high intensity
exercise (Greenhaff, 1994B)
C) Lower plasma lactic acid and hypoxanthine accumulation
(indicating a reduction in adenine nucleotide loss) during high
intensity intermittent exercise (Balsom et al., 1993).
All of these factors would result in greater high energy
phosphate stores at the beginning of each subsequent exercise
bout. This might allow more work to be done prior to ATP
levels being decreased significantly. This would result in a
delay in the accumulation of the PFK stimulators ADP and
AMP. Also creatine supplementation has been shown to
reduce ammonia production, another stimulator of PFK. Thus,
the overall effect is the reduced stimulation of anaerobic
glycolysis following creatine supplementation. In the present

59
study this could have resulted in a lower reliance on
glycolysis during each exercise bout (This is supported by the
observed reduction in plasma lactate concentrations.)- A
decreasing reliance on glycolysis would result in a lower
production of lactate and thus a smaller reduction in pH. A
reduction in pH has been linked to a reduced ability of
glycolysis to generate ATP (Gaitanos et al., 1993). Therefore a
reduced decline in pH might extend time to exhaustion by
maintaining the ATP production rate of glycolysis.
A reduced reliance on glycolysis might also explain the
greater impact of creatine supplementation on bout D. Due to
the relatively short work periods during bout D (10 seconds),
it is likely that glycolysis contributed less to ATP production
during this bout than during bouts C, B, and A (note that
lactate accumulation was lower during bout D than during the
other bouts). Therefore even a small reduction in the
stimulation of glycolysis would represent a relatively large
reduction in the contribution of glycolysis during bout D.
Consequently, during longer work bouts, a similarly small
reduction in the already large contribution from glycolysis
would be expected to have less effect. This is best exemplified
by comparing bout D to Bout A. Note that lactate accumulation

60
was significantly lower during bout D following creatine
supplementation. Conversely, bout A showed no significant
change.
In summary, creatine supplementation may have
increased PCr levels resulting in an increased phosphagen
concentration, a more rapid resynthesis of PCr during the
recovery periods and a reduced adenine nucleotide loss. A
reduced adenine nucleotide loss would provide more adenine
nucleotides for the resynthesis of ATP rather than the
production of IMP. All of these factors would result in a
better maintenance of high energy phosphate concentrations
during high intensity intermittent exercise. Also, because of
the high intensity nature of the work bouts, anaerobic
glycolysis was engaged to buffer the depletion of ATP.
However, the ability to generate ATP via glycolysis is reduced
following repeated bouts of exercise due to a reduction in
muscle pH. Creatine supplementation reduced lactate
accumulation (indicating a reduced reliance on glycolysis to
produce ATP) and thus may have better preserved the ability
of glycolysis to generate ATP. The reduction in lactate
accumulation was greatest during bout D. This may explain
the relatively large impact of creatine supplementation on

61
bout D. Therefore because of a higher concentration of stored
phosphagens prior to each subsequent exercise period during
the bouts, the metabolic impact (decreased ATP and PCr
concentrations and increased lactate) of the exercise bouts
was reduced, thus delaying the onset of fatigue.
In addition to reducing lactate accumulation and
increasing total work output, oxygen consumption was also
impacted by creatine supplementation. The rate of oxygen
consumption was decreased during bout D and C following
creatine supplementation while the placebo group showed no
change during these bouts. Since oxygen consumption was
measured at the same time points on creatine versus placebo,
the same amount of work was done at a lower net oxygen
cost. This suggests that exercise efficiency (cost/work) was
affected by creatine supplementation.
Creatine may have delayed the increase in oxygen
consumption upon the initiation of exercise. A decrease in ATP
and an increase in ADP upon the initiation of exercise serves
as a stimulator of mitochondrial respiration (Scott, 1995). An
increase in PCr levels due to creatine supplementation might
have delayed the decrease in the ATP/ADP ratio that is
responsible for stimulating mitochondrial respiration. In

62
support of this argument it has been found that competition
between aerobic and anaerobic systems for ADP can inhibit
mitochondrial respiration (Gatt, S., and Racker, E., 1959). CPK
would be poised to have such an influence on mitochondrial
respiration. An increase in PCr might allow for a more rapid
rephosphorylation of ADP by CPK and thus reduce the ADP
concentration that might stimulate respiration.
Alternatively, a reduction in fatigue due to creatine
supplementation may have delayed changes in neuromuscular
coordination that may have occurred due to fatigue. It was
noted (although not actually measured) that subjects showed
an increased body movement as they approached exhaustion
(i:e. swaying side to side and leaning forward). This may have
represented a shift in muscle recruitment (due to fatigue)
from the primary muscles used during cycling to secondary
muscles that are in a less favorable position to produce force
(i.e. gluteus maximus, hamstrings). Utilizing these secondary
muscles would result in a need to generate greater force to
produce the same amount of external work, since these
muscles are in a less favorable position to produce force. As a
result oxygen consumption would be increased. If creatine
supplementation delayed the fatigue of the primary muscles
involved in cycling there would be a delay in this shift in
whole muscle recruitment patterns and thus a lower rate of
oxygen consumption. Note that although muscle recruitment
patterns were not measured, changes in recruitment patterns
cannot be ruled out as a plausible explanation for the decrease
in oxygen consumption and may present a plausible
explanation since both aerobic (decreased V 02) and anaerobic
(decreased lactate) metabolism were reduced following
supplem entation.
It was proposed that fitness levels might affect response
to creatine supplementation since Harris et al. (1992) have
shown that creatine uptake due to creatine feeding was
greatest in subjects that had a lower initial level of creatine.
Because exercise training has been shown to increase PCr
stores (Macdougall et al., 1977) the relationship between
fitness level (highest V 02 during V 02 peak test) and
magnitude of response to creatine supplementation was
investigated. No significant relationship between these two
variables was found. Perhaps the index of fitness chosen has
little relationship to muscle creatine levels. Alternatively,
creatine may have impacted performance regardless of initial
creatine levels. Also, the relationship of body weight to

magnitude of response to creatine supplementation was
investigated. The subjects encompassed a broad range in body
weights from 115 to 290 pounds. Therefore the lightest
subject in the study would have received nearly three times
the relative dose (dose/body wt.) of the heaviest subject.
However, no relationship between body weight and response
to creatine supplementation was observed. This might suggest
that the dose administered to the lighter subjects might have
been in excess of what was necessary to produce a response
since nearly 1/3 of that relative dose led to a similar response
in the largest subject.

CHAPTER 6 - SUMMARY AND CONCLUSIONS
The purpose of the present study was to determine if
creatine supplementation could increase total work output
during high intensity continuous and intermittent exercise.
The results indicate that creatine does enhance the
performance of high intensity intermittent exercise with a
lower accumulation of lactate and a lower rate of oxygen
consumption. Creatine supplementation may have enhanced
performance by affecting the management of adenine
nucleotides and high energy phosphates during the bouts. The
effects of creatine supplementation on intermittent exercise
are greatest when the length of the work bout is short. This
may be due to a greater relative reduction in the contribution
from glycolysis during the shorter work periods.
Although the ergogenic benefit of creatine
supplementation is likely to result from the impact on cellular
metabolism of an increase in creatine and PCr stores, other
possibilities may exist. In addition to metabolic perturbations,
other nonmetabolic mechanisms of fatigue have been
proposed. For example Bigland-Ritchie et al. (1979) have
proposed that fatigue could result from an impairment of the
central nervous system resulting in a less than optimal
65

frequency of motor nerve firing. Also, with fatigue a 10 to 20
mV reduction in membrane polarization has been observed
and this decreased membrane polarization has been
associated with a reduced Ca++ transient amplitude (Hanson
and Peterson, 1971). Both the reduced frequency of motor
nerve firing and a reduced Ca++ transient amplitude would
result in reduced force production. It is not known if creatine
supplementation can affect these fatigue mechanisms as well.
Also, alterations in blood flow and cardiac output would be
expected to affect the performance of intermittent exercise.
These cardiovascular parameters were not investigated in the
present study. In conclusion, though an increase in creatine
and PCr stores seems to be the most likely explanation of the
observed ergogenic effect, these alternative explanations
remain to be investigated.
Due to the observed ergogenic impact, creatine
supplementation might be recommended for athletes
participating in sports involving repeated, short bursts of
activity followed by rest or periods of reduced activity (i.e.
football, soccer, tennis, hockey etc...) Creatine supplementation
has been associated with no known side effects as creatine is
rapidly converted to creatinine in the blood stream in a

67
nonenzymatic-nonsaturable process. The resulting creatinine
is easily excreted by the kidney. Also, since creatine is a
naturally occurring component of a meat containing diet it is
unlikely to become a banned substance. In light of these
findings, creatine is likely to find use in many sport and
recreational activities.
Three important, yet unanswered questions with regard
to creatine supplementation are: What is the dose-response
relationship? What is the washout period (How long after the
cessation of supplementation does it take for muscle creatine
levels to return to normal baseline levels)? What are the long
term effects of creatine supplementation? Creatine
supplementation studies generally employ a dose of 20g a day
during the loading phase, apparently because this dose was
shown by Harris et al. (1992) to increase skeletal muscle
creatine concentration. However, this dose may be more than
is necessary. Due to the relatively high cost of creatine
supplementation, especially during the loading phase, it would
be beneficial to investigate further the dose-response
relationship of oral creatine supplementation. Also, Greenhaff
(1994) has mentioned that skeletal muscle creatine
concentration does not return to baseline levels for weeks

after the cessation of supplementation. Therefore the washout
period for creatine supplementation may be from weeks to
months. With regards to research, this may rule out
implementing cross over designs and reversal of treatment
designs. Finally, the long term effects of supplementing with
creatine while training are unknown. It is interesting to note
that creatine depletion upregulates glucose transporter and
oxidative enzyme expression in skeletal muscle (Shields et al.
(1975). It would be interesting to determine if long term
creatine supplementation affects any of these parameters.
Also, since creatine reduces the metabolic stress of exercise
(reduced lactate, reduced VOz and reduced fatigue) it would
b6 interesting to determine if creatine alters the conditioning
response due to exercise. Finally, if creatine allows for more
intense or longer training periods, due to delaying fatigue, we
might expect training volume or long term performance to be
affected by supplementation.

BIBLIOGRAPHY
Astrand, P., (1970) Physical performance, in Textbook o f Work P h ysio logy , pg. 295-353, McGraw-Hill.
Astrand, I., Astrand, P-O., Christensen, E.H., and Hedmanb, R., (1960) Myohemaglobin as an oxygen store in man, Acta physiol. Scand., 48,448-453.
Balsom, P.D., Ekblom, B., Soderlund, K., Sjodin, B., and Hultman,E., (1993) Creatine supplementation and dynamic high- intensity intermittent exercise, Scand. J. Med. Sci. Sports, 3, 143-149.
Balsom, P.D., Harridge, S.D., Soderlund, K„ Sjodin, B., and Ekblom, B., (1993) Creatine supplementation per se does not enhance endurance exercise performance, Acta Physiol.Scand., 149, 521-523.
Berden, J.A., Haan, A.de, Doom, J.E. van, Hartog, A.F. and Westra, H.G. (1986) Has IMP a regulatory role during fatiguing contraction? IMP-binding sites on the myosin complex of rat muscle, J. Physiol (Lod.), 381, 85P.
Bergmeyer, H.U. (1965) M ethods o f Enzymatic Analysis. 2nd ed. London, Academic Press.
Bessman, S.P., and Geiger, P.J. (1981) Transport of energy in muscle: The phosphorylcreatine shuttle. Scien ce , 211:448- 452.
Bigland-Ritchie, B., Jones, D.A., Woods, J.J. (1979) Excitation frequency and muscle fatigue: electrical responses during human voluntary and stimulated contractions. Exp. N eurol.,64, 414.
Bogdanis, G.C., Nevill, M.E., Lakomy, H.K.A., and Boobis, L.H., (1993) Human muscle metabolism during repeated maximal sprint cycling, Journal o f Physiology , 467, 77P.
Brooks, G.A. and Fahey, T.A. (1985) Exercise Physiology:Human Bioenergetics and Its Im plications, MacMillan Publishing company, New York, New York.
69

70
Crim, M.C., Calloway, D.H. and Margen, S. (1976) Creatine metabolism in men: Creatine pool size and turnover in relation to creatine intake. J. Nut. 106: 371-381.
Danforth, W.H. (1965) Activation of glycolytic pathway in muscle. In Control o f Energy Metabolism . Eds. B. Chance, R.W. Estrabrook and J.R. Williamson. Academic Press, New York. P. 287.
Dobson, G.P., Parkhouse, W.S. and Hochachka, P.W. (1987) regulation of anaerobic ATP-generating pathways in trout fast-twitch skeletal muscle, Am. J. Physiol. 253(22), R186- R194.
Dudley, G.A., Staron, R.S., Murray, T.F., Hagerman, F.C., and Luginbuhl, A.A., (1993) Muscle fiber composition and blood ammonia levels after intense exercise in humans, J. Appl. P h y s io l., 54(2): 582-586.
Earnest, C.P., Snell, P.G., Mitchell, T.L., Rodriquez, R.,Almada, A, (1993) Effect of creatine monohydrate ingestion on peak anaerobic power, capacity, and fatigue index, Med. and Sci. in Spts. and Ex.
Essen, B., (1978) Studies on the regulation of metabolism in human skeletal muscle using intermittent exercise as an experimental model. Acta Physiol. Scand. Suppl. 454, 1-32.
Fitch, C.D.,Shields, R.P., Payne, W.F., and Dacus, J.M. (1968) Creatine metabolism in skeletal muscle. III. Specificity of the creatine entry process. J . Biol. Chem . 243, 2024-2027.
Fitch, C.D. and Shields, R.P. (1966) Creatine metabolism in skeletal muscle. I. Creatine movement across muscle membranes. J. Biol. Chem. 241, 3611-3614.
Gaitanos, G.C., Williams, C., Boobis, L., and Brooks, S., (1993) Human muscle metabolism during intermittent maximal exercise of brief duration, Journal o f Physiology , 467, 76P.
7 1
Gaitanos, G. C., Williams, c., Boobis, L., and Brooks, S., (1993) Human muscle metabolism during intermittent maximal exercise, J. Appl. Physiol. 75(2), 712-719.
Gatt, S., and Racker, E. (1959) Regulatory mechanisms in carbohydrate metabolism. I. Crabtree effect in reconstructed systems. J. Biol. Chem. 234, 1015-1023.
Greenhaff, P.L. (1994) Symposium: Creatine and its application as an ergogenic aid, Nutritional Ergogenic Aids, November 11- 12, Gatorade Sports Science Institute.
Greenhaff, P. L., Bodin, K., Harris, R.C., Hultman, E., Jones, D.A., McIntyre, D.B., Soderlund, K., and Turner, D.L., (1993) The influence of oral creatine supplementation on muscle phosphocreatine resynthesis following interaction in man, Journal o f Physiology , 467, 75P.
Greenhaff, P.L., Bodin, K., Soderlund, K., and Hultman, (1994) Effect of oral creatine supplementation on skeletal muscle phosphocreatine resynthesis, Am. J. Physiol. 266, E725-E730.
Greenhaff, P.L., Casey, A., Short, A.H., Harris, R.,Soderlund, K., and Hultman, E., (1993) Influence of oral creatine supplementation on muscle torque during repeated bouts of maximal voluntary exercise in man, Clinical science , 84,565- 571.
Greenhaff, P. L., Nevill, M.E., Soderlund, K., Boobis, L., Williams, C., and Hultman, E., (1992) Energy metabolism in single muscle fibers during maximal sprint exercise in man, J. Physiol. , 446, 528P.
Guimbal, C., and Kilimann, M.W. (1993) A Na+ -dependent creatine transorter in rabbit brain, muscle, heart and kidney,J. B io l Chem. , 268(12), 8418-8421.
Hanson, J., and Persson, A. (1971) Changes in the action potential and contraction of isolated frog muscle after repetitive stimulation. Acta Physiol. Scand., 81, 340.
Harris, R.C., Marlia, D.J., Show, D.H. (1991) Muscle ATP loss and lactate accumulation at different work intensities in the

72
exercising thoroughbred horse. Eur. J. Appl. Physiol., 62, 235- 44.
Harris, R.C., Soderlund, K., and Hultman, E., (1992) Elevation of creatine in resting and exercised muscle of normal subjects by creatine supplementation, C linical Science, 83, 367-374.
Koszalka, T.R. and Andrew, C.L. (1972) Effect of insulin on the uptake of creatine-l-Cu by skeletal muscle and X-irradiated rats. Proc. Soc. Exp. Biol. Med. 139: 1265-1271.
Loike, J.D., Zalutsky, D.L., Kaback, E., Miranda, A.F. and Silverstein, S.C. (1987) Extracellular creatine regulates creatine transport in rat and human muscle cells, Proc. Natl. Acad. Sci, USA, 85: 807-811.
MacDougall, J.D, Ward, G.R, Sale, D.G., and Sutton, J.R. (1977) Biochemical adaptation of human skeletal muscle to heavy resistance training and immobilization, J. Appl. Physiol., 43(4), 700-703 .
McGilvery, R.W. (1975) The use of fuels for muscular work. In M etabolic Adaptation to Prolonged Physical Exercise, ed. H. Howald and J.R. Poortmans, 12-30. Basel: Birkhauser Verlag.
Miller, W.G. (1992) Regulation of energy production during exercise, In Biochemistry o f Exercise and M etabolic Adaption, Brown and Benchmark, Duburke, IA.
Mansour, T.E., (1963) Studies on heart phosphofructokinase: Purification, inhibition, and activation. J. Biol. Chem., 238, 2285-2292 .
Morgan, H.E. and Parmeggiani, A., (1964) Regulation of glycogenolysis in muscle. III. Control of glycogen phosphorylase activity, J. Biol. Chem., 239, 2440-2445.
Nagesser, A.S., Van Der Laarse and Elzinga, W. J. (1992) Metabolic changes with fatigue in different types of single muscle fibers of Xeopus laevis. Journal o f Physiology, 448, 5 1 1 -5 2 3 .
73
Passonneau, J.V. and Lowry, O.H. (1963) Phosphofructokinase and the control of the citric acid cycle, Bio chem. Biophys. Res. Commun.y 13, 372-379.
Saltin, B„ Essen, B., and Pendersen, P.K., (1976) Intermittent exercisers physiology and some practical applications, in E. Jokl, R.L. Anand, and H. Stoboy (eds.), Advances in Exercise P hysio logy, p. 23, S. Karger, Basel.
Scott, C.B. (1995) Anaerobic metabolic influences on oxygen uptake behavior, Journal o f Strength and Conditioning R esearch , 9(1), 59-62.
Shields, R.P., Whitehair, C.K., Carrow, R.E, Heusner, W.W., and Van Huss, W.D. (1975) Skeletal muscle function and structure after depletion of creatine, L abratory Investigation , 33(2), 151-158.
Soderlund, K., Greenhaff, P.L., and Hultman, E., (1992) energy metabolism in type I and type II human muscle fibers during short term electrical stimulation at different frequencies, A c ta Physio Scand., 144, 15-22.
Walker, J.B. (1973) Metabolic control of creatine biosynthesis, II. Restoration of transamidinase activity following creatine repression. J. Biol. Chem. 236, 493-498.
Westra, H.G. De Haan, A., Van Doom, J.E. and De Haan, E J. (1986) IMP production and energy metabolism during exercise in rats in relation to age. Biochem ical Journal 239, 751-755 .
APPENDIX A: CONSENT FORM
The Effects of Creatine Supplementation on Total Work Output and Metabolism During High Intensity Intermittent Exercise.
I_________________________________________________ , Hereby
agree to participate as a subject in the research project
entitled: The Effects of Creatine Supplementation on Total
Work Output and Metabolism Purina High Intensity
Intermittent Exercise.
I understand that I shall perform a series of high intensity
cycle ergometer tests to exhaustion. I understand that since
the tests are of a high intensity nature I will experience
fatigue and the associated symptoms (shortness of breath,
tiredness, muscle ache). I also understand that during the test
data collection will include: finger prick blood samples -
finger prick blood samples will be taken with sterile lancets
in a sanitary manner. Oxygen consumption - Oxygen
consumption will be determined by the use of a Quinton gas
analyzer. Urinary creatinine - Urinary creatinine will be
measured and will be performed on the 5 urine samples that I
will provide.

75
I understand that the risks of this study are minimal and no
greater than that I would experience during intense physical
exertion (for example, fatique, localized muscle ache,
shortness of breath, soreness). I am aware that I may choose
to discontinue my participation in the study at any time
without any penalty or consequences.
I understand that I will be given creatine monohydrate (20g
per day for 5 days) or a calcium placebo (6g per day for 5
days). Both are nutritional supplements that are available
over the counter and do not exceed the manufacturers
suggested maximum dosage.
I understand that the results of this study may be published,
but upon publication or presentation of the collected data, in
any form, my name wilt not be used. Also, if I wish, at the
conclusion of the study I will be informed as to the results.
I have completely read this form. I understand the purpose of
the study and the proceedures and risks involved. I understand

that if I have any questions I may contact the researchers at
388-2036 or 766-6328.
Signed ___________________ Date _______________________
SS# ___________________ Date _______________________
Michael C. Prevost, Principal Investigator.
Arnold Nelson, Ph.D., Co-Investigator

APPENDIX B: PHYSICAL ACTIVITY READINESS QUESTIONNAIRE
PHYSICAL ACTIVITY READINESS QUESTIONNAIRE
For most people, physical activity should not pose any problem or hazard. PAR-Q has been designed to identify the small number of adults for whom physical activity might be inappropriate or those who should have medical advice concerning the type of activity most suitable.
1. Has your doctor ever said you have heart trouble?2. Do you frequently suffer from pains in yuour chest?3. Do you often feel faint or have spells of severe dizziness?4. Has a doctor ever said yhour blood pressure was too high?5. Has a doctor ever told yo that you have a bone or joint problem shch as arthritis that has been aggravated by exercise, or might be made worse with exercise?6. Is there a good physical reason not mentioned here why yuou should not follow an activity program even if yo wanted to ?7. Are you over the age of 65 and not accustomed to vigorous exerc ise?
Can you answer yes to any of the aboveq u es tio n s?____________If so which one?_________
Signature _____________________________D a te_____________________ .
77

APPENDIX C: ANOVA TABLES
Table C .l. A Lactate C reatine
DF Sum of Squares Mean Square F-Value P-VaTueTime 2 1009.371 504.686 231.734 <.0001Subject(Group) 24 52.269 2.178Phase 1 .359 .359 2.824 .1058Phase * Time 2 .205 .102 .807 .4581Phase * Subject 24 3.047 .127
Table C.2. B L actate C reatine
DF Sum of Squares Mean Square F-Value P-ValueTime 3 1752.674 584.225 340.766 <.0001Subjeot(Group) 32 54.862 1.714Phase 1 10.580 10.580 57.426 <.0001Phase * Time 3 6.614 2.205 11.967 <.0001Phase * Subject 32 5.896 .184
Table C.3. B Lactate Placebo
DF Sum of Squares Mean Square F-Value P-ValueTime 3 1926.326 642.109 230.614 <.0001Subject(Group) 32 89.099 2.784Phase 1 .045 .045 .271 .6060Phase * Time 3 .509 .170 1.024 .3949Phase * Subject 32 5.306 .166
Table C.4. C L actate C reatine
DF Sum of Squares Mean Square F-Value P-ValueTime 3 1426.420 475.473 330.564 <.0001Subject(Group) 32 46.028 1.438Phase 1 7.094 7.094 57.020 <.0001Phase * Time 3 3.455 1.152 9.257 .0001Phase * Subject 32 3.981 .124
78

79
Table C.S. C Lactate Placebo
DF Sum of Squares Mean Square F-Value P-ValueTime 3 1618.292 539.431 194.857 <.0001Subjeot(Group) 32 88.587 2.768Phase 1 .073 .073 .416 .5236Phase * Time 3 .458 .153 .865 .4695Phase * Subject(Group) 32 5.653 .177
Table C.6. D Lactate C reatine
DF Sum of Squares Mean Square F-Value P-ValueTime 3 735.875 245.292 177.013 <.0001Subjeei(Group) 32 44.343 1.386Phase 1 65.551 65.551 177.016 <.0001Phase * Time 3 36.264 12.088 32.642 <.0001Phase * Subject(Group) 32 11.850 .370
Table C.7. D Lactate Placebo
DF Sum of Squares Mean Square F-Value P-ValueTime 3 1169.630 389.877 186.015 <.0001Subject(Group) 32 67.070 2.096Phase 1 094 .094 .334 .5675Phase *Time 3 .405 .135 .480 .6985Phase * Subjeot(Group) 32 9.001 .281
Table C.8. A V 02 Creatine
DF Sum of Squares Mean Square F-Value P-ValueTIME 2 3208.676 1604.338 105.136 <.0001Subject(Group) 24 366.232 15.260Phase 1 .007 .007 .003 .9544Phase * TIME 2 .923 .462 .231 .7952Phase * Subject(Group) 24 47.890 1.995

80
Table C.9. A V02 Placebo
DF Sum of Squares Mean Square F-Value P-ValueTIME 2 3706.475 1853.237 111.867 <.0001Subjeot(Group) 24 397.595 16.566Phase 1 4.553 4.553 2.547 .1236Phase * TIME 2 1.078 .539 .301 .7425Phase * Subjeot(Group) 24 42.902 1.788
Table C.10. B V 02 creatine
DF Sum of Squares Mean Square F-Value P-ValueTIME 2 6430.809 3215.405 174.725 <.0001Subject(Group) 51 938.535 18.403Category for V02 1 31.558 31.558 4.699 .0349Category for V02 * TIME 2 9.140 4.570 .680 .5109Category for V02 * Subject.. 51 342.511 6.716
Table C .l l . B V 02 Placebo
DF Sum of Squares Mean Square F-Value P-ValueTIME 4 8946.018 2236.505 43.062 <.0001Subjeot(Oroup) 40 2077.498 51.937Phase I 46.512 46.512 49.382 <.0001Phase * TIME 4 6.867 1.717 1.823 .1434Phase * Subjeot(Group) 40 37.676 .942
’a b le d C.12. C V 02 Creatine
DF Sum of Squares Mean Square F-Value P-ValueTIME 4 8840.940 2210.235 113.336 <.0001Subject(Group) 40 780.063 19.502Phase 1 5.575 5.575 3.043 .0888Phase * TIME 4 7.518 1.880 1.026 .4057Phase * Subjeot(Oroup) 40 73.277 1.832

Table C.13. C V02 Placebo
DF Sum of Squares Mean Square F-Value P-ValueTIME 2 3543.328 1771.664 75.492 <■0001Subject(Group) 24 563.234 23.468Phase 1 22.401 22.401 4.383 .0471Phase * TIME 2 7.317 3.659 .716 .4989Phase * Subjeot(Group) 24 122.670 5.111
Table C.14. D V 02 Creatine
DF Sum of Squares Mean Square F-Value P-ValueTIME 11 22097.393 2008.854 20.794 <.0001Subject(Group) 96 9274.090 96.605Phase 1 114.990 114.990 53.744 <.0001Phase * TIME 11 19.239 1.749 .817 .6227Phase * Subjeot(Group) 96 205.401 2.140
Table C.15. D V 02 Placebo
DF Sum of Squares Mean Square F-Value P-ValueTIME 11 14420.758 1310.978 69.644 <.0001Subject(Group) 96 1807.111 18.824Phase 1 9.209 9.209 1.450 .2315Phase * TIME 11 24.543 2.231 .351 .9710Phase * Subject(Group) 96 609.638 6.350
Table C.16. C reatine Time to Exhaustion
DF Sum of Squares Mean Square F-Value P-ValueTEST 3 388083.819 129361.273 54.906 <.0001Subjeot(Group) 32 75393.556 2356.049Phase 1 114321.681 114321.681 203.578 <.0001Phase * TEST 3 61580.819 20526.940 36.553 <.0001Phase * Subject(Group) 32 17970.000 561.563
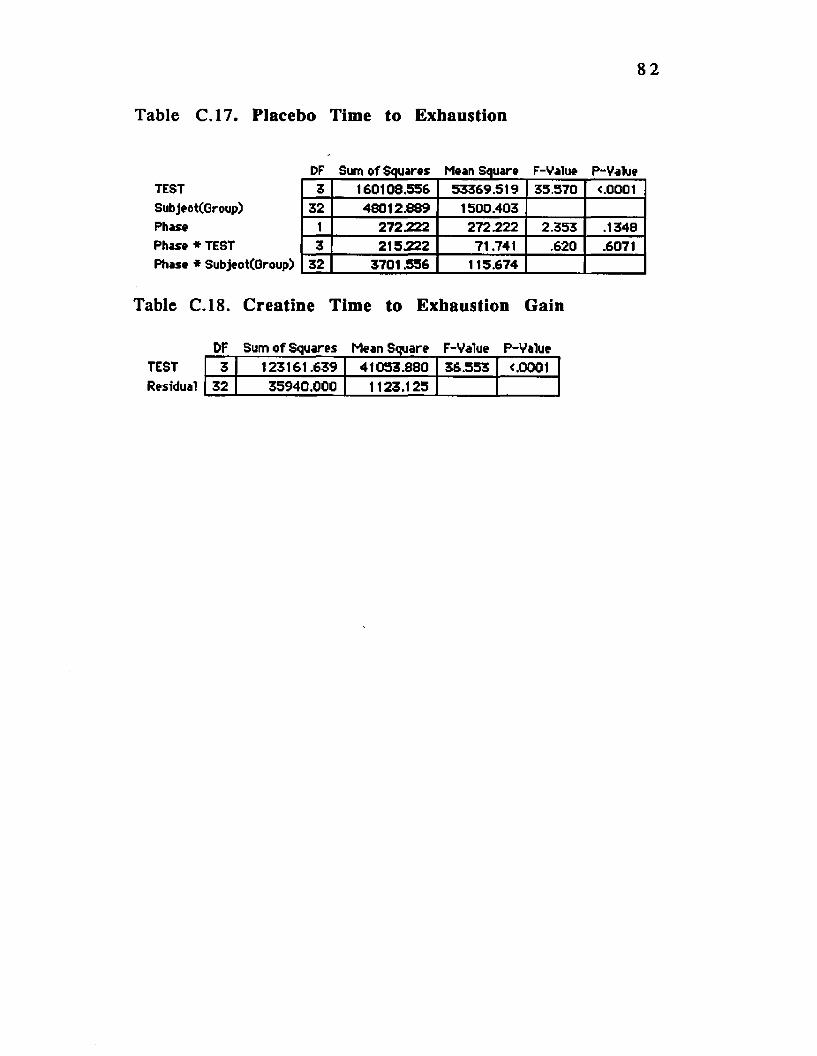
82
Table C.17. Placebo Time to Exhaustion
DF Sum of Squares Mean Square F-Value P-ValueTEST 3 160108.556 53369.519 35.570 <.0001Subjeot(Group) 32 48012.889 1500.403Phase 1 272.222 272.222 2.353 .1348Phase * TEST 3 215.222 71.741 .620 .6071Phase * Subjeot(Group) 32 3701.556 115.674
Table C.18. C reatine Time to Exhaustion Gain
DF Sum of Squares Mean Square F-Value P-ValueTEST 3 123161.639 41053.880 36.553 <.0001Residual 32 35940.000 1123.125

APPENDIX D: RAW DATATable D.1. Time To Exhaustion DataNUMBER GROUP PHASE TEST GBOER TIME1 C 1 A F 6 51 c 1 B F 1161 c 1 C F 1201 c 1 D F 1401 c 2 A F 1031 c 2 B F 2201 c 2 C F 2401 c 2 D F 2802 p 1 A M 352 p 1 B M 902 p 1 C M 1002 p 1 D M 1502 p 2 A M 412 p 2 B M 902 p 2 C M 802 p 2 D M 1603 p 1 A F 603 p 1 B F 1203 p 1 C F 2073 p 1 D F 1703 p 2 A F 523 p 2 B F 1003 p 2 C F 1603 p 2 D F 1604 c 1 A M 424 c 1 B M 604 c 1 C M 1404 c 1 D M 1504 c 2 A M 504 c 2 B M 1504 c 2 C M 2004 c 2 D M 3005 c 1 A M 52Is c 1 B M 73
(table con’d)
83
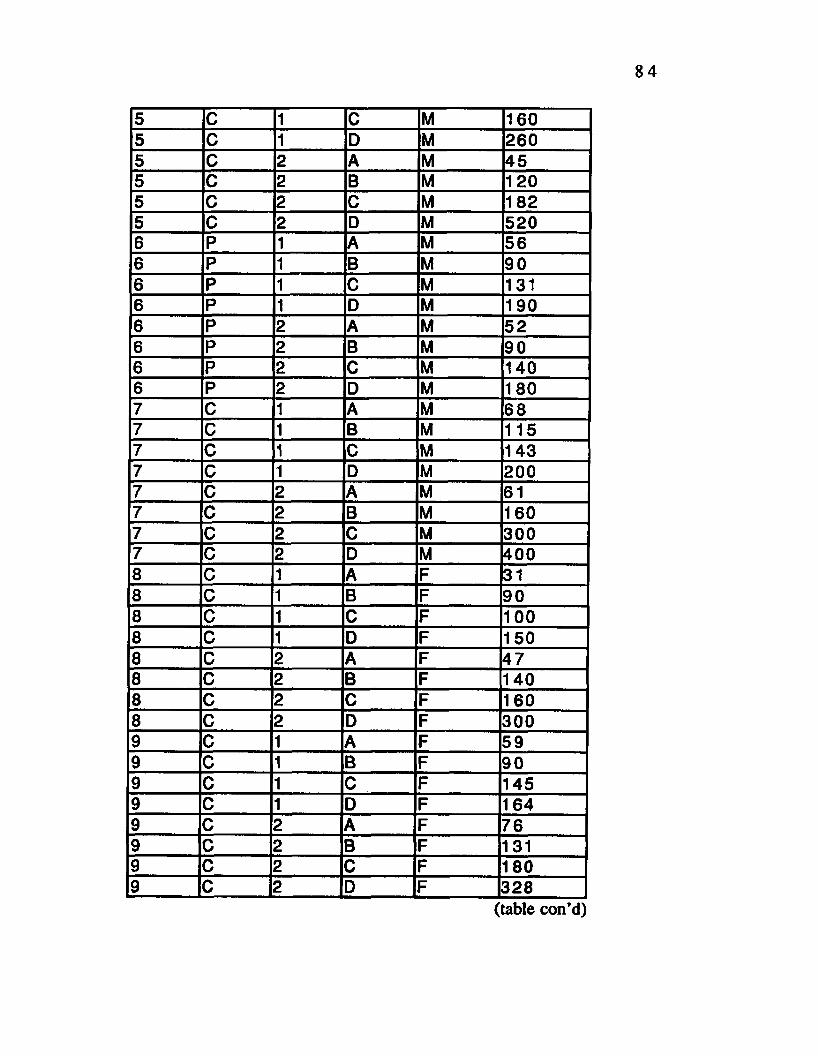
555555666666 ^
667777_7_7_7_7_8_
8_8 .8_
8_
8_
8_8_9_9_9_9_9_9_9_9.
84
M 160M 260M 45
B M 120M 182M 520M 56
B M 90M 131M 190M 52
B M 90M 140M 180M 68
B M 115M 143M 200M 61
B M 160M 300M 400
31B 90
10015047
B 14016030059
B 9014516476131180328(table con’d)

10 C 1 A M 6210 C 1 B M 8910 C 1 C M 12010 C 1 D M 14210 C 2 A M 5910 C 2 B M 10910 C 2 C M 16810 C 2 D M 29011 P 1 A M 4511 P 1 B M 11011 P 1 C M 18011 P 1 D M 25011 P 2 A M 4611 P 2 B M 9011 P 2 C M 19211 P 2 D M 24012 P 1 A 5812 P 1 B 15712 P 1 C 2001 2 P 1 D 1671 2 P 2 A 3112 P 2 B 16012 P 2 C 16012 P 2 D 18013 C 1 A M 4313 c 1 B M 10013 c 1 C M 12613 c 1 D M 1651 3 c 2 A M 6013 c 2 B M 14513 c 2 C M 25813 c 2 D M 33014 3 1 A • 4114 3 1 B • 7014 3 1 C 12014 3 1 D - 13614 3 2 A B 5214 3 2 B 85
(table con’d)

14 P 2 C F 10014 P 2 D F 13115 P 1 A F 6615 P 1 B F 12315 P 1 C F 14115 P 1 D F 16015 P 2 A F 6015 P 2 B F 13015 P 2 C F 1501 5 P 2 D F 15016 P 1 A M 3516 P 1 B M 9016 P 1 C M 1301 6 P 1 D M 2001 6 P 2 A M 3816 P 2 B M 901 6 P 2 C M 12016 P 2 D M 21017 C 1 A 3017 C 1 B 901 7 c 1 C 1001 7 c 1 D 17017 c 2 A 5717 c 2 B 15017 c 2 C F 18017 c 2 D F 3401 8 p 1 A M 4518 p 1 B M 11518 p 1 C M 12018 p 1 D M 15018 3 2 A M 3818 3 2 B M 12018 3 2 C M 1401 8 3 2 D M 150
Table D.2. V02 Data Bout A
NUMBER GROUP TIME VOa 1 VO* 2 R 1 R21 C 0 4.2 4.7 0.81 1
(table con’d)

87
1 C 30 22.4 21.1 0.76 0.921 C 45 27 26 0.92 11 C 60 29.6 33.5 1.03 1.232 P 0 5 6.1 1.05 12 P 15 15.4 18.32 1.14 1.052 P 30 25.9 22.5 1.12 1.12 P 45 34.2 1.232 P 60 43.8 1.33 P 0 7.2 7.7 0.74 0.83 P 15 21.2 22 0.84 0.893 P 30 29.1 32.1 0.9 1.013 P 45 36.7 38.1 1.04 1.233 P 60 38.2 1.244 C 0 7.7 6.4 0.874 c 15 12 13.5 0.994 c 30 19 23.2 0.984 c 45 26.1 27.4 1.125 c 0 4.5 4.2 0.8 0.915 c 1 5 1 5 16.1 0.9 15 c 30 25.7 26 1.09 1.135 c 45 29.5 30.1 1.25 1.26 p 0 7 5 0.82 0.86 p 15 25 23 0.97 16 p 30 33 32.5 1.09 1.16 p 4 5 43 45.1 1.2 1.217 c 0 6.7 9.5 0.77 0.877 c 15 17.2 16.6 0.83 0.797 c 30 21.6 23.7 0.91 0.87 c 45 33.4 33.4 1.09 0.967 c 60 38.4 38 1.22 1.38 c 0 4.6 4.2 0.86 0.958 c 15 20.1 15.2 1.07 0.98 c 30 28 21.5 1.2 1.28 c 45 29.9 1.29 c 0 8.2 7.5 0.87 19 c 15 18.6 14.6 0.9 0.99 c 30 26.2 18.4 1.09 0.969 c 45 25.7 23.5 1.3 1.1
(table con’d)

9 C 60 26.2 1.3510 C 0 11.1 8.8 0.85 0.910 C 15 21.7 13.4 0.99 0.9210 C 30 29.6 21.3 1.02 0.910 C 45 35.3 27.3 1.16 1.0610 C 60 35.8 28.1 1.3 1.2311 P 0 8.8 7 0.8 0.8211 P 15 27.6 25.4 0.9 0.9411 P 30 30.8 29.7 1.2 1.1811 P 45 44.9 46.2 1.31 1.2512 P 0 7.5 7.7 0.75 0.8512 P 15 19.2 15.5 0.87 0.8612 P 30 24.1 23.8 0.97 1.312 P 45 29 1.1313 c 0 7 7.7 0.93 0.9513 c 15 10.1 19 0.87 0.9813 c 30 24.1 31 0.94 1.0113 c 45 37.9 38.4 1.03 1.1813 c 60 43.5 1.4114 p 0 6.7 9.8 0.93 0.914 p 15 17.8 18.1 1 0.8714 p 30 26.5 24.9 1.04 0.9514 p 45 30.4 1.1615 p 0 9.1 5.3 0.97 115 p 15 17.4 6.4 1.02 1.0315 p 30 25.3 16.3 1.02 1.0715 p 45 30.8 20.5 1.16 0.8815 p 60 33.8 28.2 1.37 0.9816 p 0 7.1 6.4 0.95 0.9816 p 15 18.2 17.3 1.05 1.116 p 30 23.4 24 1.15 1.217 c 0 7.5 6.1 0.7 0.9217 c 15 20 19.3 0.7 0.9917 c 30 31.8 29.5 0.95 1.117 c 45 39 1.1618 p 0 5.6 6.7 0.8 0.818 p 15 18.4 16.9 0.86 0.8818 p 30 29.4 26.5 1.02 0.9518 p 45 32.9 1.05

Table D.3. VO 2 Data Bout B
NUMBER GROUP TIME V02 1 V02 2 R 1 R21 C 0 6.3 4.7 0.86 11 C 30 20.4 16 1.04 0.981 C 120 29.6 21.1 1.18 0.921 C 210 32.5 26 1.11 11 C 286 29.6 33.5 1.2 1.231 C 390 30.1 11 C 480 30.1 0.991 C 570 30.1 0.982 P 0 7.9 6.7 1.03 1.012 P 30 33.1 34 1.07 1.042 P 120 42.5 42.9 1.06 1.072 P 210 42.2 45 1 1.083 P 0 8 8 0.71 0.783 P 30 27.6 28 0.93 0.913 P 120 30.7 31.2 1.1 1.173 P 210 36.6 37.5 1.02 1.053 P 300 37.8 38.2 0.99 1.14 c 0 6.5 6.6 0.74 0.754 c 30 25 18.5 1.08 0.884 c 120 25.3 23.8 1.09 1.014 c 210 28.4 1.074 c 300 29.7 1.054 c 390 29.8 1.085 c 0 5.6 9.8 1.18 1.045 c 30 40.2 36.5 1.19 1.035 c 120 45.5 42.3 1.22 1.075 c 195 54.2 48.3 1.24 1.155 c 300 52.1 1.216 p 0 6.5 5.2 0.88 0.986 p 30 25.9 26.2 1.01 1.036 p 120 33.3 34 1.05 1.056 p 210 35.3 37 0.99 1.067 c 0 5.2 7.2 0.88 0.89
7 c 30 30.6 27.9 1.06 0.86(table con’d)
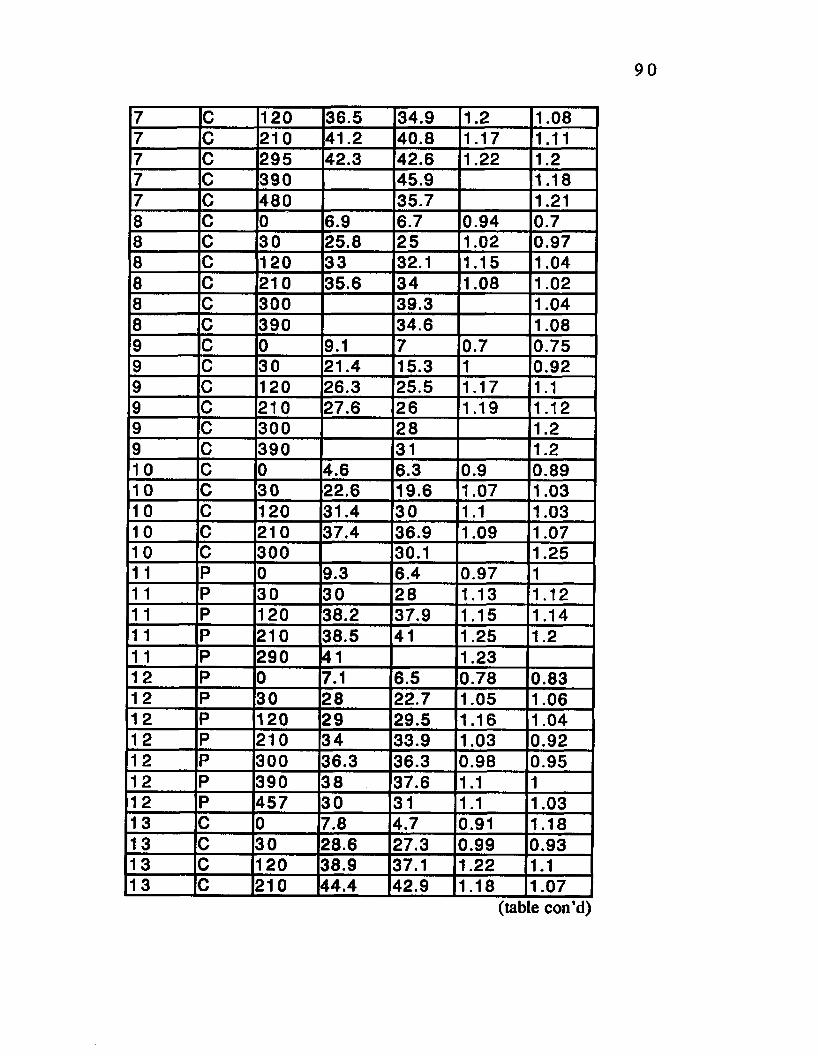
7 C 120 36.5 34.9 1.2 1.087 C 210 41.2 40.8 1.17 1.117 C 295 42.3 42.6 1.22 1.27 C 390 45.9 1.187 C 480 35.7 1.218 C 0 6.9 6.7 0.94 0.78 C 30 25.8 25 1.02 0.978 C 120 33 32.1 1.15 1.048 C 210 35.6 34 1.08 1.028 C 300 39.3 1.048 C 390 34.6 1.089 C 0 9.1 7 0.7 0.759 C 30 21.4 15.3 1 0.929 C 120 26.3 25.5 1.17 1.19 C 210 27.6 26 1.19 1.129 C 300 28 1.29 C 390 31 1.210 C 0 4.6 6.3 0.9 0.8910 C 30 22.6 19.6 1.07 1.0310 C 120 31.4 30 1.1 1.0310 C 210 37.4 36.9 1.09 1.0710 C 300 30.1 1.2511 P 0 9.3 6.4 0.97 11 1 P 30 30 28 1.13 1.121 1 P 120 38.2 37.9 1.15 1.1411 Ip 210 38.5 41 1.25 1.211 p 290 41 1.2312 p 0 7.1 6.5 0.78 0.8312 p 30 28 22.7 1.05 1.0612 p 120 29 29.5 1.16 1.0412 p 210 34 33.9 1.03 0.9212 p 300 36.3 36.3 0.98 0.9512 3 390 38 37.6 1.1 112 P 457 30 31 1.1 1.0313 c 0 7.8 4.7 0.91 1.1813 c 30 28.6 27.3 0.99 0.9313 c 120 38.9 37.1 1.22 1.113 c 210 44.4 42.9 1.18 1.07
(table con’d)
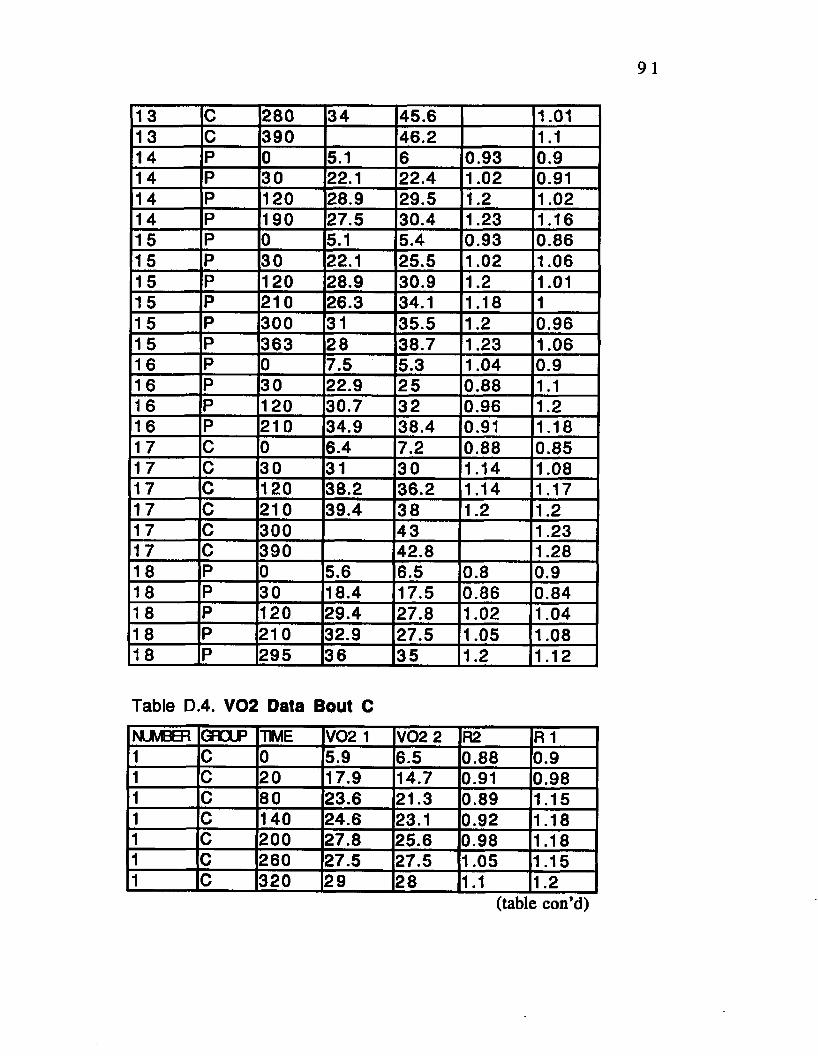
13 C 280 34 45.6 1.0113 C 390 46.2 1.114 P 0 5.1 6 0.93 0.914 P 30 22.1 22.4 1.02 0.9114 P 120 28.9 29.5 1.2 1.0214 P 190 27.5 30.4 1.23 1.1615 P 0 5.1 5.4 0.93 0.8615 P 30 22.1 25.5 1.02 1.0615 P 120 28.9 30.9 1.2 1.0115 P 210 26.3 34.1 1.18 115 P 300 31 35.5 1.2 0.9615 P 363 28 38.7 1.23 1.0616 P 0 7.5 5.3 1.04 0.916 P 30 22.9 25 0.88 1.116 P 120 30.7 32 0.96 1.216 P 210 34.9 38.4 0.91 1.1817 C 0 6.4 7.2 0.88 0.8517 c 30 31 30 1.14 1.0817 c 120 38.2 36.2 1.14 1.1717 c 210 39.4 38 1.2 1.21 7 c 300 43 1.231 7 c 390 42.8 1.2818 p 0 5.6 6.5 0.8 0.918 p 30 18.4 17.5 0.86 0.841 8 p 120 29.4 27.8 1.02 1.0418 p 210 32.9 27.5 1.05 1.0818 p 295 3 6 35 1.2 1.12
Table D.4. V02 Data Bout C
NUMBER GROUP TIME V02 1 V02 2 R2 R 11 C 0 5.9 6.5 0.88 0.91 c 20 17.9 14.7 0.91 0.981 c 80 23.6 21.3 0.89 1.151 c 140 24.6 23.1 0.92 1.181 c 200 27.8 25.6 0.98 1.181 c 260 27.5 27.5 1.05 1.151 c 320 29 28 1.1 1.2
(table con’d)

1 C 380 27.8 1.151 C 440 28.1 1.21 C 500 29.2 1.181 C 560 28.7 1.241 C 620 28.3 1.171 C 680 29 1.22 P 0 6 5.5 1 1.12 P 20 25.7 26 1.07 1.062 P 80 34.2 33.2 1.1 0.982 P 140 36.9 37 1.09 1.112 P 200 37.4 39.2 1.1 0.992 P 260 41.2 1.143 P 0 5.5 5.1 0.95 0.793 P 20 22.7 24.1 0.98 0.983 P 80 30.4 29.5 1.19 1.083 P 140 31.9 31.2 1.16 1.123 P 200 33.2 31.2 1.15 1.043 P 260 33.5 34.2 12 1.13 P 320 34.6 34 1.18 1.153 P 380 38.1 38 1.23 1.23 P 440 39.1 41.2 1.3 1.143 P 500 39.3 1.233 P 560 40 1.23 P 620 35.6 1.314 C 0 5.7 7.4 0.9 0.944 c 20 19.4 19 0.96 0.964 c 80 24.3 23 0.95 1.14 c 140 26.9 25.2 1.05 1.094 c 200 30.8 28.8 1.02 1.034 c 260 32.1 31.7 1.03 1.034 c 320 34.7 33 1.08 1.124 c 380 36 35 1.1 1.184 c 440 34 1.185 c 0 4.7 5.2 0.93 0.915 c 20 33.5 32 1.1 1.125 c 80 37.8 35 1.04 1.165 c 140 40.8 39 1.08 1.125 c 200 42.8 40.2 1.1 1.08
(table con’d)

55555666666667777777777777777888888888
93
260 46 44.1 1.1 1.1320 39.6 45.9 1.1 0.98380 48.1 46.3 1.15 1.2440 51.7 48 1.12 1.2500 54.3 0.98
8.6 7.8 0.91 0.7820 24.4 26.7 0.98 0.980 28.6 32.9 1.13 1. 12140 33.3 36.1 1.13 1.14200 34.6 38.5 1.08 1.1260 34.6 39.6 1.12 1.1311 37.5 39.9 1.11 1.14380 41.1 1.08
6.5 5.4 0.89 0.9520 23.7 22.7 0.7480 33 32.6 1.04140 37.1 35.1 1.13 1.17200 39.2 37.8 1.08 1.09260 41.2 40.5 1.04 1.21320 43.1 41.7 1.02 1.15380 44 41.5 0.99 1.12440 43.5 0.92500 44.3 0.96560 45.4 0.93620 43.4 0.91680 44.2 1.11
45.2 1.0844.4 1.0345.3 1.02
7.1 6.5 0.84 0.9920 17.9 16.5 0.82 0.9380 27.7 27 0.9 1.24140 31.4 30.4 1.18 1.28200 33 32.8 1.14 1.3260 34 33.3 1.08 1.2320 35.5 1.14380 36 1.17440 35.9 1.2
(tab!e con’d)

9 C 0 7.3 6.5 0.9 0.869 C 20 18.8 16.4 0.94 0.849 C 80 23.5 25.4 1.17 1.219 C 140 24.1 24.2 1.11 1.229 C 200 25.1 25 1.08 1.169 C 260 25.3 26.1 1.08 1.19 C 320 28 27.5 1.04 1.19 C 380 29.1 28.7 1.06 1.29 C 440 28.4 1.049 C 500 29.4 1.041 0 C 0 7 6.2 0.92 0.8610 C 20 15.9 13.6 0.95 0.8610 C 80 26.5 24.3 1 1.0710 c 140 31 29.1 1.2 1.1710 c 200 34 30.7 1.1 1.1410 c 260 35.3 32.1 1.14 1.1210 c 320 30.7 33 1.17 1.310 c 380 34.3 1.1510 c 440 31.3 1.1711 p 0 5.7 6.4 0.9 0.8711 p 20 23.9 24.3 1.12 1.131 1 p 80 33.8 34 1.14 1.161 1 p 140 34.6 34.8 1.2 1.151 1 p 200 34 36.3 1.07 1.0811 p 260 40.1 40 1.06 1.0711 p 320 40.2 39.9 1.05 1.051 1 p 380 42.7 43.1 1.04 1.0211 p 440 43.3 43.2 1.02 1.011 1 p 500 42.1 43.7 1.03 0.9612 p 0 6.7 5.2 0.83 0.8212 p 20 19.2 21.6 0.86 0.9312 p 80 26.5 28.1 1.04 1.1612 p 140 27.9 29.3 1 1.161 2 p 200 26.8 29.7 0.93 1.0712 p 260 29.5 32.7 0.94 1.021 2 p 320 31.1 32.4 0.91 1.0412 p 380 30.6 33.1 0.95 1.031 2 p 440 33.2 33.6 0.93 1
(table con’d)
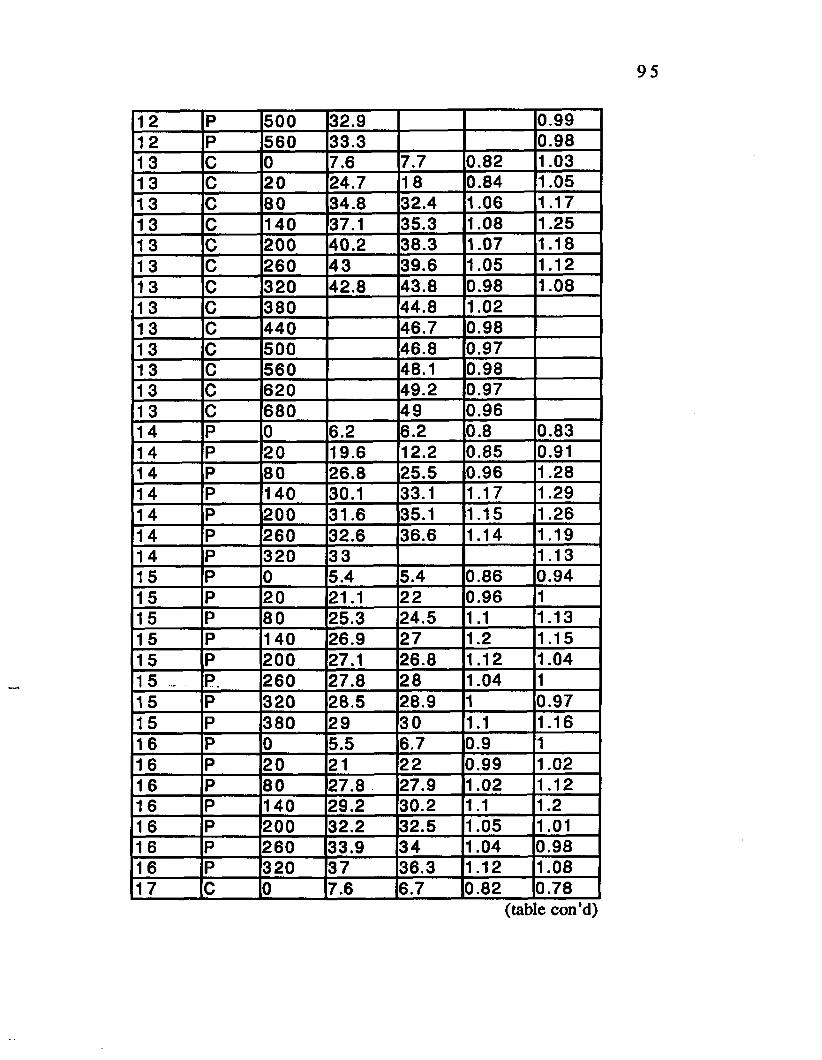
12 P 500 32.9 0.9912 P 560 33.3 0.9813 C 0 7.6 7.7 0.82 1.0313 C 20 24.7 18 0.84 1.0513 c 80 34.8 32.4 1.06 1.1713 c 140 37.1 35.3 1.08 1.2513 c 200 40.2 38.3 1.07 1.1813 c 260 43 39.6 1.05 1.1213 c 320 42.8 43.8 0.98 1.0813 c 380 44.8 1.0213 c 440 46.7 0.9813 c 500 46.8 0.9713 c 560 48.1 0.9813 c 620 49.2 0.9713 c 680 49 0.9614 p 0 6.2 6.2 0.8 0.8314 p 20 19.6 12.2 0.85 0.9114 p 80 26.8 25.5 0.96 1.2814 p 140 30.1 33.1 1.17 1.2914 p 200 31.6 35.1 1.15 1.2614 p 260 32.6 36.6 1.14 1.1914 p 320 33 1.1315 p 0 5.4 5.4 0.86 0.9415 p 20 21.1 22 0.96 115 p 80 25.3 24.5 1.1 1.1315 p 140 26.9 27 1.2 1.1515 p 200 27.1 26.8 1.12 1.0415 .... p. 260 27.8 28 1.04 115 p 320 28.5 28.9 1 0.9715 p 380 29 30 1.1 1.1616 p 0 5.5 6.7 0.9 116 p 20 21 22 0.99 1.0216 p 80 27.8 27.9 1.02 1.1216 p 140 29.2 30.2 1.1 1.216 p 200 32.2 32.5 1.05 1.0116 p 260 33.9 34 1.04 0.9816 p 320 37 36.3 1.12 1.0817 c 0 7.6 6.7 0.82 0.78
(table con’d)

1 7 C 20 1 1 12.1 1.05 1.0417 C 80 29.5 26.7 1 0.9517 C 140 34.5 32.4 1.09 1.317 C 200 39.4 38.1 1.1 1.241 7 C 260 39 39 1.13 1.151 7 C 320 40.1 0.9817 C 380 41 1.217 C 440 41.1 1.1817 C 500 40.2 1.1318 P 0 6.8 6.5 0.86 0.7818 P 20 16.2 15.9 1 0.7618 P 80 26.6 27.4 1.07 1.0318 P 140 31.2 29.9 1.1 1.1518 P 200 34.6 35.6 1.2 1.2318 P 260 36 37 1.12 1.1418 P 320 37.2 37.9 1.08 1.09
Table D.5. VO 2 Data Bout DNUMBER GROUP TIME V02 1 V02 2 R 1 R21 C 0 6.1 6.5 0.81 0.861 c 1 5 13.2 14.7 0.86 0.981 c 45 20.2 19.3 0.9 0.971 c 75 24.1 22.1 0.99 0.961 c 105 26 25.5 1.05 0.981 c 135 26.5 26 1.12 0.931 c 165 27.1 27 1.07 0.941 c 195 28.1 27.8 1.08 0.971 c 225 29.8 28.5 1.12 0.921 c 255 28.7 29.2 1.12 0.941 c 285 30.4 29 1.13 0.981 c 315 30.6 30 1.09 0.971 c 345 31.7 31 1.05 0.861 c 375 33.4 32.8 1.07 0.931 c 405 34 33.7 1.05 0.991 c 435 34.5 0.921 c 465 35.7 0.981 c 495 35.3 I0.97
(table con'd)

97
1 C 525 35.1 0.941 C 555 35.4 0.921 C 585 34.6 0.982 P 0 6.5 12.2 1.17 0.732 P 15 11 26.5 0.89 0.912 P 45 25.6 29.2 1 0.912 P 75 31.4 31.9 1.08 1.012 P 105 34.3 30.5 1.12 0.982 P 135 35.6 33.4 1.08 0.942 P 165 37.1 32 1.04 0.982 P 195 36.4 34.5 1.08 12 P 225 38.9 31.2 1.06 0.952 P 255 38.4 30.7 0.96 0.972 P 285 39.8 29.4 0.93 0.992 P 315 38.9 33.1 0.99 0.942 P 345 43.5 36.9 0.94 0.922 P 375 40.8 39.1 0.96 0.962 P 405 40.7 37.4 0.99 0.922 P 435 43.8 41.7 0.99 1.013 P 0 14.1 16.9 0.67 0.843 P 15 27 23.1 0.82 0.83 P 45 29.7 27.2 0.96 0.793 P 75 30.7 29.6 1.01 0.823 P 105 32.7 31 1.04 1.043 P 135 33.4 32.4 1.05 1.043 P 165 34.2 32 1.03 1.053 P 195 35 34.2 1.04 1.043 P 225 35.4 29.4 1 0.983 P 255 37.3 34.7 1 1.053 P 285 36.5 34.7 1.02 1.013 P 315 38.6 37.8 1.02 0.953 P 345 38.6 39.9 1 1.063 P 375 38.5 38.7 1.01 0.953 P 405 39.1 38.9 1 13 P 435 38.8 39.7 1 1.023 P 465 37.4 37.8 1 13 P 495 38 14 C 0 8.5 7.5 0.92 0.9
(table con’d)

4 C 15 14.5 13.5 0.98 0.964 C 45 18.5 19.2 1.06 0.994 C 75 23.6 24.3 1.09 14 C 105 28.6 27.9 1.08 14 C 135 29.4 31 1.06 0.984 C 165 32.4 33.1 1.109 1.024 C 195 32 34 1.06 14 C 225 33.8 33.9 1.06 14 C 255 33.6 34 1.09 0.994 C 285 35 34.7 1.06 1.054 C 315 34.8 35 1.08 14 C 345 34.4 34.9 1.06 0.994 C 375 35 35 1.1 1.044 C 405 34.5 35 1.04 14 C 435 37 37 1.04 0.984 C 465 37 14 C 495 36.9 1.014 C 525 35 14 C 555 37.2 14 C 585 36.8 1.074 C 680 37.2 1.025 C 0 5.6 5.1 0.97 0.915 C 15 25 20.4 1.11 0.935 C 45 31.3 36.9 1.21 0.995 C 75 39.7 37.9 1.23 1.25 c 105 45 44 1.25 1.125 c 135 46.4 46.1 1.27 1.085 c 165 46.3 42 1.26 1.165 c 195 51.6 49.7 1.17 1.155 c 225 53 52.2 1.22 1.185 c 255 53.6 51.3 1.19 1.075 c 285 56.3 56 1.17 1.035 c 315 53.1 53 1.19 0.975 c 345 56.3 55.5 1.15 1.195 c 375 55.6 55 1.14 0.915 c 405 60.9 60.7 1.1 1.085 c 435 57 56.9 1.13 1.045 c 465 57.7 50.3 1.09 1.02
(table con’d)

99
5 C 495 61.4 58.3 1.08 15 C 525 64.2 60.7 1.06 0.985 c 555 62.7 62 1.02 15 c 585 67.5 64 1.02 0.936 p 0 6.8 10.4 0.86 1.076 p 15 13.7 17.2 0.78 0.766 p 45 26.1 23.3 0.85 0.816 p 75 30.6 34.8 0.97 0.816 p 105 35.3 37.8 1.01 0.96 p 135 34.9 36.8 1.08 16 p 165 37.7 38 1.08 1.046 p 195 35.9 37 1.12 1.046 p 225 35.1 39.1 1.08 1.036 p 255 35.9 39.3 1.03 1.016 p 285 37.5 38.2 1 1.026 p 315 38.4 39 1 16 p 345 37.3 38.2 1.04 1.036 p 375 39.1 38.23 0.98 1.056 p 405 39.2 39 0.98 1.026 p 435 37.4 40 0.97 16 p 465 34.1 38.9 0.95 0.976 p 495 34.7 39.2 0.96 0.946 p 525 35.9 38.9 0.95 0.926 p 555 38 0.967 c 0 8.5 6.8 0.89 0.887 c 15 19.7 21.1 0.9 0.787 c 45 31.6 26.1 1.02 0.847 c 75 36.3 30.6 1.09 0.927 c 105 38 33.5 1.21 0.977 c 135 40.1 33.8 1.29 0.997 c 165 39.1 35.5 1.29 1.037 c 195 38.8 34.7 1.31 1.047 c 225 40.3 37.4 1.27 1.037 c 255 41.9 41.9 1.23 1.057 c 285 42.2 42 1.19 1.067 c 315 45.3 43 1.16 1.067 c 345 44.8 43.8 1.12 1.057 c 375 44.9 42.5 1.11 1.04
(table con’d)

100
7 C 405 46.3 43.1 1.06 1.047 C 435 46.2 43.1 1.08 1.027 C 465 46.5 42.1 1.02 0.977 C 495 47.5 41.7 1.03 0.987 C 525 45.5 43.5 1.03 17 C 555 45 40.6 1.01 0.977 C 585 48.2 45.8 1 0.998 C 0 5.8 5.8 0.86 0.788 C 15 16.9 15.8 0.86 0.828 C 45 27.2 28.2 0.89 0.848 C 75 33.6 29.3 1.04 0.938 C 105 34.9 32.3 1.08 0.998 C 135 37.6 34.9 1.15 1.038 C 165 38.9 35.3 1.17 1.038 C 195 39.7 37.9 1.21 1.068 C 225 40.9 37.7 1.21 1.058 C 255 41.1 38 1.17 1.048 C 285 43.8 40.5 1.13 1.048 C 315 42.5 41.8 1.17 1.048 C 345 43 41.6 1.12 1.048 C 375 43.8 41.9 1.1 1.048 C 405 44 41.4 1.12 1.038 C 435 43.9 43.3 1.1 1.048 C 465 42.7 1.028 C 495 43 1.018 C 525 42.7 18 C 555 44.5 1.018 c 585 42.8 0.979 c 0 5.3 5.1 0.98 1.019 c 15 14 14.1 0.83 0.929 c 45 18.9 18.6 0.87 0.839 c 75 25 22 1.02 0.869 c 105 21.8 24 1.14 0.989 c 135 28.2 24.7 1.21 19 c 165 28.1 24.2 1.2 1.059 c 195 28 26.6 1.23 1.049 c 225 28.8 27.3 1.21 1.06
(table con’d)

101
9 C 255 29.7 24.9 1.23 1.069 c 285 30.2 28.3 1.2 1.069 c 315 31.2 26.9 1.2 1.039 c 345 30 28.3 1.17 1.029 c 375 30.2 27.7 1.15 0.999 c 405 31.8 27.4 1.11 0.999 c 435 30.5 28.7 1.13 19 c 465 31 27.7 1.13 1.029 c 495 28.7 1.029 c 525 27.4 1.019 c 555 27.4 0.989 c 585 28 0.9610 c 0 5.4 5.8 0.91 0.810 c 15 18.3 11.5 0.87 1.0310 c 45 25.7 21.6 0.95 0.881 0 c 75 29.7 26.6 1.03 0.9510 c 105 30.7 30.6 1.14 0.9710 c 135 33.5 32.8 1.11 1.0510 c 165 36.4 33.7 1.16 1.0210 c 195 38.2 37.7 1.14 1.0710 c 225 40.2 37.6 1.14 1.0510 c 255 41.1 39.1 1.09 1.0410 c 285 39.8 37.3 1.07 1.0110 c 315 43.7 39.7 1.03 1.0410 c 345 44.9 40.7 1.04 1.0310 c 375 45.6 41.3 1.03 1.0310 c 405 46 42 1.03 1.0110 c 435 36.7 1.0210 c 465 43.8 1.0110 c 495 44.2 1.0210 c 525 41.7 0.9910 c 555 44.6 110 c 585 43.3 111 p 0 5.7 6.3 0.85 0.911 p 15 18.3 19.4 0.95 0.9811 p 45 25.6 24.9 0.98 0.9911 p 75 26.7 27.2 1.09 0.9511 p 105 28.2 29.3 1.09 1.111 p 135 29 30.1 1.1 1.12
(table con’d)

102
11 P 165 29.5 30.9 1.12 1.1511 P 195 32 32 1.14 1.211 P 225 35 34.5 1.15 1.1811 P 255 35.6 36 1.09 1.1611 P 285 37 36.9 1.1 1.1311 P 315 37.4 38.2 1.09 1.0411 P 345 36.9 37 1.08 1.0311 P 375 38.1 39.2 1.07 1.0411 P 405 38.8 39.3 1.05 1.0111 P 435 39 40 1.06 111 P 465 39 41 1.04 111 P 495 38.9 41.8 1.02 111 P 525 39.4 42 1.01 0.9211 P 555 40 42.3 1.05 0.9911 P 585 38.9 42.9 1 0.9612 P 0 6.5 4.1 0.82 0.951 2 P 15 8.7 9.9 0.93 0.8612 P 45 18.5 17.1 0.96 0.8812 P 75 23.7 23.5 1.05 0.991 2 P 105 27 27.8 1.11 0.9612 P 135 28.2 29.3 1.13 0.9712 P 165 29.1 30.6 1.12 0.981 2 P 195 30 32 1.08 112 P 225 30.8 31.8 1.08 0.9912 P 255 31.5 31.4 1.08 1.0212 P 285 32.4 31.1 1.03 1.0212 P 315 32.9 33.5 1.01 1.0212 P 345 35 1.0212 P 375 34.1 1.0112 P 405 29.7 1.0313 C 0 6.9 7.5 0.9 0.9613 C 15 17.9 18.3 0.92 0.913 c 45 31.5 30.6 1.06 0.8813 c 75 38 35.7 1.11 113 c 105 43 39.6 1.27 113 c 135 42.8 43.1 1.27 1.041 3 c 165 43.3 43.1 1.25 1.0313 c 195 44.8 44.5 1.23 1.01
(table con’d)

103
13 C 225 45.3 46.4 1.2 1.0113 C 255 45.3 46.2 1.13 0.9713 C 285 49.4 46.8 1.09 0.9813 C 315 46.9 48.7 1.06 0.9913 C 345 47.4 46.4 1.06 0.9513 C 375 48.3 46.8 1.06 0.971 3 C 405 45 0.9613 C 435 46.9 0.9613 C 465 46.6 0.9513 C 495 46.7 0.9213 C 525 49.9 0.913 C 555 46.6 0.921 3 C 585 49.5 0.921 4 P 0 6 4.8 0.83 0.7914 P 15 11.7 12.2 0.91 0.8514 P 45 17.7 25.5 0.87 0.9614 P 75 25 30 0.99 1.0514 P 105 28.1 33.1 1.09 1.1714 P 135 28.6 34.3 1.19 1.1514 P 165 28.8 35.1 1.23 1.1514 P 195 28.9 34.6 1.21 1.1814 P 225 26.7 36.6 1.24 1.141 4 P 255 30.9 37.3 1.2 1.1214 P 285 31.1 38 1.17 1.1214 P 315 33.7 38.2 1.15 1.1315 P 0 4.7 5.2 0.98 0.8615 P 15 12.3 13.4 0.74 0.9815 P 45 18.3 17.6 0.84 1.115 P 75 25.2 24.5 1.05 1.1215 P 105 28.4 29 1.1 1.1115 P 135 29.3 30.3 1.12 1.0915 P 165 30.9 30.9 1.14 1.0615 P 195 31.3 32 1.14 1.0315 P 225 31.7 32 1.14 1.0215 P 255 30 32.4 1.1 1.0315 P 285 30.2 33 1.07 1.0815 P 315 31.1 32.5 1.04 115 P 345 28.4 33.1 1.01 0.98
(table con’d)

104
15 P 375 29 34 1.01 0.915 P 405 29.9 34.2 1 115 P 435 30.1 31 0.99 1.0915 P 465 31 0.9916 P 0 6.7 7.7 1 0.916 P 15 18.9 17.8 1.06 0.9916 P 45 22.3 20.5 1.05 1.0416 P 75 25.6 22.5 1.03 1.0516 P 105 27.8 25.6 1.02 1.0916 P 135 28 27.2 1.09 1.116 P 165 28 27.9 1.1 1.1216 P 195 29.8 28 1.12 1.141 6 P 225 32.4 30 1.15 1.1116 P 255 33 30.9 1.03 1.0416 P 285 34.5 32.5 1.01 1.0516 P 315 35 34 1 1.041 6 P 345 35.9 35 0.99 116 P 375 36 36 0.98 0.9916 P 405 35 36 1 0.9916 P 435 36.7 37.2 1.02 0.9416 P 465 37 37.3 1 0.9316 P 495 36.6 37 1 0.9216 P 525 37 38 0.89 0.916 P 555 36.3 38.4 0.98 0.8916 P 585 38 37.8 0.92 0.9917 C 0 8.6 7.6 1.1 0.917 C 15 19.9 19.3 0.8 0.871 7 c 45 36.3 34 0.89 0.9217 c 75 40.6 38 1.01 0.91 7 c 105 41.7 40.3 1.06 0.9217 c 135 43.7 40.2 1.06 0.9117 c 165 42.7 41 1.04 0.9517 c 195 44.4 43.1 1.04 0.9317 c 225 45.2 42.7 1.03 0.917 c 255 44 43 1.05 0.9217 c 285 46.7 43.4 1 0.9217 c 315 50.7 45 0.99 0.9217 c 345 50.6 46 1.03 0.9
(table con’d)
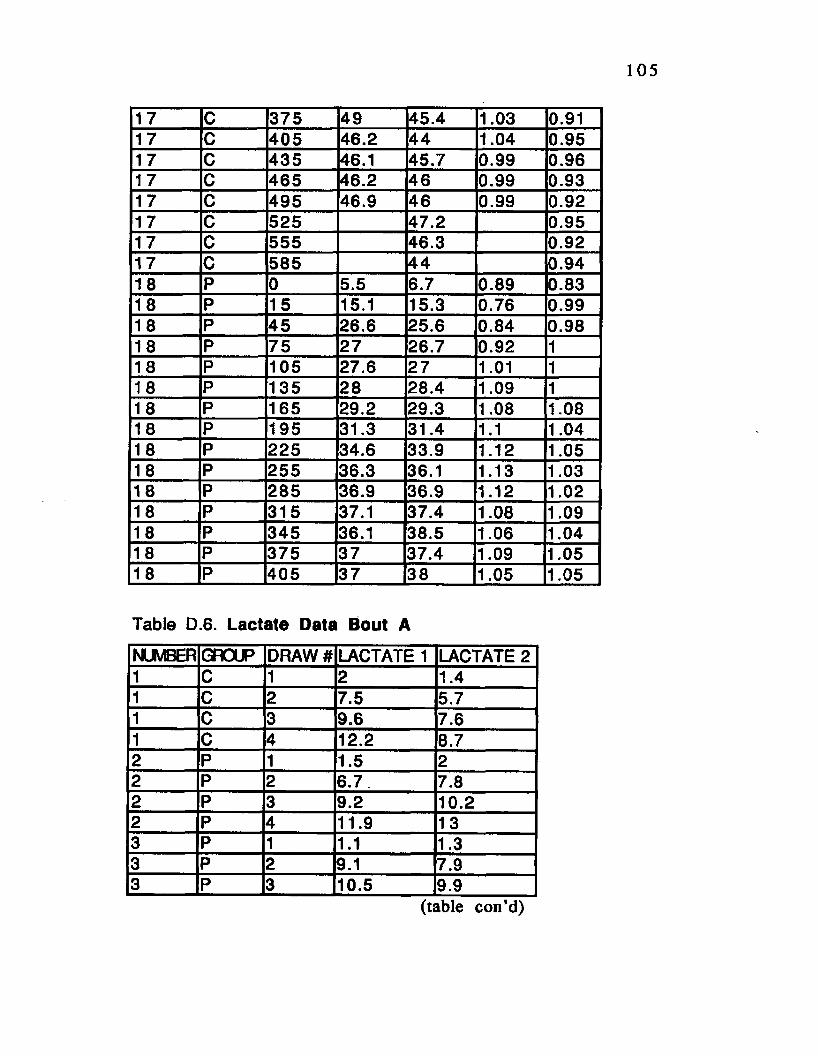
105
17 C 375 49 45.4 1.03 0.9117 C 405 46.2 44 1.04 0.951 7 C 435 46.1 45.7 0.99 0.9617 C 465 46.2 46 0.99 0.9317 C 495 46.9 46 0.99 0.921 7 C 525 47.2 0.9517 C 555 46.3 0.9217 C 585 44 0.9418 P 0 5.5 6.7 0.89 0.8318 P 15 15.1 15.3 0.76 0.991 8 P 45 26.6 25.6 0.84 0.9818 P 75 27 26.7 0.92 118 P 105 27.6 27 1.01 118 P 135 28 28.4 1.09 118 P 165 29.2 29.3 1.08 1.081 8 P 195 31.3 31.4 1.1 1.0418 P 225 34.6 33.9 1.12 1.0518 P 255 36.3 36.1 1.13 1.0318 P 285 36.9 36.9 1.12 1.0218 P 315 37.1 37.4 1.08 1.091 8 P 345 36.1 38.5 1.06 1.0418 P 375 37 37.4 1.09 1.051 8 P 405 37 |38 1.05 1.05
Table D.6. Lactate Data Bout A
NUMBER GROUP DRAW# LACTATE 1 LACTATE 21 C 1 2 1.41 C 2 7.5 5.71 C 3 9.6 7.61 C 4 12.2 8.72 P 1 1.5 22 P 2 6.7 7.82 P 3 9.2 10.22 P 4 11.9 133 P 1 1.1 1.33 P 2 9.1 7.93 P 3 10.5 9.9
(table con’d)

3 P 4 13.1 12.54 C 1 3.1 2.34 C 2 8.3 6.74 C 3 9.2 7.24 C 4 13.3 8.15 C 1 2 1.95 C 2 5.6 5.25 C 3 8.2 6.45 C 4 9.6 7.16 P 1 1.5 2.16 P 2 5.9 5.56 P 3 8 7.86 P 4 11.9 10.27 C 1 2.1 1.27 C 2 6.7 4.27 C 3 8.3 6.57 C 4 12.6 8.58 C 1 1.8 2.38 C 2 8 68 C 3 10.1 5.98 C 4 14.1 99 C 1 1.5 1.29 c 2 5.6 5.69 c 3 10.1 7.29 c 4 13.2 8.810 c 1 2.1 210 c 2 6.2 71 0 c 3 9.1 7.710 c 4 12.1 8.411 p 1 2.3 1.811 p 2 5.9 61 1 p 3 8.4 8.51 1 p 4 11.9 1212 p 1 1.9 31 2 3 2 7.2 6.912 3 3 10 9.812 p 4 14.1 14.213 c 1 2.1 1.5
(table con’d)

13 C 2 _ 8 813 C 3 11.4 9.21 3 C 4 13.2 1014 P 1 1.1 214 P 2 6.7 714 P 3 9.9 10.114 P 4 12.2 11.915 P 1 3 2.115 P 2 8.9 91 5 P 3 12.1 11.915 P 4 14.7 13.916 P 1 1.8 1.616 P 2 5.7 7.816 P 3 8.7 8.916 P 4 12.2 1317 C 1 2 2.21 7 c 2 7.9 6.717 c 3 10.4 7.417 c 4 13.2 8.918 p 1 1.6 1.418 p 2 7.3 7.818 p 3 11.1 10.818 P |4 14 14.1
Table D.7. Lactate Data Bout B
NUMBER GROUP DRAW# LACTATE 1 LACTATE 21 C 2 9.9 81 C 1 1.2 1.41 C 4 16 14.71 C 3 11 9.92 P 3 10.4 9.82 P 4 14.5 13.92 P 1 1.8 1.82 P 2 8.7 93 P 3 10.9 113 P 4 17.1 17.23 P 1 3.2 2.2
(table con’d)
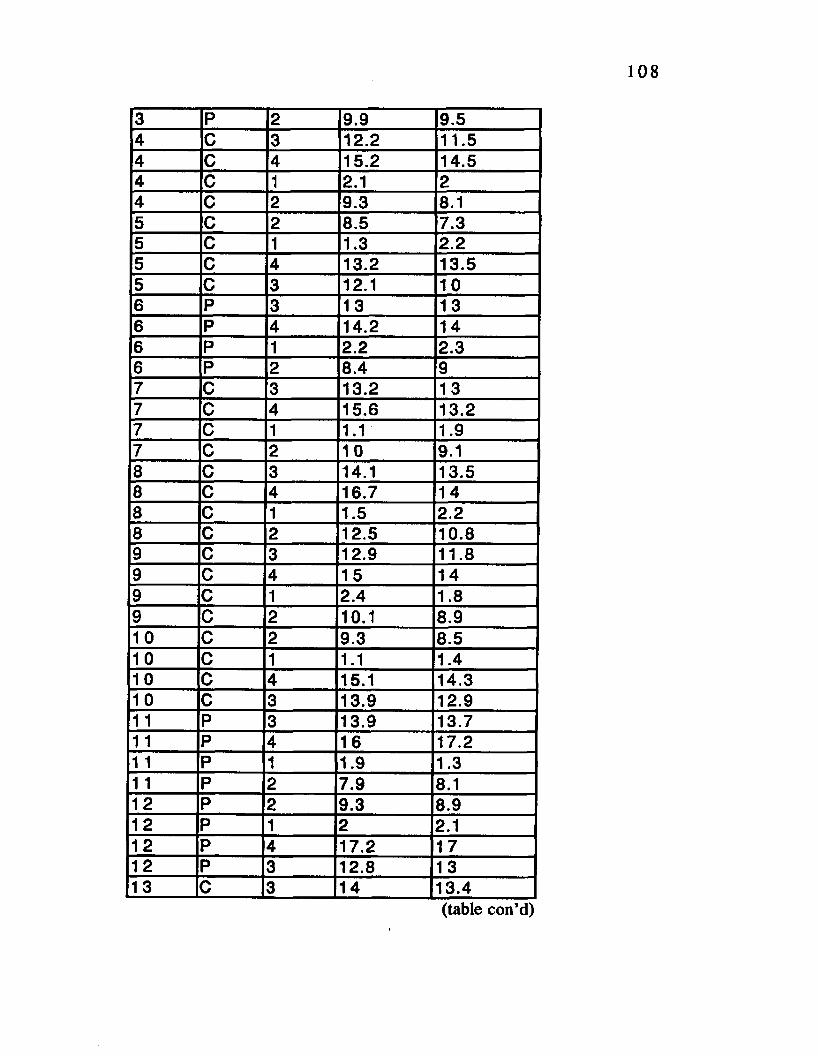
3 P 2 9.9 9.54 C 3 12.2 11.54 C 4 15.2 14.54 C 1 2.1 24 C 2 9.3 8.15 C 2 8.5 7.35 C 1 1.3 2.25 C 4 13.2 13.55 C 3 12.1 106 P 3 1 3 136 P 4 14.2 146 P 1 2.2 2.36 P 2 8.4 97 c 3 13.2 137 c 4 15.6 13.27 c 1 1.1 1.97 c 2 10 9.18 c 3 14.1 13.58 c 4 16.7 148 c 1 1.5 2.28 c 2 12.5 10.89 c 3 12.9 11.89 c 4 15 149 c 1 2.4 1.89 c 2 10.1 8.910 c 2 9.3 8.510 c 1 1.1 1.410 c 4 15.1 14.31 0 c 3 13.9 12.911 p 3 13.9 13.711 p 4 16 17.21 1 p 1 1.9 1.31 1 p 2 7.9 8.112 p 2 9.3 8.912 p 1 2 2.112 3 4 17.2 1712 3 3 12.8 1313 c 3 14 13.4
(table con’d)

109
13 C 4 15.1 14.213 C 1 1.1 1.413 C 2 11.1 9.914 P 3 12 11.614 P 4 14.2 1 514 P 1 1.3 1.214 P 2 9.3 9.915 P 3 15.1 1615 P 4 18.1 17.615 P 1 1.8 2.215 P 2 9.8 9.916 P 2 7.9 816 P 1 2.3 1.916 P 4 15.1 14.716 P 3 13.1 13.617 C 3 14.6 141 7 c 4 15 1 417 c 1 IZ2 217 c 2 10.3 918 p 2 9.5 9.618 p 1 1.7 1.318 p s 14 1618 p 3 14.2 14
Table D.8. Lactate Data Bout C
NUMBER GROUP DRAW# LACTATE 1 LACTATE 21 C 1 1.5 1.21 C 2 7.8 7.21 C 3 10.5 10.11 C 4 15.1 13.92 P 1 2.3 2.12 P 2 7 7.42 P 3 9.2 9.82 P 4 13.4 13.53 P 1 2.2 23 P 2 9.7 9.53 P 3 10.5 10.3
(table con’d)

110
3 P 4 16 17.24 C 1 1.2 1.44 C 2 8.8 7.94 C 3 11.2 10.34 C 4 14.2 13.15 C 1 1.8 1.45 C 2 7.2 75 C 3 10.5 9.85 C 4 11.5 11.26 P 1 2 1.96 P 2 7.4 7.36 P 3 10 9.86 P 4 13.4 13.17 C 1 1.7 2.17 C 2 8.9 87 C 3 12.1 11.27 C 4 14.5 12.88 C 1 2.5 38 C 2 10 9.58 C 3 13.1 12.18 C 4 15.9 14.29 C 1 3 1.59 C 2 8.1 7.99 C 3 11.8 10.19 C 4 14.6 1310 C 1 1.4 2.310 C 2 9 8.510 C 3 12.9 1210 C 4 13.8 13.111 P 1 2.2 2.111 P 2 7.2 7.311 P 3 11.5 11.511 P 4 13.9 1412 P 1 2 1.312 3 2 8 7.812 3 3 11.4 11.112 3 4 15.7 15.313 c 1 1 1.7
(table con’d)

111
13 C 2 9.6 9.113 C 3 12.2 11.713 c 4 14.6 13.614 p 1 1.1 1.114 p 2 8.5 914 p 3 10.9 1 114 p 4 13.2 14.215 p 1 1.6 3.115 p 2 9 8.415 p 3 13.5 12.915 p 4 15.6 15.916 p 1 3 2.116 p 2 7 6.816 p 3 12.2 121 6 p 4 14.1 1517 c 1 2.1 2.117 c 2 9.9 9.117 c 3 12.1 1 11 7 c 4 14 13.418 p 1 1.8 1.21 8 p 2 10 9.518 p 3 15.1 13.918 p 4 16.8 15.7
Table D.9. Lactate Data Bout D
NUMBER GROUP DRAW# LACTATE 1 LACTATE 21 C 1 2 1.41 C 2 7.5 5.71 C 3 9.6 7.61 C 4 12.2 8.72 P 1 1.5 22 P 2 6.7 7.82 P 3 9.2 10.22 P 4 11.9 133 P 1 1.1 1.33 P 2 9.1 7.93 P 3 10.5 9.9
(table con'd)

112
3 P 4 13.1 12.54 C 1 3.1 2.34 C 2 8.3 6.74 C 3 9.2 7.24 C 4 13.3 8.15 C 1 2 1.95 C 2 5.6 5.25 C 3 8.2 6.45 C 4 9.6 7.16 P 1 1.5 2.16 P 2 5.9 5.56 P 3 8 7.86 P 4 11.9 10.27 C 1 2.1 1.27 C 2 6.7 4.27 C 3 8.3 6.57 C 4 12.6 8.58 C 1 1.8 2.38 C 2 8 68 C 3 10.1 5.98 C 4 14.1 99 c 1 1.5 1.29 c 2 5.6 5.69 c 3 10.1 7.29 c 4 13.2 8.810 c 1 2.1 210 c 2 6.2 710 c 3 9.1 7.710 c 4 12.1 8.411 p 1 2.3 1.81 1 p 2 5.9 611 p 3 8.4 8.51 1 p 4 11.9 121 2 p 1 1.9 312 3 2 7.2 6.912 3 3 10 9.812 3 4 14.1 14.213 c 1 2.1 1.5
(table con’d)

113
13 C 2 8 813 C 3 11.4 9.213 C 4 13.2 1 014 P 1 1.1 214 P 2 6.7 714 P 3 9.9 10.114 P 4 12.2 11.915 P 1 3 2.115 P 2 8.9 915 P 3 12.1 11.915 P 4 14.7 13.916 P 1 1.8 1.616 P 2 5.7 7.816 P 3 8.7 8.916 P 4 12.2 1317 C 1 2 2.217 c 2 7.9 6.717 c 3 10.4 7.41 7 c 4 13.2 8.918 p 1 1.6 1.418 p 2 7.3 7.818 p 3 11.1 10.818 p 4 14 14.1
Table D.10. Urinary C reatin ine
SUBJECT SAMPLE# CREATININE1 1 1341 2 1435.81 3 768.92 1 2222 2 98.42 3 3113 1 98.53 2 213.23 3 138.54 1 314.54 2 987.44 3 2328.4
(table con’d)

5 1 135.95 2 1543.35 3 987.56 1 301.16 2 99.56 3 3127 1 209.37 2 1276.97 3 1784.28 1 167.88 2 678.98 3 1765.29 1 148.99 2 457.879 3 987.910 1 256.710 2 2323.510 3 1256.311 1 243.31 1 2 278.91 1 3 112.312 1 212.312 2 87.61 2 3 156.71 3 1 33313 2 1000.61 3 3 2223.114 1 234.414 2 194.414 3 357.315 1 189.415 2 200.615 3 199.816 1 137.416 2 112.216 3 127.917 1 22317 2 1112.8
(table con’d)

17 3 998.718 1 199.918 2 78.918 3 323.5

VITA
Michael Cory Prevost was born on August 7, 1967 in
Opelousas, Louisiana. He graduated from Opelousas Senior
High School in 1985. He then enrolled at the University of
Southwestern Louisiana to pursue a B.S. in psychology. During
his years at USL he vigorously pursued a bodybuilding
program, adding 60 pounds of muscle to his physique. He
began working as an instructor in local health clubs and also
trained a local handicapped powerlifting team. He graduated
with a B.A. in general studies in 1990. Due to his newfound
interest in exercise and fitness he entered the graduate
program in exercise physiology at Louisiana State University
in 1991. While at LSU he received training in exercise
physiology, biochemistry, molecular biology and radiotracer
methodology. His research efforts have focused on the control
of myosin isozyme expression in muscle. With regards to this
research he has presented abstracts at the American College
of Sports Medicine and Federation of American Societies for
Experimental Biology meetings, published a paper in the
Journal of Applied Physiology and has several papers in
review. He has plans to be married immediately after
116
117
completing degree requirements and then enter the Navy as
an aerospace physiologist.

DOCTORAL EXAMINATION AND DISSERTATION REPORT
Candidate: Mi chae l Cory P r e v o s t
Major Field: Ki nes i o l o g y
T it le of D isse rta tio n : The E f f e c t s o f C r e a t i n e S u p p l e m e n t a t i o n on T o U l W o f H K S p S t and Me t a b o l i s m Dur i ng High I n t e n s i t y I n t e r m i t t e n t E x e r c i s e
Major
aduate School
Date of Examination:
Oc t o b e r 3 , 1995