the effects of fabrication methods and cure cycle on the
TRANSCRIPT
THE EFFECTS OF FABRICATION METHODS AND CURE CYCLE ON THE MECHANICAL PROPERTIES OF CARBON FIBER LAMINATE IN TENSILE AND
3-POINT BEND TESTING
A Senior Project
presented to
the Faculty of California Polytechnic State University,
San Luis Obispo
In Partial Fulfillment
of the Requirements for the Degree
Bachelor of Science in Aerospace Engineering
by
Adriano Agostino
June, 2013
© 2013 Adriano Agostino

Adriano Agostino
2
Acknowledgement
I would like to start be thanking Dr. Eltahry Elghandour for his time and assistance in completing the manufacturing of the samples and the testing for this project. Dr. Elghandour has helped me work through several road bumps that I encountered when working on this project and his help simplified this project. I also need to extend much gratitude and thanks to Mr. Ken Gamble of Quattro Composites for supplying Cal Poly’s SAMPE Chapter with the pre-preg material used for my project.
Adriano Agostino
3
Abstract
This project was completed at the California Polytechnic State University, San Luis Obispo Aerospace Engineering Structures and Composites Lab during Spring Quarter 2013. The purpose of this project was to research and to gain insight into the effects of fabrication methods and of modifying cure cycles for Newport NB-301 12l 2x2 Twill Weave Carbon Fiber material properties. The two fabrication methods used were autoclave and heat press (compression molding) methods. Each fabrication method used two cure cycles, a recommended cure cycle of 275°F for 1 hour and a modified cure cycle of 250°F for 1.5 hours. The exact product data sheet of the composite used could not be found, this project attempted to generate an estimate for the missing material properties. To find tensile properties and flexural properties for each sample, testing was completed for the different cure methods. Material properties were found using the same standard of testing used by Newport Adhesives and Composites for their published data. The tensile standard used by Newport was ASTM D-638 Type 1, however due to the complexity of manufacturing the samples a simpler standard was found (ASTM D-3039). The flexure standard using for this project and by Newport was ASTM D-790. After testing seven tensile samples and eight flexure samples for each of the four different configurations, it was concluded that for plate fabrication the compression molding method of the heat press resulted in the best material properties (highest modulus and highest ultimate strength. The best mechanical properties for tensile testing resulted from the recommended 275°F cure cycle. The tensile mechanical properties that resulted from samples cured with the heat press at 275°F had an average tensile strength of 85.5 ksi (590 Mpa) and an average tensile modulus of 7.08 Msi (48.8 GPa).Unfortunately the flexure testing was not effective in displaying a clear trend for the best cure cycle. Thus no conclusion could be drawn to determine the best curing cycle for flexure.
Adriano Agostino
4
Table of Contents
Acknowledgement ........................................................................................................................................ 2
Abstract ......................................................................................................................................................... 3
List of Figures ............................................................................................................................................... 5
List of Tables ................................................................................................................................................ 5
Nomenclature ................................................................................................................................................ 6
1 Introduction ............................................................................................................................................ 7
1.1 Fabrication Methods ......................................................................................................................................... 7
1.2 Applications ...................................................................................................................................................... 9
1.3 Objective of Work ........................................................................................................................................... 10
2 Fabrication ............................................................................................................................................ 10
2.1 Carbon Fiber Sample Fabrication ................................................................................................................... 10
3 Testing and Results .............................................................................................................................. 12
3.1 Tensile Properties Testing Method (ASTM D3039) ....................................................................................... 12 3.2 Results of Tensile Testing ............................................................................................................................... 14
3.3 Flexure Properties Testing Method (ASTM D790)......................................................................................... 16
3.4 Results of 3-Point Bend Testing...................................................................................................................... 18
3.5 Determining the Volumetric Ratios of Samples .............................................................................................. 21
4 Conclusion ............................................................................................................................................ 22
4.1 Overview of Research and Results.................................................................................................................. 22
4.2 Future Work Recommendations...................................................................................................................... 23
5 Works Cited .......................................................................................................................................... 24

Adriano Agostino
5
List of Figures
Figure 1 - Lay-up molding.[1] ........................................................................................................................ 7 Figure 2 - Spray-up molding. [1] .................................................................................................................... 7 Figure 3 - Basic resin infusion process. [1] .................................................................................................... 8 Figure 4 - Vacuum bag system. [1] ................................................................................................................ 8 Figure 5 - The mold assembly for compression molding process. ............................................................... 9 Figure 6 - Newport 301 Matrix with 12k 2x2 Twill Weave Carbon Fiber. ................................................ 10 Figure 7 - Newport 301 recommended cure cycle. ..................................................................................... 11 Figure 8 - Modified Newport 301 cure cycle. ............................................................................................. 11 Figure 9 – Pre-preg Sheets for Tensile Test Samples. ................................................................................ 11 Figure 10 - Tetrahedron Heating Press. ...................................................................................................... 11 Figure 11 - Carbon Fiber Tensile Test Sample. .......................................................................................... 13 Figure 12 - Tensile Stress-Strain Curve from Autoclave Fabrication at 250°F. ......................................... 14 Figure 13 - Tensile Stress-Strain Curve from Autoclave Fabrication at 275°F. ......................................... 14 Figure 14 - Tensile Stress-Strain Curve from Heat Press Fabrication at 250°F. ........................................ 15 Figure 15 - Tensile Stress-Strain Curve from Heat Press Fabrication at 275°F. ........................................ 15 Figure 16 - Tensile Test Failures. ............................................................................................................... 16 Figure 18 - 3-Point Bend Setup. ................................................................................................................. 17 Figure 17 - Carbon Fiber 3-Point Bend Test Sample. ................................................................................. 17 Figure 19 - Flexure Stress-Strain Curve from Autoclave Fabrication at 250°F.......................................... 18 Figure 20 - Flexure Stress-Strain Curve from Autoclave Fabrication at 275°F.......................................... 19 Figure 21 - Flexure Stress-Strain Curve from Heat Press Fabrication at 250°F. ........................................ 19 Figure 22- Flexure Stress-Strain Curve from Heat Press Fabrication at 275°F. ......................................... 20 Figure 23 - Carbon Fiber Sample inside furnace. ....................................................................................... 21
List of Tables
Table 1 - Average Sample Plate Thickness for Each Fabrication Process. ................................................. 12 Table 2 - Summary of Mechanical Characteristics from Tensile Testing. .................................................. 16 Table 3- Summary of Mechanical Characteristics from 3-Point Bend Testing. ......................................... 20 Table 4 - Volumetric Ratio Summary ......................................................................................................... 22
Adriano Agostino
6
Nomenclature
A Average Cross Sectional Area (in.2 [mm2])
b Width of Beam Tested (in. [mm])
D Deflection of the Center of the Beam (in [mm])
d Depth of Beam Tested (in. [mm])
EB Modulus of Elasticity for Bending (psi [GPa])
Echord Tensile Chord Modulus of Elasticity, (psi [GPa])
Ftu Ultimate tensile strength (psi [MPa])
L Support span (in. [mm])
Lg Extensometer Gage Length (in. [mm])
m Slope of the Tangent to the Initial Straight-line Portion of the Load-Deflection Curve (lbf/in. [N/mm])
P Load at a given Point on the Load-Deflection curve (lbf [N])
Pi Force at the ith Data Point (lbf [N])
Pmax Maximum Force before Failure (lbf [N])
Vf Volume Fraction of Fiber
Vm Volume Fraction of Matrix
Wf Fiber Weight Fraction
Wm Matrix Weight Fraction
wc Weight of the Composite Sample (lbm [grams])
wf Weight of the Fiber (lbm [grams])
wm Weight of the Matrix (lbm [grams])
Δσ Difference in Applied Tensile Stress (psi [MPa])
Δε Difference between the Two strain Points
δi Extensometer Displacement at ith Data Point (in. [mm])
εf Flexure Strain in the Outer Surface (in./in. [mm/mm])
εi Tensile Strain at ith Data Point (με)
ρc Density of the Composite (lbm/in3 [grams/cm3])
ρf Density of the Fiber (lbm/in3 [grams/cm3])
ρm Density of the Matrix (lbm/in3 [grams/cm3])
σf Flexure Stress in the Outer Fibers at Midpoint (psi [MPa])
σi Tensile Stress at the ith Data Point (psi [MPa])
Adriano Agostino
7
1 Introduction A composite material is a combination of two or more distinct materials to have a recognizable interface
between them. Composites are used not only for their structural properties, but also for electrical, thermal, and environmental properties. Modern composites are typically optimized to achieve a balance of properties for specific applications. Given the vast range of materials that may be considered as composites and the broad range of uses for which composite materials may be designed, it is difficult to agree upon a single, simple, and useable definition. A common practical definition: composite materials may be restricted to emphasize those materials that contain a continuous matrix that binds together an array of stronger reinforcing material. The resulting composite material has a balance of structural properties that is superior to either material alone.
1.1 Fabrication Methods There are four main fabrication methods that industry uses to manufacture their composite parts: open
molding of composites (wet lay-up and spray-up), open molding of advanced composites (pre-preg lay-up), compression molding, and resin infusion method. (Strong)[1] This project examines pre-preg lay-ups and compression molding for determination of optimum properties.
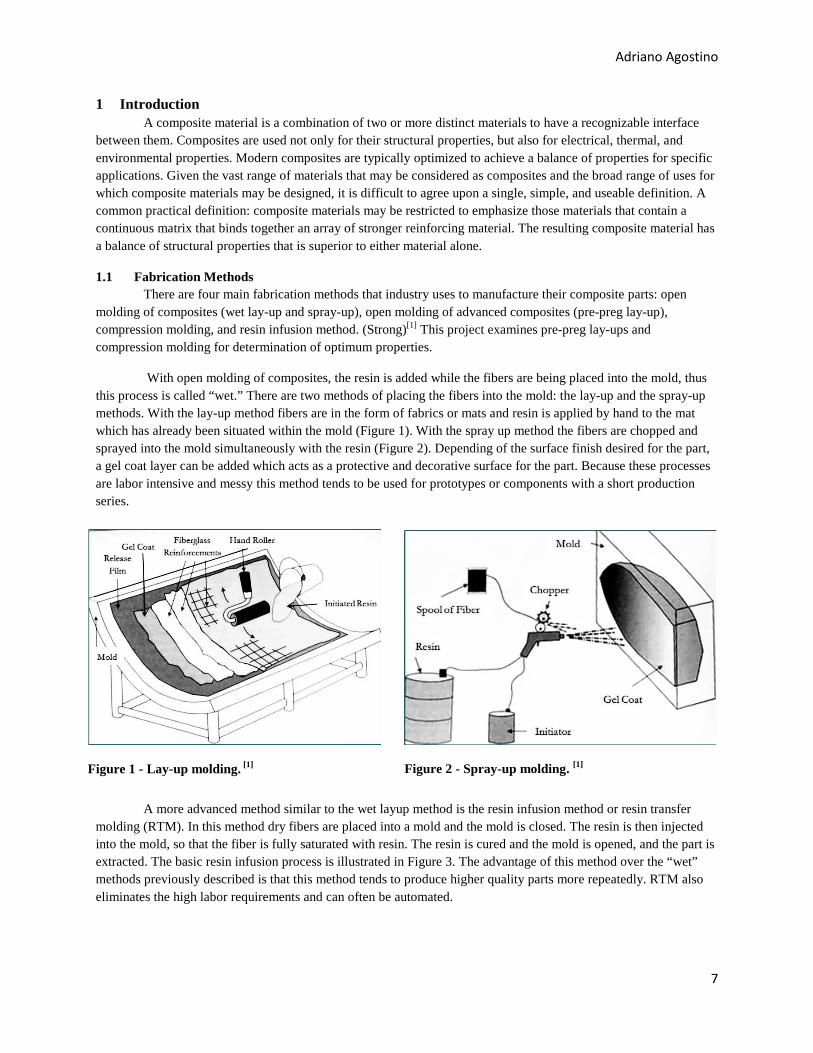
With open molding of composites, the resin is added while the fibers are being placed into the mold, thus this process is called “wet.” There are two methods of placing the fibers into the mold: the lay-up and the spray-up methods. With the lay-up method fibers are in the form of fabrics or mats and resin is applied by hand to the mat which has already been situated within the mold (Figure 1). With the spray up method the fibers are chopped and sprayed into the mold simultaneously with the resin (Figure 2). Depending of the surface finish desired for the part, a gel coat layer can be added which acts as a protective and decorative surface for the part. Because these processes are labor intensive and messy this method tends to be used for prototypes or components with a short production series.
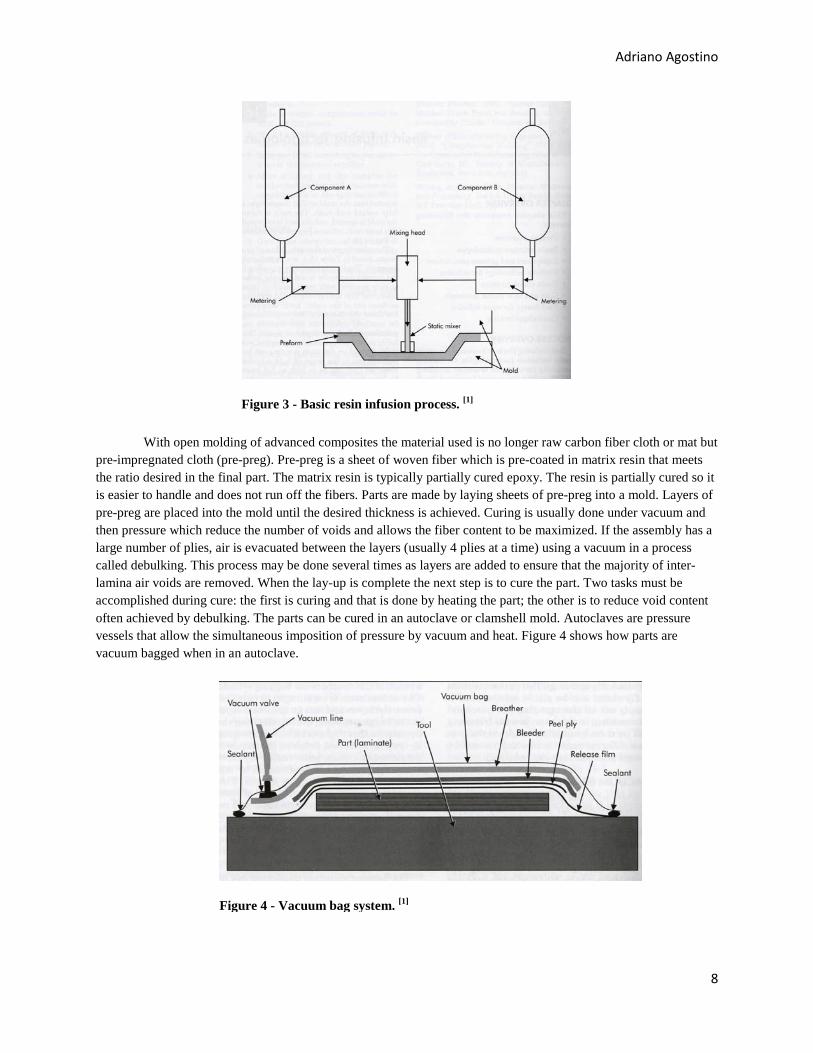
A more advanced method similar to the wet layup method is the resin infusion method or resin transfer molding (RTM). In this method dry fibers are placed into a mold and the mold is closed. The resin is then injected into the mold, so that the fiber is fully saturated with resin. The resin is cured and the mold is opened, and the part is extracted. The basic resin infusion process is illustrated in Figure 3. The advantage of this method over the “wet” methods previously described is that this method tends to produce higher quality parts more repeatedly. RTM also eliminates the high labor requirements and can often be automated.
Figure 1 - Lay-up molding. [1]
Figure 2 - Spray-up molding. [1]
Adriano Agostino
8
With open molding of advanced composites the material used is no longer raw carbon fiber cloth or mat but pre-impregnated cloth (pre-preg). Pre-preg is a sheet of woven fiber which is pre-coated in matrix resin that meets the ratio desired in the final part. The matrix resin is typically partially cured epoxy. The resin is partially cured so it is easier to handle and does not run off the fibers. Parts are made by laying sheets of pre-preg into a mold. Layers of pre-preg are placed into the mold until the desired thickness is achieved. Curing is usually done under vacuum and then pressure which reduce the number of voids and allows the fiber content to be maximized. If the assembly has a large number of plies, air is evacuated between the layers (usually 4 plies at a time) using a vacuum in a process called debulking. This process may be done several times as layers are added to ensure that the majority of inter-lamina air voids are removed. When the lay-up is complete the next step is to cure the part. Two tasks must be accomplished during cure: the first is curing and that is done by heating the part; the other is to reduce void content often achieved by debulking. The parts can be cured in an autoclave or clamshell mold. Autoclaves are pressure vessels that allow the simultaneous imposition of pressure by vacuum and heat. Figure 4 shows how parts are vacuum bagged when in an autoclave.
Figure 3 - Basic resin infusion process. [1]
Figure 4 - Vacuum bag system. [1]

Adriano Agostino
9
The last method, compression molding, uses a specific amount of material (uncured resin and fibers) placed into the cavity of a matched mold in the open position as seen in Figure 5. The mold is closed by bringing the male and female halves together, and pressure is applied to squeeze the composite material so it uniformly fills the mold cavity. While under pressure the material is heated so that it cures. The molding process can require high pressures, and so the molds are mounted in large presses. The presses allow rapid mold cycles and high-volume production therefore, this process is widely used in the automotive industry and in other industries where high volumes of small-to-moderate-sized parts are manufactured. The squeezing of the material results in low void contents in the finished parts.
1.2 Applications The use of composites is in high demand due to their enhanced mechanical characteristic and material
properties. Traditional composite markets include the automotive industry which has used fiberglass reinforced composites for several decades. [1] Weight savings has always been an advantage that composite manufacturers use to sell their product. However, in recent years steel companies have been able to come up with new alloys that allow for thinner lighter parts; so large portions of automobile bodes are still made of steel. Composites also present properties that make for good “no-dent” body panels for things like hoods and trunks. Aside from the automotive industry, the marine industry uses glass fiber reinforced polymer materials in “approximately 70% of all outboard pleasure boats 15 ft. and longer.” [1] A major benefit of using composites the ability to use molds, this allows for seamless construction of high strength and high durability boats. Composites also present minimal maintenance and resistance to corrosion, rust, dry rot, and water logging experienced by other materials like wood or metal. Composites have been used in sporting equipment like: golf clubs, tennis and racquetball racquets, pole-vaulting poles, archery bows and arrows, snow skis and snow boards, water skis and surfboards, bicycles, bats, and many other light weight high strength applications.
Figure 5 - The mold assembly for compression molding process.
Adriano Agostino
10
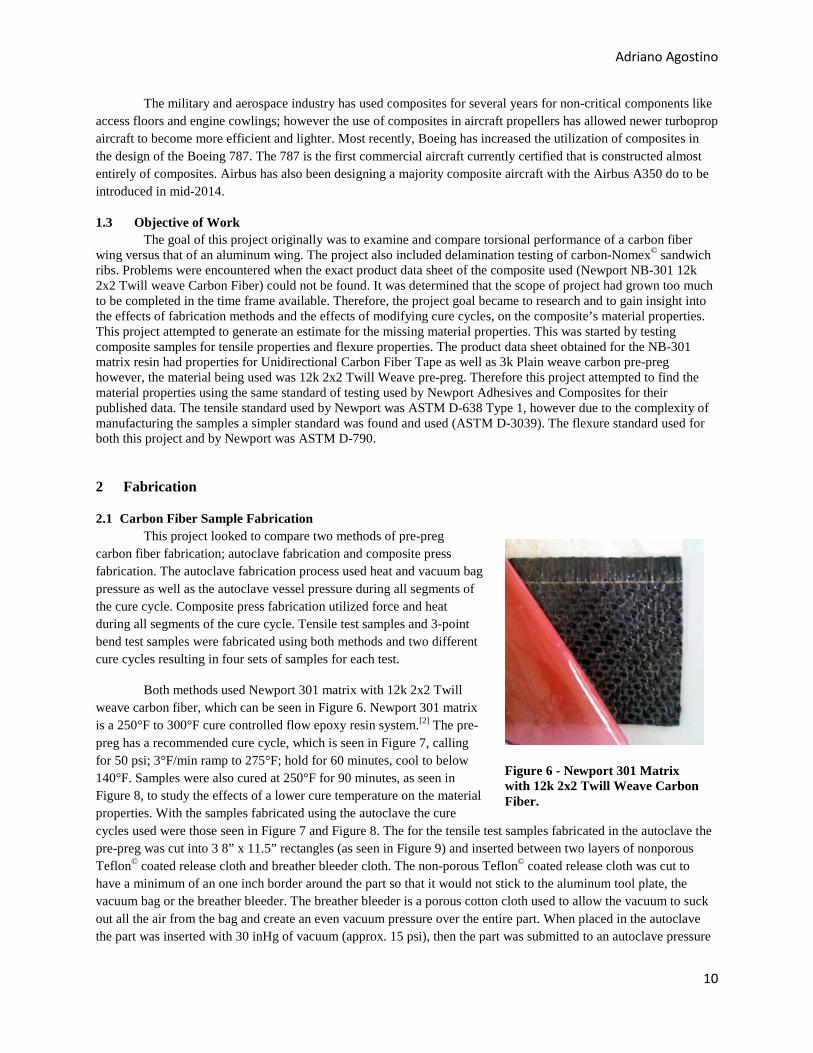
Figure 6 - Newport 301 Matrix with 12k 2x2 Twill Weave Carbon Fiber.
The military and aerospace industry has used composites for several years for non-critical components like access floors and engine cowlings; however the use of composites in aircraft propellers has allowed newer turboprop aircraft to become more efficient and lighter. Most recently, Boeing has increased the utilization of composites in the design of the Boeing 787. The 787 is the first commercial aircraft currently certified that is constructed almost entirely of composites. Airbus has also been designing a majority composite aircraft with the Airbus A350 do to be introduced in mid-2014.
1.3 Objective of Work The goal of this project originally was to examine and compare torsional performance of a carbon fiber
wing versus that of an aluminum wing. The project also included delamination testing of carbon-Nomex© sandwich ribs. Problems were encountered when the exact product data sheet of the composite used (Newport NB-301 12k 2x2 Twill weave Carbon Fiber) could not be found. It was determined that the scope of project had grown too much to be completed in the time frame available. Therefore, the project goal became to research and to gain insight into the effects of fabrication methods and the effects of modifying cure cycles, on the composite’s material properties. This project attempted to generate an estimate for the missing material properties. This was started by testing composite samples for tensile properties and flexure properties. The product data sheet obtained for the NB-301 matrix resin had properties for Unidirectional Carbon Fiber Tape as well as 3k Plain weave carbon pre-preg however, the material being used was 12k 2x2 Twill Weave pre-preg. Therefore this project attempted to find the material properties using the same standard of testing used by Newport Adhesives and Composites for their published data. The tensile standard used by Newport was ASTM D-638 Type 1, however due to the complexity of manufacturing the samples a simpler standard was found and used (ASTM D-3039). The flexure standard used for both this project and by Newport was ASTM D-790.
2 Fabrication
2.1 Carbon Fiber Sample Fabrication This project looked to compare two methods of pre-preg
carbon fiber fabrication; autoclave fabrication and composite press fabrication. The autoclave fabrication process used heat and vacuum bag pressure as well as the autoclave vessel pressure during all segments of the cure cycle. Composite press fabrication utilized force and heat during all segments of the cure cycle. Tensile test samples and 3-point bend test samples were fabricated using both methods and two different cure cycles resulting in four sets of samples for each test.
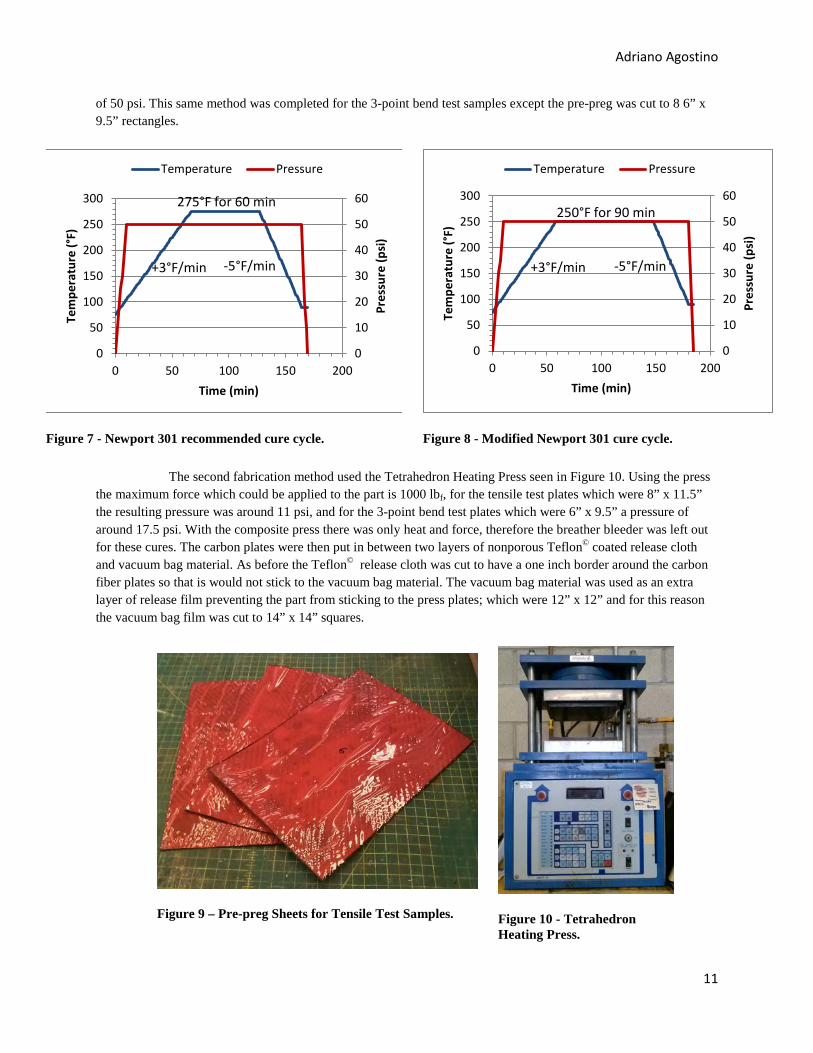
Both methods used Newport 301 matrix with 12k 2x2 Twill weave carbon fiber, which can be seen in Figure 6. Newport 301 matrix is a 250°F to 300°F cure controlled flow epoxy resin system.[2] The pre-preg has a recommended cure cycle, which is seen in Figure 7, calling for 50 psi; 3°F/min ramp to 275°F; hold for 60 minutes, cool to below 140°F. Samples were also cured at 250°F for 90 minutes, as seen in Figure 8, to study the effects of a lower cure temperature on the material properties. With the samples fabricated using the autoclave the cure cycles used were those seen in Figure 7 and Figure 8. The for the tensile test samples fabricated in the autoclave the pre-preg was cut into 3 8” x 11.5” rectangles (as seen in Figure 9) and inserted between two layers of nonporous Teflon© coated release cloth and breather bleeder cloth. The non-porous Teflon© coated release cloth was cut to have a minimum of an one inch border around the part so that it would not stick to the aluminum tool plate, the vacuum bag or the breather bleeder. The breather bleeder is a porous cotton cloth used to allow the vacuum to suck out all the air from the bag and create an even vacuum pressure over the entire part. When placed in the autoclave the part was inserted with 30 inHg of vacuum (approx. 15 psi), then the part was submitted to an autoclave pressure
Adriano Agostino
11
of 50 psi. This same method was completed for the 3-point bend test samples except the pre-preg was cut to 8 6” x 9.5” rectangles.
The second fabrication method used the Tetrahedron Heating Press seen in Figure 10. Using the press the maximum force which could be applied to the part is 1000 lbf, for the tensile test plates which were 8” x 11.5” the resulting pressure was around 11 psi, and for the 3-point bend test plates which were 6” x 9.5” a pressure of around 17.5 psi. With the composite press there was only heat and force, therefore the breather bleeder was left out for these cures. The carbon plates were then put in between two layers of nonporous Teflon© coated release cloth and vacuum bag material. As before the Teflon© release cloth was cut to have a one inch border around the carbon fiber plates so that is would not stick to the vacuum bag material. The vacuum bag material was used as an extra layer of release film preventing the part from sticking to the press plates; which were 12” x 12” and for this reason the vacuum bag film was cut to 14” x 14” squares.
Figure 7 - Newport 301 recommended cure cycle.
0
10
20
30
40
50
60
0
50
100
150
200
250
300
0 50 100 150 200Pr
essu
re (p
si)
Tem
pera
ture
(°F)
Time (min)
Temperature Pressure
275°F for 60 min
+3°F/min -5°F/min
Figure 8 - Modified Newport 301 cure cycle.
0
10
20
30
40
50
60
0
50
100
150
200
250
300
0 50 100 150 200
Pres
sure
(psi
)
Tem
pera
ture
(°F)
Time (min)
Temperature Pressure
250°F for 90 min
+3°F/min -5°F/min
Figure 9 – Pre-preg Sheets for Tensile Test Samples.
Figure 10 - Tetrahedron Heating Press.
Adriano Agostino
12
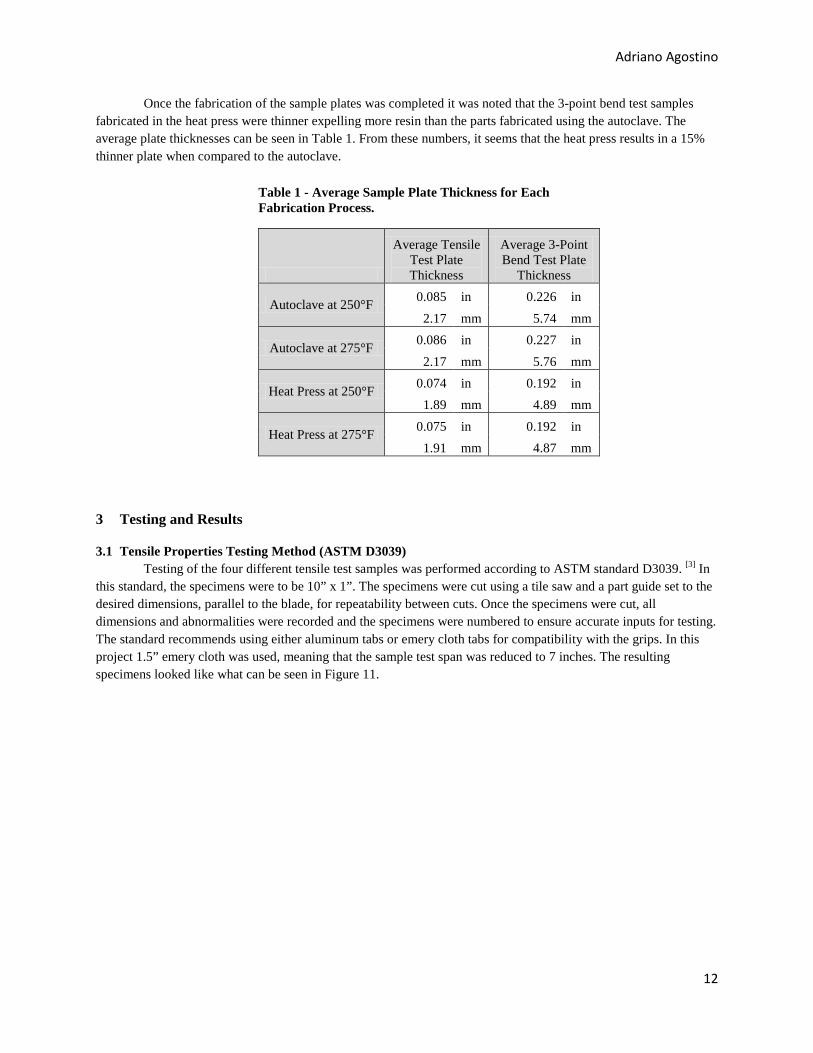
Once the fabrication of the sample plates was completed it was noted that the 3-point bend test samples fabricated in the heat press were thinner expelling more resin than the parts fabricated using the autoclave. The average plate thicknesses can be seen in Table 1. From these numbers, it seems that the heat press results in a 15% thinner plate when compared to the autoclave.
3 Testing and Results
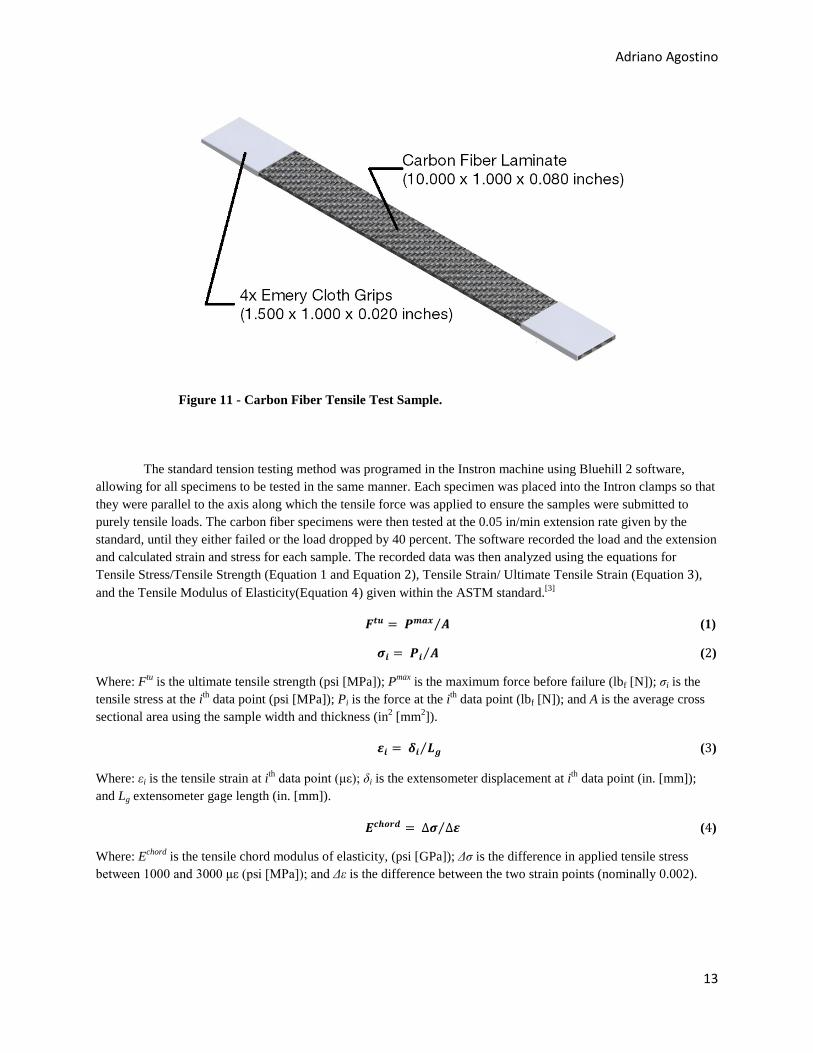
3.1 Tensile Properties Testing Method (ASTM D3039) Testing of the four different tensile test samples was performed according to ASTM standard D3039. [3] In this standard, the specimens were to be 10” x 1”. The specimens were cut using a tile saw and a part guide set to the desired dimensions, parallel to the blade, for repeatability between cuts. Once the specimens were cut, all dimensions and abnormalities were recorded and the specimens were numbered to ensure accurate inputs for testing. The standard recommends using either aluminum tabs or emery cloth tabs for compatibility with the grips. In this project 1.5” emery cloth was used, meaning that the sample test span was reduced to 7 inches. The resulting specimens looked like what can be seen in Figure 11.
Table 1 - Average Sample Plate Thickness for Each Fabrication Process.
Average Tensile Test Plate Thickness
Average 3-Point Bend Test Plate
Thickness
Autoclave at 250°F 0.085 in 0.226 in 2.17 mm 5.74 mm
Autoclave at 275°F 0.086 in 0.227 in 2.17 mm 5.76 mm
Heat Press at 250°F 0.074 in 0.192 in 1.89 mm 4.89 mm
Heat Press at 275°F 0.075 in 0.192 in 1.91 mm 4.87 mm
Adriano Agostino
13
The standard tension testing method was programed in the Instron machine using Bluehill 2 software, allowing for all specimens to be tested in the same manner. Each specimen was placed into the Intron clamps so that they were parallel to the axis along which the tensile force was applied to ensure the samples were submitted to purely tensile loads. The carbon fiber specimens were then tested at the 0.05 in/min extension rate given by the standard, until they either failed or the load dropped by 40 percent. The software recorded the load and the extension and calculated strain and stress for each sample. The recorded data was then analyzed using the equations for Tensile Stress/Tensile Strength (Equation 1 and Equation 2), Tensile Strain/ Ultimate Tensile Strain (Equation 3), and the Tensile Modulus of Elasticity(Equation 4) given within the ASTM standard.[3]
𝑭𝒕𝒖 = 𝑷𝒎𝒂𝒙 𝑨⁄ (1)
𝝈𝒊 = 𝑷𝒊 𝑨⁄ (2)
Where: Ftu is the ultimate tensile strength (psi [MPa]); Pmax is the maximum force before failure (lbf [N]); σi is the tensile stress at the ith data point (psi [MPa]); Pi is the force at the ith data point (lbf [N]); and A is the average cross sectional area using the sample width and thickness (in2 [mm2]).
𝜺𝒊 = 𝜹𝒊 𝑳𝒈⁄ (3)
Where: εi is the tensile strain at ith data point (με); δi is the extensometer displacement at ith data point (in. [mm]); and Lg extensometer gage length (in. [mm]).
𝑬𝒄𝒉𝒐𝒓𝒅 = ∆𝝈 ∆𝜺⁄ (4)
Where: Echord is the tensile chord modulus of elasticity, (psi [GPa]); Δσ is the difference in applied tensile stress between 1000 and 3000 με (psi [MPa]); and Δε is the difference between the two strain points (nominally 0.002).
Figure 11 - Carbon Fiber Tensile Test Sample.
Adriano Agostino
14
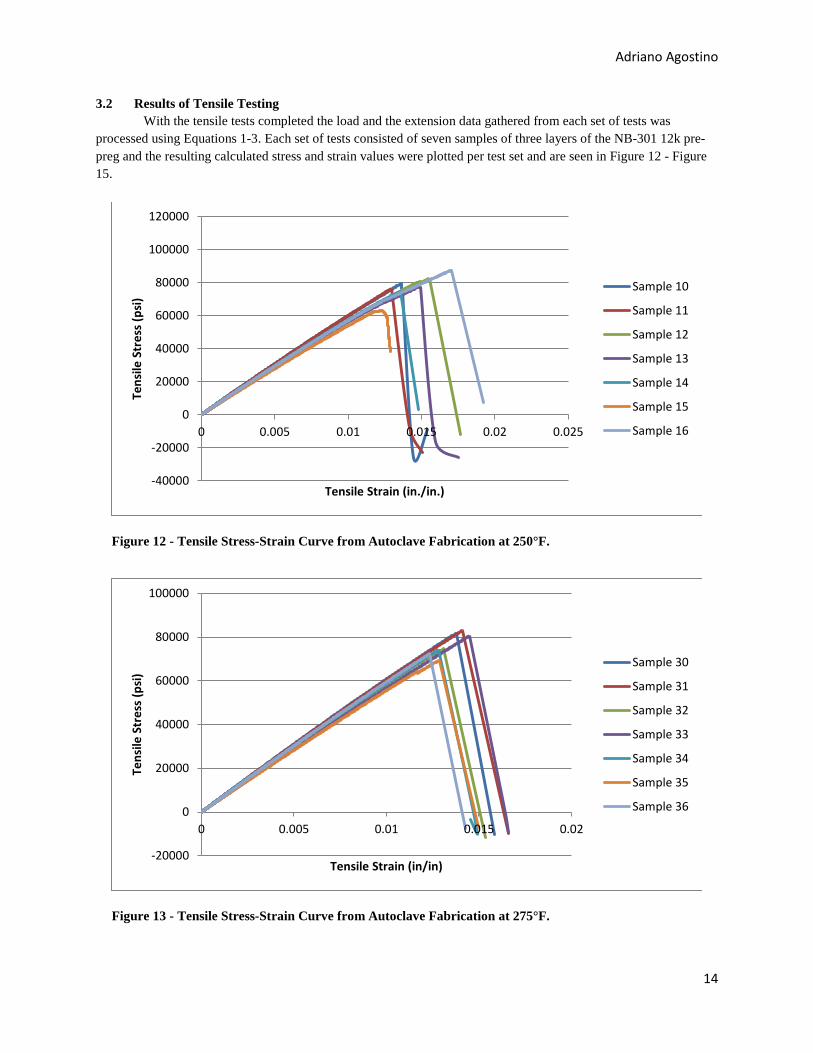
3.2 Results of Tensile Testing With the tensile tests completed the load and the extension data gathered from each set of tests was
processed using Equations 1-3. Each set of tests consisted of seven samples of three layers of the NB-301 12k pre-preg and the resulting calculated stress and strain values were plotted per test set and are seen in Figure 12 - Figure 15.
Figure 12 - Tensile Stress-Strain Curve from Autoclave Fabrication at 250°F.
-40000
-20000
0
20000
40000
60000
80000
100000
120000
0 0.005 0.01 0.015 0.02 0.025
Tens
ile S
tres
s (ps
i)
Tensile Strain (in./in.)
Sample 10
Sample 11
Sample 12
Sample 13
Sample 14
Sample 15
Sample 16
Figure 13 - Tensile Stress-Strain Curve from Autoclave Fabrication at 275°F.
-20000
0
20000
40000
60000
80000
100000
0 0.005 0.01 0.015 0.02
Tens
ile S
tres
s (ps
i)
Tensile Strain (in/in)
Sample 30
Sample 31
Sample 32
Sample 33
Sample 34
Sample 35
Sample 36

Adriano Agostino
15
The slopes of the stress-strain curves in the linear region between 0.001 and 0.003 strain (as dictated by the standard) was used to calculate the elastic modulus. The slopes of each sample for the separate cases are consistent each other, this depicts how accurate each testing procedure was followed. Table 2 shows the average modulus gathered from each of the tests. Looking at Table 2 it can be noted that the percent relative standard deviation for the average tensile modulus ranged from 1.33 to 3.44% which means the tests gave consistant results. From these values it can be seen that the Heat Press at 275°F results in the highest tensile modulus at 7,080,000 psi (40.8 GPa).
Figure 14 - Tensile Stress-Strain Curve from Heat Press Fabrication at 250°F.
-40000
-20000
0
20000
40000
60000
80000
100000
0 0.005 0.01 0.015 0.02
Tens
ile S
tres
s (ps
i)
Tensile Strain (in/in)
Sample 40
Sample 41
Sample 42
Sample 43
Sample 44
Sample 45
Sample 46
Figure 15 - Tensile Stress-Strain Curve from Heat Press Fabrication at 275°F.
-40000
-20000
0
20000
40000
60000
80000
100000
120000
0 0.005 0.01 0.015 0.02
Tens
ile S
tres
s (ps
i)
Tensile Strain (in./in.)
Sample 20
Sample 21
Sample 22
Sample 23
Sample 24
Sample 25
Sample 26

Adriano Agostino
16
Figure 16 - Tensile Test Failures.
The factors considered to determine the best fabrication method and cure cycle were found to be the tensile modulus, tensile strength and maximum load. As with the tensile modulus, the percent relative standard deviation ranged from 2.91 to 6.83%, further supporting that the tests gave consistant results. Table 2 shows that the highest tensile strength comes from the samples fabricated in the heat press at 275°F for 1 hour. Looking at the maximum load achieved by the samples, of all the fabrication methods, it was found that the maximum load for all four samples was around 6500 lbf (29000 N). Therefore, looking at results from the tensile testing it looks like the optimum fabrication method was the heat press compared to autoclave because it produced higher results for both samples regardless of cure cycle. When looking at the cure cycle it can be seen that the recommended cycle was best, over the modified cure cycle. The press samples demonstrated a difference from the 275°F cure modulus to the 250°F cure modulus of 800,000 psi (5.5 GPa) The autoclave samples showed a difference of 80,000 psi (0.6 GPa) in modulus This lead to the conclusion that in tension the recommended 275°F produces the strongest parts.
Another observation made during testing was the failure mode of the tensile test samples. All the samples failed laterally at two points around an inch from the tabs/grips (Figure 16). It was also noted that all the samples started having fiber failure around 1,000 to 2,000 lbs before the sample ultimately failed. At failure the fracture had high internal energy illustrated by failure resulting in pieces of carbon fiber flying out of the machine.
3.3 Flexure Properties Testing Method (ASTM D790) Testing of the four different 3-Point Bend test samples were performed according to ASTM standard
D790.[4] This standard had multiple sub-standards for what size the test specimen should be. For this set of tests the
Table 2 - Summary of Mechanical Characteristics from Tensile Testing.
Fabrication Method Average Tensile
Modulus
% Relative Standard Deviation
Average Tensile Strength
% Relative Standard Deviation
Average Max Load
% Relative Standard Deviation
Autoclave at 250°F 5920000 psi 3.44 77400 psi 6.76 6560 lbf 8.47 40.8 GPa 534 MPa 29200 N
Autoclave at 275°F 6000000 psi 3.42 76600 psi 6.83 6500 lbf 4.94 41.4 GPa 528 MPa 28900 N
Heat Press at 250°F 6280000 psi 2.76 75100 psi 6.44 6370 lbf 5.36 43.3 GPa 518 MPa 28300 N
Heat Press at 275°F 7080000 psi 1.33 85500 psi 2.91 6520 lbf 5.78 48.8 GPa 590 MPa 29000 N

Adriano Agostino
17
Figure 17 - 3-Point Bend Setup.
“High-Strength Reinforced Composites, Including Highly Orthotropic Laminates” section was used. This section states the span-to-depth ratio should be chosen to cause failure in the outer fibers of the specimen due to a pure bending moment. A minimum span-to-depth ratio of 16:1 must be used. The resulting target sample size is depicted by Figure 17. The specimens were again cut using a tile saw and a part guide that was set to the desired dimensions parallel to the blade for repeatability between cuts. Once the specimens were cut all dimensions and abnormalities were recorded and the specimens were numbered to ensure accurate inputs for testing. The standard states that “The specimen shall be long enough to allow for overhanging on each end of at least 10% of the support span.” For this reason it was calculated that the support span should be 4.000 inches.
The standard 3-point bend testing method was then programed in the Instron machine using Bluehill 2 software, allowing for all specimens to be tested in the same manner. Each specimen was placed onto the supports as seen depicted in Figure 18.
The carbon fiber specimens were then tested at the 0.05 in/min crosshead rate given in the standard until they either failed or the load dropped by 40 percent. The software recorded the load and the extension and calculated strain and stress for each sample. The recorded data was then analyzed using the equations for Flexure Stress/Flexure Strength (Equation 5), Flexure Strain/ Ultimate Flexure Strain (Equation 6) and the Tangent Modulus of Elasticity (Equation 7) given within the ASTM standard.[4]
Figure 18 - Carbon Fiber 3-Point Bend Test Sample.
Adriano Agostino
18
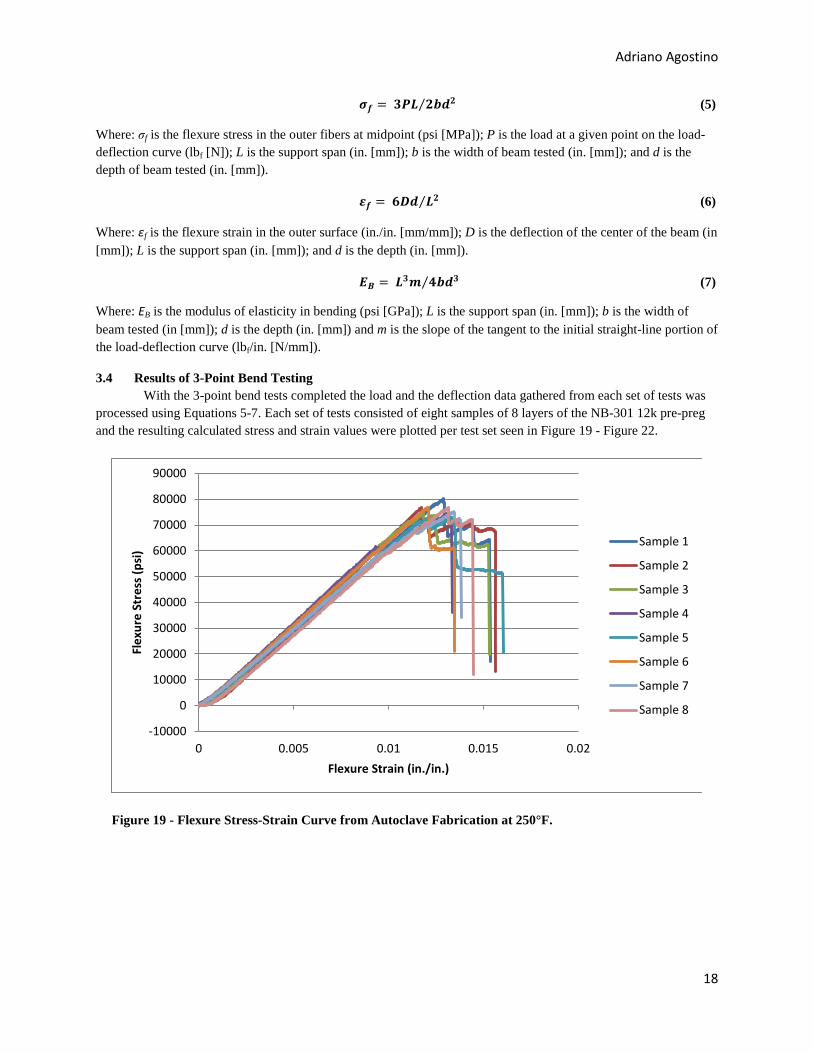
𝝈𝒇 = 𝟑𝑷𝑳 𝟐𝒃𝒅𝟐⁄ (5)
Where: σf is the flexure stress in the outer fibers at midpoint (psi [MPa]); P is the load at a given point on the load-deflection curve (lbf [N]); L is the support span (in. [mm]); b is the width of beam tested (in. [mm]); and d is the depth of beam tested (in. [mm]).
𝜺𝒇 = 𝟔𝑫𝒅 𝑳𝟐⁄ (6)
Where: εf is the flexure strain in the outer surface (in./in. [mm/mm]); D is the deflection of the center of the beam (in [mm]); L is the support span (in. [mm]); and d is the depth (in. [mm]).
𝑬𝑩 = 𝑳𝟑𝒎 𝟒𝒃𝒅𝟑⁄ (7)
Where: EB is the modulus of elasticity in bending (psi [GPa]); L is the support span (in. [mm]); b is the width of beam tested (in [mm]); d is the depth (in. [mm]) and m is the slope of the tangent to the initial straight-line portion of the load-deflection curve (lbf/in. [N/mm]).
3.4 Results of 3-Point Bend Testing With the 3-point bend tests completed the load and the deflection data gathered from each set of tests was
processed using Equations 5-7. Each set of tests consisted of eight samples of 8 layers of the NB-301 12k pre-preg and the resulting calculated stress and strain values were plotted per test set seen in Figure 19 - Figure 22.
Figure 19 - Flexure Stress-Strain Curve from Autoclave Fabrication at 250°F.
-10000
0
10000
20000
30000
40000
50000
60000
70000
80000
90000
0 0.005 0.01 0.015 0.02
Flex
ure
Stre
ss (p
si)
Flexure Strain (in./in.)
Sample 1
Sample 2
Sample 3
Sample 4
Sample 5
Sample 6
Sample 7
Sample 8
Adriano Agostino
19
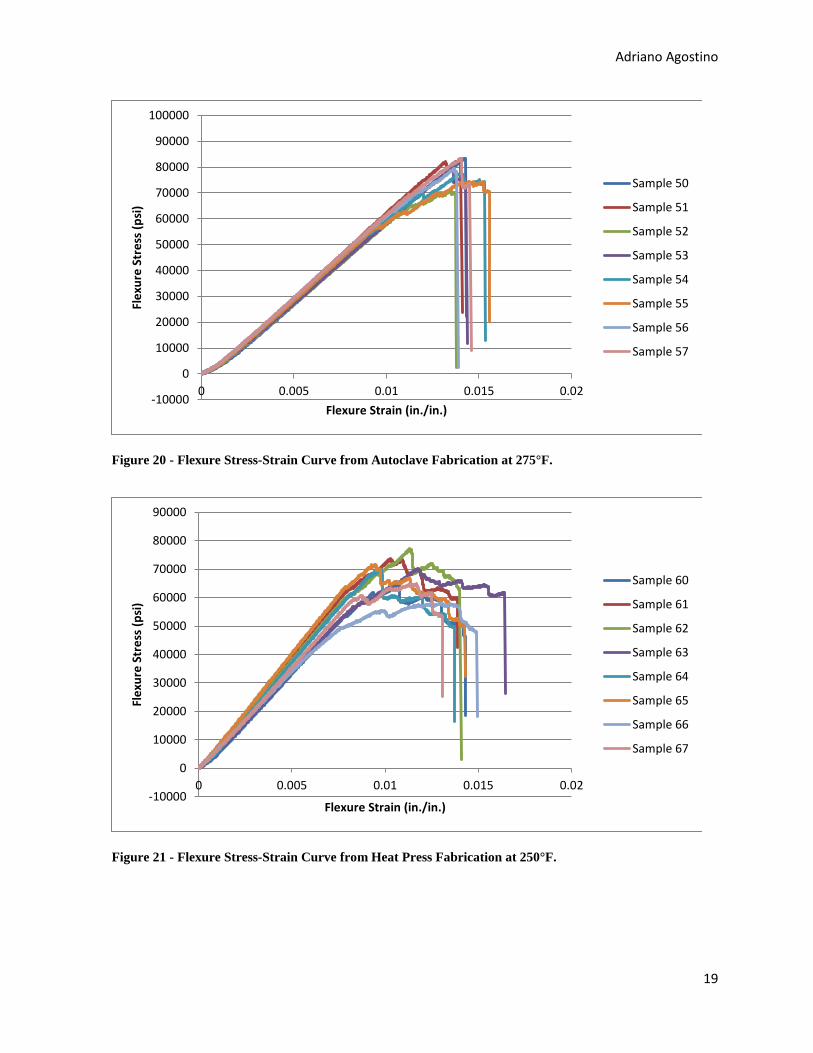
Figure 20 - Flexure Stress-Strain Curve from Autoclave Fabrication at 275°F.
-10000
0
10000
20000
30000
40000
50000
60000
70000
80000
90000
100000
0 0.005 0.01 0.015 0.02
Flex
ure
Stre
ss (p
si)
Flexure Strain (in./in.)
Sample 50
Sample 51
Sample 52
Sample 53
Sample 54
Sample 55
Sample 56
Sample 57
Figure 21 - Flexure Stress-Strain Curve from Heat Press Fabrication at 250°F.
-10000
0
10000
20000
30000
40000
50000
60000
70000
80000
90000
0 0.005 0.01 0.015 0.02
Flex
ure
Stre
ss (p
si)
Flexure Strain (in./in.)
Sample 60
Sample 61
Sample 62
Sample 63
Sample 64
Sample 65
Sample 66
Sample 67
Adriano Agostino
20
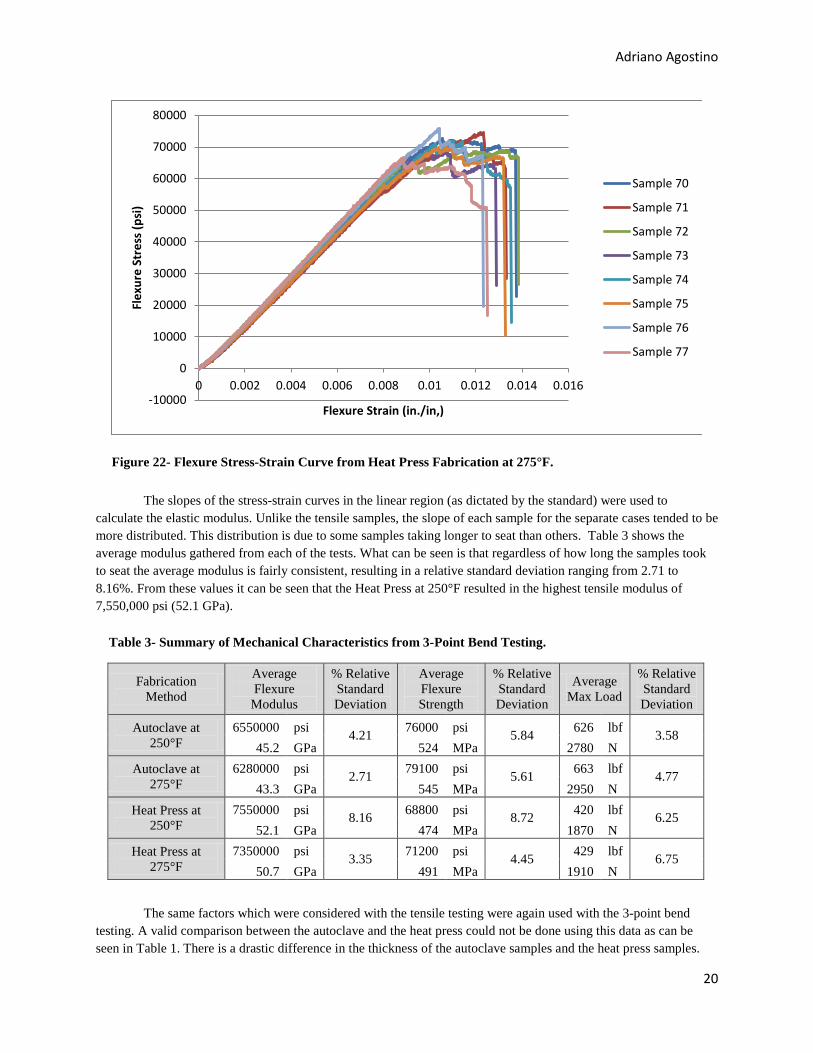
The slopes of the stress-strain curves in the linear region (as dictated by the standard) were used to calculate the elastic modulus. Unlike the tensile samples, the slope of each sample for the separate cases tended to be more distributed. This distribution is due to some samples taking longer to seat than others. Table 3 shows the average modulus gathered from each of the tests. What can be seen is that regardless of how long the samples took to seat the average modulus is fairly consistent, resulting in a relative standard deviation ranging from 2.71 to 8.16%. From these values it can be seen that the Heat Press at 250°F resulted in the highest tensile modulus of 7,550,000 psi (52.1 GPa).
The same factors which were considered with the tensile testing were again used with the 3-point bend testing. A valid comparison between the autoclave and the heat press could not be done using this data as can be seen in Table 1. There is a drastic difference in the thickness of the autoclave samples and the heat press samples.
Figure 22- Flexure Stress-Strain Curve from Heat Press Fabrication at 275°F.
-10000
0
10000
20000
30000
40000
50000
60000
70000
80000
0 0.002 0.004 0.006 0.008 0.01 0.012 0.014 0.016
Flex
ure
Stre
ss (p
si)
Flexure Strain (in./in,)
Sample 70
Sample 71
Sample 72
Sample 73
Sample 74
Sample 75
Sample 76
Sample 77
Table 3- Summary of Mechanical Characteristics from 3-Point Bend Testing.
Fabrication Method
Average Flexure
Modulus
% Relative Standard Deviation
Average Flexure Strength
% Relative Standard Deviation
Average Max Load
% Relative Standard Deviation
Autoclave at 250°F
6550000 psi 4.21 76000 psi 5.84 626 lbf 3.58 45.2 GPa 524 MPa 2780 N
Autoclave at 275°F
6280000 psi 2.71 79100 psi 5.61 663 lbf 4.77 43.3 GPa 545 MPa 2950 N
Heat Press at 250°F
7550000 psi 8.16 68800 psi 8.72 420 lbf 6.25 52.1 GPa 474 MPa 1870 N
Heat Press at 275°F
7350000 psi 3.35 71200 psi 4.45 429 lbf 6.75 50.7 GPa 491 MPa 1910 N
Adriano Agostino
21
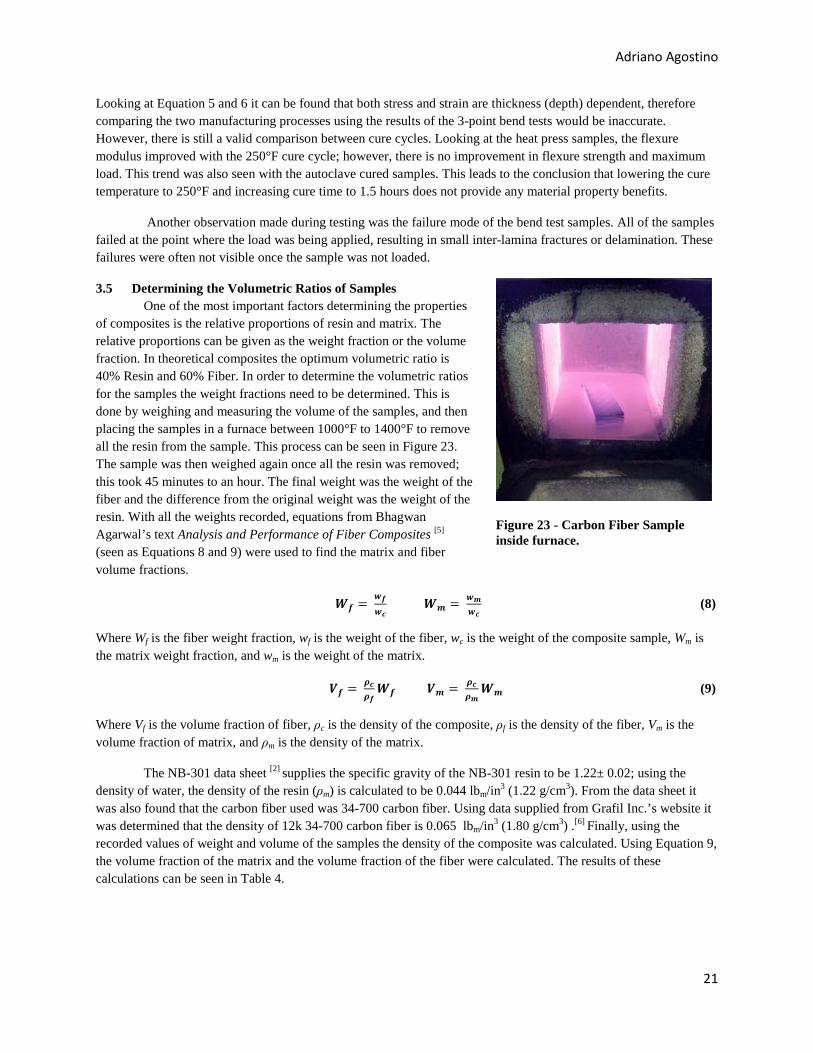
Figure 23 - Carbon Fiber Sample inside furnace.
Looking at Equation 5 and 6 it can be found that both stress and strain are thickness (depth) dependent, therefore comparing the two manufacturing processes using the results of the 3-point bend tests would be inaccurate. However, there is still a valid comparison between cure cycles. Looking at the heat press samples, the flexure modulus improved with the 250°F cure cycle; however, there is no improvement in flexure strength and maximum load. This trend was also seen with the autoclave cured samples. This leads to the conclusion that lowering the cure temperature to 250°F and increasing cure time to 1.5 hours does not provide any material property benefits.
Another observation made during testing was the failure mode of the bend test samples. All of the samples failed at the point where the load was being applied, resulting in small inter-lamina fractures or delamination. These failures were often not visible once the sample was not loaded.
3.5 Determining the Volumetric Ratios of Samples One of the most important factors determining the properties
of composites is the relative proportions of resin and matrix. The relative proportions can be given as the weight fraction or the volume fraction. In theoretical composites the optimum volumetric ratio is 40% Resin and 60% Fiber. In order to determine the volumetric ratios for the samples the weight fractions need to be determined. This is done by weighing and measuring the volume of the samples, and then placing the samples in a furnace between 1000°F to 1400°F to remove all the resin from the sample. This process can be seen in Figure 23. The sample was then weighed again once all the resin was removed; this took 45 minutes to an hour. The final weight was the weight of the fiber and the difference from the original weight was the weight of the resin. With all the weights recorded, equations from Bhagwan Agarwal’s text Analysis and Performance of Fiber Composites [5] (seen as Equations 8 and 9) were used to find the matrix and fiber volume fractions.
𝑾𝒇 = 𝒘𝒇𝒘𝒄
𝑾𝒎 = 𝒘𝒎𝒘𝒄
(8)
Where Wf is the fiber weight fraction, wf is the weight of the fiber, wc is the weight of the composite sample, Wm is the matrix weight fraction, and wm is the weight of the matrix.
𝑽𝒇 = 𝝆𝒄𝝆𝒇𝑾𝒇 𝑽𝒎 = 𝝆𝒄
𝝆𝒎𝑾𝒎 (9)
Where Vf is the volume fraction of fiber, ρc is the density of the composite, ρf is the density of the fiber, Vm is the volume fraction of matrix, and ρm is the density of the matrix.
The NB-301 data sheet [2] supplies the specific gravity of the NB-301 resin to be 1.22± 0.02; using the density of water, the density of the resin (ρm) is calculated to be 0.044 lbm/in3 (1.22 g/cm3). From the data sheet it was also found that the carbon fiber used was 34-700 carbon fiber. Using data supplied from Grafil Inc.’s website it was determined that the density of 12k 34-700 carbon fiber is 0.065 lbm/in3 (1.80 g/cm3) .[6] Finally, using the recorded values of weight and volume of the samples the density of the composite was calculated. Using Equation 9, the volume fraction of the matrix and the volume fraction of the fiber were calculated. The results of these calculations can be seen in Table 4.

Adriano Agostino
22
Unfortunately, the data from the Autoclave samples vary. It would appear that for both the tensile samples fabricated in the Autoclave the volumetric ratios is 50% fiber 50% matrix which would mean that the composite is oversaturated with resin. With the thicker 3-point bend samples the trends are about the same, maybe even more oversaturated, as can be seen with the sample cure at 275°F which has a 62% matrix ratio and a 38% fiber ratio. Because all these samples were over-saturated the pressure in the autoclave was not enough to eliminate the excess resin. Looking at the heat press cycles the ratios for both the samples cured at 250°F was around 50% Fiber and 50% Resin. It was only when looking at the samples cured at 275°F in the press that the results demonstrated a higher ratio of fibers than matrix, with 53% Fiber to 47% Matrix. This is still however theoretically over-saturated.
Looking at the tensile samples section of Table 4, it can be noted that the fiber volume ratios for the autoclave samples and the 250°F heat press samples are very similar and this seems to match up with the trend seen with the tensile moduli. The tensile test samples cured at 275°F in the heat press have a higher fiber volume ratio which possibly explains why the tensile modulus of this set was higher than the previous three sets. The results of the volumetric ratio calculation with the 3-point bend test samples didn’t seem to match any trends seen in testing.
4 Conclusion
4.1 Overview of Research and Results ASTM standards D-3039 and D-790 were used to generate mechanical properties for the composites at
different cure cycles while using different fabrication methods. From this mechanical data the tensile properties showed that using the heat press produced higher elastic moduli for both curing cases. The highest tensile strength occurred with the recommended cure cycle of 275°F for an hour. Looking at the effects of cure cycle on mechanical properties, the recommended cure cycle produced a higher tensile modulus for both fabrication processes. There was no clear trend demonstrated for a particular curing cycle when comparing tensile strength. From the mechanical data the flexure properties showed that for both fabrication methods the flexure modulus was improved with the 250°F
Table 4 - Volumetric Ratio Summary
Tensile Samples
Average Fiber
Volume Ratio
% Relative Standard Deviation
Average Matrix Volume
Ratio
% Relative Standard Deviation
Average Void Volume
Ratio
Autoclave 250°F 0.478 3.88 0.465 0.690 0.057 Autoclave 275°F 0.466 9.25 0.499 12.312 0.035 Heat Press 250°F 0.478 7.57 0.486 10.362 0.039 Heat Press 275°F 0.533 3.19 0.432 5.923 0.036
3-Point Bend Samples
Average Fiber
Volume Ratio
% Relative Standard Deviation
Average Matrix Volume
Ratio
% Relative Standard Deviation
Average Void Volume
Ratio
Autoclave 250°F 0.397 4.41 0.546 5.045 0.057 Autoclave 275°F 0.387 9.94 0.621 9.981 0.006 Heat Press 250°F 0.500 5.33 0.503 7.373 0.004 Heat Press 275°F 0.523 3.04 0.469 2.888 0.008
Adriano Agostino
23
cure cycle. There is no improvement in flexure strength and maximum load. This data leads to the conclusion that lowering the cure temperature to 250°F and increasing cure time to 1.5 hours does not provide any material property benefits.
Because there were no clear trends for which fabrication method was better, and because the standard’s specimen rules were not completely met, the flexure tests should be repeated for more accurate and conclusive results. The key conclusion drawn from the testing results on both the tensile and flexure properties is best fabricated using the recommended cure cycle of 275°F for one hour. Another conclusion that could be drawn is that heat press fabrication results in stronger plates.
4.2 Future Work Recommendations If the research were to be continued, the tests should be repeated using the ASTM D-638 Type 1 standard
for the tensile testing. This would replicate what Newport Adhesives and Composites used to produce their product data sheet. As previously mentioned, the flexure testing should be repeated and the standard should be followed more strictly to ensure that the test results could be compared more accurately. It would also be informative to complete compression testing using the ASTM D-695 standard, and short beam shear testing using the ASTM D-2344 standard. If these tests were properly completed then the project could continue toward its original goal of comparing the torsional performance of a carbon fiber composite wing to that of an aluminum wing.
If the testing is properly completed the results of the project could be applied to other projects such as those completed by the SAMPE chapter at Cal Poly for the beam competition each year. Carbon fiber beams built this year by the teams had been having issues of delamination. If the findings of the short beam shear tests show that the interlaminar strength of NB 301 12k 2x2 Twill weave carbon is greater than that of the current LTM45 pre-preg matrix with CF1803 bidirectional woven carbon fiber, then the data presents a reason to consider improving current beam construction.
Adriano Agostino
24
5 Works Cited [1] Strong, A. Brent. Fundamentals of Composites Manufacturing Materials, Methods, and Applications. 2nd.
Dearborn: Society of Manufacturing Engineers, 2008.
[2] Newport Adhesives and Composites, Inc., 2006. Newport 301 Product Data Sheet. [online] Newport Adhesives and Composites, Inc. < http://www.newportad.com/pdf/PL-NB-301.pdf> Accessed: [3 May 2013].
[3] ASTM Standard D3039, 2008, “Standard Test Methods for Tensile Properties of Polymer Matrix Composite Materials,” ASTM International, West Conshohocken, PA, 2008, D3039M - 08, www.astm.org.
[4] ASTM Standard D790, 2010, “Standard Test Methods for Flexural Properties of Unreinforced and Reinforced Plastics and Electrical Insulated Material,” ASTM International, West Conshohocken, PA, 2010, D790-10, www.astm.org.
[5] Agarwal, Bhagwan D., Lawrence J. Broutman and K. Chandrashekhara. Analysis and Perfromance of Fiber Composites. 3rd. Hoboken: John Wiley & Sons, Inc., 2006.
[6] Grafil Inc., 2012. Products: Typical Properties of Grafil Carbon Fiber. [online] Grafil Inc. <http://www.grafil.com/grafilproducts.html> Accessed: [2 June 2013].