the effects of fading a strategic self- accuracy, and...
TRANSCRIPT
The Effects of Fading a Strategic Self-Monitoring Intervention on Students’ Academic Engagement,
Accuracy, and Productivity
By: Marcia L. Rock and Beth K. Thead
Rock, M.L., & Thead, B.K. (2007). The effects of fading a strategic self-monitoring intervention on students’
academic engagement, accuracy, and productivity. Journal of Behavioral Education, 16 (4), 389-412.
Made available courtesy of Springer Verlag: The original publication is available at
http://www.springerlink.com
***Reprinted with permission. No further reproduction is authorized without written permission from
Springer Verlag. This version of the document is not the version of record. Figures and/or pictures
may be missing from this format of the document.***
Abstract:
In this study, using a single-case multiple-treatment reversal (A-B-A-B-C) research design, we replicated and
extended previous strategic self-monitoring research by teaching five students, with and without disabilities, to
use ACT-REACT to increase their academic engagement, productivity, and accuracy across new and previously
learned math material. Then, we gradually faded the students’ use of the strategic self-monitoring recording
sheet until they were no longer using it. When the ACT-REACT self-monitoring recording sheet was in place
the students’ engagement and academic productivity increased; however, when it was faded, the results varied.
During fading, the students’ performance generally exceeded baseline conditions and compared adequately to
intervention effects. Overall, the results of this study support the advantages of strategic self-monitoring and
also point to the mixed benefits of fading these procedures in inclusive environments.
Keywords: Self-monitoring - Academic engagement - Academic productivity - Academic accuracy - Inclusive
classroom
Article:
In a recent investigation of classroom teachers’ expectations, Lane et al. (2006) reported general and special
educators viewed student self-control as critical to achieving academic and behavioral success. Hirschi (2004)
defines self-control as ―the set of inhibitions one carries with one wherever one happens to go‖ (p. 543).
Unfortunately, students with disabilities often function well below national normative levels in measures of
self-control (Gresham et al. 1996). Self-control is required for successful completion of many assigned
classroom tasks, particularly independent seatwork. In general education settings, teachers expect students with
and without disabilities to engage in such activities for much of the instructional time (Parmar and Cawley
1991; Vaughn et al. 2002).
Accumulating inclusion-related literature suggests that one evidence-based approach designed to teach self-
control effectively and in turn, positively influence the academic engagement and performance of students with
disabilities in the general education classroom is self-management (see Dalton et al. 1999; Hogan and Prater
1993; McDougall and Brady 1998; Peterson et al. 1999; Prater et al. 1991; Trammel et al. 1994). Self-
management approaches include interventions ―in which the target individual plays the primary role in changing
his or her own behavior‖ (Kerr and Nelson 2002, p. 460). Many teachers struggle to meet their students’
complex needs while encountering excessive teacher workload responsibilities and the demands of increased
accountability (Schumm and Vaughn 1995). Thus, general education teachers may find self-management
approaches preferable to environmentally or teacher mediated interventions.
One type of self-management approach that has been used successfully within general and special education
settings to increase students’ self-control and improve academic performance is self-monitoring (see Bray et al.
1998; Carr and Punzo 1993; Dunlap and Dunlap 1989; Dunlap et al. 1995; Edwards et al. 1995; Harris et al.

2005; Levendoski and Cartledge 2000; Maag et al. 1992; Mathes and Bender 1997; McDougall and Brady
1998; Reid and Harris 1993; Rock 2005; Shimabukuro et al. 1999). Self-monitoring involves the recording of
one’s own behavior (Kerr and Nelson 2002). Two types of self-monitoring approaches appear in the literature:
measuring and recording one’s own attending behaviors (self-monitoring of attention, SMA) or one’s own
academic performance (self-monitoring of performance, SMP) (see Maag et al. 1993; Reid 1996; Reid and
Harris 1993).
While there is no question self-monitoring is an effective intervention to improve students’ self-control and
academic performance, the differential effectiveness of SMA versus SMP approaches for students with varying
disabilities remains relatively unknown. A few studies with students with learning disabilities have revealed that
SMP resulted in greater improvements on selected tasks than SMA (Harris 1986; Harris et al. 1994; Reid and
Harris 1993). However, in a recent study of students with attention-deficit/hyperactivity disorder (ADHD) use
of differing self-monitoring procedures (Harris et al. 2005) concluded SMA yielded higher gains in spelling
study performance than SMP. We found only one study in which the researcher employed SMA and SMP
interventions concurrently (see Rock 2005) to successfully enhance the academic engagement, productivity, and
accuracy of nine elementary-aged students with and without exceptionalities in general education classrooms.
Since classroom teachers report being overwhelmed by student needs and a wide range of teaching
responsibilities (Boardman et al. 2005), it seems logical that in order for them to transfer self-monitoring
research into effective and ongoing classroom practice they need procedures like ACT-REACT (defined
below).
ACT-REACT is a strategic self-monitoring approach wherein students employ simultaneous use of
SMA + SMP in addition to other self-management procedures, such as self-modeling and goal orientation
activities (Rock 2004). ACT-REACT is a mnemonic device that represents a six-step process that includes:
Articulate your academic and behavioral goals, Create a self-monitoring work-plan to record your academic and
behavioral performance, Take picture(s) of your behavioral goals using self-modeling, Reflect on your
academic and behavioral goal attainment after each class, Evaluate your academic and behavioral progress over
time, and ACT again continuously. A multiple baseline across subjects with an embedded reversal assessed the
effectiveness of the strategic self-monitoring approach (i.e., ACT-REACT) to enhance the academic
engagement, productivity, and accuracy of nine elementary-aged students with and without exceptionalities in
general education classrooms. During the study, participants used the ACT-REACT strategy during independent
seatwork in math and/or reading. Following the ACT-REACT intervention all students demonstrated
considerable improvement, academically and behaviorally. Thus, in one study, ACT-REACT has been shown to
be effective across students, tasks, categories of exceptionality, and stages of learning in inclusive settings (e.g.,
Rock 2005). Procedures such as ACT-REACT allow students with differing exceptionalities to benefit from a
single intervention; however, given the lack of studies available it is clear more research on combined SMA and
SMP interventions is needed.
Another limitation in the self-monitoring literature is the scant number of studies wherein the authors
incorporated a gradual fading schedule. Kerr and Nelson (2002) assert that a critical aspect of any successful
self-management program is fading. Researchers suggest use of gradual fading procedures to ensure desired
self-monitoring intervention effects are maintained over time and generalized across settings, tasks, and
teachers (Edwards et al. 1995). Surprisingly, when we conducted a thorough review of the professional
literature examining about 212 self-monitoring studies only ten (approximately 5%) included gradual fading
procedures in the experimental phases of the investigation (see Boyle and Hughes 1994; De Haas-Warner 1992;
DiGangi et al. 1991; Edwards et al. 1995; Levendoski and Cartledge 2000; Mathes and Bender 1997; Maag
et al. 1993; McDougall and Brady 1998; Prater et al. 1992; Prater et al. 1991). In all but two of these studies
(i.e., Edwards et al. 1995; Maag et al. 1993), researchers demonstrated that students’ academic engagement
maintained or increased during fading conditions. On the other hand, only five of the studies investigated
students’ academic performance during fading phases and results were mixed. Levendoski and Cartledge
observed declines, whereas McDougall and Brady (1998) reported continued increases. DiGangi, Maag, and
Rutherford noted maintenance of academic performance gains; whereas, Edwards and her colleagues like Maag,

Reid, and DiGangi described both improvements and deteriorations in participant performance. Interestingly,
despite prevailing policy and practice shifts to educate students with disabilities in the general education
classroom (25th Annual Report to Congress), only six (see De Haas-Warner 1992; DiGangi et al. 1991;
Edwards et al. 1995; Maag et al. 1993; McDougall and Brady 1998; Prater et al. 1992) of the 10 inquiries were
undertaken in inclusive environments.
Given the importance of student self-control in the general education classroom, and acknowledging the
aforementioned gaps in this facet of the self-monitoring literature, we conducted this study with two purposes in
mind. The first purpose of the present study was to replicate and extend research on combined self-monitoring
of attention and performance procedures by evaluating the intervention (i.e., ACT-REACT) across various
stages of learning, including new content, with a different and diverse student population. The second purpose
was to evaluate maintenance of the intervention effects when students’ use of the strategic self-monitoring
materials was gradually faded.
Methods
Participants
Of the five children participating in this study, one student, Alvin, was considered ―typical‖ or non-disabled.
One student, Levi, was suspected of having attention-deficit/hyperactivity disorder (ADHD), but was not
formally identified, and three, Joshua, JaShun, and Lucy had differing disability labels. The students’ teacher
nominated these students and requested the combined self-monitoring of attention and performance procedures
(i.e., ACT-REACT) be used during independent math seatwork. She asserted that the students’ lack of
engagement in assigned independent seatwork tasks was especially problematic.
Joshua and JaShun were 13-year-old African-American identical twins identified with learning disabilities and
ADHD. The boys were born prematurely and were exposed prenatally to alcohol and cocaine. The twins were
adopted as infants. Joshua and JaShun did not enter school until the age of six. At the request of their adoptive
parents they were retained in the fourth/fifth grade, thus their relatively older age. As is the case with many
children born prematurely, the boys were small in stature and appeared younger than their chronological age.
No pyschoeducational data were available on the twins because they had relocated recently and their formal
educational records failed to arrive despite repeated requests. Joshua and JaShun exhibited high rates of
disengaged or off task behavior during independent seatwork. Joshua’s active disengagement was characterized
by talking to peers, persistently being out of seat, singing, making faces at peers, drumming on the table top,
loud talking and laughing, and acting aggressively toward his twin brother as well as his peers (e.g., throwing
erasers, hitting, launching rubber bands). JaShun’s active disengagement was characterized by the same
problem behaviors. The twins’ passive disengagement was characterized by staring, looking out the window,
and drawing or doodling.
Lucy was a 14-year-old Caucasian girl identified as having autism and moderate mental retardation. Her most
recent special education reevaluation data indicated a Verbal, Performance, and Full Scale IQ of 52, 50, and 48,
respectively derived from the Wechsler Intelligence Scale for Children—Third Edition. Lucy was disengaged
passively and actively during independent math seatwork on a daily basis. Her passive disengagement was
characterized by staring, whispering to self and peers, and toying with pencils, erasers, math manipulatives, and
so forth. Her active disengagement was characterized by laughing aloud for no obvious reason and interrupting
the master teacher with unrelated questions. Lucy had received early intervention services, but did not enter
kindergarten until the age of seven. At the request of her parents, she was retained in the fourth/fifth grade, thus
her relatively older age. Lucy was slow to mature and did not appear to be older than her classmates.
Levi was an 11-year-old African-American boy who was not identified formally as having a disability. His
chronic active disengagement consisted of persistently being out of his seat, wandering the halls, talking with
other students, laughing, and tapping his pencil on the tabletop. By contrast, his passive disengagement
consisted of staring, drawing or doodling, and occasionally humming softly to himself.
Alvin was a 10-year-old African-American boy who was not identified as having a disability. Alvin was
disengaged actively and passively during independent seatwork. His actively disengaged behaviors included
talking, laughing, and telling jokes with peers. By contrast, his passively disengaged behaviors were
characterized by staring and laying his head down on the desk.
Achievement test data were available for the five participants. ACT-explore ® scores were available for the
twins, Joshua and JaShun. In mathematics the twins performed in the 2nd and 11th percentiles, respectively.
However, in reading Joshua scored in the 26th percentile, while JaShun scored in the 16th. For the other two
students, Levi and Alvin, Stanford Achievement Test, Tenth Edition, scores were available. Levi scored in the
50th percentile for Total Mathematics and the 83rd percentile for the Complete Battery, while Alvin performed
in the 86th percentile for Total Mathematics and the 88th percentile for the Complete Battery. Lucy, the student
for whom alternative assessment was deemed appropriate, earned a Total Mathematics Composite score below
the 1st percentile rank and a Total Reading Composite score in the 1st percentile on the Wechsler Individualized
Achievement Test (WIAT).
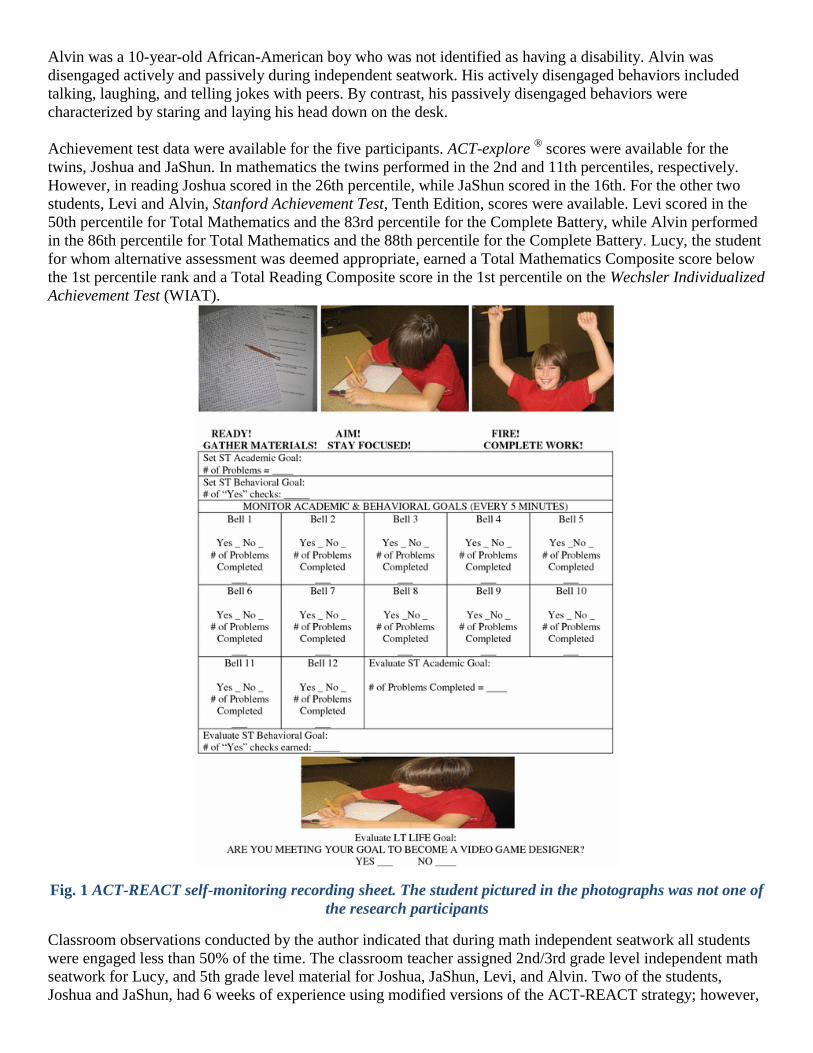
Fig. 1 ACT-REACT self-monitoring recording sheet. The student pictured in the photographs was not one of
the research participants
Classroom observations conducted by the author indicated that during math independent seatwork all students
were engaged less than 50% of the time. The classroom teacher assigned 2nd/3rd grade level independent math
seatwork for Lucy, and 5th grade level material for Joshua, JaShun, Levi, and Alvin. Two of the students,
Joshua and JaShun, had 6 weeks of experience using modified versions of the ACT-REACT strategy; however,

the other three students did not have previous experience with self-monitoring interventions. The students’
names were changed to protect their anonymity. Written parental consent and student assent for participation
was obtained for each student. The students received no rewards or incentives for participating in the study.
Setting
The study was conducted in an elementary school in the southeastern United States. All the students were
placed in a fourth/fifth grade multiage general education classroom, along with 21 other students. The research
was conducted when students were engaged in independent seatwork in the area of math. One master teacher
and one assistant teacher were present during seatwork activities. The master teacher was stationed at the
computer. Her role was to guide students’ interaction with the Accelerated Math curriculum program (e.g.,
scanning, scoring, printing new work material), while the assistant teacher worked with students individually on
an as-needed basis. The teacher and/or assistant teacher provided intermittent large or small group math
instruction when a new skill was introduced for differing lengths of time (i.e., 5–15 min) immediately prior to
independent seatwork activities. The classroom was a fully inclusive multiage cluster; therefore, students
differed in with regard to both age and grade level. The small classroom size (i.e., 9.144 m by 3.9624 m) forced
students to be in close physical proximity to one another. There were no individual desks; students completed
independent seatwork at square or round tables.
Materials
The materials students used included: instructional materials specific to independent seatwork (e.g., Accelerated
Math worksheet, scan cards); a graphic organizer (i.e., three-main-idea frame; Ellis 1998); a timing device (a
travel alarm clock with a snooze feature); a recording instrument (i.e., a pencil, pen); and an ACT-REACT self-
monitoring recording sheet. The ACT-REACT self-monitoring recording sheet (see Fig. 1) provided space for
students to systematically keep a record of their behavioral and academic progress by means of a 5-min self-
recording interval system. The self-monitoring recording sheets used by the students were generated by the
computer using Microsoft Word and were reproducible (see Rock 2004).
Design
A single-case multiple-treatment reversal (A-B-A-B-C) research design (Cooper et al. 2007; Kazdin 1982) was
used to evaluate the effectiveness of the ACT-REACT strategy on students’ academic engagement, accuracy,
and productivity. For each student (i.e., Joshua, JaShun, Lucy, Levi, and Alvin), academic engagement,
accuracy, and productivity data were obtained during baseline, intervention with ACT-REACT, return to
baseline, return to intervention with ACT-REACT, and gradual fading of the ACT-REACT self-monitoring
recording sheet. We chose the reversal design because Cooper et al. (2007) maintain ―it is the most
straightforward and generally the most powerful within-subject design for demonstrating a functional relation
between an environmental manipulation and a behavior‖ (p. 176).
Student Interviews
Semi-structured interviews were conducted with each participant at the end of the study. Students were
interviewed individually by the first author for varying lengths of time (i.e., 5–10 min) in the school library. The
interview questions were derived from those included in Levendoski and Cartledge’s (2000) student
questionnaires and included the following: ―Did you like using ACT-REACT?‖ ―If so, why?‖ ―If not, why
not?‖ ―Do you think you did more work during math when you used ACT-REACT?’’ ―Why or Why not?‖
―Will you continue to use ACT-REACT on your own or during other times of the day?’’ ―Why or Why not‖ ―Is
there anything else you would like to tell me about ACT-REACT?‖
Dependent Variables and Measurement
Academic engagement data (recording time on task) were recorded for Joshua, JaShun, Lucy, Levi, and Alvin.
Academic engagement was defined as follows: the student participates in math related independent seatwork
assignments (e.g., student in seat, eyes on papers, working quietly on assigned paper–pencil math tasks).
Academic disengagement was defined as the student was out of seat and/or talking to classmates about subjects
other than the paper–pencil math task and/or making vocalizations and/or staring off into the distance and/or

laying head on the table and/or insulting peers and/or drawing and/or hitting peers and/or spitting and/or playing
with objects. Momentary time-sampling methods at 1-min intervals were used to measure the students’
engaged/disengaged behavior during independent seatwork (Cooper et al. 2007). To do this, we looked at each
student (in the same order) at the 1-min mark of the observation period, determined immediately whether the
target behavior (academic engagement) was occurring, and marked our decision on the recording form. We
repeated this procedure until the end of the 45 min observation period in which math independent seatwork
activities were assigned continuously.
In addition to engagement, data were collected on math productivity and accuracy. Math productivity was
defined as the total number of math problems completed; math accuracy was defined as the percentage of the
total number of problems on a completed assignment that were correct. These academically specific variables
were measured using permanent product analysis (e.g., computer-scored assignment and test results). Academic
productivity data were recorded at the end of each day while academic accuracy data were calculated at the end
of each completed assignment.
The school used the Accelerated Math curriculum produced by Renaissance Learning. Accelerated Math is a
computer software tool for managing and monitoring students’ mathematics learning from first grade through
calculus. Specifically, Accelerated Math generates unlimited practice assignments that are individualized for
each student; provides immediate, individualized feedback showing what mistake each student makes;
delineates all mastered objectives; and immediately scores all practice assignments and tests (e.g., Renaissance
Learning: Better Data, Better Learning; http://www.renlearn.com/am). The number of math problems the
students receive each day varies depending on content. Because of Lucy’s level of functioning and type of
disability, her independent seatwork tasks were modified. Specifically, we limited the number of problems she
received on a test or assignment to 10. If she completed the 10 problems, she was instructed to ask for another
assignment. The computer-generated Accelerated Math results verified the number of problems completed and
calculated the percentage of accuracy for all students.
Interobserver Agreement
The first author and two graduate assistants conducted all of the observations. The first author had previous
training and experience in the use of momentary time-sampling observation systems and taught the graduate
assistants how to collect academic and behavioral data over a 1-week period using classroom-based practice
recording. Both graduate assistants were trained until each student reached the .80 or better agreement with the
first author.
Graduate assistants collected interobserver agreement (IOA) data during each phase of the study across the
dependent variables. Academic engagement data were assessed by having the graduate assistants observe at the
same time as the first author/researcher. A point-by-point agreement ratio was used to calculate IOA (Kazdin
1982). Agreements of the observers at each 1-min interval were divided by the number of agreements plus
disagreements and multiplied by 100 to obtain a percentage (Kazdin 1982). The IOA for Joshua’s academically
engaged behavior was 92.2% (range = 61.9–100%); and, the IOA for JaShun’s academically engaged behavior
was 98.7% (range = 71.4–100%). There were only two instances in which IOA scores fell below 80% for
Joshua and JaShun; when this happened, the observers were retrained. The IOA for Lucy’s academically
engaged behavior was 90.2% (range = 84.4–95.5%); the IOA for Levi’s academically engaged behavior was
88.1% (range = 80–96.7%); and, the IOA for Alvin’s academically engaged behavior was 96.2% (range = 92–
100%). Behavioral IOA was assessed during each phase of the study (i.e., 24% of the sessions). Academic IOA
data were unnecessary because productivity and accuracy data were computer generated.
Procedure
General Procedures
Throughout the study, sessions were conducted over about a 5 month period during the 2003–2004 school year
on Monday, Tuesday, Wednesday, and Friday except for absences, field trips, school holidays, special
assemblies, testing, or unplanned events. Data were not collected on Thursday because of the first author’s

university teaching schedule. During data collection, the observer was seated on a stool or in a chair off to the
side or in the back of the classroom. Students worked independently for 45 min on Accelerated Math seatwork.
The curriculum was individualized, and students were engaged in various stages of learning (i.e., acquisition,
fluency, maintenance, generalization) during these activities. For instance, when a student completed a test the
next math printout included new material that the student had not encountered previously. Accelerated Math is
designed to be used as a supplement to the mathematics curriculum; however, in this school this was not the
case—it was used as the only mathematics curriculum. The computer generated the objectives covered in the
students’ independent seatwork assignments and were based on the grade level scope and sequence the teacher
assigned.
Baseline
Baseline data were collected for seven school days. The students were expected to raise their hand when they
needed assistance or encountered new content. During baseline no other procedures or interventions were in
place.
Intervention 1
A strategic self-monitoring approach, referred to as ACT-REACT (see Rock 2005), was used. After the last day
of the first baseline, the first author conducted individual training sessions to teach Joshua, JaShun, Lucy, Alvin,
and Levi how to use the strategic ACT-REACT self-monitoring procedure. Each student participated in two
30 min training sessions. To conduct the training sessions, the first author asked each student to bring his or her
math materials to the library. While in the library, the first author taught and modeled the steps of the strategic
ACT-REACT self-monitoring procedure (see Rock 2004, 2005 for detailed discussions of the training process).
Intervention 1 commenced upon completion of baseline and training activities. At the beginning of the
independent math seatwork period, the ACT-REACT self-monitoring recording sheets were distributed along
with the timing device (travel alarm) to the students. Each student was instructed to remember to use the ACT-
REACT strategy in exactly the same way he or she learned during training. This process took approximately 3–
5 min. At the end of the session, the first author reviewed the students’ goals, as well as their attention and
performance data, with the students in a one-to-one format; encouraged the students to continue to monitor their
attention and performance in other classes throughout the day; and collected the ACT-REACT self-monitoring
recording sheets and timing devices. These wrap-up procedures took approximately 3 min with each student.
The students used the ACT-REACT procedure for 21 school days.
Return to Baseline
Following the first intervention phase, a second baseline phase was initiated. The students were instructed to
―take a break‖ and not use the ACT-REACT procedures for the next four school days. The researchers
employed the same approach that was described in the general procedures and initial baseline phase.
Intervention 2
After the last day of the return-to-baseline condition was completed, the ACT-REACT intervention was
reintroduced, and the students resumed use of the strategic self-monitoring recording sheet. The first author
reviewed the ACT-REACT strategy briefly with each student before reinstating intervention. The students
returned to using the ACT-REACT procedure for eight school days.
Fading The fading condition was divided into five phases that were carried out over 14 school days. The goal during
the fading condition was to gradually reduce the students’ use of the strategic ACT-REACT self-monitoring
recording sheet. Phases 1, 2, 3, and 4 of the fading condition lasted 3 days each, while phase five lasted only
2 days. During the first phase of the fading condition (i.e., days 73, 74, and 75) the SMA + SMP self-
monitoring intervals were increased on the strategic ACT-REACT self-monitoring sheet from 5 min to 10 min.
So, there were fewer opportunities for the students to mark their attention and performance on the strategic
ACT-REACT self-monitoring recording sheet. On days 76, 77, and 78 (i.e., fading phase 2), the students were

instructed to self-monitor on their strategic ACT-REACT self-monitoring recording sheet at 20 min intervals.
On days, 79, 80, and 81 (i.e., fading phase 3), SMA + SMP self-monitoring intervals on the strategic ACT-
REACT self-monitoring sheet were increased to 30 min. On days 82, 83, and 84 (i.e., fading phase 4), the
students were instructed to self-monitor on the strategic ACT-REACT self-monitoring recording sheet at 40 min
intervals. Finally, on days 85 and 86 (i.e., fading phase 5), the strategic ACT-REACT self-monitoring recording
sheet was removed and no timer was used. As the cueing intervals were gradually lengthened, the students were
instructed to continuously and silently assess their performance until the end of the period to determine whether
or not they had met their academic and behavioral goals. They did not report their results to anyone.
Results
Joshua
Figure 2 shows the percentage of academic engagement for Joshua. The mean percentage of engagement during
the initial baseline for Joshua was 47.8% (range = 26.9–75%). During the initial implementation of ACT-
REACT, Intervention 1, Joshua’s academic engagement increased to a high and stable level. His mean
percentage of engagement was 92.9% (range = 83.3–100%). When the return-to-baseline condition was
implemented, a substantial decline occurred in Joshua’s academically engaged behavior. Joshua’s mean
percentage of engagement decreased to 35.9% (range = 26.7–50%). During the reinstatement of the ACT-
REACT intervention, Intervention 2, Joshua’s engagement data accelerated and remained constant. The mean
percentage of his academic engagement was 81.7% (range = 60–90%). When the strategic ACT-REACT self-
monitoring recording sheet was faded systematically, the mean percentage of Joshua’s academic engagement
decreased slightly compared to the initial intervention phase. However, his level of engagement was higher and
more stable than the trends observed during Baselines 1 and 2. The mean percentage of engagement during the
14 days of fading for Joshua was 80.9% (range = 63.3–93.3%).
Fig. 2 Percentage of academic engagement and number of problems completed for Joshua during math
independent seatwork
Figure 2 also provides the academic productivity data for Joshua. During the first baseline condition, the mean
number of problems Joshua completed was nine (range = 2–15) with a mean accuracy of 66.7% (range = 50–
100%). During the initial intervention phase, Intervention 1, Joshua’s productivity increased. The mean number
of problems Joshua completed was 16 (range = 9–27) with a mean accuracy of 64.17% (range = 20–100%).
However, caution is warranted in ascribing experimental control to this phase change for this behavior due to
the positive trend in baseline. On the return to baseline condition, Joshua’s productivity and accuracy
deteriorated; he completed a mean number of 10.3 (range = 8–12) problems per day with a mean accuracy of
56.7% (range = 33–95%). However, caution is warranted in ascribing experimental control to this phase change
for this behavior due to the negative trend in the preceding phase. During the reinstatement of the ACT-REACT
intervention, the productivity and accuracy data for Joshua improved. He completed a mean number of 19
(range = 11–29) problems per day with a mean accuracy of 65.9% (range = 40–100%). When the strategic
ACT-REACT self-monitoring recording sheet was faded systematically, Joshua’s productivity was higher but

unstable while his accuracy declined. During the 14 days of fading, Joshua completed a mean number of 24
(range = 9–45) problems per day with a mean accuracy of 54.5% (range = 35–100%).
JaShun
Figure 3 shows the percentage of academic engagement for JaShun. The mean percentage of engagement during
the initial baseline for JaShun was 52.4% (range = 19.2–100%). During the initial implementation of ACT-
REACT, Intervention 1, the percentage of JaShun’s academically engaged behaviors increased. His mean
percentage of engagement increased to 93.6% (range = 73.3–100%). Like Joshua, when the return-to-baseline
condition was implemented, a substantial decline occurred in JaShun’s academically engaged behavior.
JaShun’s mean percentage of engagement decreased to 37.5% (range = 13.3–56.7%). During the reinstatement
of ACT-REACT, Intervention 2, JaShun’s engagement data accelerated and remained constant. The mean
percentage of his academic engagement was 78.8% (range = 64–93.3%). When the strategic ACT-REACT self-
monitoring recording sheet was faded systematically, the mean percentage of JaShun’s academic engagement
decreased slightly compared to Intervention 1. However, his level of engagement was higher and more stable
than the trends observed during Baselines 1 and 2. The mean percentages of engagement during the 14 days of
fading for JaShun was 83.6% (range = 66.7–93.3%).
Fig. 3 Percentage of academic engagement and number of problems completed for JaShun during math
independent seatwork
Figure 3 also provides the academic productivity data for JaShun. During the first baseline condition, the mean
number of problems JaShun completed was 8.0 (range = 2–20) with a mean accuracy of 62.4% (range = 40–
82%). During the initial implementation of ACT-REACT, Intervention 1, JaShun’s productivity and accuracy
increased. The mean number of problems JaShun completed was 13.7 (6–28) with a mean accuracy of 67.3%
(range = 40–100%). On the return to baseline condition, JaShun’s productivity and accuracy deteriorated; he
completed a mean number of 10.3 (range = 6–15) problems per day with a mean accuracy of 53.7%
(range = 52–56%). During the reinstatement of the ACT-REACT intervention, Intervention 2, the productivity
and accuracy data for JaShun improved. He completed a mean number of 15.6 (range = 5–30) problems per day
with a mean accuracy of 73.6% (range = 25–100%). As was the case with his twin brother, when the strategic
ACT-REACT self-monitoring recording sheet was faded systematically, JaShun’s productivity increased while
his accuracy declined. During the 14 days of fading, JaShun completed a mean number of 19.3 (range = 5–45)
problems per day with a mean accuracy of 43.0% (range = 14–80%).
Lucy
Figure 4 shows the percentage of academic engagement for Lucy across phases of the study. During the initial
baseline, the data path for this student is variable, although she demonstrated low levels of academic
engagement during math independent seatwork activities. The mean percentages of engagement during the
initial baseline for Lucy was 19.2% (range = 8.70–27.27%). During Intervention 1, when the ACT-REACT
intervention was implemented, the percentage of Lucy’s academically engaged behavior increased moderately.

Lucy’s mean percentage of engagement increased to 64.9% (range = 31.6–100%). When the return-to-baseline
condition was implemented, a substantial decline occurred in Lucy’s academically engaged behavior. Lucy’s
mean percentage of engagement decreased to 31.0% (range = 24–43.3%). During the reinstatement of the ACT-
REACT intervention, engagement data accelerated moderately for Lucy. The mean percentage of Lucy’s eight
data points during Intervention 2 was 58.9% (range = 50–76.7%). When the ACT-REACT intervention was
faded systematically, Lucy’s level of academic engagement decreased slightly compared to Intervention 1 and
2; however, she exhibited levels of engagement that were higher and more stable than the trends observed
Baseline 1 and 2. The mean percentages of engagement during the 14 days of fading for Lucy was 56.7%
(range = 13.3–73.3%).
Fig. 4 Percentage of academic engagement and number of problems completed for Lucy during math
independent seatwork
Figure 4 also provides the academic productivity data for Lucy. During the first baseline condition, she
completed a mean number of 1.3 problems (range = 1–2) with a mean accuracy of 60% (range = 20–100%).
During the initial implementation of ACT-REACT, Intervention 1, Lucy’s productivity and accuracy increased.
She completed a mean number of 4.4 problems (range = 2–9) each day with a mean accuracy of 87.5%
(range = 50–100%). On the return to baseline condition, Lucy’s productivity deteriorated, while her accuracy
remained relatively stable; she completed a mean number of 2.8 problems (range = 0–5) each day with a mean
accuracy of 86.5% (range = 73–100%). During the reinstatement of the ACT-REACT intervention, Intervention
2, the productivity data for Lucy improved, and her accuracy, again, remained stable. However, caution is
warranted in ascribing experimental control to this phase change for this behavior due to the positive trend in
prior baseline phase. She completed a mean number of 4.3 problems (range = 3–6) each day with a mean
accuracy of 87% (range = 60–100%). When the strategic ACT-REACT self-monitoring recording sheet was
faded systematically, Lucy’s productivity increased while her accuracy declined. During the 14 days of fading,
Lucy completed a mean number of 5.9 problems (range = 1–13) each day with a mean accuracy of 65.1%
(range = 20–100%).
Levi
Figure 5 shows the percentage of academic engagement for Levi across phases of the study. During the initial
baseline, the data path for this student was variable, although he demonstrated low levels of academic
engagement during math independent seatwork activities. The mean percentages of engagement during the
initial baseline for Levi was 30.9% (range = 13.6–40.9%). During Intervention 1, when the ACT-REACT
intervention was implemented, the percentage of Levi’s academically engaged behavior increased to high and
stable levels. Levi’s mean percentage of engagement increased to 91.0% (range = 76.7–100%). When the
return-to-baseline condition was implemented, a substantial decline occurred in Levi’s academically engaged
behaviors. Levi’s mean percentage of engagement decreased to 32.5% (range = 20–40%). During the
reinstatement of the ACT-REACT intervention, engagement data accelerated for Levi. The mean percentage of
Levi’s eight data points during Intervention 2 was 92.6%. When the ACT-REACT intervention was faded
systematically, Levi’s level of academic engagement decreased slightly compared to Intervention 1 and 2;

however, his exhibited levels of engagement were higher and more stable than the trends observed Baseline 1
and 2. The mean percentages of engagement during the 14 days of fading for Levi was 79.1% (range = 56.7–
92%).
Fig. 5 Percentage of academic engagement and number of problems completed for Levi during math
independent seatwork
Figure 5 also provides the academic productivity data for Levi. During the first baseline condition, Levi
completed a mean number of 3.1 problems (range = 3–8) each day with a mean accuracy of 65.3% (range = 20–
100%). During the initial implementation of ACT-REACT, Intervention 1, Levi’s productivity increased, but
his accuracy decreased. He completed a mean number of 16.9 problems (range = 7–38) each day with a mean
accuracy of 57.0% (range = 8–100%). On the return to baseline condition, Levi’s productivity deteriorated,
while his accuracy improved; he completed a mean number of eight problems (range = 4–17) each day with a
mean accuracy of 64.7% (range = 47–80%). During the reinstatement of the ACT-REACT intervention,
Intervention 2, the productivity data for Levi improved substantially, and his accuracy diminished slightly. He
completed a mean number of 19.1 problems (range = 13–29) each day with a mean accuracy of 67.1%
(range = 39–100%). When the strategic ACT-REACT self-monitoring recording sheet was faded systematically,
Levi’s productivity increased while his accuracy declined. During the 14 days of fading, Levi completed a mean
number of 20.9 problems (range = 3–45) each day with a mean accuracy of 61.8% (range = 38–86%).
Alvin
Figure 6 shows the percentage of academic engagement for Alvin across phases of the study. During the initial
baseline, the data path for this student was variable, although he demonstrated low levels of academic
engagement during math independent seatwork activities. The mean percentages of engagement during the
initial baseline for Alvin was 44.3% (range = 20.0–68.2%). During Intervention 1, when the ACT-REACT
intervention was implemented, the percentage of Alvin’s academically engaged behavior increased to high and
stable levels Alvin’s mean percentage of engagement increased to 92.7% (range = 80–100%). When the return-
to-baseline condition was implemented, a substantial decline occurred in Alvin’s academically engaged
behavior. Alvin’s mean percentage of engagement decreased to 37.5% (range = 20–50%). During the
reinstatement of the ACT-REACT intervention, engagement data accelerated for Alvin. The mean percentage of
Alvin’s eight data points during Intervention 2 was 85.6% (range = 56–100%). When the ACT-REACT
intervention was faded systematically, Alvin’s academic engagement decreased slightly compared to
Interventions 1 and 2; however, he exhibited levels of engagement that were higher and more stable than the
trends observed Baseline 1 and 2. The mean percentage of engagement during the 14 days of fading for Alvin
was 84.5% (range = 73.3–90%).

Fig. 6 Percentage of academic engagement and number of problems completed for Alvin during math
independent seatwork
Figure 6 also provides the academic productivity data for Alvin. During the first baseline condition, Alvin
completed a mean number of 4.3 problems (range = 2–6) each day with a mean accuracy of 86.5% (range = 80–
96%). During the initial implementation of ACT-REACT, Intervention 1, Alvin’s productivity increased, but
his accuracy decreased. He completed a mean number of 11.5 problems (range = 5–17) each day with a mean
accuracy of 57.0% (range = 8–100%). On the return to baseline condition, Alvin’s productivity deteriorated,
while his accuracy improved; he completed a mean number of 7.5 problems (range = 5–10) each day with a
mean accuracy of 74.5% (range = 67–80%). During the reinstatement of the ACT-REACT intervention,
Intervention 2, the productivity data for Alvin improved, and his accuracy diminished slightly. Alvin completed
a mean number of 13.6 problems (range = 6–20) each day with a mean accuracy of 70.1% (range = 25–100%).
When the strategic ACT-REACT self-monitoring recording sheet was faded systematically, Alvin’s
productivity and accuracy increased. During the 14 days of fading, Alvin completed a mean number of 17.8
problems (range = 9–30) each day with a mean accuracy of 81.1% (range = 56–100%).
Student Interviews
All of the students completed exit interviews after the last day of the final fading phase. Each student indicated
he or she liked using ACT-REACT. When asked to elaborate, every student made a comment about how ―the
sheets with the pictures‖ reminded them to do what they were supposed to during math. They also stated they
liked to give themselves ―checks‖. All students reported they thought they did more work when they used ACT-
REACT because they were able to ―scan‖ at the end of class. Finally, all the students reported they wanted to
continue using ACT-REACT, and three of the five requested the materials be left with their teacher so they
could do so.
Discussion
The vast majority of past researchers examining the effects of self-monitoring have not included diverse
students with differing needs in the same general education classroom nor have they faded the experimental
phases during the investigation. Moreover, few researchers have investigated the impact of combined SMA and
SMP procedures when students encountered new content. In the present study, we attempted to address these
gaps and extend the literature by teaching five diverse students, with and without disabilities, to use a combined
SMA and SMP self-monitoring procedure (i.e., ACT-REACT) to enhance their academic engagement,
productivity, and accuracy across new and previously learned math material. Then, we gradually faded the self-
monitoring recording sheet until students were no longer using it.
Overall, the results of this study do successfully extend prior ACT-REACT research (see Rock 2005) by
evaluating the strategic self-monitoring intervention with a different and diverse population. While the first
ACT-REACT investigation included nine participants of different ages, race, grades, gender, and
exceptionality, variation in race was limited to one student who was Asian-American. Thus, most of the
students participating in the first study were from middle or upper income Caucasian or Asian-American
groups. In the present study, most of the students (four of the five) were African-American and two were of
low-income status. As was the case in the first the study, when intervention phases are compared with baseline
phases, all students’ engagement and productivity improved across new versus previously learned material, but
for some students their accuracy did not. This pattern may be a direct result of the variations in the students’
stages of learning and a more detailed explanation is offered later in this discussion when students’ performance
during fading phases are compared to baseline and intervention phases.
Yet another vitally important consideration that may be associated with the variability in the students’ accuracy
is instructional match. Seminal researchers have documented that after daily review and presentation of new
content, effective teachers provide ample opportunities for guided practice before assigning independent
practice (Rosenshine 1983, 1986). Specifically, Evertson et al. (1980) confirmed that effective teachers spend
about 23 min per day presenting new material and leading guided practice, while their less effective colleagues
spend about 11 min doing so. Since elementary-aged students spend 50–70% of their time working
independently, the importance of teacher-led guided practice cannot be overlooked (Rosenshine 1983).
Unfortunately, most classroom teachers fail to regularly incorporate this practice into daily instruction—
especially during math (Evertson et al. 1980; Good and Grouws 1977; Kame’enui et al. 2002). As we noted
previously, the classroom teacher in this study gave short presentations followed by independent practice. Thus,
there were occasions wherein the assigned independent math seatwork was simply too difficult for the students.
Fisher et al. (1980) found that when teachers had to give lengthy explanations during seatwork, students made
more errors. Therefore, to improve the students’ accuracy and to maximize the effects of the ACT-REACT
strategy (during intervention and fading) the students should have achieved a success rate of 80% before
engaging in independent practice activities (Rosenshine 1983).
In terms of academic engagement when the ACT-REACT strategic self-monitoring sheet was gradually faded,
the results of this study support those obtained in the ten previous self-monitoring investigations that included
fading in their experimental phases (see Boyle and Hughes 1994; De Haas-Warner 1992; DiGangi et al. 1991;
Edwards et al. 1995; Levendoski and Cartledge 2000; Mathes and Bender 1997; Maag et al. 1993; McDougall
and Brady 1998; Prater et al. 1991, 1992). In this study, all of the students demonstrated markedly improved
levels of academically engaged behavior during fading when data are compared to baseline phases. These
results mirrored those achieved by Edwards and her colleagues and Maag and his colleagues. Four of the five
students (i.e., Joshua, JaShun, Lucy, and Alvin) in our study maintained or continued to increase academically
engaged behavior throughout the fading phases when data are compared to intervention phases. Only one
student in our study, Levi, demonstrated a slight decline in academic engagement during fading phases when
the data are compared with intervention phases. Maag, Reid, and DiGangi posited that the slight decreases in
some of their participants’ academic engagement during fading phases may have been attributed to lack of
sufficient time devoted to gradual cueing withdrawal. They speculated their 6 day fading phase may have been
too brief and suggested a longer cueing period be incorporated into future investigations. Accordingly, Edwards
et al. Levendoski and Cartledge, Mathes and Bender, and McDougall and Brady included longer, more
structured fading approaches in the experimental phases of their research design. Our efforts to provide an
extended fading phase (i.e., 4 school weeks) yielded results similar to those reported by Edwards and her
colleagues. Edwards et al. found that intervention effects were maintained for two of their three subjects when
the self-management intervention was faded and removed. Edwards and her colleagues suggested that for the
one student who showed a decrease in on-task behavior during fading perhaps a more gradual fading approach
was needed to promote success. We agree with their assertion; perhaps Levi would have benefited from a
different and more gradual fading plan.
Also with regard to academic engagement, four of the five students in our study (Joshua, JaShun, Lucy, and
Alvin) experienced slight declines in this behavior when Intervention 1 results are compared with Intervention 2
results. Two explanations for this seem plausible. First, during Intervention 1, the use of the ACT-REACT self-
monitoring technique was novel to the students. In fact, during Intervention 1, after the students received their

ACT-REACT self-monitoring recording sheet, we frequently observed them ―hunkering down‖ and ―assuming
the pose‖ reflected in their self-modeling picture prompt. However, during Intervention 2 and across the five
fading phases, when the novelty apparently diminished, we did not notice the students assuming these
exaggerated poses while they were working. Also, the way we defined engaged behavior may have contributed
to the slight variations in the students’ academically engaged behavior. In our operational definition of
academic engagement, students had to have their eyes on their paper to be scored as engaged. Thus, there may
have been occasions when the students appeared to be off-task when actually they were not. The fact that most
of the students did maintain academic productivity gains during fading phases appears to lend additional
support to this speculation. However, additional research is needed to support these explanations.
The impact of ACT-REACT on students’ academic productivity and accuracy also varied when the intervention
was gradually faded. As we mentioned previously, we found only five studies (see DiGangi et al. 1991;
Edwards et al. 1995; Levendoski and Cartledge 2000; Maag et al. 1993; McDougall and Brady 1998) in which
researchers investigated students’ academic performance during fading conditions and results were also mixed.
In the current study, all of the students demonstrated stable or improved levels of academic productivity during
fading when data are compared to baseline and intervention phases. This finding is most consistent with the
results obtained by McDougall and Brady who reported continued increases in students’ productivity during
fading phases. That said, we need to extend a caution about the students’ continued gains in productivity during
the fading phases of this study. During fading, the nature and content of the independent seatwork changed; all
students were introduced to geometry objectives. When the students were completing these objectives they were
no longer required to perform mathematical calculations or solve story problems every day; instead they were
presented intermittently with tasks in which they simply had to identify points, lines, rays, angles, intersecting,
parallel, or perpendicular lines, as well as faces, edges, and vertices of solids. Thus, they were able to complete
more problems in less time.
Our findings regarding fluctuations in the students’ accuracy are also consistent with previous results obtained
by past self-monitoring researchers. When fading results were compared with intervention effects, Edwards and
her colleagues’ (1995) subjects showed varied levels of improvement on reading comprehension assignments.
While Levendoski and Cartledge’s (2000) four subjects failed to maintain academic performance gains when
the self-monitoring cards were removed. In our study, four of the five students did not maintain academic
accuracy when fading phases are compared with baseline and/or intervention phases of this study. One student,
Alvin, was the exception to this pattern. Alvin, the student who did not have identified or suspected disability,
achieved stability with academic accuracy during fading. Edwards et al. and Levendoski and Cartledge asserted
that such instability in students’ academic accuracy levels may be a direct result of the variations in the
students’ ability levels, interests, frequency of direct and remedial instruction, and stages of learning. We agree.
Like the students in Levendoski and Cartledge’s (2000) study, our participants were introduced continuously to
new math concepts they had not yet mastered. As we noted previously, the Accelerated Math curriculum
produced unlimited practice assignments and tests for each student. Understanding this helps, in part, to explain
the students’ highly variable levels of academic accuracy throughout the study. For example, when students
were given practice assignments to repeatedly perform newly introduced math skills their accuracy was often
very poor (e.g., 10% or 20%). As students gained proficiency and eventually passed the test their accuracy was
much higher (e.g., 80–100%).
An examination of within and across condition trends for each participant supported Edwards et al. (1995) and
Levendoski and Cartledge’s (2000) assertion about the instability in students’ academic accuracy levels. For
instance, Joshua’s academic accuracy remained relatively stable during Baseline 1, Interventions 1 and 2, and
Fading 1 phases of the study when he was presented with seatwork tasks in which he had to add, multiply and
subtract whole numbers, complete word problems, estimate differences and products of whole number by
rounding, and complete word problems. But, his accuracy declined during Baseline 2 and Fading 2, 3, 4, and 5
phases. During these times Joshua was introduced to new material. During Baseline 2 his new objectives
included finding the greatest common factor and the least common multiple of two numbers, simplifying

fractions, finding mixed and reciprocal numbers, and adding like denominator fractions. While during the last
four phases of fading, he was introduced to new content (i.e., simple geometry—finding area, parameter, and so
forth). Similar patterns were observed with JaShun, Lucy, and Levi. As we noted previously, Alvin was the only
student whose academic accuracy remained relatively stable when fading results are compared to the initial
baseline phase.
As can be seen, our findings regarding students’ academic engagement, productivity, and accuracy during
fading phases were mixed. That is, during fading, four of the five students’ levels of academic engagement and
productivity remained relatively stable or improved. But, only one of the student’s levels of academic accuracy
remained stable or continued to improve when fading results are compared with baseline and intervention
phases. While the issue of instructional mismatch and the students’ stages of learning appear to be reasonable
explanations for this, it is also interesting to note that, in this study, the ACT-REACT procedure did not require
students to self-monitor their academic accuracy. Instead they self-monitored their attention (SMA) to the
assigned seatwork task and their productivity (SMP) (i.e., the number of problems completed). The
improvements observed in engagement and productivity may be attributable to the fact that the students self-
monitored these combined target behaviors (see Rooney et al. 1985). Future researchers might wish to include
self-monitoring of academic accuracy and productivity during SMP to determine the effect on students’
performance.
Like McDougall and Brady (1998), students in our study were not stigmatized by their use of the strategic
ACT-REACT self-monitoring procedures/materials. In fact, the non-participating students also expressed a
desire to use ACT-REACT. So, there were several other non-participating students using ACT-REACT during
independent math seatwork in the classroom. The travel alarm we used to cue the students to self-monitor made
a soft beeping sound, but did not disturb the other students. We decided not use electronic vibrating reminder
systems (e.g., WatchMinder® or the MotivAider
®) because they were too costly.
There are several limitations associated with the present study. Much of the data were collected by the
author/researcher. This could be a potential bias, as the researcher was not naïve to the purposes or conditions of
the study. To control for this variable, future studies should consist of the implementation of ACT-REACT on
behalf of practicing teachers and data collection by naïve observers. On a related note, as McLaughlin (1976)
cautioned in a seminal review of the self-control research, the mere presence of the first author and her graduate
students acting as observers may have affected the participants’ behavior. In future investigations of ACT-
REACT, researchers could make use of unobtrusive measures such as videotaping to control for this potential
confound. The attention the students received from the researcher during the brief exchange of materials, before
and after math independent seatwork, could have acted as reinforcement thereby influencing behavior
(McLaughlin 1976). Including more days during the final fading phase or conducting follow-up research could
serve as possible solutions to this problem. Another important consideration is the complexity (SMA + SMP) of
the strategic self-monitoring intervention may not have been necessary. Future research should evaluate simpler
packages or use a component withdrawal design to ―tease out‖ effective components of the ACT-REACT
strategy.
Notwithstanding these limitations, our results confirm prior findings regarding the effectiveness of self-
monitoring to increase students’ academic engagement and productivity in inclusive classrooms. Also the
results of the present study support those obtained by several previous researchers who investigated self-
monitoring during fading conditions and help to underscore the complexities of gradually reducing such
supports with students who have differing needs and abilities. Thus the question emerges: ―Did the students in
this study maintain acceptable levels of academic and behavioral performance during fading conditions?‖ In a
seminal investigation of students’ engaged academic behavior in secondary classrooms, Frederick (1977)
concluded that high achieving students were academically engaged 75% of the time; whereas, students who
were low achieving were academically engaged only 51% of the time. Using these criteria, it seems reasonable
to conclude that during fading, Joshua, JaShun, Levi, and Alvin’s percentage of academically engaged behavior
resembled high achieving students and Lucy’s exceeded low achieving students. Therefore our results lead us to

conclude that ACT-REACT holds promise as an effective self-monitoring strategy allowing students with and
without disabilities in inclusive classrooms to benefit from a single intervention. While by no means definitive,
our results contribute to the accumulated research on self-monitoring, and at the same time raise important new
questions for future investigators to examine.
References
Boardman, A. G., Arguelles, M. E., Vaughn, S., & Klingner, J. (2005). Special education teachers’ views of research-based practices. The Journal of Special Education, 39(3), 168–180.
Boyle, J. R., & Hughes, C. A. (1994). Effects of self-monitoring and subsequent fading of external promotes on the on-task behavior and task productivity of elementary students with moderate mental retardation. Journal of Behavioral Education, 4, 439–457.
Bray, M. A., Kehle, T. J., Spackman, V. S., & Hintze, J. M. (1998). An intervention program to increase reading fluency. Special Services in the Schools, 14, 105–125.
Carr, S. C., & Punzo, R. P. (1993). The effects of self-monitoring of academic accuracy and productivity on the performance of students with behavioral disorders. Behavior Disorders, 18, 241–250.
Cooper, J. O., Heron, T. E., & Heward, W. L. (2007). Applied behavior analysis (2nd ed.). Upper Saddle River, NJ: Pearson Education, Inc.
Dalton, T., Martella, R. C., & Marchand-Martella, N. E. (1999). The effects of a self-management program in reducing off-task behavior. Journal of Behavioral Education, 9, 157–176.
De Haas-Warner, S. D. (1992). The utility of self-monitoring for preschool on-task behavior. Topics in Early Childhood Special Education, 12, 478–495.
DiGangi, S. A., Maag, J. W., & Rutherford, R. B. (1991). Self-graphing of on-task behavior: Enhancing the reactive effects of self-monitoring on on-task behavior and academic performance. Learning Disability Quarterly, 14, 221–230.
Dunlap, G., Clarke, S., Jackson, M., Wright, S., Ramos, E., & Brinson, S. (1995). Self-monitoring of classroom behaviors with students exhibiting emotional and behavioral challenges. School Psychology Quarterly, 10(2), 165–177.
Dunlap, L. K., & Dunlap, G. (1989). A self-monitoring package for teaching subtraction with regrouping to students with learning disabilities. Journal of Applied Behavior Analysis, 22, 309–314.
Edwards, L., Salant, V., Howard, V. F., Brougher, J., & McLaughlin, T. F. (1995). Effectiveness of self-management on attentional behavior and reading comprehension for children with attention deficit disorder. Child & Family Behavior Therapy, 17(2), 1–17.
Ellis, E. S. (1998). Content enhancement series: The framing routine. Lawrence, KS: Edge Enterprise.
Evertson, C., Anderson, C., Anderson, L., & Brophy, J. E. (1980). Relationship between classroom behaviors and student outcomes in junior high mathematics and English classes. American Educational Research Journal, 17(1), 43–60.

Fisher, C. W., Berliner, D. C., Filby, N. N., Mariliave, R., Cahen, L. S., & Dishaw, M. M. (1980). Teaching behaviors, academic learning time, and student achievement: An overview. In C. Denham & A. Lieberman (Eds.), Time to learn. Washington, DC: U.S. Department of Education.
Frederick, W. C. (1977). The use of classroom time in high schools above or below the median reading score. Urban Education, 21, 459–465.
Good, T. L., & Grouws, D. A. (1977). Teaching effects: A process-product study in fourth-grade mathematics classrooms. Journal of Teacher Education, 28(3), 49–54.
Gresham, F. M., MacMillan, D. L., & Bocian, K. M. (1996). Learning disabilities, low achievement, and mild mental retardation: More alike than different? Journal of Learning Disabilities, 29, 570–581.
Harris, K. R. (1986). Self-monitoring of attentional behavior versus self-monitoring of productivity: Effects on on-task behavior and academic response rate among learning disabled children. Journal of Applied Behavior Analysis, 19, 417–423.
Harris, K. R., Friedlander, B. D., Saddler, B., Frizzelle, R., & Graham, S. (2005). Self-monitoring of attention versus self-monitoring of academic performance: Effects among students with ADHD in the general education classroom. The Journal of Special Education, 39, 145–156.
Harris, K. R., Graham, S., Reid, R., McElroy, K., & Hamby, R. S. (1994). Self-monitoring of attention versus self-monitor of performance: Replication and crossing-task comparison studies. Learning Disability Quarterly, 17(2), 121–139.
Hirschi, T. (2004). Self-control and crime. In R. F. Baumeister & K. D. Vohs (Eds.), Handbook of self-regulation: Research, theory, and applications. New York: Guilford Press.
Hogan, S., & Prater, M. A. (1993). The effects of peer tutoring and self-management training on on-task, academic, and disruptive behaviors. Behavioral Disorders, 18, 118–128.
Kame’enui, E. J., Carnine, D. W., Dixon, R. C., Simmons, D. C., & Coyne, M. D. (2002). Effective teaching strategies that accommodate diverse learners (2nd ed.). Upper Saddle River, NJ: Merrill Prentice Hall.
Kazdin, A. E. (1982). Single-case research designs: Methods for clinical and applied settings. New York, NY: Oxford University Press, Inc.
Kerr, M. M., & Nelson, C. M. (2002). Strategies for addressing behavior problems in the classroom (4th ed.). Upper Saddle River, NJ: Merrill Prentice Hall.
Lane, K. L., Wehby, J. H., & Cooley, C. (2006). Teacher expectations of students’ classroom behavior across the grade span: Which social skills are necessary for success? Exceptional Children, 72, 153–167.
Levondeski, L. S., & Cartledge, G. (2000). Self-monitoring for elementary school children with serious emotional disturbances: Classroom applications for increased academic responding. Behavior Disorders, 25, 211–224.
Maag, J. W., Rutherford, R. B., & DiGangi, S. A. (1992). Effects of self-monitoring and contingent reinforcement on on-task behavior and academic productivity of learning-disabled students: A social validity study. Psychology in the Schools, 29, 157–172.

Maag, J. W., Reid, R., & DiGangi, S. A. (1993). Differential effects of self-monitoring attention, accuracy, and productivity. Journal of Applied Behavior Analysis, 26, 329–344.
Mathes, M. Y., & Bender, W. N. (1997). The effects of self-monitoring on children with attention-deficit/hyperactivity disorder who are receiving pharmacological interventions. Remedial and Special Education, 18, 121–128.
McDougall, D., & Brady, M. P. (1998). Initiating and fading self-management interventions to increase math fluency in general education classes. Exceptional Children, 64, 151–166.
McLaughlin, T. F., (1976). Self-control in the classroom. Review of Educational Research, 46, 631–663.
Parmar, R. S., & Cawley, J. F. (1991). Challenging the routines and passivity that characterize arithmetic instruction for children with mild handicaps. Remedial and Special Education, 12, 23–32.
Peterson, L., Young, K. R., & West, R. P. (1999). Effects of student self-management on generalization of student performance to regular classrooms. Education and Treatment of Children, 22, 357–372.
Prater, M. A., Hogan, S., & Miller, S. R. (1992). Using self-monitoring to improve on-task behavior and academic skills of an adolescent with mild handicaps across special and regular education settings. Education and Treatment of Children, 15, 43–55.
Prater, M. A., Joy, R., Chilman, B., Temple, J., & Miller, S. R. (1991). Self-monitoring of on-task behavior by adolescents with learning disabilities. Learning Disability Quarterly, 14, 164–177.
Reid, R. (1996). Research in self-monitoring with students with learning disabilities: The present, the prospects, the pitfalls. Journal of Learning Disabilities, 29, 317–331.
Reid, R., & Harris, K. R. (1993). Self-monitoring of attention versus self-monitoring of performance: Effects on attention and academic performance. Exceptional Children, 60, 29–40.
Renaissance Learning™ Better Data, Better Learning (n.d.). Retrieved July 12, 2002, from http://www.rrenlearn.com/am & http://www.renlearn.com/ar/howitworks.htm
Rock, M. L. (2004). Transfiguring it out: Converting disengaged learners into active participants. Teaching Exceptional Children, 36, 64–72.
Rock, M. L. (2005). Use of strategic self-monitoring to enhance academic engagement, productivity, and accuracy of students with and without disabilities. Journal of Positive Behavioral Interventions, 7, 3–17.
Rooney, K. J., Polloway, E. A., & Hallahan, D. P. (1985). The use of self-monitoring procedures with low IQ learning disabled students. Journal of Learning Disabilities, 18, 384–389.
Rosenshine, B. (1983). Teaching functions in instructional programs. The Elementary School Journal, 83(4), 335–351.
Rosenshine, B. (1986). Synthesis of research on explicit teaching. Educational Leadership, 43, 60–69.
Schuum, J. S., & Vaughn, S. (1995). Getting ready for inclusion: Is the stage set? Learning Disabilities Research and Practice, 10, 169–179.

Shimabukuro, S. M., Prater, M. A., Jenkins, A., & Edelen-Smith, P. (1999). The effects of self-monitoring of academic performance on students with learning disabilities and ADD/ADHD. Education and Treatment of Children, 22, 397–414.
Trammel, D. L., Schloss, P. T., & Alper, S. (1994). Using self-recording, evaluation, and graphing to increase completion of homework assignments. Journal of Learning Disabilities, 27, 75–81.
Vaughn, S., Levy, S., Coleman, M., & Bos, C. S. (2002). Reading instruction for students with LD and EBD: A synthesis of observation studies. The Journal of Special Education, 36, 2–13.