the effects of learning styles and socio-economic status
TRANSCRIPT

The Effects of Learning Styles and Socio-economic Status on Learning Achievement of Secondary School Students
By
Zarina Akhtar
A THESIS SUBMITTED IN PARTIAL FULFILLMENT OF
THE REQUIREMENTS FOR THE DEGREE OF
DOCTOR OF PHILOSOPHY
In Education
To
FACULTY OF ADVANCED INTEGRATED STUDIES AND RESEARCH
NATIONAL UNIVERSITY OF MODERN LANGUAGES, ISLAMABAD
September 2010
© Zarina Akhtar, 2010
ii
Name of Student
Degree Name in Full (e.g Master of Philosophy, Doctor of Philosophy)
Name of Discipline
Name of Research Supervisor Signature of Research Supervisor
Name of Dean (FAISR) Signature of Dean (FAISR)
Name of Rector Signature of Rector
DISSERTATION AND DEFENSE APPROVAL FORM
The undersigned certify that they have read the following thesis, examined the defense, are satisfied with the overall exam performance, and recommend the thesis to the Faculty of Advanced Integrated Studies & Research for acceptance: Thesis/ Dissertation Title: The Effects of Learning Styles and Socio-economic Status on Learning Achievement Of Secondary School Students Submitted By: Zarina Akhtar Registration #: 305-Ph.D/Edu/2005
Doctor of Philosophy Education Dr. Hamid Khan Niazi ______________________________ Dr. Shazra Munawar ______________________________ Brig. (R) Dr. Aziz Ahmed Khan ______________________________
_______________________ Date

iii
Thesis Submission Approval Form (SUPERVISOR)
of a thesis The Effects of Learning Styles and Socio-economic Status on Learning Achievement of Secondary School Students Submitted by ZARINA AKHTAR 305-Ph.D/Edu/2005___ Education___
Registration No Discipline
Candidate for the degree of DOCTOR OF PHILOSOPHY
This thesis has been read by me and has been found to be satisfactory regarding content, English usage, format, citations, bibliographic style, and consistency, and thus fulfils the qualitative requirements of this study. It is ready for submission to the Faculty of Advanced Integrated Studies and Research for internal and external evaluation. Dr Hamid Khan Niazi_____ _______________________ Name of Supervisor Signature of Supervisor _____________________
Date

iv
CANDIDATE DECLARATION FORM
I Zarina Akhtar Daughter of Ghulam Muhammad Registration No. 305-Ph.D/Edu/2005
Discipline Education Candidate of Doctor of Philosophy in Education at the National University of Modern
languages do hereby declare that the thesis The Effects of Learning Styles and Socio-
economic Status on Learning Achievement of Secondary School Students submitted by
me in partial fulfillment of PhD degree in discipline/Department Education is my original
work, and has not been submitted or published earlier. I also solemnly declare that it shall
not, in future, be submitted by me for obtaining any other degree from this or any other
university or institution.
I also understand that if evidence of plagiarism is found in my thesis/dissertation at any stage,
even after the award of a degree, the work may be cancelled and the degree revoked.
______________________
Signature of candidate
_ Zarina Akhtar_____ Name of Candidate September 29th , 2010 Date
CANDIDATE UNDERTAKING FORM
v
I Zarina Akhtar Daughter of Ghulam Muhammad Registration No. 305-Ph.D/Edu/2005
Discipline Education Candidate of Doctor of Philosophy in Education at the National University of Modern Languages do hereby declare that the thesis The Effects of Learning Styles and Socio-economic Status on Learning Achievement of Secondary School Students strictly adheres to the Plagiarism instructions given by NUML and HEC, and is therefore:
i. my original work, and not jointly produced ii. not plagiarized as per definition of the process given by the HEC/NUML iii. written in academically correct English iv. written in literary language
__Zarina Akhtar____ _____________________ Name of student Signature of student September 29th , 2010 Date

vi
DEDICATED TO
MY FAMILY AND FRIENDS, WHO HELPED, PRAYED AND ENCOURAGED ME IN THE COMPLETION OF THIS STUDY

vii
ACKNOWLEDGEMENTS
All Glory be to Allah Who enabled me to compete this research work.
It gives me an immense pleasure to pay my special gratitude to those who contributed
their sincere efforts in the accomplishment of this research work in one way or the other.
Without their contribution and collaboration, perhaps this dream would have not turned into
reality.
Undoubtedly, the name of my adviser Dr. Hamid Khan Niazi, Chairperson,
Educational Planning, Policy Studies and Leadership (EPPSL) deserves to be at the top of the
inventory. Actually, I have in words of thanks to represent my inner feelings and regards that
I cherish for him. He always received me open heartedly. I always found him agreeable,
sympathetic and friendly in his dealings. He never showed any indifference towards me even
in the most inconvenient times. It was only and only through his skillful guidance, honest
and sincere devotions and lovable posture that always encouraged and enabled me to achieve
this overwhelming task. I, from the core of my, heart extend thanks to him.
The researcher is highly indebted to Prof. Dr. Shizra, Dean Faculty of Education,
Allah Buksh, Head of the Department of Education and all the faculty members of Education
Department, NUML for their keen interest towards the in time completion of the study.
The researcher also acknowledges the sincere efforts of her friends Asma and Prof.
Minhaj ud Din Ahmed who assisted her in the administration of the research instruments and
the researcher is also particularly thankful to all teachers and students who responded
willingly to the research questions.
Zarina Akhtar

viii
ABSTRACT
Title: The Effects of Learning Styles and Socio-economic Status on Learning Achievement of Secondary School Students
The objectives of the study were to investigate the relationship between different learning
styles and learning achievements, socio-economic status of students and their learning
achievement and learning styles and Socio-economic status of students studying at secondary
schools. Study also assessed the difference in opinion by gender and by region about
learning styles.
To investigate the relationship three types of data were collected. Firstly information
about students learning styles were collected by using learning style questionnaire, secondly
information about socio-economic status of parents were collected through the questionnaire
and thirdly information about students’ achievement was taken from their Secondary School
Certificate Examination.
The population of the study was all students studying in class 10th at public sector
schools of district Attock, Chakwal, Islamabad and Rawalpindi. The sample (1580 students
and their parents) was drawn by using multistage sampling technique from four districts. The
data were collected by administering the questionnaires to students in their classes. The data
were then analyzed by SPSS using Pearson Co-relation. Gender wise and region wise
differences in opinion were also computed by t-test.
It was found that A+ grade achievers did not preferred collaborative learning style and
A grade achievers did not preferred dependent learning style. None of the students from
upper and lower class got A+ grade. The more students who got A+ grade were from the upper
middle class and lower middle class. The middle class students prefer independent learning
style. The female students prefer dependent learning style in spite of region (rural and urban).
No difference in opinion by region was observed.
Students did not preferred collaborative and dependent learning style. They preferred
to study at their own this leads that the class room activities were of no use for them. Their
concern for the achievement showed their interest for examination. This showed that learning
styles may not effect learning achievement but the system of examination effects the
achievement. In the light of conclusions it was recommended that the system of examination
may be connected with class room activities. It may focus on real classroom learning not to
rote memorization.

ix
LIST OF CONTENTS
CHAPTERS Page no
1. INTRODUCTION
1.1. Rationale of the study --------------------------------------------------------------01
1.2. What Learning Styles are?---------------------------------------------------------02
1.3. Learning Styles by gender---------------------------------------------------------03
1.4. Diversity within Learning Styles--------------------------------------------------04
1.5. How Socio-economic Status be perceived---------------------------------------05
1.6. Diversity in Socio-economic Status----------------------------------------------06
1.7. Learning achievement--------------------------------------------------------------07
1.8. Relationship between Learning Styles and Learning Achievement----------08
1.9. Relationship between Socio-economic Status and Learning Achievement--09
1.10. Relationship of Socio-economic Status and Learning Styles-----------------10
1.11. Statement of the problem----------------------------------------------------------11
1.12. Objectives of the study-------------------------------------------------------------12
1.13. Research Questions of the study--------------------------------------------------12
1.14. Significance of the study ----------------------------------------------------------13
1.15. Delimitation of the study ----------------------------------------------------------14
1.16. Conceptual Framework ------------------------------------------------------------15
2. REVIEW OF LITERATURE
2.1. Piaget’s Theory for Cognitive development------------------------------------18
2.1.1. Schema----------------------------------------------------------------------18
2.1.2. Assimilation----------------------------------------------------------------19
2.1.3. Accommodation------------------------------------------------------------19

x
2.2. Vygotsky Socio-cultural perspective of cognitive development-------------21
2.3. Bruner’s Theory of discovery Learning-----------------------------------------23
2.4. What is learning?-------------------------------------------------------------------25
2.5. Learning theories-------------------------------------------------------------------28
2.5.1. Behavioristic learning theory--------------------------------------------29
2.5.2. Humanistic Learning Theory---------------------------------------------31
2.5.3. Cognitive learning theory------------------------------------------------32
2.6. Definition of Learning Styles-----------------------------------------------------36
2.7. General Concepts of Learning Style---------------------------------------------37
2.8. Difference between cognitive style and learning style------------------------40
2.9. Theories of learning styles--------------------------------------------------------41
2.10. Learning style Models-------------------------------------------------------------43
2.10.1. Instructional and environmental preferences models -----------------43
a) Dunn & Dunn’s Model-------------------------------------------43
b) Jhon Holand's model----------------------------------------------47
c) Schmeck, Ribich and Ramanaiah model-----------------------50
d) Aggarwal Learning Style Inventory----------------------------51
2.10.2. Social Interaction Model--------------------------------------------------51
a) Grasha & Reichmann Learning Model-------------------------52
b) Marcia Baxter-Magolda’s Model-------------------------------56
2.10.3. Information Process Model-----------------------------------------------57
a) Kolb’s Learning Style Inventory---------------------------------57
b) Honey and Mumford Learning Style----------------------------59
c) Anthony Gregorc’s style Delineator-----------------------------61
2.10.4. Cognitive and Personality Model----------------------------------------66

xi
a) The Felder & Silverman Learning Style Model----------------66
2.11. Comparison of Eleven Major Learning Styles Models------------------------67
2.11.1 Dunn and Dunn: Learning Style Inventory (Grades 3-12)
and Productivity Environmental Preference Survey (Adult)-------70
2.11.2 National association for Secondary School Principals (NASSP)---72
2.11.3 HILL: Cognitive Style Profile-------------------------------------------74
2.11.4 LETTERI: Cognitive Style Delineators--------------------------------75
2.11.5 RAMIREZ: Child Rating Form-----------------------------------------77
2.11.6 REINERT: Edmonds Learning Style Identification Exercise-------78
2.11.7 SCHMECK: Inventory of Learning Processes------------------------79
2.11.8 HUNT: Paragraph Completion Method--------------------------------81
2.11.9 KOLB: Learning Style Inventory---------------------------------------82
2.11.10 GREGORC: Gregorc Style Delineator--------------------------------83
2.11.11 McCARTHY: 4 MAT SYSTEM--------------------------------------84
2.11.12 CONCLUSION----------------------------------------------------------86
2.12 Assessment of Learning Styles---------------------------------------------------89
2.13 Teaching Styles---------------------------------------------------------------------91
2.14 Anthony F. Grasha the Author of the learning style questionnaire----------94
2.15 The original questionnaire of Grassha & Riechmann--------------------------96
2.16 General Concept of achievement-------------------------------------------------96
2.16.1 What is achievement------------------------------------------------------96
2.16.2 Types of achievements---------------------------------------------------97
2.16.3 Measuring learning achievements--------------------------------------98
2.17 Institutions Responsible for measuring Learning Achievement------------103
2.18 The process of standardization of Instruments adopted by BISE’s---------106

xii
2.19 Factors affecting the learning achievement-------------------------------------107
2.20 Learning Style and Achievement-------------------------------------------------108
2.21 Social Differentiation and Social stratification; Status and Class------------111
2.22 Social class theories----------------------------------------------------------------115
2.22.1 Karl Marx Class and Capitalism-----------------------------------------116
2.22.2 Max Weber: Class Status and Party-------------------------------------117
2.22.3 Theory of Functionalism--------------------------------------------------118
2.22.4 The Conflict Theory-------------------------------------------------------119
2.23 The measurement of class position in open class societies -------------------120
2.23.1 The “style of life” approach ------------------------------------120
2.23.2 The Reputational Approach-------------------------------------121
2.23.3 The Subjective Approach---------------------------------------122
2.23.4 The Occupational Prestige Approach --------------------------122
2.23.5 The Multiple Index Approach -----------------------------------123
2.24 Determinants of the social class--------------------------------------------------123
2.25 Class structures in various societies----------------------------------------------126
a) The UK---------------------------------------------------------------127
b) The USA-------------------------------------------------------------129
c) China-----------------------------------------------------------------130
d) France----------------------------------------------------------------131
e) Japan------------------------------------------------------------------132
f) India------------------------------------------------------------------132
g) Iran-------------------------------------------------------------------133
2.26 Social Class and Achievement----------------------------------------------------137
2.27 Effects of Social Class on Education --------------------------------------------138

xiii
2.28 Demographic variables of sampled districts------------------------------------139
2.29 Formation of status class for current study--------------------------------------140
2.30 Related researches------------------------------------------------------------------143
2.31 Summary of the whole discussion------------------------------------------------154
3. METHODLOGY AND PROCEDURE 3.1 Research Design and Methodology----------------------------------------------159
3.2 Demographic variables of sampled districts------------------------------------159
3.3 Population---------------------------------------------------------------------------160
3.4 Sampling design--------------------------------------------------------------------161
3.5 Instruments--------------------------------------------------------------------------164
3.5.1. Learning Style Scale Questionnaire-------------------------------------165
3.5.2. Detail of the questionnaire for the study-------------------------------167
3.5.3 Socio-Economic Status (SES) Scale Questionnaire------------------168
3.6 Validity and Reliability of Instruments------------------------------------------168
3.7 Socio-economic status Questionnaire Codes------------------------------------172
3.8 Data Collection----------------------------------------------------------------------173
3.9 Data Analysis -----------------------------------------------------------------------173
3.10 Limitations---------------------------------------------------------------------------174
4. DATA ANALYSIS AND INTERPRETATION
4.1 Formation of Status class----------------------------------------------------------175
4.2 Socio-economic status groups ---------------------------------------------------176
4.3 Academic Achievement grade----------------------------------------------------178
4.4 Relationship of learning styles and learning achievement--------------------183

xiv
4.5 Relationship of Socio-economic status and learning achievement----------192
4.6 Relationship of Socio-economic status and learning styles-------------------207
4.7 Difference in opinion about learning styles by gender------------------------214
4.8 Difference in opinion about learning styles by region-------------------------218
4.9 difference in opinion about learning styles of rural students by gender-----221
4.10 difference in opinion about learning styles of urban students by gender----224
5. SUMMARY, FINDINGS, CONCLUSIONS AND
RECOMMENDATIONS Page no
5.1 Summary-----------------------------------------------------------------------------229
5.2 Findings------------------------------------------------------------------------------230
5.2.1. Findings based on the descriptive statistics----------------------------231
5.2.2. Findings based on the analysis of relationship
between learning styles and achievement ------------------------------231
5.2.3. Findings based on the analysis of relationship between
Socio-economic Status (SES) and achievement-----------------------233
5.2.4. Findings about the relationship between Learning Styles
and Socio-economic (SES) groups--------------------------------------235
5.2.5. Findings about the opinion for Learning Styles by gender----------236
5.2.6. Findings about the learning style by Region---------------------------236
5.3 Conclusions--------------------------------------------------------------------------237
5.4 Discussion---------------------------------------------------------------------------239
5.5 Recommendations------------------------------------------------------------------247
5.6 Replications--------------------------------------------------------------------------251
BIBLIOG RAPHY--------------------------------------------------------------------------253

xv
APPENDICES-------------------------------------------------------------------------------270
LIST OF TABLES
Table No Title of Table Page no
2-1 The models of learning styles and elements of those models--------069
2-22-1 Breakdown of social classes according to obtained scores-----------143
3-1 Total Number of Secondary Schools in district Attock, Chakwal,
Islamabad and Rawalpindi------------------------------------------------161
3-2 Sample of the study by schools and students included in the study162
3-3 Response rate from sampled student’s by district --------------------163
3-4 Response rate by gender --------------------------------------------------163
3-5 Response rate by region---------------------------------------------------164
4-1 Breakdown of social classes according to obtained scores-----------176
4-2 Distribution of students by grades included in the study ------------178
4-3 Distribution of respondents of each SES group in respective
grades-----------------------------------------------------------------------180
4-4 Distribution of respondents of developed districts in each SES
groups and respective grades --------------------------------------------181
4-5 Distribution of respondents of under-developed districts in each
SES groups and respective grades---------------------------------------182
4-6 Relationship between A+ grade achievers and their learning
styles-----------------------------------------------------------------------183
4-7 Relationship between “A” grade achievers and their learning
styles------------------------------------------------------------------------184
4-8 Relationship between “B” grade achievers and their learning

xvi
styles------------------------------------------------------------------------185
4-9 Relationship between “C” grade achievers and their learning
styles------------------------------------------------------------------------186
4-10 Relationship between “D” grade achievers and their learning
styles------------------------------------------------------------------------187
4-11 Relationship between “E” grade achievers and their learning
styles------------------------------------------------------------------------188
4-12 Relationship among different learning styles and Pearson’s value
of students achievements by grades -----------------------------------189
4-13 Relationship among different learning styles and Pearson’s value
of students achievements by grades of respondents of developed
districts----------------------------------------------------------------------190
4-14 Relationship among different learning styles and Pearson’s value
of students achievements by grades of respondents
of under-developed districts----------------------------------------------191
4-15 Relationship between A+ grade achievers and different SES
groups-----------------------------------------------------------------------192
4-16 Relationship between “A” grade achievers and different SES
groups------------------------------------------------------------------------194
4-17 Relationship between “B” grade achievers and different SES
groups-----------------------------------------------------------------------196
4-18 Relationship between “C” grade achievers and different SES
groups-----------------------------------------------------------------------198
4-19 Relationship between “D” grade achievers and different SES

xvii
groups-----------------------------------------------------------------------200
4-20 Relationship between “E” grade achievers and different SES
groups-----------------------------------------------------------------------202
4-21 Relationship among different SES groups and Pearson value of
students achievements by grades ---------------------------------------204
4-22 Relationship among different SES groups and Pearson value of
students achievements by grades of respondents of developed
districts----------------------------------------------------------------------205
4-23 Relationship among different SES groups and Pearson value of
students achievements by grades of respondents
of under-developed districts----------------------------------------------206
4-24 Relationship between “upper class” and learning styles-------------207
4-25 Relationship between “upper middle class” and learning
styles------------------------------------------------------------------------208
4-26 Relationship between “middle class” and learning styles------------209
4-27 Relationship between “lower middle class” and learning
styles------------------------------------------------------------------------210
4-28 Relationship between “lower class” and learning styles-------------210
4-29 Relationship among different Learning Styles and Pearson’s
value of different SES groups-------------------------------------------211
4-30 Relationship among different Learning Styles and Pearson’s
value of different SES groups of respondents of developed
districts---------------------------------------------------------------------212
4-31 Relationship among different Learning Styles and Pearson’s

xviii
value of different SES groups of respondents of under-developed districts-----
-----------------------------------------------------------------213
4-32 Opinion about Independent learning style by gender----------------214
4-33 Opinion about Dependent learning style by gender------------------215
4-34 Opinion about Collaborative learning style by gender---------------215
4-35 Opinion about Competitive learning style by gender-----------------216
4-36 Opinion about Avoidant learning style by gender---------------------216
4-37 Opinion about Participant learning style by gender-------------------217
4-38 Opinion about Independent learning style by region------------------218
4-39 Opinion about Dependent learning style by region--------------------218
4-40 Opinion about Competitive learning style by region------------------219
4-41 Opinion about Collaborative learning style by region----------------219
4-42 Opinion about Participant learning style by region--------------------220
4-43 Opinion about Avoidant learning style by region----------------------220
4-44 Opinion of rural students about independent learning style by
gender------------------------------------------------------------------------221
4-45 Opinion of rural students about dependent learning style by
gender------------------------------------------------------------------------221
4-46 Opinion of rural students about collaborative learning style by
gender------------------------------------------------------------------------222
4-47 Opinion of rural students about competitive learning style by
gender------------------------------------------------------------------------222
4-48 Opinion of rural students about avoidant learning style by
Gender-----------------------------------------------------------------------222
4-49 Opinion of rural students about participant learning style by

xix
gender-----------------------------------------------------------------------223
4-50 Opinion of urban students about independent learning style by
gender-----------------------------------------------------------------------224
4-51 Opinion of urban students about dependent learning style by
gender-----------------------------------------------------------------------224
4-52 Opinion of urban students about collaborative learning style by
gender------------------------------------------------------------------------225
4-53 Opinion of urban students about competitive learning style by
gender------------------------------------------------------------------------225
4-54 Opinion of urban students about avoidant learning style by
gender------------------------------------------------------------------------226
4-55 Opinion of urban students about participant learning style by
gender------------------------------------------------------------------------226
4-56 The effect size of the learning style of rural students measured
by Chon’s D formula------------------------------------------------------227
4-57 The effect size of the learning style of urban students measured
by Chon’s D formula------------------------------------------------------227

xx
LIST OF FIGURES
Figure No Title of Figure Page no
1-1. The conceptual frame work of the study------------------------015
3-1 Sample Design of the study---------------------------------------162

xxi
LIST OF GRAPHS
Graph No Title of Graph Page no
1 Achievement of the respondents at secondary level-------------- ----177 2 Achievement of respondents by grades---------------------------------179 3 A+ Grade achievement by the respondents in each SES group-------193
4 A Grade achievement by the respondents in each SES group--------195 5 B Grade achievement by the respondents in each SES group--------197 6 C Grade achievement by the respondents in each SES group--------199 7 D Grade achievement by the respondents in each SES group--------201 8 E Grade achievement by the respondents in each SES group--------203

xxii
LIST OF ACRONYMS
Socio-economic Status SES Learning achievement A+, A, B, C, D, E Grades Learning Style Inventory LSI Reading Style Inventory RSI Learning Style Profile LSP Federal Board of Intermediate and Secondary Education FBISE Board of Intermediate and Secondary Education BISE Pakistan Social and Living Standard Measurement Survey PSLSMS Executive District Office EDO Secondary School Certificate SSC Statistical Package for Social Sciences SPSS

CHAPTAR 1
INTRODUCTION
1.1 Rationale of the study
Life from its start to end is learning. Learning continues since the start to the end
of life. The concept of learning is as old as development. The aim of education is the
development of six aspects of the personality. These six aspects of personality
development are physical, mental, social, spiritual, esthetic and emotional. Development
is associated with achievement so the ultimate goal of learning is achievement.
According to Dictionary of Education (2002, p.5) achievement is “successful
accomplishment or performance in particular subject or course or area of study”. Many
educationist and psychologists tried since long to know the ways and means of learning
and to maximize the achievement. These ways of learning were identified as learning
styles and means of learning were the opportunities provided by the environment either
by school or by parent. These parental factors were distinguished as socio-economic
status. So the learning styles and the socio-economic status are two important
components which maximize learning achievement.
To maximize learning the efforts of all the concerned persons were remained
continued as the life goes on. The contributions of psychologist were remarkable for
understanding the process of learning. Their contributions were started from Behaviorists
to Humanists and then to Cognitivists; all of them described the learning theories. Every
one was trying to define the concept of learning, the nature of learning. How learning
takes place? How individual learns? Which factors influence the learning process? Which

2
factors effects academic achievement? What physical and mental changes came as the
result of learning? Which steps should be followed to be a learned person? Every
psychologist perceives the process of learning in a different way. Those different ways of
learning were called learning theories. The learning theories gave new and diverse
directions to study the process of learning without discarding the previous. According to
the Parson, Hinson & Sardo-Brown, (2001, p.207) “the beliefs of all presented learning
theories are seeds of their theories. They should be acknowledged for their belief but it
should be kept in mind that theories are reasoned explanations for phenomena and not the
absolute fact and there is much more beyond theses theories of learning”.
1.2 What Learning Styles are?
The learning theories provide the base for learning styles. Learning styles are
relatively stable preference used by each individual to organize and process information
for solving a problem in a learning task. According to Feldman (2004, p.35) “learning
style reflects our preferred manner of acquiring, using and thinking about knowledge”.
When a situation has been faced by a person it is his learning style which leads him to
acquire, retain and use knowledge to handle that situation. Every one has different way to
handle the situation. Felder (2005, p.58) said that “students are characterized by different
learning styles preferentially focusing on different types of information and tending to
operate on perceived information in different ways”.
In simplest term a student’s learning style is a particular way with which a student
learns the best. Although the researchers have defined learning style in their own
perspective but all are agreed that it refers to individual characteristic of learning

3
behavior which is pervasive and consistent in nature. There are many learning styles
based on the individual differences or these individual differences reflect different
learning styles in human personality. This shows the diversity in learning styles.
1.3 Learning Styles by Gender
Learning styles are the reflections of individual differences or preferences among
learners, which impact learning. Male and female students possess biological, social,
psychological and emotional differences. There are variety of responses in students’
perception, thinking, feeling and acting even in one gender. There may be variety of
differences in different genders. The research shows the male students possess different
learning styles then female students. Verma and Tiku (1989) conducted a study on the
learning styles of male and female students. They found male and female students are
similar on independent, dependent, avoidant, collaborative and competitive learning
styles and different on participant learning style. The female students have strong
preference for participant learning style. Verma and Kumari (1988-89) also conducted a
study on learning style differences by gender and result showed that female students tend
to have relatively more preference of field-independent and environment oriented
learning style than male counter part. Similarly some other researchers i.e.
Chohen (1986) and Sing (1987) studied the learning styles of male and female students
by using different tools. They have also reported gender differences in learning styles.

4
1.4 Diversity with in Learning Styles
Learning Styles appears to be biological and perhaps, social differences that
influence the classroom learning in particular and life long learning in general. These
styles reflect qualitative differences or preferences. They do not reflect how smart
students are or how well the students are developed cognitively. According to
Felder and Spurlin (2005) there are many types of learning styles such as psychological
styles, physiological styles and cognitive styles.
Psychological Styles
The student’s inner strength, sense of individuality and personality traits (social
and emotional traits) influences their learning. The self perception and self-esteem also
affected the learning. All these factors together are called psychological styles. The
example of this style is Myers-Briggs Type Indicator. (Houston, 1997; Avitabile, 1998;
Wilson, 1998; Parsons & colleagues, 2001).
Physiological Styles
There are consistent ways to facilitate learning through the use of the senses or
environmental stimuli. Hemispheric specializations (right or left brain), auditory, visual,
kinesthetic, olfactory preferences, or preferences for environmental conditions, e.g. light,
noise are examples of physiological styles. The examples of Physiological style are
Holand's Model (1974), Kolb’s Learning Style (1976), Dunn and Dunn's Model (1978),
etc.
Cognitive Styles
There are consistent ways of responding and using stimuli in the environment;
how things are perceived and made sense of; which is the most comfortable, expedient,

5
and pleasurable way to process information. For example students may utilize field-
dependent or independent style (Aggarwal Styles (1983)), impulsive or reflective styles
(Honey and Mumford Learning Style (1986)) etc.
The more students grow, the more sophisticated they become, but every one has
preferred styles or ways of learning. Students’ preferred styles of learning influence their
achievement. The environment includes two aspects: the school environment and the
home environment. School environment further has two components classroom inner
environment and out of class school environment Charles (2002). Classroom
environment has curriculum, teacher’s instruction, teaching methodology, students’
teacher and peers’ relationship. The out of class environment provides the opportunity to
participate in other co-curricular activities create the sense of participation, co-operation
and competition. Learning styles may emerge form school and home environment Slavin
(1995). The school environment provides facility to students to interact with teachers’,
peers’, learning activities and system, during the process of learning, where as home
environment or socio-economic status of parents provides basic needs and different
opportunities to promote learning.
1.5 How Socio-economic Status (SES) be perceived?
The home environment has direct focus on parents. Because they are responsible
to built and manage it. Home environment influenced by many factors such as parent
education, job, attention and income. All these factors together called Socio-economic
Status (SES). So the other factor which may affect students learning achievement is the
SES of parents.
6
According to Parson, Hinson and Sardo-Brown (2001, p.193), “Socio-economic
Status (SES) is the term used to distinguish between people’s relative position in the
society in terms of family income, political power, educational background and
occupational prestige”. The SES often described by social classes or groups.
Internationally as defined by Socio-economic Classification (2004, p.13) these social
classes are distributed in to five categories, such as “upper class”, “upper middle class”,
“middle class”, “lower middle class” and “lower class”. There are some variations in
class structure but most of the time this five class structure is used.
1.6 Diversity in Socio-economic Status
SES groups or classes are determined through various aspects all over the world.
It varies because of the individual differences no one is similar to any one by any of
aspect. Some try hard earn more and some earn less. At any corner of the world people
earn at different rate and enjoy different socio-cultural positions. Every country has
defined criterion for measuring and valuing the positions of their citizens. These positions
further wrapped as SES. The margins between SES groups are settled according to the
local situation of the country. Along with it an internationally defined criterion is also
available given by Socio-economic Classification (2004, p.13). According to that
criterion the SES described via stratified groupings.
The Socio-economic Classification further described by Macionis (1994) quoted
by Parson, Hinson and Sardo-Brown (2001, p.193), the families with an income in excess
of $100,000, and enjoy broad political power, who possess college and professional
degrees, and who has large family business are categorized at the top of the hierarchy or
7
“upper class”. Families earning between $40,000-100,000/annum, and hold power in
state and local politics, with having at least high/higher school education and white collar
or skilled labor jobs are a part of the “upper middle class”. The “middle class” families
earn between $25,000-40,000/annum.
Parson, Hinson and Sardo-Brown (2001, p.193) further described some families
are considered part of working class or “lower middle class”. Lower middle class have
income between $12,000-25,000/annum, having limited local power, high school degree
and blue collar jobs. The others are categorized as “lower class” they lived below the
poverty line. They earn below $12,000/annum and no political voice.
1.7 Learning Achievement
Achievement is what one can do; which added value made a tangible or notice-
able difference and contribute toward the advancement of the person. Achievement is
measured by performance indicators like percentiles and ranks. Learning achievement
means gain in knowledge. It is a successful performance on a specific task. According to
the Dictionary of Education (2002, p.5), “achievement is successful accomplishment or
performance in particular subjects, areas, or courses, usually by reasons of skill, hard
work and interest. Achievement is typically summarized or measured in various types of
grades, marks, scores or descriptive commentary”.
The ultimate goal of all the efforts of psychologists and educationists is to
maximize learning achievement from the minimum resources. The developed countries
focused on achievement for their further developments and advancements whereas the

8
developing and under developed countries also focuses on it to save their resources from
wastage and get maximum from the available resources.
1.8 Relationship between Learning Styles and Learning Achievement
The one reason of the failure during academic life is that students cannot apply
what they have learned during their academic life to the world in which they live. Many
students failed to explain everyday phenomena by using concepts they have learned
during their educational training. This is not due to the lack of knowledge, because all the
students attend 180-200 school days interacting with lectures and practical activities and
they are also evaluated on what they have been taught and what have learned. Bonder
(1991) concluded it as “students all too often posses knowledge without understanding”.
According to Ashkenazi (2006), the problem is not just the lack of ability to
transfer domain specific knowledge into everyday life. Evidence shows that the
individuals acquired knowledge is fragmented and is unreliable. Many students do not
tried to concentrate on acquired knowledge so they are unable to understand the basic
concepts from the very beginning of their studies. Research of Nakhleh, (1992) shows
that students’ constructions of a concept sometime differ from that one the teacher holds
and tried to present. Different kinds of misconceptions can be identified when students
are asked to explain their own views of established concepts. When explored the
students’ cognitive structure these misconceptions interfere with subsequent conceptual
learning. But this lack of conceptual understanding does not interfere with the students’
ability to perform well in problem solving situation. In a study conducted by Sawrey
(1990) “concept learning versus problem solving” students were asked to answer two
9
questions that rely on the same concept. The first was a numerical problem solved by
using mathematical formula; the second was a conceptual question which has no formula
associated with it. Only 31% gave a correct answer to the second (conceptual) question,
and 88% solved correctly the first one. This shows that most of the student learn to use
formula for solving problems without having an understanding of the underlying concept.
The discussion may be concluded in this way that all the students in a class did
not possess and follow the same way of learning. This forced to acknowledge that
different students preferred different learning styles. These different learning styles effect
their learning achievement. Verma and Sherma (1987) conducted a study on “academic
achievement in relation to learning styles of adolescents” The major findings were the
group of students have participant learning style has better performance in the total area
of the study than the group having avoidant learning style. Another study conducted by
Dunn (1989) on “Grouping students for instruction: effect of learning style on
achievement and attitude”. The results revealed that the learning style has positive effect
on the achievement and attitude as the students preferred learning alone performed
significantly better in the learning alone condition and the students preferred learning
with peers performed significantly better in the learning with peer condition.
1.9 Relationship between Socio-economic Status and Learning Achievement
Socio-economic status is an important variable which may effect learning
achievement. According to Dictionary of Education (2002, p.864), Socio-economic
Status (SES) can be defined as “the background or standing of one or more persons in the
society on the basis both of social class and financial situation”. The high Socio-

10
economic Status (SES) families provide more resources for learning experience to their
children. The financially and socially stable parents may provide better opportunities for
learning experiences.
Mirza in (2001) study the “relationship of socio-economic status with
achievement” and found socio-economic status of students has fairly significant effect on
their achievement. Some other research studies shows that children from high SES group
earn higher achievement test scores, better grades and stay in school longer than the
children from low SES group.(Reed & Sautter, 1990; Knapp & Shields, 1990). It was
concluded on the bases of the findings of different research studies that there is positive
correlation between low SES and lower self-esteem, ability or readiness and school
oriented resources; and negative correlations between low SES and learned helplessness,
achievement test scores, the dropout rate and discipline problems (Rice, 1993; Dodge,
Pettit & Bates, 1994). It was also observed that many students who are academically able
to continue their studies fail to do so because of the low income status of their families
(Jordan & Plank, 1998).
1.10 Relationship of Socio-economic Status and Learning Styles
Students from different SES groups have different facilities at home and schools.
It is universally true that a class has three types of students the high achievers, average
and low achievers. Although they learn in same class, but the learning outcomes are
different according to their personal experiences.
Verma & Sheikh (1992) conducted a study on “learning styles of advantaged and
disadvantaged students”. They used Socio-economic Status questionnaire of Koul for the
11
classification of advantaged and disadvantaged groups. The result showed that the
students from advantaged group have more preference for independent and participant
learning styles than the students from disadvantaged group. It provides the base to study
the relationship of learning styles and SES.
Pakistani familial setup reflects diverse socio-economic status. This status may
effect the learning achievement of students. So far there had been no enough research
done to figure out the relationship between learning style, socio-economic status and
learning achievement. The relationship between these three factors is the back bone of the
education system as the whole system revolves around the input (socio-economic status),
process (learning style) and out put (learning achievement). In the light of previous
discussion the current study is designed to identify the effects of learning style and its
relationship to their socio-economic status and learning achievements.
1.11 Statement of the problem
Learning is the most important component in education system. Learning style is
an individual’s characteristic way of responding to certain actions in the instructional
environment which leads to learning. The learning styles may have different effects on
the student’s academic achievements. Similarly parental socio-economic status may also
have some effect on student’s achievement. The study was designed to explore the
effects of student’s learning styles and socio-economic status on learning achievement at
secondary school level.

12
1.12 Objectives of the study
The main objectives of the study were:
1. To investigate the relationship between different learning styles and learning
achievement of students at secondary schools.
2. To find out the relationship between different groups of socio-economic status of
parents and learning achievement of their children studying at secondary schools.
3. To explore the relationship between different groups of socio-economic status of
parents and learning styles of their children studying at secondary schools.
4. To identify the difference in opinion about learning styles of students by gender.
5. To find out the difference in opinion about learning styles of students by region.
6. To investigate the difference in opinion about learning styles of rural and urban
students by gender.
1.13 Research questions of the study
The following research questions were addressed in the study:
i. Is there any significant relationship between the different learning styles and
academic achievement of the students at secondary school?
ii. Is there any significant relationship between different groups of socio-economic
status of parents and academic achievement of their children studying at
secondary schools?
iii. Is there any significant relationship between the different socio-economic status
groups of parents and learning styles of their children studying at secondary
school level?

13
iv. Is there any significant difference in learning styles of students by gender?
v. Is there any significant difference in learning styles of students by region?
vi. Is there any significant difference in opinion about learning styles of rural
students by gender?
vii. Is there any significant difference in opinion about learning styles of urban and
students by gender?
1.14 Significance of the Study
Individual differences work every where in every situation. Whether it is a
personality difference, it is biological or social differences or it is difference in learning
and responding to a specific situation. Even the socio-economic status is not same
anywhere. Some do hard earn less some do less earns more. There is a need to study
which factor affects what. To conduct this research three variables are selected the
learning styles of students, the socio-economic status of parents and of students and the
learning achievement. The researcher tried to explore the relationship among these three
variables. The findings and the conclusion of the study will be helpful for students to
identify and differentiate their own learning style. It will also help teachers to adopt
teaching methods according to the learning styles of students. The teacher educators can
get benefit from this study for training prospective teachers to understand the different
learning styles of students and designing classroom learning activities according to the
preference of their students. Parents can get information how Socio-economic status
effects the learning style and learning achievement of their children which may motivate
them to uplift their socio-economic status. The principals and administrators can use the
14
findings of the study for establishing the system in their institutions which suits to
maximize the learning. Policy makers will be benefited by the results of the study for
further policy formulations regarding teacher training, designing teaching learning aids
and taking measures for the improvement of classroom environment. The non-
governmental organizations (NGOs) can also persuaded by the result of the study to work
for designing teaching aids, training teachers regarding methodology, assessment etc and
developing supplementary reading material according to the learning needs of the
students. This study further provides an edifice for further researches in the field of
teaching, learning and achievement.
1.15 Delimitations of the study
Keeping the finances and time available to researcher the study was delimited to:
a. Region Pothohar Plateau of Pakistan included four districts i.e. Attock,
Chakwal, Islamabad and Rawalpindi.
b. Secondary school students who appeared in SSC examination in 2007.
c. Only public sector schools of four districts (Attock, Chakwal, Islamabad
and Rawalpindi) were included in the study.
d. Learning styles defined by Grasha and Riechmann (1974), i.e.
independent, dependent, competitive, collaborative, participant and
avoidant styles were used as a basic tool for research.

15
1.16 Conceptual Framework
The conceptual framework of the study focused on the relationship of three
variables i.e. students learning achievement, their learning styles and parental socio-
economic status. In which learning styles and socio-economic status of parents of
sampled students were independent and learning achievement was dependent variable.
The design of the study is depicted as below:
Figure: 1-1 The conceptual frame work of the study
After the identification of independent and dependent variables it was easy to
categorize the variables for visible picture of the study. The learning styles model
presented by Grasha & Riechmann (1974) which have six styles, the socio-economic
status divided into five classes for the clear understanding of the results and the academic
achievement of students measured in grades i.e. A+, A, B, C, D, E as per defined policy
of Boards of Intermediate and Secondary Education in Pakistan.
Learning styles of students
Socio-economic Status of parents
Learning Achievement of students

16
CHAPTER 2
REVIEW OF LITERATURE
Education is the process of life long learning. Learning is development.
Development means certain changes that occur in human beings with the passage of time
throughout their lives. In the process of development the human capabilities are modified
and refined up to maximum level that enables people to adjust in society and live a better
life. According to Dictionary of Education (2005, p.130), “Education is the process of
developing the potentials of man to the optimum level, in order to enable him to lead a
productive and happy life in society”. The aim of education is to develop the human
personality. The human personality has six aspects so the ultimate aim of education is to
develop six aspects of the personality. These six aspects of personality development are
physical, mental, social, spiritual, esthetic and emotional. Human development can be
divided into four domains physical, personal, social and cognitive. The Physical
development, deals with the changes in physical appearance of the body i.e. height,
weight etc. Personality development focuses personality of human beings as
psychological, emotional and esthetic development. The social development refers to
social changes and social relations with others. The last cognitive development refers to
changes in cognition and thinking. Since long education was considered as one of the
most powerful agent of change. It enable individual to gain a more profound
understanding of human development and building relationship among individuals,
communities and nations to lead a successful life.
As the child grows the process of development focuses on two major areas, the
physical development and mental development. The physical development enables child
17
to perform physical activities and the cognitive development enables child to think and
respond in a specific situation.
The cognitive development is mainly related to brain development. Ausubel
(1965) described the human brain as white matter of coconut size. There are several
different areas of the brain. These areas are responsible to perform different functions.
For example feathery looking cerebellum coordinates with balance and skilled
movements. The cerebellum may also play a role in higher cognitive function such as
learning. This part of body learns, thinks, remembers and solves problems. So it remains
under special interest of educators’ as they want to know how the brain contributes to
educational phenomena. Brain regulates two functions memory and emotions. Regarding
the memory part of brain called hippocampus processes person’s experience and give
meaning to it. New information is stored in memory as long-term knowledge while the
amygdale directs emotions. The thalamus is involved in our ability to learn new
information, particularly verbal information.
Hippocampus is composed of group of neurons. For a specific experience
hippocampus is activated and person can recall facts and information from memory. This
process of neuron activation is called neural placity. This process brings structural
changes in brain (O’Donnell, Reeve & Smith, 2007, p.35). The process of education
changes the function of brain not the structure of brain. Educational programmes provide
environment to brain to process, store, remember and use information to solve problems.
The educational process develops the brain and it has greater neuronal interconnectivity.
A normal human brain has 100 billion neurons and brain forges about 100 trillion
18
connections that join neurons together and these connections foster learning. (O’Donnell,
Reeve & Smith, 2007, p.36).
In the literature Jean Piaget was the first psychologist who describes how humans
gather and organize information and process it for development. The work of Jan Piaget
is known as “Piaget’s Theory” for cognitive development. Vygotsky and Bruner are also
the well known psychologists they worked for cognitive development and how the
learning and thinking takes place.
2.1 Piaget’s Theory for Cognitive Development
Piaget started to study the child’s cognitive development at the beginning of the
20th century. According to Piaget (1969, p.70) “the main goal of education should be to
help children learn how to learn and that education should “form not furnish” the minds
of students”. The Piaget’s theory of cognition is based on adaptation and organization of
facts according to demand of physical environment. The process of adaptation has four
stages schema, assimilation, accommodation and equilibration (Parsons, Hinson & Sardo-
Brown, 2001, p.36).
(a) Schema
Piaget (1971, p.44)) said scheme is a unit. It is a collection of neurons. It is a
chunk of information activated in the result of specific action under a specific situation
and it helps to organize the environment. He used schema to represent the cognitive
structure. Piaget said that it helps individuals to organize their environment.
He further elaborated the function of schema according to him when a person
encounter with new idea the existing structure helps to understand it and make it

19
meaningful for the person. If that new experience or idea became meaningful or
understandable then it assimilates to existing structure that is the next stage in Piaget’s
Cognitive Development Theory.
(b) Assimilation
Piaget’s theory was explained by Parson and Colleagues (2001). They said
assimilation is the process of making sense of experience and perception by fitting them
into previously established cognitive structure. If the new idea or experience did not
assimilated and remained unable to make connection with the existing cognitive structure
then the brain creates new scheme. This process is called accommodation.
(c) Accommodation
Parson and Colleagues (2001) deeply study the Piaget’s work and explained that
in the process of accommodation the new idea get a separate place in the brain as it
remain unable to make a connection with existing situation and not assimilated. Now two
processes occur at the same time one is assimilation and other is accommodation. This
refers to cognitive development. If the process of assimilation occurs only the brain gets a
big structure of schema with more information then it become difficult to distinguish the
idea. If the continuous process of accommodation occurs then the brain has isolated
schemata without any connection and relation in the result generalities can not be
formulated. Both the processes occur in the brain simultaneously and Piaget named this
stage as “Equilibration”. Equilibration is a stage of balance between assimilation and
accommodation.
To motivate individuals Piaget suggested put them in a state of cognitive
disequilibrium. It is a discrepancy between what is perceived and what is understood.

20
Piaget called it cognitive conflict. Cognitive conflict is a state in which one expects some
thing to happen in a certain way but it does not. This situation motivates individual to
understand the situation which caused the conflict and in the result assimilation takes
place otherwise new schemata created with new experience and adaptation takes place.
Piaget classified the cognitive development parallel to physical development into
four stages. According to him at sensory motor stage (birth to 2 years) the child moves
from the reflexive activities to more highly organized form of activities. Like as from
reaching, grasping and sucking to the object permanence.
The second stage is pre-operational stage (2 years-7 years) at this stage the child
lacks logical operations, symbolic function, egocentrism, centration or concentration.
Third stage (7 years-13years) is concrete operational stag. At this stage a child is able to
think logically but only about concrete objects and problems. The last stage (13years-
17years) is operational stage; according to Piaget, at this stage a child is able to solve
abstract problems.
Many criticisms came to Piaget’s theory. Piaget focused the individuals. He
thought individual can learn at their own when reached to specific stage. He ignored the
individual differences as every individual is different. He may reach to a specific
developmental stage at different time, then; how learning could be happened at the same
rate in same situation at the same time. Further Piaget assumed that cognitive conflict
motivates learning but this discrepancy some times produces avoidance behavior which
totally stops learning. Piaget also ignored the teacher’s, the environmental and cultural
role in learning. Learning is a process which could not be continues in isolation so
environment, culture and teacher may affect learning. When Piaget gives his biological

21
views of cognitive development Vygotsky gave socio-cognitive perspective of learning.
Socio-cognitive perspective of learning focus how the cognition develops when others
help the learner. When a learner come a cross to a new situation he may be confused in
handling new situation. He needs some guidance in the form of instructions or role play.
When anyone guides him he may solve the situation comfortably. This is the social
aspect of cognitive development.
2.2 Vygotsky Socio-cultural Perspective of Cognitive Development
Vygotsky believed that child is not an isolated character of the world. He lives in
society and has some culture. This social and cultural factor has significance affect on
cognitive development. Vygotsky (1978, p.57) assumed that “every function in a child’s
cultural development appears twice: first on the social level and later on the individual
level; first between people (inter-psychological) and then inside the child (intra-
psychological)”. Woolfolk (2004, p.79) strengthens the idea of Vygotsky by saying that
“the higher mental process appears first between people as they are constructed during
shared activities then the process internalized by the child and become part of that child’s
cognitive development”.
Vygotsky believed that during the learning process the children may face two
situations or stages; either he can solve the problem independently or he can not. When
the child can solve the problem independently he named this stage as the “zone of actual
development” and when he is unable to do so at their own and may be able to solve it
with the help of some other person the Vygotsky named this stage as the “zone of
proximal development (ZPD)”. The ZPD is an individual’s potential to learn.

22
Encyclopedia of Education (2003, p.575) defines zone of proximal development as, “The
ZPD is the area between a learner’s level of independent performance (often called
developmental level) and the level of assisted performance (when the child can do with
support)”. To get support from others to perform a task, language and other signs
symbols are the main factors.
Both the Piaget and Vygotsky emphasized the importance of social interaction in
cognitive development but in a different perspective. Piaget believes that interaction
promote development by creating disequilibrium, he believes that most helpful way is to
interact with peers because they are at the same level of development. While Vygotsky
believes that cognitive development fosters by interaction with some skilled and
experienced person. Students can learn from both adults and peers.
Some other psychologists have also worked for social development. Vygotsky
highlighted socio-cognitive aspect of development. He focused the concept of social
interaction and assumed that it developed the cognitive activities. The others focused on
personality development such as psycho-social development. According to O’Donnel and
Colleagues (2007, p.77), “The essence of social development is the students’ progression
toward psychological growth, personal adjustment, a sense of competence, emotional
maturity, a pro-social orientation towards others, and a capacity for autonomous
functioning”. The training institutions for social development are society and school. In
which the role of teacher has important place. This function of school and teacher in
social development was explained by Erikson.
Erikson (1982) explains it in “life span development framework”. He described
eight developmental turning points that all people face during the developmental process
23
at specific age. Those eight points were: trust versus mistrust, autonomy versus shame,
initiative versus guilt, competence versus incompetence, identity versus role confusion,
intimacy versus isolation, generality versus stagnation and integrity versus disparity.
Each turning point is related to seven others. A positive resolution at one stage increases
the individual strength and potential to cope with future turning points whereas negative
resolution leaves the person more vulnerable to later maladjustment.
Along with Piaget’s cognitive development theory, Vygotsky’s social
development theory Bruner gives learning as discovery theory. All three were
constructivists focusing cognitive development by three different aspects.
2.3 Bruner’s Theory of Discovery Learning
In contrast to the Piaget’s age-stage theory Bruner (1966) believed that a person
can learn new idea at any age by taking an active role in the learning process. He called it
the invariant sequence of stages. He felt that a person’s environment and background
knowledge or schema and current knowledge play an important role in person’s cognitive
development and understanding of ideas. Bruner believed that learner should participate
actively in transforming knowledge, decision making, constructing hypothesis and
thinking about what is being taught.
Bruner stands some where between Piaget and Vygotsky. He bridges the concept
of both. Bruner like Piaget acknowledge the role of biology in cognitive development, in
particular that individuals are born with the biological systems that enable them to make
sense of their environment and that these systems mature over time. Bruner was also
agreed with Piaget that individuals have to be active in their development as discussed

24
above. However Bruner have more agreement with Vygotsky. He emphasizes discovery
learning or role of language. The language not only reflects experience but it can
transform the experience. He was interested in language learning and teaching, and
expands the Vygotsky’s concept of scaffolding.
2.3.1 Modes of cognitive development
Bruner presented three modes of cognitive development. He said during the
cognitive growth students’ move through these stages.
a) Enactive Stage
At this stage students begin to develop understanding with environment through
active manipulation. Student learns to control his body and react physically to the
environment. This form of memory may be linked with muscle memory. At this stage
students should be given opportunity to play with material in order to under stand how it
works.
b) Iconic Stage
At the second stage incoming information is stored in the form of mental images
or icons. Students can manipulate these images without having concrete objects. Students
are able to take the form of sound and smell images and to visualize concrete
information.
c) Symbolic Stage
This is the final stage in which students can use abstract ideas to represent the
world. Now students have ability to make important shift in cognitive development.
25
A key difference between Piaget and Bruner is that whilst Piaget thought the
application of logic was the ultimate goal of cognitive development, Bruner believed that
all these modes of representation were available to the adult engaged in problem solving
activities.
The similarity of Bruner and Vygotsky was both believed that if the language
form thoughts then the cognitive development can be accelerated. The cognitive
processes and the quality of thinking may be enhanced by teaching the appropriate
language.
In the above discussion of cognitive development two concepts overlap each other
learning and development; a question arises which one comes first? Both strengthen each
other, development promotes learning and in the result of learning development takes
place.
2.4 What is learning?
According to Dictionary of Education (2005, p.521) “learning is the process of
acquiring knowledge, skills and belief through experience”. Learning takes place when
students interact with others and with environment by observing, talking, listening
discussing, writing and relating their own ideas and experiences with others.(Reddy,
2006, p.11). Piaget’s (1964, p.17) describes “learning is subordinated to development and
not vice versa”. He explained development as the active construction of knowledge and
learning as the passive formation of association. He was interested in knowledge
construction and believes that cognitive development came before learning. According to
his view child cannot learn a concept before they are cognitively ready. Here by the term

26
cognitively ready he means development of child. Cognitive development takes place
first then they become able to learn where as Vygotsky believed that learning is an active
process and it did not wait for readiness. Vygotsky, (1978, p.90) said “properly organized
learning results in mental development and sets in motion a variety of developmental
process that would be impossible apart from learning”. He saw learning as a tool in
development. Learning pulls development up to higher level and social interaction is a
key in learning. So in this way learning can be defined as an individual as well as social
activity.
Learning takes place as a result of experience. For example a first grade student
sings, “twinkle twinkle little star” and second grade student leaves hot spoon
immediately. First case is the example of learning while second case is not the example
of learning, what’s the difference between the examples of learning and not learning? The
difference is the experience. In other words the first grade student’s behavior is the result
of his experience. He was not biologically programmed to sing “twinkle twinkle little
star” and leaving hot spoon is reflexive activity. According to Parson (2001, p.206)
“learning is acquiring knowledge: it’s an enduring change in living beings not dictated by
genetic predisposition; it is also a relatively permanent change in behavior resulting from
practice or experience”.
This definition has three important elements.
1. Learning is a change in behavior, for better or worse.
2. This change takes place through practice or experience. It means changes due
to growth, reflex actions, maturation or injury are not learning.
3. This change must be relatively permanent.

27
So the changes due to motivation, fatigue, adaptation drug or sensitivity of the
organism is not learning because these changes are of a transient nature resulting from
genetic forces, or induced artificially. They are not considered to involve in promoting
learning.
Different educationist and psychologists perceive learning in a different way.
According to Skinner quoted in Sharma (2005, p.285) “learning is not acquiring
knowledge or skill by more mechanical repetitions. It is a process in which the learner
organizes different elements and experience to reach a practical goal”.
According to Hilgard quoted by Reddy (2006, p.53) “learning refers to the change
in a subject’s behavior to a given situation brought about by his repeated experiences in
that situation, provided that the behavior cannot be explained on the basis of native
response tendencies, maturation or temporary states of the subject (e.g. fatigue, drugs
etc).
Sharma (2005, p.284) describes, “Learning is associated with acquisition of new
behavior or modification of old behavior”. This was strengthened by the views of Reddy
(2006, p.143) he said, “Learning is the modification of behavior potential as a function of
experience”.
All the definitions of learning discussed above emphasizes learning takes place
due to experience. A learner gain experience while interacting with society so the
learning is a social as well as individual activity. Learning is a social activity started by
the interaction with others but ends as an individual’s activity. As teacher design an
activity the whole class or a group of some students gone through it but same learning did

28
not occur, because every individual’s experience could be different. The change in
thinking, feeling and action which has taken place in the result of activity is different.
Learning is a complex activity it continues formally or informally intentionally or
unintentionally. Some times learner gone through the different activity but learn different
thing which may not be the intention of learner. So people learn things that are beneficial
and not so beneficial to them. An example might be phobia.
Learning is an abstract concept some time learner become aware of what has been
learnt some time not. Learning is not always deliberate and learner may not be conscious
of what has he learnt. Some time learning takes place without realizing it. Some time it
remains unaware what has learnt, and some time learned what did not set to learn. The
results of learning are not always easy to see. Most contemporary theorist agreed that not
all learning yields readily observable change like Bandura (1977, 19978) noted that
learning can takes place even though no overt behavioral change is witnessed in learners.
Besides all this; psychologists agreed that learning varies from simple to complex and
mechanistic way to organized way.
From the century ago educationist and psychologist observe the process of
learning and describe it in learning theories.
2.5 Learning Theories
All the theories of learning were based on the presenter’s perception about the
nature of man. Scientists, Psychologists and educationists proposed theories of learning
totally depend on the assumption about knowledge, society and man. A survey of
research literature reveals that particular learning theories emphasize particular kind of

29
learning and learning environment, while they neglected others. Learning theories
proposed yet can easily be divided in following categories.
1. Behavioristic learning theory.
2. Humanistic or non-Behaviorist learning theory.
3. Cognitive learning theory.
2.5.1 Behavioristic Learning Theory
The major proponents of Behavioristic theory were Thorndike, Watson, Skinner
and Guthrie. Behaviorist said that behavior and environment are the most important
component of learning. Reeve (2007, p.209) said “Changes in the environment will result
in change in behavior”. Individual differences are less important to them, because their
goal is to produce desirable behavior or reduce the frequency of undesirable behavior.
Same views were presented by Parson (2001, p.208) “learning is a change in the way
people act overtly-observable behavior observable change”. They believe that learning
occurs through a process of contiguity i.e. learning is the result of events occurring at the
same time. Whenever two events occur together over and over again they will become
associated. The best contiguity theory is classical conditioning, which involves the
pairing of a stimulus and a response. The stimulus leads to the response without any prior
learning, for every stimulus there is a natural response as for every action there is a
reaction. Pavlov discovered the phenomenon of classical conditioning while conducting
research on the digestion system of dogs. He noted dog salivated when food presented to
it.
30
Pavlov begins to ring a bell whenever food presented to dog. Initially no response
was observed but gradually through experience dog learned the sound of bell and it
become conditioned response. Previously the unconditioned stimulus (food) produced
unconditional response (salivation), which was natural now associated with the condition
of bell. So the conditioned stimulus (ringing of bell) produce conditioned response
(drooling) with out the presentation of food to dog as result of contiguous pairing of the
two events.
Association’s theories depend on the principle of contiguity. Guthrie (1935)
proposed this theory, which was further explained by Zais (1976, p.251), “a combination
of stimuli which has accompanied a movement will on its occurrence tend to be followed
by that movement”. Guthrie's theory got attention because of its simplicity. He said, "In
any given situation we learn what we do and in similar situations repeat what we have
learned. He said all learning takes place in a single contiguous pairing of stimulus and
response. The criticism on it was then what was the role of practice? He explains under
the presence of stimulus different responses occur and due to practice when the stimulus
removed the last response is the learning of the person. Because when ever the situation
repeated under the specific stimulus the person repeat the last response learnt in first trail.
He further said, the practice improved the total acts of achievement not the learning.
Learning takes place at first trail and practice improve the acts of a person and his
performance.
An alternative theory of behavioral learning was operant learning. It was
presented by Skinner. In operant learning the learner acts in the environment and in the
result, learner's repeating behavior increases or decreases. The basic law of operant

31
conditioning was stated by Skinner (1938, p.21) as "If the occurrence of an operant is
followed by presentation of reinforcing stimulus, the strength is increased”. This theory
emphasizes two factors the operant and the re-in-forcer. His approach was described by
O'Donnell, Revee & Smith (2007, p.210) as black box theory, in which information from
environment going into the individual who learn and behave. But nothing could be said
about what occurred in the black box of the individual. This approach is contrast to
cognitive theory as the proponent of that are very interested in what occurred in the
individuals as he or she receives and actively process the information from the
environment.
2.5.2 Humanistic Learning Theory
Albert Bandura and Allport was the proponent of this theory. Bandura (1978)
stated this theory as “the social settings in which individual live, work and play are
powerful influences on behavior, attitudes and beliefs about one's self and the world”.
The primary point is that individuals learn from observing the behaviors of other and the
social consequence of those actions. Allport (1985, p.3) also have the same point of view
and said "to understand and explain how the thoughts, feelings and behaviors of
individuals are influenced by the actual imagined or implied presence of others”.
In the result of criticism on behaviorist theory it was criticized that the human
beings are not robots they understand the environment in which they live and they are
influenced by it. They further said "sometimes there is something in the organism which
effect behavior”.

32
This theory was based on Bandura’s "Bobo doll study" (1963 p.3-11). He made a
film and showed it to students and observed the student’s behavior. He suggested
observational learning strategy for students learning. The factors involved in
observational learning were attention, retention, reproduction and motivation. In the light
of this theory it was suggested to the teachers by Parson (2001, p.236) that “they must
grab the students attention; they must provide for the retention of the learning, they must
ensure students have the capability to learn observationally, and they must provide same
kind of incentives for learning”.
2.5.3 Cognitive learning theory
All cognitive theories are constructive in nature and emphasize the active role of
learner in making meaning out of their experience. Cognitive theory is also known as
“Classical Gestalt Theory”. It was generally known as the product of German
psychologists. Wertheimer, Koffka & Kohlar were the main persons who perceived this
theory. Gestalt was a Germen word, meaning, "pattern" or "configuration". Later on
Piaget, Bruner and Asubel gave their perspective and developed the cognitive learning
theory.
Gestaltist pointed out that person perceives or learns in terms of dynamic
structured wholes. It could be understood by an example when three dots are presented so
..., it tends to look like a triangle rather than three separates dots. Changing the dots in to
squares (□□□) presents an entirely different set of visual components. Yet the essential
character of the Gestalt is not altered.

33
So the learning under this theory is not the perception of fact or data rather it is
the restructuring and reorganization of data to make sense of it. The way a learner
restructures the data it is based on previous experience and current state of mind. The
gestalt learning or cognitive learning also has been affected by some laws or factors as
the previous theories were.
The example described above is the gestalt first law of figure. This law is stated as
the tendency of perceiving images in the fore ground first, while other images fade into
the background. In the previous image when one see three dots they perceive it as triangle
and the dots fade into the background.
The laws of learning in gestalt theory are derived from the single general law, the
law of good form or law of pragnanz. Which is based on general good form of gestalt as
the simple, clear, compact and significant gestalt conveys clear meanings to perceiver or
learner which effect learning. The other laws of learning in gestalt theory are developed
by Koffka and presented by Zais (1976, p.279).
i. Law of similarity
This law states that the good gestalt is composed of similar elements, because it
results in interaction which produces a unitary gestalt and so facilitates the learning.
ii. Law of proximity
If things are placed together, it is tendency to discern them as belonging together
(Farhman – Diggory, 1992). For example see figure below:
○○ ○○ ○○ ○○ ○○
It is perceived as five pairs of circles first, rather than as 10 separate circles
because of the proximity.
34
iii. The law of closure
Perceptually the human beings have tendency to fill the gap (Farhman – Diggory,
1992). In other words we see the above distant circles as closed figure, by joining parallel
line.
It reflects the tendency of human beings to give suitable end to every situation.
This closure represents the rewards that come with the successful completion of learning
tasks.
iv. The law of good condition
It states that perceptions are formed on a pattern that tends to continue the pattern
perceived as incomplete gestalt. For example a half circle is perceived as complete figure.
These were the four basic laws of gestalt or cognitive learning theory.
Bruner and Asubel were the proponents of this theory. According to the Bruner
"learning is an active process in which learners construct new ideas or concepts based
upon their current or past experience". The learner selects and transforms information,
constructs hypothesis and makes decision based on cognitive structure. Cognitive
structure provides the meaning and leads the learner beyond the information given.
Bruner concludes that the persons learn best when are motivated to perceive and they are
motivated to perceive by insight full experience.
The other theory which was based on the theme was presented by the Gestaltist’s
information process model (IPM) like the gestalts IPM theorists behave in the
significance of perception of learning. Bombarding stimuli are filtered through these
structures and what perceived after filtered thoughts are processed.

35
All the learning theories discussed above were the perception of different schools
of thought of psychologists and educationists. The further advancements on the bases of
research disclosed the different ways of perceiving information and processing
knowledge. As the behaviorists totally focus the behavior of learner it was perceived a
mechanical task. The educationists of this point of view thought that learning takes place
by hit and trail method. It is mechanical drill process. They focus on rote memorization.
After extensive practice the learner becomes able to perform tasks.
The socialist criticize and gave their own points of view that learner can not live
in isolation, and learning is a social activity. When learner interacts with environment or
society learning takes place, and society contributes in the process of learning. This
school of thought gave social learning theory. After that the cognitivist came and said
that learning is the cognitive process it is the process of perceiving information they focus
on cognitive map. All the theories over lap each other and concept travel side by side
after analyzing critically it was noticed that all new school of thoughts did not deny the
previous theory rather they modify it and looked them in different perspective drill and
practice, refined the social actions which has always been learned through society.
Further learner interacts with society through five senses and the process help in the
development of cognitive map. Every theory has its own importance.
It is easy to look in the light of above discussion that learning takes place at three
stages the learner’s physical activities (Behaviorists) the learner's social activities (Social
learning theories) and learner's cognitive activities (Cognitive or gestalt theory of
learning). Learning will be durable when all three aspects contribute. For people to be
learned the impact of these components varies and people learn differently. Some people

36
focus behaviors, some social actions and some cognitive processing for learning. These
different perceptions, variations or preferences are called learning styles. This is an
important area for a teacher to have awareness about cognitive and learning styles
variations mainly in the ways that students perceive in their world and in how they
process and reflect upon information. Some of these variations seem to be caused by
differences in the brain, others by individual performance and still others by culture. All
these variations are due to individual differences.
Educators had noticed that some students learn better than others and prefer
certain ways of learning to others. These different ways and preferences were referred as
learning styles. Learning style is a consistent pattern of behavior and preference by which
an individual approaches. Bennet (1990, p.140) defines educational experience, “It is the
composite of cognitive affective and physiological factors that serve as relativity stables
indicator of how a Lerner perceive, interacts with and responds to the learning
environments.
2.6 Definition of learning styles
Different psychologists and educationists look upon the idea of learning style
differently. They define this concept according to their own perspective.
Sigel & Coop (1974, p.23) have viewed learning style as an integral concept that
bridges the personality cognitive dimension of the individuals.
Gibson (1976, p.89) argues that learning style and cognitive style are
synonymous.

37
Lay Cock (1978, p.45) describes learning style as an individual characteristic way
of responding to certain variables in the instructional environment.
Kalsbeek (1989, p.2) said that learning style can be understood as a person's
preferred approach to information processing, idea formation and decision making. The
attitude and interest decide how to respond in which learning situation all depends on the
compatibility with the personal profiles. So it can be concluded by analyzing all these
definitions that the learning style is the preferred way of perceiving and responding to the
information in a specific learning situation.
2.7 General Concept of Learning Style
By going through the concept and definition of learning style the researcher come
to the conclusion that learning style is influenced by the personality trait, working
preferences and cognitive perception. The history traced back to ancient Greeks:
Hippocrates divide personality into four types i.e. melancholic, sanguine, phlegmatic, and
the choleric. Jung divided personality in two type’s extro-version and intro-version. He
further divided these two types into four fold classification of thinking, feeling, sensation
and intuition. Keefe (1979, p.10) stated that learning styles reflect genetic coding,
personality, development, motivation and environmental adaptation. This shows that
learning style is the learner's personal way of perceiving and processing information in
which the whole personality, environment and cognition of the learners work. The
identification and recognition of one’s learning style may help them how life long
learners to be. If students remain unable to learn how to learn, they may not be effectively
trained to lead a successful life. Actually helping students to understand how they can

38
naturally take in and process information will go a long way towards making the life long
learner. The environment around the person makes sense to him as an individual. This is
called perception and perception shape what one thinks. How he makes decision and
defines what is important to him. These individual perceptions determine the natural
learning strengths or learning style.
James and Blank (1993, p.45) identified three dimensions of learning styles. First
is the individual's information processing style, which define learner's typical mode of
perceiving, thinking, problem solving and memory. These preferred ways of perceiving,
organizing and retaining knowledge are believed to be distinctive and consistent. Second
is affective style defined as personality traits relating to attention, emotion and valuing
and how the person motivates his/her self and sustains behavior? Third is physiological
style, defined as the biological based modes of responses, which depend upon the
physical environment, gender differences and the individual's state of nutrition and
health. These three areas together offer a holistic view of the learner taking into
consideration of one's mind, body and emotion.
Same as the developmental stages person's learning style accompanies personal
development and self actualization. Rayner and Riding (1997, p.9) describe three stages
in this process. Initially the person is unaware of their learning style; it is hidden.
Gradually the person gains awareness of style and its possible implications for learning
and behavior of their-self and others. To be aware of learning style paradigms, it is
important to examine both definitions of learning styles and the classification of learning
styles. According to Reiff, quoted by Kang (1999, p.1), “it is evident that people learn
differently and at different paces because of their biological and psychological

39
differences”. Again, Brown (2000, p.114) states that “It would appear that individuals
show general tendencies toward one style or another, but that differing contexts will
evoke differing styles in the same individual”. Obviously, people have their own
preferences in learning situations and in certain circumstances they can use different
learning styles which are appropriate for them.
With the in-depth study, researchers have made efforts to define and categorize
learning styles in different ways; for example, learning style is “identifiable individual
approaches to learning situations”, learning styles are the “preferred modes for
perceiving, organizing, and retaining information”, its “natural, habitual, and preferred
way(s) of absorbing, processing, and retaining new information and skills” and as
“cognitive, affective, and physiological traits that serve as relatively stable indicators of
how learners perceive, interact with, and respond to learning environments” (Keefe,
1979) (all cited in Peacock, 2001, p. 2).
In addition, learning styles have been categorized by researchers in a variety of
ways. Brown (2000, p.114-122) introduced learning style variables as “field
independence, left-and right-brain functioning, ambiguity tolerance, reflectivity and
impulsivity, visual and auditory styles”. Reid divided learning styles into three
categories: cognitive, sensory, and affective learning style models (Rausch, 1996). Keefe
(2001, p.4), wrote that “learning styles have cognitive, affective, and physiological
variables.” He elaborated it by writing “if, a student has good analytic skills (cognitive),
information will probably be categorized correctly. If a student does not like mathematics
(affective), learning will be impeded. If a student feels ill or tired (physiological), then
little learning will occur”.

40
Thus, there were two situations one defined Learning Styles and other categorized
it keeping in view the variables and it is a difficult job. When each researcher classified
learning styles based on different variables, there were many different ways to categories
and decide which variable should be included in each category. In fact, Rausch (1996)
described the complexity of learning styles in his article when he explained Reid’s
categorization of learning styles models by saying that elements of each category are not
exclusive and independent.
Finally the researcher discovers application of this awareness to many situations
in life. Developing awareness can help individuals recognize their strengths and those of
others acknowledging their weaker areas and work collaboratively with others more
effectively.
2.8 Difference between Cognitive Style and Learning Style
In addition to learning style the related concept is cognitive style. Some
psychologists perceived it in the same way but it is different. As Riding and Cheema
(1991, p.194) describes the distinction between cognitive style and learning style. He
viewed cognitive style as underlying learning style and involving theoretical academic
description of process involved, while learning style is of immediate interest of trainer
and educator.
It was observed by psychologists that people differ in perceiving and processing
information; it is their “cognitive style”. Arends (2007, p.50) "Some individuals appear to
be ‘field dependent’: They perceive situation as a whole rather than ‘in parts’. They like
to see big picture in most problem situation. Some other are ‘field independent’, they tend
41
to see the separate parts of the whole instead of the whole ‘it self’”. In general field
dependent individuals are more people oriented; social relations are important to them
and they work well in groups. Field independent individuals have strong analytical ability
and they monitor their information processing rather than their relationships with others.
Arends (2007, p.50) labeled learning style as "in-context" and "out of context
style". By “in-context” he means learner acquired skills and knowledge at specific point,
he need in his real life situation and develop perceptions. By "out of context" learning
means that learning is unconnected to a real immediate need, so it is process oriented.
Obviously; it is important for teachers to recognize students’ difference in the ways they
process information and in their preferred ways of learning.
It can be summarized that cognitive style is absorption of information and
learning style is processing of information. Cognitive style is mainly related to function
of brain and gestalt devolvement and learning style is a way of responding to a certain
situation.
2.9 Theories of Learning Styles
Theories of learning styles were emerged from learning theories. Every individual
is different because of heredity, environment and training. These individual differences
forced to perceive and process information differently.
Traditional theory of Behaviorism has been superceded by socialists and
cognitivists based on social, cultural and cognitive factors. The learning style theories can
be easily put under the umbrella of learning theories. As Dun & Dun’s model under

42
Behavioristic theory, Myers-Briggs Type Indicator under cognitivistic Theory and Grasha
& Riechmann under social learning theory.
The learning style theories can be best represented by Curry’s “onion model”.
Bentham (2002, p.99) reflected on model. He stated that all learning style may be placed
according to the layers of onion. The outer layer of model has root in Behaviorist Theory
which may be influenced by learning environment and individual’s expectation. The
example of that layer may be Dunn & Dunn's model, Jhon Hollad's model and Schmech,
Ribich & Ramanaiah model.
The middle layer of the model refers to as information processing style. This
learning style reflects the individual’s intellectual approach for integrating or assimilating
information, the example of this layer may be Kolb's learning style. The inner layer was
referred as cognitive personality style, which defined as the individual's approach to
assimilating and adapting information. The example of this layer would be Myres-Briggs
type indicator. The onion model gave no comment for social interaction model.
This metaphor was expanded in (1987, p.123) by Charles Claxton and Particia
Murrell to four layers. Further Claxton and Murrell explained that the traits described at
different levels are not discrete or separate units. Traits at inner most level are most stable
and least subject to change. Moving from core level of personality to outer levels, the
inner set of traits influence the outer layer traits. Hence personality has impacts on ones
information processing abilities, information processing abilities effect person's social
interaction and person's social interaction style influence their instructional preferences.

43
2.10 Learning Style Models
Learning style model can be easily divided into four categories after reviewing the
literature, as:
1. Instructional and environmental preferences models.
2. Social interaction model.
3. Information processing model.
4. Cognitive and personality model.
2.10.1 Instructional and environmental preferences models
In curry's onion model it represents the outer most layer. It was considered to be
the least stable and easily influenced by learning environment.
a. Dunn and Dunn's Model
The Dunn and Dunn Model have a great deal of history and research behind it. It
was developed by Dr. Rita Dunn in 1967 and since that time research has been conducted
at more than 90 institutions of higher education. The model traces its roots to two distinct
learning theories: Cognitive Style Theory and Brain Lateralization Theory.
Cognitive Style Theory was based on the idea that individual process information
differently on the basis of either learned or inherent traits. Brain Lateralization Theory is
based on the idea that the two hemispheres of the brain have different functions: left brain
has verbal-sequential abilities and right brain has emotions-spatial holistic processing.
Rita Dunn and Kenneth Dunn (1978, p.3) proposed the main theory of
instructional and environmental preferences. They said that “Learning Style is the way in
which each learner begins to concentrate, process, and retain new and difficult

44
information”. They further elaborated learning styles as “...a biologically and
developmentally imposed set of personal characteristics that make the same teaching
method effective for some students and ineffective for others,..." (Dunn, 1989).
Dunn and Dunn's defines Learning Style Elements as follows
i. Environmental Stimuli Preferences
Sound Preference
Light Preference
Temperature Preference
Design Preference
The environment in learning style refers to noise level, light, temperature and
seating design. For instance some prefer to learn at night some in day. Some achieve best
learning in calm and quite atmosphere whereas some other prefers music around them.
ii. Emotional Stimuli Preference
Motivation Preference
Persistence Preference
Responsibility Preference
Structure Preference
By these factors they mean motivation, persistence, responsibility, and need for
externally imposed structure verses flexibility. As some people prefer to complete one
task before starting other and other people can easily perform multiple tasks, working
well at a variety of responsibilities at the same time.

45
iii. Sociological Stimuli Preference
Self Preference
Pair Preference
Peers/Team Preference
Adult Preference
Varied Preference
By sociological needs they mean how individual learn when associated with
people or peers, with an authoritative person or with colleague. Learning occurs at
several ways or follows a persistent pattern. Some like to work alone some impart their
best performance working with group.
iv. Physiological Stimuli Preferences
Perceptual Preference
Intake Preference
Time Preference
Mobility Preference
Physical needs are related to physical performance for learning like perceptual
modalities as visual, auditory tactical, kinesthetic, time of day as morning, evening,
afternoon, night, energy level, need for intake as eating or drinking while studying and
mobility (sitting still or moving around at study time).
v. Psychological Stimuli Preferences
Global/Analytic Style
Hemisphericity Preference
Impulsive/Reflective Preferences

46
This group is pertaining to psychological processing as global or analytic
processing style, action and hemispheric, impulsivity or reflectivity.
These 21 elements were grouped across five “stimuli” categories, environmental
preferences, emotional preferences, sociological preferences, physiological preferences,
and psychological preferences. The theory of Dunn and Dunn's model is biologically
based upon physical and environment learning preferences. This is well-knitted to
emotional and sociological preferences combined to form an individual learning style
profile.
The Dunn and Dunn's model is presented conceptually as a gestalt of
environmental, emotional, sociological, physical and psychological elements that vary
from learner to learner and whenever reference is made to the model the learning style
elements are always described and grouped in terms of their related areas.
A primary component of the Dunn and Dunn Learning Styles model is the process
of identifying each student's individual learning style. How do teacher come to know
what learning styles each student has or prefer? There are many different ways to
determine an individual student's learning style. The Learning Styles Inventory (LSI) and
the Reading Styles Inventory (Dunn, Dunn & Price; Carbo & Dunn) are the assessment
instruments recommended by the model developers. However, the Learning Styles
Profile (Keefe & Monk, 1986) is also used extensively with learning style programs that
are primarily based on the development work of the Dunns.

47
b. Jhon Holand's Model
Jhon Holand presented his model in 1974. This model is based on the correlation
between the personality and vocational preference. He focuses on six personality types
realistic, investigative, artistic, social, enterprising and conventional in relation to six
environmental models sharing a common set of constructs (1974, p.2). He believes one
can predict when placed in a different environmental setting because environment
powerfully influences an individual's opportunity to learn. The descriptions of these
settings were taken from the article “Learn to Live, Work: A Comprehensive
Developmental Guidance Program”. These settings are as follows:
i. Realistic
In realistic surroundings people are motivated to see the world in simple, direct
and traditional way while encouraging people to perceive them as an individual unit. It
discourages interpersonal relationship. It stimulates people to perform realistically and
rewards them for the display of conventional goods and values such as money, power and
possession. The typical work activities include fixing, building, repairing, using tools that
require fine motor coordination. Generally these people prefer concrete problems over
abstract problems. Their hobbies include hunting, fishing, camping, building, reading
magazines, operating recreational vehicles, and dangerous activities (skydiving, mountain
climbing, auto racing). These people are emotionally stable, reliable, practical, thrifty,
persistent, shy, and modest, avoid being the center of attention, maintain traditional
values, and slow to accept new ideas.

48
ii. Investigative
This style helps to distinguish the environment by investigation and observation.
It encourages people to investigate abstract, complex and original ways. It motivate
learner to investigate biological, cultural and physical phenomenon by using scientific
methods. The focus of the activities includes performing abstract tasks, solving problems
through thinking, working independently, doing scientific work, collecting and
organizing data, conducting research, dislike selling, and prefers to rely on their own
work rather than working in a group. The typical hobbies include complex activities
(skiing, scuba diving, sailing and flying), computers, reading, bird watching, astronomy,
and chess. These people are independent, self-motivated, reserved, analytical, original,
confident, and creative and having scholarly abilities.
iii. Artistic
The artistic environment is characterized by creative, free and ambiguous
activities and competencies. It encourages people to see themselves as expressive,
original, intuitive and creative and to view the world in flexible and unconventional
ways. The typical work activities include composing, writing, creating artwork, working
independently, playing musical instruments, comfortable in academic environment,
decorating and designing. The typical hobbies include drawing, sketching, painting,
photography, going to theater, museum, reading, writing poetry or stories, collecting
artwork, dancing, and enjoy being a spectator. These people are independent, non-
conforming, impulsive, romantic, free-spirited, intuitive, sensitive, emotional, and drawn
to beauty and aesthetic qualities.

49
iv. Social
This environment is described by sociability and dominated by similar types of
men and women. Learners are encouraged to participate in social activities and promote
cooperation, flexibility and help fullness. The typical work activities include teaching,
explaining, enlightening, helping, selecting, informing, organizing, working with people,
often like to be the center of attention, solves problems through the discussion of feelings,
and enjoys leading and directing others. The typical hobbies include entertaining others,
attending conventions, doing volunteer work, and organizing social events. These people
are humanistic, idealistic, ethical, responsible, cooperative, kind, generous, insightful,
friendly, cheerful, and concerned about others.
v. Enterprising
Enterprising environment forced learners to see themselves as popular,
aggressive, self-confident, sociable and possessing leadership qualities. They can design
personal goals and in this way dominating others. The typical work activities include
selling, purchasing, political maneuvering, entertaining clients, leading committees,
managing people, seeks positions of leadership, participates in competitive activities,
giving speeches and presentations. The typical hobbies include belonging to clubs,
sporting events, political activities, and attending conventions. These people are
ambitious, talkative, witty, argumentative, aggressive, risk takers, adventuresome, and
attracted to money, power, and material possessions.
vi. Conventional
In this environment individuals feels to be bound with values and authorities. It
leads person to feel constricted, simple and dependent on others in society. The typical

50
work activities include conducting a financial analysis, operating office machines,
keeping records, writing business reports, making graphs, and often work well in large
organization. The typical hobbies include collecting (stamps, coins), home improvement
projects, building models, civic and fraternal organizations, and playing games with
clear-cut rules. These people are conscientious, practical, self-contained, conservative,
orderly, systematic, precise, accurate, careful, controlled, and careful about money.
c. Schmeck, Ribich and Ramanaiah Model
Schmeck presented this model in 1977. They used behavior oriented statements to
assess the learning process in the dynamic setting. In fact it was developed with in the
context of cognitive psychology and derived from laboratory research concerned with
information processing and memory. It focuses on four learning processes deep
processing, elaborative process, fact retention and methodical study (1977, p.17).
i. Deep processing
It assesses the use of dialectical and hierarchical information structuring
techniques.
ii. Elaborative process
It assesses the use of personal experiences and self-involvement for the purpose of
encoding information.
iii. Fact Retention
It assesses the focus of attention and memorization of facts for passing
examination.

51
iv. Methodical study
It assesses regularity in studies as well as the appropriateness of method used for
earning high grades.
d. Aggarwal Learning Style Inventory
Aggarwal (1983) has developed and standardized the Learning Style Inventory
which has seven aspects.
1. Flexible and non-flexible
2. Individualistic and non-individualistic
3. Visual and aural
4. Field-dependent and Field independent
5. Short attention span and Long attention span
6. Motivation centered and non-motivation centered
7. Environmental oriented and environment free
2.10.2. Social Interaction Model
The second layer of onion model consists of social interaction model. This model
considers how the interpersonal relationship of peers and student-teachers helps to gain,
understand and assimilate information. The main presenter came under this category are
Grasha & Reichmann and Baxter and Magolda.

52
a. Grasha & Reichmann Learning Model
Anthony Grasha & Sheryl Reichmann developed this model in (1974). This
model focuses on student’s attitudes toward learning, classroom activities teachers and
peers; Grasha’s original idea was that as compared to participative, collaborative and
independent, avoidant, dependent and competitive styles were always functional; but
other researchers have not always operated on those assumptions and have sought
preferred learning methods for all except the avoidant style. The style or trends he
describes are as:
i. Avoidant Learning style
The students having this learning style do not participate in the class room
activities and are not interested to take responsibilities. They do not bother about learning
content and attending the class. They study enough to pass the examination only. Mostly
they remained absent from the class.
General classroom preference
They remain passive rather avoid to participate in classroom activities
They does not like continuous assessment system in class
They like pass-fail grading system
They does not like teachers attention
They like to sit on back benches
Advantages of this style are students take life easy. They remain happy with what
the life is. They are not interested in taking serious steps to change their lives. They have
time to enjoy the life. Disadvantages are they do not contribute for the development.
They keep themselves away from setting productive goals.

53
ii. Participative Learning style
These students enjoy learning and willing to accept responsibilities for self-
learning and try to get knowledge as much as possible. They participate in all activities to
enhance their own learning. Their focus is the requirements of the course and their own
contribution. They do maximum to fulfill the requirements of the course. They enjoy
going to class and participating in classroom activities.
General classroom preference
They prefer lecture with discussion
They like to avail all the possibilities to share the information
They enjoy class reading assignments
They like those teachers who can conclude the discussion
Advantage of this style is these students have practical experience. Disadvantage
is they may give importance to others needs then their own.
iii. Competitive Learning style
These students always try to do better than others. They believe in putting
maximum efforts to get reward and recognition. They like teacher’s attention for this they
follow all the instructional procedures in class. They are anxious about what others are
doing. They want to remain at the top.
General classroom preference
They become a group leader in discussions
They like teacher-centered teaching
They want appreciation for doing a good job
They prefer those activities in which they can perform better then others

54
Advantage of this style is it motivates students to set targets for their success.
Disadvantage of this style is it make difficult for people to appreciate and to learn
collaborative skills.
iv. Collaborative Learning style
The students prefer this style believe that they can learn by sharing ideas and
talents. These students enjoy working and learning by sharing their knowledge and
activities with others in a group. They cooperate with teachers and students in conducting
classroom activities.
General classroom preference
They prefer group work
They like to organize seminars and team activities
They like students centered activities
They prefer to work for group projects
Advantage of this style is it develops skills for working for combined activities.
Disadvantage of this style is that the students may not work with competitive people.
They depend too much on others and not always able to work alone.
v. Dependent Learning style
They have less intellectual curiosity and they prefer to learn only what is required.
They always look towards teachers and peers for the instructions and guidelines. They are
good to follow the instructions. They do everything what teacher asks because they
totally depend on others.
General classroom preference
These students like that the material should be provided by teachers

55
They want clear instructions from teachers what to do
They live happily with teacher-centered classroom method
They prefer the demands of teacher must be clear in all aspects of course
Advantage of this style is these students are good followers. Disadvantages are it
is difficult to develop skills for independent work. They have no self direction. They can
not set targets for their life. They can not deal or handle new situation.
vi. Independent Learning style
These students can set their goals by themselves. They are confident in their
learning abilities. They need less direction from the teacher. They prefer only the content
which is important to them. They are target oriented they like to work alone on course
projects.
General classroom preference
They prefer independent study
They like to follow self-paced instructions
They like those assignments that enhance their independent skills
They like the projects which can be designed by students
They prefer-students centered course designs
Advantage of this style is it develops self-initiated and self-directed learner.
Disadvantage of this style is these students are deficient in collaborative skills. They are
failed to consult teachers when they need help.
Grasha & Reichmann (1974) stated that individuals learn best in the situation that
meet their social emotional needs and are attuned to their predominant pattern of
56
behavior. They also proposed that teacher should develop activities which appropriately
match their student’s perceptions and styles for their proper involvement in the learning.
b. Marcia Baxter-Magolda’s Model
Marcia Baxter-Magolda’s (1992, p.138) presented her view after re-
conceptualizing William Perry’s ideas and declare that for learning: individuals use their
age and gender as well as the social expectation. She describes four stages of learner’s in
her model.
i. Absolute Knower
These students believe that teachers know every thing and it is their responsibility
to get it from them. They expect teachers should have friendly behavior, it makes easier
for them to know what is expected from them.
ii. Transitional Knower
They can take risk. They are willing to perform new experiment with the surety of
being correct. They can use different strategies for improving learning in same area. They
are able to apply their knowledge and ability in different areas.
iii. Independent Knower
They can use and manipulate information and experience according to their need.
They appreciate leader’s act of promotion of independent thinking and exchange of
opinion.

57
iv. Contextual Knower
They can judge and criticize their own knowledge and skill that may apply to a
new or unique environment. They are capable of applying concepts in different situation.
2.10.3 Information Process Model
This model describes the third layer of onion model. It explains how people
perceive and process information for learning. How individuals interact with the world.
This layer is considered to be more stable than the outer layers because it works inside
human beings and not directly interact with the environment, although it is modified by
learning strategies. Main theories fall in to this layer are Kolb (1976), Gregorc (1982),
Honey and Mumford learning Styles (1986).
a. Kolb’s Learning Style Inventory
According to Kolb’s point of view different people prefer different learning
styles. Various factors influence a person’s preferred style. In his experiential style model
he defines three stages of a person’s development. The four different learning styles
improve as we mature through our development stage.
In his experiential learning style model he defines three developmental stages and
when a person matures through these developmental stages he may possesses four
different learning styles. The developmental stages Kolb defined are as:
i. Acquisition-This stage continues through birth to adolescence. At this stage the
basic abilities and cognitive structures are developed.

58
ii. Specialization-This is adulthood stage. In which particular special learning
style is shaped by educational and organizational socialization.
iii. Integration-It is about mid career to later life, at this level person exhibits,
expression of non-dominant learning style.
Kolb (1976, p.2) further explains learning process. He said students can be
divided into four groups.
Students who can learn only by doing
Students who can learn by reflecting
Students who can learn by experiencing
Students who can learn by thinking
Then he made groups and combined these styles into two components: perception
i.e. “how the information is taken in” and the processing i.e. “how the information is
assimilated”.
In terms of perception an individual may have a preference for “concrete
experience” or “abstract conceptualization”. In concrete experience person participate in
specific situation which effect person’s feeling, where as in abstract conceptualization the
emphasis is on thinking rather than feeling.
In terms of processing an individual would either have a preference for “active
experimentation” or “reflective observation”. In active experimentation person prefers to
do and wants to involve in practical work, where as in reflective observation person
prefer to watching rather than doing something. Then person of this learning style
emphasized on understanding and seeing the situation from different perspective.

59
These two dimensions of perceiving and processing information results in four type of
learners.
Type 1: (concrete experience + reflective observation)
Type 2: (abstract conceptualization + reflective observation)
Type 3: (abstract conceptualization + active experimentation)
Type 4: (concrete experience + active experimentation)
Mostly Kolb’s learning style concept was used to identify the learning styles of
distance learning system. It was also used to identify learning styles of Indian Managers:
The specialty of Kolb’s experiential learning was defined by Ahmad and Varghese (1991,
p.55) that “for most people learning resides in the class room. It is viewed as acquiring
concepts and the application of learned concept was neglected. Kolb has taken learning
“out of the class rooms” and linked it to the experiences of daily life”.
b. Honey and Mumford Learning Style
Honey and Mumford (1986) defined four learning styles which are as:
i. Activist:
Activists function in immediate situation. They love challenges and prefer hands
on activities. They do not necessarily recognize problems. Activists involve themselves
fully in new experience. They enjoy here and now and are happy to be dominated by immediate
experiences. They are open-minded, not skeptical and this tends to make them enthusiastic about
anything new. Their philosophy is: I'll try anything once'. They tend to act first and consider the
consequences afterwards. Their days are filled with activity. They tackle problems by
brainstorming. When they finished one task they looked busy in searching new. They tend to

60
thrive on the challenge of new experiences but are bored with implementation and longer term
consolidation. They are gregarious people constantly involving themselves with others but,
along with it they want to remain at the center of all activities.
i. Reflector:
Reflectors like to stand back. They don’t indulge themselves in new experiences
they only observe from different perspectives. They collect data, both first hand and from
others, and prefer to think about it thoroughly before coming to any conclusion. They
collect data through all aspects before making decision. They postponed the decisions
until they reach at definite stage. Their philosophy is to be cautious. They are thoughtful
people who like to consider all possible angles and implications before making a move.
They prefer to take a back seat in meetings and discussions. They enjoy observing other people
in action. They listen to others and get the drift of the discussion before making their
own points. They tend to adopt a low profile and have a slightly distant and tolerant view.
When they act they have past as well as the present data and others' observations as well as
their own.
ii. Theorist:
They are rational, logical and analytic. Theorists adapt and integrate observations
into complex theories. They tried to solve problem in a logical way. They assimilate
disparate facts into coherent theories. They tend to be perfectionists who won't sit until things
are tidy and fit into a rational scheme. They like to analyze and synthesize. They are keen thinkers
on basic assumptions, principles, theories, models and systems. Their philosophy praise
rationality and logic. 'If it's logical it's good'. Questions they frequently ask: "Does it make
sense'? .... How does this fit with that? .... What are the basic assumptions'?" They tend

61
to be detached, analytical and dedicated to rational objectivity rather than anything subjective or
ambiguous. Their approach to problems is consistently logical. This is their 'mental set' and they
rigidly reject anything that doesn't fit to it. They prefer to maximize certainty and feel
uncomfortable with subjective judgments, lateral thinking and anything flippant.
iii. Pragmatist:
Pragmatists are keen on trying out ideas, theories and techniques to see if they
work in practice. They positively search out new ideas and take the first opportunity to
experiment with applications. They are the sort of people who return from management
courses brimming with new ideas that they want to try out in practice. They like to get
on with things and act quickly and confidently on ideas that attract them. They tend to be
impatient with ruminating and open-ended discussions. They are essentially practical,
down to earth people who like making practical decisions and solving problems. They respond
to problems and opportunities 'as a challenge'.
Their philosophy is: "There is always a better way' and 'If it works it's good'.
This theory was come after Kolb’s and considered equivalent to Kolb’s experiential
learning theory.
c. Anthony Gregorc’s Style Delineator
Gregorc (1982) proposes that people differ in organizing the space and time.
Individuals have two significant types of mediation abilities: perception i.e. the way in
which information is grasped and second is ordering i.e. the way in which information is
arranged; systemized and deposited. Perception has two qualities abstractness and
concreteness. Ordering has two dimensions: sequential and random. According to

62
Gregorc these dimensions combined to provide four learning styles. Concrete sequential,
concrete random, abstract sequential and abstract random.
i. Concrete sequential
The learners having this style prefer step by step orderly approach to organize
information.
In General:
People of this style like clear structure with clear directions and deadlines.
They prefer to be told what to do and how to do it.
They are gifted at organizing according to an established or traditional pattern and
are good at maintaining that organization.
They like to collect discrete concrete facts or objects, classify them, chart and
report on them.
In the Classroom:
They prefer a world where there is a clear hierarchy,
Where there is a right answer and a wrong answer, and
Where tidiness and organization are rewarded.
ii. Concrete Random
These learners learn mostly by trail and error. They are also intuitive and
independent.
In General
Most famous inventors were probably dominant or strong in this style, which is
best known for creative problem solving and solving mysteries.
Typically, individuals of this style are divergent thinkers who dislike being told

63
what to do and how to do it. Directions for assembling or purchase are only for
reference if they can’t figure it out at their own.
On the other hand, people with this dominant style may take charge in emergency
and lead other people what to do and how to do it.
Often considered to be “trouble makers” in highly structured environments,
individuals with this dominant style will be valued for this ability to rise to the
occasion in an emergency.
In the Classroom
People of this dominant style are often very uncomfortable in the highly
structured and directive atmosphere that is typical in American education today.
They in turn can make traditional teachers uncomfortable either by their divergent
thinking (there is more than one “right” answer or way to do it.) or by their
tendency to ask questions (The most frequent question being, “Why?”).
According to Kathleen Butler, this style is the most likely to drop out of school
(as a way to solve the problem of their discomfort in school.)
Students with dominant Concrete Random style will thrive in an atmosphere that
permits individual problem solving, group brainstorming, simulation games and
competitive games.
They prefer a world where they are not told what to do, but have an opportunity to
learn by asking questions, where they can try to figure out things at their own, and
where the ability to provide leadership in crisis situations is rewarded.

64
iii. Abstract Sequential
These learners are strongly analytical and logical. They favor verbal form of
instructions.
In General:
People with this dominant style are a small proportion of the population, but they
are highly respected for their intellectual prowess and vocabulary.
They tend to organize thoughts around themes, with thematic piles on their desks
or shelves.
Books are a major part of the world of the person who has a high Abstract
Sequential style, particularly reference and non-fiction books.
In the Classroom
People of this style are highly independent learners who are gifted at analytical
thinking, who like to research independently, to hypothesize, and to debate
different sides of the same issue.
This style tends to like lecture-style instruction with some, but not too much,
practice.
They prefer a learning environment where a high degree of independence is
permitted and where academic excellence is rewarded, where the rightness and
wrongness of an answer is always open for debate.
iv. Abstract Random
These learners prefer unstructured environment and learn holistically. They show
strong visual preference toward instructions.

65
In General:
People with this dominant style are heavily influenced by the personal pleasure
they derive from a situation to satisfy their aesthetic or emotions.
They tend to be extremely attuned to the people and the emotional environment
around them.
They are often artistic.
In the classroom:
The most important thing for a teacher to do in order to effectively educate
students with this dominant style is to communicate that you like them. If they
feel that you like them, they will make enormous efforts to please you. If they feel
that you are cool toward them or actually dislike them, it is almost impossible for
them to learn in your classroom.
In general individuals who have a high Abstract Random style are easily
discouraged in the highly sequential world of the typical American classroom,
both because their dominant style puts them at a learning disadvantage and
because they are often criticized for their messiness, lack of attention to detail and
failure to follow directions.
Anxious to please, they do best when they receive emotional support, and are
allowed to learn through storytelling, pretending and creating.
They prefer a world that is warm and beautiful, where others are sensitive to their
feelings, and where sensitivity and artistic creativity are valued.
These students can often function better if taught to use a variety of colors for
taking notes and organizing information.

66
2.10.4. Cognitive and Personality Model
Cognitive and personality model described the inner most layer of Curry’s “onion
model” This model focuses individual’s deepest personality characteristics and how they
view the world. This model describes the level at which the deepest personality trait
shaped toward the world. The main theories falls in to this category are under:
a. The Felder & Silverman Learning Style Model
According to Felder & Silverman (1988, p.1) learning takes place in the outer and
inner environment of learner. It overlaps the middle and inner layer of onion model. They
classify students on five spectrums: Sensing/Intuitive, Visual/Verbal,
Inductive/Deductive, Active/Reflective and Sequential/Global. Every spectrum can be
defined as:
i. Sensing or Intuitive Learner
Sensor learners are concrete, practical, oriented toward facts and procedures,
where as Intuitive learners are conceptual, innovative oriented towards theories and
meanings.
ii. Visual or Verbal Learner
In this category visual learners prefer visually presented material, pictures,
diagrams and flow charts; where as verbal learners prefer written instruction and spoken
explanation.
All these learning styles which were presented by different Psychologists time to
time focus different aspects of student’s life. Some focus environment, some personality,

67
some senses but the majority focus the individual’s ability, individual’s thinking and
individual’s way of doing things.
2.11 Comparison of Eleven Major Learning Styles Models
The discussion on learning style is never ending. Many have been discussed in
previous section but there are more then that. Some learning styles focuses cognitive
theories some personality theories; other focuses environment; learning in group or
learning alone. The ultimate goal of every one was to trace out which is he most suitable
situation to enhance learning. In literature DeBello (1990) compare eleven major learning
styles models with respect to variables, populations, instrumentation and the research
methodology behind them.
The purpose of review of that portion of literature is not to miss any aspect or
component regarding the study. According to DeBello (1990) the pioneers of this field
observed individual student differences from varying vantage points. Most of them
perceived single or dual variables on a bipolar continuum; others conceived
multidimensional approach to the concept. Perhaps the most vital development in
education across the world is the concept of individual learners' preferences. Teachers,
school boards, and parents across the nation have become cognizant of various aspects of
learning styles, and it is incumbent upon those who would be educational leaders to
become knowledgeable and have awareness about current research in learning styles.
This part of literature examines the efforts of well known leaders of the field,
theorists who have developed and established reputations over the years. Learning style
models are reviewed on the basis of: psychometric analyses of Curry (1987), Patricia

68
Kirby's (1979) and the publications disseminated by the Center for the Study of Learning
and Teaching Styles at St. John's University, Jamaica, New York, and the personal
experiences and analyses of researcher.
DeBello gives certain reasons for the selection of these models,
(a) These represent a historical perspective;
(b) These have influenced others;
(c) These reflect individual practitioners' attempts to identify style;
(d) These are related to concurrent issues in education;
(e) These are research oriented;
(f) These are widely known in the field presented in Table 2-1.

69
Table 2-1: The models of learning Styles and elements of those models
Summary of Theorists
and Models Theorist Elements of model
Dunn & Dunn Environmental, emotional, sociological, physical,
psychological
NASSP Environmental, emotional, sociological, physical, psychological/cognitive, study skills
Hill Qualitative/theoretical symbols, modalities of inference, Cultural
Letteri Cognitive style
Ramirez Bio-cognitive style, bicultural
Reinert Perceptual modalities
Schmeck Cognitive processing, study methods, retention
Hunt Need for structure, need for authority dependent/ independent
Kolb Concrete experience vs. reflective observation/abstract conceptualization vs. active experimentation
Gregorc Perception/ordering
McCarthy Innovative/analytic/common sense/dynamic hemi-sphericity
Note. NASSP = National Association of Secondary School Principals

70
2.11.1 DUNN AND DUNN’s Learning Style Inventory
Kenneth Dunn and Rita Dunn were the earliest research practitioners worked in
the field of learning styles. Their model of learning styles can be classified as
multidimensional. As discussed in paragraph 2.10.1(a) these dimensions are
environmental, emotional, sociological, physiological, and psychological, and contain
twenty one subcategories, which the Dunns’ refer to as elements. These elements do not
impact equally on all learners. Those that affect individuals strongly are referred to by the
Dunns’ as strong preferences; others that are important, but influence less, are called
preferences (Dunn and Dunn, 1978).
The environmental stimulus includes the elements of sound, light, temperature,
and design (Dunn, 1978). Emotionality includes motivation, persistence, responsibility,
and structure. The sociological stimulus includes the elements of learning alone, in a pair,
or in a group, or as a part of a team, with an authoritative or collegial teacher, or in varied
treatments--in other words, a combination of social patterns. Physical elements include
perceptual modalities, the need for intake while learning, time-of-day energy periods, and
the need for mobility versus passivity.
The psychological dimension includes global/analytic, hemi-sphericity, and
impulsive/reflective characteristics. Although this stimulus is not assessed separately
through the Learning Style Inventory (LSI) (Dunn, Dunn, & Price, 1989), research
confirmed correlations between being strongly global and needing low light, sound, and
periodic breaks when learning, an informal design, and intake, and between being
strongly analytic and needing bright light, quiet environment while learning, a formal

71
design, and no intake and being persistent (Dunn, Bruno, Sklar, & Beaudry, in press;
Dunn, Cavanaugh, Eberle, and Zenhausern, 1982).
The Dunns’ model is based on diagnostic/prescriptive approach in which the
learners’ styles are identified through a self-report instrument and teaching techniques are
designed to respond according to the youngsters' styles. It is of key importance to the
theoretical structure of the model is the tenet that individual styles must be assessed and
that, if a learner is going to have the best opportunity to learn, instructional techniques
must be used that are congruent with each student's style. But it was found that not every
theorist agrees with that stance.
Criticism on Dunns’ approach is on his instrument that is used to assess style;
which is comprised of 100 items and requires approximately 30 minutes to administering.
That instrument was used in different forms for assessing learning style of youngsters in
Grades 3 through 12. The LSI Primary Version (Perrin, 1983), is an adaptation essentially
for young non-readers. The Productivity Environmental Preference Survey (PEPS)
(Dunn, Dunn, & Price, 1982) is a version intended for adults and may have applications
outside of the school setting.
The Reading Style Inventory (RSI), developed by Carbo (1984), relies on the
theoretical framework of the Dunn model is very much resemble with Gregorc’s,
McCarthy, and Kolb have certain conceptual similarities heavily steeped in Jungian
theory. Carbo’s RSI is an instrument that applies the Dunn and Dunn concept of learning
style to reading and is an adaptation of the LSI (Carbo and Hodges, 1989).
Extensive research by using the LSI has made it the most widely documented
assessment instrument (Dunn, Beaudry, & Klavas, 1989). Curry's (1987) review of 21

72
different learning/cognitive style models through psychometric analyses reported that the
Dunn and Dunn model had one of the highest reliability and validity ratings. The Ohio
State University’s National Center for Research in Vocational Education published the
results of a two-year study of instruments. It reported that the LSI had "impressive
reliability, and face and construct validity" (Kirby, 1979, p. 72). Since 1979, the LSI has
evidenced extremely high predictive validity. The award-winning, experimental, and co-
relational research with the LSI conducted at more than 50 universities distinguishes this
model's research base. Keefe (1982) identified the Dunns' model as being practitioner
oriented and the most widely used assessment in elementary and secondary schools.
2.11.2 NASSP’s Learning Style Profile
National Association for Secondary School Principals and St John’s University
started working at University’s Center for the study of learning and teaching styles. This
task was carried latter by National Learning Styles Task Force, under the leadership of
Keefe, assembled to examine the underlying attributes of each of the better known
learning style constructs. They want to create a single learning style instrument that
assessed a broad spectrum of research-based learning style characteristics. They adopted
the Letteri’s (1980) perspective, related to learning styles and information processing for
developing NASSP’s learning style model (Keefe and Monke, 1986).
The developed model encompassed physiological/environmental, cognitive, and
affective domains as well as an information-processing perspective. The instrument of
Learning Styles Profile (LSP) was a 42-page, 126-item assessment intended for use with
73
secondary students. Similar to the Dunn and Dunn model, LSP was computer scored and
tabulated, and respondents can get a printout of their individual Learning Style Profile.
Both the models have many similar components. Both addresses the study skills
which emphasize that student learn through their strongest modality or preference, are
reinforced through their secondary or tertiary strength, and are taught finally to apply the
new information creatively. (The LSP diverges to that philosophy.)
For LSP cognitive skill items were derived from Witkin’s Group Embedded
Figures Test (GEFT) perceptual responses from Reinert's (1976) Edmonds Learning
Style Identification Exercise (ELSIE), and environmental, affective, and physiological
items from the Dunn and Dunn model. Keefe reported that, while significant correlations
were established among the LSP, LSI, and ELSIE, no significant correlation emerged
between the LSP and the GEFT. Furthermore, Curry (1987) reported similar findings.
The NASSP’s Learning Style Profile is advancement because it represents the
first model to be created out of the diverse and occasionally opposite philosophies of
current theorists. Because of its relatively recent arrival, it was suspected that further
refinements of the instrument will be forthcoming, for its strongest reliabilities are those
of variables adopted from the Dunn and Dunn model. Keefe reported significant
correlations between the LSP and Reinert's ELSIE, which purportedly has no reliability
or validity (Curry, 1987).

74
2.11.3 HILL’s Cognitive Style Profile
One of the earliest theorists in the field of learning style was Joseph Hill (1976).
Hill was president of Oakland Community College in Michigan during the late 1960s and
early 1970s. He defined learning style is the process of searches for meaning. According
to Hill individual’s learning style is reflected when dealing with theoretical and
qualitative symbols; modalities of inference and cultural determinants. Each of those
components is discussed briefly in following paragraph.
The category of theoretical symbols is subdivided into auditory and visual
categories; each is further subdivided into linguistic and quantitative symbols. There are,
in addition, fifteen qualitative elements. Among the fifteen some develop visual
perceptions some audio some about six senses. Modalities of inference are the second
major category. An individual uses these forms of inferences in the process of obtaining
meanings of the situation. Specific elements included in this category are critical
thinking, contrasting and comparisons, relationships between measures, and hypothesis
development.
The third major element of Hill's model is cultural determinants. Hill’s cognitive
style is how individuals interpret symbols, and he believed that the meaning that is
assigned to symbols is shaped by one’s culture, and his family and peers influence the
culture. This element is one aspect of Hill’s Cognitive Style Profile. However, it gives the
base for the identification of cultural patterns in learning styles. Due to this reason it is
placed with the Ramirez' model. There is another view which emphasizes the family and
peers as perhaps more akin to the Dunns’ sociological stimulus in that both peer’s

75
orientation and authority orientation may be viewed as aspects of the individual's
immediate culture.
In either case, Hill provided the student’s learning styles with a great
consideration. Cognitive style mapping is the elaborated process of obtaining a cognitive
style profile. It involves a self-report test, which takes about 50 minutes to administer, as
well as an interview component.
The Cognitive Style Interest Inventory was revised since Hill’s death; however, it
remains rather complex. Although Curry (1987) reported that this instrument showed no
reliability or validity, but the Hill's early attempt at a comprehensive diagnostic
prescriptive approach to learning style is worthy of study for the principles of learning it
presents.
2.11.4 LETTERI’s Cognitive Style Delineators
According to Charles Letteri's (1980) learning is information processing, the
storage and retrieval of information. It has six phases starting from perception, reception
to long term memory; failure at any phase represent the disability in acquiring cognitive
skills. In Letteri's view once a child has acquired these information processing skills and
become able to generalize it across the content area. The mastery of learning can be
achieved.
Letteri defined the cognitive style of the learner by seven different dimensions
like field dependence/independence; scanning/focusing; breadth of categorization;
cognitive complexity; reflective/impulsive; leveling/sharpening; and tolerant/intolerant.
After defining these dimensions Letteri develop items to assess these dimensions. The

76
instrument developed represents skills on a bipolar continuum. At one extreme they
appear as highly analytic where as at other extreme it appears as being highly global.
After research it was found that those learners who had above average success in
academic ask were reflective, analytical, focused, complex categorized narrowly, able to
see details sharply and tolerant. Such learner were referred as Type I learners. In contrast
the individuals who had below grade level performance in academic areas were
impulsive, global, non-focused able to view items only in a simple way, able to
categorize broadly, levelers and intolerant. These were the Type 3 learners. Type 2
learners were some where in the middle of two extremes.
In the field of learning styles today, there is debate on it over whether the efforts
can be made to change students’ style or not. Dunns’ view is that student should be
taught according to their strengths and abilities and the learning style assessment should
serve only for diagnostic purpose. Gregorc gives the importance to students’ individuality
and in this way presents middle way. Whereas Letteri is at the opposite extreme, not only
by suggesting adaptation or flexibility, but also advocating training to actually change the
students’ cognitive profiles.
Letteri's approach was clinical; he believes that the schools’ should translate
curriculum on the basis of cognitive profile of student needed for school achievement and
success.

77
2.11.5 RAMIREZ’s Child Rating Form
Ramirez and Castaneda (1974) defined learning style in terms of the cognitive
style dimension of field dependence/independence and cultural differences. He focuses to
the behaviors emerged from the bi-cognitive and bicultural dispositions. According to
Ramirez the students who are field sensitive are group oriented, they are sensitive to the
social environment and positively responsive to adult modeling, but less sensitive to the
spatial incursions of others, less comfortable with trial and error, and less interested in the
minute detail of tasks and are non-social.
Ramirez focuses minority populations of California for his work. He believes that
student-socialization process contributes to their cognitive development. According to
Ramirez in the result of socialization practices, the average Mexican American, black and
other minority students more field sensitive than the field independent, or more global
than the analytic. By understanding students needs the classrooms can be made more
responsive to developing field-sensitive learning approaches. He believes that by the
encouragement minority students can become bi-cognitive and have ability to function in
two extreme settings and become bicultural.
Ramirez was concerned that by ignoring the difference in groups stereotyping
increased and in the result diversity with in culture has also been ignored.
The instrument was developed by Ramirez and Alfredo Castaneda was called the
Child Rating Form. It was direct observation form showing frequency of behaviors. It
could be completed by the teacher or senior student in a self report survey. Ramirez has
worked in bilingual education and has developed a primary bilingual program, “Nuevas
Fronteras” based on his learning style model.
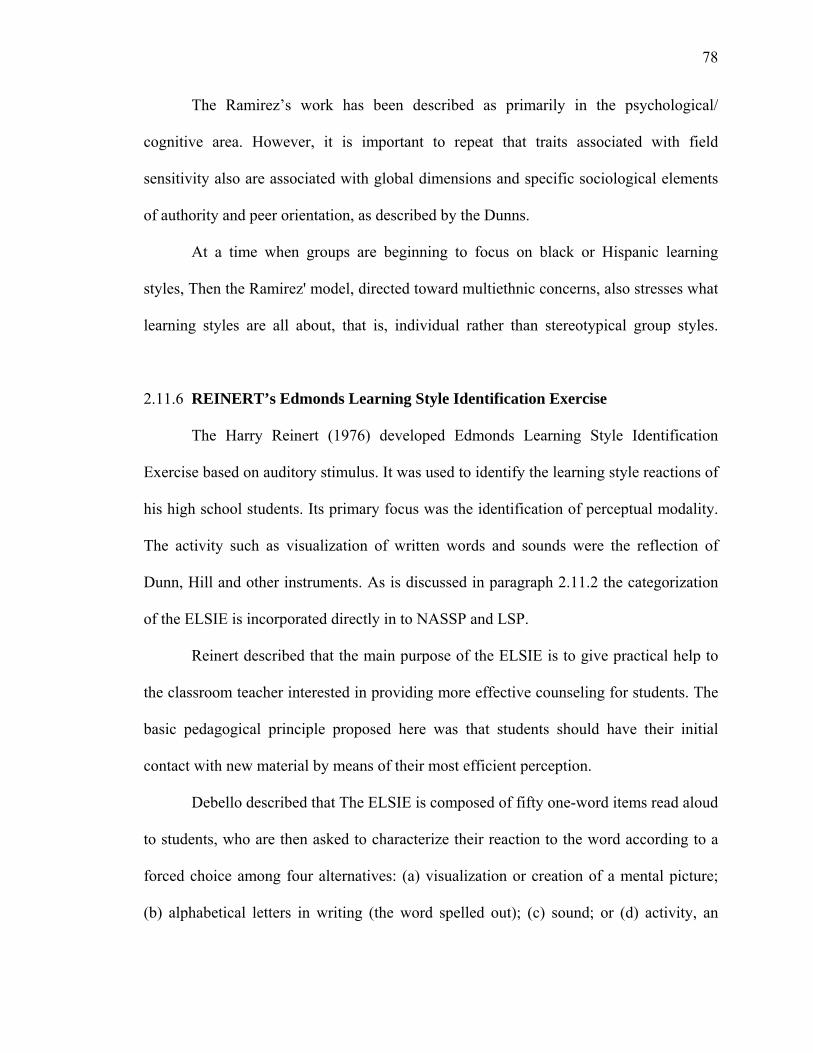
78
The Ramirez’s work has been described as primarily in the psychological/
cognitive area. However, it is important to repeat that traits associated with field
sensitivity also are associated with global dimensions and specific sociological elements
of authority and peer orientation, as described by the Dunns.
At a time when groups are beginning to focus on black or Hispanic learning
styles, Then the Ramirez' model, directed toward multiethnic concerns, also stresses what
learning styles are all about, that is, individual rather than stereotypical group styles.
2.11.6 REINERT’s Edmonds Learning Style Identification Exercise
The Harry Reinert (1976) developed Edmonds Learning Style Identification
Exercise based on auditory stimulus. It was used to identify the learning style reactions of
his high school students. Its primary focus was the identification of perceptual modality.
The activity such as visualization of written words and sounds were the reflection of
Dunn, Hill and other instruments. As is discussed in paragraph 2.11.2 the categorization
of the ELSIE is incorporated directly in to NASSP and LSP.
Reinert described that the main purpose of the ELSIE is to give practical help to
the classroom teacher interested in providing more effective counseling for students. The
basic pedagogical principle proposed here was that students should have their initial
contact with new material by means of their most efficient perception.
Debello described that The ELSIE is composed of fifty one-word items read aloud
to students, who are then asked to characterize their reaction to the word according to a
forced choice among four alternatives: (a) visualization or creation of a mental picture;
(b) alphabetical letters in writing (the word spelled out); (c) sound; or (d) activity, an

79
emotional or physical feeling about the word. Some examples used are ocean, good, God,
and foot.
Keefe reported a significant .002 correlation between the ELSIE and the
corresponding subscale elements of the NASSP LSP. However, summative psychometric
ratings reported by Curry (1987) showed the ELSIE as having poor reliability and no
validity.
2.11.7 SCHMECK: Inventory of Learning Processes
Ronald Schmeck has background in psychology also worked for learning styles.
He believes that cognitive and personality studies are useful but not decisive for learning,
while the learning styles as a construct would be more useful.
According to Schmeck's learning style is a predisposition on the part of some
learners to adopt a particular learning strategy regardless of the specific demands of the
learning task. Learning strategies, as defined by Schmeck, are a pattern of information-
processing activities that the individual uses to prepare for a test of memory.
Schmeck views this information processing as a continuum; on one extreme,
shallow/repetitive and reiterative processor; on the other extreme, deep and elaborative
processing. Shallow processors tend to remember the symbols used in communication; as
depth of processing increases, the number of conceptual associations increases, giving the
material more meaning. Thus, elaborative processors do more than just remember; they
classify, compare, contrast, analyze, and synthesize information. (This might well be
compared with the higher levels of the Bloom taxonomy.) Thus, shallow processing is
not a separate style, but it is one point on a continuum.
80
Schmeck's original Inventory of Learning Processes (Schmeck, Ribich, and
Ramanaiah, 1977) was a self-report instrument comprised of 62 items to assess students'
behavioral and conceptual processes. Geared to the college student, as most of Schmeck's
research and work are, this true/false format arranged items into four scales: synthesis
analysis, study methods, fact retention, and elaborative processing. One example of the
relationship among these elements has been posed by Schmeck: It is possible to retain
facts whether one processes in depth or shallowly. However, Schmeck's research has
determined that those who retain facts by processing deeply and attending to facts were
more successful academically than those who processed shallowly and also attended to
facts. The latter could be said to be the memorizer, the one who retains information
verbatim with little understanding.
Just one further comment on the study methods scale: Those students who studied
often by using drill type, classic, how-to-study methods were found by Schmeck in one
study to have high achievement motivation but to lack the skill or ability necessary to
engage in deep or elaborative processing. In fact, additional research has suggested that
students who score high on that scale are "eager to please." Such data increase the
dimension of the Schmeck model, and provide insight into the authority orientation of the
learner.
In 1984, a later refinement of the instrument developed in conjunction with
Entwistle and Ramsden expanded on the initial construct. Schmeck's instrument was
designed solely for college students. After the analysis of it, Curry characterized it as
having strong reliability and validity.

81
2.11.8 HUNT: Paragraph Completion Method
According to David Hunt learning style is a condition under which students are
most likely to learn. The Hunt’s model is the conceptual level based on the description of
students need for structure (Hunt, Butler, Noy, & Rosser, 1978). According to Hunt those
students who have low conceptual level are concrete and impulsive; they have poor
tolerant for frustration. They require a great deal of structure in academic setting. The
learners who have average conceptual level are referred as conforming or dependent.
They depend on rules and authority and are categorical thinkers. Such learners require
structure but should with some choices. Those at the high conceptual level are referred as
independent they are described as inquiring, self-assertive, questioning requiring less
structure.
The learning style models discussed yet insisted that students’ styles should be
changed, some argued that teaching may be changed to the individual’s strength. Hunt
promotes both the contemporaneous or developmental perspective. The contemporaneous
view indicates that the student with low cognitive-level in the classroom must be given
structure if the teacher is to facilitate learning; however, for long-term purposes, at initial
stage provide high structure and gradually decrease the amount of structure so that self-
initiative can develop.
That perspective is similar to Schmeck's, who agrees that learning styles can, and
sometimes should, be modified slowly over time (specifically encouraging shallow
processors to become elaborative processors).
Hunt's assessment instrument is called the Paragraph Completion Method. It
consists of six lead sentences, which the learner is directed to complete and write more

82
about. Examples include: "What I think of school... "and "When I am criticized... ". The
specific response is important in terms of the complexity of the response, not the opinion
stated. Hunt's is a semi-projective assessment that requires specific training to score and
interpret. Curry (1987) reported fair reliability and fair validity for this instrument.
Thus, Hunt's approach to learning style takes two dimensions--conceptual
complexity and need for structure and relates each in a developmental framework.
2.11.9 KOLB’s Learning Style Inventory
David Kolb gives his conceptual framework of learning styles known as
experiential learning model. It is based on simple description of the learning cycle of how
experience is translated into concepts.
This is a four-stage cycle. It starts from concrete experience which is the basis for
observation and reflection. Those observations are assimilated into theory from which
new implications for action can be deduced. These implications serve as guide lines in
acting to create new experiences. Thus, the cycle has evolved.
To be effective, the learner requires abilities that are polar opposites: concrete
experience versus abstract conceptualization and active experimentation versus reflective
observation. However, as a result of hereditary equipment, past experiences, and the
demands of present environments, most people develop learning styles that emphasize
certain learning abilities over others.
Kolb's Learning Style Inventory (1976) is a 9-item assessment form with 4 sub-
items. In the result four dominant types of learning styles have emerged. The first type is
converger. These person’s dominant learning abilities are abstract conceptualization and

83
active experimentation. Their strength is practical application of ideas. The second type is
diverger. They have opposite learning strength as the converrger. They are best at
concrete experiences and reflective observation. Their strength lies in their imaginative
ability. The third is assimilator. Their dominant learning abilities are abstract
conceptualization and reflective observations. Their strength lies in their ability to create
theoretical models. The last type is accommodator. Their learning abilities are concrete
experience and active experimentation. Their strength lies in carrying out plans and
experiments, and involving themselves in new experiences.
Kolb’s model and instrument were designed and used for adults and for
management training. Curry (1987) reported strong reliability but only fair validity.
2.11.10 GREGORC: Gregorc Style Delineator
Gregorc's model (1982) is based on that learning style which consists of
distinctive, observable behavior. It provides the clues about functioning of individual’s
mind and the way they relate to the world. It suggests that individuals learn in
combinations of dualities, specifically, perception and ordering. Abstract, concrete,
random, and sequential proclivities have been found by Gregorc to combine into several
styles.
Four distinct learning patterns can be observed in this model. Some exhibits all
four patterns to some extent, other show inclination towards one or two. For example
concrete sequential acquire knowledge through direct hands on experience. They
appreciate order and the direct step by step instructions. Concrete random learners prefer
experimental attitudes and behaviors. They like to use trial and error approach, they like

84
to initiatives. Abstract sequential learners have excellent decoding abilities with written,
verbal and image symbols. They prefer to learn in rational and sequential manner they
love to learn from authorities rather than active experimentation. Abstract random
learners are distinguished by their attention to human behavior and their capacity to
interpret vibrations. They prefer to receive information in an unstructured manner and,
therefore, prefer discussions and activities that involve multi-sensory experiences.
Gregorc believes that styles emerge from in-born predispositions, and it can be
stream lined and modified. Gregorc assesses style with a self-report inventory called
Gregorc Style Delineator. IT is based on the rank ordering of four words in each of ten
sets. It is similar in format and design to the Kolb Learning Style Inventory like the
Dunns’ And Hunt, Gregorc emphasis the matching of instructional material and method
to meet the needs of individual preference.
2.11.11 McCARTHY’s 4 MAT SYSTEM
McCarthy’s was impressed by Kolb’s learning style model. She believes that all
people sense and feel observe and think experiment and act. She observes and proposes
that all learners move continually between abstract conceptualization and concrete
experience while learning.
McCarthy observed learning pattern and identify four learning styles clusters.
Those were innovative, analytics, common sense and dynamics. The innovative are
curious, aware, and perceptive; analytic’s are critical, fact seeking, and philosophizing;
common-sense people are hands-on, practical, and give importance to the present;
dynamics are risk taking, adaptive, inventive, and enthusiastic.

85
McCarthy identifies the left-brain function as being associated with verbal and
field-independent activity and the right-brain function as being responsible for
visual/spatial, field-dependent activity. McCarthy proposes a spiral process of learning.
The learner enters in to this process through motivation which comes from the right brain
structure. This is the sensing/feeling activity for the innovative learners at next stage the
activity analyzed completely which provide investigative, intellectual exercise. It appeals
to analytic learners. Once the concept has been formulated learner’s practice working
with the concept the left brain tried to mastery the concept. This relates to common sense
hands on practice and personalization. Finally the learner is asked to make right brain
choice of alternatives and apply as many as possible to real world situation.
Thus, all four styles are presented with accompanying left/right hemispheric
activities in every lesson. This concept provides the concrete experiences to learners, and
the cycle is set for another move through the entire spiral.
According to McCarthy’s point of view by using this spiral concept of full-circle
training, regardless of the individual’s learning style all the students may be provided an
opportunity of being taught through their style strength.
By the very nature of this model’s approach, instrumentation such as the Kolb
Learning Style Inventory appears secondary to the instructional plan in that, regardless of
students’ learning styles, all receive the same instruction in exactly the same pattern for
exactly the same amount of time.

86
2.11.12 CONCLUSION
The whole discussion leads to general consensus concerning the importance of
addressing learning style by all the theorists. After review the chart, there are many areas
of overlap among the models. Interest in specific areas such as psychological/cognitive is
apparent; however, multidimensional models seem to offer a more thorough,
encompassing, and responsive approach to the complexity of diversified differences in
how students actually attend to, absorb, and retain new and difficult material.
Clearly, two major issues remain constant. The first is whether to teach to
students' strengths or to attempt to expand their style. It may strike some observers as an
irrelevant exercise to identify style and then to set about ignoring it. However, a broader
problem remains before a firm decision can be made. If psycho-biologist Richard Restak
(1979), author of The Brain: The Last Frontier, and Yale psychologist are correct in their
point of view then the learning styles are biologically imposed on humans. If someone
able to change the style than he/she may be permanently changes the color of eyes, hair,
or skin. Research by Kagan (1966) and others appears to confirm that view. However,
can it be modified, or to follow the medical analogy further, offer cosmetic surgery in the
classroom? The debate continues.
The second issue revolves around whether or not teachers can observe the
differences among students' styles or whether valid and reliable instrumentation should
be used. While teacher observation checklists can serve a function, even they may require
some training and experience on the part of the teacher. In addition, several studies
revealed that, although teachers may identify certain learning style characteristics through
observation, they often misinterpret many others (Beaty, 1986; Dunn, Dunn, & Price,

87
1977; Marcus, 1977). As it has been seen, many models of style require not only training
in administration but also interpretation of the assessment. The decision by a school or
district to take that step should include knowledge of the validity and reliability of the
instrument.
Certainly, there is enough room in this newly emerging field for differences and
even dissension among theorists. Their differences of opinion forced to pay attention to
what they have proposed. Their beliefs are honest and have integrity, but some are based
essentially on theory and others on extensive research in schools at every level. One is
not necessarily better than the other--they may be mutually complementary--but some
have exercised the obligation of providing strong experimentation behind the suggested
practices, and others have not as yet been able to do that. However, the decision
concerning which model is to be used in school should rely on the following: First, is it
reliable and valid? For that information, Curry's (1987) psychometric review of
instrumentation can be consulted, which is available from the Center for the Study of
Learning and Teaching Styles, St. John's University, New York. Second, is there
widespread practitioner use? For that, it may be referred to the Association for
Supervision and Curriculum Development (ASCD) Directory of Practitioners, available
from the ASCD in Alexandria, Virginia, the ASCD's Clearinghouse Bulletin and St.
John's University's Learning Style Network Newsletter, both of which provide such
information in every issue; and Dunn and Griggs' (1988) Learning Styles: Quiet
Revolution in American Secondary Schools.
Third, is there extensive research behind the model? For this it is suggested that
examine either Dissertation Abstracts International or research journals or examine the
88
Annotated Bibliography (1990) available through the Center for the Study of Learning
and Teaching Styles, St. John's University, New York. Fourth, can the school be visited
actually using the model in which you are interested? The ASCD's Directory of
Practitioners (1985-1989) is especially helpful, and anyone can make use of it. At the
secondary level, Learning Styles: Quiet Revolution in American Schools is the best
source. If it works for them, it can work for anyone. When visit made to schools, ask for
evidence of how student achievement has increased or whether attitudes or behavior have
improved. Ask how they know those things have happened? Finally, can training be
designed and provided to teaching staff so that they may be able to know how to use
individual styles to obtain increased achievement? Both Wedlund and Gregorc insist that
there is a danger in having only a little knowledge about styles and then trying to
implement school-wide programs. Identify either well-known practitioners or well-
respected theorists and spend the time it takes to really learn to implement a learning
styles program. The research is very clear on this point: All children have individual
learning styles. While some may disagree as to the treatment of style differences in the
classroom; educators today cannot ignore the impact of this revelation.
Treating every child in the classroom the same way is not responding to their styles.
Teachers and parents want more for students than the old hit-and-miss strategies of the
past. Minimally, both want to help the underachiever and enhance the potential of
successful students. Research affirms that learning styles-based programs statistically
increase student achievement (Dunn, Beaudry, & Klavas, 1989).

89
2.12 Assessment of Learning Styles
This article was written by Huisun Roh in 2004 due to the relevancy with the
current discussion it is included with modification. In order to maximize achievement and
study the effect of learning style, teachers need to know how to assess effectively
students’ learning styles. Question is whether students can identify their own learning
styles or not? Dunn (2002) found that most third through twelfth grade students know not
only their strong learning preferences but also weak ones in testing. In addition, to know
the subject’s learning preferences, Black (2004) uses a simple question, asking someone
for reflection. Subjects are taught either by drawing a map or telling the students directly.
Black (2004) described that if subjects are visual learners, they would draw a map; if they
are auditory learners, they would prefer telling the person how to go. Therefore,
according to Black (2004) and Dunn (2002), people can distinguish their own preferences
and also students know not only their learning styles but also strong and weak
preferences without assessing their learning styles.
Nevertheless, many researchers have concentrated on how to assess individuals’
learning styles by developing distinct models and assessment instruments. DeBello
(1990) wrote that there are as many different methods of assessment of learning styles as
there are various definitions of learning styles. DeBello (1990, p. 2) compared and
analyzed each model and chose eleven major learning styles models based on historical
consideration, mutual influence, and concurrent issues in education, among other styles.
The eleven learning styles models he analyzed were Dunn & Dunn’s Learning Style
Inventory (LSI), NASSP’s Learning Style Profile (LSP), Hill’s Cognitive Style Profile,
Letteri’s Cognitive Style Delineator, Ramirez’s Child Rating Form, Reinert’s Edmonds
90
Learning Style Identification Exercise (ELSIE), Schmeck’s Inventory of Learning
Process, Hunt’s Paragraph Completion Method, Kolb’s Learning Style Inventory,
Gregorc’s “Gregorc Style Delineator”, and McCarthy’s 4 Mat System.
First of all, according to DeBello’s (1990, p.4) comparison, the most common
type of assessment is self- report. One example is Dunn & Dunn Learning Style
Inventory (LSI), based on a diagnostic and prescriptive approach, designed for third to
twelfth graders. Their LSI, as reported by Curry (1977), in which students are given thirty
minutes to check one hundred items, resulted in “one of the highest reliability and
validity ratings”. Also, NASSP’s Learning Style Profile (LSP), similar to the Dunn &
Dunn model, intended for secondary students, and includes 42 pages and 126 items.
Schmeck’s Inventory of Learning Process, which consists of 62 items arranged into four
scales, is another self-report instrument to assess college students’ behavioral and
perceptional process. In addition, Kolb’s Learning Style Inventory, which consists of nine
items with four sub items, is intended for self-reporting adults.
Second, Reinert and Hunt’s models offer different methods to assess students’
learning styles. For instance, Reinert’s Edmonds Learning Style Identification Exercise
(ELSIE), designed for high school students, is composed of 50 one-word items. First, a
teacher reads those words to students aloud, and then a teacher characterizes their
students’ reaction into one of four categories: “visualization”, “spelling”, “sound”, or
“feeling”. Reinert’s model, a primarily perceptual model for identifying learning styles, is
intended to help classroom teachers practically counsel students more effectively.
Meanwhile, Hunt’s Paragraph Completion Method consists of six lead sentences, which

91
students are directed to complete. In this model, the complexity of the response is more
important than the opinion given by the student (DeBello, 1990).
Third, according to DeBello’ (1990), some models include other methods such as
interviews or observation. For example, Gregorc’s Gregorc Style Delineator, similar
Kolb’s Learning Style Inventory in form and design, is a self- report assessment. This
model, suggests using observation and interviews together to help in classifying learning
preferences, in addition to student’s ordering of four words in each of ten items. Also,
Hill’s Cognitive Style Profile, including interviews, is a self- report test that takes about
fifty minutes. Hill mentioned “culture factor” because he believed people, by interacting
with each other, are shaped by their culture, family, and peers. In comparison, Ramirez’s
Child Rating Form is a direct observation by the teacher, or if students are old enough,
they can do it as a self-report observation. Ramirez emphasized that learning styles are
not stereotypical group styles but individual.
In brief, it is common that most students know their preferences of learning, or
teachers are sometimes aware of students’ learning styles by asking directly. Moreover,
through using learning style assessment instruments such as questionnaires, opinionnaire,
observations, interviews or some combination of those, teachers can examine students’
learning styles.
2.13 Teaching styles
There are many teaching styles such as authoritarian teaching style, permissive
teaching style, and detached teaching style. The teaching styles are defined by different
authors in different ways. According to Galton it is instructional format. Daniel Schneider

92
thinks that teaching styles refer to the teaching strategies and methods employed plus use
of certain kinds of rhetoric. Anthony Grasha (1996) identifies five approaches for
classroom teachers. These are as follows:
1. Expert
This is teacher centered approach. Teacher possess this style have knowledge and
expertise which students need. He tried to maintain his status as an expert among students
by displaying detailed knowledge. They challenged students to enhance their
competence. They are concerned with transmitting information and insuring that students
are well prepared.
The advantage of this style is the teacher possesses all type of information,
knowledge and skill regarding their field. The disadvantage of the style is that if it is over
used the students with less abilities may be less motivated.
2. Formal Authority
The person possess this style achieve status among students because of his
knowledge and expertise usually they are faculty members. They are concerned with
providing positive and negative feed back without imposing anything. He establishes
learning goals, expectations and rules of conduct for students. They are concerned with
the correct, acceptable and standard ways to do things keeping in mind the ways students
learn. The advantage of this style is they focus on clear expectations and acceptable ways
of doing things. The disadvantage of this style is with a long duration the relationship
become mechanical. It can lead to rigid, standardize and less flexible ways of managing
students and their concerns.

93
3. Personal Model
They believe in teaching by personal examples and develop a prototype for how
to think and behave. They direct students by showing how to do things and ask them to
observe and respond in the same way as instructors approach. They are less creative. The
advantage of this style is it emphasis on direct observation and follows a role model. The
disadvantage of this style is that the person possess this style believe that his approach is
the best way to lead students and those students who can not live with this approach feel
inadequate.
4. Facilitator
The person possesses this style give more regard to the teachers students
relationship and the interaction. He guides and direct students by asking questions,
exploring options, suggesting alternatives and encouraging them to develop criterion to
make informed choices. Their aim of teaching is to develop the capacity for independent
action, initiative and responsibility in students. They work with students on projects in a
consultative fashion and tries to provide as much support and encouragement as possible.
The advantage of this style is, this person is flexible, the focus is on the needs and
goals of students and they have willingness to explore options and alternative course of
action. The disadvantage of this style is it is time consuming and is some time employed
when a more direct approach is needed. It can make students uncomfortable if not
employed in a positive and affirming manner.

94
5. Delegator
It is concerned to develop student’s capacity to work in an autonomous fashion.
They give free hand to students to work independently on projects or as part of
autonomous team. The teacher is available at the request of students as a resource person.
The advantage of this style is it helps students to perceive themselves as an independent
learner. The disadvantage is that the opinion about student’s readiness for independent
work may be wrong and some students become anxious when given autonomy.
The teaching styles were not addressed during this study there were two reasons.
One is there are eight or nine teachers teaching to secondary class students at the moment
and there are many who taught them in preceding classes no one can say that the students
this specific learning style is due to which teacher. The second reason is the achievement
of the students is considered as a whole, no subject-wise description was taken so no
body can judge which learning style of students is due to which teacher’s teaching style.
2.14 Anthony F. Grasha the Author of the Learning Style Questionnaire
About 30 years ago Anthony F. Grasha wrote a twelve page essay describing the learning
styles of students as part of his research. Although at that time author was not engaged in
research program but this idea ‘the different ways students used to learn in classes
fascinated him. He developed a questionnaire and surveyed students about how they
learn. Along with students responses he made informal observation of students in
classroom to develop and finalize questionnaire. The essay was accepted by American
Psychologists and gets published. This article generates a considerable amount of interest

95
in author’s view on learning style and he changed his career and associates himself with
learning styles.
He started teaching learning issues with other perspectives, like the role of
students learning styles and teachers teaching styles in classroom. After going though
extensive study and research author give different dimension to the idea and wrote a book
in 2002 “Teaching with Style” which was an extension of his previous work. He made
serious efforts and conducted hundred workshops and seminars. During his studies he
also developed Teaching Style Inventory after conducting extensive interviews on the
problems college faculty faced in classroom across different disciplines and presented in
his book. He presented an integrated model of teaching and learning style in his book.
This model examines the relationship among learning styles of Competitive,
Collaborative, Independent, Dependent and Participant, Avoidant and teaching styles of
Expert, Formal Authority, Personal Model, Facilitator and Delegator. According to
author teaching styles learning styles and classroom processes are seen as interdependent.
Many researches were conducted but with different angle. The researcher got the idea of
current research by Grasha’s idea with little difference. Grasha was impressed that
teaching styles effects students learning styles but researcher start thinking what else
effects learning style whether this theory holds in Pakistani situation or not? Researcher
started with the assumption that teacher’s teaching styles are same then what else affects
learning styles. The study is the continuity of that idea.

96
2.15 The original questionnaire of Grasha & Riechmann
The original questionnaire of Grasha & Riechmenn was developed in 1974. It has
ninety statements covering all six learning styles defined by them. These styles were
Independent, Dependent, Collaborative, Competitive, Participant and Avoidant. This
questionnaire was used by many psychologists for identifying the learning styles of
students. After extensive research it was finalized with sixty statements ten for each
learning style. These statements were designed on the five point likert scale method for
responding. Students respond these statements by number 5 if they are strongly agreed
with the stem, by 4 if agreed, similarly by 3, 2 and 1 if uncertain, disagreed and strongly
disagreed respectively. This questionnaire was adopted by the researcher after asking for
the permission from the author. The permission was applied by e-mail but got no
response. This version is available on internet along with the detailed scoring manual.
The statements were placed in a specific sequence while assembling the questionnaire to
avoid the influence of the learning styles on students. The statement of each learning
style was in sequence of independent, avoidant, collaborative, dependent, competitive
and participant. The idea of the author was used and statements were rephrased for the
current study. The same scoring procedure was used as described by the author.
2.16 General Concept of Achievement
2.16.1 What is achievement?
Achievement is a thing you did which added value made a tangible or notice able
difference and contributed to the advancement of the person. Achievement is measured
by performance indicators like percentiles and ranks. If a class showed the achievement

97
of the last student as 80% marks it showed nothing because no one can comment without
further information like what was the achievement of student who stood first in class and
others. What was the rank or position of a student in a class who got 80% marks? If
evaluator found he was the last student it meant lowest achiever in the group. His
achievement was very poor as he did not achieve the objectives. Attainment of goals or
objectives is called achievement. Achievement is doing what you want to do with in the
set criteria. It is recognition of what makes you unique and what you have to offer others.
Achievement is difference in prior and later attainment. It is difference between pervious
and final stage skill, knowledge and ability. It is the measure of quality and quantity of
the success in knowledge skill and ability one have. According to Dictionary of
Education (2005) “achievement is a successful accomplishment or performance in
particular subjects, areas or courses, usually by reason of skill, hard work and interest”.
For the students achievement is successful accomplishment of learning task.
According to web definition “achievement is ability to demonstrate, accomplishment of
some outcome for which learning experiences were designed.” Achievement is an
abstract concept it could be judged or measured by some criteria. In the Ofsted Hand
Book (2002, p.2) achievement is defined as it is judged with reference to the progress
made by individuals and groups of students taking in to account their prior attainment and
potential”.
2.16.2 Types of achievements
Achievement is of two types materialistic and non-materialistic. In materialistic
person get some physical reward in terms of money, grades, gifts etc but in non-
materialistic achievement the person cannot get reward physically. It only can be felt in

98
the form of happiness, kindness helping others etc. The materialistic achievement
develop cognitive domain of learning and non-materialistic achievement develop some
aspects of affective domain of learning (Bloom’s Taxonomy of Educational Objectives).
The former can be measured by different measuring tools but latter can only be
observed and felt, it can not be measured exactly it is pursuit of dream. It is liberty from
the chains fear and unbelief. Most of the students are concerned with their learning
achievement because learning achievement begins when a child start reading and able to
learn. The child’s most important learning challenges and achievement started to acquire
at home before entering the school where he learns some of its achievement which further
modified in school. When the child enters in school he learns to walk and talk, to be
organized and disciplined, he learns thinking and reasoning he further learn to make
relation and connection which helps them throughout their lives. This trained them to
adjust in the society. If they don’t learn to adjust at this stage it will be difficult for the
person later on.
2.16.3 Measuring learning achievements.
Learning achievements can be measured by three ways.
a) Oral measurement
b) Written measurement
c) Worked sample measurement.
a) The oral measurement of achievement
Learning achievement can be measured by oral test, which is in form of interview,
quiz, discussion viva-voice etc.

99
i. Interview:
The interview is an oral questionnaire or test. Instead of writing the response the
interviewee responds orally. It is a face to face meeting in which some aspects are
discussed regarding the issue. According to Patton (1990, p.278) the purpose of interview
is to find out what is in or on someone else’s mind. The interview is often superior to
other measuring tools because people are usually more willing to talk rather than to write.
During interview the inter viewer can get all related information by asking the relevant
questions which helps to evaluate and distinguish the person’s organization of thoughts,
logical connection, creativity, innovation and novelty which can be missed on written
assignment. It also helps to motivate students for responding and hence the inter-viewer
can investigate deeply.
ii. Quiz
Quiz is a tool for measuring learning achievement (Linnen, 2003). Some time
student is not good at writing. They make spelling mistakes, which can be covered in
quizzes. Quiz is the procedure to measure learning achievement of individual as well as
group which provide immediate results. Students also feel satisfied by knowing instant
feed back. Teacher can also save time of markings papers and compiling the results.
iii. Viva- Voice
This test is oral. In which students learning achievement about the process and
procedures can be measured (Print, 1993, p.204). This evaluates the consequence and
procedure about the specific practical situation in which students have to be very careful.
Through this way of measuring learning achievement students learn to follow the steps
and instructions about specific situation carefully.

100
b) Worked Sample Test.
Worked sample test is also known as process evaluation test. In this test the actual
evidence of student work is frequently under-valued (Print 1993, p.204). It can depict
what the student is capable of. In schools, work samples are found commonly in writing,
reading, home economic, art, industrial arts, craft, physical education and so forth.
Greater use of work samples could probably be made in such subjects as geography,
history, social studies, science and mathematics.
c) Written Test.
The written tests are paper pencil test, which are specifically used to measure
learning achievement of students. There are two ways to use achievement test. One way
the performance of whole class is measured by comparing individual student’s
performance in the class and the other way students individual mastery level is measured
(Kobasa, 1998). In the first situation the test used as a tool is called norm-referenced test
and in second it is called criteria-reference test.
The norm-referenced test was defined by Kubiszyn and Borich (2003, p.57) as “A
test used to compare students performance to a norm or average of performances by the
other similar students is called Norm-Referenced Test (NRT)”. The Criterion referenced
test was first purposed by Glaser in 1963 which were closely resembles the concept of
mastery approach. According to Riaz (2008, p.3) “The essence of this approach lies in
comparing the test performance of examinees to some objectively stated goal or standard
of achievement to evaluate their mastery level”. The criterion referenced tests are
designed to measure how much of a specified content area has been learned, mastered, or
performed by the examinees.

101
The Criteria-Referenced Test (CRT) is defined as “a test on which student’s
performance is compared to a standard of mastery called criteria”. The first type of
information tells where students stand when compared with other students. In other
words this kind of test data helps to determine a student’s place or rank. Where as second
type of information provided by test tells about student’s level of proficiency in or
mastery of some skill or set of skills. As it is clear by the definition the CRT must be very
specific as it has to provide the information about the individual’s skills. The advantage
of this is to be specific about the student’s performance as he has achieved mastery of the
skill or failed to master the skill and its disadvantage is; it helps in making decision about
the multitude of skills which were typically taught in the average class room.
The Norm-Reference Test in contrast, tends to be general. At one side it measures
a variety of specific and general skills at once but on other side it fails to measure them
thoroughly and teacher can not say with confidence about the students mastery of concept
as he/she can say while using criterion referenced test. So that is teacher: who determines
the appropriate uses of test type to measure student’s achievement and mostly it is based
or decided on the purpose of testing. There are two types of tools used to measure
student’s achievements.
Teacher made test
Standardized test
i. Teacher Made Test
This test is prepared by subject teachers who are teaching to students. These tests
are designed for specific purpose like formative achievement measurement and for
diagnostic purpose. The main purpose of using this test is to measure what and how much

102
students have learnt as a result of formal or informal instructions. They measure the
present level of performance of individuals or groups in academic learning. When it is
used for diagnostic purpose it helps to what are strengths and weaknesses of students
where he is strong in learning and why failed to achieve other concepts.
ii. Standardized Test
Standardized test in contrast to teacher made tests are constructed and
administered carefully under certain standard condition so because of these standard
conditions these tests are called Standardized Tests (Linn & Miller, 2003)
The standardized achievement test has main distinction features including a fixed
set of test items designed to measure clearly defined achievement domain specific
directions for administering and scoring the test and norms based on representative
groups of individuals like those for whom the test was designed. Standard content and
procedures make it possible to give an identical test to individuals in different places. The
norms enable us to compare an individual’s test score with those of known groups who
also have taken the test. Thus test norms provide a standard frame of reference for
determining an individual’s relative level of test performance on a particular test.
There is another advantage of Standardized test as test is set of statements with
specific features like to refer to specific content with specific objectives for specific class
with specific statements of difficulty level and discrimination Index (Wiersma & Jurse,
1995, p.312). If these are multiple choice items the distracters have specific functions.
These test items are made Standardized by applying these conditions on it. Once these
were made standardized these can be used again and again. The procedure to make the

103
test standardized will be discussed in the section of introduction and functioning of Board
Intermediate and Secondary Education.
The test used for measuring the learning achievement of sampled students was
semi standardized. These tests were administered in four districts at the same time under
same standard condition in all districts. These test were basically norm-referenced test
constructed from the same content and on same learning standards in all districts and was
taught by the teachers with same methodology and same academic and professional
qualification. So the effects of student learning styles on achievement can be measured
along with the effect of socio-economic status of parents and of students can also be
studied because the environment of school in four districts was almost same.
2.17 Institutions Responsible for Measuring Learning Achievement in Pakistan
Boards of Intermediate and Secondary Education are the public sector institutions
working in Pakistan for measuring learning achievement of the students enrolled at
secondary and higher secondary schools. These Boards are working in each Division of
each Province of Pakistan and one Federal Board of Intermediate and Secondary
Education is working for measuring the achievement of students enrolled at the school
under the supervision of Federal Ministry of Education. The achievement of the sampled
student was measured by two institutions named as Federal Board of Intermediate and
Secondary Education (FBISE) Islamabad and Board of Intermediate and Secondary
Education (BISE) Rawalpindi.

104
a) Federal Board of Intermediate and Secondary Education Islamabad
Gazette book of Pakistan (2000) gives information about the Federal Board of
Intermediate and Secondary Education (FBISE) Islamabad. It was established under
FBISE ACT 1975, is an autonomous body of the Ministry of Education. It is empowered
with administrative and financial authority to organize, regulate, develop and control
Intermediate and Secondary Education in general and conduct examinations in the
institutions affiliated with it.
Jurisdiction of the Federal Board includes:
iv. Islamabad Capital Territory
v. All over Pakistan (Cantonments and Garrisons)
vi. Federally Administered Northern Areas
vii. Overseas
Roles and responsibilities are briefly described below:-
Affiliate institutions imparting SSC and HSSC education within Pakistan and
abroad.
Prescribe courses of instructions for SSC and HSSC
Ensure provision of requisite facilities in the affiliated instructions
Hold exams, appoint examiners and supervisory staff
Institute measures to promote physical well being of students
Conduct additional Examinations
o Allama Iqbal Gold Medal Competitive
o Primary Teaching Certificate and Certificate of Teaching
o Diploma in Education

105
b) Board of Intermediate and Secondary Education (BISE) Rawalpindi
Gazette book of Pakistan (2000) gives information about the Board of
Intermediate and Secondary Education Rawalpindi. It was established in October, 1977
as a result of bifurcation of BISE Sargodha under Punjab Boards of Intermediate and
Secondary Education Act NO. XIII of 197. The BISE Rawalpindi has since been
confined to the Districts of Attock, Chakwal, Jhelum and Rawalpindi.
The main objective of the Board is to hold and conduct all examinations pertaining to
Secondary School Certificate, Intermediate classical Languages and such other
examinations as may be assigned by the controlling Authority/Government of Punjab.
Main source of income of the Board is the examination and other fee collected from the
candidates. No grant-in-aid from Government or any financial Institution is involved.
The objectives of the Board are as follows:
i. To regulate and supervise the Secondary and Intermediate Education.
ii. To hold and conduct all examinations pertaining to Intermediate and Secondary
Education and Classical Language, PTC/CT/DM/OT and such other examinations
as may be assigned by the controlling authority/Government.
ii. To compile the result of the students who have appeared candidates and notify the
same and issue certificates to successful candidates.
iii. To promote the supports activities among the students.

106
2.18 The process of Standardization of Instruments Adopted by
BISE’s
FBISE Islamabad and BISE Rawalpindi both institutions were responsible to
measure and analyze the performance of students at the end of the session of SSC and
HSSC. The sampled students were enrolled in SSC program. At the end of the session in
March, 2007 the examining bodies decided to evaluate the learning achievement of the
secondary school students. For this purpose the external system of evaluation was used as
a routine. Normally the FBISE Islamabad and BISE Rawalpindi use paper pencil test to
measure learning achievements of the students. No other method of assessment is used
for the certification of student’s achievement at SSC level in Pakistan. The institutions
hired and trained professional working teachers for the preparation of instruments during
June and July, 2006. They were trained by the experts of different countries and then
asked to prepare the achievement test. They have adopted the standard procedure for the
preparation and finalization of instruments. They have focused on Bloom’s Cognitive
educational objectives, knowledge, compression and application. The general weight-age
given to all subjects was as given in gazettes of FBISE Islamabad and BISE Rawalpindi
2007.
Knowledge 50%
Comprehension 20%
Application 30%
The paper pattern includes three types of test item, multiple choice questions,
short answer questions and problem solving questions. The test items were processed and

107
passed through different channels before finalization. The test development experts then
assemble the papers, which were standardized; these instruments were used to measure
student’s achievement.
2.19 Factors Effecting the Learning Achievement
The student’s achievement remained the major concern of psychologists,
educationists and no doubt parents since long. Many research studies were conducted to
study the factors affecting learning achievement. People did a lot to maximize the
students learning achievement. After reviewing the literature the factors effecting
learning achievement can be divided in to two groups the factors from school side and the
factors from the student’s home side.
The factors from school side may be the curriculum, school environment, the
teaching methodology and relationship with teacher and peers, whereas the factors from
the student’s home side were their personal abilities and the environment provided by
parents at home or their SES in society. The Trends in International Mathematics and
Science Study (TIMSS) is very famous study all over the world, which also analyze the
factors effecting learning achievement along with the students’ achievement in
Mathematics and Science. The findings of the study in Iran by Kiamanes (2002) were
home back ground, student’s attitude towards subject, self concept, teaching and external
motivation, are the main factors effecting learning achievement.
A similar study was conducted by Colemanetel; (1966, p.9). It also suggested that
schools made no difference; extensive research has been carried out on in and out of
school variables affecting student’s achievement. Considerable research has examined the

108
relationship between students’ characteristics such as self-concept, attitudes toward
subject, home back-ground as well as motivation and students subsequent academic
performance. Another study was conducted in Pakistan by Saeed and colleague(2005,
p.2) They also highlighted the factors effecting the learning achievement of students and
according to them these factors are “parent education and their occupation, SES home
work school location, facilities at home, availability of helping books. Parents guidance
and teacher guidance self-study habit are the major factors effecting student’s
achievement.
Along with them Intraprawat and colleagues (2005, p.5) also conducted a study
about “Factors effecting Learning Achievements of Suranaree University of Technology
Students” they have divided factors into two groups: the factors on the students side and
the factors on the university side. The factors on the student’s side were their
fundamental knowledge in respective subjects from high schools and their learning
behavior in university. And the factors on the university side are the characteristics and
teaching factors of the lecturers, and the instructional system of the university. The
findings were as: The students who has better performance in high school has performed
better in university and the teachers whose knowledge in particular subject is excellent
the performance of their students was also better in their subjects.
2.20 Learning Style and Achievement
From the above discussion about learning styles, it is concluded that people adopt
different learning styles according to their preferences for perceiving and processing
information. These are not quantifiable differences that can be expressed simply as a

109
higher or lower Intelligent Quotient (IQ). These are qualitative differences in the kinds of
perception and judgment that each person prefers to use. Learning depends on many
factors. Each of us has a different mix of preferences, we learn in our own, particular and
individual way thus we show different degrees of success in school.
Allison & Hayes (1994, p.32) point out that an individual’s learning orientation is
possibly the most important determinant of the individual’s educational attainment. For
this reason, considerable researches have been conducted in recent years to diagnose
learning style preferences. Identifying the characteristics of individual students is seen as
a potential way of improving course design and an individual’s learning outcomes.
Significant efforts were made to study the learning styles in education and studies
have produced findings indicating significant differences in academic performance by
students manifesting different learning styles (Dunn, Deckinger, Withers and
Katzenstien., 1990; O’Brien, 1994). Booth & Mlandenovic (1999) for example found a
significant relationship between learning style preferences and achievement in specific
courses in a college pharmaceutical program.
Most educators “agree that learning styles exist and acknowledge the significant
effect that learning styles have on the learning process” (Vincet & Ross, 2001). The
assertion has been made that tailoring educational environment and materials to students’
learning styles increases overall academic achievement.
A key to getting and keeping students actively involved in learning lies in the
understanding of the learning style preferences of the students which can positively or
negatively influence a student’s performance. Therefore it would be wise to understand
what learning style preferences are, and how to address while preparing instructional

110
material for students. Studies indicate that the more the student understands about how
they learn, the more likely they will become independent, responsible, self-confident
learners (Smith & Renzulli, 1984).
Rita Dunn (1983) reviewed several research findings on students learning styles
and their achievement at college, secondary and elementary school levels. Her findings
indicate that matching students learning styles with teaching styles had a positive effect
on achievement scores, attendance towards school, and motivation for additional
education.
Most of the early researches about learning styles were related to young
population. The learning styles were addressed in reference to student’s achievement.
This concept explains the success or failure of the different learning approaches with
different tasks, especially as they related to expectations in schools. There is evident that
students with specific learning style patterns underachieve in school. Regardless of their
cultural background, students who have these dominant learning style patterns have
limited opportunities to use their style strengths in classroom.
Many researches in the field of education support the notion that there is
difference in the way students approach learning (Biggs, 1976, 1987; Entwistle, 1979).
Blackmore (1996) suggested that one of the first thing educators can do to aid the
learning process is to simply be aware that there are divers learning styles in the students
population. Kaurse (2000) established that there are differences in how individual
learners acquire and process information.
Kaurse as quoted by Imtiaz (2004, p.30) pointed out that although many students
can master easy information in the “wrong” style for them, they do it more efficiently and

111
rapidly when they capitalize on their learning style strengths. He also stated that no one
method will be best for all learners and further established that there must be a variety of
methods, an appropriate mix of strategies to meet the needs of a variety of individual
learners.
Biggs (1987, p. 65) stated that the early works on approaches to learning were
restricted to the domain of educational psychology. Essentially, these early theories
attempted to predict quality of learning outcomes measured by academic performance by
examining factors such as IQ, socio-economic status, prior knowledge and special
abilities and so on, in the quest to establish general laws.
2.21 Social Differentiation and Social Stratification: Status and Class
In literature all social groups and societies exhibit social differentiation. The
social differentiation is the process by which different statuses in any group, organization,
or society develop. For example, the school is a social organization: the principal,
teachers, students, administration staff, guard, parents, non-governmental organizations
and policies curriculum all have different status with in the organization. Together they
constitute a whole social system, one that is marked by social differentiation.
Social stratification is a relative fixed, hierarchical arrangement in society by
which groups have different access to resources, power and perceived social worth.
Social stratification is a system of structured social inequality.
The status was defined by many ways: Ascribed Status, Achieved Status and Master
Status.

112
2.21.1 Ascribed Status
Dictionary of Social Science (2002) defined ascribed status as it is determined at
the time of birth like: gender, race, ethnic differences provide basis for ascribed status.
2.21.2 Achieved Status
Achieved status was acquired on the basses of merit skills, abilities by the
individual in the society (Dictionary of Sociology, 2003). The example is being a doctor
or being a teacher or even being a criminal the status then determines a set of behaviors
and expectations for the individuals.
2.21.3 Master Status
According to Academic of Social Science (2002, p.176) “The master status is that
status which has exceptional importance for social identity”.
2.21.4 Status Symbols
Status symbols are those items which are used to identify status.
Stockwell, Peter (2002, p.26) defines the status as, “a status is a rank or position
in a group or organization”. It was also defined by Sociologists Frederic (1956, p.54), “a
status is a position in a social system independent of given factors”. A person’s status or
position determines the nature and degree of his responsibilities and obligations as well
as his superior, inferior relations to other members of the society.
2.21.5 Estate, Caste and Class System
Stratification system can be broadly categorized into three types: Estate system,
Caste system and Class system (Andersen & Taylor, 2003, p.177).

113
Estate system
Estate system of stratification is one in which the ownership of property and
the exercise of power is monopolized by an elite who have total control over
social resources. Historically, such societies were feudal systems where
classes were differentiated in to three basic groups: the nobles, the priesthood,
and the commoners.
Caste system
In caste system one’s place in the stratification system is an ascribed status. It
is a quality given to an individual by circumstances of birth. The hierarchy of
classes is rigid in caste systems and is often preserved through formal law and
cultural practices that prevent free association and movement between classes.
Class system
In class system one’s placement in the class system can change according to
one’s achievement; that is, class depends to some degree on achieved status,
defined as status that is earned by the acquisition of resources and power,
regardless of one’s origins. Class systems are more open than caste systems,
since position does not depend strictly on birth, and classes are less rigidly
defined than castes, because the divisions are blurred by socially mobile
individuals moving between one class to the next.
Social Scientists uses concepts and theories to help the people to grasp, order,
analyze and understand the nature of the societies, culture and socio-culture formation
with which they can confronted. Each society has specific features or attributes that may

114
resemble or differ from those of others societies, as was said by Nade quoted by Bond
(1981).
societies are made up of people; societies have boundaries, people either
belongs to them or not; and people belongs to a society in virtue of rules
under which they stand and which impose on them regular, determinate
ways of acting towards and in regard to one another (p.228).
In simple way it can be said that societies are bounded units whose members are
governed by rules. No one can draw a line between these units it could only be observed
that if the society organizes these units under some rules then culture provides that set of
rules and way of life. This living style determines the status of the person in society.
The status of the person determines the class to which he belongs. Sociologists
said with the reference of continuum theory of social stratification that there is no sharp
dividing line between social classes. The German Sociologists Max Weber framed three
component theory of social stratification in which he defines status class as “a group of
people that can be differentiated on the basis of non-economical qualities like honor,
prestige and religion. Bedisti (2004, p.4) commented on Weber’s theory and said
bureaucracy is the most powerful in all status groups. In fact the difference in power,
prestige and status is so numerous and so widespread as to make for almost imperceptible
graduations from the lowest to the highest social rank. Almost all social Scientists were
agreed with this interpretation, but there is considerable disagreement as to whether
categories of classes should be delineated in the first place and what arbitrary points on
the power prestige and status continuum best divide the important classes in the second
place.

115
Theories of classes were very old. From the very first “Three class Theory” of
social stratification was very popular. According to this theory society is divided into
three classes, the “upper class”, “middle class” and the “lower class”. The upper class
composed of a relatively few individuals who hold the top most positions in society; a
middle class composed of persons of lesser status but of relatively comfortable means;
and a lower class is of persons who have a bare existence when measured by the given
society standards. The chief criticism of this theory is that it does not draw a sharp
dividing line between individuals of different classes in society. The middle class for
instance, may run the whole range from semiskilled workers to owners of relatively large
business enterprises as well as highly paid professionals. Such criticisms have led to the
five and six class theories of social stratification. The six class theory holds that the upper
class is divided in to an upper-middle and a lower upper class, and the middle class is
divided in to an upper middle and a lower middle class and that the lower class is divided
in to an upper lower class and a lower class. The five class theory generally holds only
one upper class.
Several other approaches to social class ranking have been used such as the two
classes the business class and the working class.
2.22 Social Class Theories
Social class theories revolve around the inequality. All the Social Scientists
analyze the situation and give their point of views. The most famous were the theory of
Karl Marx, and Max Weber, along with functionalism and conflict theory. These theories
were best discussed by Andersen and Taylor (2003, p.176-183).

116
2.22.1 Karl Marx: Class and Capitalism
Karl Mrax (1818-1883) gives a complex and profound analysis of the class
system under Capitalism. In Marx’s view two primary classes exists under capitalism.
The capitalist class was that who own the production and the working class was that well
sell their labor for wages. These two classes were further divided in to two classes: The
Petty bourgeoisie small business owners, managers those who can be identified or named
as middle class. Those people associated with the interests of the capitalist class but who
do not own the means of production. The second was lumpenprole-tariat, they are
unnecessary as workers. In these days they are known as underclass homeless,
permanently poor people.
Andersen & Taylor (2003, p.179) reflected on Marx thought and said that with the
development of capitalism the capitalists and working class would become increasingly
antagonistic referred to as class struggle. When class conflicts become more intense the
two classes would become more polarized the petty bourgeoisies become deprived of
their property and dropping into the working class This analysis is still reflected in the
world and the question is when the classes become more polarized then the rich get richer
and every one else worse off.
Marx thought that the capitalists are the basis for other social institutions. It is the
infrastructure of society with other institutions like law, education, the family etc. Thus
according to Marx the law supports the interests of capitalists, the family promotes values
that socialize people into appropriate work role and education reflects the interest of the
capital class.

117
The question is why do people support such a system? Here ideology plays a role.
Ideology refers to belief system that supports the status quo. According to him the
dominant ideas of a society are promoted by the ruling class, because through their
control of the communications industries in modern societies the ruling class is able to
produce idea that butters their own interests.
At that time when this theory was presented the middle class was small. It was
dependent on the capitalists and was exploited by it, because the middle class did not own
the means of production. He saw middle class people as identifying with the interest of
the capitalists class because of the similarity in their economic interest and dependency
on the capitalist system. He thought middle class failed to work in his own interest
because of a false believed and they will have to pay for it in future. His analyses was
proven true as the tendency of wealth remain long in few hands and majority worked
only to make ends meets.
2.22.2 Max Weber: Class, Status and Party
Max Weber (1864-1929) agreed with Marx that classes were formed around
economic interests, and also that material forces (economic forces) have a powerful effect
on people’s lives. However he disagreed with Marx that economic forces are the primary
dimension of stratification. According to Weber three dimensions to stratification are
class (the economic dimension), status (prestige, cultural and social dimension), and party
(power, the political dimension). Weber gives a multidimensional view of social
stratification because he analyzed the connections between economic, cultural and
political system. He pointed out that, although the economic, social and political

118
dimensions of stratification are usually related, they are not always consistent. A person
could be high on one or two dimensions, but low on another.
Weber as quoted by Andersen & Taylor (2003, p.180) defined class as the
economic dimension of stratification i.e. how much access to the material goods of
society a group or individual has. According to Weber status is the prestige dimension of
the stratification, the social judgment or recognition given to a person or group. Weber
understood that class distinctions are linked to status distinctions it means those with the
most economic resources tend to have the highest status in society but not always true.
Finally party is the political dimension of stratification. It is the capacity to
influence groups and individuals even in the face of opposition. Power is also reflected in
the ability of a person or group to negotiate their way through social institutions.
Although having power is typically related to also having high economic standing and
high social status, this is not always the case. An arrogant man may have money and
power, but be held in low esteem by those who worked for him. The point is that
stratification does not rest solely on economics; political power and social judgments are
also important components of stratification systems. Weber redefined the sociological
analyses of stratification to account for the subtleties that can be observed when you look
beyond the sheer economic dimension to stratification.
2.22.3 Theory of Functionalism
Andersen and Taylor (2003, p.181) commented on Functionalism theory. They
viewed society as a system of institutions that are organized to meet society’s needs. The
functionalist perspective emphasizes that the parts of society are in basic harmony with

119
each other. According to different sociologists society is characterized by cohesion,
consensus, cooperation, stability and persistence.
According to the functionalist perspective, social inequality serves an important
purpose in society: it motivates people to fill the different positions in society that are
needed for the survival of the whole. This idea is addressed in an argument by Davis and
Moore they argue that some positions in society are more functionally important than
others and that inequality is a mechanism to ensure that the most talented people go into
the most demanding positions. These positions demand higher training and with it higher
rewards are associated so it motivates peoples for achieving these higher positions. In
other words, functionalist theorists see inequality as an element of a reward system that
motivates people to succeed.
2.22.4 The conflict Theory
Conflict theory also see society as a social system as functionalists theory; but
unlike functionalism, conflict theory emphasizes that the system is held together through
conflict and coercion. From a conflict-based perspective, society comprises competing
interest groups, some of whom have more power than others. Different groups struggles
over societal resources and compete for social advantage. Conflict theorist argues that
those who control society’s resources also hold power over others. The perspective of
conflict theory was largely derived from the Karl Marx theory, social stratification is
based on class conflict and blocked opportunity.
Conflict theorists argue that the consequences of inequality are negative. From a
conflict theory point of view, the more stratified a society, the less likely that society will

120
benefit from the talents of its citizens, because inequality limits the life chances of those
at the bottom, preventing their talents from being discovered and used.
Implicit in the argument of each perspective is criticism of the other perspective.
Functionalism assumes that the most highly rewarded jobs are the most important for
society, where as conflict theorists argue that some of the most vital jobs in the society
and these sustain life and quality of life, such as farmers, mothers, trash collectors, and a
wide range of others laborers are usually the least rewarded. Conflict theorists also
criticize functionalist theory for assuming that the most talents get the greatest rewards.
They point out that system of stratification tend to devalue the contributions of those left
at the bottom and to under use the diverse talents of all the people.
2.23 The measurement of class position in open class societies.
Researchers have attempted to highlight class position in open class societies in
many ways. Five approaches were used to measure the class position. Every approach has
its advantages and disadvantages. The major approaches are discussed in following
section.
2.23.1 The style of life approach
This approach was presented by Weber and quoted by Sims (1970). According to
him only the life style grouped people together in different classes. The social intimacy is
the one indicator which determines the status of the person and treats others as
comparative equal. The second is the member of the different social classes’ posses and
use certain items which divide them in to classes. The social intimacy is reported by
inter-marriages and having other relationships and mutually shared activities.
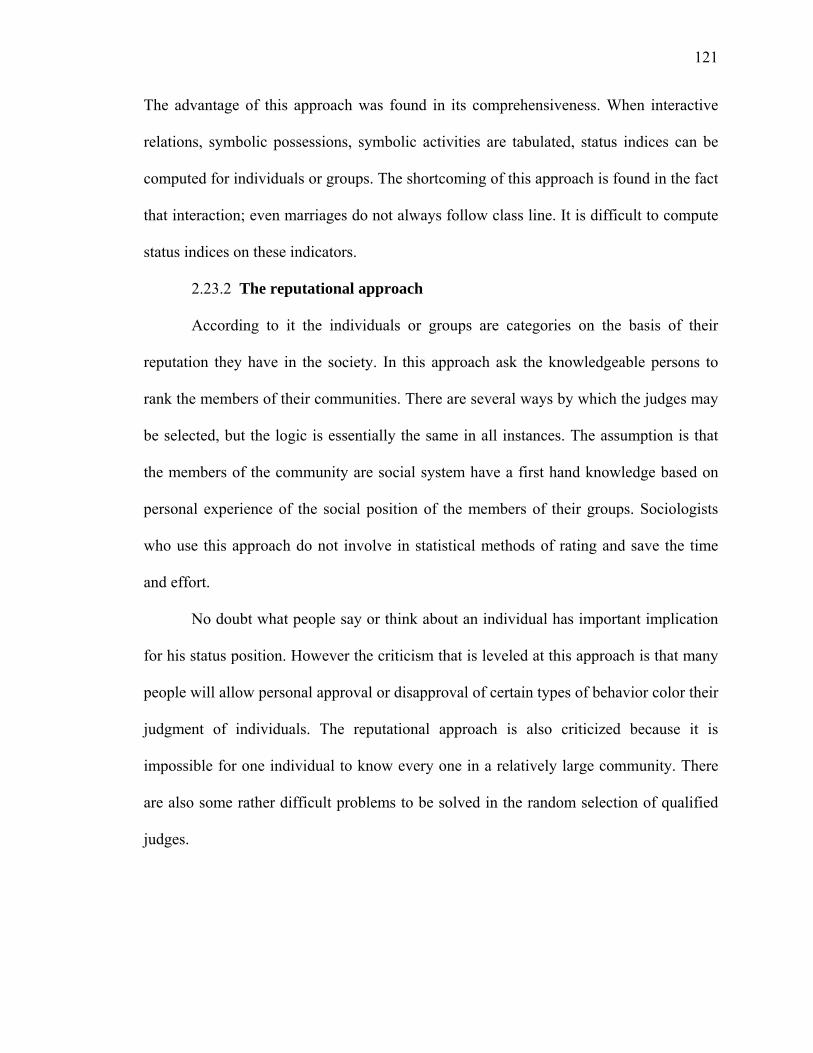
121
The advantage of this approach was found in its comprehensiveness. When interactive
relations, symbolic possessions, symbolic activities are tabulated, status indices can be
computed for individuals or groups. The shortcoming of this approach is found in the fact
that interaction; even marriages do not always follow class line. It is difficult to compute
status indices on these indicators.
2.23.2 The reputational approach
According to it the individuals or groups are categories on the basis of their
reputation they have in the society. In this approach ask the knowledgeable persons to
rank the members of their communities. There are several ways by which the judges may
be selected, but the logic is essentially the same in all instances. The assumption is that
the members of the community are social system have a first hand knowledge based on
personal experience of the social position of the members of their groups. Sociologists
who use this approach do not involve in statistical methods of rating and save the time
and effort.
No doubt what people say or think about an individual has important implication
for his status position. However the criticism that is leveled at this approach is that many
people will allow personal approval or disapproval of certain types of behavior color their
judgment of individuals. The reputational approach is also criticized because it is
impossible for one individual to know every one in a relatively large community. There
are also some rather difficult problems to be solved in the random selection of qualified
judges.

122
2.23.3 The subjective approach
The Third approach is the subjective approach. The logic of this approach is based
on the assumption that the individual is in the best position to know where he fits into the
class system. Warner (1969, p.3) also used this approach, according to him in this
approach people of the community made ranking. This method assumed that the
members of the community could rank their fellows according to technique such as
evaluation of social reputation & institutional membership.
While keeping all the style of life, reputational and subjective approach it could
be perceived that subjective approach has an advantage over all approaches. As the
reputational approach is limited by the scope of acquaintance of the judges selected and
the subjective approach also has advantages of time and simplicity over the style of life
approach.
The chief criticism that has been raised against the subjective approach is that the
man may have a wrong perception, both of his social class system and his own position in
the system. When evaluating themselves such persons for ideological ego or other
reasons will indicate that they belong in lower or higher class categories than they
actually hold. These shortcomings can be minimized by careful Scholars but do
complicate the subjective approach to the study of class position.
2.23.4 The occupational prestige approach
The fourth approach to the study of social class utilizes occupation as an index to
class position. This approach is defined in terms of the rationale that occupation has a
social reality. It has direct meaning for status position. The status was determined by
rating for occupation prepared by the National Opinion Research Centre at the University

123
of Chicago. The North-Hatt and the Hodge, Siegel and Rossi describe (1964, p.292)
occupations on the basis of prestige as determined by the responses of approximately
3000 interviews selected at random. This approach was still in practice in UK in the
office of National Statistics to divide social classes by classifying the people/population
in socio-economic classification (2004, p.5). They have divided in 8, 5 and 3 classes
according to their occupation. In UK Socio-Economic Status of individuals was
determined by their occupation class to whom they belong.
The disadvantage of this approach is inherent in all single factor measures of complex
entities.
2.22.5 The multiple index approach
All the approaches discussed above or some others for the study of social class
position have many weaknesses when used alone. For this reason, Warner (1963, p.273)
prefer to use two or more approaches so that they may have multiple indicators of social
class positions. Studies which combine the reputational or subjective approach with the
style of life or occupational prestige approaches are considered more valid and more
reliable if high correlation is attained between the measures used. Various researchers
have worked out composite indices that are designed to eliminate the biases of single-
factor measures of class position and at the same time eliminate the necessity of double-
checking by using multiple approaches.
2.24 Determinants of the social class
What are the major determinants of social class? Different sociologists have
different opinion but literature reflects all are agreed on the main determinants namely,

124
wealth, power and prestige. Educational Sociologists define the meaning of social class
and discuss its significance and implications for individuals in society. Class has been
described by Weber as multi-dimensional concept that is determined by three major
variables wealth, power and prestige.
The philosophy dictionary defines the social class as “A group separating a
society in to subsets, defined in-terms of status privilege. It is a place in the processes of
economic production, access to power and authority”. The earliest concept of class was
of Karl Marx, Who focused on how one class controls and directs the process of
production while other classes are the direct producers and the providers of services to
the dominant class. Latterly the Max Weber saw people as having different life chances
because of difference in skills, education and qualification as was explained by Kerswill
(2006, p.4)
Food and Culture Encyclopedia defines social class by “unequal access to
desirable resources” such as money, goods and services or the personal gratification such
as prestige or respect”.
Giddass (2001) describes social class as difference in styles of life marked by
such things as ‘housing’, ‘dress’, ‘manner of speech and occupation’ which are the major
determinants. It is also described by Wikipedia encyclopedia. The class is determined
largely by: personal or house hold per capita income or wealth net worth, including the
ownership of land, property, means of production etc.
Occupation
Education and qualification
Family background

125
In the view of Warners (1969) objective approach of class ranking was formalized
by “index of status characteristics” four criteria are associated with index: occupation,
source of income, house type and dwelling area.
This is the one way to determine the status of the different social classes. There
are many other options decided and used for determining the status of a social class in
society: as was discussed by Thomas (2007) the status of social classes was determined
by the job or occupation they have. The lower class often referred as working class or
blue color works.
The blue color workers are those who are employed by some one and they are
unable to employ any one. The classes of employees who perform manual or technical
labor are referred to the dress codes of workplaces. The distinctive features of this class
are generally having low level education unskilled or semiskilled occupation training is
often learned on the job and have low income then white collar and higher from pink
collar. Fontenot (2006) defines the middle class people generally called white color
workers they have more education holding technical or less laborers job. They are not
involved in manual labor. They are salaried professional like doctors, lawyers, employers
in administrative position managers and they earn average to about average incomes.
Upper class people tend to have high education, the highest salaries and prestigious
occupational positions. Along with these positions some workers were distinct as pink
color workers. In the first half of 20th century in 1950’s women began entering in
contrary’s work force in significant number. They entered in workforce at entry level
position of pink color workers defined by Dr. Fontenot as when women work for a living
in a clean, safe environment, are called pink color workers. Pink color jobs are secondary

126
labor market jobs like secretaries, nurses, telephone operators, teachers, librarian etc. As
according to gender stereo types pervasive in male dominated societies, these occupations
are seen as “ideally and naturally” suited to women as they echo domestic responsibilities
and their jobs do not require as much professional training. The status of such jobs is low
and pay is also less having limited benefits or chances of advancement.
Since that time different societies fix different determinants and different
structures of social classes.
2.25 Class Structure in Various Societies
According to Wikipedia Encyclopedia the social class refers to the hierarchical
distinction (or stratification) between individuals or groups in societies or culture.
Usually individuals are grouped in to classes based on their role in society and economic
position (pink, blue or white collar workers) and similar political and economic interests
within the stratification system. However class is not a universal phenomenon. Many
groups or societies do not have social class and often lack permanent leaders and
consciously and actively avoid dividing their members into hierarchical power structure.
No universal factor can determine the class. The class determinants vary from one
society to another. Even within a society different people or groups may have very
different idea about what makes one “higher” or “lower” in the social hierarchy.
Theoretical debate over the definition of class remains important not for old days it is of
the much concerned of today. Sociologist Dennis Wrong (Wikipedia) defines class in two
ways: realist and nominalist. The realist definition relies on clear class boundaries to
which people are divided into social groups. The nominalist’s definition of class focuses

127
on the characteristics that people share in a given class like education, occupation etc. So
the class is determined not by the group in which you place yourself or the people you
interact with, but rather has these common characteristics.
Since the period of Karl Max, Max Weber and others sociologists defined
different criteria for the distribution of social classes. Some includes occupation, source
of income, house type and dwelling area (Bond, 1981) In British the socio-economic
status involves combination of factors like occupation, income and education level. This
is revised in 2001 by the office for National Statistics it is now called Socio-Economic
Classification (SEC) for all official statistics and surveys and determined by
“Occupation” alone. Different societies use different social class structures with different
determinants and different explanation. As was presented in Encyclopedia Wikipedia
(2006, p. 1-49) following societies have specific class structures.
a. The United Kingdom
Encyclopedia Wikipedia (2006, p.1-49) described that the social class structured
model in the United Kingdom was changed during ‘Thatcher Era’ and it is continuously
used in these days. The difference is previously defined the socio-economic status or
individual’s social class was governed by mannerisms, education and statuses of one’s
parents but no determined by occupational nature of job someone have. They use eight
class model described by Encyclopedia Wikipedia (2006) is presented in following pages.
i. Upper Class: The people belong to this class have inherited wealth. They
got education from most famous British’s schools such as Eton and Winchester.

128
ii. Upper Middle Class: The people of this class are generally
professionals with advanced degrees and usually with the public school education.
The major portion of their wealth is from inheritance.
iii. Middle Class: The people of middle class are also the professionals like
upper middle class but with less education and established back ground. They
usually have their own home and earn well above the national average.
iv. Lower Middle Class: The people of this class may not hold a university
degree but work with white color job and earn just above the national average.
v. Upper Working Class: The people belong to this class generally does not
hold a university degree but they works in skilled or well experienced role such as
supervisor, foreman, or skilled trade such as plumber, electrician, joiner, tool-
maker, train driver.
vi. Working Class: These people usually have low educational achievement
and worked in blue color professions as semiskilled or unskilled worker in the
field of industry or civil work (construction work). The examples of this class are
a drill press operator, car assembler, welding machine operator bus driver truck-
lift operator, docker, or production laborer.
vii. Lower Worker Class: They usually work in low wage occupation, such
as cleaner, shop assistant, bar worker. They are often employed in the personal
service industry.
viii. Under Class: The people who are unemployed rely on the state benefits
for income belongs to this class. They are unemployed.

129
b. The United States of America
According to Encyclopedia Britannica (2006) the social structure in United States
of America is defined by several factors. The main determinants are educational
attainment, income and occupational prestige. The Americans society is distributed
mostly in six or five class systems. The detail according to Encyclopedia Britannica
(2006) is as under:
i. Upper Class: The upper class is established by those peoples who have
great influence, wealth and prestige. The population of this class is only 1 % and
they own about one third of private wealth. The members of this class tend to act
as grand conceptualized and influence the national institution.
ii. Upper Middle Class: The upper middle class consists of people with
white color professions, comfortable personal income and advanced post secretary
Educational degree. The professional’s from this class have enough autonomy at
their workplace and therefore enjoy high job satisfaction. They are 15% of the
total population in society. They earn round about six figure income and live a
comfortable life.
iii. Lower Middle Class: They are semi professionals from the professions
of non-retail sales people and craftsman who have some college education. They
often suffer lack of job security. House holds of this class need two earning
members.
iv. Working Class: This class consists of the majority of the Americans it
includes blue as well as white color workers who have relatively low personal

130
income and low education many belongs to 45% population of Americans who
have never attended colleges.
v. Lower Class: They are poor people of this society with very low
education and less income they hardly earn to live hand to mouth and it is
common for them drift in and out of poverty.
c. China
Before Confucian period the feudal system divided the whole population of China
into six classes. As described by Encyclopedia Wikipedia (2006) the four noble classes
was named as the king, the Dukes then the great men and finally the scholars and below
noble class there were commoners and slaves.
Latter Confucian doctrine minimized the importance of the nobles except the
emperor and abolished the status of great men and scholars as noble classes. They divide
the society in following groups.
i. Scholars: This group is highest in rank because they thought they have
ability and opportunity to conceive ideas in state of leisure. It leads them to make
wise law. The scholars were mainly belonged to gentry who owned land, and may
be educated but had no aristocratic title.
ii. Farmers: This class consists of person who produces food and the
artisans who produced useful objects.
iii. Merchants: They ranked at the bottom because they did not produce any
thing.
iv. Soldiers: They are ranked even lower then merchants because of there
perceived expendability.

131
The confusion model of social class is different from the model of Europe and
America. According to it the merchants can attain great wealth with out reaching the
social status accorded to a poor farmer. Because merchants can purchase land to reach
farmer status or even can buy a good education and they would attain the status of scholar
and go to imperial civil service.
d. France
France was an absolute monarchy for most of the time, with the king at the
Pinnacle of the class structure. However the French State-General was established in
1302 by ranking the people according to hereditary. The detail was taken from
Encyclopedia Wikipedia (2006) it described the social class system in France as below:
i. The First Estate: The First Estate in France consisted on the high born
sons of the great royal families the king and queen. Who had devoted themselves
for religion as Brahmins in Indian, Scholars in Confucian (China) and Qajar in
Iran.
ii. The Second Estate: The second state consisted of all others noble people
of the society, who are 2% in the total population.
iii. The Third Estate: Technically all other people belong to this class but
in reality this class is of the richest members of the society and peasant has no
voice at all in the social system as contrasted with the ideologically high status of
farmers in Confucian China.

132
e. Japan
In Japan the class structure was influenced by the China. It was based mostly on
feudal system and shifted to coming generations. For details as explained by
Encyclopedia Wikipedia (2006), is presented in following section:
i. The Emperor: The Emperor was at top (Pinnacle) as a deity and still it
continues although now they are not considered as god. In Japan history the
emperor was not allowed out side from their palace and their will was interpreted
by a shogun or military dictator.
ii. The Shogun: The people of this class are military dictators.
iii. Regional Lords: This class consists on the people who run the
administrative control of the province through their samurai lieutenants.
iv. Farmers: As the Japan class structure was influenced by China or
perhaps springing from a lack of arable land they ranked farmers above merchants
and other bourgeois.
f. India
The Indian class system was one of the oldest and rigid systems of social class.
Indian society is so rigid they have lack upward or downward mobility between castes.
They are totally against the Varna sharme Dharma idea in Hinduism which allowed
people born into a certain verna their status was determined by their education and their
occupation. The class system of society was divided on the basis of skills and
qualification and not the father’s status to their sons. Encyclopedia Wikipedia (2006)
described they have four classes:

133
i. Brahmin Varna: The people of this class were idealized as a leisurely
priest class devoted to religious ceremonies. They are religious scholars.
ii. Kshatriya Varna: They were defined as military princes and they can
call as upper middle class. They are distinguished as ruler and warriors.
iii. Vaishya Varna: the people of this class were associated to artisan
farmers’ herders and merchants. The represent the modern concept of middle
class.
iv. Shudra Varna: The lower varna were the shudar. They are considered as
servants. They do not even have some simple basic right in Indian social system.
The Indian Constitution introduces various affirmative action plans to abolish this
class system but have very limited successes.
v. Untouchables- an unofficial “5th” class- their jobs involved activities
Hindus considered “lowly or dirty” (handling garbage or dead animals, etc.)
vi. Indians were born into a certain caste and they could not change it.
vii. According to karma, the caste system was fair because people’s social
class reflected what they had done in past lives.
g. Iran
Prior to the revolution 1979 the major determinant for status class was prestige
and the influence of one’s in highest decision making, wealth was also important and
finally was connected with political power. Education helped to enter in to high jobs
which after word provided opportunities for making connection with those who had
political power. After revolution some determinants remained at the same position and
class system was based on four class systems as described by Hand Book of Iran (2007).

134
i. The Upper Class:
The people of upper class were those who have high position in society like land
owners, industrialists, finance and large scale merchants. The merchants remained
as part of the upper class by having wealth, but such persons have no political
influence and this absence of influence could impede to acquire new wealth.
Senior clergy group with great political influence because the element of the
upper class religious expertise also has an influence on the government’s key
administrator has strong commitments to Shia Islam.
ii. The Middle Class:
Prior to revolution middle class was divided in two groups; those who possessed
western education who had a secular looked those who were suspicious of
western education who valued a role for religious in both public and private life.
The people with secular point of view want them self-employed by bureaucracy,
the professions and universities, while religious oriented concentrated among
bazaar, merchants and the clergy. After revolution 1979 the distribution of middle
class remains same. There were several social groups based on different
occupations like bazaar merchants, professional managers of private and
nationalized concerned the high grade civil servants, teachers, medium scale land
owners, military officers, junior ranks of the shia clergy. Some middle groups
have more influence to political power. After revolution the people with western
education were required to undergo special Islamic indoctrination courses to
retain their jobs.

135
iii. The Working Class:
Since twentieth century the working class has been in the process of formation.
The working class is a big class divided into various groups of workers; like
working in oil industry manufacturing, construction and transportation and those
who are mechanics and artisan in the bazaar workshops. Some perform manual
labor, some are regular employees and others are not. The illiterate do low ranked
jobs. Thousands of people work seasonally or occasionally at one or other jobs.
These are some cases of social class system around us all the societies have same
structure parallel to the Plato’s three class system Jalalzai (1992).
i) The Philosophers Kings (rulers)
ii) Guardians (Soldiers)
iii) Workers (Labor, Artisan)
The Plato’s point of view is that the social class is an important factor for most
people as it measures the position of person in society. The status of person as well as the
structure of social class is defined by two stand parts.
i) Objective
ii) Subjective.
Objective view distinguishes social class on the basis of occupation and
subjective view refers the position of a person feels or belongs to a specific group or has
influence on the decision making committee (Aragon, Johnson & Shaik, 2004). There are
many systems for measuring social class the first is the Registrar General’s
Classifications which classify group or classes on the basis of occupation and it is as:
Class I: Class I is based on lawyers, architects and doctors.

136
Class II: It is consisted of shop-keepers, farmers and teachers.
Class III: It includes shop assistants, clerical staff and electricians.
Class IV: The people assistants with the profession of bus conductors and farm
workers came under this class.
Class V: The people of this class are illiterate and mostly are laborers on building and
other states.
The Second system of measuring social class by marketing group is as follows:
a) Upper class: It consists of elite group.
b) Upper middle class: The people have high managerial, administrative and
professional position consist on this class.
c) Lower Middle class: These people are supervisor or clerical and junior staff in
any office.
d) Skilled working class: The people of this class are skilled manual workers.
e) Working Class: They are semi and unskilled manual workers
f) Those having no job and depending on state’s income for survival.
In literature the system of social class distribution of socio-economic status has
been defined by both objective and subjective approaches. Some time subjective some
time objective. Sociologists use both according to Academic Dictionary of Social Science
(2002):
The term socio-economic status often contrasted with that of social class.
Socio-economic Status, largely an American usage has developed as a
way to operationalize or measure social class on the assumption that class
groupings are not real groups. It is a rather arbitrary category and is
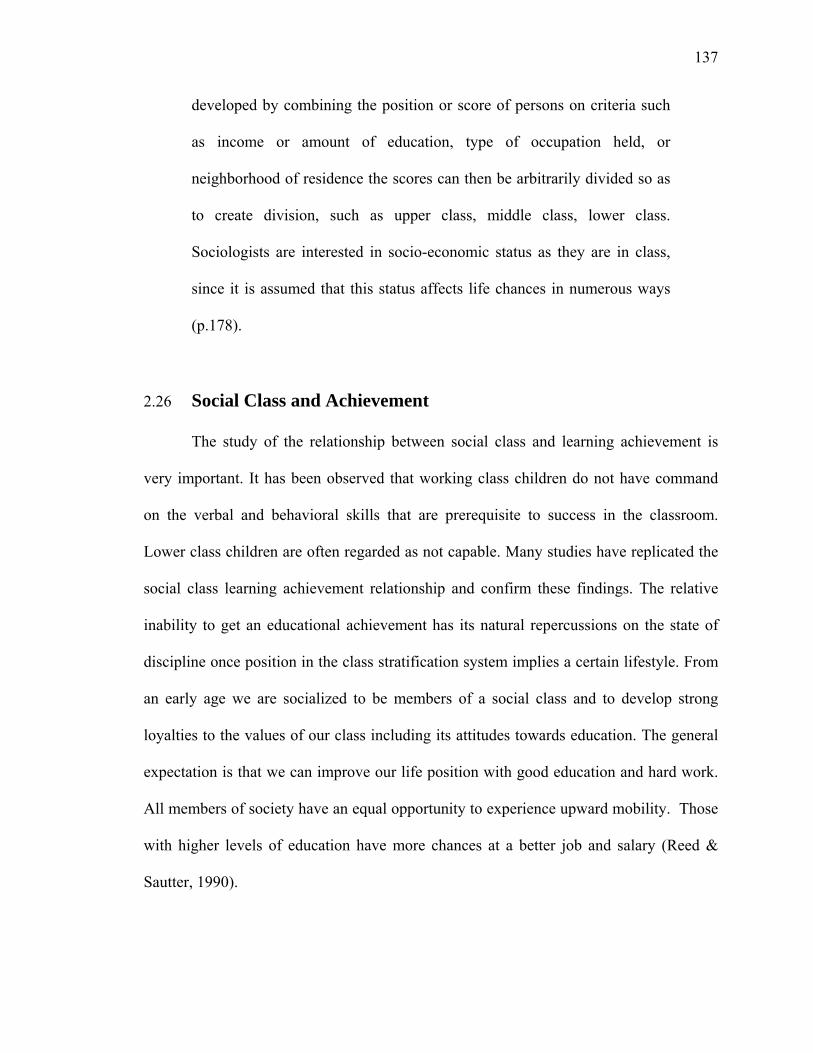
137
developed by combining the position or score of persons on criteria such
as income or amount of education, type of occupation held, or
neighborhood of residence the scores can then be arbitrarily divided so as
to create division, such as upper class, middle class, lower class.
Sociologists are interested in socio-economic status as they are in class,
since it is assumed that this status affects life chances in numerous ways
(p.178).
2.26 Social Class and Achievement
The study of the relationship between social class and learning achievement is
very important. It has been observed that working class children do not have command
on the verbal and behavioral skills that are prerequisite to success in the classroom.
Lower class children are often regarded as not capable. Many studies have replicated the
social class learning achievement relationship and confirm these findings. The relative
inability to get an educational achievement has its natural repercussions on the state of
discipline once position in the class stratification system implies a certain lifestyle. From
an early age we are socialized to be members of a social class and to develop strong
loyalties to the values of our class including its attitudes towards education. The general
expectation is that we can improve our life position with good education and hard work.
All members of society have an equal opportunity to experience upward mobility. Those
with higher levels of education have more chances at a better job and salary (Reed &
Sautter, 1990).
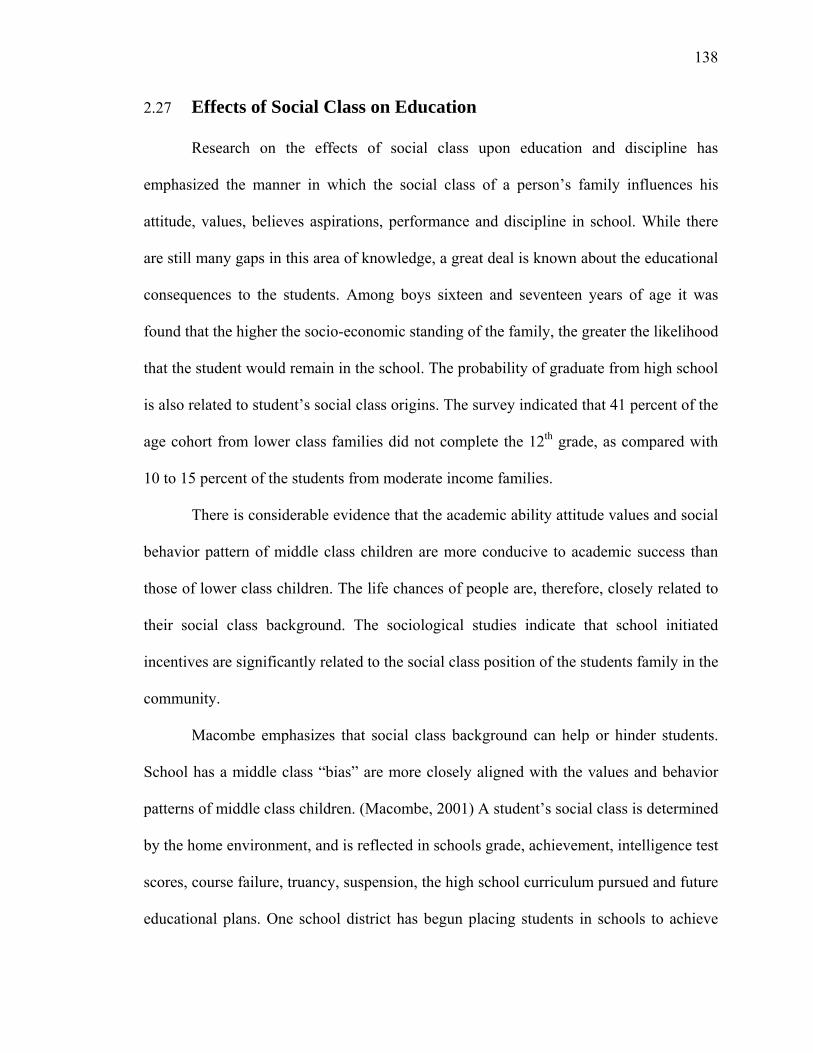
138
2.27 Effects of Social Class on Education
Research on the effects of social class upon education and discipline has
emphasized the manner in which the social class of a person’s family influences his
attitude, values, believes aspirations, performance and discipline in school. While there
are still many gaps in this area of knowledge, a great deal is known about the educational
consequences to the students. Among boys sixteen and seventeen years of age it was
found that the higher the socio-economic standing of the family, the greater the likelihood
that the student would remain in the school. The probability of graduate from high school
is also related to student’s social class origins. The survey indicated that 41 percent of the
age cohort from lower class families did not complete the 12th grade, as compared with
10 to 15 percent of the students from moderate income families.
There is considerable evidence that the academic ability attitude values and social
behavior pattern of middle class children are more conducive to academic success than
those of lower class children. The life chances of people are, therefore, closely related to
their social class background. The sociological studies indicate that school initiated
incentives are significantly related to the social class position of the students family in the
community.
Macombe emphasizes that social class background can help or hinder students.
School has a middle class “bias” are more closely aligned with the values and behavior
patterns of middle class children. (Macombe, 2001) A student’s social class is determined
by the home environment, and is reflected in schools grade, achievement, intelligence test
scores, course failure, truancy, suspension, the high school curriculum pursued and future
educational plans. One school district has begun placing students in schools to achieve

139
socio-economic balance. Class is not the only variable effecting achievement, and within
each class there is wide variation, but there is definitely a significant relationship between
class on the one hand and achievement on the other hand. Equal opportunity exists when
all people, even those without status, wealth or membership in a privileged group, have
an equal chance of achieving a high socio-economic status in society, regardless of their
gender, minority status or social class. This requires removing obstacles to individual
achievements, such as prejudice, ignorance and treatable impairments.
2.28 Demographic Variable of the Sampled Districts
The sample districts were selected from the northern zone called Barani zone of
Pakistan. The selected districts were also named as “Pothohar Plateau” on the map of the
Pakistan. They are linked by road. These districts were classified as developed and under
developed on the basses of literacy rate, services available and facilities provided by
government or other non-governmental organizations as was described by Khawaja
(2005).
Islamabad and Rawalpindi district were categorized as developed districts and
Attock and Chakwal districts were as under developed districts. Islamabad is the capital
of Pakistan and Rawalpindi is sister city of it. Both the districts were declared as big
cities have literacy rate 72.38 and 70.5 higher in ranking regarding literacy, both the
districts have many facilities in terms of education, health, business and trade, embassies
and foreign offices etc. Whereas Attock and Chakwal districts have less facilities as
compared to developed districts. The literacy rate of Attock and Chakwal is 49.27 and

140
56.72 respectively. Although both district are neighbors of developed district but there is
a waste difference in facilities and services available and living standards of people.
According to Amjad, Arif & Mustafa (2008, p.143), “A second urban corridor has
been developed in north Punjab by establishing the capital, Islamabad, alongside
Rawalpindi, resulting in an increase in the size of the twin cities that has generated a lot
of opportunities for nearby areas. They have integrated their rural population as well as
populations from surrounding districts, including Jhelum, Chakwal and Attock, by
providing them employment opportunities, mainly in the services sector.
Developed district have almost same educational and health facilities as both have
many big hospitals and universities. Chakwal district has one small campus of University
of Engineering and Technology Taxila and one District Head Quarter Hospital, whereas
Attock has a campus of University of Education Lahore and one government hospital.
2.29 Formation of Status Classes for the Study
After going through the literature thoroughly and evaluating the determinants of
the social classes, the five class social structure was used. The classes were named as
upper class, upper middle class, middle class, lower middle class, and lower class. This
structure was previously used by Sabzwari (2004) to study the social structure in Pakistan
the major determined were finalized by going through official documents.
Economic Survey of Pakistan 2006-07was consulted to identify the social and
economic indicators. This document is an official document developed by Economic
Adviser’s Wing, Finance division, Government of Pakistan. The document defined
141
economic and social indicators (Appendix-L). The indicators defined by this book were
growth rate
(constant and current), consumer price index, fiscal policy, money and credit, stock
exchange market, balance of payments, commodity sectors, infrastructure, human
resources and social development.
The other document consulted were Pakistan Social and Living Standards
Measurement Survey (PSLSMS) 2004-05. It was fourteen page official document. It was
developed by Federal Bureau of Statistics Government of Pakistan (Appendix-K). It was
used to measure the social and living standards of Pakistani people. It has a detailed
instrument containing fourteen portions A, B, C, D, E, F, G, H, I, J, K, L, M and N. Each
portion required different detail.
The portion A was about introduction. It asked the detail of province, district, city,
name of interviewer and interviewee. Portion B was about the detail of family size (male
and female members). C part was about the educational levels of the family members.
The next part D was about the health facilities available and utilized by the members of
the family. The E part of the questionnaire was about the nature of the job of the earning
member of the family. F part asked about the property (agriculture land, personal live
stock) and facilities (iron, fans, sewing machine refrigerator, and traveling facilities)
available to a family. The G portion of the instrument was about the nature of
accommodation and utilities. H portion has two parts the first was about the income and
expenditure and the second part was about the loan a family has taken and spends on
which item. The “I” part asked the safety measure for the children less then age five. The
J & K part discussed the condition of married women of the family and services and

142
facilities availed by the family members respectively. The last part L was about the
detailed expenditure of the family. This questionnaire was used to measure and determine
the social and living standard of a family which was consulted by the researcher to
develop SES questionnaire for the measurement of SES of the parents of the sampled
students.
Along with the two documents discussed above a research study of Sabzwari
(2004, p.50) was also consulted. The indicators taken by him were educational
qualification, occupation, monthly income, supervision/teaching to children, time spend
with children, participation of children for sports and the value system of a family.
After analyzing all the documents and discussing with the experts of the sociology
departments of different university indicators were finalized by the researcher with the
consent and help of supervisor. The main indicators were the parents’ academic and
professional qualifications, parents income level, job, family size, locality and nature of
accommodation, facilities at home, traveling facilities, distance of school from home and
coaching at home. Following variables were used with the consent of supervisor and the
experts of sociology departments of different organizations:
1. Educational Qualification of students mother, father and elders/young siblings
2. Parent’s occupation
3. Monthly income
4. Type of residence
5. Different house hold facilities at home
6. Mode of traveling to school
7. Tuition facility at home.

143
All the variables were scored and total scores were used to make different classes.
The maximum scores obtained on Socio-Economic Status Scale questionnaire by the
respondents were 150 and minimum score was 106. According to the obtained scores the
classes were made by a fix interval the detail is as:
Table 2-22-1 Breakdown of social classes according to obtained scores
Class Number of respondents SES Score
Upper class 42 142 – 150
Upper Middle class 260 133 – 141
Middle class 641 124 – 132
Lower Middle class 575 115 – 123
Lower class 62 106 –114
Table 2-22-1 indicates that in the selected sample 260 parents were from the
upper middle class, 641 parents of the students were from middle class and 575 were
from lower middle class. So the very large majority i.e. 1476 students belong to middle
class. This also indicates that a majority of children of middle class are studying in public
sector educational institutions. This may be due to their economic position and they may
be able to afford the expenditure of public sector schools only.
2.30 Related Researches
Many research studies were conducted all over the world to identify student’s
learning style and effect of socio-economic status on achievement. Bond (1981, p.253)
study the “social economic status and educational achievement” and concluded that the

144
students from different SES groups did not perform at the same level in school.
Performance of students from lower class was poor and it was because of non supportive
attitude of teachers towards them. Hopkins (1982, p.351) conducted a study of learning
styles of traditional students and non-traditional adult learners enrolled in full time
undergraduate study. The findings revealed that non-traditional students preferred the
independent, participant and dependent styles while traditional students indicated
preferences for the collaborative, competitive and avoidant styles. Females indicated
preferences for the dependent, participant and collaborative styles. Male exhibited
preference for the avoidant, independent competitive styles.
Pandian (1983) undertook a study to ascertain the learning styles and their
preferred teaching strategies as well as the association between learning styles and
predictive variables like types of college, gender, subject of the study, personality traits,
locus of control and English language ability. The findings revealed that except their
subject of study all other variables were found to be related to their learning styles.
Bishop (1985) explored the learning styles of women students in a private liberal
arts college. The results showed that the women were collaborative, independent and
participative learners. When compared with men and women from other liberal arts
college, these women were found significantly more participative and collaborative and
significantly less dependent and avoidant. They were significantly less competitive than
the men.
Ketchum (1985) undertook a study of student learning styles at Maharishi
International University (MIU). Comparisons were conducted with the MIU third and
fourth year students and with a sample at another university. The major findings of the

145
study were (i) the entering MIU first year students’ primary strengths were the ‘Personal’
learning styles of participant, collaborative and dependent, (ii) The first year MIU
students were found to score significantly higher on avoidant and lower on participant
than the fourth year MIU students, (iii) The MIU first year students did not differ from
the students of the other university.
Verma and Sherma (1987) conducted a study on “academic achievement in
relation to learning styles of adolescents”. They used Grasha & Riechmann’s learning
styles model. They measured the performance of students in five subjects i.e. Hindi,
English, Mathematics, General Science and Social Studied with the total area of study.
The major findings were the group of students has participant learning style showed
better performance in the total area of the study than the group having avoidant learning
style. No difference of performance for academic achievement of students having
dependent and independent, collaborative and competitiv learning style.
Verma (1988) study the “learning style preference in relation to personality
types”. He used the learning styles model defined by Agarwal. The results of this study
indicated that personality type and learning style preferences of senior secondary students
were partly contingent upon each other i.e. the extrovert and introvert students were
different in their learning style preference.
Katz (1988) conducted a research on individual learning style Israeli Norms and
Cross-Cultural Equivalence of Kolb’s Learning Style Inventory”. He found that the
choice of a career or a major field of study is influenced by individual’s learning style.
Verma (1989) conducted another study on “Learning style preference of senior
secondary school students in relation to their anxiety”. He used Agarwal’s tool for

146
learning styles. The major findings of the study suggested that high anxious and low
anxious students showed no different preferences for their learning style.
Dunn (1989) conducted a research on “Grouping students for instruction: effect of
learning style on achievement and attitude”. The results revealed that the learning style
had positive effect on the achievement and attitude as the students preferred learning
alone performed significantly better in the learning alone condition and the students
preferred learning with peers performed significantly better in the learning with peer
condition.
Verma and Tiku (1989) and Verma and Kumari (1988-89) conducted similar
studies “a comparative study of learning styles of male and female high school students”
and “learning style preferences of senior secondary students in relation to their sex”
respectively. In first study researchers used learning styles presented by Grasha &
Riechmann and in second study researchers used set of learning styles defined by
Agarwal. The major findings of first study indicated male and female students were
similar on independent, dependent, avoidant, collaborative and competitive learning style
only difference was on participant learning style. The female students showed strong
preference for participant learning style whereas the result of second study showed
female students tend to have relatively more preference of field-independent and
environment oriented learning style than male counter part. Similarly some other
researchers i.e. Chohen (1986) and Sing (1987) studied the learning styles of male and
female students by using different tools. They have also reported gender differences in
learning styles

147
Verma and Kumari (1989-90) further tried to explore and conducted a research on
“students learning styles across the academic streams”. The significant findings of the
study showed that Science and Arts students have different preferences than Science and
Commerce students. However the students from Arts and Commerce stream showed
similar learning styles.
La Pointe (1990) investigated the relationship between cultures, learning styles,
classroom environments and teaching procedures. Data analysis highlighted certain
differences between groups along with similarities. All had the highest percentage of
agreement with collaborative learning style.
Kaeley (1990) conducted a research on “The influence of Socio-economic status,
entry style and instructional variables on the learning of Mathematics in a Neo-Literate
society”. The result of the study was that SES has influence on student’s mathematics
achievement and no significant effect of classroom instruction was found during the
study. In another study of Kaeley (1988) it was further concluded that male and female
students showed no significant difference in achievement.
Verma and Tiku (1990) found that learning styles of high school students were
not appeared to be affected by their socio-economic status. However, when compared
with intelligence, students with low intelligence level showed greater preference for
avoidance learning style. No interaction between intelligence and socio-economic status
was noted with regard to learning styles of high school students.
When the relationship between learning style and achievement motivation was
measured by Verma (1991) it was found that learning style preference is independent of

148
achievement, that there was no significant relationship found between low achievement
motivated and high achievement motivated students with any specific learning style.
Stewart, E. Cooper. & Miller (1991) has conducted a study on “MBTI learning
style-teaching style dis-congruencies”. The main findings were the teachers and students
who were congruent on the concrete abstract (NS) dimension had the highest rating while
those congruent on both the concrete-abstract (SN) and reflective-active (IE) dimensions
yield the second highest rating. When compared with mean scores for grades it was found
that they were not significantly related to level of learning style-teaching style
congruency and dis-congruency.
In 1991-92 Verma conducted a research on “relationship between rural-urban
residential background and learning style preference”. It was found that rural-urban
residential background of the students was not significantly related to their learning
styles. But some other researchers as Tappenden (1983); Clyne (1984); Atchison (1988)
and Nah (1989) used different tools for measuring learning style and conducted
researches from rural and urban students and found difference in learning styles.
Again Verma conducted research with Sheikh in (1992) on “learning styles of
advantaged and disadvantaged students”. They used Socio-economic Status questionnaire
of Koul for the classification of advantaged and disadvantaged groups. The result showed
that the students from advantaged group have more preference for independent and
participant learning styles than the students from disadvantaged group. Whereas in 1990
it was found that no relationship exists between SES and learning styles.
Verma has conducted series of researches in relation to different aspects of life
with learning style. Like in 1992 he tried to find-out relationship between “creative

149
personality and preferred learning styles”. It was found no significant relationship exists
between creative personality and preferred learning styles. In 1992 he further explored
the relationship of family climate and learning style by a research “an ex-post-facto study
of the relationship of family climate and learning style” and found that family climate of
adolescent girl students has no significant relation with their preferred learning style.
In 1993 he again tried to investigate “differences in learning styles of adolescent
girls students possessing high and low self-concept” and found some difference in
learning styles i.e. the girls students possessing high self-concept seem to prefer field-
independent and long attention span learning style than the students possessing low self-
concept they prefer field-dependent and short attention span learning styles. He focused
not only the learning styles of secondary school students but also the learning styles of
university students. Verma conducted research in (1993) on “modes and styles of
learning of university students as a function of their locus of control”. For this research he
used the learning style inventory of David Kolb (976) and in the result non-significant
relationship emerged between locus of control and learning styles of university students.
Chi-cling Yen and Seok Lee conducted a research in 1994 on “applicability of the
learning style inventory in an Asian context and its predictive value”. It was found that
the Singaporean students score was high in abstract conceptualization ability and low in
concrete-experience ability and it was proved the learning styles were associated with
different educational background.
Gokhale (1995) conducted a research on “Collaborative learning enhances critical
thinking”. He also founds that the students with collaborative learning style performed
significantly better on the critical thinking test than students who studies individually.

150
In 1996 Verma conducted research on “modes and styles of learning as functions
of personality and motivation”. The study showed that personality (sense of personal
identity and locus of control) and motivation (self-actualization and achievement
motivation) were not significantly related to the modes and styles of learning of
university students.
When all aspects were covered Verma (1996) conducted study on “do different
types of schools make a difference in learning style preference of adolescents?” The
findings showed that different types of schools lead to difference in learning styles of the
adolescents. Again during the same year Verma and Kumar (1996) combined five
variables in one study named “study involvement and learning styles of women students
as related to residential background, academic stream and type of institution”. The
findings of the study indicated that the rural women students with Arts subjects studying
at government institutions showed greater study involvement than urban women students
with Science subjects studying at private institutions. Further the rural students prefer
avoidant learning style; Science students showed preference for other learning styles; the
students of private institutions have inclination towards independent and avoidant
learning styles.
Verma (1997) conducted a research on “learning style preferences of
intellectually gifted adolescents and implications for instruction”. The analysis of data
showed that intellectually gifted adolescent students possess different learning styles and
these different learning styles has different implications on instructions like preference of
individualistic learning style encourage independence in learning, the teacher may

151
provide opportunity to the students having flexible learning style in the completion of
assignments which leads to creativity etc.
Verma (1999) investigated “student’s perceptual style preference and classroom
environment in vocational schools”. The findings showed that vocational and non-
vocational secondary school students had similar level of preference for visual, aural, and
kinesthetic perceptual styles.
Mirza in (2001) study the “relationship of socio-economic status with
achievement” and found socio-economic status of students has fairly significant effect on
their achievement.
Imtaiz (2004) conducted a research to investigate the learning style preferences of
university students. He uses Hanson and Silvir’s Learning Preference Inventory. Four
types of learning style i.e. Mastery (ST) Learner, Interpersonal (SF) Learner,
Understanding (NT) Learner and Self-Expressive (NF) Learner have been identified
among students. The findings were majority of students preferred concrete and specific
information, move step by step, learn by practice, emphasis on memory and repeat over
and over what has been learned on the other hand a very few students show preferences
for imagination, creativity and new possibilities.
Aragon, Johnson, and Shaik (2004) conducted research study on “The Influence
of Learning Style Preferences on Student Success in Online versus Face-to-Face
Environments”. They used the same learning styles questionnaire of Grasha &
Riechmann. The data was collected by using three learning style instruments. The
population was the students enrolled in an online instructional design course and students
in an equivalent face-to-face course to determine the students’ preferences across the

152
constructs of motivation maintenance, task engagement, and cognitive controls.
Significant differences were found between the learning style preferences of the online
students and those of the face-to-face students, these differences were not significant
when success factors were controlled. The results of the study suggested that students can
learn equally well in either delivery format, regardless of learning style, provided the
developed course revolve around adult learning theory and sound instructional design
guidelines.
Al-Othman conducted research in 2004 to find out the relationship between
gender and learning styles in internet-based teaching at Kuwait. The focus of the study
was on students' reactions to online education in TEFL as determined by degree of
satisfaction with regards to: classes, degree of mastery of content, degree of applicability
of content, and preferences for learning tools; applied to the various online sessions they
have taken in a TEFL methodology course. Findings revealed that there were obviously a
multitude of factors that influence reactions to online learning and teaching. The study
concluded that it was not possible to estimate the weighting of these factors that occur in
a student's mind as he/she evaluates an online course.
Anzelmo-Skelton (2006) examine the effects of learning style, strategy use, and
personalization of mathematical word problems on the selection of appropriate operations
and the execution of correct computational responses by students with learning
disabilities (LD). The secondary purpose of the study was to determine if learning style,
strategy used, and personalization of mathematical word problems interacted with
mathematical word problem achievement levels to effect students with learning
disabilities selection of appropriate operations and execution of correct computational

153
responses. The sample was 144 male students of elementary schools with learning
disabilities receiving general and special education services. Results of this study
revealed that learning style did affect students with learning disabilities, selection of
appropriate operations and execution of correct computational responses of mathematical
word problems. The other outcomes of the study indicated no statistically significant
results. Further investigations were made regarding the affect of learning style, strategy
used, and/or personalization on the mathematical responses of students with learning
disabilities.
Uzun and Sentruk conducted a study in (2008) assessing learning styles of
students at uludag university faculty of education. The purpose of the study was to
determine learning styles of students in order to develop teaching strategies about
Computer Literacy Course and to find out the significant difference on learning
preferences between students from different departments. Grasha & Riechmann Learning
Style Survey was used to assess the learning style preferences of the students. Sample of
this study was randomly selected 177 students consisted of 53 students from The
Department of Educational Science, 38 students from The Department of Turkish
Education, 86 students from The Department of Primary Education. Data were collected
from a web page designed for Computer Literacy Course given to these students. Results
suggested that students prefer collaborative and competitive style learners. One way
ANOVA was used to determine the difference on learning preferences between students
from different departments for six sub categories of learning style inventory. Data
analysis revealed that there were no department-related differences on students’ learning
preferences.

154
Thomas, Ratcliffe, Woodbury and Jarman (2004) conducted an experimental
research study on Learning Styles and Performance in the Introductory Programming
Sequence at university of Wales United Kingdom. The objective of the study was to
reports on the implication of different preferred learning styles on students' performance
in the introductory programming sequence as on work in progress on how to
accommodate these different styles. Students were given a learning styles preference test
and then their preferred learning styles were compared to their performance on the exam
and the practical programming part of the introductory programming module. There were
significant differences in performance between groups of students. Research has shown
that methods of teaching and learning which combine significant student autonomy,
conjecturing and articulation with dynamic scaffolding by the teacher are highly
effective.
2.31 Summary of the whole discussion
The purpose of education is to develop the individual’s personality. All the efforts
of psychologists and educationists revolved around it. They started to define learning.
They focused learning by different aspects. At one side they looked down how the brain
functions with the growth of an individual on other side they tried to know how the brain
develop. How people get, process and retained information. Whatever they understood it
was presented in the name of learning theories. The earlier psychologists focus behavior
of the person. They described learning as a mechanical task. It is a drill process and
promotes rote memorization. They were known as behaviorists. Socialists criticize them
and gave their own point of view about learning. They said learner can not live in

155
isolation and learning is a social activity, when learner interacts with environment
learning takes place. The cognitivists said that the learning is the cognitive process. They
focus on cognitive map. All the theories overlap each other. The new school of thought
did not deny the previous one rather they modify the concept. When these learning
theories grow it provided the base for learning styles.
The learning style is the learner’s preferred way of perceiving and responding to
the information in a specific learning situation the concept of learning style travel with
the learning theories. Every learning theory advocates a learning style. Research on
learning styles leads to the different directions some see learning styles in the cover of
cognitive style but these are different and some wrap it in personality styles, some focus
environment and some psychology of the person. The reason is as there is variation in
learning theories so in the learning styles.
Learning style is the way of processing information. When we stand on the feet of
behaviorists/environment oriented situation our thinking reflects accordingly and the
Dunn and Dunn, Jhon Holand’s and Schmeck, Ribich and Aggarwal’s model of learning
style emerges. When it looked by the socialist point of view they consider the
interpersonal relationship helps to gain, understand and assimilate information, then
Grasha and Riechmann, and Marcia Baxter’s model appears in literature and when the
proponents of cognitive learning theory focuses learning styles Kolb’s Gregric and
Honey and Mumford learning style model grab the attention of people. The focus of all
the above were physical environment, social environment and cognitive abilities for
describing learning styles. The Felder and Silverman combine cognitive and personality
both and Felder and Silverman learning style model emerges.

156
Everyone did a god job in their own perspective and tried to highlight their own
point of view. In this way various directions appeared. The focus of this research was to
study the student’s way of learning in classroom while interacting with peers and
teachers; which learning style they prefer during their learning in class and what is the
role of socio-economic status (SES) to enhance the learning achievement. For this
purpose Grasha’s learning style model was adopted according to Pakistani scenario. This
model described six learning styles.
Social status decides the position of a person in the society. To determine the
social status in depth study was done. Literature showed like the learning styles many
theories and approaches were described by the socialists time to time to determine the
status of a person. The prominent social class theories were Karl Marx’s “class and
capitalism”, Max Weber’s “class, status and party”, “Theory of functionalism” and “the
conflict theory” were found to determine the status of the person in society. Parallel to
these theories some approaches were also used to measure class position in open class
society. These approaches were “the style of life”, “the reputational”, “the subjective”,
“the occupational prestige” and “the multiple index approach. After reviewing the social
structure of different neighboring countries five class structure of SES was selected to
classify the respondents. The questionnaire for measuring the SES of respondents was
developed keeping in view the National documents of Pakistan.
Five classes “upper class”, “upper middle class”, “middle class”, “lower middle
class” and “lower class” were used to classify the parents of the students involved in the
study.
157
For this research learning style and SES were used as independent variables and
the learning achievement as dependant variable. In Pakistan Board’s of Intermediate and
Secondary Education are the institutions responsible to assess students’ achievement and
award them certificate of success. The students involved in conducting this study were
enrolled in four districts, three from Punjab province and one from Federation. The
student’s scores obtained on their Secondary School Certificate Examination conducted
by their respective Board’s of Intermediate and Secondary Education was taken as their
learning achievement. These institutions uses written, oral and worked sample test to
assess the students’ achievement.
Other research studies were also reviewed who have similar theme. Some
researches were about the SES and achievement some about the learning styles and
achievement and some focus gender-wise and area-wise preference of learning styles.
Some studies focus learning styles of distance learning other focus learning styles of
formal students. Some researchers used Grasha and Riechmann instrument some uses
other instruments. A long discussion showed the research studies can be categories in
three ways. Some of the studies showed that the socio-economic status affect the
achievement. (Bond, 1981; Kaeley, 1990; Verma & Sheikh, 1992; and Mirza, 2001), one
study showed no effect of SES on achievement. (Verma & Tiku, 1990).
Parallel to this different variables were studied with learning styles. The major
variables were gender, institutions, personality different stream of academic subjects,
creativity, area, family climate, locus of control, choice of career motivation, anxiety etc.
Some variables affected learning styles (Hopkin, 1982; Pardan, 1985; Bishop, 1985;
Ketchum, 1985; Dunn, 1989; Verma & Kumari, 1988-89; Verma & Kumari, 1989-90;

158
Verma, 1993; Imtaiz,2004; Uzun and Sentruk, 2008) but some did not affect any learning
styles (Verma & Sherma, 1987; Katz, 1988; Verma, 1989; Verma & Tiku, 1989; Verma,
1991; Verma, 1993; Chi-Cling Yen & Soek Lee, 1994; ).
One study Verma & Tiku (1990) showed no relationship between SES and
Learning Styles. Some studies showed partial effect of different variables. Al-Otman
(2004) showed that it is not possible to estimate the weighting of these factors that occur
in a student's mind as he/she evaluates an online course.
So in the light of above discussion researcher feel forced to look through the
situation deeply in Pakistani perspective.

159
CHAPTER 3
METHODOLOGY AND PROCEDURE
The method of studying a problem is conditioned by many factors, such as the
nature of the problem, the place where the research is to be conducted and other resources
available to the researcher. The procedure of the study includes the following:
Research design and method,
Population and sampling,
Research instruments,
Data collection and the statistical use for the analysis of data
3.1 Research Design and Method
The research design used was descriptive and the nature of the study was
ex-post facto research. The independent variables were learning styles of the students and
socio-economic status (SES) of the parents of selected students and the dependent
variable was learning achievement of sampled students.
3.2 Demographic Variable of the Sampled Districts
The sample districts were selected from the northern zone called Barani zone of
Pakistan. They are linked by road. These districts were classified as developed and under
developed on the basses of literacy rate, services available and facilities provided by
government or other non-governmental organizations as was described by Khawaja
(2005).

160
Islamabad and Rawalpindi district were categorized as developed districts and
Attock and Chakwal districts were as under developed districts. Islamabad is the capital
of Pakistan and Rawalpindi is sister city of it. Both the districts were declared as
developed cities have literacy rate 72.38 and 70.5 higher in ranking regarding literacy,
both the districts have many facilities in terms of education, health, business and trade,
embassies and foreign offices etc. Attock and Chakwal districts have fewer facilities
when compared with the developed districts. The literacy rate of Attock and Chakwal is
49.27 and 56.72 respectively. Although both district are neighbors of developed district
but there is a waste difference in facilities and services available and living standards of
people.
Developed district have almost same educational and health facilities as both have
many big hospitals and universities. Chakwal district has one small campus of University
of Engineering and Technology Taxila and one District Head Quarter Hospital, whereas
Attock has a campus of University of Education Lahore and one government hospital.
Procedure
Researcher adopted following procedure for the study.
3.3 Population
Students enrolled at four districts Attock, Chakwal, Islamabad and Rawalpindi
were identified as population. These districts were selected because they presented one
region called “Pothohar Plateau” on the map of Pakistan and the socio-economic status of
the population living there is almost equal. The main strata’s of population were defined
as male, female, rural and urban. Executive District Office (EDO) Attock, Chakwal and
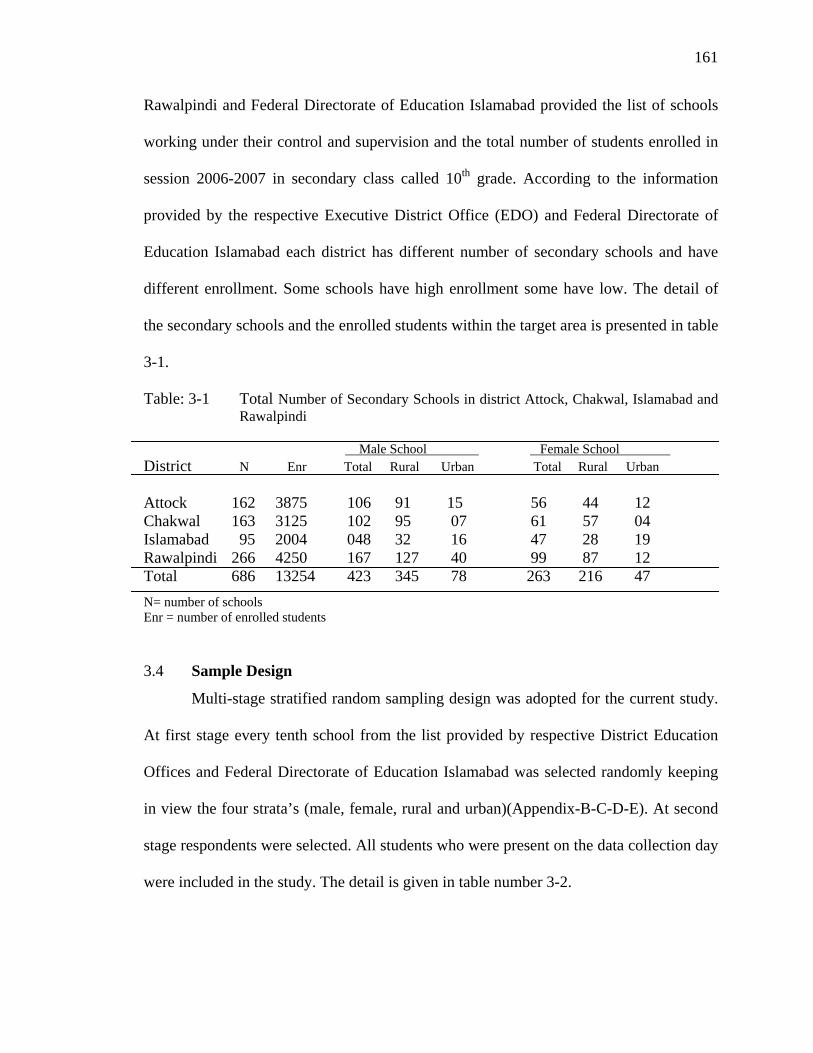
161
Rawalpindi and Federal Directorate of Education Islamabad provided the list of schools
working under their control and supervision and the total number of students enrolled in
session 2006-2007 in secondary class called 10th grade. According to the information
provided by the respective Executive District Office (EDO) and Federal Directorate of
Education Islamabad each district has different number of secondary schools and have
different enrollment. Some schools have high enrollment some have low. The detail of
the secondary schools and the enrolled students within the target area is presented in table
3-1.
Table: 3-1 Total Number of Secondary Schools in district Attock, Chakwal, Islamabad and Rawalpindi
Male School Female School
District N Enr Total Rural Urban Total Rural Urban Attock 162 3875 106 91 15 56 44 12 Chakwal 163 3125 102 95 07 61 57 04 Islamabad 95 2004 048 32 16 47 28 19 Rawalpindi 266 4250 167 127 40 99 87 12 Total 686 13254 423 345 78 263 216 47
N= number of schools Enr = number of enrolled students
3.4 Sample Design
Multi-stage stratified random sampling design was adopted for the current study.
At first stage every tenth school from the list provided by respective District Education
Offices and Federal Directorate of Education Islamabad was selected randomly keeping
in view the four strata’s (male, female, rural and urban)(Appendix-B-C-D-E). At second
stage respondents were selected. All students who were present on the data collection day
were included in the study. The detail is given in table number 3-2.

162
Table: 3-2 Sample of the study by schools and students included in the study District No. of Selected schools No. of respondents Attock 16 775 Chakwal 16 625 Islamabad 08 200 Rawalpindi 26 850 Total 66 2450
Sample Design
Figure-3-1: Sample Design of the study
Attock 775
Chakwal 625
Islamabad 200
Rawalpindi 850
Male 500
Male 400
Male 100
Male 575
Female 275
Female 225
Female 100
Female 275
Rural 325
Urban 450
Rural 400
Urban 225
Rural 100
Urban 100
Rural 425
Urban 425

163
Distribution of questionnaire and response rate from each district, gender-wise and
region-wise is presented in table 3-3, 3-4 and 3-5.
Table: 3-3 Response rate from sampled student’s by district District Delivered Received Response Rate(%)
Attock 775 492 63 Chakwal 625 452 72 Islamabad 200 126 63 Rawalpindi 850 510 60 Total 2450 1580 64 Table 3-3 shows the variation in response rate. This was because the student’s
questionnaire was filled by themselves in class but the SES Questionnaire was filled by
their parents at home. Some students or their parents did not return the questionnaire. So
the overall returned response rate of sampled students was 64 percent. The district-wise
response rate of Attock, Chakwal, Islamabad and Rawalpindi was 63, 72, 63 and 60
percent respectively.
Table: 3-4 Response rate by gender
District Male Female
Delivered Received Response
rate(%) Delivered Received
Response
rate(%)
Attock 500 304 61 275 188 68
Chakwal 400 275 69 225 177 78
Islamabad 100 58 58 100 68 68
Rawalpindi 575 327 57 275 183 66
Table 3-4 indicates gender-wise response rate of male and female students of each
district. The response rate of male and female students from Chakwal district was highest
i.e. 69 and 78 percent respectively. The response rate of male and female students from
Rawalpindi district was lowest that is 57 and 66 percent respectively.

164
Table: 3-5 Response rate by region
District Rural Urban
Delivered Received Percentage Delivered Received Percentage
Attock 325 166 51 450 326 72
Chakwal 400 282 70 225 170 75
Islamabad 100 63 63 100 63 63
Rawalpindi 425 239 56 425 271 63
Table 3-5 gives the response rate of rural and urban students. Table further shows
the response rate of the rural and urban students from Chakwal was highest that is 70 and
75 percent respectively. The response rate of the rural students of Attock district was
lowest i.e. 51 percent.
3.5 Instruments
For the research three types of data were required: first; information about
students Learning Styles, second; information about Socio-economic Status (SES) of the
parents of students and indirectly of students and third; student’s achievement scores. For
learning styles, Grasha & Riechmann’s (1975) questionnaire “Learning Style Scale
Questionnaire” was adopted, for Socio-economic Status “Socio-economic Status (SES)
Scale Questionnaire” was developed by researcher and Student’s achievement sores in
Secondary School Certificate (SSC) Examination 2007 were used for their academic
achievement. For the academic achievement SSC examination scores was used because
FBISE Islamabad and BISE Rawalpindi prepared standardized paper for measuring
students’ achievement and it was difficult for researcher to prepare standardized paper for
all subjects evaluated in the SSC examination.

165
3.5.1 Learning Style Scale Questionnaire
Grasha and Riechmann (1975) prepared Learning Style Scale Questionnaire for
measuring students learning styles. The original version which was developed in 1974
has ninety statements. The modified version 2002 of the questionnaire contains 60
statements; it is available on inter-net (Appendix-F). The questionnaire focuses on six
learning styles named as Independent, Dependent, Collaborative, Competitive,
Participant and Avoidant. Each style has ten statements. Each statement refers to a
specific situation of respective learning style. All the statements were regarding the
teaching and learning in classroom environment.
a) Variables of the questionnaire
The questionnaire was assembled in a specific pattern. The statements of each
style were placed in the sequence of Independent, Avoidant, Collaborative, Dependent,
Competitive and Participant Learning Style respectively. The statements were placed in
this way to avoid the influence of style on students. The Statements were designed to
respond on five point Likert Scale.
b) Scoring Procedure of the Questionnaire
The scoring manual was also given by the Author of the questionnaire. The
obtained score for each style may range between fifty and five; the maximum may be
fifty and the minimum may be five. It can be machine as well as manual scored. Machine
scoring does it automatically as program was installed with the questionnaire. The
manual scoring procedure was as follows:

166
1. Copy responses from the questionnaire returned by the students with given ratings
on the space provided below for each item.
Learning Style Test Items 1. . 2. . 3. . 4. . 5. . 6. . 7. . 8. . 9. . 10. . 11. . 12. . 13. . 14. . 15. . 16. . 17. . 18. . 19. . 20. . 21. . 22. . 23. . 24. . 25. . 26. . 27. . 28. . 29. . 30. . 31. . 32. . 33. . 34. . 35. . 36. . 37. . 38. . 39. . 40. . 41. . 42. . 43. . 44. . 45. . 46. . 47. . 48. . 49. . 50. . 51. . 52. . 53. . 54. . 55. . 56. . 57. . 58. . 59. . 60. .
2. Sum the ratings for each column and place them in the spaces below
. . . . . . . . . . . .
3. Divide total score for each column by 10 and place answer in the spaces below:
. . . . . . . . . . . . Independent Avoidant Collaborative Dependent Competitive Participant
4. The names for each learning style associated with each column are shown above.
5. Check whether score represents a relatively Low, Moderate, or High score based
on the norms for each learning style scale shown below:
Low Moderate High
Independent [1.0-2.7] [2.8-3.8] [3.9-5.0] Avoidant [1.0-1.8] [1.9-3.1] [3.2-5.0] Collaborative [1.0-2.7] [2.8-3.4] [3.5-5.0] Dependent [1.0-2.9] [3.0-4.0] [4.1-5.0] Competitive [1.0-1.7] [1.8-2.8] [2.9-5.0] Participant [1.0-3.0] [3.1-4.1] [4.2-5.0]

167
3.5.2 Details of the Questionnaire for the study
The Grasha’s Questionnaire was adopted by the researcher. The questionnaire
was translated into Urdu and English language with the help of experts of Urdu and
English Language departments of different universities. Learning Style Scale
Questionnaire was comprised of sixty statements ten for each Learning Style i.e.
Independent, Dependent, Collaborative, Competitive, Participant and Avoidant. The
statements were distributed in the same order as suggested by the author to avoid the
influence of different learning styles on students. Each statement carried five possible
responses. The Likert 5 point method of summated rating was used. The scaled values
used against each response were Strongly Disagreed (SD) =1, Disagreed (D) =2, Not
Decided (ND) =3, Agreed (A) =4 and Strongly Agreed (SA) =5. (English and Urdu
Version of Learning Style Questionnaire attached at Appendix-H&J)
The same scoring procedure adopted as was suggested by the author. It was pilot
tested in four schools (Appendix-A) other than the schools from where sample was
drawn: two from each districts Islamabad and Rawalpindi. On the basis of the result of
the pilot testing the highlighted confusions in the statements of the instrument were
rectified.
As many learning style inventories’ and questionnaires are available in market as
the learning styles are; but the first reason to use this learning style questionnaire was; as
the main focus of the study was students learning in classroom i.e. social interaction of
students in class. What are the contributions of teachers’ and peers’ to develop a
personality? Whether the social relations effects the learning styles and achievements or
not? The second reason was; the other learning styles are based on inherited
168
characteristic. Some are related to personality traits which are psychology based (Jhon
Holand's Model) some are cognitive styles (Kolb’s, Honey and Mumford’s) comes from
heredity or God giftedness. Aggarwal’s and Dunn & Dunn’s focuses environment some
are the combination of two factors personality and cognitive (Felder & Silverman). All
focuses individuals; Individual’s personality, individual’s intelligence, individual’s
working with physical environment. Grasha & Riechmann has paid attention on the
learning style working in the classroom with other students and with teachers. This style
has combination of factors as defined by Grasha and Riechmann independent and
dependent (no relation with or depend on others), collaborative and Competitive (sharing
and working with each other or not sharing but working to compete human’s involved)
and participation and avoidant again focus is on students. So the researcher selected this
learning style questionnaire for the study. The questionnaire is available on net even then
the researcher asked the publisher for the permission to use the questionnaire by e-mail
but got no response.
3.5.3 Socio-Economic Status (SES) Scale Questionnaire
“Socio-economic Status (SES) Scale Questionnaire” was used to identify the
Socio-economic Status (SES) of the parents of sampled students. The indicators used for
defining Socio-economic status were taken from the national documents of Pakistan, like
Pakistan Social and Living Standards Measurement Survey 2004-05 by Federal Bureau
of Statistics Islamabad and Pakistan Economic Survey for the year 2005-06.

169
a) Pakistan Social and Living Standards Measurement Survey (PSLSMS)
2004-05
Pakistan Social and Living Standards Measurement Survey (PSLSMS) 2004-05 was
fourteen page official document. It was developed by Federal Bureau of Statistics
Government of Pakistan (Appendix-K). It was the latest version available in the office of
Bureau of Statistics. It was used to measure the social and living standards of Pakistani
people. It was a detailed instrument containing fourteen portions A, B, C, D, E, F, G, H,
I, J, K, L, M and N. Each part required different detail.
The part A was about introduction. It asked the detail of province, district, city, name
of interviewer and interviewee. Part B was about the detail of family size (male and
female members). C part was about the educational levels of the family members. The
next part D was about the health facilities available and utilized by the members of the
family. The E part of the questionnaire was about the nature of the job of the earning
member of the family. F part asked about the property (agriculture land, personal live
stock) and facilities (iron, fans, sewing machine refrigerator, and traveling facilities)
available to a family. The G part of the instrument was about the nature of
accommodation and utilities. H portion has two parts the first was about the income and
expenditure and the second part was about the loan a family has taken and spends on
which item. The “I” part asked the safety measure for the children less then age five. The
J & K part discussed the condition of married women of the family and services and
facilities availed by the family members respectively. The last part L was about the
detailed expenditure of the family. This questionnaire was used to measure and determine
the social and living standard of a family which was consulted by the researcher to

170
develop SES questionnaire for the measurement of SES of the parents of the sampled
students.
b) Pakistan Economic Survey 2005-06
The second document which was consulted for the development of SES
questionnaire was Pakistan Economic Survey 2005-06. This document is an official
document developed by Economic Adviser’s Wing, Finance division, Government of
Pakistan. The document defined economic and social indicators (Appendix-L). The
indicators defined by this book were growth rate (constant and current), consumer price
index, fiscal policy, money and credit, stock exchange market, balance of payments,
commodity sectors, infrastructure, human resources and social development.
Along with the two documents discussed above a research study of Sabzwari
(2004, p.50) was also consulted. The indicators taken by him were educational
qualification, occupation, monthly income, supervision/teaching to children, time spend
with children, participation of children for sports and the value system of a family.
After analyzing all the documents and discussed with the experts of the sociology
departments of different university some indicators were finalized by the researcher with
the consent and help of supervisor. The main indicators were the parents’ academic and
professional qualifications, parents income level, job, family size, locality and nature of
accommodation, facilities at home, traveling facilities, distance of school from home and
coaching at home. After pilot testing the instruments were finalized in the reflection of
the responses of students and by their parents with the expert opinions of experts
(Appendix-G&I).

171
3.6 Validity and Reliability of Instruments
Validity is the degree to which an instrument measures what it is supposed to
measure and consequently, permits appropriate interpretation of scores. This is the match
between the conceptual definition and the operational definition of terms. For the validity
both the instruments “Learning Style Scale Questionnaire” and “Socio-economic Status
Scale Questionnaire” were delivered to different experts of Psychology, Sociology and
Languages, and were received with their comments. In the light of the experts’ opinion
the instruments were finalized.
The reliability means dependability, or trustworthiness. According to Gay (1992),
“The reliability is the degree to which an instrument consistently measures whatever it
measures”. An instrument is reliable if it yields consistent scores when the phenomenon
being measured is not changing. It is the degree to which scores are free of “measurement
error”. The reliability of an opinionnaire may be measured by inter-item reliability type.
The inter-item reliability measures internal consistency of statements. The internal
consistency is the association of answers to a set of questions designed to measure the
same concept. The stronger the association among individual items and the more items
included, the higher the reliability of an index.
• Cronbach’s alpha is a statistics commonly used to measure inter-item
reliability
• Cronbach’s alpha is based on the average of all the possible correlations of
all the split 1/2s of a set of questions on a questionnaire.
The pilot test of Learning Style Questionnaire and Socio-economic Scale
Questionnaire was done in four schools; two from Rawalpindi and two from Islamabad

172
other than the sample schools. The list of pilot test schools is attached at Appendix-A.
The learning style questionnaire was filled by students in the class and socio-economic
status scale questionnaire was carried by them to home and that was filled by their
parents. The statements were clear to the students no one asked any significant question
regarding the statements of both the questionnaire. The data were entered in to computer
through Statistical Package for Social Sciences SPSS and the reliability of the learning
style scale questionnaire was calculated by Cronbach alpha and it was found 0.75.
3.7 Socio-economic Status Questionnaire Codes
After a long discussion with the experts of Sociology and Language departments
of different universities and with the consent of supervisor the SES Questionnaire were
assigned specific codes. The allotted codes were as follows:
Education of parents = 1 – 8
Professional education of parents = Certificate =1 Diploma =2 Degree =3
Income sources = 1 - 3
Father/mother job = 1 – 3
Family size = members a family have
Earning members of the family = number of earning members
Children enrolled in educational levels = 1-6
Income group = 1-6
Nature of accommodation = 1-5
Facilities at home = 1-9
Traveling facilities = 1-3

173
Distance of school from home = number of kilometers
Coaching at home = 1-6
3.8 Data Collection
Data was collected, by administering both the instruments “Learning Style Scale
Questionnaire” and “Socio-economic Scale Questionnaire” directly to students in their
respective classes with the help of their teachers in the month of March, 2007. The
Learning Style Scale Questionnaire was responded by students him/her self in class room
whereas the Socio-economic Scale Questionnaire was reported by their parents. Some of
the students and their parents did not returned the questionnaire so the variation in
response rate occurred which is discussed in section 3.3 Table 3-3 of this chapter. The
achievement data of the students was collected from the gazette of Board of Intermediate
and Secondary Education Rawalpindi and Federal Board of Intermediate and Secondary
Education Islamabad of SSC Examination 2007.
3.9 Data Analysis
Collected data was entered in computer with the help of data entry operator
during June-August, 2007 for the purpose of analysis through software Statistical
Package for Social Sciences (SPSS). Descriptive statistics (frequency and percentage)
and inferential statistics (Pearson correlation and t-test) were used to analyze the data.

174
3.10 Limitations
During the process of conducting the study some problems were faced by the
researcher so the study was restricted at some variables:
1. It was difficult to include the students from all provinces of Pakistan so the
study was restricted to the students of four districts, three from Punjab and one
from Federation constituting the “Pothohar Plateau”.
2. It was difficult to manipulate all the defined learning styles so the study was
restricted to only Garasha & Riechmenn’s Social Interaction Model.
3. It was difficult to manipulate all the indicators of SES however the study was
restricted to some basic indicators like education, income, facilities at home
and family size.
4. The internal assessment was not given the weight-age. The reason was
teachers feel threat against them. The study was restricted to external
examination of the students only which were conducted by the Board of
Intermediate and Secondary Education.

175
CHAPTER 4
DATA ANALYSIS AND INTERPRETATION
This chapter deals with the data analysis and its interpretation. For this purpose
the whole chapter has been divided into three sections. The first section presents the
analysis of the data by using percentages for the distribution of sample in different groups
of SES and academic achievement. The second section reflects the relationship of
different variables by using Pearson’s Product Moment Correlation and the third section
presents the difference in opinion of the sampled students by using t-test.
SECTION 1
4.1 Formation of status class
The five class social structure was used. The classes were named as upper class,
upper middle class, middle class, lower middle class, and the lower class. This structure
was previously used by Sabzwari (2004) to study the social structure in Pakistan. All the
variables were scored and total scores were used to make different classes. The maximum
score obtained on Socio-Economic Status Scale Questionnaire by the respondents was
150 and minimum score was 106. According to the obtained scores the classes were
made by a fix interval. The detail is as follows:
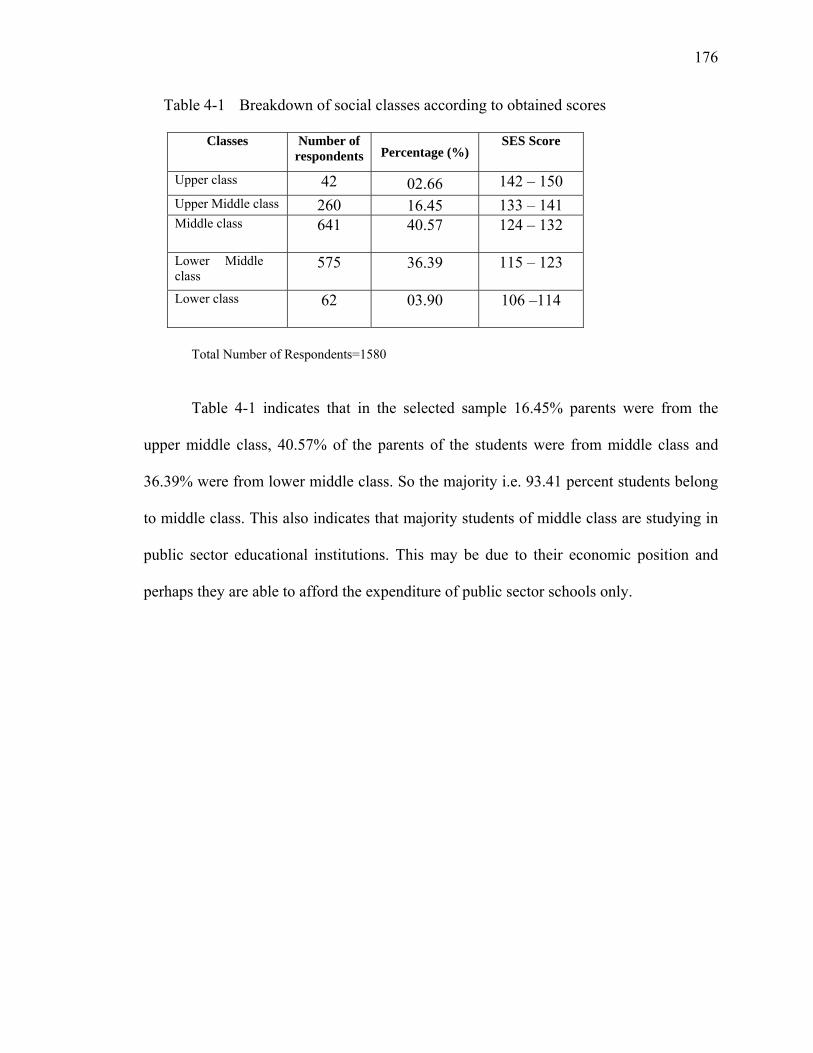
176
Table 4-1 Breakdown of social classes according to obtained scores
Classes Number of respondents Percentage (%)
SES Score
Upper class 42 02.66 142 – 150 Upper Middle class 260 16.45 133 – 141 Middle class 641 40.57
124 – 132
Lower Middle class
575 36.39
115 – 123
Lower class 62 03.90
106 –114
Total Number of Respondents=1580 Table 4-1 indicates that in the selected sample 16.45% parents were from the
upper middle class, 40.57% of the parents of the students were from middle class and
36.39% were from lower middle class. So the majority i.e. 93.41 percent students belong
to middle class. This also indicates that majority students of middle class are studying in
public sector educational institutions. This may be due to their economic position and
perhaps they are able to afford the expenditure of public sector schools only.

177
The achievement of the students’ in respect of their scores was collected by the
gazette of Board of Intermediate and Secondary Education (BISE) Rawalpindi and
Federal Board of Intermediate and Secondary Education (FBISE) Islamabad. The gazette
showed that the total score was 1050. The graphic representation of achievement scores
of the students’ is given in following graph.
328362377387397406415424433442451460469478487496505514523532541550559568577586595604614623636646659669682704733
achv
0
5
10
15
20
Cou
nt
Graph-1: Achievement of the respondents at secondary level.
Graph-1 showed the obtained scores of the respondents at secondary level. The
graph is negatively skewed. It reflects the performance of the students is below the actual
mean. The reason may be the for this session the examination pattern focuses on
Application level of Cognitive Domain of Baloom’s Taxonomy but the classroom
teaching did not equip them for such tasks.

178
According to gazette of Board of Intermediate and Secondary Education (BISE)
Rawalpindi and Federal Board of Intermediate and Secondary Education (FBISE)
Islamabad grading policy (Appendix-M) for the year 2007 the sampled students’
achievement scores were categorized by grades given in table 4-2.
Table 4-2 Distribution of students by grades included in the study
Grade No. of students in sample Percentage
A+ 033 02
A 167 11 B 444 28 C 694 44 D 238 15 E 004 00
N=1580 Table 4-2 gives the detail of sampled students’ academic achievements according
to their respective grades. It shows that only 13% students were declared as pass in A and
above grade, 28% students were in B grade and 44% were declared as C grade achievers
and only 15% were low achievers. It strengthens the findings of previous graph-1. It is
further be clarified by Pie graph.
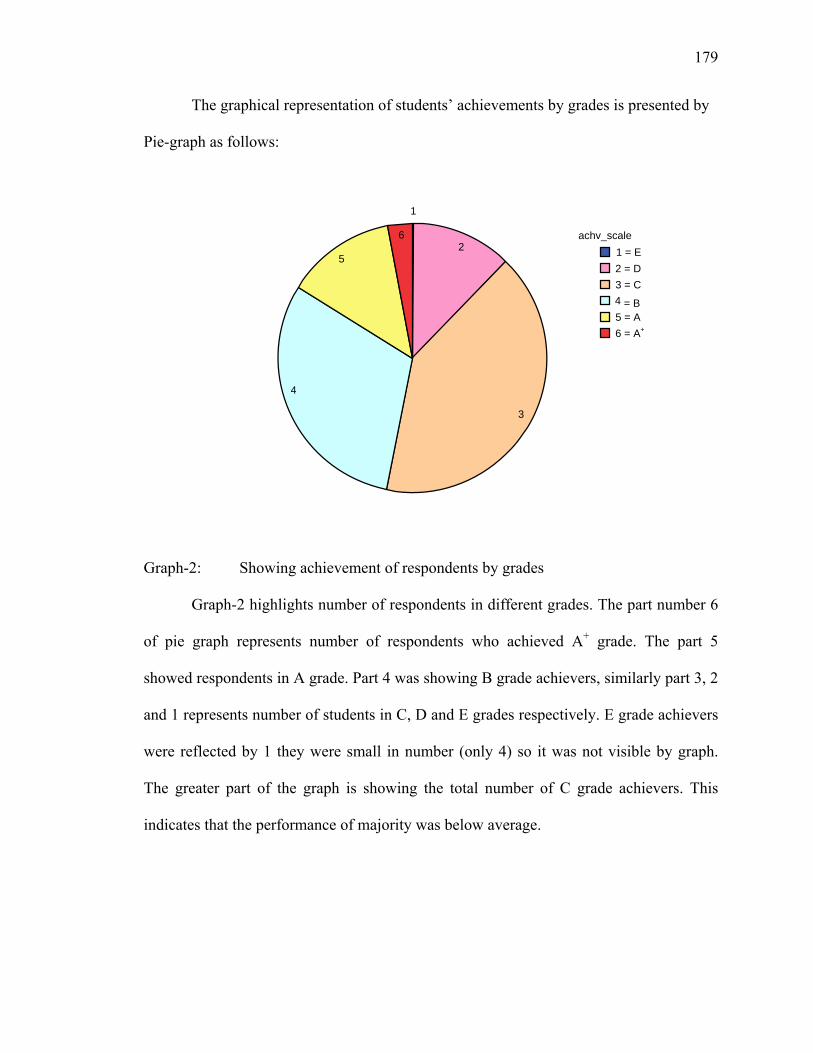
179
The graphical representation of students’ achievements by grades is presented by
Pie-graph as follows:
Graph-2: Showing achievement of respondents by grades
Graph-2 highlights number of respondents in different grades. The part number 6
of pie graph represents number of respondents who achieved A+ grade. The part 5
showed respondents in A grade. Part 4 was showing B grade achievers, similarly part 3, 2
and 1 represents number of students in C, D and E grades respectively. E grade achievers
were reflected by 1 they were small in number (only 4) so it was not visible by graph.
The greater part of the graph is showing the total number of C grade achievers. This
indicates that the performance of majority was below average.
achv_scale 1 = E 2 = D
3 = C
4 = B 5 = A
6 = A+
6
5
4
3
2
1

180
Table 4-3 Distribution of respondents of each SES group in respective grades.
A+ A B C D E Total
Upper Class 0 9 13 15 5 0 42
Upper Middle Class 12 29 92 98 29 0 260
Middle Class 10 87 164 292 88 0 641
Lower Middle Class 11 39 162 265 95 3 575
Lower Class 0 3 13 24 21 1 62
Total 33 167 444 694 238 4 1580
Table 4-3 is a two way table showing the number of respondents in the sample
and their distribution in each SES group and in respective achievement grades. Table
shows that the majority of the respondents were from middle class (641). Similarly the
values in table showed that B and C grade achiever were in majority (444, 694
respectively). The E grade achievers belong to lower middle and lower class.

181
Table 4-4 Distribution of respondents of developed districts in each SES group and respective grades.
A+
A B C D E Total
Upper Class 0 5 8 7 1 0 21
Upper Middle Class 6 13 47 37 20 0 123
Middle Class 5 37 47 129 46 0 264
Lower Middle Class 4 9 58 93 41 0 205
Lower Class 0 0 5 12 6 0 23
Total 15 64 165 278 114 0 636
Table 4-4 shows total number of respondents of developed districts and their
distribution in SES groups and in respective grades. The overall distribution of
respondent presented in table 4-3 was also reflected in this table. The majority of the
students were from middle class. Similar values were found regarding grades in table 4-3
majority got B and C grade. No one got E grade in the sample from developed districts.

182
Table 4-5 Distribution of respondents of under-developed districts in each SES group and respective grades.
A+
A B C D E Total
Upper Class 0 4 5 8 4 0 21
Upper Middle Class 6 16 45 61 9 0 137
Middle Class 5 50 117 163 42 0 377
Lower Middle Class 7 30 104 172 54 3 370
Lower Class 0 3 8 12 15 1 39
Total 18 103 279 416 124 4 944
Table 4-5 reflects the position of respondents of under-developed districts in each
SES group along with their grades. Majority of the respondents belongs to middle and
lower middle class (377, 370 respectively). The majority of A+ grade achievers belongs
to lower middle class and majority of A grade achievers were from middle class. The
majority of upper class respondents (8) of these districts got C grade.
The table 4-3, 4-4 and 4-5 shows that the achievement of respondents is tilted
towards left as in tables the majority achieve grade B and C. This distribution showed
approximate not exact normal curve of the achievement of the sample.

183
SECTION 2
In this section the relationship between: learning styles and students’ academic
achievement, socio-economic status groups and academic achievement and learning
styles and socio-economic status of students is discussed. The one thing appeared during
the data analyses which effects the results was the responses of students for competitive
learning style. The scoring of Learning Style Scale Questionnaire according to given
manual in Chapter 3 section 3.4.1 it was found for competitive learning style the scored
value was constant. Constant value can not be correlated. So no relationship was found
no analyses were made for this learning style when correlation was calculated.
Question 1: Is there any significant relationship between the different learning styles
and learning achievement of students at secondary school level Table 4-6 Relationship between A+ grade achievers and their learning styles Groups Pearson Correlation(r) p value Significance Independent style 0.222 .231 n.s
Dependent style -.086 .636 n.s
Collaborative style -.388* .026 s
Competitive style not defined
Participant style -.166 .355 n.s
Avoidant style -.046 .787 n.s *Significant at α=.05 Number of respondents = 33
Table 4-6 shows the significant negative relationship between the A+ grade
achievers and collaborative learning style, where as relationship with other styles was not
significant. Only one relationship was positive and it was with Independent learning style
(r = .222). It gives some indication of the students learning style that A+ grade achievers
were not collaborative. They may prefer Independent learning style.

184
Table 4-7 Relationship between “A” grade achievers and their learning styles Groups Pearson Correlation(r) p value Significance Independent style -.087 .261 n.s
Dependent style -.155* .045 s
Collaborative style -.082 .290 n.s
Competitive style not defined
Participant style -.014 .853 n.s
Avoidant style -.036 .647 n.s * Significant at α=.05
Number of respondents = 167
Table 4-7 indicates the relationship among “A” grade achievers and their learning
styles. All the defined relationships were negative. Only one relation was negatively
significant. It was between A grade achievement and dependent learning style. The
relationship with other styles was not significant and was in low range near zero. It means
A grade achievers were not dependent. The other relationships were negative and have
low value between 0 and the significant relationship -0.155. The value of collaborative
and independent style was approximately equal, whereas the value of avoidant and
participant styles was near to zero. It was found that the A grade achievers do not prefer
any from these styles.

185
Table 4-8 Relationship between “B” grade achievers and their learning styles Groups Pearson Correlation(r) p value Significance
Independent style .048 .309 n.s
Dependent style .007 .881 n.s
Collaborative style .066 .164 n.s
Competitive style not defined
Participant style .070 .142 n.s
Avoidant style .036 .445 n.s
Number of respondents = 444
Table 4-8 indicates no significant relation between B grade achievers and their
learning styles. Although all the relations were on positive side on the defined range of
the correlation, but it is not significantly correlated. The higher value in these minimum
relations was with participant learning style i.e.0.070. It implies ‘B’ grade achievers have
slight preference for participant learning style. If it be linked with the values of previous
table 4-7; it was found that A grade achievers showed no relation with participant
learning style; but B grade achievers showed positive relation with participant learning
style.

186
Table 4-9 Relationship between “C” grade achievers and their learning styles Groups Pearson Correlation(r) p value Significance Independent style -.041 .282 n.s
Dependent style -.040 .295 n.s
Collaborative style -.023 .550 n.s
Competitive style not defined
Participant style -.033 .380 n.s
Avoidant style .049 .194 n.s
Number of respondents = 694
Table 4-9 point out that no significant relationship exists between C grade
achievers and learning styles. From the define relations one was positive and others were
negative. The value of “r” for avoidant learning style was 0.049 its “p” value is 0.194.
This relationship was not significant but its value is meaningful among the other values.
Similarly at the other extreme the value of “r” which may be considered as meaningful
was of independent learning style. The value of “r” for this style was -0.041 and its “p”
value were 0.282. This may be interpreted in this way that “C” grade achievers do not
prefer independent learning style actually they don’t prefer any style but they have some
preference for avoidant learning style.

187
Table 4-10 Relationship between “D” grade achievers and their learning styles Groups Pearson Correlation(r) p value Significance Independent style -.027 .682 n.s
Dependent style -.053 .415 n.s
Collaborative style -.042 .523 n.s
Competitive style not defined
Participant style -.005 .940 n.s
Avoidant style -.002 .974 n.s
Number of respondents = 238
Table 4-10 shows that the relationship between D grade achievers and their
learning styles was negative and it was not significant. The extreme values were of
Avoidant and dependent learning style. The value of “r” for dependent learning style was
-0.053 whereas it was -0.002 for avoidant learning style. The existing relationship was
not significant but it may give some indication by extreme values that “D” grade
achievers do not prefer dependent learning style; along with it they also do not preferred
collaborative style.

188
Table 4-11 Relationship between “E” grade achievers and their learning styles
Groups Pearson Correlation(r) p value Significance Independent style -.367 .633 n.s
Dependent style -.494 .506 n.s
Collaborative style not defined
Competitive style not defined
Participant style -.494 .506 n.s
Avoidant style -.494 .506 n.s
Number of respondents = 4
Table 4-11 reveals that the relationship of “E” grade achievers with learning
styles collaborative and competitive was not defined. The relationship of E grade
achievers with other styles was negative. No relationship was significant. The value of
“r” for “E” grade achievement and three learning styles i.e. dependant, participant and
avoidant learning style was same and it was -0.494 which is almost equal to -0.5. It is a
meaningful negative relation showing “E” grade achievers (low achievers) may not have
dependent, participant and avoidant learning style. The variation in the correlation for
“E” grade achievement and learning style was only for independent learning style. It is
interpreted on the basis of the values of the table that no relationship was significant but
“E” grade achievers may not prefer dependent, participant and avoidant learning style.

189
The overall relationship between learning styles and students achievement is presented in the following table. Table 4-12 Relationship among different Learning styles and Pearson value of
students’ achievements by grades Learning styles A+ A B C D E Independent style .022 -.089 .048 -.041 -.027 -.367 Dependent style -.086 -.155* .007 -.040 -.053 -.494 Collaborative style
-.388* -.082 .066 -.023 -.042 Not
Defined Competitive style Not
Defined Not
Defined Not Defined
Not Defined
Not Defined
Not Defined
Participant style -.166 -.014 .070 -.033 -.005 -.494 Avoidant style -.046 -.036 .036 .049 -.002 -.494
* Significant at α=.05 Total number of respondents = 1580
Table 4-12 depicts that only two relationships were negatively significant. Those
were between the A+ and A grade achievers and collaborative and dependent learning
styles respectively. The other students having B, C, D and E grades have no significant
relationship with any learning style. Further the results of the table showed that the
highest value of r = -.494 was of “E” grade achievers and dependant, participant and
avoidant learning styles. “E” grade achievers have no preference for dependent,
participant and avoidant learning style. A+ and A grade achievers were studying
independently without co-operating with others. These results indicate the preference of
high achievers and low achievers. A+ grade achievers and E grade achievers both were
not dependent. The reason of both may be different. One group (A+ grade achievers) was
more concerned about their studies but other seems having less concern for studies. Both
prefer the same style. Both are studying in same class. This shows classroom
environment did not effect both groups’ achievements or both groups have no interest for
classroom activities. Both want to study out of classroom environment.

190
The selected districts may be categorized as developed and under-developed
districts on the bases of indicators presented in Chapter-2 section 2.27. The overall
relationship between the learning styles and students’ achievements of developed and
under developed district is presented in following tables 4-13 and 4-14.
Table 4-13 Relationship among different Learning styles and Pearson value of students’ achievements by grades of respondents of developed districts.
Learning styles A+ A B C D E
Independent style .092 -.049 .001 -.048 -.074
Not Defined
Dependent style -.419 -.210 -.114 -.112 -.079
Not Defined
Collaborative style
-.606* -.258* .011 -.034 -.031 Not
Defined Competitive style Not
Defined Not
Defined Not
Defined Not
Defined Not
Defined Not
Defined Participant style
-.606* -.224 .005 -.049 -.131 Not
Defined Avoidant style
-.098 -.101 .075 .030 -.061 Not
Defined * Significant at α=.05 Number or respondents = 636
The values of the table 4-13 showed that no respondent from the developed
districts got E grade so no analysis for this grade can be made. The negative significant
relationship exists among collaborative learning style and A+ and A grade achievement
(i.e. between high achievers). The value of “r” shows the relation is more meaningful for
A+ grade achievement and collaborative learning style rather than A grade achievement.
Further the A+ achievers showed significant negative relationship with the participant
learning style. This showed that A+ grade achievers did not prefer collaborative and
participant learning styles. The relationship between A+ grade achievement and
dependant learning style was also negative and is meaningful. Another negative
relationship exists between A grade achievement and dependant and participant learning
style the value of r is -.210 and -.224 respectively. All other relations lies near zero and
showed no relationship exists among the variables.

191
Table 4-14 Relationship among different Learning styles and Pearson value of students’ achievements by grades of respondents of under-developed districts
Learning styles A+ A B C D E
Independent style .308 -.087 .074 -.045 .035 -.367 Dependent style -.267 -.121 .071 .007 -.027 -.494
Collaborative style Not
defined .096 .088 -.017 -.068
Not Defined
Competitive style Not
Defined Not
Defined Not
Defined Not
Defined Not
Defined Not
Defined Participant style .182 .081 .086 -.021 .129 -.494 Avoidant style -.059 -.046 .006 .072 .025 -.494
Total number of respondents = 944
The values of the table 4-14 shows no significant relationship exists among
achievement and learning styles of the respondents of under-developed districts. The
value of “r” shows although not significant but some relationships exist among the
achievement of students and their learning styles. The relationship between E grad
achievers and dependent, participant and avoidant learning styles has same values i.e. -
.494. This is the highest value of “r” in above table. This can be interpret in this way that
E grade achievers (low achievers) form the under developed districts do not prefer
dependent, participant and avoidant learning styles. On positive side the value of r = .308
and it is for A+ grade achievers and independent learning styles. This shows that
(although not significant) higher achievers have some preference for independent
learning style. All other relationships exist around 0 which may be interpreted as no
relationship exists among learning styles and achievement grades of the respondents of
under-developed districts.

192
Question: 2 Is there any significant relationship between socio-economic status (SES) of parents and academic achievement of their children studying at secondary schools.
Table 4-15 Relationship between A+ grade achievers and different SES groups Groups N Pearson Correlation(r) p value Significance Upper class 00 .00 0.00 no relationship Upper middle class 12 .036 .912 n.s Middle class 10 .323 .363 n.s Lower middle class 11 .172 .614 n.s Lower class 00 .00 0.00 no relationship Number of respondents = 33
Although 42 and 62 respondents belongs to upper class and lower class
respectively but table 4-15 indicates that no student from upper class and lower class got
A+ grade; so no relationship has been defined between these two SES groups and A+
grade achievement. The value of “r” for middle class and A+ grade achievement was
0.323; it was not significant but the relationship exists. Relationship was not significant
the reason may be the less number of students (10) in this class. But the middle class has
positive relation with A+ grade achievement. The other value of r = 0.172 was for lower
middle class it also showed positive relation. It was also not significant but relation exists.
Relationship with upper middle class of SES groups and A+ grade was also positive but
not significant.

193
The graphic representation of table 4-15 is as follows:
lower middle class middle class upper middle class
ses_scale
700
705
710
715
720M
ean
ach
v6
Graph-3: A+ grade achievement by the respondents in each SES group
Graph-3 showed the frequency of respondents who got A+ grade. According to
the information given in graph the students from upper middle class, middle class and
lower middle class got A+ grade. None of the students’ from the upper and lower classes
got A+ grade.

194
Table 4-16 Relationship between “A” grade achievers and different SES groups Groups N Pearson Correlation(r) p value Significance Upper class 09 .456 .218 n.s Upper middle class 29 -.044 .819 n.s Middle class 87 -.134 .217 n.s Lower middle class 39 .058 .724 n.s Lower class 03 -1.000* .003 s * Significant at α=.05 Number of respondents = 167
Table 4-16 shows relationship between different SES groups of parents and A
grade achievement. Table shows a perfect negative significant relationship between A
grade achievers and lower class. Table further showed positive relationship between
upper class and A grade achievement i.e. r = .456. Again two extreme groups showed
meaningful inverse relations. This may be interpreted in this way that there is a chance
for upper class to get A grade and there may not be a chance for lower class to get A
grade from sampled students if the study may revised.
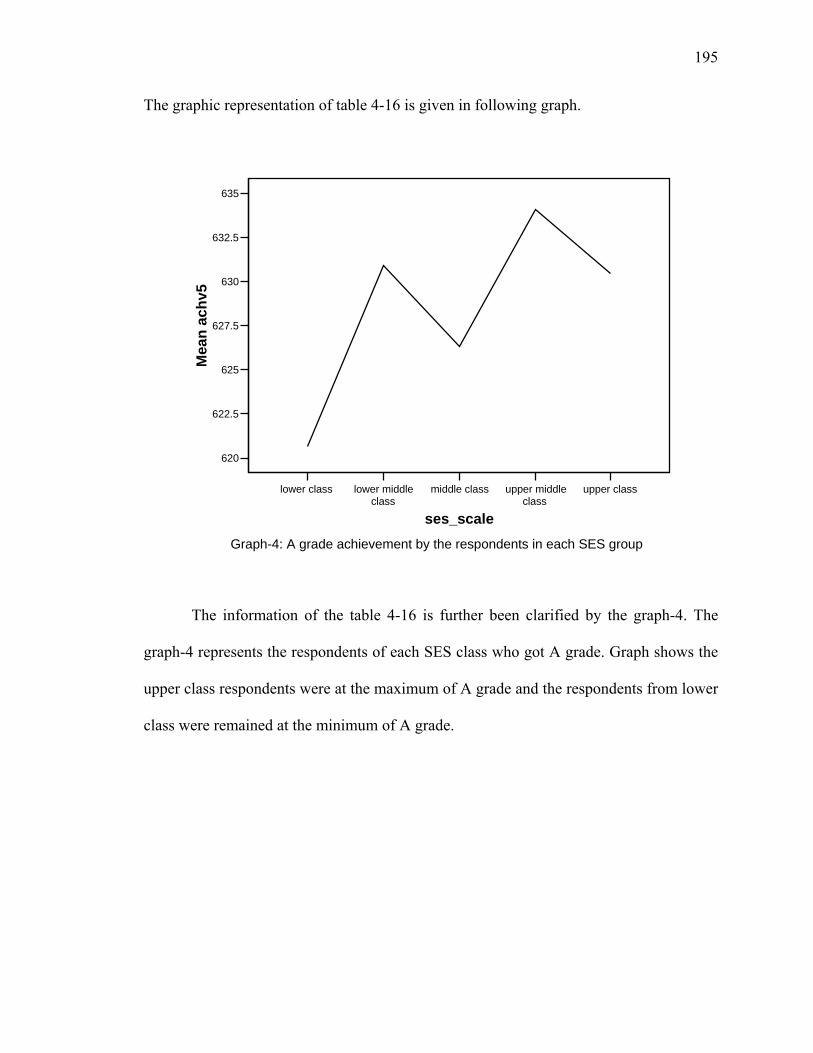
195
The graphic representation of table 4-16 is given in following graph.
lower class lower middle class
middle class upper middle class
upper class
ses_scale
620
622.5
625
627.5
630
632.5
635M
ean
ach
v5
Graph-4: A grade achievement by the respondents in each SES group
The information of the table 4-16 is further been clarified by the graph-4. The
graph-4 represents the respondents of each SES class who got A grade. Graph shows the
upper class respondents were at the maximum of A grade and the respondents from lower
class were remained at the minimum of A grade.

196
Table 4-17 Relationship between “B” grade achievers and different SES groups Groups N Pearson Correlation(r) p value Significance Upper class 013 -.134 .663 n.s Upper middle class 092 -.071 .499 n.s Middle class 164 -.012 .882 n.s Lower middle class 162 .093 .241 n.s Lower class 013 -.279 .357 n.s Number of respondents =444
Table 4-17 depicts the relationship between different SES groups and B grade
achievers. The value of “r” shows no significant relationship exists between different
SES groups and B grade achievers. The detailed investigation shows low negative
relations between lower and upper class and B grade achievement. Only one positive
relation exists between lower middle class and B grade achievement. The value of r
showed no relationship exists with other SES groups and B grade achievement.

197
The graphic representation of the table 4-17
lower class lower middle class
middle class upper middle class
upper class
ses_scale
542
544
546
548
550
552
Mea
n a
chv4
Graph-5: B grade achievement by the respondents in each SES group
The graph-5 indicates the number of respondents from each SES group who got B
grade along with their marks. Graph showed respondents from lower class and upper
class remained at the minimum of B grade whereas the respondents from upper middle
class were at the maximum of the B grade. So the performance of upper middle class was
better then all other SES groups.

198
Table 4-18 Relationship between “C” grade achievers and different SES groups Groups N Pearson Correlation(r) p value Significance Upper class 015 -.165 .557 n.s Upper middle class 098 .172 .090 n.s Middle class 292 .035 .554 n.s Lower middle class 265 .054 .383 n.s Lower class 024 -.265 .211 n.s Number of respondents = 694 Table 4-18 highlights that no significant relationship exists between “C” grade
achievers and different SES groups. Two relations between lower class and upper class
were negative. The value of r = -0.265 was the value which shows some relationship
among other relations. This value was of lower class and C grade achievement the other
negative relation was between upper class and C grade. Only one positive relationship
between upper middle class and C grade achievement exists. For this relation the value of
p = .090 with corresponding to the value of r = .172 was slightly better then others. This
relation will become significant if the value of p be less then 0.05.
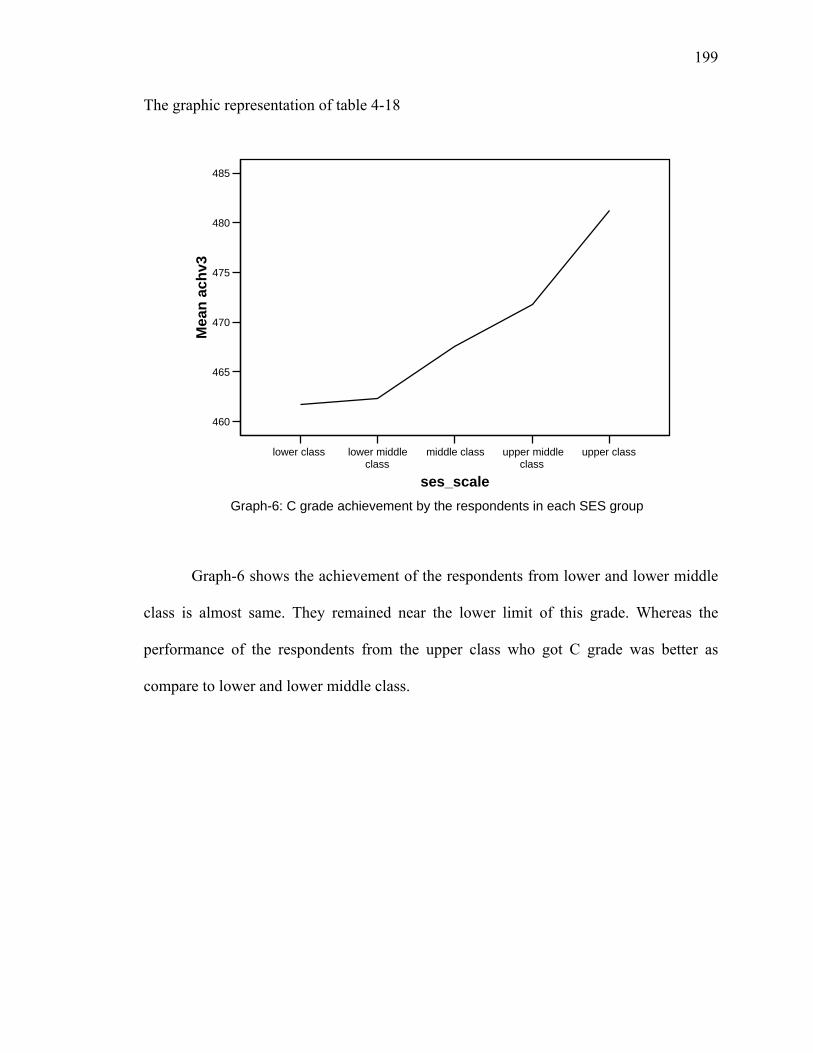
199
The graphic representation of table 4-18
lower class lower middle class
middle class upper middle class
upper class
ses_scale
460
465
470
475
480
485
Mea
n a
chv3
Graph-6: C grade achievement by the respondents in each SES group
Graph-6 shows the achievement of the respondents from lower and lower middle
class is almost same. They remained near the lower limit of this grade. Whereas the
performance of the respondents from the upper class who got C grade was better as
compare to lower and lower middle class.

200
Table 4-19 Relationship between “D” grade achievers and different SES groups Groups N Pearson Correlation(r) p value Significance Upper class 005 -.560 .326 n.s Upper middle class 029 .317 .094 n.s Middle class 088 .212* .047 s Lower middle class 095 -.021 .837 n.s Lower class 021 .168 .466 n.s * Significant at α=.05 Number of respondents =238 Table 4-19 shows that only middle class have significant relationship with D
grade. The other classes have no significant relationship with D grade achievement. The
relationship between middle class and D grade achievement, although it was significant
but the value of r = 0.317 for upper middle class which was higher then the existing value
of significant relation (r = 0.212). It implies that there was a strong positive relationship
between upper middle class and D grade achievement then the significant relation. The
value of r = -.0560 which shows the relation between upper class and D grade
achievement. This value is higher then all other relations even from significant relation.
This result can not be ignored which indicate the upper class students may not got D
grade.
This showed the students from middle class and upper middle class were average
students. The reason for this low achievement may be that their parents may not be able
to afford expenditure on extra coaching or tuition for their children.
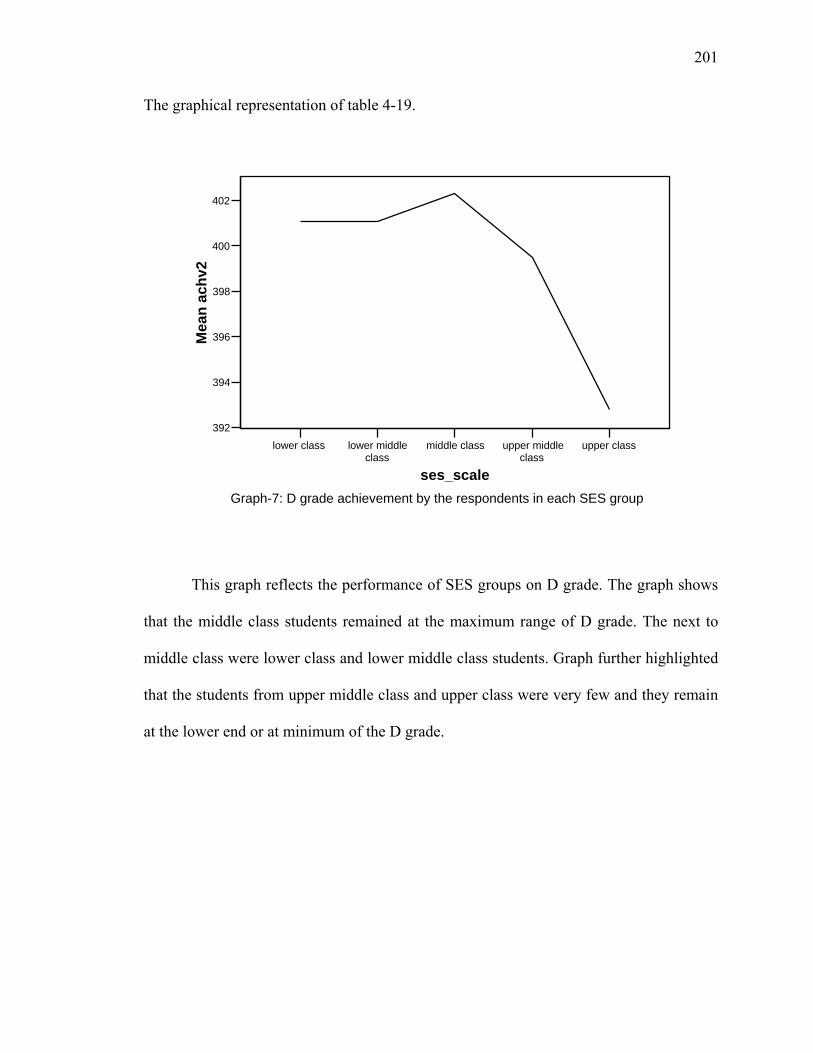
201
The graphical representation of table 4-19.
lower class lower middle class
middle class upper middle class
upper class
ses_scale
392
394
396
398
400
402M
ean
ach
v2
Graph-7: D grade achievement by the respondents in each SES group
This graph reflects the performance of SES groups on D grade. The graph shows
that the middle class students remained at the maximum range of D grade. The next to
middle class were lower class and lower middle class students. Graph further highlighted
that the students from upper middle class and upper class were very few and they remain
at the lower end or at minimum of the D grade.
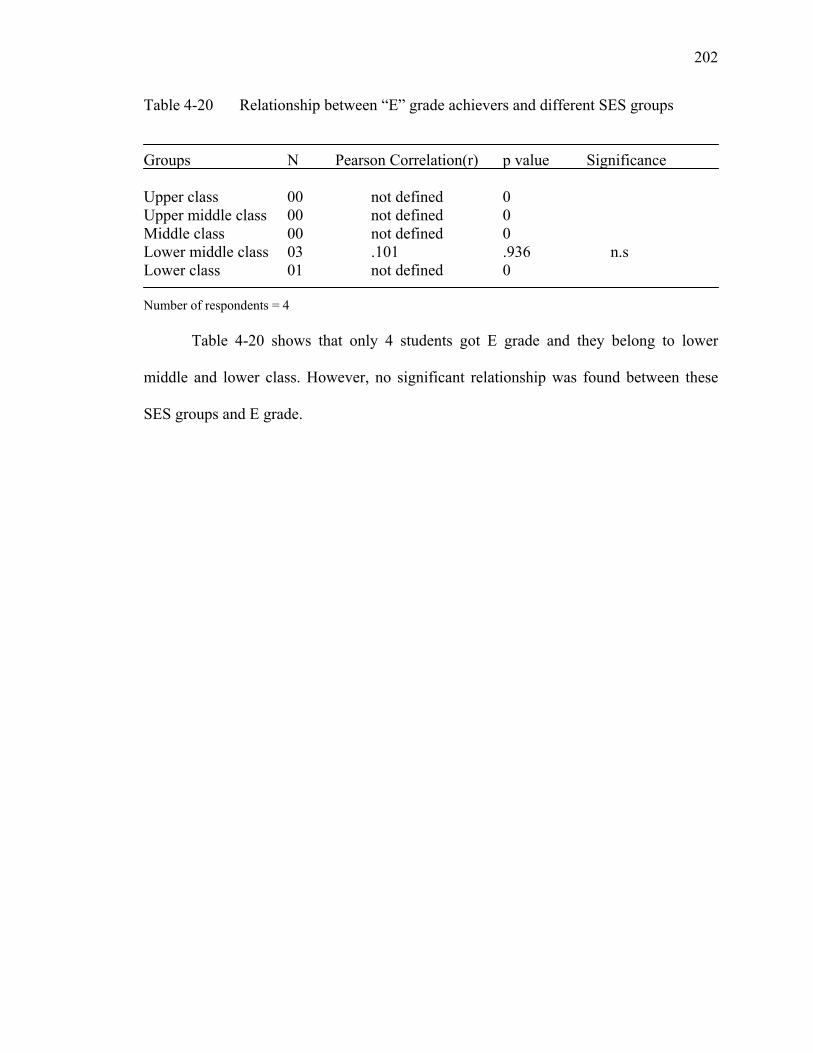
202
Table 4-20 Relationship between “E” grade achievers and different SES groups
Groups N Pearson Correlation(r) p value Significance Upper class 00 not defined 0 Upper middle class 00 not defined 0 Middle class 00 not defined 0 Lower middle class 03 .101 .936 n.s Lower class 01 not defined 0 Number of respondents = 4
Table 4-20 shows that only 4 students got E grade and they belong to lower
middle and lower class. However, no significant relationship was found between these
SES groups and E grade.

203
The graphical representation of table 4-20
lower class lower middle class
ses_scale
330.5
331
331.5
332
332.5
333
Mea
n a
chv1
Graph-8: E grade achievement by the respondents in each SES group
The graph-8 highlights that only respondents from lower and lower middle classes
got E grade. No respondent from any other class got E grade.

204
The overall relationship between different SES groups of parents and students achievement is presented in the following table. Table 4-21 Relationship among different SES groups and Pearson value of students’
achievements by grades SES groups A+ A B C D E
Upper class .00 .456 -.134 -.165 -.560 Not
Defined
Upper middle class .036 -.044 -.071 .172 .317 Not
Defined
Middle class .323 -.134 -.012 .035 .212* Not
Defined Lower middle class .172 .058 .093 .054 -.021 .101
Lower class .00 -1.00* -.279 -.265 .168 Not
Defined Significant at α=.05N number of respondents = 1580
Table 4-21 gives the over view of all the results from table 4-15 to 4-20. It
indicates the relationship among different SES groups and Pearson value of students’
grades. According to the table there exists a positive significant relationship between
middle class and “D” grade, similarly a perfect significant negative relationship exists
between lower class and “A” grade of students. Other then significant relation one
relation was better that was between upper class and A grade achievement. For this class
a negative as well as positive relationship exists. The value of r = .456 was between the
upper class and A grade at the same time the value of r = -.560 was for D grade; both the
values were inverse to each others but showed an understandable result. Similarly another
quotable relationship emerged after analysis between middle class and A+ and D grade
achievement the value of r was .323 and .212 respectively. This may be interpreted in this
way that middle class students has got D grade but there is a chance of some students
who may got A+ grade. Both the relations were positive. The result for D grade was
significant but the value of “r” showing the intensity of relation was higher for A grade
achievement.

205
Table 4-22 Relationship among different SES groups and Pearson value of students’ achievements by grades of the respondents of developed districts.
SES groups A+ A B C D E
Upper class .00 .540 -.245 .082 .00 Not
Defined
Upper middle class .0172 .206 -.126 .237 .261 Not
Defined
Middle class .574 -.072 .056 .034 .196 Not
Defined Lower middle class -.738 .456 .012 .033 -.006 .101
Lower class .00 .00 -.677 -.095 .267 Not
Defined Total number of respondents = 636
Table 4-22 indicates the relationship among different SES groups and
achievement grades of the respondents from developed districts. No respondents from
this group got E grade no analysis can be done. Table values further highlights that no
relationship is significant. The highest positive Pearson value of r in this table is of
middle class and A+ grade i.e. .574. This shows that the majority of the respondents from
middle class got A+ grade; whereas the highest negative value of “r” is -0.738 which is
inverse value showed the majority of the respondents from lower middle class may not
got A+ grade. The positive value of “r” indicates a relationship between A grade
achievement and Upper class and lower middle class. The value of these two
relationships is near to .5 which shows some relationship exists between these two groups.
When relationship is considered with respect to SES groups, it was found that
upper class achieve A grade and not B grade the upper middle class remain with B, C and
D grade, the middle class with A+ and D grade, the lower middle class got A but Not A+
grade, and lower class got D not B and C grade in developed districts.

206
Table 4-23 Relationship among different SES groups and Pearson value of students’ achievements by grades of the respondents of under-developed districts.
SES groups A+ A B C D E
Upper class .00 .535 .018 .323 -.405 Not
Defined
Upper middle class -.208 -.140 -.017 .132 .765* Not
Defined
Middle class -.455 -.168 -.041 .039 .225 Not
Defined Lower middle class .447 -.042 .150 .062 -.040 .101
Lower class .00 -1.00* .363 -.419 .219 Not
Defined
* Significant at α=.05 Total number of respondents = 944
Table 4-23 depicts the relationship between SES groups and the achievement
grades of the respondents of under-developed districts. Table highlight two significant
relationships one is positive and other is negative. The positive significant relationship is
between the respondents of upper middle class and D grade. The value of r = .765 which
shows a strong positive relationship. The other significant relationship is also very
important; it is perfect negative relation between the respondents of lower class and A
grade achievement. Both the relationships may be interpreted in this way that in the
sample the respondents from upper middle class got D grade and of lower middle class
may not have achieved A grade.

207
Question: 3 Is there any significant relationship between the different socio-economic
status groups of parents and learning styles of their children studying at secondary school
level?
Table 4.-24 Relationship between “upper class” and learning styles Learning styles Pearson Correlation(r) p value Significance Independent style .015 .924 n.s
Dependent style .244 .120 n.s
Collaborative style -.320* .039 s
Competitive style not defined
Participant style .100 .529 n.s
Avoidant style .022 .889 n.s
* Significant at α=.05
Number of respondents = 42 Table 4-24 shows that the significant negative relationship exists between upper
class and collaborative style. The value of table further shows no significant relationship
exists with other styles. All other relationships were positive except the significant
relation. In these positive relations the relationship between dependent learning style and
upper class was one relation which can be discussed. When assessed between the ranges
of correlation i.e. -1 to 1 the only relationship of dependent learning style and upper class
has positive “r” value (0.244) which indicates some relationship exists. It can be interpret
that upper class students may not collaborate they may depend on others.

208
Table 4-25 Relationship between “upper middle class” and learning styles Learning styles Pearson Correlation(r) p value Significance Independent style -.025 .689 n.s
Dependent style -.082 .186 n.s
Collaborative style -.080 .199 n.s
Competitive style not defined
Participant style -.057 .360 n.s
Avoidant style .101 .103 n.s
Number of respondents = 260
Table 4-25 indicates no significant relationship exists between the upper middle
class and the learning styles. The relationship of different learning styles and upper
middle class fall around both the sides of zero, approximately in equal range, which
shows no relationship exists. At negative side the value of r = -0.082 and at positive side
it was .101, but the “p” value shows the relation above zero has some value then the
value at negative side. So the upper middle class may prefer avoidant learning style.

209
Table 4-26 Relationship between “middle class” and learning styles Learning styles Pearson Correlation(r) p value Significance Independent style .118* .003 s
Dependent style .055 .165 n.s
Collaborative style -.041 .302 n.s
Competitive style not defined
Participant style .020 .609 n.s
Avoidant style .072 .068 n.s * Significant at α=.05 Number of respondents = 641
Table 4-26 reflects the relationship between different learning styles and middle
class respondents. Table shows the significant positive relationship exists between
independent style and middle class. One relationship was negative and others were
positive, but no value of “r” is between the range which may be interpreted. It means no
relationship exist between middle class and other learning styles.

210
Table 4-27 Relationship between “lower middle class” and learning styles Learning styles Pearson Correlation(r) p value Significance Independent style .059 .157 n.s
Dependent style .009 .834 n.s
Collaborative style -.006 .895 n.s
Competitive style not defined
Participant style -.030 .468 n.s
Avoidant style .002 .957 n.s
Number of respondents = 575
Table 4-27 indicates no significant relationship exists between the lower middle
class and learning styles. All above relations exists around zero, some on positive side
and others on negative side. The main result table shows that no relationship exists
among different learning styles and lower middle class.
Table 4-28 Relationship between “lower class” and learning styles Learning styles Pearson Correlation(r) p value Significance Independent style -.082 .528 n.s
Dependent style .007 .955 n.s
Collaborative style not defined
Competitive style not defined
Participant style -.207 .106 n.s
Avoidant style -.120 .352 n.s Number of respondents = 62
Table 4-28 shows no significant relationship exists between lower class and
learning styles. One relation is positive i.e. of dependent learning style. The others
relationships were negative. No relationship exists among different learning styles and
lower class.

211
The overall relationship between different learning styles and SES groups of parents is presented in the following table. Table 4-29 Relationship among different Learning Styles and Pearson value of
different SES groups. Learning styles
Upper Class
Upper middle class
Middle class
Lower middle class
Lower class
Independent style .015 -.025 .118* .059 -.082 Dependent style .244 -.082 .055 .009 -.007 Collaborative style
-.320* -.080 -.041 -.006 Not Defined
Competitive style Not Defined
Not Defined
Not Defined
Not Defined
Not Defined
Participant style .100 -.057 .020 -.030 -.207 Avoidant style .022 -.101 .072 .002 -.120
* Significant at α=.05
The information of table 4-29 indicates that the positive significant relationship
exists between the Independent style and middle class. This means the students from
middle class possess Independent learning style. Table further shows that negative
significant relationship exists between upper class and collaborative learning style. No
relationship exists between other learning styles and SES groups. Findings of this table
support the findings of table 4-6 and 4-12 that A grade achievers were not collaborative.

212
Table 4-30 Relationship among different Learning Styles and Pearson value of different SES groups of respondents of developed districts
Learning styles Upper Class
Upper middle class
Middle class
Lower middle class
Lower class
Independent style .039 -.149 .131* .176* -.086 Dependent style .164 -.101 .051 -.033 .236 Collaborative style
Not Defined -.051 -.072 -.070 Not Defined
Competitive style Not Defined
Not Defined
Not Defined
Not Defined Not Defined
Participant style .035 -.115 .-.014 -.112 -.053 Avoidant style .260 -.202 .094 .150* .067
* Significant at α=.05
Table 4-30 showed the significant relationship between independent learning style
and middle, lower middle class students of developed districts. It means the students of
middle class and lower middle class preferred independent learning style. The other
significant relationship exists between avoidant learning style and lower middle class of
developed district. This shows lower class students prefer avoidant and independent
learning style. The other value of r = .260 was positive but not significant it was of
avoidant learning style and upper class this value is higher then the significant values.
This shows relative high preference of upper class students for avoidant learning style.
Similarly the value of r = .236 was on second number which was greater then the
significant values it is for the dependent learning style and lower class. This means the
upper class students prefer avoidant style and lower class students prefer dependent style.
No other relationship between other SES groups and learning styles was found significant.
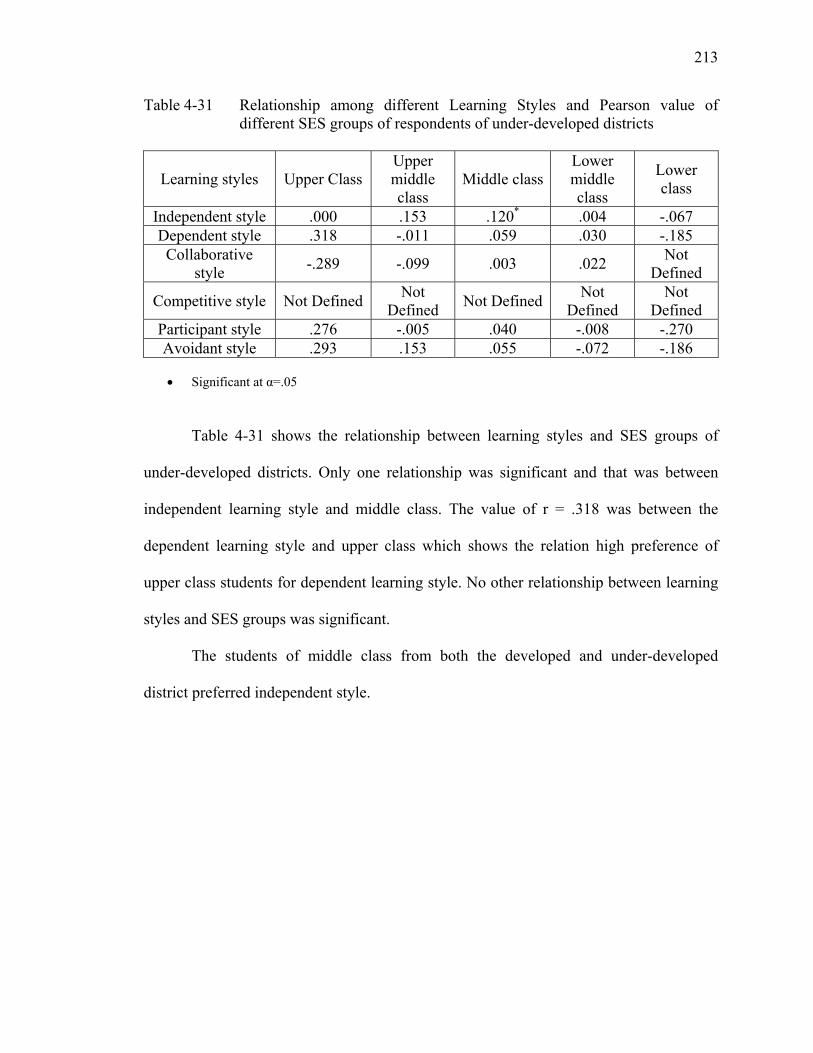
213
Table 4-31 Relationship among different Learning Styles and Pearson value of different SES groups of respondents of under-developed districts
Learning styles Upper Class Upper middle class
Middle classLower middle class
Lower class
Independent style .000 .153 .120* .004 -.067 Dependent style .318 -.011 .059 .030 -.185
Collaborative style
-.289 -.099 .003 .022 Not
Defined
Competitive style Not DefinedNot
Defined Not Defined
Not Defined
Not Defined
Participant style .276 -.005 .040 -.008 -.270 Avoidant style .293 .153 .055 -.072 -.186
Significant at α=.05
Table 4-31 shows the relationship between learning styles and SES groups of
under-developed districts. Only one relationship was significant and that was between
independent learning style and middle class. The value of r = .318 was between the
dependent learning style and upper class which shows the relation high preference of
upper class students for dependent learning style. No other relationship between learning
styles and SES groups was significant.
The students of middle class from both the developed and under-developed
district preferred independent style.

214
SECTION 3
This Section deals with the opinion about learning styles by gender and locality of
students studying at Secondary Schools with in the target area.
Question: 4 Is there any significant difference in learning styles of students by gender? Table 4-32 Opinion about Independent learning style by gender Gender N Mean t df p-value Significance Male 964 2.71
1.802 1578 .072 n.s Female 616 2.75
Table 4-32 shows that the value of t-test at α=.050 is not significant for the independent
style of male and female respondents. This means there is no significant difference in
opinion between male and female respondents about independent learning style. The
mean of both the groups is almost same. It also supports the findings that there is no
significant difference between the opinion of male and female students for independent
learning style.

215
Table 4-33 Opinion about dependent learning style by gender Gender N Mean t df p-value Significance Male 964 2.79
6.142* 1578 .000 s Female 616 2.90 * Significant at α=.05
According to the table 4-33 the t-value (6.142) is significant at 0.05 level of alpha.
It can be concluded that there is significant difference in opinion between male and
female respondents regarding dependent learning style. The mean value of female
respondents is higher then the mean of male respondents so they showed high preference
for dependent learning style.
Table 4-34 Opinion about collaborative learning style by gender Gender N Mean t df p-value Significance Male 964 2.96
1.069 1578 .285 n.s Female 616 2.97
Table 4-34 reveals that the t value (1.069) is not significant at .05 level of
significance; it means there is no significant difference in opinion between male and
female students on collaborative style. It is further confirmed by the mean values of both
the groups (male and female) that both posses the same opinion.

216
Table 4-35 Opinion about competitive learning style by gender Gender N Mean t df p-value Significance Male 964 2.96
Not defined Female 616 2.97
Table 4-35 shows opinion of male and female students about competitive was not
defined. The mean value of both female and male students is almost the same. This result
support that there is no difference between male and female students regarding the
competitive learning style.
Table 4-36 Opinion about avoidant learning style by gender Gender N Mean t df p-value Significance Male 964 2.74
4.917* 1578 .000 s Female 616 2.84 * Significant at α=.05
Table 4-36 points out that the t value (4.917) is significant at .05 alpha level. This shows
there is a significant difference in opinion between male and female respondents. This is
further confirmed as the mean of female respondents (2.84) is higher then the mean of
male respondents (2.74). Female respondents have more preference for avoidant style.

217
Table 4-37 Opinion about participant learning style by gender Gender N Mean t df p-value Significance Male 964 2.81
4.475* 1578 .000 s Female 616 2.89 * Significant at α=.05
Table 4-37 indicates that the t value (4.475) is significant at .05 alpha level. The
mean value of female respondents is high (2.89) than the male respondents (2.81) and this
confirms that there is significant difference in opinion between male and female
respondents. Female respondents have participant learning style.
From the interpretation of tables from 4-32 to 4-37 it can be highlighted that female
respondents have dependent, avoidant and participant learning styles as compared to male
respondents.

218
Question 5: Is there any significant difference in learning styles of students by region?
Table 4-38 Opinion about Independent learning style by region Gender N Mean t df p-value Significance Rural 750 2.73
0.619 1578 .536 n.s Urban 830 2.72
Table 4-38 highlights that t value (0.619) at α= .05 is not significant which is
further confirmed by the mean value of male and female respondents which is equal. This
showed that there is no significant difference in opinion between rural and urban
respondents on independent style.
Table 4-39 Opinion about dependent learning style by region Gender N Mean t df p-value Significance Rural 750 2.83 0.043 1578 .966 n.s Urban 830 2.83
As table 4-39 showed the t value (0.043) is not significant. This is prove is further
strengthened by the mean value (2.83) of both the (rural and urban) respondents which is
same so it can be concluded that there is no significant difference in opinion between
rural and urban respondents on dependent learning style.
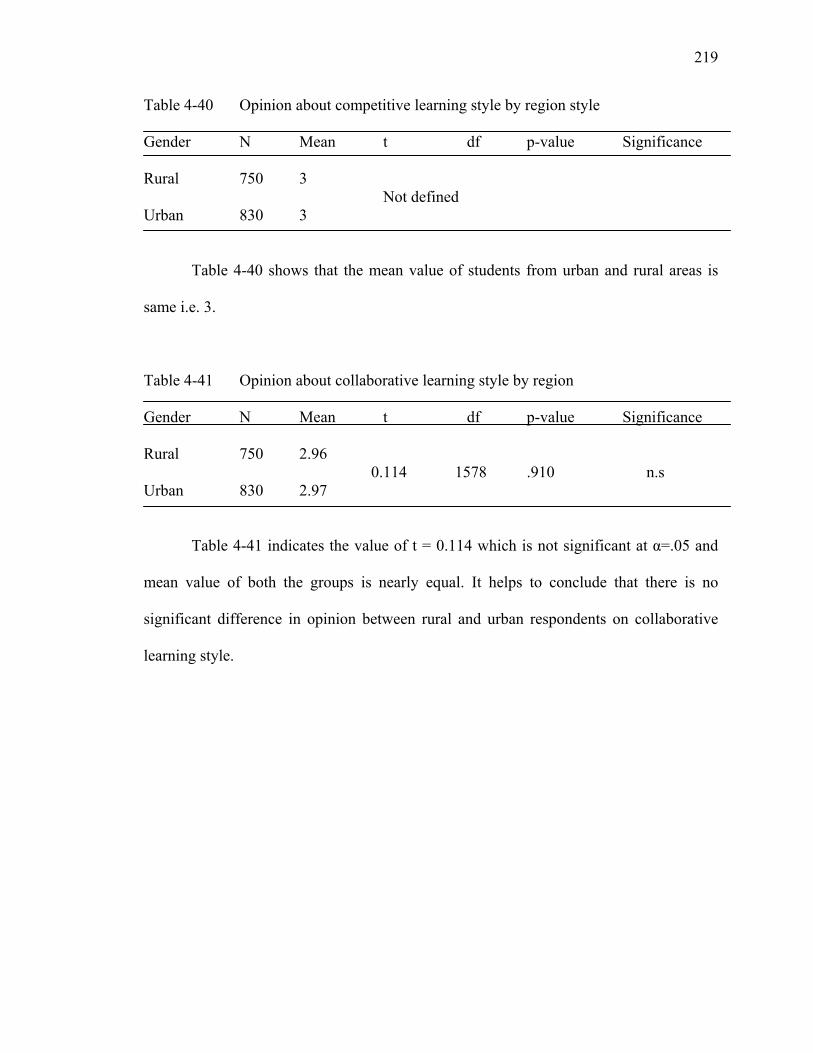
219
Table 4-40 Opinion about competitive learning style by region style Gender N Mean t df p-value Significance Rural 750 3
Not defined Urban 830 3
Table 4-40 shows that the mean value of students from urban and rural areas is
same i.e. 3.
Table 4-41 Opinion about collaborative learning style by region Gender N Mean t df p-value Significance Rural 750 2.96
0.114 1578 .910 n.s Urban 830 2.97
Table 4-41 indicates the value of t = 0.114 which is not significant at α=.05 and
mean value of both the groups is nearly equal. It helps to conclude that there is no
significant difference in opinion between rural and urban respondents on collaborative
learning style.

220
Table 4-42 Opinion about participant learning style by region Gender N Mean t df p-value Significance Rural 750 2.85
0.563 1578 .574 n.s Urban 830 2.83
Table 4-42 shows the t-value is not significant although the mean value of male
respondents (2.85) is higher than female (2.83) but this is very negligible. It means that
there is no significant difference between rural and urban respondents on participant style.
Table 4-43 Opinion about avoidant learning style by region Gender N Mean t df p-value Significance Rural 750 2.76
1.918 1578 .055 n.s Urban 830 2.80
Table 4-43 highlights that value of t = 1.918, which is not significant at α=.05, it
means that there is no significant difference of opinion between rural and urban
respondents on avoidant style.
The interpretation of tables from 4-38 to 4-43 help to concludes that there is no
significant difference of opinion between rural and urban respondents on different
learning styles. The further analysis was done to find-out the difference in opinion about
learning styles of rural and urban students by region.

221
Question 6: Is there any significant difference in opinion about learning styles of rural students by gender?
Table 4-44 Opinion of rural students about independent learning style by gender Gender N Mean t df p-value Significance Male 472 2.72
1.29 605 .195 ns Female 278 2.76
Table 4-44 indicates that the mean value of female students (2.76) is greater then
the male students (2.72) for independent learning style even then the value of
t = 1.29 is not significant at α = .05, it means that there is no significant difference in
opinion of rural students about independent learning style.
Table 4-45 Opinion of rural students about dependent learning style by gender Gender N Mean t df p-value Significance Male 472 2.78
5.29* 735 .000 s Female 278 2.92 * Significant at α=.05 Table 4-45 highlights that
Table 4-45 shows that the t = 5.29 is significant at α = .05. It means there is
significant difference in opinion of rural male and female students about dependent
learning style. Females’ are more inclined towards dependent learning style, because the
mean value of rural female students (2.92) is greater then the rural male students (2.78)
.

222
Table 4-46 Opinion of rural students about collaborative learning style by gender Gender N Mean t df p-value Significance Male 472 2.96
1.301 692 .194 ns Female 278 2.97
Table 4-46 reflects that the t = 1.301 is not significant at α = .05. It means that
there is no significant difference in opinion of rural male and female students about
collaborative learning style. It is further strengthened by the mean value of male and
female students which is almost same.
Table 4-47 Opinion of rural students about competitive learning style by gender Gender N Mean t df p-value Significance Male 472 3.00 Not defined Female 278 3.00 * Significant at α=.05
Table 4-47 shows there is no difference in mean so the t value is not defined.
Table 4-48 Opinion of rural students about avoidant learning style by gender Gender N Mean t df p-value Significance Male 472 2.73
2.06 631 .059 ns Female 278 2.80
Table 4-48 depicts the difference in mean value of rural male (2.73) and female
(2.80) students about avoidant learning style but the value of “t” is not significant at
α = .05. It helps to conclude that there is no significant difference in opinion of rural male
and female students about the said style.

223
Table 4-49 Opinion of rural students about participant learning style by gender Gender N Mean t df p-value Significance Male 472 2.81
3.85* 709 .000 s Female 278 2.91 * Significant at α=.05
Table 4-49 highlights the value of t = 3.85 which is significant at α=.05. It is
further obvious from the mean value of rural male (2.81) and female (2.91) students that
there is significant difference in pinion about participant learning style. The rural female
students are more inclined towards the participant learning style then the rural male
students.
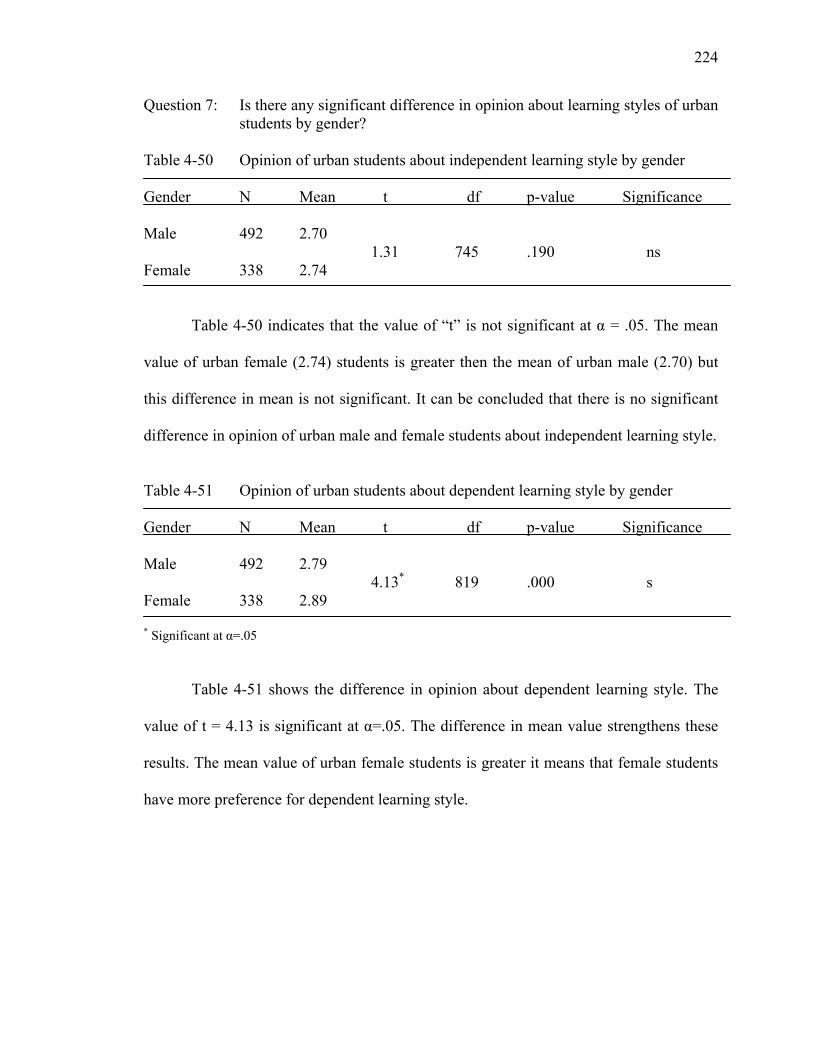
224
Question 7: Is there any significant difference in opinion about learning styles of urban students by gender?
Table 4-50 Opinion of urban students about independent learning style by gender Gender N Mean t df p-value Significance Male 492 2.70
1.31 745 .190 ns Female 338 2.74
Table 4-50 indicates that the value of “t” is not significant at α = .05. The mean
value of urban female (2.74) students is greater then the mean of urban male (2.70) but
this difference in mean is not significant. It can be concluded that there is no significant
difference in opinion of urban male and female students about independent learning style.
Table 4-51 Opinion of urban students about dependent learning style by gender Gender N Mean t df p-value Significance Male 492 2.79
4.13* 819 .000 s Female 338 2.89 * Significant at α=.05
Table 4-51 shows the difference in opinion about dependent learning style. The
value of t = 4.13 is significant at α=.05. The difference in mean value strengthens these
results. The mean value of urban female students is greater it means that female students
have more preference for dependent learning style.

225
Table 4-52 Opinion of urban students about collaborative learning style by gender Gender N Mean t df p-value Significance Male 492 2.96
0.314 828 .756 ns Female 338 2.97 Table 4-52 reflect the difference in opinion of urban male and female students
about collaborative learning style. The “t” value is not significant and the reason may be
the difference in mean of urban male and female students is negligible. So there is no
significant difference in opinion of urban male and female students about collaborative
learning style.
Table 4-53 Opinion of urban students about competitive learning style by gender Gender N Mean t df p-value Significance Male 492 3.00 Not defined Female 338 3.00
Table 4-53 highlights the results of the difference in opinion of urban male and
female students about competitive learning style. The mean is same so the “t” value is not
defined.

226
Table 4-54 Opinion of urban students about avoidant learning style by gender Gender N Mean t df p-value Significance Male 492 2.74
5.15* 822 .000 s Female 338 2.88 * Significant at α=.05
Table 4-54 depicts there is significant difference in opinion of urban male and
female students about avoidant learning style. The “t” value (5.15) is significant. The
mean of urban female (2.88) students is higher then the mean of urban male (2.74) so it
helps to conclude that the female students have more preference for avoidant learning
style then the male students.
Table 4-55 Opinion of urban students about participant learning style by gender Gender N Mean t df p-value Significance Male 492 2.80
2.92 801 .054 ns Female 338 2.88
Table 4-55 showed the value of t = 2.92 is not significant at α = .05. This helps to
conclude that there is no significant difference in opinion of urban male and female
students about participant learning style.
The results of the question six and seven shows that rural female students prefer
dependent and participant learning style whereas urban female students prefer dependent
and avoidant learning style. To clear this situation Cohen’s d effect size of learning style
was also calculated to investigate which learning style has strong effect. The detail is
given in following table 4-56.

227
Table 4-56 The effect size of the learning style of rural students measured by Chon’s D formula
Learning styles The value of D Description of effect Independent style .091 weak effect
Dependent style .402 moderate effect
Collaborative style .050 weak effect
Competitive style not defined
Participant style .288 modest effect
Avoidant style .160 weak effect
Table 4-56 indicates that the effect of three learning styles is weak effect. The
effect of participant learning style is modest and the effect of dependent learning style is
moderate, which shows the rural female students have strong effect of dependent learning
style then the participant learning style.
Table 4-57 The effect size of the learning style of urban students measured by Chon’s
D formula Learning styles The value of D Description of effect Independent style .089 weak effect
Dependent style .546 moderate effect
Collaborative style .054 weak effect
Competitive style not defined
Participant style .220 modest effect
Avoidant style .366 modest effect
Table 4-57 indicates some different results as table 5-56 showed. Here two
learning style i.e. independent, collaborative have weak effect, two showed modest effect
i.e. participant and avoidant learning style and one dependent learning style showed
moderate effect. The value of D for avoidant style and dependent style when compared it

228
can be concluded that the urban female students have more preference for dependent
learning style and less for avoidant learning style.
In this way the contradiction will be removed and it is interpreted that all rural
and urban female students prefer dependent learning style; further rural female students
prefer participant learning style whereas urban female students prefer avoidant learning
style.

229
CHAPTER 5
SUMMARY, FINDINGS, CONCLUSIONS, DISCUSSION
AND RECOMMENDATIONS
5.1 Summary
Education at secondary school level is a terminating stage of learning in Pakistan.
The completion of secondary education gives the diversified direction to students.
Students may develop their learning and working habits by completing the secondary
level of education. To lead them till this stage, the teacher’s continuous efforts play a
very important role. This is important for teachers to understand how the in-built features
of learners affect the way they process information to perform a task.
Several theoretical perspectives contribute to understand how learning happened
such as Behaviorist Theory, Gestalt Theory, and Personality Theory. Some theories have
direct influence on pedagogic strategies like Piaget’s Cognitive Development Theory,
Vygotsky’s Socio-Culture Theory, The Information Processing Approach, Social
Constructivist Theory, Meta-cognition and the Learning Style Theories.
The Learning Styles Models are based on Learning Styles Theories. The Social
Interaction Model is one of them, which was concerned about ‘the student’s learning in
social environment’. Grasha & Riechmann gives a model for students learning styles.
This research was designed to study the effects and relationship of different variables
with students’ achievement. The objective was to investigate the effects of Learning
Styles and Socio-economic Status (SES) on students’ learning achievement.
For this purpose the researcher adopted the questionnaire developed by Grasha &
Riechmann for learning styles. The parents were divided into five classes according to

230
their socio-economic status. The classes were named as upper class, upper middle class,
middle class, lower middle class and lower class. The students were also categorized in
the respective classes to whom their parent belongs. The learning achievement was
interpreted by scores of students’ obtained during their Secondary School Certificate
Examination conducted by respective Board of Intermediate and Secondary Education in
2007. Students enrolled at four districts Attock, Chakwal, Islamabad and Rawalpindi
were identified as population. Multistage stratified random sampling technique was used
to select sample. First schools were selected randomly then respondents were selected.
The sample of the study was all those students who were present on data collection day at
selected schools. The total number of students was 1580. Collected data was analyzed
through percentages, Pearson’s correlation and t-test and interpreted through graphs and
tables.
5.2 Findings
After organizing, tabulating, analyzing and interpreting the data, the following
findings were obtained. The findings were classified into six broad categories namely; the
findings based on the descriptive statistics, relationship between students learning styles
and their academic achievement, relationship between socio-economic status and their
achievement, the relationship between learning styles and socio-economic status groups,
and the difference in opinion about learning styles by gender and by region.

231
5.2.1 Findings based on the descriptive statistics
The data obtained from the students regarding their socio-economic status and
their achievement was analyzed by the percentage. The major findings were as follows:
i. On the basses of obtained scores from the Socio-economic Status (SES)
questionnaire the SES groups were formed. The distribution of respondents in
each group was 2.6% respondents were from upper class, 16.45% were from
upper middle class, 40.57% from middle class, 36.39% from lower middle
class and 3.90% were from lower class. (Table 4-1)
ii. 13 % respondents got A and above grade, 28% achieved B grade, and 44% had
C grade and 15% achieved lower than C grade. (Table 4-2)
iii. From developed districts 12% respondents got A and above grade, 26% got B,
44% got C grade and 18% achieved lower then C grade. (Table 4-4)
iv. From under-developed districts 13% respondents got A and above grade, 30%
got B grade 44% got C and 13% remained below C. (Table 4-5)
5.2.2 Findings based on the analysis of relationship between learning styles and achievement
This section presents the findings about the relationship of learning styles and
learning achievement. The main findings were:
i. The high achievers (A+ and A grade achievers) do not prefer collaborative and
dependent learning style. There is a significantly negative relationship
between collaborative and dependent learning styles and high achievers.
(Table 4-6 & Table 4-7)

232
ii. Some relations although not significant yet exist among A+, B, C, D and E
grade achievers and learning styles. (Table 4-12)
There is a positive relation between A+ grade achievers and
independent learning style. (Table 4-6)
There is a positive relation between B grade achievers and participant
learning style. (Table 4-8)
There is a positive relation between C grade achievement and avoidant
learning style. (Table 4-9)
There is a negative relation between D grade achievement and
dependent and collaborative learning style. (Table 4-10)
iii. There is a significant negative relationship between the respondents from
developed districts who got A+ grade and collaborative and participant
learning style. (Table 4-13)
iv. There is no significant relationship among learning styles and the achievement
grades of the respondents from under-developed district; however A+ grade
achievers prefer independent style and E grade achievers do not prefer
dependent, participant and avoidant styles. (Table 4-14)

233
5.2.3 Findings based on the analysis of relationship between Socio-economic Status (SES) and students’ achievement
On the basis of scores obtained through Socio-economic Status questionnaire the
whole sample was divided into five classes named as upper class, upper middle class,
middle class, lower middle class and lower class and students grades were classified as
A+, A, B, C, D, and E (Table 4-1 & 4-2). In this section findings were based on the
results of correlation between SES groups and academic achievement grades of the
students. The main findings were:
i. No student from upper class and lower class got A+ grade. This ultimately shows
no relationship exists between the achievement grades of the students from upper
class and lower class. (Table 4-15)
ii. A perfect significant negative relationship exists between A grade achievers and
lower class. (Table 4-16)
iii. A significant positive relationship exists between D grade achievers and middle
class. (Table 4-19)
iv. Finding about the relationship between SES groups and achievement grades
which were not significant.
There is a positive relationship between the A grade achievement and
the upper class students. (Table 4-16)
There is a positive relationship between lower middle class and B
grade achievement (r = .093) and a negative relationship between
lower class and B grade achievement. (Table 4-17)
234
The respondents of upper middle class showed positive relation and
respondents from lower middle class showed negative relationship
with C grade achievement. (Table 4-18)
Respondents from upper class showed negative relation and upper
middle class showed positive relationship with D grade achievement.
(Table 4-19)
E grade achievers belong to lower class. (Table 4-20)
v. There is no significant relationship between different SES groups and
achievement grades of the respondents from developed districts. (Table 4-22)
There is positive relationship between upper class and A grade
achievement.
There is positive relationship between middle class and A+ grade
achievement.
There is strong relationship between lower middle class and A+ grade
achievement.
There is no relationship between the upper and lower class with A+
grade achievement.
There is positive relationship between the upper middle class and
lower class with D grade achievement.
vi. There is significant positive relationship between upper middle class and D grade
achievement of the respondents from the under-developed districts. (Table 4-23)
vii. There is perfect negative significant relationship between lower class and A grade
achievement. (Table 4-23)

235
viii. There is positive relationship between upper class and A grade and lower middle
class and A+ grade achievement of the under-developed districts. (Table 4-23)
5.2.4 Findings about the relationship between Learning Styles and Socio-economic (SES) groups
The major findings regarding this section were as:
i. There is significant negative relationship between the collaborative learning style
and upper class. (Table 4-24)
ii. There is a significant positive relationship between independent learning style and
middle class. (Table 4-26)
iii. There is a positive relationship between dependent learning style and upper class
respondents. (Table 4-24)
iv. There is negative relationship between participant learning style and lower class.
(Table 4-29)
v. There is significant positive relationship between independent learning style and
respondents of middle class from developed districts.
vi. There is significant relationship between independent and avoidant learning style
and respondents of lower middle class from developed districts. (Table 4-30)
vii. There is positive relationship between avoidant learning style and respondents of
upper class from developed district. (Table 4-30)
viii. There is a significant positive relationship between independent learning style and
respondents of middle class from under-developed districts. (Table 4-31)
ix. There is positive relationship between dependent learning style and respondents
of upper class from under-developed districts. (Table 4-31)

236
5.2.5 Findings regarding the opinion about Learning Styles by gender
The main finding of this section was:
There is significant difference in opinion between male and female
students about dependent, avoidant and participant learning styles.
(Table 4-33, 4-36 and 4-37)
5.2.6 Findings about the learning style by Region
This section has three parts one is for the difference in opinion about learning
styles by region. Second is the difference in opinion of rural and urban students about the
learning style by gender. The third is the effect size of learning style.
i. The finding of first part was:
There is no significant difference in opinion between rural and urban
students regarding the learning styles of students. (Table 4-38 to 4-43)
ii. The findings of second part is further divided into two as follows
a. The findings regarding the rural students about learning styles by gender
There is significant difference in opinion of rural male and female
students about dependent and participant learning style. (Table 4-45 &
4-49)
b. The findings regarding the urban students about learning styles by gender
There is significant difference in opinion between urban male and
female students about dependent and avoidant learning style. (Table
4-51 &4-54)

237
iii. The Chon’s D test result showed the effect of dependent learning style is stronger
than the participant and avoidant learning style. (Table 5-56 & 5-57)
5.3 Conclusions
The conclusions drawn from the findings of the study are as follows:
i. The performance regarding the learning achievement of the respondents of under-
developed districts is better then the respondents of developed districts.
ii. The A+, A and D grade achievers do not prefer collaborative and dependent
learning styles.
iii. B grade achievers prefer participant learning style.
iv. C grade achievers prefer avoidant learning style.
v. The A+ grade achievers of developed districts do not prefer collaborative and
participant learning style.
vi. A+ and E grade achievers of under-developed districts do not prefer dependent,
participant and avoidant learning style.
vii. A+ grade achievers of developed and under-developed districts do not prefer
participant learning style.
viii. None of the students from upper and lower class got A+ grade in their final
examination. All E grade achievers belong to lower class.
ix. Lower class respondents are not A grade achievers.
x. Middle class respondents are D grade achievers.
xi. Upper class respondents are A grade but not D grade achievers.
xii. Upper middle class respondents are C and D grade achievers.

238
xiii. The socio-economic status of the respondents of developed districts affects the
achievement.
Upper class respondent show relationship with A grade.
Upper middle class respondents are D grade achievers.
Middle class respondents are A+ grade achievers.
Lower middle and lower class respondents are not A+ grade achievers.
xiv. The socio-economic status of the respondents of under-developed districts also
affects the achievement.
xv. Upper class respondents do no prefer collaborative learning style.
xvi. Middle class respondents prefer independent learning style.
xvii. Lower class respondents do not prefer participant learning style.
xviii. Lower middle class respondents from developed districts prefer independent and
avoidant learning style.
xix. The upper class respondents from developed district prefer avoidant learning style.
xx. The middle class respondents from under-developed districts prefer independent
learning style.
xxi. The upper class respondents of under-developed districts prefer dependent
learning style.
xxii. Female students prefer participant, dependent and avoidant style.
xxiii. There is no difference in learning styles of students from urban and rural areas.
xxiv. Urban and rural female students prefer dependent learning style.

239
5.4 Discussions
Achievement is the key component in the teaching and learning process. Many
research studies have been conducted to find-out and highlight the variables affecting
student’s achievement. The current study is aimed to investigate the effects of students
learning styles and socio-economic status on their learning achievement. The learning
style is an individual’s way of responding to learning situation and home environment
provides an opportunity and experience to handle that learning situation.
Most of the findings are logical and in accordance with the literature review but
some of them are different and few are debatable. The findings indicate that A+ and D
grade achievers do not prefer collaborative learning style and A grade achievers do not
prefer dependent learning style. B grade achievers show some preference for participant
style and C grade achievers for avoidant learning style. If A+ and A grade achievers are
considered as high achievers and B and C grade achievers as average ability students and
D and E grade achievers as low ability students then it can be stated that high achievers
and low achievers do not prefer collaborative and dependent learning style. The average
ability students (i.e. B and C grade achievers) have opposite preference some prefer
participant and some prefer avoidant learning style.
It is evident from the findings of relationship between learning style and learning
achievement of developed and under-developed districts. The high achievers of
developed districts do not prefer collaborative and participant learning style. Similarly the
high achievers of under-developed prefer independent learning style. The low achievers
of the under-developed districts also show preference for dependent, participant and
avoidant learning style. These results support the findings of the study conducted by

240
Verma and Sherma (1987) by using same instrument the major finding was that
“individual differences in learning styles affect the academic performance of the students.
The students prefer dependent and participant learning style are better in their studies
then the students who prefer independent and avoidant learning style. Dunn (1989) also
has conducted research on “grouping students for instructions: effect of learning style on
achievement and attitude” and reported positive effect of learning style on achievement
and attitude. These results are supported by some other studies conducted by Chi-Ching,
Yuen & Noi, Lee Seok. (1994) and this was against the study of Verma (1991). Verma
(1991) conducted this study to investigate the relationship between learning style and
achievement motivation. The sample was 95 respondents of intermediate college and all
was selected from urban area. Then he uses the responses of 28 high and 23 low
achievement motivated respondents and left the 44 average motivated students. He
analyzed the data by using chi square. The findings showed that there is no significant
relation between learning styles and achievement motivation. The reason for
contradictory result was the instrument he uses Aggarwal’s learning styles, small sample
size urban environment of institutions. It is so concluded that a teacher needs to consider
variations in learning styles of the students during planning, conducting and evaluating
teaching learning process.
The findings regarding the relationship between socio-economic status (SES) and
learning achievement has showed that upper class students are not A+ grade achievers
because no one from them got A+ grade. It means they are not concerned with the top
position. They are not low achievers as they showed negative relation with C and D grade.

241
The students from upper middle class are low achievers as they showed positive
relation with C and D grades and negative relation with A and B grades. The middle class
students are also low achievers as they have significant relation with D grade and
negative with A and B grades. The performance of lower middle class students is good.
They show positive relation with A+ and B grades and negative relation with D grade. No
one from lower class got A+ rather they showed perfect negative relation with A grade.
Lower class also has negative relation with B and C grades. Similarly the upper class
students of developed districts and under-developed districts are high achievers whereas
lower class students are low achievers. It can be concluded that SES affects the learning
achievement of the students. This is also reflected in the literature review chapter 2.
These findings verify the results of the study of Bond (1981); Kaeley (1990); Mirza
(2001); Barry (2005) and Ewijk and Sleegers (2010) but do not support the findings of
the study of Verma and Tiku (1990). Verma and Tiku (1990) conducted a research and
study the effect of SES and general intelligence and found that SES and intelligence in
combined form do not have any differential effect. The reason for this finding may be the
small sample size and urban institutional environment of Verma and Tiku’s research. He
selected the sample form Shimla city schools. There is no other study available which
opposes these findings.
The findings regarding socio-economic status and learning styles has showed that
upper class students are not collaborative, middle class students prefer independent and
lower class students do not prefer participant learning styles. The same has appeared in
the findings of developed districts; the middle class students of developed districts prefer
independent and lower middle class students prefer independent and avoidant learning
242
style. It means the middle and lower middle class students prefer independent learning
style. The upper class students of developed district prefer avoidant learning style. This is
linked with the findings that upper class students are not A+ grade achievers as no one
from this class in sample achieved A+ grade and they prefer avoidant learning style. The
middle class students from under-developed districts also prefer independent learning
style but the upper class students of these districts prefer dependent learning style. These
findings support the findings of the study of Kirk (1986), Singh (1987) and Verma and
Sheikh (1992). It is against the study of Verma and Tiku (1990) where he concluded that
the effect of SES was not found significant even at .05 level of confidence with any of the
learning styles presented by Grasha and Riechmann. The reason may be the sample size
and the institutional environment being urban in nature might have minimized the
differences in the learning styles of high school students belonging to high and low SES.
From the above discussion it is clear that the SES affects the learning styles of students.
The findings regarding the difference in opinion about learning styles by
gender showed that female students are more inclined towards the dependent, participant
and avoidant learning styles. Martin (2000) studied the social interaction learning style of
Irish adults. The findings showed that the older learners prefer participant learning style
whereas the younger learners prefer avoidant learning style. Although the Martin’s study
little bit supports the findings even then there is a need to investigate the female students
learning styles; because they prefer two opposite learning styles i.e. participant and
avoidant. To clarify the situation appeared in the above findings region-wise difference in
learning styles by gender has analyzed. It has been found that the rural female students
prefer dependent and participant learning styles whereas urban female students prefer

243
dependent and avoidant learning styles. The first part of the findings support to the
findings of the study conducted by Verma (1989), “the female students are more
dependent and participant than the male students”. This result was also supported by
Hopkin’s (1982) research. He uses the same tool of Grasha and Riechmann and found
that female students’ indicated their preference for participant, collaborative and
dependent learning styles while male student’s exhibit more preference for avoidant,
independent and competitive learning styles. The second part of the finding highlighted
that the urban female students prefer dependent and avoidant learning style. This is
supported by research conducted by Verma and Kumar (1996), in which the major
findings were that the urban female students had avoidant learning style as compared to
rural women. Further the effect size of learning styles has also been measured to
determine which learning style has strong or moderate effect. Chon’s D formula is used.
It has found for both rural and urban students the effect of dependent learning style was
moderate as compared to the participant and avoidant learning style the effect of these
styles is modest. Finally it was concluded that female students prefer dependent learning
style in-spite of region (rural and urban). However, some studies had used different tools
and showed difference in learning styles among rural and urban students (Pandian (1983),
Tappenden 1983; Clyne 1984; Bishop (1985), Cohen (1986), Sing (1987), Atchison 1988;
Nah 1989; and Verma 1992).
Generally the prevailing conditions of our institutions are not satisfactory. Most of
the institutions are facing lack of teaching staff, in sufficient physical facilities. The
teaching staff at institutions is not fully equipped to handle the situation. Majority
teachers have theoretical training. The majority of the sampled students belong to middle

244
class. The middle class students showed their preference for independent style. The
students preferring independent style like independent study. They like to follow self-
paced instructions. They feel comfortable with the assignments that gave them a chance
to think independently. They like those projects that can be designed by students. They
prefer-students centered rather than teacher-centered course activities. Along with these
characteristics they have a significant relationship with D grade achievement. This result
is also reflected in chapter IV graph-1. The normal curve showing academic achievement
is not bell shape it’s negatively skewed. It means the performance of the students is
below average. It indirectly showed that the classroom activities are not satisfying their
needs so they are low achievers. This showed that the classroom activities do not fulfill
their demand. They have no interest in classrooms activities; or the existing classroom
situation may over-burden them and not providing them the real learning environment
which affect their learning. They prefer to work alone and require little directions from
the teachers (Barry, Jennifer, 2005).
The high achievers and low achievers do not prefer the collaborative and
dependent learning styles. The students who prefer collaborative learning style like
lectures with small group discussions. They like small seminars. They like students-
designed aspects of courses. They prefer to work for group projects; similarly they did
not prefer dependent learning style. The students who prefer dependent learning style like
outlines or notes available on board. They want clear deadlines and instructions for
assignments. They live happily with teacher-centered classroom method. They prefer no
ambiguity in all aspects of course. Both styles have not been preferred by high and low

245
achievers. This indicates that high achievers and low achievers have no attention in class
room activities. Their locus of control is some where else.
There may be many reasons for these results; the classroom environment is not
favorable, text books are of poor quality, content is heavily loaded with theories, due to
over crowded classes teacher can not pay attention to every one, lack of physical facilities
may made school environment unattractive, in-service teacher training may not be
effective, pre-service teacher training do not fully equipped teachers to make classroom
environment attractive for students, students teachers relationship is weak and the
demand of the examination in annual system may not focus the classroom learning of
students etc (Hamidah, Jaafar Sidek, 2009).
There may be another factor which may be the reason for these results and that is
the style of measuring students academic achievement i.e. examination system. The
examination is one of the key component of education system which is responsible
measure academic achievement and it is linked with classroom activities rather it leads
classroom activities. If examination requires concept clarification, skill acquiring then the
students may prefer classroom learning but the results of the study showed that the
students do not prefer classroom activities as their focus is some where else. Although for
the session 2006-2007 the examining bodies changed the pattern of examination as
discussed in paragraph 2.17 of chapter 2. The main focus turned on the cognitive domains
of Bloom’s (1956) Taxonomy of Educational Objectives but the students results showed
that teacher’s teaching do not equip them for such pattern.

246
Some research studies findings showed that teachers teaching and delivery system
do not affects students learning styles. The findings of the Aragon, Johnson, and Shaik
(2004) study reflect that the students can learn equally well in either delivery format,
regardless of learning style, provided the course is developed around adult learning
theory and sound instructional design guidelines. It further supports the study of Uzun
and Sentruk (2008) that there were no department-related differences on students’
learning preferences.
In reference to the research questions of the study the first question was “is there
any significant relationship between the different learning styles and academic
achievement of the students at secondary school?” It is concluded that there is a
relationship between Learning styles and achievement.
The second question was “Is there any significant relationship between different
groups of socio-economic status of parents and academic achievement of their children
studying at secondary schools?” It can be addressed as there is a relationship between the
different socio-economic status groups of students and their academic achievement at
secondary school.
The third question was “Is there any significant relationship between the different
socio-economic status groups of parents and learning styles of their children studying at
secondary school level?” It can be answered in this way that SES affects the learning
styles of secondary school students.
The fourth question was “Is there any significant difference in learning styles of
students by gender?” The findings showed that the female students have different
learning styles then male students.
247
The findings regarding the six and seven question showed the rural and urban
female students prefer different learning style.
Results of the previous and the present studies refer that the classroom activities
may be designed in the way which is more practical and attractive and according to the
requirement of the students need so that they may stay in class and focus the classroom
activities for their life long, durable and real learning.
5.5 Recommendations
The following recommendations were made in the light of findings and conclusion of the
study:
1. The high and low achievers have no interest for classroom activities as they do not
prefer collaborative and dependent learning style. The average ability student’s
preferred independent learning style, means they like out of class learning. All the
groups have no interest with classroom activities. This is an alarming situation for
Pakistani Educationists. There is a need to bring the students back in to the
classroom. This may be possible only when the students feel that the classroom
activities are interesting and beneficial for their studies. This can be made by
making teaching and learning attractive for the student. It is therefore recommended
that the teaching may be made student-centered. The practical activities are
recommended rather then the theoretical explanation of concepts. This can be done
in two phases: one by motivating working teaching staff during refresher courses,
second by renovating the activities of prospective teachers at professional training
institutions.

248
2. For the working teachers practical activities may be designed on the pattern of
Children’s Global Network Pakistan (CGNP) working in all provinces of Pakistan.
The main focus of this is learner-centered teaching. It can be done in all provinces
at professional training institutions. The professional teacher training institutions
are fully equipped in all provinces of Pakistan. They may take this responsibility to
refresh the knowledge and methodology of the working teachers. Further the
administration: the principal of the school may make committees of different
subject teachers teaching to different classes at their schools. These committees
may meet once a week or once after two weeks to discuss the problems and
weaknesses of the students reflected during teaching and faced by teachers and
cover those problems at earlier stage of learning after discussion and
recommendations of the committee. This will help all teachers to identify, diagnose
and highlight the problems of the students appeared during their teaching and they
are unable to cope them. The committee will discuss it and give the acceptable
solution to all those problems. This will also refresh the knowledge and experience
of the working teachers and help to maintain their confidence and healthy
environment.
3. The prospective teachers may be trained for this situation during their professional
training courses. The research institutions and professional training institution can
tackle this situation in such a way by shifting the curriculum of prospective teachers
to activity based methodology from the theoretical perspective. It is easy to train
new teachers rather than changing the old one. If this situation will not be taken by
249
responsible persons the students will lose motivation and the country will face the
situation as in Sawat and tribal areas today.
4. The study was restricted to public sector institutions. A majority of the respondents
were from middle class. Research showed significant effect of SES on learning
style and learning achievement. Therefore, it is recommended that a campaign for
family literacy along with the vocational training programs with the help of
National Commission for Human Development, Basic and Non-formal Literacy
Programs and Family Literacy Education may be organized. It may be launched at
existing public sector institutions in evening for the motivation of parents to acquire
skill and maintain the socio-economic status. As this will provide opportunity to
their children for new experience and promote durable and real learning. The home
environment contributes a lot in the learning of students.
5. The classroom teaching can be made effective by linking it with internal assessment
system. For the sampled students of this research only external examination marks
were used which was made by FBISE Islamabad and BISE Rawalpindi. The
internal assessment provides a link between the teachers teaching and students
learning. This provides a binding force to students and teacher’s and binds them
together to improve the teaching learning situation. The findings of the research
showed teachers were teaching in an alien environment and students were focusing
the examination style no link exists between them every one going on their own
way. There was no activity to bridge their teaching and learning. Both were
working in different directions and this is not a healthy situation for the developing

250
country like Pakistan. It is therefore recommended that internal assessment may be
given weight-age along with the final evaluation.
6. It is further recommended that classroom–based assessment program may be
launched at schools. Classroom-based assessment is used to make decisions to
improve instructions for learning. It is designed to assist students learning. This
assessment is subjective, informal, immediate and ongoing and is based on
students’ performance in the situation where students actually demonstrate
proficiently. But the teachers’ practices regarding class assessment may be flawed
with poorly focused questions, predominance of questions that require short
answers, repetition than reflection and they may be influenced by the requirements
of external examination. For the improvement and development of teachers’
competencies regarding assessment techniques and its uses some activities are
suggested at cluster schools; after each terminal examination. In such activities
teachers can highlight the practices used by them for the assessment of students and
its advantages. They may also discuss which were difficult to use and how to
remove these difficulties.
7. Majority of middle class students are enrolled at public sector institution. The upper
class SES group enrolled their children at private institution for better facilities. For
further investigation of the effect of SES on learning styles and learning
achievement it is recommended that include private institutions and select equal
number of students to make SES class and then study the effect of learning styles
and specific SES group on achievement.

251
8. The female students preferred dependent learning styles so the teachers teaching
female students may keep in mind this variation in gender learning style preference.
9. It is recommended that the pattern of examination may be shifted from rote
memorization to skill acquirement. There may be some activities conducted in
schools affiliated with BISE and FBISE in which the boards reflect those
competencies which are required during the evaluation of students and its pattern
so that the teachers’ become aware of those styles and patterns.
10. The public and private partnership can be welcomed to design and construct
teaching learning material for students and teachers and its availability at learning
institutions so that institution may provide the learning experience to the students
belong to low SES group which their parents are unable to provide.
5.6 Replications (Suggestion for further researches)
The following suggestions were made for the replication of study:
i. The relationship of learning styles, socio-economic status and academic
achievement of the students studying at private institutions may be studied.
ii. The learning styles of students studying at private and public sector institutions
may be compared.
iii. Learning styles of students studying at co-education institutions may be studied.
iv. The evaluation of academic achievement of students may be made by their
teachers. This may help to clarify the preferred learning styles of students.
v. The socio-economic status classes can be made with equal respondents in each
class then their learning style be studied and learning achievement may be

252
compared. The variation in classes may affect the learning styles and learning
achievements.

253
BIBLIOGRAPHY Academic Dictionary of Social Science, Editor Ramesh Chopra (2002), Delhi: Isha Books
Delhi. Aggarwal, S. C. (1982). Learning Style Preference of Science Students in Relation to
Institution and Sex, Indian Journal of Psychology: Vol. 26, 199-204. Aggarwal, S. C. (1983). A Comparative Study of Learning Style of High and Low Creative
Students Belonging to Different Types of Institutions, Ph. D. (unpublished) Thesis, Madras University India.
Ahmad, Sameena., & Varghese, Asha. Rachael. (1991). Learning Styles of Indian Managers:
Some explorations, Journal of the Indian Academy of Applied Psychology: Vol. 17(1-2), 55-59.
Al-Othman, N. M. A. (2004). The Relationship between Gender and Learning Styles in
Internet-Based Teaching - A Study From Kuwait. Reading Matrix: Vol. 4(1), 153-170. Allinson, J., & Hayes, C. (1994). Cognitive Style and its Relevance for Management
Practice, British Journal of Management: Vol. 5, 53-71. Allport, G. W. (1985). The Historical Back Ground of Social Psychology. Hand Book of
Social Psychology: Vol. 1, 1-46. Amjad, R., Arif, G. M., &Mustafa, Usman., (208). Does the Labor Market Structure Explain
Difference in Poverty in Rural Punjab?. The Lahore Journal of Economics: Special Edition, 139-162.
Anderson, J. A., & Adams, M. (1992). Acknowledging the Learning Styles of Diverse
Student Populations: Implications for instructional design. In L. L. B. Border & N. V. Chism (eds.), Teaching for Diversity: San Francisco.
Andersen, M. L., & Taylor, H. F. (2003). The essentials Sociology. (2nd ed.). Belmont:
Thomson Learning Inc. Aragon, S. R., Johnson, S. D., & Shaik, N. (2001). Paper presented at the 8th International
literacy and Educational Research Network Conference on Learning. Dimoloko Skotop Spetses: Greece.
Aragon, S. R., Johnson, S. D., & Shaik, N. (2004). The Influence of Learning Style
Preferences on Student Success in Online versus Face-to-Face Environments. Retrieved on June 6th, 2009 from http//www.jstore.com.

254
Arends, J. D. (2007). Educational Psychology: Introduction to Learning Styles. USA: John Wiley & Sons Inc.
Ashkenazi, G. (2006). Learning Style, Personality Type and Academic Achievement in
Undergraduate Chemistry. Department of Science Teaching, The Hebrew University: Jerusalem Israel. Retrieved from net on April 23rd 2009 from www.google.com
Atchison, M. R. (1988). The Relationship between the Learning Styles and Reading
Achievement of Sixth Grade Students in the State of Alabama, Dissertation Abstracts International: Vol. 49(8), 2103-A.
Ausubel, D. P. (1965). A Cognitive Structure View of Word and Concept Meaning. Readings
in the psychology of cognition. New York: Holt, Rinehart & Winston. Avitabile, J. (1998). Interaction of Presentation Mode and Learning Styles in Computer
Science. ERIC Document Service No. 56, 419492. Bandura, A. (1977). Social learning theory, Englewood Cliffs, NJ: Prentice-Hall. Bandura, A. (1978). Social learning theory of aggression, Journal of Communications: Vol.
28,12-29. Bandura, A. (1963). Imitation of film-mediated aggressive models. Journal of Abnormal and
Social Psychology: Vol. 66, 3-11. Bentham. (2002). Educational Psychology. New Delhi: Mittal Publication. Barry, Jennifer. (2005). The Effect of Socio-economic Status on Academic achievement.
Department of Sociology, Wichita KS: Wichita State University. Retrieved from net on April 20th 2010 from www,google.com.pk
Beaty, S. A. (1986). The effect of in-service training on the ability of teachers to observe
learning styles of students. Dissertation Abstracts International: Vol. 47, 1986A. Bedisti, Eleni. (2004). The influence of social class on the language of school children in
Greece. Ph.D. Thesis, University of Reading. Biggs, J. B. (1976). Dimensions of Study Behavior another look at ATI. British Journal of
Educational Psychology: Vol. 46, 68-80. Biggs, J. B. (1987). Student Approaches to learning and Studying. Melbourne: A.C.E.P. Bishop, H. N. (1985). Student Learning Styles: Implications for Student and Institutional
Development, Dissertation Abstract International: Vol. 46(8), 2230-A.
255
Black, J. M. (2004). Assessing learning preferences. Plastic Surgical Nursing. ERIC Document Reproduction Service No. 24(2) 13569996
Blackmore, J. (1996). Pedagogy: Learning Styles. Retrieved 12 May, 2007 from http://www.granite.cyg.net/~jblackmo/diglib/styl-a.html Bloom, B.S. et al. (1956). Taxonomy of Educational Objectives; Handbook I, Cognitive
Domain. New York: D. McKay Publisher. Bond, G.C. (1981). Social Economic Status and Educational Achievement, American
Anthropological Association: Blackwell Publisher. Retrieved 20 October, 2008 from http://www.jstore.org.
Bonder, G. M. (1991). The conceptual knowledge of beginning chemistry graduate. Journal of Chemical Education: Vol. 68, 873-878.
Booth, P. L., & Mlandenovic, R. (1999). The Quality of Learning in Accounting Education: The Impact of Approaches to Learning on Academic Performance. Accounting Education, 8(4), 277-300. Retrieved 29 Jan, 2008 fromhttp://www.aaanz.org/web2002_papers/delang.pdf.
Brown, H. D. (2000). Styles and Strategies: Principles of Language Learning and Teaching.
New York: Longman. Bruner, J. S. (1960). The Process of Education. Cambridge, MA: Harvard University Press. Bruner, J. S. (1966). On the Conservation of Liquids. In Bruner, Oliver & Greenfield Studies
in Cognitive Growth. New York: Wiley. Carbo, M. (1984). Reading Style Inventory. Available from Learning Styles Network, St.
John's University, Grand Central and Utopia Parkway: Jamaica, NY 11439 Carbo, M., & Hodges, H. (1989). Learning style strategies can help students at risk. Teaching
Exceptional Children. Vol: 20(4), 55-58. Carbo, Marie. (1992). Giving Unequal Learns an Equal Chance: A Critique Remedial and
Special Education. Educational & Psychological Measurement: Vol. 13(1), 6-18. Carraher, Shawn M. (1993). Another Look at the Dimensionality of a Learning Style
Questionnaire. Educational & Psychological Measurement: Vol. 53(2), 411-415. Castaneda, A. (1978). Traditionalism, Modernism and Ethnicity. In Martinez, J. (ed.),
Chicano psychology. New York: Academic Press. Charles, C. M. (2002). Building Classroom Discipline. (7th ed.). Boston: Allyn & Bacon.
256
Chi-Ching, Yuen., & Noi, Lee Seok. (1994). Learning Styles and Their Implications for Cross-cultural Management in Singapore. The Journal of Social Psychology: Vol. 134(5), 593-600.
Chi-Ching, Yuen & Noi, Lee Seok. (1994). Applicability of the Learning Styles Inventory in
an Asian Context and its predictive value. Educational and Psychological Measurement: Vol. 54(2), 541-549.
Claxton, C. S. & Muller, P. H. (1987). Learning Styles: Implications for improving
Educational Practice. Washington DC: Association for the Study of Higher Education. Clyne, R. D. (1984). Learning Style Preference and Reading Achievement Urban Alaskan
Native Students. Dissertation Abstracts International: Vol. 45(9), 2801-A. Chohen, L. A. (1986). Birth order and learning Styles: An Examination of Other
Relationship between Birth order and Middle School Students Preferred Learning Style Profile. Dissertation Abstract International, 47(6), 2084-A.
Coleman, James. et.al. (1966). Equality of Educational Opportunity. Washington, DC: U. S.
Government Printing Office. Cooper, Stewart E. & Miller, John A. (1991). MBTI Learning Style-Teaching Style
Dis-congruencies. Journal of Educational & Psychological Measurement: Vol. 51(3), 699-706.
Cornwell, John M. et al. (1991). Factor Analysis of the 1985 Revision of Kolb’s Learning
Style Inventory. Journal of Educational & Psychological Measurement: Vol. 51(2), 455-462.
Cornwell, John M., & Manfredo, Pamela. A. (1994). Kolb’s Learning Style Theory. Journal
of Educational & Psychological Measurement: Vol. 54(2), 317-327. Curry, L. (1987). Integrating concepts of cognitive learning style: A review with attention to
psychometric standards. Ottawa, Ontario, Canada: Canadian College of Health Science Executives.
Dangwal, Ritu. (1998). Construction of Children’s Learning Styles Inventory. Journal of the
Indian Academy of Applied Psychology: Vol. 25(1-2), 91-98. Davis, M. A. (1985). An Investigation of the Relationship of Personality Types and Learning
Styles Preference of High School Students. Dissertation Abstracts International: Vol. 46(6), 1606-A.

257
DeBello, T.C. (1990). Comparison Of Eleven Major Learning Styles Models: Variables, Appropriate Populations, Validity of Instrumentation and the Research Behind them. Journal or Reading, Writing, and Learning Disabilities: Vol. 6: 203-222. retrieved on Jan 6th, 2009 from www.google.com
Dembo, M. H. (1977). Teaching for Learning: Applying classroom Educational Psychology
in the classroom, California: Goodyear Publishing Co. Dictionary of Education complied by Mamta Mehndiratta. (2005). New Delhi: K. S.
Paperbacks. Dictionary of Sociology. complied by Gordon Marshall. (2003). New York: D. McKay
Publisher Dodge, K. A., Pettit, G. S., & Bates, J. E. (1994). Socialization Mediators of the Relation
Between Socio-economic Status and Child Conduct Problems. Child Development: Vol. 65, 649-665.
Dunn, R. (1983). Learning Style and its Relation to Exceptionally at Both Ends of Spectrum.
Exceptional Children: Vol. 4(6). 496-506. Dunn, R. (1987). Research on Instructional Environments: Implications for Student
Achievement and Attitudes. Professional School Psychology: Vol. 21(1), 43-52. Dunn, R. (1989). Grouping students for instructions: effects of learning style on achievement
and attitude. The Journal of Social Psychology: Vol. 130(4), 485-494. Dunn, R. (1990). Rita Dunn Answer Questions on Learning Styles. Educational Leadership:
Vol. 48(2). Dunn, R. (2002). Can Students Identify Their Own Learning Styles? When it’s important to
them, they can. Educational Leadership: ERIC Document Reproduction Service No. 8518433
Dunn, R., Beaudry, J., & Klavas, A. (1989). Survey of research on learning styles.
Educational Leadership: Vol. 46(6), 50-58. Dunn, R., Bruno, J., Sklar, R., & Beaudry, J. (1982). The effects of matching and
mismatching minority developmental college students' hemispheric preferences on mathematics test scores. Journal of Educational Research: Vol. 56(23), 156-178.
Dunn, R., Cavanaugh, D., Eberle, B., & Zenhausern, R. (1982). Hemispheric Preference: The
Newest Element of Learning Style. The American Biology Teaching: Vol. 44(5), 291-294.

258
Dunn, R., DeBello, T. Brennan, P. Krimsky, J., & Murrain, P. (1981). Learning Style Researchers define Differences Differently. Educational Leadership: Vol. 8(23), 372-375.
Dunn, R., Deckinger, E. L., Withers, P. & Katzenstein, H. (1990). Should College Students
be Taught how to do Homework?. Illinois School, Research and Development Journal: Vol. 26(2), 96-113.
Dunn, R., & Dunn, K. (1978). Teaching Students Through Their Learning Style: A Practical
Approach. Reston, Virginia: Reston Publishing Co. Dunn, R., Dunn, K., & Price, G. E. (1977). Summary of Research on Learning Style Based
on the Learning Style Inventory. New York: N.Y. Dunn, R., Dunn, K., & Price, G. E. (1989). Learning Style Inventory. Lawrence, KS: Price
Systems. Dunn, R. et al. (1990), Grouping Students for Instruction: Effects of Learning Style on
Achievement and attitudes. Journal of Social Psychology: Vol. 130(4), 485-494. Encyclopedia Britannica. (2006). retrieved on 16th Nov, 2008 from
http://student.drilannica.com/conplans/article-208190/social class Encyclopedia of Education. (2nd ed). Edited by Guthrie, J.W. (2003). Macmillan Reference
USA: Macmillan. Encyclopedia Wikipedia. (2006). retrieved on 08th Nov, 2008 from http://www.google.com Entwistle, N. J. (1979). Motivation, Styles of Learning and the Academic Environment,
Edinburgh. The University of Edinburgh, ERIC Document Reproduction Service no. 190636.
Erikson, E. H. (1982). The life cycle completed. New York: Norton. Felder, R. M. & Geiger, Marshall A. et al. (1993). An Examination of Ipsative and
Normative versions of Kolb’s revised Learning Style Inventory. Educational & Psychological Measurement: Vol. 53(3), 717-726.
Felder, R. M. (2005). Understanding Students Differences. Journal of Engineering
Education: Vol. 94(1), 57-72. Retrieved on 04th October, 2008 from http://www.google.com.
Felder & Silverman. (1988). Learning Style Model. Retrieved on July, 8th 2008 from the web
site www.google.com.pk.

259
Felder, R. M. & Silverman. L. K. (1988). Learning and Teaching Style in Engineering Education. Engineering Education. Vol: 78(7). 675-681.
Felder, R. M. & Spurlin, J. (2005). Applications, Reliability and Validity of the Index of
Learning Styles. Journal of Engineering Education: Vol. 21(1), 103-112. Retrieved on 24th March, 2008 from http://www.google.com.
Feldman, R. S. (2004). Power Learning. United States: McGraw-Hill Higher Education.
http://www.mhhe.com/power2004.
Fontenot, R. J (2006). Blue, Pink and White: The importance of collars. Presentation retrieved on 8th June, 2007 from http://www.google.com.pk.
Foss, Nancy. (2009). A Brief Introduction to the Gregorc Model for Describing Cognitive Style Differences. Retrieved from web on June 3rd, 2009 from www.google.com
Gay, L. R. (1992). Educational Research competencies for analysis and application. (5th ed.) New York: Macmillan Publishing Company Inc.
Gibson, J. J. (1976). Psychology for the Classroom. Englewood cliffs, New Jersey: Prentice
Hall, Inc. Giddass, H. (2001). Sociology. (4th ed.). Cambridge: Polity. Gokhale, A. Anuradha. (1995). Collaborative learning Enhances critical Thinking, digital
library and archives. Retrieved 8 August, 2007 from www.google.com. Government of Iran, (2007). A Hand Book of Iran. Tehran: Iran Embassy. Government of Pakistan. (2000). Gazette book of Pakistan. Islamabad: Pakistan Printing
Press. Grasha, A. F. (2002). Teaching with Style: A practical guide to Enhancing learning by
understanding teaching and learning style. San Bernadino: Alliance Publisher. Grasha, A. & Riechmann, S. (1975). Students Learning Styles Scales Questionnaire. Faculty
Resource Centre: University of Cincinnati. Grasha, A. F., Kirschenbaum, D. S. (1980). Psychology of adjustment and Competence.
Cambridge, Massachusetts: Winthrop Publishers. Gregorc, A. F. (1982). Gregorc Style Delineator: Developmental, Technical and
administration Manual. Maynard, MA: Gabriel Systems Inc.
260
Gretes, John A., & Songer. (1989). Validation of the Learning Style Survey: An Interactive Videodisc Instrument. Educational & Psychological Measurement: Vol. 49(1), 235-241.
Gruber, Christian P., & Carriuolo, Nancy. (1991). Construction and Preliminary Validation
of a Learner Typology for the Canfield Learning Styles Inventory. Educational & Psychological Measurement: Vol. 51(4), 839-855.
Guthrie, Edwin R. (1935). The Psychology of Learning. New York: Harper & Row. Hamidah, Jaafar Sidek. & et al. (2009). The Social Interaction Learning Styles of Science
and Social Science Students. Asian Social Science: Vol. 5 (7), 58-64. Retrieved on Feb, 20th 2010 from the website of www.ccsenet.org/journals.html.
Handbook for Inspecting Colleges, Ofsted (2002) and LSC Quality Improvement Strategy.
2003-2006 Annex 1, retrieved 20th November, 2008, from www.google.com. Hayes, J., & Allinson, C. W. (1996). The Implications of Learning Styles for Training and
Development: A Discussion of the Matching Hypothesis. British Journal of Management: Vol. 6, 63-73.
Hill, J. S. (1976). Cognitive Style Interest Inventory. Oakland Community College, 2480
Opdyke Road: Bloomfield Hills, MI 48013. Holand, J. (1974). Learning Style Model. Retrieved on July 27th , 2008 from
http///www.answer.com Honey & Mumford. (1986). Learning Style Model. Retrieved on July 6th, 2008 from
http//www.google.com. Hopkins, F. A. (1982). Curricula and Instructional Implications Based on a Study of
Learning Styles of Traditional Students and Non-Traditional Adult Learners Enrolled in Full time Undergraduate Study. Dissertation Abstracts International: Vol. 43(2), 352-A.
Houston, L. (1997). Knowing Learning Styles can Improve Self-confidence of
Developmental Writers. Teaching English in the Two Year Colleg: Vol. 24, 212-215. Hunt, D. E., Butler, L. F., Noy, J. E., and Rosser, M. E. (1978). Assessing Conceptual Level
by the Paragraph Completion Method Education. Toronto, Canada: Ontario Institute for Studies.
Imtiaz, Ch. (2004). An Investigation of learning Style Preferences of University Students.
Islamabad: Unpublished M.Phil Thesis, Quaid-e-Azam University.

261
Intraprawat, Chanchai. et al. (2005). Factors Affecting the Learning Achievement of Suranree University of Technology Students. retrieved 6th June, 2008 from www.answer.com.
James, W. B. & Blank, W. E. (1993). Review and Critique of Available Learning Style
instruments for adults. New Directions for adult and Continuing Education. Vol: 59. 47-57.
Jordan, W. J., & Plank, S. B. (1998). Sources of Talent Loss Among High-achieving Poor
Students. ERIC Document Service No: 424342. Kaeley, G. S. (1988). Sex Difference in Learning of Post-Secondary Mathematics in a Neo-
Literate Society. Educational Studies in Mathematics: Springer: Vol. 19(4), 435-457. retrieved on 21 November, 2007 from http://www.jstore.org
Kaeley, G. S. (1990). The Influence of Socio-economic Status, Entry Style and Instructional
Variable on the Learning of Mathematics in a Neo-Literate Society. Educational Studies in Mathematics: Springer, Vol. 21(4), 319-350. Retrieved 22 November, 2007 from http://www.jstore.org
Kalsbeek, D. H. (1989). Linking Learning Style Theory with Retention Research.
Association for Institutional Research. Vol: 32. 1-7. Kang, S. (1999). Learning Styles: Implications for ESL/EFL Instruction Forum. ERIC
Document Reproduction Service No. 601615 Katz, (1988). Individual’s Learning Style Israeli Norms and Cross-cultural Equivalence of
Kolb’s Learning Style Inventory. Journal of Cross-Cultural Psychology: Vol. 19(3). 361-379.
Katz, Noomi. (1988). Individual Learning Style: Israeli Norms and Cross-cultural
Equivalence of Kolb’s Learning Style Inventory. Journal of Cross Cultural Psychology: Vol. 19(3), 361-379.
Kaurse, L. B. (2000). The Cognitive Profile Model of Learning Styles: Differences in student
Achievement in General Chemistry. Journal of College Science Teaching: Vol. 27(1) Retrieved on 13 September, 2007 from http://www.cognitiveprofile.com
Keefe, J.W. (1979). Students Learning Style. National Association of Secondary School
Principals, New Delhi: India. Keefe, J. W. (1982). Assessing Student Learning Styles. In Keefe, J. W. (ed.), Student
learning styles and brain behavior. Reston, VA: National Association of Secondary School Principals.

262
Keefe, J. W., & Monk, J. S. (1986). Learning style profile examiners' manual. Reston, VA: National Association of Secondary School Principals.
Keefe, J. M. (2001). Assessment of Learning Style Variables; The NASSP Task Force
Model. Theory into Practice. ERIC Document Reproduction Service No. 5199938, Kepner, M.D., & Neimark, E. D. (1984). Test-retest reliability and differential patterns of
score change on the Group Embedded Figures Test. Journal of Personality and Social Psychology: Vol. 7, 291-300.
Kerswill, Paul. (2006). Socio-economic Class, in Carmen Liamas and Peter Stockwell. (eds.),
The Routledge Companion to Sociolinguistics. London: Routledge. Ketchum, R. G. (1985). A Study of Student Learning Style at Maharishi International
University. Dissertation Abstracts International: 46(11), 3330-A. Khawaja, A. (2005). Constraints and Challenges Arising from Demographic Transitions
Imbalances: Pakistan at Crossroads. Network of Asia-Pacific Schools and Institutes of Public Administration and Governance (NAPSIPAG) Annual Conference 2005: Beijing
Kirby, P. (1979). Cognitive styles, Learning Style, and Transfer Skill Acquisition
(Iqformation Series No. 195, National Center for Research in Vocational Education). Columbus, OH: The Ohio State University.
Kleinfeld, Judith & Nelson, Patricia. (1991). Adapting Instruction to Native Americans’
Learning Styles: An Iconoclastic View. Journal of Cross Cultural Psychology: Vol. 22(2), 273-282.
Knapp, M. S., & Shields, P. M. (1990). Preconceiving Academic Institution for the Children
of Poverty. Kappan: Vol. 71(10), 753-758. Kolb D. A. (1976). Learning Style Inventory. Technical Manual. Boston: MC Ber. Kolb, D. A. (1981). Learning Styles and Disciplinary Differences. In A. W. Chickering and
Associates (eds.). The Modern American College, San Francisco: Jossey Ban. Kobasa, P. A. (1998). The World Book of Study Power 2 Testing. Chicago: World Book Inc. Kubiszyn, T. & Borich, G. (2003). Educational Testing and Measurement: classroom
application and practice. Singapore: John Wiley &Sons pt. ltd. La, Pointe, C. (1990). Cross-cultural Learning: The Relationships Between Cultures,
Learning Styles and Classroom Environments and Teaching Procedures. Dissertation Abstracts International: Vol. 51(1),69-A.

263
Lay Cock, V. K. (1978). Assessing Learning Characteristics. In Robert M. Anderson et al. (Eds). Individualizing Materials for Special Children in the Man Stream”, Baltimore University: Park Press.
Letteri, C. A. (1980). Cognitive profile: Basic Determinant of Academic Achievement.
Journal of Educational Research: Vol. 73, 195-199.
Linnen, (2003). Measurement and Assessment in Education. New Delhi: Pearson Education Inc.
Lynda Thomas , Mark Ratcliffe , John Woodbury & Emma Jarman. (2002). Learning Styles and Performance in the Introductory Programming Sequence. ACM SIGCSE Bulletin: Vol. 34.
Macionis, J. (1994). Sociology (4th ed.). Englewood Cliffs, NJ: Prentice Hall, Inc Macombe, Paul. C. (2001). A Labor Approach to the Development of the Self or Modern
Personality: A case of public education. USA: Dissertation.com. Marcia, Baxter-Magolda. (1992). Learning Style Model. Retrieved on March 23rd , 2008 from
http//www.answer.com. Marcus, L. (1977). How Teachers View Learning Styles. NASSP Bulletin: Vol. 6 (408), 112-
114. Miller, G. F. (2001). The Relationship Between College Student Learning Styles and
Assessment Methods in Elementary statistics. Columbia University Teachers College: USA.
Miller, P. H. (2002). Theories of Developmental Psychology. (4th ed.). New York: Worth. Mirza, M. Shafi. (2001). Relationship of Socio-economic Stats with Achievement. Journal of
Elementary Education: Vol. 1(4), 18-24. Murray-Harvey, Rosalind. (1994). Conceptual and Measurement Properties of the
Productivity Environmental Preference Survey as a Measure of Learning Style. Educational & Psychological Measurement: Vol. 54(4), 1002-1012.
Nah, Kwiook. P. (1989). The Relation of Korean Students Learning Style with Residence
Gender and Achievement. Dissertation Abstracts International: Vol. 5(12), 458-A. Nakhleh, M. B. (1992). Why Some Students don’t Learn Chemistry. Journal of Chemical
Education: Vol. 69, 191-196.

264
North-Hatt, Hodge., Siegel & Rossi. (1964). Jobs and Occupation: A Popular Evaluation. The American Journal of Sociology: Vol. 58, 297-315.
O’Brien, T. P. (1994). Cognitive Learning Styles and Academic Achievement in Secondary
Education. Journal of Research and Development in Education: Vol. 28, 11-21. O’Donnell, A. M., Reeve, J., & Smith, K. (2007). Educational Psychology: Reflection for
Action. USA: John Wiley & Sons Inc. Pakistan Economic Survey. (2005-2006). Economic Advisor’s Wing, Finance Division,
Government of Pakistan: Islamabad. Pakistan House Hold Integrated Survey. (2006). Federal Bureau of Statistics, Government of
Pakistan: Islamabad. Pakistan Social and Living Standards Measurement Survey Round 1 (2004-05). Statistics
Division, Bureau of Statistics, Government of Pakistan: Islamabad. Pandian, C. (1983). Learning Styles and Teaching Strategies in Higher Education.
Ph.D. Education. Madras University. Parson, R. D., Hinson, S. L., Sardo-Brown, D. (2001). Educational Psychology: A
Practitioner- Researcher Model of Teaching. Singapore: Thomson Learning Inc. Patton, M. Q. (1990). Qualitative Evaluation and Research Method. (2nd ed.). Thousand
Oaks, CA: Sage. Peacock, M. (2001). Match or mismatch? Learning Styles and Teaching Styles in EFL.
International Journal of Applied Linguistics, 11. ERIC Document Reproduction Service No. EJ628089.
Perrin, J. (1983). Learning Style Inventory: Primary version. Jamaica: NY: St.
Piaget, J. (1964). Development and Learning. Washington DC: National Science Foundation. Piaget, J. (1969). Science of Education and the Psychology of the child. New York: Viking. Print, M. (1993). Curriculum Development and Design. (5th ed.). Malaysia: Allen & Unwin Ramirez, M., & Casteneda, A. (1974). Cultural democracy: Bi-cognitive development and
education. New York: Academic Press. Rausch, A.S. (1996). Learning Styles and the Japanese University Second Language Student.
Japan: Language and Linguistics. ERIC Document Reproduction Service No. 408830

265
Rayner, S. & Ridding, R. (1997). Towards a Categorization of Cognitive Styles and Learning Styles. Educational Psychology: Vol. 17. 5-29.
Reddy, R. G. (2006). Open and Flexible Learning: Issues and Challenges. Memorial
Lectures. New Delhi: Viva Books Private Limited. Reed, S., & Sautter, C. S. (1990). Children of poverty: The Status of 12 Million Young
Americans. Phi Delta Kappan: 71(10), K1-K12. Reinert, H. (1976). One Picture is Worth a Thousand Words? Not Necessarily. The Modern
Language Journal: Vol. 60(4), 160-168. Restak, R. (1979). The Brain: The Last Frontier. New York: Doubleday.
Riaz, M. N. (2008). Test Construction. Islamabad: Higher Education Commission Islamabad,
Pakistan. Rice, P. F. (1993). The Adolescent: Development, Relationships, and Culture. Boston: Allyn
& Bacon. Riding, R. & Cheema, I. (1991). Cognitive Styles- an Overview and Integration. Educational
Psychology: Vol. II(3&4). Sabzwari, G. R. (2004). A Study on the Effects of Parental Socio-economic Status on the
Disciplined Behavior of their Adolescent Children Studying in Secondary Classes. Islamabad: Unpublished Ph.D. Thesis, Allama Iqbal Open University.
Saeed, M., Gondal, M., & Bushra. (2005). Assessing Achievement of Primary Grade and
Factors Affecting achievement in Pakistan. International Journal of Educational Management: Vol. 19(6), 486-499. Retried on 2 December, 2008 from http://www.emeraldinsight.com.
Sawrey, B. A. (1990). Concept Learning Versus Problem Solving. Journal of Chemical
Education: Vol. 67, 253-254. Schmec, R. R., Ribich, F. D., & Ramanaih, N. (1977). Development of a Self-Report
Inventory for Assessing Individual Difference in Learning Processes. Applied Psychological Measurement: Vol. 1(2), 413-431.
Sharma. (2005). Introduction to Educational Psychology. New Delhi: Raragun Publication. Sigel, I. E., & Coop, R. H. (1974). Cognitive Styles and Classroom Practice. In R. H. Coop
and K. White (ed.). Psychological Concepts in the classroom. New York: Haper & Row.

266
Sims. (1970). The Measurement of Socio-economic Status. Singapore: Thomson Learning Inc.
Sims, Ronald R. et al. (1989). An Exploratory Examination of the Convergence between the
Learning Styles Questionnaire and the Learning Style Inventory II. Educational & Psychological Measurement: Vol. 49(1), 227-233.
Sing, A. K. (1987). Learning Styles of Advantaged and Disadvantaged High School Students
in Relation to Their Academic Achievement. Unpublished Ph.D. Thesis. BHU. Skinner, B. F. (1938). The Behavior of Organisms: An experimental analysis. New York:
Appleton-Century-Crofts. Slavin, R. E. (1995). Cooperative Learning. 2nd ed. Boston: Allyn & Bacon. Smith, L.H., & Renzulli, J. S. (1984). Learning Styles Preferences: A Practical Approach for
Classroom Teachers. Theory into Practice: Vol. 23(1), 45-50.retrieved 22july, 2007 from www.jstore.org.com.
Snider, Vicki E. (1992). Learning Style and Learning to Read: A Critique. Remedial and
Special education: Vol. 13(1), 6-18. Socio-economic Classification (United Kingdom). (2004). Malcolm McDonald and Ian
Dunbar: The Market Segmentation Company. Retrieved on Feb 23, 2009 from http://www.marketsegmentation.co.uk.
Stewart, B. D. (1979). Learning Styles Among Gifted/Talented Students: Preferences for
Instructional Techniques. Dissertation Abstracts International: Vol. 40(8), 4503-A. Stewart, E. Cooper., & Miller. (1991). MBTI Learning Style-Teaching Style dis-
congruencies. Educational & Psychological Measurement: Vol. 51, 23-35. Stockwell, Peter. (2002). Sociolinguistics. A resource book for students. London: Routledge. Tappenden, V. J. (1983). Analysis of Learning Styles of Vocational Education and Non-
Vocational Education Students in Eleventh and Twelfth Grades from Rural-Urban and Suburban Location in Ohio. Dissertation Abstracts International: Vol. 44(5), 1326-A.
Teague, James E., & Michael, William B. (1994). References of Science Teachers for
Multiple-choice Achievement Test Items at Different Levels in Bloom’s Taxonomy in Relation to Their Cognitive Learning Styles. Educational & Psychological Measurement: Vol. 54(4), 941-948.
[*] Thomas, D. (2007). The Psychology of Social Class. London: Routledge.
[*]

267
[*] Thomas., Ratcliffe., Woodbury., & Jarman. (2004). Learning Styles and Performance in the Introductory Programming Sequence. Department of Computer Science, University of Wales: UK. Retrieved on May 30th , 2009 from http//www.google.com.
Tucker, D. F. (1983). A Study of Preferred Learning Styles of Selected Eight Grades
Students. Dissertation Abstract International: Vol. 44, 980-A. Uzun, A., & Şentürk, A. (2008). Assessing Learning Styles of Students at Uludag University
Faculty of Education. Retrieved on June 12, 2009 from http//www.google.com. Veres, John G. et al. (1991). Improving the Reliability of Kolb’s Revised Learning Style
Inventory. Educational & Psychological Measurement: Vol. 51(1), 143-150. Verma, B. P. (1988). Learning Style Preferences in Relation to Personality Types. The
Progress of Education: Vol. LXII(12), 236-265. Verma, B. P. (1989). Learning Styles Preferences of Senior Secondary Students in Relation
to Their anxiety. Asian Journal of Psychology and Education: Vol. 22(1&2), 24-28. Verma, B. P. (1991). Relationship between Learning Style and Achievement Motivation.
Psychology Lingua: Vol. 21(2), 73-78. Verma, B. P. (1991-92). Relationship between Rural-Urban Residential Background and
Learning Style Preferences. Journal of Education and Psychology: Vol. 49(3&4), 34-39. Verma, B. P. (1992). Creative Personality and Preferred Learning Styles, Journal of
Education Research and Extension, Vol. 39(1), 31-37. Verma, B. P. (1993). Differences in Learning Styles of Adolescent Girl Students Possessing
High and Low Self-Concept. Education Herald: Vol. 24(2), 14-22. Verma, B. P. (1993). Modes and Style of Learning of University Students as a Function of
Their Locus of Control. New Delhi: Mittal Publications. Verma, B. P. (1996). Modes and Styles of Learning as Functions of Personality and
Motivation. Psycho Lingua: Vol. 26(1), 37-42. Verma, B. P. (1996). Do Different types of Schools Make a Difference in Learning Style
Preference of Adolescents?. The Educational Review: Vol. 11(9), 11-17. Verma, B. P. (1997). Learning Processes of Prospective Teachers in Relation to Sex and
Academic Achievement. Journal of Psychological Researches: Vol. 41(1), 32-37. Verma, B. P. (1999). Student’s Perceptual Style Preference and Classroom Environment in
Vocational Schools. The Educational Review: Vol. 105(10), 170-173.

268
Verma, B. P., & Kumari, B. (1988-89). Learning Style Preferences of Senior Secondary
Students in Relation to Their Sex. Journal of Education and Psychology: Vol. 46(3&4), 85-89.
Verma, B. P., & Kumari, B. (1989-90). Student Learning Styles Across the Academic
Streams. Journal of Education and Psychology: Vol. 4(3&4), 126-132. Verma, B. P., & Kumar, R. (1996). Study Involvement and Learning Styles of woman
students as Related to Residential Background, Academic Stream and Type of Institution. Indian Educational Review: Vol. 31(2), 99-111.
Verma, B. P., & Sharma, S. P. (1987). Academic Achievement in Relation to Learning Styles of Adolescents. Journal of the Institute of Educational Research: Vol. 11(2), 35-40.
Verma, B. P., & Sheikh, G. Q. (1992). Learning Styles of Advantaged and Dis-advantaged
students. Indian journal of Psychology and Education: Vol. 23(2), 101-109. Verma, B. P., & Tiku, A. (1989). A Comparative Study of Learning Styles of Male and
Female High School Students. Educational Herald: Vol. 21(3&4), 1-7. Verma, B. P., & Tiku A. (1990). Learning Styles of High School Students: Effects of Socio-
Economic Status and General Intelligence. Indian Educational Review: Vol. 15(1), 31-40. Vincent, A., & Ross, D. (2001). Learning Style Awareness: A Basis for Developing
Teaching and Learning Strategies. Journal of Research on Technology in Education: Vol. 33(5).
Vygotsky, L. S. (1978). Mind in Society: The Development of Higher Psychological Processes. Cambridge, MA: Harvard University Press.
Warner, et al. (1963). Social Class in America. American Sociological Review: Vol. 28. 271-
278. Warner, W. L. (1969). Occupational Prestige in the United States. The American Journal of
Sociology: Vol. 70, 286-302. Weber, Max. (1947). The Theory of Social and Economic Organization. New York: Free
Press. Wilson, V. A. (1998). Learning How They Learn: a review of the Literature on Learning
Styles. ERIC Document Service No: ED 427017. Wiersma, W., & Jurs, S. G. (1990). Educational Measurement and Testing. (2nd ed.) USA:
Allyn & Bacon.
269
Yuen, Chi-Ching., & Lee, Seok Noi. (1994). Applicability of the Learning Style Inventory in an Asian Context and its Predictive Value. Educational & Psychological Measurement: Vol. 54(2), 541-549.
Zais, Robert S. (1976). Curriculum Principles and Foundation. New York: Harper & Row
Publisher Inc.
http://www.nwlink.com/~donclark/hrd/vak.html (2000) “Learning Styles” http://www:\Students Learning Styles - Google Search.htm (2004)
www.everythingesl.net/inservices/learningstyle.php - 10k - 27 May 2006 “Teach to students larning styles”
http://doi.acm.org/10.1145/377435.377467 “The effect of student attributes on success in programming” (2001)
Web Version of the Learning Styles Survey © Copyright 2000 by Suzanne Miller, Instructor [email protected]
G:\ERIC - Education Resources Information Center.htm Comparison of Eleven Major Learning Styles Models: Variables; Appropriate Populations; Validity of Instrumentation; and the Research Behind Them.
270
List of Schools included in Pilot Testing
1. Federal Government Girls High School Pind Malkan Sehala Islamabad
2. Federal government Boys high School Bhimbar Tarr Sehala Islamabad
3. Government Girls High School No. 2 Rawalpindi
4. Government Boys High School Sector III Khayban-e-Sersyed Rawalpindi.
Appendix-A

271
List of Schools of Districts Attock
S.No School Name
1. Government High School No 1 Fathe Jang 2. Government High School No 2 Fathe Jang 3. Government Higher Secondary School Hassanabadal 4. Government Pilot Secondary School Attock 5. Government High School Pindi Gheb 6. Government High School No 1 Hazro 7. Government High School No 2 Hazro 8. Government Islamia High School Attock 9. Government High School No 1 Jand 10. Government High School No 2 Pindi Gheb 11. Government Boys High School Hattar 12. Government High School Khore Company 13. Government High School Malhowali 14. Government High School Waesa 15. Government High School Haji Shah 16. Government High School Jhamat 17. Government High School Jabi Kasran 18. Government High School Buraj Fathe Jang 19. Government High School Rangu 20. Government High School Haroon 21. Government Girls High School Hasanabdal 22. Government Girls High School No 1 Fathe Jang 23. Government Girls High School Jand 24. Government Girls High School No 2 Jand 25. Government Girls Higher Secondary School Attock 26. Government Girls High School Shamsabad 27. Government Girls High School Pindi Gheb 28. Government Girls High School No 2 Hasanabdal 29. Government Girls High School Bahter 30. Government Girls High School Kot Chajji 31. Government Girls High School Hattar
Appendix-B

272
List of Schools of Districts Chakwal
S.No School Name 32. Government High School Choa Syden Shah 33. Government High School No 1 Chakwal 34. Government High School Tatral 35. Government Islamia School Chakwal 36. Government High School No 2 Chakwal 37. Government High School Katas 38. Government High School Mureed 39. Government Higher Secondary School Bhagwal 40. Government High School Noor Pur 41. Government High School Mangan 42. Government Boys High School Balkasar 43. Government High School Neela 44. Government High School No 2 Chakwal 45. Government High School Karsal 46. Government Higher Seondary School Bhagwal 47. Government Girls High School Jabair Pur 48. Government Girls High School No 1 Chakwal 49. Government Girls High School Dulmial 50. Government Girls High School No 2 Chakwal 51. Government Girls High School Balkasar 52. Government Girls High School Noor Pur 53. Government Girls High School Bhagwal 54. Government Girls High School Mureed 55. Government Girls Higher Secondary School Choa
Syden Shah 56. Government Girls High School Roupwal
Appendix-C

273
List of Schools of Districts Islamabad
S.No School Name 57. Federal Government Boys Model School G-6/4
Islamabad 58. Federal Government Model School for Boys Humak
Islamabad 59. Federal Government Boys Secondary School Charah
Nilor Islamabad 60. Federal Government Boys Secondary School Bara Kahu
Islamabad 61. Federal Government Girls Model School G-9/3
Islamabad 62. Federal Government Girls Model School Humak Sehala
Islamabad 63. Federal Government Girls High School Kot Hatial Bara
Kahu Islamabad 64. Federal Government Girls Secondary School Charah
Nilor Islamabad
Appendix-D
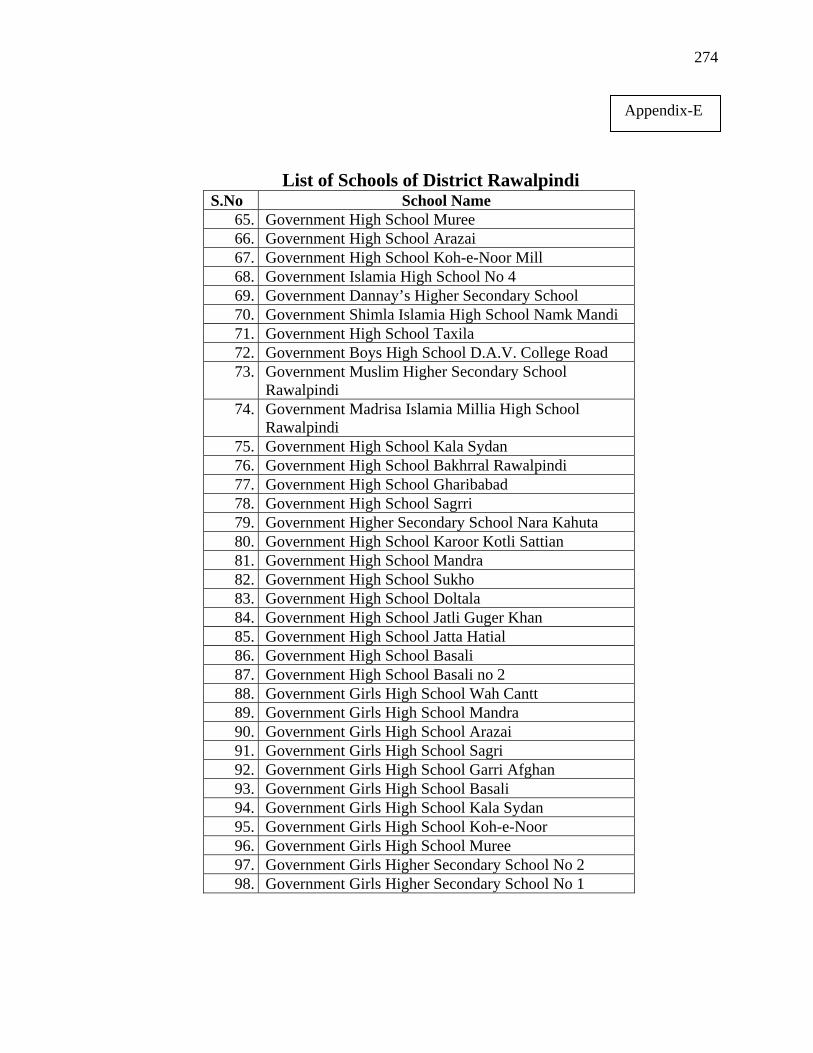
274
List of Schools of District Rawalpindi
S.No School Name 65. Government High School Muree 66. Government High School Arazai 67. Government High School Koh-e-Noor Mill 68. Government Islamia High School No 4 69. Government Dannay’s Higher Secondary School 70. Government Shimla Islamia High School Namk Mandi 71. Government High School Taxila 72. Government Boys High School D.A.V. College Road 73. Government Muslim Higher Secondary School
Rawalpindi 74. Government Madrisa Islamia Millia High School
Rawalpindi 75. Government High School Kala Sydan 76. Government High School Bakhrral Rawalpindi 77. Government High School Gharibabad 78. Government High School Sagrri 79. Government Higher Secondary School Nara Kahuta 80. Government High School Karoor Kotli Sattian 81. Government High School Mandra 82. Government High School Sukho 83. Government High School Doltala 84. Government High School Jatli Guger Khan 85. Government High School Jatta Hatial 86. Government High School Basali 87. Government High School Basali no 2 88. Government Girls High School Wah Cantt 89. Government Girls High School Mandra 90. Government Girls High School Arazai 91. Government Girls High School Sagri 92. Government Girls High School Garri Afghan 93. Government Girls High School Basali 94. Government Girls High School Kala Sydan 95. Government Girls High School Koh-e-Noor 96. Government Girls High School Muree 97. Government Girls Higher Secondary School No 2 98. Government Girls Higher Secondary School No 1
Appendix-E

275
Grasha-Reichmann Student Learning Style Scales
(Original Questionnaire)
The following questionnaire has been designed to help you clarify your attitudes and feelings toward learning in college. There is no right or wrong answers to each question. However, as you answer each question, form your answers with regard to your general attitudes and feelings toward all of your courses.
Respond to the items listed below by using the following scale.
Use a rating of 1 if you strongly disagree with the statement.
Use a rating of 2 if you moderately disagree with the statement.
Use a rating of 3 if you are undecided.
Use a rating of 4 if you moderately agree with the statement.
Use a rating of 5 if you strongly agree with the statement.
1. I prefer to work by myself on assignments in my courses.
2. I often daydream during class.
3. Working with other students on class activities is something I enjoy doing.
4. I like it whenever teachers clearly state what is required and expected.
5. To do well, it is necessary to compete with other students for the teacher’s attention.
Appendix-F

276
6. I do whatever is asked of me to learn the content in my classes.
7. My ideas about the content are often as good as those in the textbook.
8. Classroom activities are usually boring.
9. I enjoy discussing my ideas about the course content with other students.
10. I rely on my teachers to tell me what is important for me to learn.
11. It is necessary to compete with other students to get a good grade.
12. Class sessions typically are worth attending.
13. I study what is important to me and not always what the instructor says is important.
14. I very seldom am excited about material covered in a course.
15. I enjoy hearing what other students think about issues raised in class.
16. I only do what I am absolutely required to do in my courses.
17. In class, I must compete with other students to get my ideas across.
18. I get more out of going to class than staying at home.
19. I learn a lot of the content in my classes on my own.
20. I don’t want to attend most of my classes.
21. Students should be encouraged to share more of their ideas with each other.
22. I complete assignments exactly the way my teachers tell me to do them.
23. Students have to be aggressive to do well in courses.
24. It is my responsibility to get as much as I can out of a course.
25. I feel very confident in my ability to learn on my own.
26. Paying attention during class sessions is very difficult for me to do.
27. I like to study for tests with other students.
28. I do not like making choices about what to study or how to do assignments.

277
29. I like to solve problems or answer questions before anyone else can.
30. Classroom activities are interesting.
31. I like to develop my own ideas about course content.
32. I have given up trying to learn anything by going to class.
33. Class sessions make me feel like a part of a team where people help each other learn.
34. Students should be more closely supervised by teachers on course projects.
35. To get ahead in class, it is necessary to step on the toes of other students.
36. I try to participate as much as I can in all aspects of a course.
37. I have my own ideas about how classes should be run.
38. I study just hard enough to get by.
39. An important part of taking courses is learning to get along with other people.
40. My notes contain almost everything the teacher said in class.
41. Being one of the best students in my classes is very important to me.
42. I do all course assignments well whether or not I think they are interesting.
43. If I like a topic, I try to find out more about it on my own.
44. I typically cram for exams.
45. Learning the material is a cooperative effort between students and teachers.
46. I prefer class sessions that is highly organized.
47. To stand out in my classes, I complete the assignments better than other students.
48. I typically complete course assignments before their deadlines.
49. I like classes where I can work at my own pace.
50. I would prefer that teachers ignore me in class.
51. I am willing to help out other students when they do not understand something.
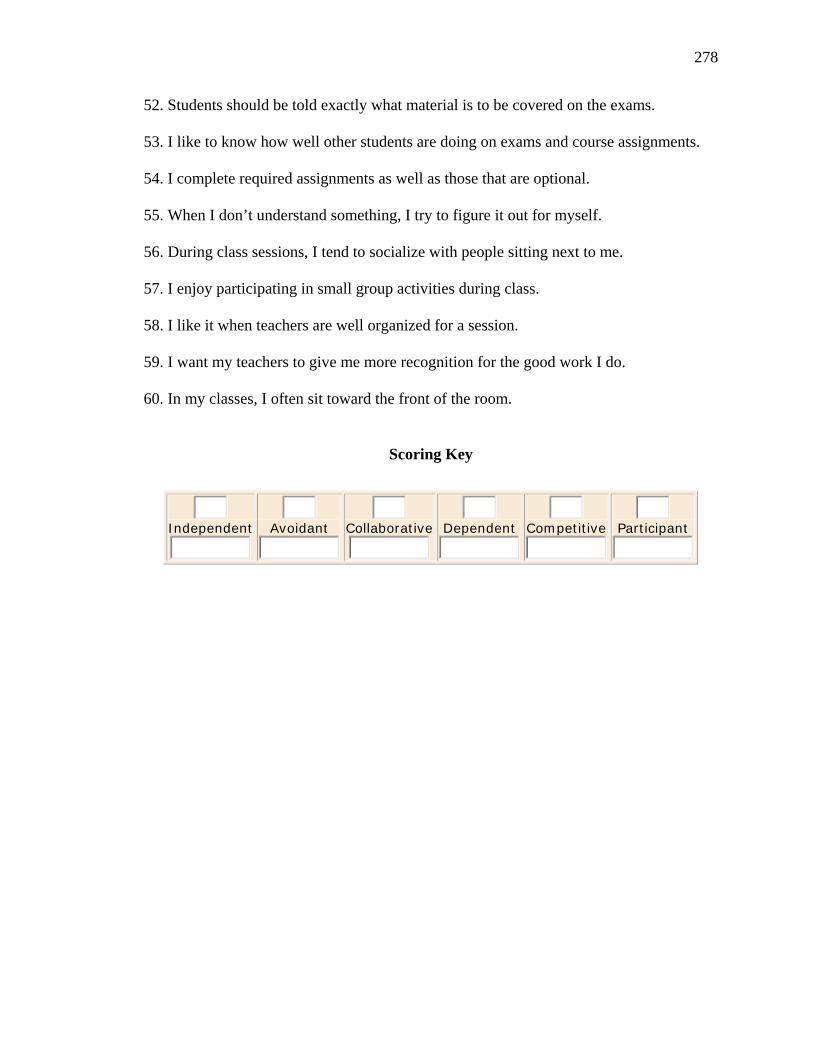
278
52. Students should be told exactly what material is to be covered on the exams.
53. I like to know how well other students are doing on exams and course assignments.
54. I complete required assignments as well as those that are optional.
55. When I don’t understand something, I try to figure it out for myself.
56. During class sessions, I tend to socialize with people sitting next to me.
57. I enjoy participating in small group activities during class.
58. I like it when teachers are well organized for a session.
59. I want my teachers to give me more recognition for the good work I do.
60. In my classes, I often sit toward the front of the room.
Scoring Key
Independent
Avoidant
Collaborative
Dependent
Competitive
Participant

279
Manual Scoring
If you have any problems with the automatic scoring, use the manual scoring table below:
1) Copy your responses from the sheet of paper with your ratings on it to the space provided below for each item.
Learning Style Test Items 1. . 2. . 3. . 4. . 5. . 6. . 7. . 8. . 9. . 10. . 11. . 12. . 13. . 14. . 15. . 16. . 17. . 18. . 19. . 20. . 21. . 22. . 23. . 24. . 25. . 26. . 27. . 28. . 29. . 30. . 31. . 32. . 33. . 34. . 35. . 36. . 37. . 38. . 39. . 40. . 41. . 42. . 43. . 44. . 45. . 46. . 47. . 48. . 49. . 50. . 51. . 52. . 53. . 54. . 55. . 56. . 57. . 58. . 59. . 60. .
2) Sum your ratings for each column and place them in the spaces below . . . . . . . . . . . .
3) Divide your total score for each column by 10 and place your answer in the spaces below
3) Divide your total score for each column by 10 and place your answer in the spaces below . . . . . . . . . . . . Independent Avoidant Collaborative Dependent Competitive Participant
4) The names for each learning style associated with each column are shown above.

280
5) Check whether your score represents a relatively Low, Moderate, or High score based on the norms for each learning style scale shown below. Low Moderate High Independent [1.0-2.7] [2.8-3.8] [3.9-5.0] Avoidant [1.0-1.8] [1.9-3.1] [3.2-5.0] Collaborative [1.0-2.7] [2.8-3.4] [3.5-5.0] Dependent [1.0-2.9] [3.0-4.0] [4.1-5.0] Competitive [1.0-1.7] [1.8-2.8] [2.9-5.0] Participant [1.0-3.0] [3.1-4.1] [4.2-5.0]

281
QUESTIONNAIRE FOR SOCIO-ECONOMIC STATUS OF PARENTS
1. Name: _________________________ 2. Child’s Name: _____________________
3. Child’s School Name: _______________________________4. District: ___________
5. Your Academic Qualification: ________6. Your Professional Qualification: ________
7. Wife’s Qualification: _______________
8. Your job: Govt. Service: Semi Govt.:
Non Govt. Organization Private: Any other (pl. specify):_______________
9. Nature of Job:
Self Employed: Business man: Land Lord: Any other(pl. specify):_____
9. Wife’s job:
Govt. Service: Private: House wife: Any other:____________
10. Number of Family Members: 11. Number of earning members of Family:
12. Number of Children you have? Son: Daughter:
13. Age group of your children’s: 1 to 5 years: 6 to 10 Years:
11 to 15 years: 16 to 20 years: Above 20 years:
14. Level of education in which your children’s are studying:
Primary Middle SSC HSC BA MA
15. Your Monthly Income from all sources:
(a) Below Rs. 5000/- (b) Rs. 5000/- to Rs. 10000/-
(c) Rs. 10000/- to Rs. 15000/- (d) Rs. 15000/- to Rs. 20000/-
(e) Rs. 20000/- to Rs. 25000/- (f) Above 25000/-
Appendix-G

282
16. In which area do you live? Rural: Urban:
17. Your Accommodation is? Own: Rented:
Official Residence: Living with relatives: Any other:
18. Do you have any vehicle? Yes No
19. If yes, which one? Car Suzuki Van
Motor cycle Bicycle
19. Which facilities do you have at your Home?
Electricity Sui-gas Water
20. Which appliances do you have at your home?
Iron TV Refrigerator Washing Machine
Greasier Heater Computer
21. Do you have toilet at your Home? ? Yes No
22. If yes, which one?
Flash (sewerage) Flash (tank) Flash (open passage)
22. Which source your child use for coming to school?
By foot Cycle Motor cycle Personal car
Privately arranged vehicle Public connivance
23. Distance of your child’s School from home? _____ Km ______Meter
24. Who coach your children after School?

283
Student Learning Style Scales The following questionnaire has been designed for the purpose of identifying your
style of learning in classroom at secondary school. There is no right or wrong answers to
each question. However, as you answer each question, it helps researcher to identify
your learning style. Your opinion will only be used for research purpose.
Respond to the items listed below by using the following scale.
SD=Strongly disagree D= Disagree UD= Undecided
A= Agree SA= Strongly agree
S.
No Statements SA A
U
D D SD
1 I prefer to work by myself on assignments in my courses.
2 I often daydream during class.
3 Working with other students on class activities is something I enjoy doing.
4 I like it whenever teachers clearly state what is required and expected.
5 To do well, it is necessary to compete with other students for the teacher’s attention.
6 I do whatever content is asked from me to learn in my classes.
7 My ideas about the content are often as good as those in the textbook.
8 Classroom activities are usually boring.
9 I enjoy discussing my ideas about the course content with other students.
10 I rely on my teachers to tell me what is important for me to learn.
11 It is necessary to compete with other students to get a
good grade.
12 Class sessions typically are worth attending.
13 I study what is important to me and not always what the teachers says is important.
Appendix-H

284
14 I am very seldom excited about material covered in a course.
15 I enjoy hearing what other students think about issues raised in class.
16 I only do what I am absolutely required to do in my courses.
17 In class, I must compete with other students to get my ideas across.
18 I get more out of going to class than staying at home.
19 I learn a lot of the content in my classes on my own.
20 I don’t want to attend most of my classes.
21 Students should be encouraged to share more of their ideas with each other.
22 I complete assignments exactly the way my teachers tell me to do them.
23 Students have to be aggressive to do well in courses.
24 It is my responsibility to get as much as I can out of a course.
25 I feel very confident in my ability to learn on my own.
26 Paying attention during class sessions is very difficult for me to do.
27 I like to study for tests with other students.
28 I do not like making choices about what to study or how to do assignments.
29 I like to solve problems or answer questions before anyone else can.
30 Classroom activities are interesting.
31 I like to develop my own ideas about course content.
32 I have given up trying to learn anything by going to class.
33 Class sessions make me feel like a part of a team where people help each other learn.
34 Students should be more closely supervised by teachers on course projects.
35 To get ahead in class, it is necessary to step on the toes of other students.
36 I try to participate as much as I can in all aspects of a course.
37 I have my own ideas about how classes should be run.
38 I study just hard enough to get by.

285
39 An important part of taking courses is learning to get along
with other people.
40 My notes contain almost everything the teacher said in class.
41 Being one of the best students in my classes is very important to me.
42 I do all course assignments well whether or not I think they are interesting.
43 If I like a topic, I try to find out more about it on my own.
44 I typically cram for exams.
45 Learning the material is a cooperative effort between students and teachers.
46 I prefer class sessions that is highly organized.
47 To stand out in my classes, I complete the assignments better than other students.
48 I typically complete course assignments before their deadlines.
49 I like classes where I can work at my own pace.
50 I would prefer that teachers ignore me in class.
51 I am willing to help out other students when they do not understand something.
52 Students should be told exactly what material is to be covered on the exams.
53 I like to know how well other students are doing on exams and course assignments.
54 I complete required assignments as well as those that are optional.
55 When I don’t understand something, I try to figure it out for myself.
56 During class sessions, I tend to socialize with people sitting next to me.
57 I enjoy participating in small group activities during class.
58 I like it when teachers are well organized for a session.
59 I want my teachers to give me more recognition for the good work I do.
60 In my classes, I often sit toward the front of the room.

Appendix-L
293
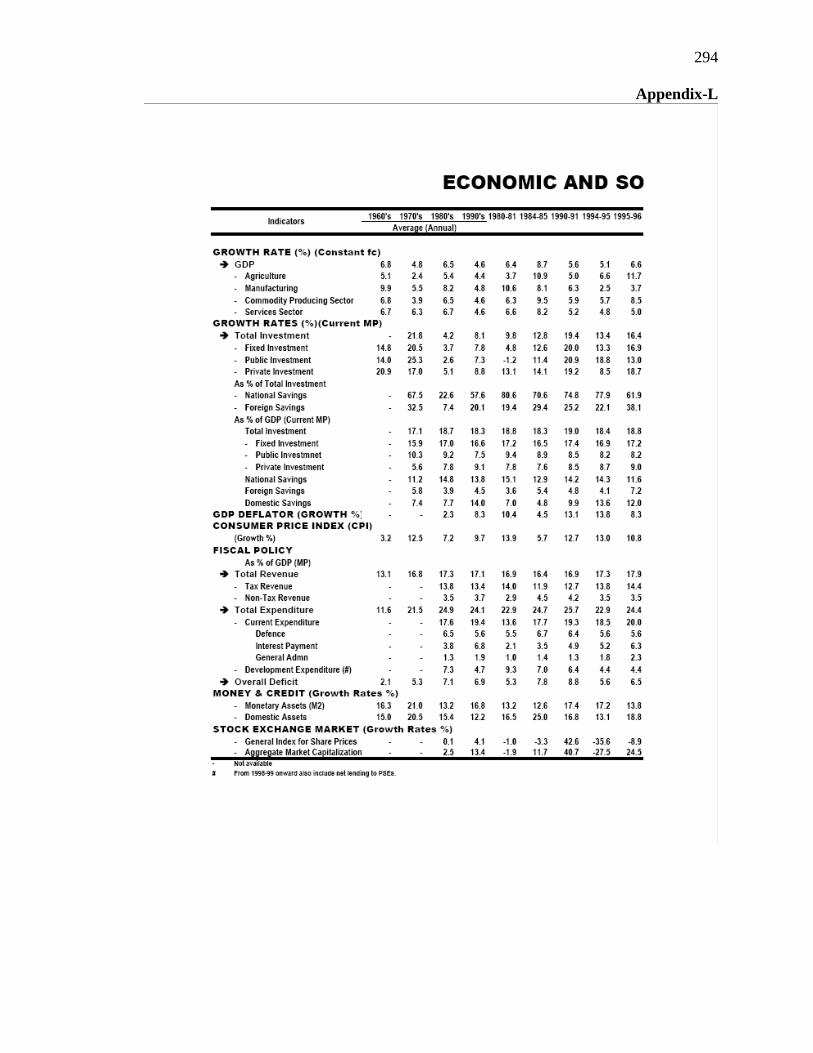
Appendix-L
294

Appendix-L
295

Appendix-L
296

Appendix-L
297

Appendix-L
298

Appendix-L
299

304
Appendix-M
BOARD OF INTERMEDIATE AND SECONDARY EDUCATION ISLAMABAD
GENERAL RULES FOR EXAMINATION 1.18 Placement in Grades
A candidate, who has qualified for the grant of Secondary/ Higher Secondary School Certificate, shall be placed in one of the following grades:
S. No. Percentage of Marks Grade Remarks
1. 80% and above Al Exceptional
2. 70% and above but below 80% A Excellent
3. 60% and above but below 70% B Very good
4. 50% and above but below 60% C Good
5. 40% and above but below 50% D Very fair
6. 33% and above but below 40% E Fair