the effects of minimum wage implementation on employment ... · technical intern trainees in the...
TRANSCRIPT

1
The Effects of Minimum Wage Implementation on Employment: Evidence from
Technical Intern Trainees in Japan
Gong Haojun1 School of Economics, Kobe University, 2-1 Rokkodai-cho, Nada-ku, Kobe Hyogo Prefecture, 657-
8501, Japan.
1 E-mail address: [email protected]

2
Abstract
Prior to 2010, the statutory minimum wage in Japan was not applicable to foreign
technical intern trainees in the first year following their arrival in Japan. However,
trainees receive off-the-job training up to two months after their arrival; owing to this, the
Ministry of Justice revised the Immigration Control and Refugee Recognition Act to
stabilize the legal status of such trainees. Following this revision, trainees who complete
two months of off-the-job training are eligible for minimum wage in the year they arrive
in Japan. We examined the effect of minimum wage implementation on the hiring of
technical intern trainees. The baseline results revealed no significant effects of minimum
wage implementation on hiring practices after first-year trainees are eligible for minimum
wage. We then limited our sample to the metal processing industry to consider changes
in the scope of permitted occupations for trainees. We consequently observed negative
effects of minimum wage on trainee hiring after minimum wage eligibility was applied
in 2010. Moreover, there is no evidence demonstrating a demand shift to other full-time
employees due to the decline in new technical intern trainees in metal processing industry
after 2010.
Keywords: Minimum wage, Labor demand, Employment loss, Technical intern trainees
JEL Classification: J23, J38, J61

3
1. Introduction
The effects of minimum wage policies have been hotly debated worldwide for many
years. In Japan, regional (prefectural) minimum wages had increased at a slow pace until
a policy amendment was instituted in 2007. This amendment sought to gradually raise
regional minimum wages in each prefecture to allow workers to access a “decent life.”
Since this amendment, the average regional minimum wage has increased, arousing
scholarly interest in its effects.
Standard economic theory predicts that an increase in minimum wage leads to a
decrease in the employment of minimum-wage workers (Stigler 1947). According to
Neumark and Wascher (2007), about 85 percent of 33 credible studies have reported a
reduction in employment following minimum wage increases. However, evidence also
reveals a positive or at least non-negative effect of minimum wage on employment, such
as in Dube et al. (2010) and Allegretto et al. (2011).
In Japan, the minimum wage differs according to prefecture. Since the Minimum
Wage Act was revised in 2007, the average prefectural hourly minimum wage has
increased by over 10 yen on average each year, although the increase in rates differs
according to prefecture. Regarding the employment effects of an increase in minimum
wage, previous studies in Japan have largely focused on a variety of low-wage workers;
these workers include teenagers (Akesaka et al. 2017; Kawaguchi and Mori 2009, 2013),
high school graduates (Ariga 2007), and female workers (Kambayashi et al. 2013;
Kawaguchi and Mori 2009; Kawaguchi and Yamada 2007). These studies found that low-
wage workers, who are the most likely to be influenced by minimum wage changes, may
lose employment or be hired less frequently. However, Higuchi (2013) reported that an

4
increase in minimum wage did not lead to losses of employment. Therefore, observed
effects of minimum wage changes in Japan remain mixed.
One reason for this disparity may be that the analysts did not specifically target
workers influenced by minimum wage. As Tanaka and Abe (2007) have noted, although
part-time teenage and female workers are likely low-wage workers who would be
influenced by any change in minimum wage, this is not always the case in Japan. There
is a differential between the minimum wage and the average wage for part-time
employees by prefecture; therefore, the low wage groups targeted may include workers
other than those who work for a minimum wage. Furthermore, among the low-wage
groups targeted, demand shift between workers influenced by minimum wage and those
not influenced by minimum wage may occur, leading to potential biases in the analysis.
Therefore, it is important to target only worker groups who are influenced by changes in
minimum wage. Although Kawaguchi and Yamada (2007) attempted to do this by
conducting a Difference in Differences (DID) estimation using worker groups whose
wages were lower than minimum wage as a treatment group and those whose wage were
higher than the minimum wage as a control group to identify the minimum wage effect,
the treatment sample size was quite small (18 people) due to a moderate increase in the
minimum wage before 2007, which led to their inability to control for unobserved
determinants between the two groups. Hence, accurately targeting worker groups
influenced by minimum wage changes and identifying the effects remains an issue to be
solved in Japan.
Moreover, when an increase in minimum wage or its introduction leads to a decrease
in employment or new hires for minimum wage workers, a demand shift from minimum
wage workers to higher-skilled and -waged workers may occur simultaneously. There is

5
some evidence on the demand shift effect caused by an increase in minimum wages
between teenage and adult workers (Hamermesh 1982; Lang and Kahn 1998; Pereira
2003), low- and high-educated workers (Connolly 2005), female and male workers aged
55–64 (Feliciano 1998), and workers aged 18–19-year-old and 20–21 (Dean and Steven
2004) overseas. However, this area has been poorly studied in Japan.
The purpose of this paper is to examine the effect of minimum wage implementation
on the new hiring of foreign technical intern trainees (hereafter trainees) in Japan. Since
2010, these trainees have been eligible for minimum wage even in their first year after
they have been in the country for two months. We use this policy change to examine the
employment effects of minimum wage changes in Japan. We clarified whether a demand
shift from foreign trainees to other regular employees exists due to minimum wage
changes for trainees.
This paper’s contributions to the literature are twofold. First, we focus on a worker
group in Japan—foreign technical intern trainees—who are wholly influenced by
minimum wage. Previously, workers in this group were not regarded as legal workers in
their first year, so they were excluded from the Minimum Wages Act. However, in the
2000s, the Japanese government confirmed that such workers were part of the legal labor
market. The government then revised the Immigration Control and Refugee Recognition
Act in 2010 to enforce a minimum wage for first-year trainees upon their arrival in Japan.
According to a Japan International Training Cooperation Organization (hereafter JITCO)2
survey, the average wages of first-year trainees doubled following minimum wage
2 JITCO is a public interest incorporated foundation that was jointly established in 1991 by the
Ministry of Justice; the Ministry of Foreign Affairs; the Ministry of Health, Labour and Welfare; the
Ministry of Economy, Trade and Industry; and the Ministry of Land, Infrastructure, Transport and Tourism. Its purpose is to contribute to the effective implementation and appropriate expansion of the
Technical Intern Training Program for accepting foreign technical intern trainees.

6
implementation. Thus, we examined the effects of minimum wage implementation on
employment in Japan. Outside Japan, some evidence has been gathered on the effect of
minimum wage introduction. In Germany, no reduction in the number of internships was
observed (Bossler and Wegmann 2019), and in South Korea, no reduction on plant-level
employment in was observed (Baek and Park 2016). Thus far, no studies have
comprehensively examined the effects of the implementation of minimum wage for
workers in Japan. Second, we attempt to ascertain whether the demand for trainees shifted
toward higher skill employees after the implementation of a minimum wage for trainees.
The main findings of this study are as follows. First, we find no evidence denoting
any effects of minimum wage on new trainee hiring after minimum wage implementation
in 2010. However, when we limit our sample to the metal processing industry to consider
the increase in permitted occupations for accepting trainees, we observe negative effects
of minimum wage on new hiring after 2010. Furthermore, we identify no evidence of a
demand shift toward Japanese male full-time employees who are considered higher
skilled workers owing to a decrease of new hires in the metal processing industry.
In Section 2, the institutional background is explained, and the revisions regarding
minimum wages and the Technical Intern Training Program to the Immigration Control
and Refugee Recognition Act in 2010 are presented in detail. Section 3 describes the data,
and Section 4 describes the empirical model. Section 5 presents the results. Section 6
concludes the paper.
2 Institutional Background
2.1 Minimum wage system

7
The Minimum Wage Act in Japan was first established in 19593. Minimum wages
are set through the following method. The Central Minimum Wages Council divides the
47 prefectures into four ranks according to their economic conditions and sets the rough
level of an increase in minimum wages every year. The Local Minimum Wages Council
sets the amount of minimum-wage increase according to the suggestions of the Central
Minimum Wages Council. The Director of the Prefectural Labor Bureau establishes the
minimum wage for each prefecture on the basis of the Local Minimum Wages Council’s
deliberation.
Minimum wage in Japan is divided into two types: the prefectural (regional)
minimum wage covers all workers in the corresponding prefecture, and the industrial
minimum wage applies to specific industries in each prefecture. In other words, the latter
does not cover all workers in the prefecture. Therefore, we focused on the broader
category, prefectural minimum wage, which is considered to have a larger influence. In
2007, the government revised the prefectural minimum wage to help workers pay basic
living expenses. Since this revision, the hourly minimum wage for each prefecture has
increased annually by about 10 yen or more compared with previous increases of only 1
or 2 yen per hour. It is mandatory for all businesses to comply with the minimum wage.
Any business that violates this law is penalized and must pay a maximum amount of
500,000 yen.
2.2 Exemptions and implementation of minimum wage
3 See Hamaguchi (2009), Rodo Chosakai (2009) and Kanki (2011) for detailed explanations of
minimum-wage legislation in Japan.

8
Until 2010, some special worker groups in Japan were exempt from the minimum
wage. This included disabled employees and others on probation or those working for an
extremely short time whose productivity was considered lower than that of general
workers. First-year technical intern trainees were included as an exempt group as well.
However, because trainees receive off-the-job training for two months after they move to
Japan and comprise a labor pool just as other Japanese workers do, the Ministry of Justice
revised the Immigration Control and Refugee Recognition Act to stabilize the legal status
of first-year trainees in 2010. Following this revision, trainees finishing two months of
off-the-job training have been eligible for minimum wage and receive protection under
other labor-related laws and regulations from the year they enter Japan. This revision was
enacted in 2009 and put into effect in 2010. Hence, we focused on the effects of minimum
wage implementation on first-year trainees.
Trainees are foreign workers accepted under the Technical Intern Training Program,
which was established in 1993.4 In Japan, trainees are accepted by one of two methods.
One is acceptance supervised by organization in which Japanese enterprises accept
trainees under the supervising organizations’ responsibility and administration. The other
is acceptance managed by individual enterprise in which Japanese enterprises accept
employees of their overseas branches, subsidiaries, and joint venture enterprises
irrespective of labor demands. According to JITCO white paper, approximately 90
percent of accepted trainees have been accepted through enterprises under a supervising
organization since 2002. Furthermore, approximately 80 percent of enterprises under a
4 More detailed information about foreign technical intern trainees may be found in Kamibayashi’s
work (2009) and JITCO’s homepage (n.d.). What is the Technical Intern Training Program,
Retrieved August 10, 2019, from https://www.jitco.or.jp/en/regulation/index.html/.

9
supervising organization have been small- and medium-sized enterprises (hereafter
SMEs) with fewer than 1,000 employees. They indicate that trainees are mainly required
by SMEs and accepted by a supervising organization. Most importantly, compared with
acceptance managed by individual enterprise, trainee acceptance through acceptance
supervised by organization has tended to meet labor needs; thus, enterprises’ labor
demand for trainees is influenced by minimum wage changes. Hence, we focused only
on trainees accepted by a supervising organization in this study.
Under the supervised by organization method, a Japanese business enterprise
finalizes its job requirements to satisfy its labor demand, and the supervising organization
then provides hiring requirements to the sending organization responsible for recruiting
and selecting candidates. After the supervising organization reduces the number of
candidates to two or three times the number of vacancies to allow the Japanese business
enterprise recruiting the trainees to choose ideal candidates5. Therefore, the hiring of
trainees is entirely decided by the enterprise and its labor demand. Upon employment, the
trainees receive training and work for the hiring enterprise for three years at most by
fixed-term contract. Due to the contract, enterprises can only adjust trainee employment
by adjusting new hires instead of firing current employees. Although the maximum
number of new hires in each year for enterprises are set by the government based on the
enterprise’s size, the hiring of trainees is lower than the quotas for each year, according
to the JITCO white paper. Hence, enterprises are able to adjust the number of newly hired
trainees under the set quota.
5 There doesn’t exist data for number of candidates of trainees by prefecture. But we can obtain this
evidence from the website of the supervising organization.

10
Figure 1 demonstrates the training process after trainees are accepted. In their first
year, trainees undergo off-the-job training (e.g., learning Japanese, attending other
lectures, etc.) to acquire knowledge and information necessary for their legal protection
over the first two months. After this training, they are considered workers as akin to other
Japanese employees6 in the same enterprise. Until 2009, only second- and third-year
trainees were eligible for the minimum wage, and the wages paid were almost always at
the minimum wage. According to a 2016 survey7 on 10,000 companies that accept
trainees, trainees’ wages are always almost within the range of 100–200 yen of the
minimum wage.
Figure 2 shows trainees’ wages upon entry and how they have changed since the
revision of the Immigration Control and Refugee Recognition Act in 2010. Until 2009,
the average hourly wage paid for first-year trainees was about 400 yen—that is, half of
the minimum wage that second- and third-year trainees were paid. Although the wages
of second- and third-year trainees are always at the minimum, their low wages in their
first year led to an average hourly wage over three years below minimum wage. Since
2010, first-year trainees’ wages have met the minimum wage guidelines (i.e., twice the
earlier average wage). These facts indicate that changes in minimum wage directly
influence trainees’ wages. Thus, we focused on the policy change of minimum wage
implementation on first-year trainees in 2010 to examine how the minimum wage affects
the hiring of new trainees.
6 To proceed to second-year “Technical Intern Training (ii)” and third-year “Technical Intern Training
(ii),” the trainees must pass the specified “Technical Intern Training Evaluation Examination”
organized by Japan vocational ability development association in each prefecture. Two-third of the
trainees in first-year stage proceeds to the second year (Hashimoto 2011). 7 A survey about acceptance of technical intern trainees in enterprise from the Japan institute for labor
policy and training (JILPT) in 2016.

11
3. Data
Our analysis relied on prefecture-level panel data in Japan. To identify the number
of new trainee hires, we used aggregate data from the JITCO white paper spanning 2002–
2016. JITCO publishes a white paper that details the number of new foreign trainee hires
at the prefecture level for each previous year and includes a description of national
average wages paid to first-year trainees and second- and third-year trainees rather than
presenting individual-level wages. For data on the number of regular8 and part-time
employees and their average wages, we used aggregate data from the Basic Survey on
Wage Structure from 2002 to 2016. This survey is conducted every year from July 1 to
31. Surveyed establishments are selected using a uniform sampling method that assesses
the following establishments belonging to the industry and surveyed area: 1)
establishments with 10 regular employees or more (private establishments and
establishments of public corporations under Specified Agency Engaged in Administrative
Execution or the Local Public Corporation Labour Relations Law) and 2) private
establishments with 5–9 regular employees. The prefectural minimum wage in each year
is obtained from the Pandect of Minimum Wages Determination (Saitei Chingin Kettei
Yoran), spanning from 2001 to 2015. The unemployment rate from 2002 to 2016 is
acquired from the Labor Force Survey. This survey has been conducted by The Statistics
Bureau of the Ministry of Internal Affairs and Communications (MIC) every month since
July 1947. Approximately 40 thousand households in about 2,900 enumeration districts,
8 Regular employees are workers who satisfy one of the following conditions: (1) persons hired for
an indefinite period or for longer than one month or (2) persons hired by the day or for less than one month and who were hired for 18 days or more in each of the two preceding months. It includes full-
time workers and part-time workers satisfying the above conditions.
12
which are selected from approximately one million Population Census Enumeration
Districts prior to assessment, are surveyed. Respondents over 15 are asked about
employment status (about 100 thousand persons in total).
4 Empirical Strategy
4.1 Estimation model
A) Baseline model
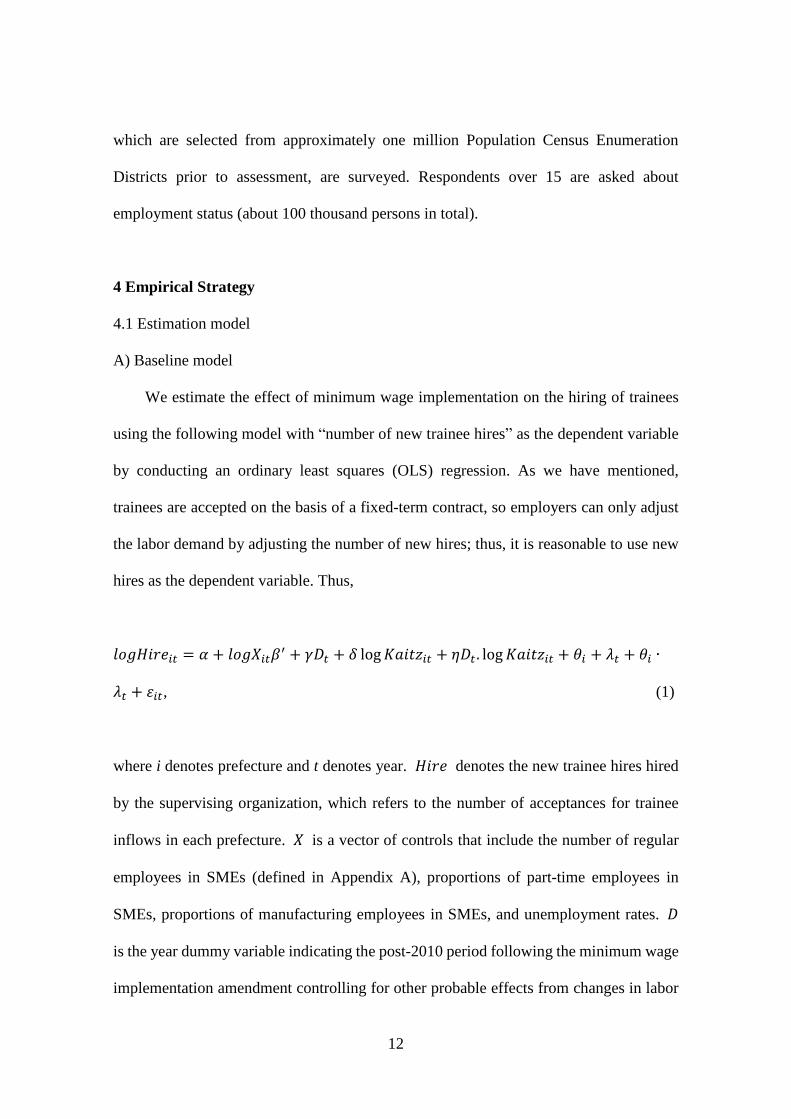
We estimate the effect of minimum wage implementation on the hiring of trainees
using the following model with “number of new trainee hires” as the dependent variable
by conducting an ordinary least squares (OLS) regression. As we have mentioned,
trainees are accepted on the basis of a fixed-term contract, so employers can only adjust
the labor demand by adjusting the number of new hires; thus, it is reasonable to use new
hires as the dependent variable. Thus,
𝑙𝑜𝑔𝐻𝑖𝑟𝑒𝑖𝑡 = 𝛼 + 𝑙𝑜𝑔𝑋𝑖𝑡𝛽′ + 𝛾𝐷𝑡 + 𝛿 log 𝐾𝑎𝑖𝑡𝑧𝑖𝑡 + 𝜂𝐷𝑡 . log 𝐾𝑎𝑖𝑡𝑧𝑖𝑡 + 𝜃𝑖 + 𝜆𝑡 + 𝜃𝑖 ∙
𝜆𝑡 + 휀𝑖𝑡, (1)
where i denotes prefecture and t denotes year. 𝐻𝑖𝑟𝑒 denotes the new trainee hires hired
by the supervising organization, which refers to the number of acceptances for trainee
inflows in each prefecture. 𝑋 is a vector of controls that include the number of regular
employees in SMEs (defined in Appendix A), proportions of part-time employees in
SMEs, proportions of manufacturing employees in SMEs, and unemployment rates. 𝐷
is the year dummy variable indicating the post-2010 period following the minimum wage
implementation amendment controlling for other probable effects from changes in labor

13
market conditions for all prefectures, including the protection of national labor-related
laws on trainees since 2010. It takes the value of one for 2010 to 2016 and zero for the
years before 2010. Then, we used the Kaitz index, calculated by the ratio of minimum
wages to average wages, which indicates the real level of minimum wage by prefecture.
The minimum wage law in Japan applies to the straight wage rate excluding allowances;
therefore, we define hourly wages as scheduled earnings without allowance9 divided by
hours worked. When calculating the weighted average wage of regular employees, we
first calculated hourly wage by gender as the monthly scheduled earnings divided by the
monthly hours worked, and then computed the weighted average of hourly wages using
the number of employees of each gender. When calculating the Kaitz index, we use the
minimum wage enacted in year t-1 and the average wage in year t to match because the
minimum wage is typically enacted in October of each year, and the average wage data
we used are collected via survey in June of each year. Minimum wages enacted in October
are applied to wages, and relevant data is collected in June of the following year.
To evaluate minimum wage implementation for first-year trainees in 2010, we
constructed an interaction term for the post-2010 period dummy variable and Kaitz index.
Using the parameter of this interaction term, we identified the effects of minimum wage
implementation for first-year trainees, which increased the wages of new hires compared
with the pre-2010 period. In recent years, the endogenous determination of minimum
wage levels has become significant. However, the only study that considers minimum
wage as possibly endogenous in Japan is that conducted by Kawaguchi and Mori (2013),
who concluded that no endogeneity problem exists in minimum wage analysis. Thus, the
9 Allowances consist of commutation, perfect attendance, and family allowances.

14
endogeneity of minimum wages does not require consideration in Japan. Therefore, we
do not need to consider the potential endogeneity of minimum wages in our study.
We use control variables that capture the conditions and structure of regional labor
markets. Given that the labor demand for trainees comes mainly from SMEs, we used
control variables pertaining to SMEs with fewer than 1,000 employees. In addition, we
used the number of regular employees to control for the amounts of labor demand in the
prefecture. Likewise, we used the unemployment rate to control for the conditions of
regional labor markets. Based on JITCO’s data, the manufacturing industry has the
greatest need for trainees. Other studies on trainees, such as those conducted by Shu
(2004), Shiho (2007), and Hashimoto (2011), have reported that trainees are primarily
employed by the manufacturing industry. We thus used the proportion of manufacturing
employees as a control variable. Moreover, a higher need for part-time employees in
prefectures indicates a higher need for flexible workers. There is evidence indicating that
trainees may be substitutable for part-time employees (Nishioka 2004). The proportion
of manufacturing employees was calculated by dividing the number of manufacturing
employees in SMEs by the total number of regular employees in SMEs. Likewise, the
proportion of part-time employees was calculated by dividing the number of part-time
employees by that of regular employees. Because data on part-time employees by
company size did not exist before 2008, we calculate the proportion of part-time
employees using data for all company sizes, rather than only those with fewer than 1000
employees.
Finally, we controlled for the prefecture fixed effect (𝜃𝑖), linear time trend (𝜆𝑡), and
prefecture-specific time trend (𝜃𝑖 ∙ 𝜆𝑡). 휀𝑖𝑡 denotes the error term.

15
B) Metal processing industry model
One problem in the baseline model is that trainees are not permitted to work in all
occupations in Japan. Although the scope of permitted occupations remained the same
until 2007, the scope has been increasing since 2008. Table 1 shows the industries
included in the extension of permitted occupations after 2008. For example, three new
occupations in the food manufacturing industry were permitted: one in 2008, one in 2015,
and one in 2016. Note that such extensions create more demand for new trainee hires.
Thus, the estimated effects of minimum wage on new hires may be affected by external
factors in the baseline model. To address this problem, we limited our sample to the metal
processing industry in which the scope of permitted occupations remained constant
throughout the analysis period (2002–2016). Aside from this industry, there are other
industries in which the scope of permitted occupations and activities remained the same,
but we were unable to use these samples due to the limitation of aggregate data.
When estimating the effect of minimum wage on the employment of trainees in the
metal processing industry, we used a Tobit model. Figure 3 shows the histogram of the
dependent variable—namely, new trainee hires in the metal processing industry. The
distribution of the number of new trainee hires is positively skewed with many
observations in the data set reflecting a value of zero. The right tail is longer, and the mass
of the distribution is concentrated on the left of the figure. This indicates that some regions
accepted few to no new hires in some years.
We examined the effect of minimum wage implementation for trainees in the metal
processing industry using the same model as baseline model by conducting a Tobit
regression. The number of new trainee hires in the metal processing industry was
truncated at zero. Thus, the results were biased when using ordinary least squares

16
estimates. This maximum likelihood estimation procedure yields consistent and
asymptotically efficient results (Tobin, 1958; Amemiya, 1985). Moreover, we added one
to the number of new hires in the dependent variable because prefectures with zero new
hires in some years would have been excluded from the sample when using the logarithm
of this variable.
Some variables in this model differed from baseline model. We used the variable from
the metal processing industry sample10. As for controls in X, we only included male full-
time employees in the metal processing industry and the unemployment rate. Because the
Basic Survey on Wage Structure did not report the number of part-time employees and
female full-time workers at the prefecture-industry level until 2008, we define regular
employees as male full-time employees to capture the conditions and structure of regional
labor markets. The average wage used to calculate the Kaitz index was equivalent to the
average wage paid to male full-time employees. Furthermore, due to the limitation of
aggregate data in the metal processing industry, we used the data aggregated for
enterprises of all sizes rather than SMEs with fewer than 1,000 employees.
4.2 Data characteristics
Table 2 and Table 3 presents the summary statistics of variables for the baseline
model and the metal processing industry sample, respectively. Figure 4 shows that the
number of new hires exhibited a distinct trend after 2008. Until 2007, the number of hires
increased continually despite the depression during which teenage workers in Japan faced
high unemployment rates (Shiho 2007). This number decreased from 2008 to 2010 and
10 See details in Appendix B and C.

17
fluctuated in recent years. In other words, the number of new trainee hires seems to
respond to economic conditions after 2008. Figures 5 shows the evolution of minimum
wages and the log of Kaitz index—both of which exhibit an increasing trend following
the minimum wage change in 2007. The prefectural minimum wage increased gradually
compared with that before 2007. Figure 6 shows that the trend of new trainee hires in the
metal processing industry follows those of all other industries. Hires began decreasing in
2008, but marginally increased from 2010 onward. After 2010, the trend fluctuates.
Figure 7 shows the evolution of the Kaitz index. Since the 2007 revision, the slope of
minimum wages and the Kaitz indices indicating an increasing trend becomes steeper,
which also follows the trends observed in all industries. Thus, considering the clear
increase in the minimum wage after 2007, minimum wage implementation for first-year
trainees in 2010 was expected to be significantly influential.
5. Results
5.1 Baseline results
Table 4 reports the OLS estimation results for the baseline model. The first column
presents the estimation result derived without controlling for the trend, prefecture-specific
effect, the number of regular employees, unemployment rate, proportion of
manufacturing employees and that of part-time employees , while the second column
shows the result derived while incorporating the number of regular employees and the
unemployment rate to capture the situation of region labor markets. The coefficient of the
Kaitz index became statistically insignificant and diminished in the second column
compared with that in the first column. The results in the second column reveal that the
unemployment rate has a negative effect on new trainee hires. Owing to the negative

18
correlation between the Kaitz index and unemployment rate, an upward bias on the Kaitz
index coefficient in the first column is observed without controlling for unemployment
rate. The third column shows the results derived by adding the proportions of
manufacturing employees and part-time employees, which are considered to influence the
demand for trainees. The result of the negative effect of the proportion of part-time
employees on new trainee hires and the positive correlation between the proportion of
part-time employees and the Kaitz index additionally reveals an upward bias on the Kaitz
index coefficient in the second column when not controlling for the proportion of part-
time employees. The results in the fourth column were derived by controlling for trends,
and those in the fifth column were derived by controlling for prefecture-specific trends.
After controlling for all covariates, both the coefficient of regular employees and the
unemployment rate are negative and statistically significant. These results indicate that
the hiring of trainees is positively related to the labor market conditions; when other labor
pools in Japan sufficiently satisfy company labor demands, the hiring of trainees
decreases. Furthermore, the coefficient of the proportion of part-time employees is
positive and statistically significant. This indicates that regions with more part-time
employees employ more trainees, which implies that regions with higher demands for
flexible workers tend to employ trainees. Regarding the variable of the proportion of
manufacturing employees, we found that its coefficient is statistically insignificant, which
contradicts our prediction.
The coefficient of interaction term of the post-2010 period dummy variables and the
log of the Kaitz index is negative, and the magnitude of the point estimate is quite large
(-1.367), indicating that a one percent increase in the Kaitz index results in the decrease
in the new trainee hires by 1.4 percent points. However, the standard error for the

19
coefficient is large and statistically insignificant. The results suggest that the
implementation of the minimum wage in 2010 did not affect the number of new trainee
hires. However, the Kaitz index coefficient (without the interaction term) is negative and
statistically significant. Trainee wages in their second and third years are always
equivalent to the minimum wage; thus, hiring them was influenced by minimum wage
regardless of the wage level for first-year trainees. After the minimum wage was applied
to first-year trainees, the negative effect of minimum wage after 2010, which is identified
by the Kaitz index coefficient with the interaction term, was expected to increase;
however, we found the effect to be insignificant. This may be due to the influence of the
increased number of occupations accepting new trainees since 2008 as greater demand
attenuated the negative effects from minimum wage implementation.11
5.2 Tobit estimation results for the metal processing industry
Table 5 reports the results derived by applying the average marginal effect in Tobit
regression for the metal processing industry sample. When only controlling for prefecture
dummy variables in the first column, the coefficient of the interaction term with the Kaitz
index is negative and statistically significant. After further controlling for the number of
male full-time employees and unemployment rates, the magnitude of the coefficient of
the interaction term increased, and the statistical significance of it increased from 10% to
5%. The unemployment rate exhibits a statistically significant negative effect on new
trainee hires, which reflects our baseline results. These results indicate that as labor
market conditions improve, the demand for trainees will increase. The effect of male full-
11 We also used the interaction term for a distributed lag in the interaction between the Kaitz index and the time effect in order to estimate the lagged effect of minimum wages. We found no evidence
denoting lagged effects of minimum wages on the new hires.

20
time employees is statistically insignificant but negative, suggesting that when other labor
pools in the manufacturing industry sufficiently satisfy company labor demand, new
trainee hires decrease. These results remain nearly the same regardless of including or
excluding the trend.
After further controlling for prefecture-specific time trends, the estimated minimum
wage effects marginally decreased. Considering all control variables in the model, a 1
percent increase in the Kaitz index was directly correlated with a 1.4 percent the number
of new hires compared with the period before 2010. Thus, after minimum wage was
implemented for first-year trainees, new trainee hires in the metal processing industry
decreased.
5.3 Effects on other regular employees in Japan (metal processing industry)
We ascertained that—through minimum wage implementation for first-year trainees
in 2010—trainee hires in the metal processing industry reflects an increase in the Kaitz
index. We then examined whether a demand shift from trainees to regular employees
occurs when new trainee hires decrease. We thus used the following model:
𝑙𝑜𝑔MetalEmp𝑖𝑡 = α + log𝑋𝑖𝑡𝛽′ + 𝛾𝐷𝑡 + 𝛿𝑙𝑜𝑔(𝐾𝑎𝑖𝑡𝑧𝑖𝑡) + 𝜂𝐷𝑡. 𝑙𝑜𝑔(𝐾𝑎𝑖𝑡𝑧𝑖𝑡) + 𝜃𝑖 +
𝜆𝑡 + 𝜃𝑖 . 𝜆𝑡 + 휀𝑖𝑡, (3)
where i denotes prefecture and t denotes year. We used the variable from the metal
processing industry sample; the dependent variable 𝑀𝑒𝑡𝑎𝑙𝐸𝑚𝑝 refers to number of
male full-time employees in the metal processing industry. 𝑋 is a vector of controls that
includes the unemployment rate and labor force. We also used the interaction of the post-

21
2010 period dummy variables and the Kaitz index to observe the effect of the decrease of
new hires. Finally, as in equation (1), we controlled for the prefecture fixed effect (𝜃𝑖),
linear time trend (𝜆𝑡), and prefecture-specific trend (𝜃𝑖 . 𝜆𝑡).
Table 6 presents the corresponding results. The coefficient of the interaction of post-
2010 period dummy variables and the Kaitz index is positive, which reveals that as the
number of new trainee hires decreases through the Kaitz index, the number of male full-
time employees increases in kind. This result implies that trainees are substituted by male
full-time employees when minimum wage was implemented for, but the coefficient is
statistically insignificant. We did not observe any substitution effect from male full-time
employees.
6. Conclusion
This study was focused on the effects of minimum wage implementation on first-
year trainees, which are the only group that is comprehensively influenced by minimum
wages in Japan. We use prefecture-level panel data to estimate the effect of minimum
wages on trainee employment and determined whether the demand for trainees shifts
toward other higher-skilled employees in Japan after increased minimum wages for
trainees.
The baseline results revealed no significant effects of minimum wage on new trainee
hires after minimum wage implementation for first-year trainees. However, after we
limited our sample to the metal processing industry in order to consider whether the bias
may be the result of our baseline model due to extended scope of permitted occupations
for trainees, we observed the negative effects on new hiring post-2010 among prefectures.
The number of new trainee hires elasticity to minimum wages in this paper is 1.4, which

22
is larger than the employment elasticity of 0.3, which was identified in the study
conducted by Kambayashi et al. (2013) and 0.5, which was identified in the study
conducted by Kawaguchi and Mori (2013) in which they examined a low-wage group
rather than a worker group solely paid minimum wage. Although we used new hire data
rather than general employment data to define our dependent variable, we can say that
1.4 is also the employment elasticity for trainees. Hence, minimum wage exhibits a
negative and more notable effect on trainees. Furthermore, we did not observe a shift in
demand to male full-time employees. Therefore, our evidence reveals that minimum wage
implementation only led to a decrease in new trainee hires, and it did not affect the
demand for higher-skilled workers in the metal processing industry.
In summary, by targeting a worker group that is wholly influenced by minimum
wage changes, we were able to observe the effect and magnitude on new hires in the metal
processing industry in the context of previous studies that evaluated other labor pools in
Japan. Our research highlights the necessity of identifying and analyzing worker groups
that are definitively affected by minimum wage policy and revision.
Disclosure statement
No potential conflict of interest was reported by the authors. The study is not supported
by any grants.
References
Abe, Y., Tanaka, A., 2007. The part-time/full-time wage gap and the role of the regional
minimum wages in Japan: 1990-2001. Japanese Journal of Labour Studies, No. 568, 77-
92. [in Japanese]

23
Akesaka, M., Ito, Y., Ohtake, F., 2017. Impact of change in minimum wages on
employment and poverty in Japan. ISER Discussion Paper, No. 999. [In Japanese]
Allegretto, A.S., Dube, A., Reich, M., 2011. Do minimum wages really reduce teen
employment? accounting for heterogeneity and selectivity in state panel data. Industrial
relations, Vol. 50, No. 2, 205-240.
Amemiya, T., 1985. Advanced Econometrics. Cambridge, US: Harvard University Press.
Ariga, K., 2007. Labor market of new high school graduates. In: Causes and Institutions
of Economic Stagnation, Fumio Hayashi ed., Keiso Shobo. [In Japanese]
Baek J., Park W., 2016. Minimum wage introduction and employment: Evidence from
South Korea, Economics Letters., Vol.139, No.1, 18-21.
Bossler, M., Wegmann, J., 2019. The German generation internship and the minimum
wage introduction: Evidence from big data. Applied Economics, Vol. 51, No. 16, S. 1730-
1747.
Connolly, H., 2005. Are low-educated workers disproportionately affected by a change
in the minimum wages? Unpublished paper, Northeastern University.
Dean, H., Steven, S., 2004. Youth minimum wages reform and the labour Market. IZA
Discussion Paper, No. 1091, March.
Dube, A., Lester, W., Reich, M., 2010. Minimum wages effects across state borders:
Estimates using contiguous counties. The Review of Economics and Statistics, Vol. 92,
No. 4 (November), 945-964.
Feliciano, Z.M., 1998. Does the minimum wage affect employment in Mexico? Eastern
Economic Journal, Vol. 24, No. 2, Spring, 165-80.
Hamaguchi, K. (2009). Legal policies on the minimum wage system (Saiteichinginsei no
hoseisaku). Quarterly Labor Law, Vol.226, 229–241 [in Japanese].

24
Hamermesh, D.S., 1982. Minimum wages and the demand for labor. Economic Inquiry,
Vol. 20, No. 3, 365-380.
Hashimoto, Y., 2011. A study on wage and productivity of enterprise that accept foreign
trainees・technical intern trainees. Economic Analysis, No. 185, 67-91. [in Japanese]
Higuchi, Y., 2013. The dynamics of poverty and the promotion of transition from non-
regular to regular employment in Japan: Economic effects of minimum wages revision
and job training support. The Japanese Economic Review, Vol. 64, No. 2, 147-200.
Kamibayashi, T., 2009. Ichijiteki gaikokujin roudousya ukeireseido no teichakukatei-
gaikokujin ginojisyuseido wo chushinni [The rooting process of the temporary migration
system in Japan: focusing on the technical internship program], Vol.56, No.1, 39-63. [In
Japanese]
Kambayashi, R., Kawaguchi, D., Yamada, K., 2013. Minimum wages in a deflationary
economy: The Japanese experience, 1994-2003. Labor economics, Vol. 24, 264-276.
Kanki C., 2011. Legal structure of, and issues with, Japan’s regional minimum wage
system: Comparative study of the UK and French systems, including the social security
systems. Japan Labor Review, Vol.8, No.2, 55-70.
Kawaguchi, D., Yamada, K., 2007. The impact of the minimum wages on female
employment in Japan. Contemporary Economic Policy, Vol. 25, No. 1, 107-118.
Kawaguchi, D., Mori, Y., 2009. Saitei Tingin Roudousya No Zokusei To Saitei Tingin
Hikiage No Koyou Heno Eikyou [Characteristic of minimum wage workers and the
impact of minimum wage increase on employment]. Nihon Roudou Kenkyu Zassi
[Japanese Journal of Labor Studies], Vol. 593, 41–54. [In Japanese]

25
Kawaguchi, D., Mori, Y., 2013. Minimum wages and teens employment: The impact of
minimum wages revision in 2007. RIETI Discussion Paper Series, 13-J-009. [In
Japanese]
Lang, K., Kahn, S., 1998. The effect of minimum wages laws on the distribution of
employment: Theory and evidence. Journal of Public Economics, Vol. 69, No. 1 (July),
67-82.
Neumark, D., Wascher, W., 2007. Minimum wages and employment. Foundations and
Trends in Microeconomics, Vol. 3, 1–2.
Nishioka, Y., 2004. The fact of utilization of foreign technical intern trainees and
substation for Japanese employees. The Japanese Journal of Labor Studies, Vol. 46, No.
10, 26-34. [In Japanese]
Pereira, S.C., 2003. The impact of minimum wages on youth employment in Portugal.
European Economic Review, Vol. 47, No. 2 (April), 229-44.
Rodo Chosakai. 2009. Kaitei 3-han, saitei chinginho no shokai [Detailed explanations of
the minimum wages act, 3rd revison]. Tokyo: Rodo Chosakai
Shiho, K., 2007. The role of foreign technical intern trainees in human resource
management: Theoretical analysis and empirical analysis on acceptance of foreign
technical intern trainees. Sanken Ronshu, Vol. 34, 87-97. [In Japanese]
Shu, G., 2004. Determinants of foreign trainees' inflow to Japan under the recession in
'90s. Sanken ronshu, Vol. 31, 67-78. [in Japanese]
Stigler, G.J., 1947. The economics of minimum wages legislation. The American
Economic Review, Vol. 36, No. 3, 358-365.
Tobin, J., 1958. Estimation of relationships for limited dependent variables.
Econometrica, Vol. 26, No. 1, 24-36.

26
Appendix A. Variable definitions and sampling
A.1. Regular employee data processing—baseline model
Data from the Basic Survey on Wage Structure were used. In this case, the data of
regular employees were separated according to full- and part-time status. For regular
employees, we summed the number of full- and part-time employees. As the data on part-
time employees by company size was not available prior to 2008, we summed the number
of full-time employees of SMEs and that of part-time employees for all company sizes as
regular employees from SMEs in Japan. We used the same sample to calculate the average
wage of regular employees in SMEs.
Appendix B. Data processing—using the metal processing industry sample
To collect data on new trainee hires in the metal processing industry, we used the
aggregate data collected from the JITCO white paper published from 2004 to 2016, For
the metal processing industry sample, the scope of occupations in the metal processing
industry that accept trainees—as denoted in the JITCO white papers—does not reflect the
scope denoted in the Basic Survey on Wage Structure. Therefore, when matching the data
from each survey, we chose the occupation in the Basic Survey on Wage Structure that
best reflects that outlined by JITCO to compose the metal processing industry data. The
examined occupations include metal molder, steel rolling and drawing worker, lathes
operator, general chemical operative, milling machine operator, metal press machine
operator, ironworker, and sheet-metal worker and finisher.
Appendix C. Data processing—new trainee hires in the manufacturing sample:

27
The new trainee hire data in the JITCO white paper was not separated according to
individual enterprise and supervising organization types at the prefecture-industry level
until 2010. Thus, we used the sum of the two types to maintain data consistency from
2004 to 2016. Given that ninety percent of the trainee hires were overseen by supervising
organizations, we considered this method of trainee acceptance to be mainly for the
supervising organization type. We believe that this did not affect the result of the analysis
for the trainees from the supervising organization type.

28
Table 1 Extension of permitted occupations for trainees
Data source: JITCO white paper (2009–2017)

29
Table 2 Summary statistics of baseline model variables
Notes: The represented data includes that of 47 prefectures over 15 years (2002–2016).
Data Source: JITCO white paper, Basic Survey on Wage Structure and Labor Force Survey in 2002-
2016, and Pandect of Minimum Wages Determination (Saitei Chingin Kettei Yoran) in 2001-2015.
Table 3 Summary statistics of variables in the metal processing industry sample
Notes: The represented data includes that of 47 prefectures over 13 years (2004-2016).
Data: JITCO white paper, Basic Survey on Wage Structure and Labor Force Survey in 2004-2016,
and Pandect of Minimum Wages Determination (Saitei Chingin Kettei Yoran) in 2003-2015.

30
Table 4 OLS estimation on minimum wage implementation for newly hired first-year
trainees
Notes: It reports results for OLS estimation including prefectural dummy variables with the “number
of new trainee hires” as the dependent variable. It covers observation for 47 prefectures for 15 years
(2002-2016). All variables have been log transformed. Standard errors in parentheses are clustered at
the prefecture level. Robust standard errors are in parentheses; *** p<0.01, ** p<0.05, and * p<0.1.
Data source: See Table 2.

31
Table 5 Tobit estimation regarding minimum wage implementation for newly hired
first-year trainees
Notes: Average marginal effects for the Tobit estimates using the metal processing industry sample
including prefectural dummy variables with the “number of new hires of trainees” as the dependent
variable. This data represents the observation of 47 prefectures over 13 years (2004-2016). All
variables have been log transformed. Standard errors in parentheses are clustered at the prefecture
level. Robust standard errors are in parentheses; *** p<0.01, ** p<0.05, and * p<0.1.
Data source: See Table 3.

32
Table 6 Effects of minimum wage implementation on male full-time employees in
Japan
Notes: Standard errors in parentheses are clustered at the prefecture level. This data represents
observation of 47 prefectures over 13 years (2004–2016). We controlled for unemployment rate, labor
force, trend, prefecture effect, and prefecture-specific trend in the estimation. Robust standard errors
are in parentheses; *** p<0.01, ** p<0.05, and * p<0.1.
Data source: See Table 3.

33
Figure 1 Training process
Data source: JITCO. (n.d.). What is the Technical Intern Training Program, Retrieved August 10,
2019; https://www.jitco.or.jp/en/regulation/index.html/.
Figure 2 Changes in first-year trainees’ wages following the revision of the Immigration
Control and Refugee Recognition Act (hourly wage in yen)
Notes: Only average wages are shown.
Data source: JITCO white paper (2003–2015)

34
Figure 3 Distribution of new trainee hires in the metal processing industry
Data source: Author’ calculations based on JITCO white paper data (2005–2017).
Figure 4 Changes in trainee hires
Notes: Figure indicates the average of trainee hires among prefectures for each year.
Data source: Author’s calculations based on JITCO white paper data. (2003–2017).

35
(a) Average minimum wages (b) Log Kaitz index
Figure 5 Evolution of the minimum wage
Notes: The figure indicates the average hourly minimum wages (yen) and log of Kaitz index in
baseline model by prefecture for each year.
Data source: Author’s calculations based on Basic Survey on Wage Structure (2002–2016) and the
Pandect of Minimum Wages Determination (2001–2015) data.
Figure 6 Changes in trainee hires in the metal processing industry
Notes: The figure shows the average of trainee hires in the metal processing industry among
prefectures for each year.
Data source: Author’s calculations based on JITCO white paper data (2005–2017).

36
Figure 7 Evolution of the log Kaitz index (metal processing industry)
Data source: Author’s calculations based on the Basic Survey on Wage Structure (2004–2016) and
the Pandect of Minimum Wages Determination (2003–2016) data.
List of figure captions
Figure 1 Training process ..................................................................................... 33
Figure 2 Changes in first-year trainees’ wages following the revision of the
Immigration Control and Refugee Recognition Act (hourly wage in yen) .... 33
Figure 3 Distribution of new trainee hires in the metal processing industry........ 34
Figure 4 Changes in trainee hires ......................................................................... 34
Figure 5 Evolution of the minimum wage ........................................................... 35
Figure 6 Changes in trainee hires in the metal processing industry .................... 35
Figure 7 Evolution of the log Kaitz index (metal processing industry) ............... 36