the effects of noise on speech and … effects of noise on speech and warning signals s d tic ......
TRANSCRIPT
AD-A212 520 ,AD
Technical Memorandum 5-89
THE EFFECTS OF NOISE ON SPEECH AND WARNING SIGNALS
D TIC Alice H. SuterS ELECTEVN~ Gallaudet University
D June 1989
AMCMS Code 611102.74A0011
Approved for public release;distribution Is unlimited.
This report was prepared by Gallaudet University for the U.S, Army HumanEngineering Laboratory. This report has received a technical review by theHuman Engineering Laboratory but it has not received an editorial review by thelaboratory. This report is presented in the Interest of providing information in atimely manner.
U. S. ARMY HUMAN ENGINEERING LABORATORY
Aberdeen Proving Ground, Maryland
89 9 13 104

DISCLAIMER NOTICE
THIS DOCUMENT IS BEST QUALITYPRACTICABLE. THE COPY FURNISHEDTO DTIC CONTAINED A SIGNIFICANTNUMBER OF PAGES WHICH DO NOTREPRODUCE LEGIBLY.

AI
Destroy this report when no longer needed.Do not return It to the originator.
The findings in this report are not to be construed as an official Departmentof the Army position unless so designated by other authorized documents.
Use of trade names In this report does not constitute an official endorsementor approval of the use of such commercial products.
UNCLASSIFIEDSECURJIITY CLASSIFICATIO OF THI'S' PAUI•
Form ApprovedREPORT DOCUMENTATION PAGE OMBNo, 0704.0188
I& REPORT SECURITY CLASSIFICATION lb, RESTRICTIVE MARKINGS
Unclassified2a, SECURITY CLASSIFICATION AUTHORITY 3. DISTRIBUTION /AVAILABILITY OF REPORT-1 , ,,, I. DOW' SCHDUAppruved for public release;
I, L.A$ I ITON/DOWNGRADING SCHEDULE distribution is unlimited.
4. PERFORMING ORGANIZATION REPORT NUMBER(S) 5. MONITORING ORGANIZATION REPORT NUMBER(S)
Technical Memorandum 5-89
Go. NAM[ OF PERFORMING ORGANIZATION 6b OFFICE SYMBOL 7a. NAME OF MONITORING ORGANIZATION(If applicable)
Gallaudet University Human Engineering Laboratory
c.. ADDRESSI ('3ty, State. and ZIP Code) 7b. ADDRESS (City, Stott, and ZIP Code)
Washington, DC 20002 Aberdeen Proving Ground, MD 21005-5001
Sa. NAME OF FUNDIN4/$PONSORING 8b, OFFICE SYMBOL 9. PROCUREMENT INSTRUMENT IDENTIFICATION NUMBERORGANIZATION (It appllcable)
SC. ADDRESS(City, State, and ZIPCode) 10. SOURCE OF FUNDING NUMBERSPROGRAM PROJECT ITASK "WORK UNITELEMENT NO, NO, NO, ACCESSION NO,6.11.02 1L161102B7
11, TITLE (Indclde securIty -IfSaiication)
The Effects of Noise on Speech and Warning Signals
12, PERSONAL AUTHOR(S)Suter, Alice H.
13a. TYPE OF RE T 13 TIME COVERED 14 DATE OF REPORT (Year, Month, Day) 15. PAGE COUNTFinal FROM _....... TO 1989, June 55
16. SUPPLEMENTARY NOTATION
17, C ODATI CONS 18. SUBJECT TERMS (Continue on reverse if necessary and identify by block number)FIELD GROUP SUB-GROUP speech communication speech interference
23 02 warning signals masking
23 04 1 inteLligibility
It ABSTRACT (Continue on reverse if neceMAry and identify by block number)
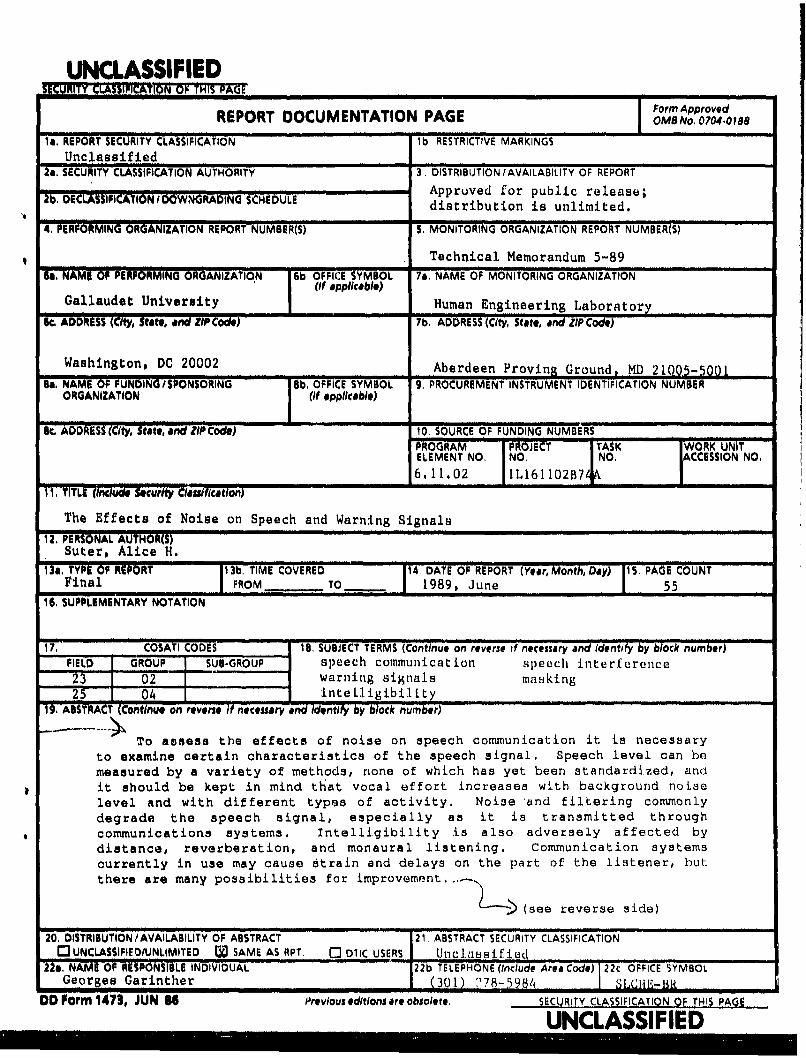
To assess the effects of noise on speech communication it is necessaryto examine certain characteristics of the speech signal. Speech level can bemeasured by a variety of methods, none of which has yet been standardized, ano
it should be kept in mind that vocal effort increases with background noiselevel and with different types of activity. Noise 'and filtering commonlydegrade the speech signal, especially as it is transmitted throughcommunications systems. Intelligibility is also adversely affected bydistance, reverberation, and monaural listening. Communication systemscurrently in use may cause strain and delays on the part of the listener, but
there are many possibilities for improvement... " (
L (see reverse side)
20, DISTRIBUTION/AVAILABILITY OF ABSTRACT 21. ABSTRACT SECURITY CLASSIFICATIONrUNCLASSIFIED/UNLIMITED W SAME AS RPT". .0 IIC USERS Unclasified
22m. NAME OF RESPONISBLE INDIVIDUAL " 22b TELEPHONE (Include Area Code) 22c OFFICE SYMBOLGeorges Garinther I (301) 278-598I LCIE-,
DD Form 1473, JUN 84 Previouseditionsare obsolete. SECURITY CLASSIFICATION OF THIS PAGE
UNCLASSIFIED
19. (continued)
9Individuals who need to communicate in noise may be subject to voicedisorders. Shouted speech becomes progressively less intelligible at highvoice levels, but improvements can be realized when talkers use )."clearspeeoch."L-Tolerable listening levels are lower for negative than for positiveS/Ns, and comfortable listening levels should be at a S/N of at least 5 do,and preferably above 10 dB.-,
Popular methods to predict speech intelligibilit4 in noise include theArticula9,Ja Inde*x/i? Speech Interference Level g), Speech TransmissionIndex 4+Gf4fJ and the sound level meter's A-weighting network. This reportdescribes these methods, discussing certain advantages and disadvantages ofeach, and shows their interrelations. ( 0-) <
Communication is considered "Just reliable" at an Al of 0.3 to 0.45although little evidence is available to support these criteria. Likewise,there is little information available on the specific types and amounts ofcommunication needed for various operations, and the only available evidenceon the consequences of degraded speech tends to be anecdotal or subjective.
Audible warning signals should be at least 15 dB but no more than 25 doabove masked threshold. Temporal, spectral, and ergonomic aspects shouldemphasize attention demand, relevance, and appropriate level of prioritywithout being unduly aversive.
AMCMS Code 611102.74A0011 Technical Memorandum 5-89
THE EFFECTS OF NOISE ON SPEECH AND WARNING SIGNALS
Accosloi For
Alice H. Suter I CRAMGallaudet University NTIC TA&I
Washington, DC CCaBndUnannouniced C3justific~ation
By__Distributlo, I
June 1989Availablity Codes
0lst IAvail and/orDit pecial
S I
APPROVED
D rector) eiman Engineering Laboratory
W44,
Approved for public release;distribution is unlimited.
This report was prepared by Gallaudet University for the U.S. ArmyHuman Engineering Laboratory. This report has received atechnical review by the Human Engineering Laboratory but it hasnot received an editorial review by the laboratory. This reportis presented in the interest of providing information in a timelymanner.
U.S. ARMY HUMAN ENGINEERING LABORATORYAberdeen Proving Ground, Maryland 21005-5001.

CONTENTS
1. INTRODUCTION ........................... 3
11. SPEECH VARIABLES ......................... 3
A. Speech Level................................................... 4B. Speech Materials.0 . .. 4-6 ............- 1...... *......... 5
C. Distortions.......................... I ......... I......... I...... 12
.Ill. TRANSMISSION CHARACTERISTICS .................. 6................... 14
A. Distance Between Talker and Listener .......................... 14B. Reverberation................................................ . 14C. Spatial L.ocation.............................................. 15D. monaural vs. Binaural Listening ............................... 15E . Telephone Listen~ing................................. 16
F. Communication Systems .......................................... 17
IV. TALKER AND LISTENER VARIABLES ...,. .............. ,. ,. . .......... 18
A. Talker Variables ............ * ..... .. . . . ,,....,.......... 10
2. Talker articulaLion .................................... 183. Gander..................................................... 19
B. Listener Variables............................................ 201. Preferred listening levels ... .#..........o._,..... 202. Non-native listeners........................ I......... I.... 213. Speecri recognition during a secondary task.,.,,,,........ 22
V.* PREDICTION METHODS ........... ............. _-........ _ 23
A. Articulation index ,.................,......,....,.....I...... 2.3B. Speech Interference Level..................................... 24C. Speech Transmission index .....................I.......... ..... 27D. Sound Level Meter Weighting Networks .......................... 29E. Relationships of Methods to One Anot~her .........,,..,...... 29
VI. ACCEPTABILITY CRITERIA ......- . ....... I,.......1, ...... ,.,I... 31
A. Minimal or "Just Reliable" Communication ...................... 31B. Recomrnendat ions for Various Environments~ and
*operations ...............!...................................UC. Consequences of Degraded Speech .........................., 33
*VII. DETECTION OF WARNING SIGNALS IN NOISE..............,.,....... 35
VIII. 3UMMARY........................................................... 141.
IX. RESEARCH RECOMMENDATIONS.......................................... 43
THE EFFECTS O NOISE ON SPEECH AND WARNING SIGNALS
I. INTRODUCTION
The effective communication of speech and warning signals is vital tothe success of a military program. The consequences of communication failarescan range from a minor irritation to a major disaster, depending on the
Simportance of the incorrectly perceived message. These communication Uý,.urrscan be costly in terms of mission objectives# equipment, and, in thlo extreme,human life. Adequate technology exists to permit effective communic, ,on inmost situations, but it is not always implemented. In some conditione, a highlevel of intelligibility is unnecessary because the communication task is verysimple. In others, however, highly intelligible communications are needed toconvey complex or unexpected messages in emergency situations. It inimportant to assess each communication situation so that the right balance canbe made between economy and program effectiveness. Unnecessary sophisticationin communication systems should be avoided, but too much emphasis on economycan lead to greater expense in the long run.
The purpose of this literature search and analysis is: (1) to elucidatethe present state of information on the effects of noise on the perception andrecognition of speech and warning signals) (2) to describe some of thecircumstances in which communication improvements or degradations may occur;and (3) to identify additional information collection or research projectsthat will improve speech and signal recognition in military environments.
To obtain an understanding of speech and warning signal communication inthe military context, it is first necessary to explore some theoretical andpractical aspects of communication, especially as it is affected by noise.The report will cover speech variables, namely speech level, materials usedfor testing communication systems, and distortions of speech by filtering andmasking. It will include a discussion of the transmission of speech fromtalker to listener, various talker and listener variables, such as the effectof non-native languages on both; and some of the more prominent methods forpredicting the effects of noise and other degrading factors on speechintelligibility. The report will conclude with discussions of criteria foracceptable communication and for warning signal detection, and a number ofrecomendations for future research.
II. SPEECH VARIABLES
The intelligibility of speech depends on a large number of variables.The framers of ANSI S3,14 (ASR, 1917) divide them into acoustic, non-acoustic,and random or quasirandom factors. Acoustic factors include the level andspectrum of the speech signal at the listener's ear; the level, apectral, andtemporal characteristics of the interfering noise; differences in the spatiallocations of the speech and noise sources; and reverberation effects. Non-acoustic factors include the talker's speech habits, the size of the messageset, the probability of occurrence of each unit, the listener's motivation andfamiliarity with the speech material, and visual cues. Random or quasirandom
3
factors, which set an "upward bound" on the precision with whichintelligibility can be estimated, include individual differences betweentalkers and listeners, day-to-day variations in their effectiveness, effectsof randomization in the choice of test material, random sampling errors, andthe listener's age and hearing sensitivity (ASA, 1977 p. 1).
A. Speech Level
Any predictions of speech intelligibility are likely to be influenced bythe procedure used to measure speech level. One of the difficulties is thewide dynamic range of speech, which is as much as 30 dB between the most andleast intense phonemes (Webster, 1984; Pearsons, 1983; Hood and Poole, 1977).Another is a satisfactory method of accounting for the pauses betweenutterances. Various measurement methods have been proposed. One of the mostpopular methods is the long-term rms level monitored with a sound level meteror a VU me-ter. However, this method involves a certain amount of subjectivejudgement, and, according to Pearsons (1983), the speech sample should be atleast 10 seconds long. Kryter (1984) maintains that the average A-weightedpeak level of each word measured with a sound level meter set on slow responseis approximately equal to the unweighted Leq. Pearsons (1983) believes thatthe integrating sound level meter or computer shows promise (see also Suter,1978), but points out that there are no standard techniques available.
Standardization is currently being considered by Working Group S3-59 forANSZ $3.38, "Measurement of Speech Levels" (ASA, 1986). A preliminary draftof this standard favors a method called the Equivalent Peak Level (EPL)developed by Brady (1968), with long-term rms measured in real-time as analternative. The EPL method consists of measuring the rms level above anarbitrary threshold and calculating the peak of a log-uniformly distributedspeech sample that would have the same rms level. The advantages of EPL arethat it is (1) expressed by a single number, (2) uninfluenced by silentintervals, (3) independent of the threshold setting of the speech detector,and (4) follows known lovel changes on a dB for dB basis (Brady, 1968).
Although the varilous methods identify different speech levels, therelationships between thKese levels are fairly uniform. Most investigationsshow the unweighted rms level to be about 4 dB above A-weighted rms level, andthe EPL to be 8 to 10 d1i above unweighted rms (Pearsons, 1983; Steeneken andHoutgast, 1978) . According to Kryter (1962a), speech peaks, defined as thelevel exceeded by only 1% of the speech signal, are equal to the rms level +12dB. The long-term rms level may be estimated by taking the average speechpeaks in quiet, measured with a sound level meter set on C-weighting and slowresponse, and subtracting 3 dB (Kryter, 1962a).
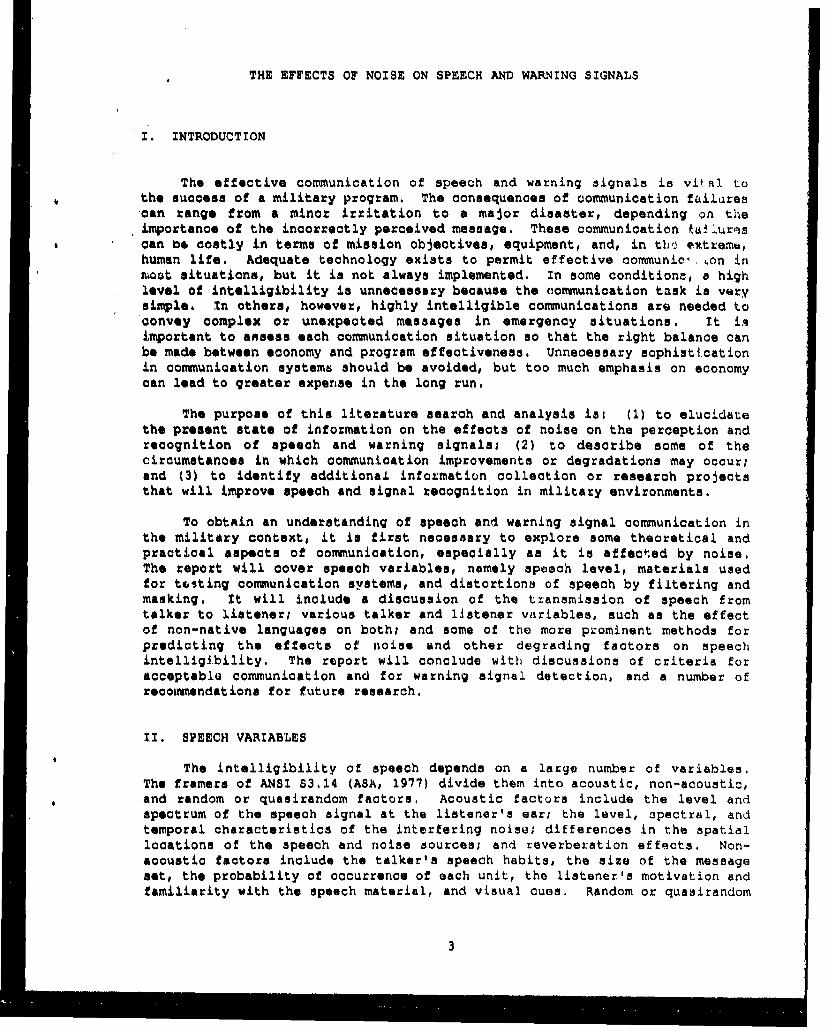
Speech level will change according to the vocal effort expended.Pickett (1956) found the range of vocal force varied from 36 dB, the level of* forced whisper, to 90 dS for a heavy shout. Figure 1 shows speech level asa function of vocal effort according to Pearsons et a.L (1977) and includingdata from Beranek (1954). The entire range extends from about 48 dB to 92 dB.
People will increase their vocal effort automatically with increasingdistance between talker and listener and with elevation in background noiselevel. Gardner (1966) found that people raise their voices approximately 2 dB
4
Preen Sturdy
so
24> 70 ,.V,
S60
0 ShadedArea00. i ndicates Standard
T, I!. D. eviaotion
50
Casual Normal kasd Laud Sh~out
V9 ý a I EffrF irtsi
Figure 1. Speech levels for various voca~l efforts.
Noe From Speanrh Lavalm in Varioug Woini FErvirnnmACnt. (EPA-600/1-77-025) byK. S. Pearsons, R. L. Bennett, and S. Fidell, 1977, U.S. EnvironmentalProtection Agency. Reprinted by permission.
5

with every doubling of distance between about 1 and 4 meters. Kryter (1946)
reports a 3-dB increase and Webster and Klumpp (1962) report a 5-da increase
for every 10-dB increase in background noise level. Webster and Klumpp (1962)
identified the same increase in vocal effort as a result of a doubling in the
number of talkers around a communicating pair (the "cocktail party" effect).
Pearsons and his colleagues (1977) measured speech levels in face-to-face
conversation at one meter, and found an increase of 6 dB for every 10 dB
increase in background noise level between 48 and 70 dB, above which talker
and listener moved closer together.
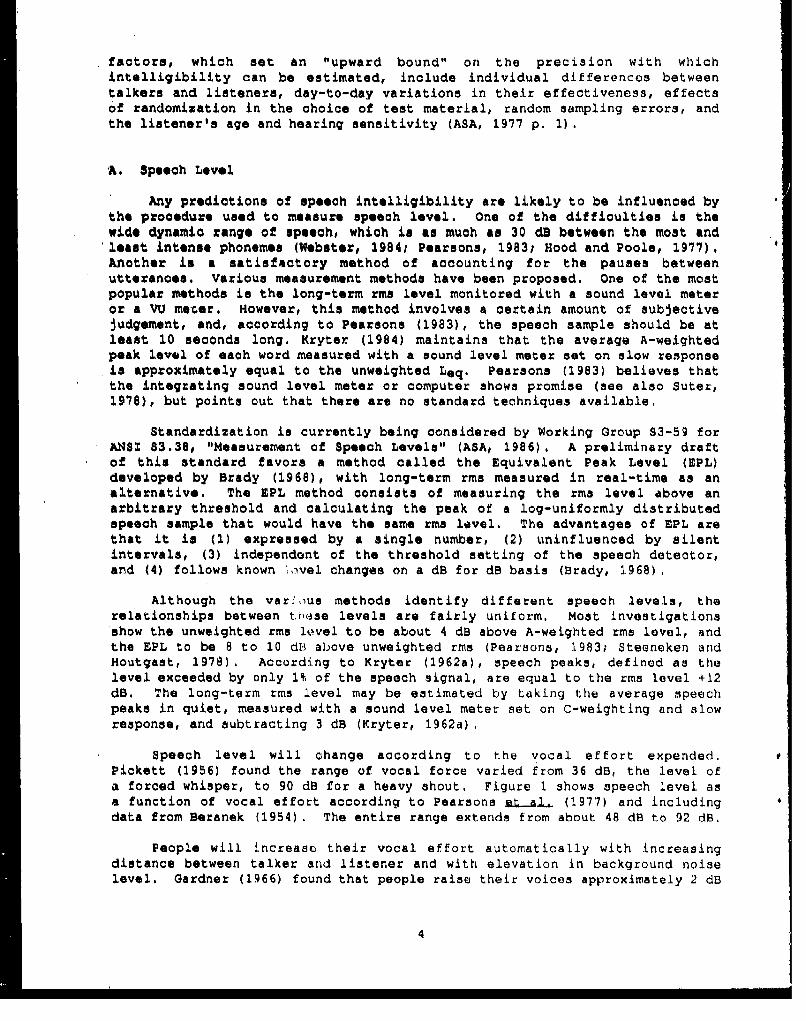
Changes in the speech spectrum and rate of utterance also occur as vocal
effort increases. Webster and Klumpp (1962) found that speech rate decreasedwith inoreasing noise level, although it tended to increase with increasingnumbers of competing talkers. Figure 2, also from Pearsons at.&L (1977),displays the definite shift toward higher frequency speech energy with
increasing vocal effort. People change their vocal effort according to their
activity, even without increases in background noise level. They tend to talk
louder when reading prepared text than they do in casual conversation, They
also raise their voices when talking before an audience, on the telephone, and
even in the presence of a microphone (Webster, 1984). On the basis of data
from van Heusden ait &I. (1979), Houtgast advocates distinguishing betweenpublic and private communication, with the former being 9 dB louder than the
latter (Houtgast, 1980). The intelligibility of amplified speech remains good
up to sound pressure levels as high as 120 dB, but as soon as noise isintroduced, even with a speech-to-noise ratio as favorable as 15 dB,intelligibility begins to drop off above a sound pressure level of 90 dB(Pollack and Pickett, 1958), overloading the auditory system is presumablyresponsible. Unamplified speech is another matter. Intelligibility falls offabruptly above a speech level of 78 dB, However at speech levels below 55 dB,intelligibility falls off gently at first and then abruptly (Pickatt, 1956).
B. Speech Materials
Spoken language contains numerous constraints, which add to itsredundancy and make it easier to understand. This is indeed fortunate for thehearing-impaired individual and for any listener in a time of emergency.These constraints result from any language's grammatical structure, thecontext of the word or mentence, limitations in vocabulary size, the length ofwords, and the listener's familiarity with the speech material. The greaterthe constraints, the higher the speech Intelligibility scores for the samespeech-to-noise ratio. An example of this is the relative intelligibI.I.ty of
specialized vocabularies, such as the ones used Ly air traffic controllers,
Frick and Sumby (1952) describe four steps of constraints in pilots' receiptof control tower messages: from an infinite set of possible messages onemoves to a set of alphabetical sequences, then to a set of English sentences,to air language with its own particular grammar, arid finally to the tower
messages with their own procedural constraints. The estimated redundancy withrespect to what could have been conveyed is 96%. The authors note that this
degree of redundancy is very inefficient in terms of information transfer, but-
they point out that communication systems tend t.) be noisy, and thecommunication link between pilot and control tower haa a low tolerance forerror, so redundancy provides an important form of insurance.
6
87.8
- - -.. L_
--- ---
. .... ,..,... Laud -60,.. - .
Ole wo ...
\10 .
IFI
7o ..7
Its too sit :5 00go 1 11D 1000 3150 &DOD 6000 Ig,500 10,000III to t oo 4 00 130 1000 oo1600 16 n 600 0000 &$o 1 ,000 ),O
ONE-THIRD OCTAVE BAND CINI ER FREOUENCI~bi IN Hi Ilrpe)
F'igure 2. Average speech 3pectra for male talker.s at five voc.ali erforts.
Noe From Speech LQveig In VarlowLs NiAJ F.InvronirtenLs (HL'A-6OO/l-77-O25) byK,. S. Pearmons, R. L,. Bennet t, and S . 'idaill, 19 7 7 U ,S. Isiv 11:o rimne nIta .Protection Agency. Reprinted by perinmiion,
7I

Intelliqibility increases directly as the number of possible words in amessage set decreases. Similarly, for a given amount of intelligibility, thespeech-to-noise ratio can be reduced with proportional decreases in the sizeof a message set. Miller at al. (1951) found that a dercrease in message sizefrom 256 to 4 monosyllables corresponded to a 12-dB decrease in speech-to-noise ratio. For this reason, "closed-set" tests, such as the Modified RhymeTest (House a a., 1965), yield better intelligibility scores than "open set"tests of monosyllabic words or nonsense syllables, for a given speech-to-noiseratio. Other investigations have shown that long words are morA intelligiblethan short ones (Rubenstein aeL., 1959), and two-syllable words are moreintelligible when the accent is on the second syllable (Black, 1952).
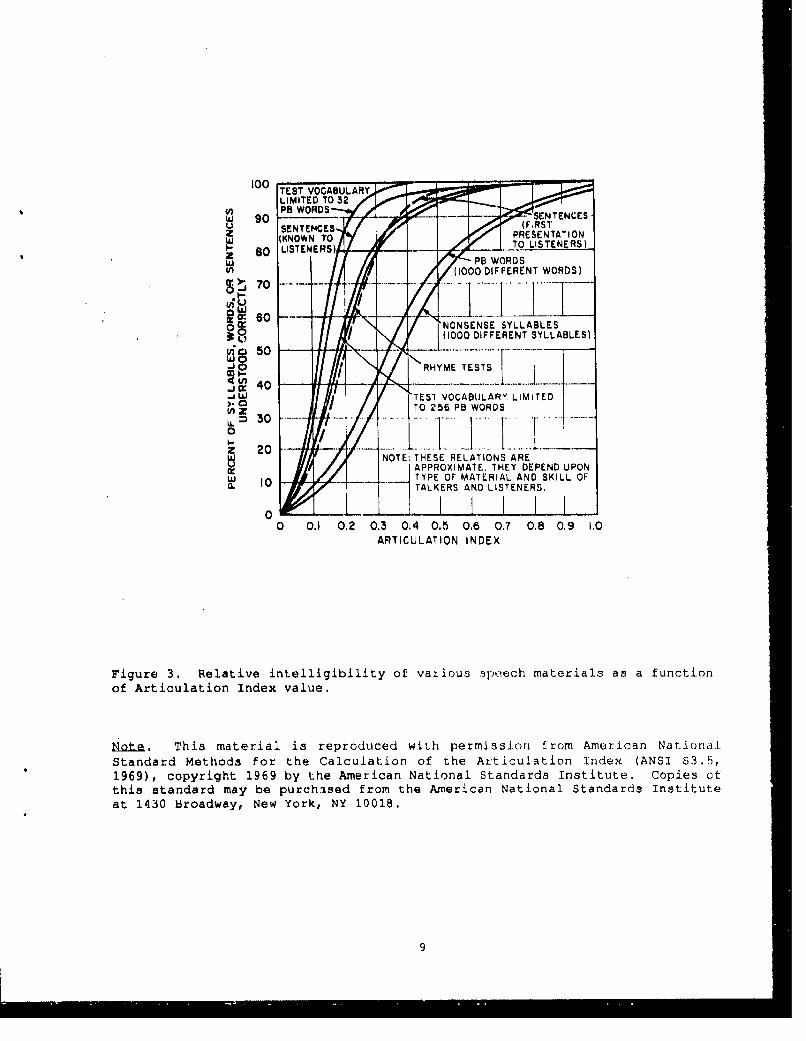
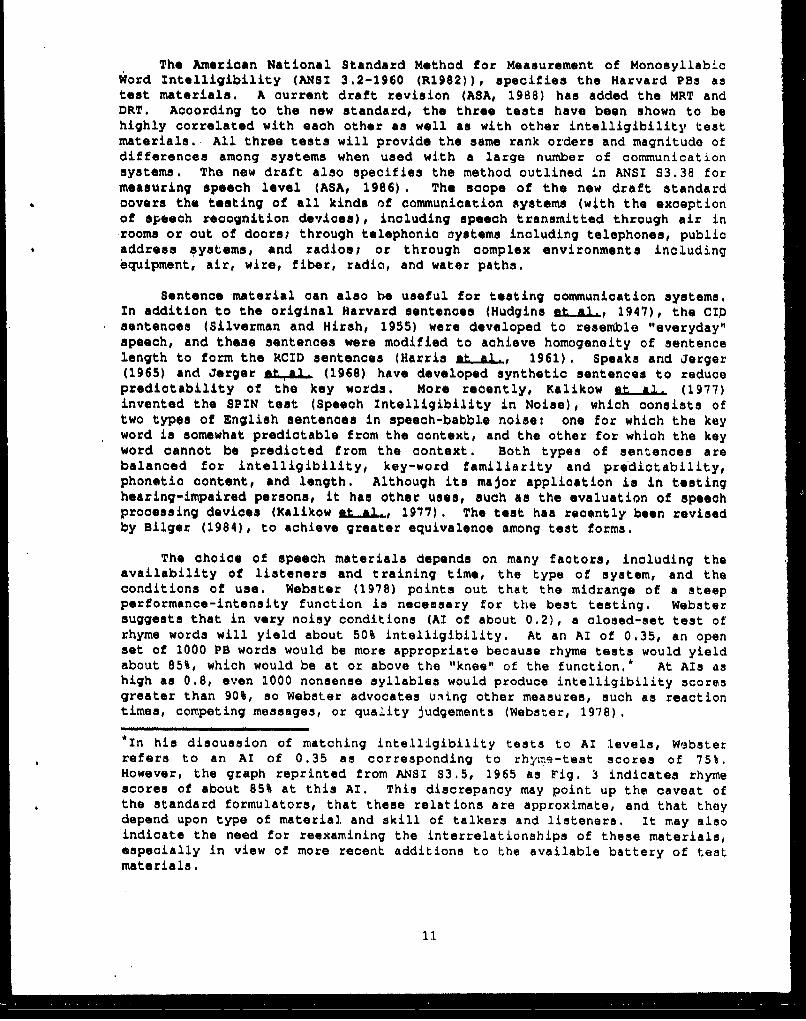
Figure 3 from ANSI 83.5 (1969) shows the relative intelligibility ofvarious speech materials as a function of speech-to-noise ratio (representedby Articulation Index values) . The order of difficulty is from the leastintelligible, 1000 nonsense syllables; to 1000 phonetically balanced (PB)words; to rhyme tests, 236 PBs, and unfamiliar sentences; to familiarsentences; to the most intelligible, a vocabulary limited to 32 PB words. Thecommittee cautions the reader that these relations are approximate, as theydepend on the type of material and the skill of talkers and listeners.
Features within words can cause some words to be more intelligible(resistant to masking or filtering) than others. For example, prosodicfeatures and vowels are more easily identified than consonants (Webster andAllen, 1972). Medial position phonemes are more intelligible than consonantsin the initial and final position and final consonants are more easilyidentified than initial consonants under adverse conditions (Clarke, 1965),
In an effort to improve the reliability of the Harvard list of PBs, Hoodand Poole (1977) noted that the intrinsic intelligibility of these wordscovered a range of at least 30 dB. (The authors considered this large range anecessary feature of a good intelligibility test.) By eliminating 5 "roguelists", Hood and Poole brought the performance-intensity functions of theremaining 15 lists into close agreement. During this procebs, they cnalyzodthe difficulty of all wcords in the 20 lists, having tested each word 36 timen.The result is a table, which lists the relative intelligibility of all of theHarvard PBs, from most intelligible (jam, our, rope, wild, and will) to leastintelligible (rave, fin, pun, and sup) . This table could be useful inassessing the difficulty of woods to be used in special phraseologies or fortesting the articulation of specific systems.
The helpful redundancy in speech is derived from a number of differentfeatures, as explained above. In other words, it is as if we may the samething in a variety of ways. The question arises, then, as to whether simplerepetition of the same word will increase its intelligibility. I nvestigationsof this question have produced moderately ericouiaging results. Miller e&L-.Al(1951) found that three successive presentations ot the same word Improvedintelligibility by 5 to 10%, depending on the speech.-to-noise ratio. Lazarus(1983) quotes a German colleagum (Platte, 1978 and 19'79) as finding that largevariances can be avoided by triple repetition. Using the Harvard PBs, Thwing(1956) tested the effects of one through four presentations of the same word(e.g., "Item 26: dog, dog, dog") at three speech-to-noise ratios. Theresults showed a slight improvement between the first and second presenta-
8
10TEST VOCABULARY
V) PS WORDS 0
I- I80 SETN - R
0 - C" D PERENTSYLLABISN
J. TI TE0i VOA OL LIS~TEDESTO I PA WORDS
70
OMIZNOTE N .HS RELAINS SLARLES(10PODIMAERENT THYLDEPEDLUPO
J RHYPE OMTERILT NDSKLLO
.j UITALKER VOANDAR LIST ITED5
AOTICUTESRLATION S ARDE
Figure ~ ~ ~ ~ ~ ~ ~ ~~APRXIAE 3HE DElativ iUelgbliPoONios~~e mtrasasafntooTYP ArtiMulationIndeSKvalue.
Figure Thi meatieritliiiaiis rerduefw~ permissio f5hmtrom l Arian Nafntionii
Standard Methods for the Calculation of the Articulation Index (ANSI S3.5f1969), copyright 1969 by the American National Standards Institute. Copies ofthis standard may be purchased from the American National Standards Instituteat 14:30 Broadway, New York, NY 10018.
9

tions, but nothing after that. The greatest inmprovement was at the mostfavorable speech-to-noise ratio. Other investigators found no improvement forrepetition of numbers (Moser at al., 1954) or nonsense syllables (Black,1955). Hood and Poole (1977) noticed that words duplicated (by chance) inseparate lists were missed on some occasions but not on others. They citeBrandy (1966) as finding the same result, and suggest that the cause lies inslight variations in the talker's voice production, not only among differenttalkers but at different times with the same talker. So, at least for words,there appears to be a moderately beneficial effect of at least one repetition.In view of the increased opportunity for talker variations, it would seemreasonable that these benefits would be somewhat greater for phrases and shortsentences.
As stated above, word familiarity is another important consideration inthe intelligibility of a spoken message. According to Rubenstein and Pollack(1963), intelligibility is a simple power function of the probability of aword's occurrence. In an effort to develop word lists with familiaritygreater than the Harvard PBs, Hirsh at al. (1952) developed the CID W-22 listof 200 familiar PBs, Peterson and Lehiste (1962) developed a CNC (ConsonantVowel Nucleus Consonant) list of 500 PBs, and Tillman and Carhart (1966)compiled the 200 words that comprise the NU Auditory Test 6, which wasdeveloped for and used extensively by the U.S. Air Force (Webster, 1972).
In a comprehensive compendium of speech testing materials, Webster(1972) discusses and reprints various speech materials and standardphraseologies used in testing communication systems. These include a selectedlist of Navy Brevity Code words, along with ICAO phonetic spelling words anddigit pronunciation (Moser and Dreher, 1955), a transcription of radiotransmissions of U.S. Naval aircraft over Vietnam (Webster and Allen, 1972),and a list of words frequently used in USAF aircraft compiled by DonaldGasaway. Gasaway's list includes statistics on word familiarity according toword-frequency counts from Thorndike and Lorge (1952), and a code showingwhether they are represented in various standard word lists and among BrevityCode words. Webster's compendium also includes lists of tactical fieldmessages from the U.S. Army Test and Evaluation Command (1971), 150 phrasesfrom the flight deck of aircraft carriers developed by Klumpp and Webster(1960), and lists of aviation maintenance/supply support messages developed byWebster and Henry (NAVSHIPS, 1972).
One of the difficulties involved in speech testing using large sets ofmonosyllables, such as 1000 Harvard PBs, is the fact that talker and listenercrews must be thoroughly trained. Webster (1972) states that such trainingtakes weeks to perform! In an effort to reduce or eliminate training time,Fairbanks and his colleagues developk d the closed-set Rhyme Test (Fairbanks,1958), which has gone through a series of modifications (House at al., 1965;Kreul Pt al., 1968) . An interesting innovation is the Tri-Word MRT (Williams,iat.....&L, 1976), where words are presented in triplets instead of individually.The principal advantage of this test is its speed: the investigators foundthat 51 words could be presented in only 2.3 minutes as opposed to 5 minutesfor the MRT. Another variation developed by Voiers (1967) is the DiagnosticRhyme Test (DRT), which can be used to identify the particular features ofspeech (in initial consonants only) that are affected by a communicationsystem.
10
The American National Standard Method for Measurement of MonosyllabicWord Intelligibility (ANSI 3.2-1960 (R1982)), specifies the Harvard PBs astest materials. A current draft revision (ASA, 1988) has added the MRT andDRT. According to the new standard, the three tests have been shown to behighly correlated with each other as well as with other intelligibility testmaterials.. All three tests will provide the same rank orders and magnitude ofdifferences among systems when used with a large number of communicationsystems. The new draft also specifies the method outlined in ANSI S3.38 formeasuring speech level (ASA, 1986) . The scope of the new draft standardcovers the testing of all kinds of communication systems (with the exceptionof speech recognition devices), including speech transmitted through air inrooms or out of doors; through telephonic systems including telephones, publicaddress systems, and radios; or through complex environments includingequipment, air, wire, fiber, radio, and water paths.
Sentence material can also be useful for testing communication systems,In addition to the original Harvard sentences (Hudgins at Al., 1947), the CIDsentences (Silverman and Hirsh, 1955) were developed to resemble "everyday"speech, and these sentences were modified to achieve homogeneity of sentencelength to form the RCID sentences (Harris aL..A., 1961). Speaks and Jerger(1965) and Jerger at.Al- (1968) have developed synthetic sentences to reducepredictability of the key words. More recently, Kalikow Lat l, (1977)invented the SPIN test (Speech Intelligibility in Noise), which consists oftwo types of English sentences in speech-babble noise: one for which the keyword is somewhat predictable from the context, and the other for which the keyword cannot be predicted from the context. Both types of sentences arebalanced for intelligibility, key-word familiarity and predictability,phonetic content, and length. Although its major application is in testinghearing-impaired persons, it has other uses, such as the evaluation of speechprocessing devices (Kalikow a , 1977). The test has recently been revisedby Bilger (1984), to achieve greater equivalence among test forms.
The choice of speech materials depends on many factors, including theavailability of listeners and training time, the type of system, and theconditions of use. Webster (1978) points out that the midrange of a steepperformance-intensity function is necessary for the best testing. Webstersuggests that in very noisy conditions (Al of about 0.2), a closed-set test ofrhyme words will yield about 50% intelligibility. At an AI of 0.35, an openset of 1000 PB words would be more appropriate because rhyme tests would yieldabout 85%, which would be at or above the "knee" of the function,* At Als ashigh as 0.8, even 1000 nonsense syllables would produce intelligibility scoresgreater than 90%, so Webster advocates uning other measures, such as reactiontimes, competing messages, or quality judgements (Webster, 1978).
*In his discussion of matching intelligibility tests to Al levels, Websterrefers to an AI of 0.35 as corresponding to rhyme-test scores of 75%,However, the graph reprinted from ANSI S3.5, 1965 as Fig. 3 indicates rhymescores of about 85% at this Al. This discrepancy may point up the caveat ofthe standard formulators, that these relations are approximate, and that theydepend upon type of material and skill of talkers and listeners. It may alsoindicate the need for reexamining the interrelationships of these materials,especially in view of more recent additions to the available battery of testmaterials.
11
SC. Distortions
According to Harris (1965), "...not more than half .he time in everydaylife do we listen to clearly enunciated speech in quiet." (p. 825).Distortions of speech, such as filtering and noise masking, are prevalent inall kinds of occupational environments and are common to many militarysituations, from offices and computer rooms to tracked vehicles andhelicopters.
Filtering of speech occurs when it is passed through almost anytransmission system, such as a telephone or a radio communication system.High-frequency speech sounds are most readily affected, with a resulting lossof consonant intelligibility. The effects of filtering are exacerbated byother distortions, particularly by background noise and hearing impairment.
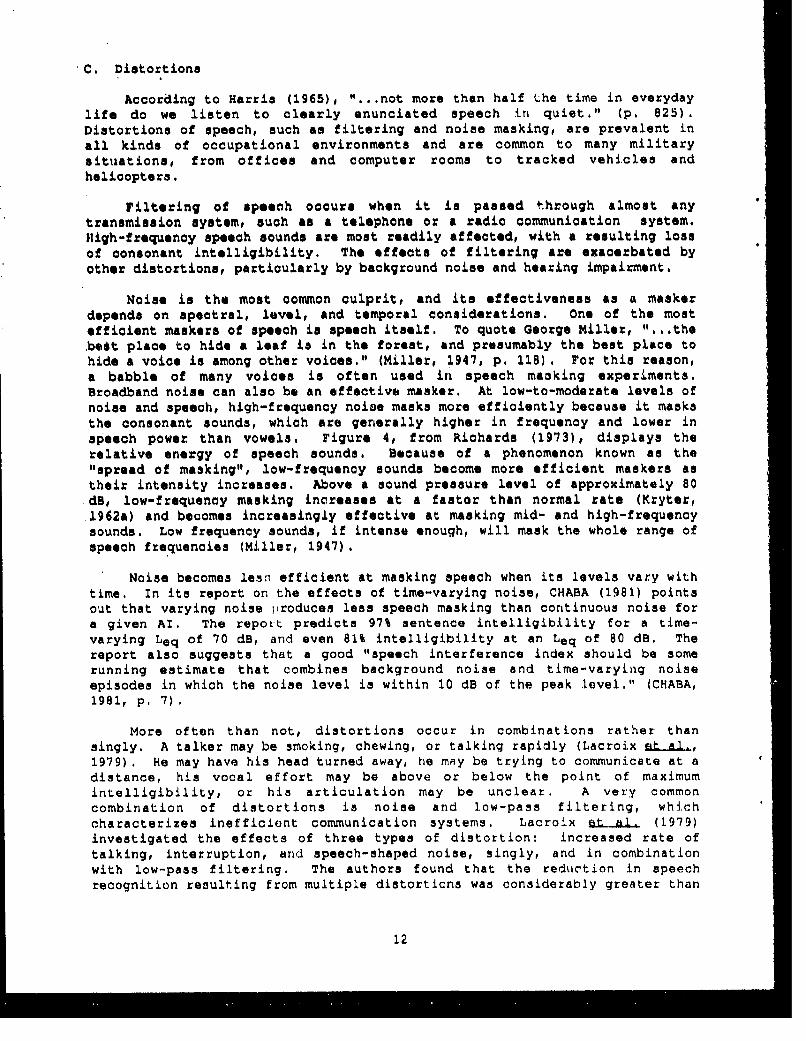
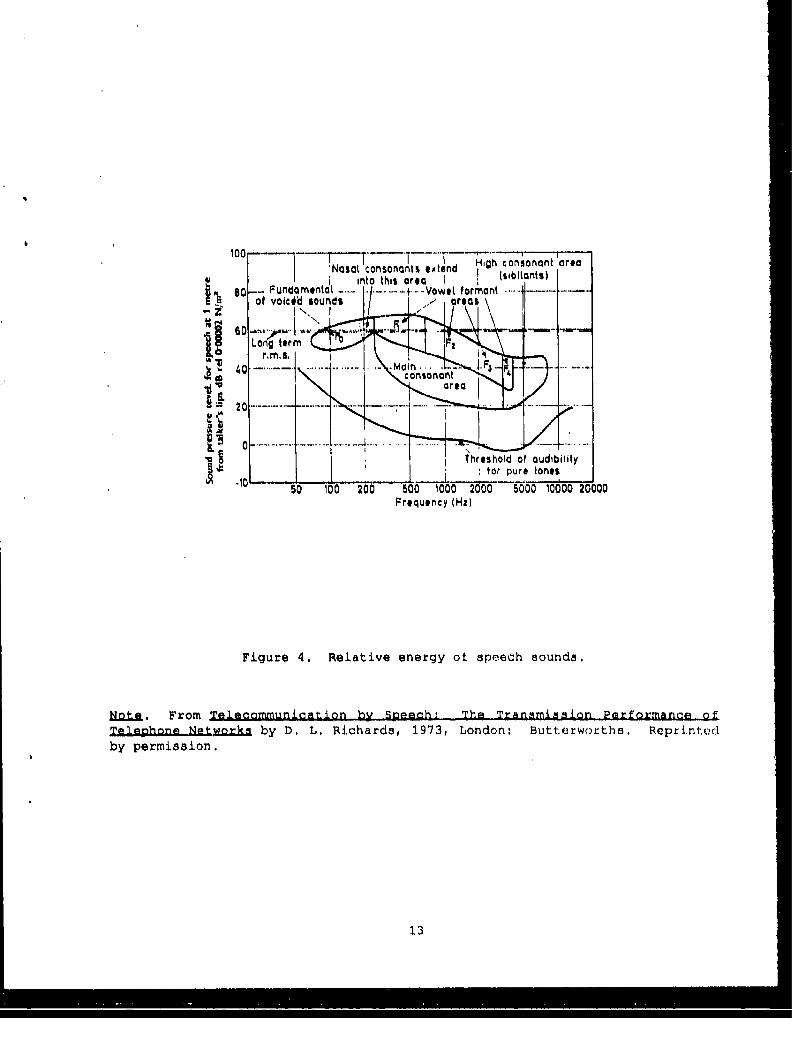
Noise is the most common culprit, and its effectiveness as a maskerdepends on spectral, level, and temporal considerations. One of the mostefficient maskers of speech is speech itself. To quote George Miller, "...thebest place to hide a leaf is in the forest, and presumably the best place tohide a voice is among other voices." (Miller, 1947, p. 118), For this reason,a babble of many voices is often used in speech masking experiments.Broadband noise can also be an effective masker. At low-to-moderate levels ofnoise and speech, high-frequency noise masks more efficiently because it masksthe consonant sounds, which are generally higher in frequency and lower inspeech power than vowels. Figure 4, from Richards (1973), displays therelative energy of speech sounds. Because of a phenomenon known as the"spread of masking", low-frequency sounds become more efficient maskers astheir intensity increases. Above a sound pressure level of approximately 80dB, low-frequency masking increases at a faster than normal rate (Kryter,1962a) and becomes increasingly effective at masking mid- and high-frequencysounds. Low frequency sounds, if intense enough, will mask the whole range ofspeech frequencies (Miller, 1947).
Noise becomes less efficient at masking speech when its levels vary withtime. In its report on the effects of time-varying noise, CHABA (1981) pointsout that varying noise produces less speech masking than continuous noise fora given Al. The repott predicts 97% sentence intelligibility for a time-varying Leq of 70 dB, and even 81% intelligibility at an Leq of 80 dB. Thereport also suggests that a good "speech interference index should be somerunning estimate that combines background noise and time-varying noiseepisodes in which the noise level is within 10 dB of the peak level." (CHABA,1981, p. 7),
More often than not, distortions occur in combinations rather thansingly. A talker may be smoking, chewing, or talking rapidly (Lacroix at al,,1979). He may have his head turned away, he may be trying to communicate at adistance, his vocal effort may be above or below the point of maximumintelligibility, or his articulation may be unclear. A very commoncombination of distortions is noise and low-pass filtering, whichcharacterizes inefficient communication systems. Lacroix a 1.• (1979)investigated the effects of three types of distortion: increased rate oftalking, interruption, and speech-shaped noise, singly, and in combinationwith low-pass filtering. The authors found that the reduction in speechrecognition resulting from multiple distortions was considerably greater than
12
¶00 . . . " - . , ... .Noa cosnat extend High consonant area
I i .nto this orea n H o, (sibilonts).s --. Fu,,,mntot .. .. . ..-Vow#( ,orm.ont
voicild sounds , a reas
Long terr ..r ..f•'• ••
0 consionant
20-
ii I • Thres ho~d of a.udibilhty
[ ! ' I i for pure tones.so 100 200 500 1000 2000 5000 10000 20000
Frequency (1-1)
Figure 4. Relative energy ot speech sounds.
Note. From Telecommunication by Speach! Tha Transmission Performance ofTelephone Netwdorks by D. L. Richards, 1973, London: Butterworths. Reprinted
by permission.
13
an additive effect. According to Lacroix and his colleagues, these results
corroborated similar findings of earlier investigations (Licklider and
Pollack, 1948; Martin, Murphy, and Meyer, 1956; Harris, 1960).
III. TRANSMISSION CHARACTERISTICS
A. Distance Between Talker and Listener
Early criteria developed by Beranek (1950) gave estimated "speechinterference levels" (SILs) as a function of distance and vocal'effort. Based
on communication in the free field, they show the expected 6-dB decrease inSIL for a given intelligibility with every doubling of distance. However,
speech intelligibility will not deteriorate with distance as quickly as might
be expected from the 6-dB per doubling rule because people will increase their
vocal effort with increasing distance. Also, the 6-dB rule is inappropriate
for indoor spaces because of room reverberation and other factors. Schultz
(1984) has developed a formula for predicting sound propagation indoors, basedon the frequency and sound power level of the source, room volume, and thedistance from the source. Modifications to the SIL for vocal effort,reverberation, and other factors will be disnussed in greater detail in asubsequent section.
Garinther and Hodge (1987) point out that individuals use a
"communicating" voice level, meaning that they raise their voices as they feel
necessary according to the distance at which they need to communicate. They
cite research by Gardner (1966) to support their estimate of a 2.4 dB increase
in vocal effort for each doubling of distance. An investigation of the
effects of wearing a gas mask and hood showed that individuals use slightlyhigher voice levels in this condition, and raise their voices approximately1.5 dB per doubling of distance (Garinther and Hodge, 1987).
B. Reverberation
Although reverberation is a necessary feature in concert halls and
auditoriums, the prevailing thinking on the subject nowadays is that itseffects on speech are virtually never beneficial. Early reverberations seem
to have little adverse effect if they arrive during the production of the same
sound (Nabelek, 1980), but Webster (1983) and other investigators he cites
(Mankovsky, 1971: Kuttruff, 1973) believe that all reflections are
detrimental. In a study of the influence of noise and reverberation on speech
recognition, Nabelek and Pickett (1974) found that a change in reverberation
time of 0.3 second produced a substantial decrease in speech recognition,
equivalent to a 2- to 6-dB increase in noise level. The investigators used
two types of noise: one consisting of 16 impulses/second and the other a
babble of 8 talkers. Nabelek has reported that a degradation of speech
perception in quiet .- curs at reverberation times longer than 0.8 second, and
that the amount of the deqradation depends on the size of the room (and
therefore the temporal distribution of reflections), the type of speech and
noise, and the listener's distance from the source (Nabelek, 1980).
14
In an attempt to test the effects of small room reverberation andbinaural hearing on normal and hearing-impaired subjects, Nabelek andRobinette (1978) found a significant decrease in speech recognition scoresbetween a reverberation time of 0.25 to 0.5 second, and concluded that theadverse effects of reverberation are greater in small than they are in largerooms. A table comparing their data to those of other researchers shows thatthe effect of reverberation on speech recognition may vary anywhere from 0% to34.8%, depending on reverberation time, presence or absence of noise, andmonaural or binaural listening (Nabelek and Robinette, 1978, p. 246). Theauthors also discuss an experiment using computer simulated reverberationconsisting of a direct sound followed by 5 reflections, decreasing at a rateof. 6 dB per reflection. Unexpectedly, the results failed to show astatistically significant difference between speech recognition scores forthree simulated reverberation times. In a later simulation, Nabelek (1980)did find .a difference between non-reverberant and computer simulatedreverberant conditions of 9% in the scores of hearing-impaired subjects. Thissimulation had been developed by Allen and Berkley (1979), whose FORTRANprogram may be used to simulate a wide range of small-room acousticalconditions.
C. Spatial Location
The location of the speech and noise sources may also have an effect onspeech intelligibility. The most difficult condition occurs when speech andnoise are coming from the same direction. Generally, as the angle ofseparation becomes wider, intelligibility increases for a given speech-to-noise ratio. Plomp (1976) reports that with the speech signal coming from 00azimuth, people could tolerate a decrease of approximately 5 da in speech-to-noise ratio for the same intelligibility when the noise was moved from 00 to135 azimuth. This finding occurred in non-reverberant conditions. Effectswere less dramatic as reverberation time increased from 0 to 2.3 sec.
D. Monaural vs. Binaural Listening
Nature has provided us with two ears for reasons in addition toredundancy. Binaural hearing enhances our sense of a sound's location, and itincreases our ability to recognize speech sounds in a reverberant space. Weare able to do this by discriminating small differences in signal phase andtime of arrival at the two ears. This ability is considerably better forfrequencies below rather than above 1500 Hz (Littler, 1965).
Different investigators report different amounts of improvement or"binaural gain", defined as the difference in speech-to-noise ratio for agiven speech recognition score. The amount of improvement depends on suchaspects as reverberation, the type of masker, the spatial location of thespeech and noise, the listener's hearing sensitivity, and the presence orabsence of amplification. MacKeith and Coles (1971) report a 3- to 6-dBimprovement from binaural sufmation alone (at or slightly above threshold),Nabelek and Pickett (1974) found improvements of 4 to 5 dB, unaided listeningin reverberant conditions, but the gain was only 3 dB when listening throughamplificatl*on. The binaural advantage appears to be greater for normalhearing than for hearing-impaired people (Ndbelek and Robinette, 1978),
15
although the hearing-impaired will experience a peculiar summation when thehearing threshold levels for the two ears are dissimilar according tofrequency (MacKeith and Coles, 1971).
Levitt and Rabiner (1967) have developed a met'hod for predicting thegain in intelligibility due to binaural listening. They estimate the maximumbenefit for single words in high-level white noise is about 13 dB, while athigh intelligibility levels the benefit will be only about 3 dB (fromsummation). The authors suggest that binaural gain might be greater withspeech as a masker, since Pollack and Pickett (1958) found advantages up to 12dB. With respect to directionality, Plomp (1976) found that there was abinaural gain of about 2.5 dB ovqr the monaural condition when the noise wason the side of the occluded ear , 'and a greater gain when the masking noise wason the aide of the open ear. These advantages were fairly constant,irrespective of reverberation and azimuth of the masker. However# the data ofNabelek and Robinette (1978) and Nabelek and Pickett (1974) show sizeableincreases in binaural advantage with a doubling of reverberation time.
E. Telephone Listening
Telephone circuitry filters the speech signal on both the low and highends of the spectrum, such that the spectrum rises gradually from 200 Hi to apeak of about 000 Hz, with a gradual decline to 3000 Hz and a precipitous dropthereafter (Richards, 1973). Without the advantage of high-frequency speechinformation or binaural hearing, noise, either in the system or in thelistener's environment, can be problematioal, Noise in the listener'senvironment further disrupts telephone listening in that it is amplifiedthrough the same mechanism that enables talkers to monitor their voice levels,"side-tone feedback" (Holmes a.LjL., 1983).
In an effort to evaluate the influence of a noisy background ontelephone listening, Holmes Al.a (1983) tested the ability of normal hearingsubjects to hear ape, -ýh through a standard "500" handset. Speech waspresented at a sound prý saure level of 86 dB (the average level of telephonespeech according to tht authors) in backgrounds of multi-talker babble andwhite noise at 65, 75, id 85 dB in five telephone conditions: transmitteroff, transmitter occludt,•A by the listener's palm, contralateral ear occluded,control (normal listenini itnode), and transmitter off plus contralateral earoccluded, The results showed no significant differences among conditions whenthe noise was at the 65 dil level, but for the less favorable speech-to-noiseratios, significantly poorer speech recognition scores were obtained duringthe control and contralateral ear occluded positions than during thetransmitter off and transmitter occluded positiona, The authors conclude thattelephone listening can be improved by occluding the transmitter, but no helpis derived from the popular remedy of occluding the opposite ear, Holmes andher colleagues also found that amplifid telephones irdprove speech recognitionbecause increases in thu level of side-tone feedback are non-linear withrespect to increases in signal level, They found that if the telephone'soutput was increa:;ed by as much as 20 dB, the side-tone feedback increased byonly about 4 to 7 dB. Thus, the speech-to-noise ratio would be morefavorable, and indeed thi.y found that speech recognition scores using anamplifier showed smaller differences between the tran.smitter occluded and
16

unoccluded positions, causing the authors to recommend amplifier handsets asanother remedy for telephone listening in noise.
F. Communication Systems
Communication systems have been specially designed for military andindustrial use where high levels of background noise are common. Certainfeatures have been developed to enhance the communicatiozn process in noiseenvironments. Circumaural earcups house the receiver, providing attenuationof up to 20 to 30 dB, depending on frequency and on the efeectiveness withwhich they are worn. The process of electronic peak clipping aidsintelligibility by boosting consonant energy in relation to vowels, but thebenefits of this process are limited 'vhen noise accompanies the signal(Kryter, 1984). The noise cancelling microphone is a useful innovation, asare improvements in circuitry such as the "expander/compander" circuitrydescribed by Mayer and Lindburg (1981).
Despite recent improvements, Mayer and Lindburg (1981) contend that mostcommunication systems in use today are based on design concepts that are over50 years old. The 300-3000 H& bandwidth allows inslifficient intelligibilityin noise, such that aviators sometimes need to take the time to use thephonetic alphabet - time that they can ill afford to spend. Mayer andLindburg state further that peak clipping in typical noisy conditions canproduce a distortion of the signal of up to 50%, degrading speechintelligibility to the extent that all the gains from this process are lost.They cite a worst case condition where peak clipping can almost destroy theintelligibility of a high amplitude "panic message", In addition, thoymaintain that current test procedures are outmoded. The 6cc coupler is notappropriate for circumaural earoups. ABA standard 1-1975 procedures areinappropriate because real-world, high noise environments lead to a "pumping"action on the earcup, causing the ear cushion to be lifted off the ear, withresulting acoustical leaks. Finally, Mayer and Lindburg state that theequipment used to test the noise cancelling microphone (the Kruff Box) is notan adequate simulator of the aircraft noise environment.
Mayer and Lindburg (1981) proceed to describe their newly developedtest procedures and communication system. The test consists of "real head"attenuation in pink noise with two microphones, one outside and one beneaththe earmuff. The system, C-10414 ARC Intercommunication Control has anincreased bandwidth (300-4500 Hz) with a relatively flat rumponse, and uses"expander/compander" circuitry, fast-.acting automatic gain control, and anoise cancelling microphone. This kind of research and development will becontinued under a program entitled The Voice Recognition and Response forArmy Aircraft (VRAA).
Such a program also exists in the Air Force, The Voice CommunicationResearch and Evaluation System (VOCRES) has been described by McKinley (1981)as a laboratory system replicating cockpit communication and environmentalconditions, where the elements that can be varied include: microphones,earphones, helmets, oxygen masks, aircraft radios, ambient noise, Jammingsignal type and modulation, jammer-to-signal power ratios, and receiver inputdata.
17
IV. TALKER AND LISTENER VARIABLES
A. Talker Variables
1. Vocal effort and fatigue
Although people readily raise their voices in a noisy background or whenseparated by distance, there is a limit to the length of time they can andwill maintain an increased vocal effort. Pickett (1956) identified thehighest level, measured at one meter, that could be sustained without painfulvoice fatigue as 90 dB, and, regardless of fatigue, the highest absolute levelwas 100 to 105 d3. However, as Webster and Klumpp (1962) have indicated,people will be reluctant to expend a vocal effort beyond 78 dB for more than abrief period of time, even in higher noise levels. They call this the"asymptotic speech level" (Webster and Klumpp, 1962).
Rupf (1977) assessed subjective estimates of the length of time peoplecould talk in noise before their voices would become unduly strained. Hefound that on the basis of 5-minute conversations in noise, about half thepeople believed they could talk for one hour in A-weighted levels of 75 dE, 30minutes in 80 dB, 15 minutes in 85 dR, and 7 minutes in 90 dB, However, whenasked to rate the feasibility of conversing during these 5-minute segments,the 50% level of acceptability fell at an A-weighted level of 83 d9.
Discomfort is not the only adverse effect of talking in high noiselevels. Reports of noise-exposed workers show an abnormally high incidence ofvocal cord dysfunction (vocal nodules, chronic hoarseness, etc.) among workerswho need to communicate as part of their work (Anon., 19791 Klingholz ata&L.,1978: Schleier, 1977). Klingholz atl, (1978) found that 70% of laboratorysubjects produced "pathological phonation" in A-weighted noise levels of 90 dBand above, and virtually all subjects did in levels above 95 dB. Clinicalevidence of vocal disorders in noise-exposed workers with speech-intensivejobs showed that the disorders tended to occur between the third and seventhyear of work (Klingholz atAIl, 1978).
2. Talker articulation
The talker's speech patterns can have considerable influence on theintelligibility of speech. Common sense tells us that people with a foreignaccent, strong regional dialect, or just generally sloppy articulation will bemore difficult to understand than people with standard dialect and carefulenunciation. Borchgrevink (1981) alludes to potential air traffic safetyhazards when controllers speak in foreign accents, "with errors in phonemepronunciation and prosodic features." (p. 15-3), Picheny ea.Al. (1985) gavea short review of the benefits gained by training personnel to articulateclearly, They cite Snidecor t l.al (1944) as finding that drilling subjectsto mimic the speech of a trained talker, as well as prompting them to talklouder, more clearly, and to open their mouths more, improved communicationover military equipment. Similarly, Tolhurst (1955) was able to improve theintelligibility of speech in a noisy background by 10% when the talkers woreinstructed to speak more intelligibly, In another experiment, Tolhurst (1957)
18

found that by either decreasing speech rate or by increasing clarity, he wasable to improve intelligibility by as much as 9% (see Picheny of,.l., 1985).
Picheny and his colleagues (1985) studied the effects on hearing-impaired listeners of conversational versus clear speech. Listeners werepresented via headphones with short nonsense sentences dt comfortablelistening levels. When using the clear speech mode, talkers were instructedto enunciate consonants carefully, to avoid slurring words togethLr, and toplace stress on adjectives, nouns, and verbs. They were encouraged to talk asif they were speaking to a hearing-impaired listener in a noisy environment.Although listeners reported that the clear speech was tiring because it wasspoken more slowly (sentences were approximately twice as long in the clearspeech mode), the average improvement in intelligibility scores was 17%.
In a second article on the subject of clear speech, Picheny at al,(1986) presented an acoustical analysis of clear speech and the differencesbetween the clear and conversational speech modes. They found that theincrease in clear speech duration is achieved by lengthening the individualspeech sounds as well as by inserting or lengthening pauses. They also foundthat clear speech is characterized by the consistent articulation of stop-burst consonants, and all consonant sounds at the end of words, both voicedand unvoiced. Although changes in the long term speech spectrum were small,the intensity for obstruent sounds (breath obstructed), appears to be up to 10dB greater in clear than in conversational speech. The authors note that todate there is no hard evidence that isolates the most important acousticalfactors in differentiating between clear and conversational speech.Consequently, they suggest the development of a model that will permit thesynthetic manipulation of variables known to be important. In this way, "onecould gradually transform conversational speech into clear speech by varyingone parameter at a time .... " (Picheny a._al., 1986, p. 444).
Mosko (1981) studied the effect of clear speech on radio voicecommunications with normal listeners. Listeners were trained to "over-articulate" for a period of 3 to 4 days. For speech material, Mosko chosedigit sequences and words that commonly occur in aircraft communications,presented in quiet and in noise. Again, the duration of the clear speechsegments was up to twice as long as the normal utterances, and intelligibilityshowed a 16% to 18% improvement in quiet. Preliminary data from the noiseconditions showed an improvement of 6% to 8% at a speech-to-noise ratio of 0dB. In the discussion following his paper, Mosko points out that the speechof people using radio communication systems tends to deteriorate over time.
You can almost chart how long they have been on thejob by the deterioration in their speech and you noticethis time and time agnin. When you train people to useradios.. .they should be professional talkers. (Mosko,1981, p. 4-6)
3. Gender
There has been some controversy about the relative intelligibility ofmale and female voices. While the female voice is probably no lessintelligible in most circumstances, it may be somewhat more difficult to
19
understand in high noise levels when it is lower in sound energy. Pearsons .tal. (1977) found the female voice to be 2 do lower than the male voice in the"casual," "normal," and "raised" modes, 5 do lower in the "loud" mode, and 7dD lower in "shout". They maintained that their data did not supportBeranek's (1954) recommendation that background noise be reduced consistentlyby 5 dB to accommnodate female talkers. In a study of speech materialsprocessed through Air Force cormmunication systems, Moore at,.a.I. (1981) foundsmall but systematic differences in the intelligibility of male end femalevoices in high levels of background noise. While there was little differenceat sound pressure levels of 79 and 95 do, male voice intelligibility was 6.8%greater in 105 do and 9.5% greater at a noise level of 115 dB. The authorswere not sure whether the cause was that the high-frequency content of femalespeech was more easily masked, or because of the differences of vocal outputwith increasing levels of backguound noise.
B. Listener Variables
1. Preferred listening levels
Although quite high levels of speech can be tolerated with little or noloss of intelligibility if the speech is amplified and if the speech-to-noiseratios are sufficiently high, people prefer to listen to speech within acertain range of levels. A study by van Heusden ah &1- (1979) explores therelationships between selected listening levels in the sound field for speechand background noise. Using a Bekesy "up-down" adjustment method, listenerswere instructed first to find the preferred speech level, as if listening to aradio, and later to find the minimum required level for understanding speech,(No details are given for the criteria for "understanding".) Speech andspeech-shaped noise were presented through separate loudspeakers. A-weightednoise levels were 40, 50, 60, and 70 do and quiet. The results showed averagepreferred speech levels of 49 dB(A) in quiet, and 61 dB(A) in noise, with aslope of 3.1 do per 10 dB increase in background noise level -- above about 35dB(A). "Minimum" speech levels were identified as 25 dBUA) in quiet, andabout 54 dB(A) in the 70-dB(A) noise condition, with a slope of 6.4 dB per 10dB increase in noise level above 40 dB(A). The investigators concluded thatpeople prefer to keep about the same (subjective) loudness level of speech innoise as they experienced in quiet, although this level w.ll not guarantee thesame level of intelligibility.
In a follow-up study by Pols tAl..a (1980), the same group ofexperimenters studied preferred listening levels for speech as a function ofmodulation frequency in fluctuating noise. Experimental conditions weresimilar, except that the noise, which was typical of community noise, wasmodulated at frequencies of 0.1, 0.3, 1 and 5 Hz. Also, subjects used aslightly different psychophysical method, which gave them somewhat more timein which to make their selections. The results 'showed that modulationfrequency had a negligible affect on the selection of preferred listeninglevel, so long as the equivalent sound level was constant among noise stimuli.However, the identified preferred levels were about 10 d8 higher than in theprevious experiment, and the slope of the curve was 5 dB per 10 dH increase innoise level above 35 dB(A), rather than 3.1 dB. Pols and his colleagues offerno explanation for the difference in slope, but they believe that thedifference in level may be due to the difference in adjustment methods. In
20
this experiment, the method may have led to the identification of the moatcomfortable listening level, whereas in the previous experiment the levelsidentified would have reflected the 4aLa comfortable level, Pols at. al.hypothesize a similar explanation for other such discrepincies they noted inthe literature. This leads them to conclude that preferred listening levelsare better described by a range of levels than by single numbers.
Investigations of preferred listening levels under earphones haveproduced somewhat higher levels, but there is considerable variation amongstudies, Beattie atl, (1982) measured most comfortable listening levels(MCL) in quiet, and in white noise levels of 55, 70, 85, and 100 dB SPL. Theslope of the MCL, 5.3 dB per 10-dB increase in noise level, was similar tothat of Pols at al, (1980), but the mean identified levels were much higher-82.5 dB in quiet, and 90.9 dB and 100.3 dB in noise levels of 85 dB and 100 dorespectively. Beattie and his coworkers point out that there is a wide rangeof MCLo reported in the literature, Varying from a low of 42 dB SPL in a studyby Schaenman (1965) to a high of 91 do found by Lofties (1964). Thediscrepancies seem to be due mainly to differences in instructions andpsychophysical methods of threshold determination (Beattie at al., 1982). Onefactor that would account for a portion (about 6 dB) of the difference betweenthe results of Beattie a•t.s and the work of van Heusden aL-aL (1979) andPolo at-al, (1980), is the difference in thresholds of sensitivity betweenlistening in the sound field and under earphones. Another factor would be theuse of A weighting by van Heusden and Pole, which would account for anadditional 4 dB when compared with unweighted sound pressure levels, and stillanother is the use of higher noise levels by Beattie at a.., which would belikely to induce listeners to raise speech levels.
In the above experiments, subjects were presented with a fixed level ofnoise and were permitted to adjust the preferred listening level separately,In a subsequent experiment (Beattie and Himes, 1984), subjects were presentedwith a fixed speech-to-noise ratio (under earphones) and asked to identifyMCLs, adjusting the speech and noise together, as they would when listeningthrough a hearing aid or a communication system. The investigators found MCLsthat ranged from 78 dB SPL in a speech-to-noise ratio of -10 to 83 do SPL in aspeech-to-noise ratio of +10, Upper ranges of comfort, defined as the pointat which listening would be uncomfortable if the level were any louder, were93 d8 SPL for a speech-to-noise ratio of -10, and 98 dB SPL in quiet.Although there was a great deal of individual variability, it is interestingto note that people will include higher levels of speech within the comfortzone, so long as they do not have to contend with too much noise.
2. Non-native listeners
Degraded communication can occur when listeners, as well as taikers, unea language which is not their native tongue, Using shqrt, high-predictability
and low-predictability sentences (the SPIN test), Florentine (1985) tested 11native and 14 non-native but fluent-in-English listeners. She found that thenative listeners were able to obtain 50% performance levels at significantlylower speech-to-noise ratios (about 3 dB) than the non-native listeners,Likewise, Nabelek (1983) found differences between native and non-nativelisteners as a function of reverberation. In a reverberation time of 0.4second, non-natives scored 6% lower, and with reverberation times of 0.8 to1.2 second, they scored 10% lower than native listeners.
21
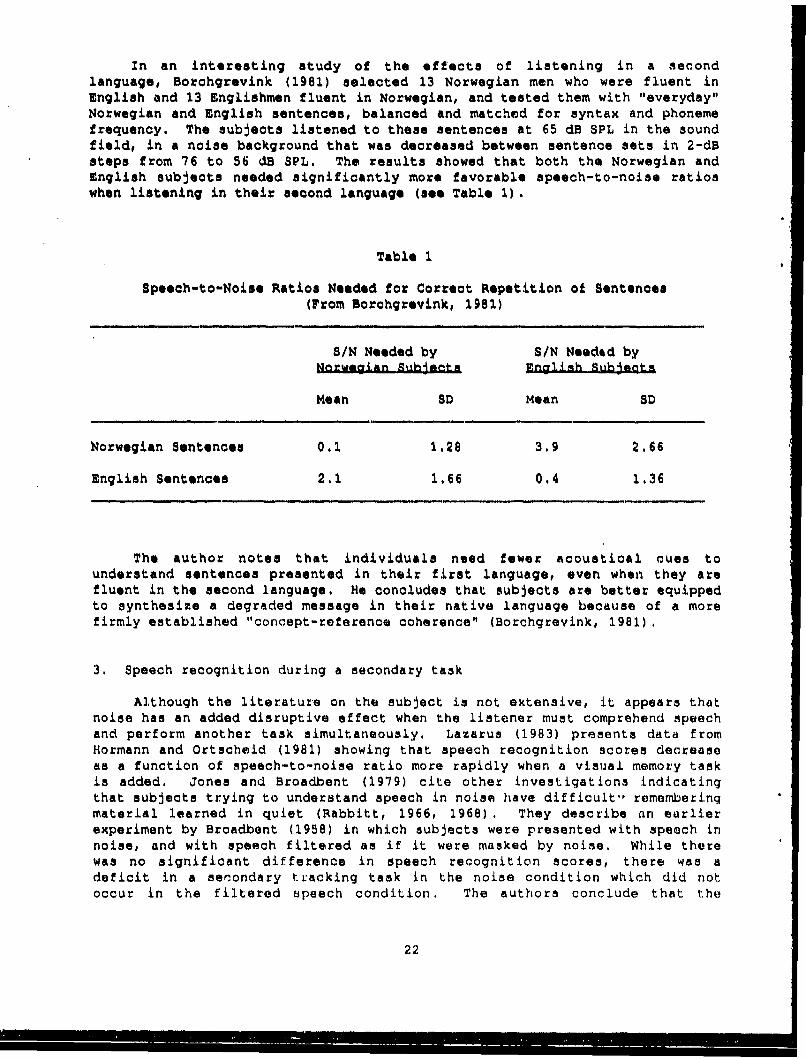
In an interesting study of the effects of listening in a secondlanguage, Borchgrevink (1981) selected 13 Norwegian men who were fluent inEnglish and 13 Englishmen fluent in Norwegian, and tested them with "everyday"Norwegian and English sentences, balanced and matched for syntax and phonemefrequency. The subjects listened to these sentences at 65 dB SPL in the soundfield, in a noise background that was decreased between sentence sets in 2-dBsteps from 76 to 56 dB SPL. The results showed that both the Norwegian andEnglish subjects needed significantly more favorable speech-to-noise ratioswhen listening in their second language (see Table 1).
Table I
Speech-to-Noise Ratios Needed for Correct Repetition of Sentences(From Borchgrevink, 1981)
S/N Needed by S/N Needad byNarwegian Subjnetm English AuhýaQts
Mean SD Mean SD
Norwegian Sentences 0.1 1.28 3.9 2.66
English Sentences 2.1 1.66 0.4 1.36
The author notes that individuals need fewer acoustical cues tounderstand sentences presented in their first language, even when they arefluent in the second language. He concludes that subjects are better equippedto synthesize a degraded message in their native language because of a morefirmly established "concept-reference coherence" (Borchgrevink, 1981).
3. Speech recognition during a secondary task
Although the literature on the subject is not extensive, it appears thatnoise has an added disruptive effect when the listener must comprehend speechand perform another task simultaneously, Lazarus (1983) presents data fromHormann and Ortscheid (1981) showing that speech recognition scores decreaseas a function of speech-to-noise ratio more rapidly when a visual memory taskis added. Jones and Broadbent (1979) cite other investigations indicatingthat subjects trying to understand speech in noise have difficult-, rememberingmaterial learned in quiet (Rabbitt, 1966, 1968) . They describe an earlierexperiment by Broadbent (1958) in which subjects were presented with speech innoise, and with speech filtered as if it were masked by noise. While therewas no significant difference in speech recognition scores, there was adeficit in a secondary tracking task in the noise condition which did notoccur in the filtered speech condition. The authors conclude that the
22

extended effort required to cope with the noise produces a penalty in otheractivities (Jones and Broadbent, 1979).
4. Auditory fatigue
In this context, auditory fatigue may mean temporary threshold shift(TTS) or a more central effect "analogous to perstimulatory fRtigue orloudness adaptation" (Pollack, 1958). Regardless of the etiology, high noiseor speech levels may produce a deterioration in speech recognition withcontinued exposure.
Pollack (1958) investlgated the effects of broadband noise and speechlevels (S/N w 0 dB) of 110 dB to 130 dB for successive 100-second exposures.Speech recognition scores deteriorated significantly over successive tests atnoise and speech levels above 115 dB, and the deterioration in time wasroughly logarithmic over the period of the eight tests. Not unexpectedly,post-mtimulatory tests showed large decrements in speech recognition for soft(45 dB) and very loud (125 do) speech, but no significant effects on speech inquiet between these levels (Pollack, 1958).
In another study of the effects of auditory fatigue, Parker at.(1980) exposed subjects to a 1500- to 3000-Hz band of noise at 115 dB for 5minutes. After noise exposure, recognition scores for PBs in a 2825- to 3185-Hz band of noise were poorer in quiet, slightly poorer in the 90-dB noisecondition, about the same in 40 dB, and somewhat better in the 65 dB noisecondition. The authors conclude that the subjects responded as predicted froma "recruitment model" (referring to the improvement in the 65 dB noisecondition, and suggest that a small TTS would not affect speech embedded inmoderately intense masking noise.
Sorin and Thouin-Daniel (1983) studied the effects of mild TTS on therecognition of low-level speech in noiae (speech at 34 dB(A), noise at 40dB(A)). They added a "lexical decision" task in the form of a word/non-wordjudgement, in an attempt to test central as well as peripheral dysfunction.The results showed that the presence of a 15-dB TTS produced an increase from5.3% to 10.8% incorrect rhyme words and 5% to 13.5% incorrect lexical.responses (which includes decisions exceeding a 2-second limit) . They alsonoticed that the presence of TTS increased a subject's tendency to respond"word" more often than "non-word", a type of response that has been identifiedin studies of the effects of noise on task performance. Although speech at 34dB(A) Is not typical of everyday conversation, it could characterize certaincombat conditions, where understanding softly spoken messages is of vitalstrategic importance.
V. PREDICTION METHODS
A. Articulation Index
The Articulation Index (Al) is a method for predicting the efficacy ofspeech communication in noise, based on the research and method of French andSteinberg (1947). The classic "20 band" method uses measurements or estimates
23
of the spectrum level of speech and noise in 20 contiguous bands, each ofwhich contribute equally to speech intelligibility. This method has beenimproved and modified by Kryter and his colleagues for numerous conditions ofnoise and distortion (see Kryter, 1962a and ANSI, 1969). These modificationsinclude:
1. Corrections for reverberation times up to 9 sec.
2. Corrections to the noise spectrum for spread of masking effects(upward, downward and nonlinear growth).
3. Methods using octave And 1/3 octave bands instead of the original 20bands.
4. Calculation of AI for non-steady-state noise with a known duty-oycleand levels that fall at least 20 dB during the "off period".
5. Calculation of Al for non-steady noise when the rate of interruption
is known.
6. Adjustments for the effects of sharp, symmetrical peak clipping.
7. Corrections for vocal effort, including speech levels of 40 to 100dB (long-term rms).
8. Corrections for the added benefits of lipreading.
Applications of the Al to hearing-impaired listeners have beensuggested by Kryter (1970), Braida a&.a. (1979), Dugal nL.AL., (1980), Skinnerand Miller (1983), Kamm at al. (1985), and Humes ALA2..., (1986).
Although the Al can be somewhat complicated in terms of measurement andinstrumentation, it has been found to be a valid predictor of speechintelligibility in a variety of conditions (Kryter, 1962b), and it has been apopular and a respected measurement tool over recent decades.
B. Speech Interference Level
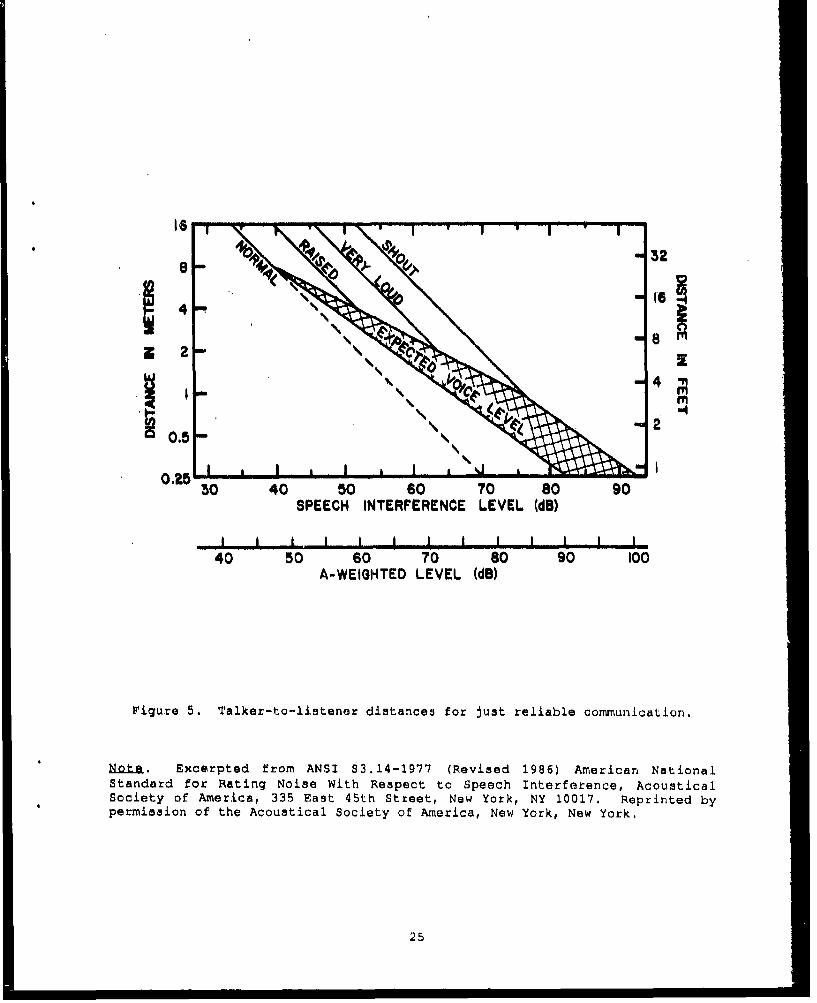
Originally developed by Beranek (1954), the Speech Interference Level(SIL) provides a quick method of estimating the distance with whichcommunication can occur for various levels of vocal effort. The currentmethod involves taking the arithmetic average of sound levels in the octavebands 500, 1000, 2000, and 4000 Hz. According to ANSI S3.14 (ASA, 1977), theprimary purpose of the SIL is to rank-order noises with respect to speechinterference. Figure 5, from ASA (1977), shows talker-to-listener distancesfor "Just reliable" communication (defined as 70% monosyllables), with theapproximate A-weighted level on the abcissa for comparison, "Expected voicelevel" reflects the natural increase in vocal effort with increasing SIL.
Figure 6 shows Webster's most recent version of the SIL criteria(Webster, 1983), with numerous modifications and embellishments. Webster(1983), describes them as: (1) a broader range of voice levels to reflectdifferences between public and private voice levels (see Houtgast, 1980; van
24
* B A- 32
4i
'.4
0,.5 0.2530 40 50 60 70 80 90
SPEECH INTERFERENCE LEVEL (dB)
I I I I I, I . I I I ,, i . . I
40 50 60 70 80 90 100A-WEIGHTED LEVEL (dB)
Figure 5. Talker-to-listener distances for Just reliable communication.
Note. Excerpted from ANSI S3.14-1977 (Revised 1986) American NationalStandard for Rating Noise With Respect to Speech Interference, AcousticalSociety of America, 335 East 45th Street, New York, NY 10017. Reprinted bypermission of the Acoustical Society of America, New York, New York.
25

32- Woemem Lr• In...V3e•9: Free Fted
4 etwe, , Tyl~oel' nomtsnPFAVATEVW PUUUO
VoiVoie evelS
raw hdus to2. Afluit Noise
EqUvelent#Noise F~or
duieto s-Voice Leves at I MeterREVIIIIIIIIIIIAION(ree dU(A)
0.R s@a*e an simieose)
0.2520 30 40 50 60 To so 90 100 110
Level In dU(A)
Figure 6, Revised "1SIL" chart showing relationships among A-weighted ambientnoise levels, distances between communicators, and voice levels of talkers forjust reliable communication indoors.
Note. From "Communicating In Noise, 1978-1083" by J. C. Webster, in G. Rossi(Ed.), Noise as a Public Health Problem, 1983, P2rcaedingm of the .. rInternaLtonal Congress, Milan, Italy: Centro Ricerche e Studi Amplifon.
2 ,

Neusden &Lal,, 1979)1 (2) a different rate of fall-off of speech level withdistance based on typical room reverberation; (3) "equivalent noise floors"based on room reverberation (see Houtgast, 1980); and (4) a downward shift of3 dB in the voice level reference lines at one meter to account for thedifferences between A-weighted and rms speech levels (according to Steenekenand Houtgast 1978). Despite all of these modifications, the SIL still hascertain disadvantages in that it assumes normal hearing on the part of thelistener, and face-to-face communication with unexpected word material(Webster, 1984), and it uses only one level of intelligibility (70%monosyllables). Someone who desired 90% word intelligibility, for example,would not be able to use the chart.
C. Speech Transmission Index
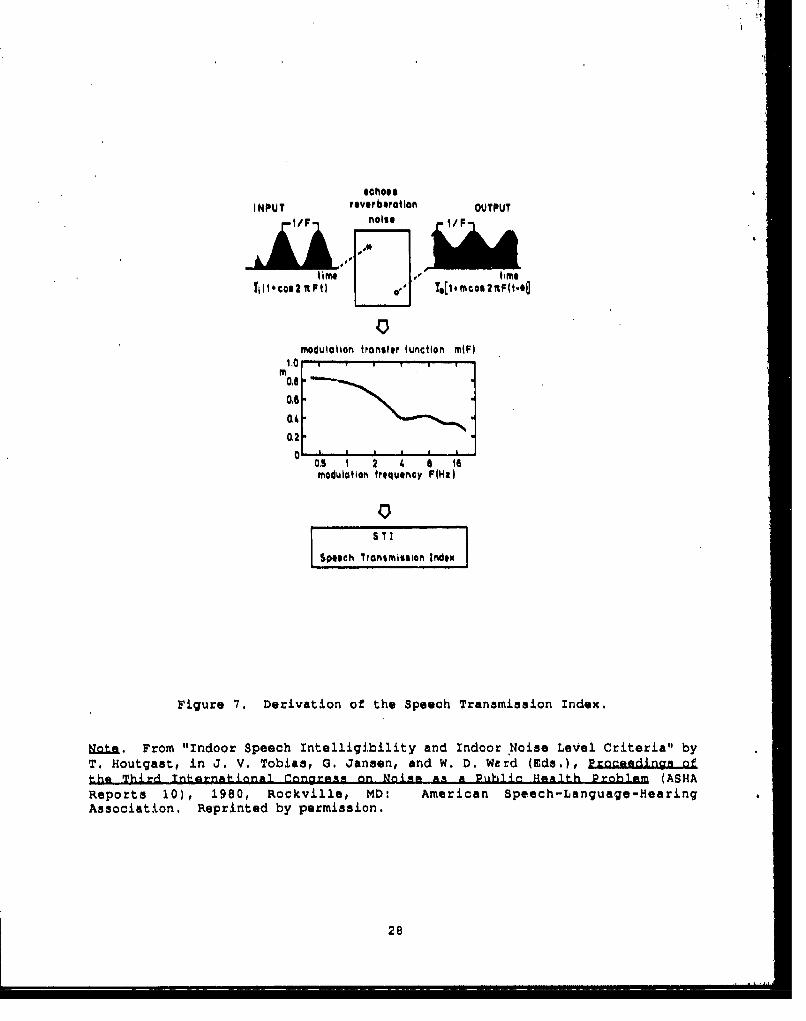
Developed by a group of researchers at the TNO Institute for Perceptionin the Netherlands, the Speech Transmission Index (STI) is derived from aspeech transmission channel's "Modulation Transfer Function" (MTF). The MTFmay be measured with special equipment or calculated from the volume andreverberation time of the room, distance between talker and listener, andnoise level (Houtgast, 1980). Figure 7, from Houtgast (1980) shows a model ofthe derivation of the STI. Houtgast gives data indicating an excellentcorrelation between STI and speech intelligibility for a wide variety of largerooms. The author also explains that in a highly reverberant room, noisebelow a certain level can have no degrading effect on speech because theadverse effects of reverberation dominate. This is the "noise floor", whichWebster has incorporated in his latest SIL chart (see Figure 6).
in a later paper, Houtgast and Steeneken (1983) discuss the verificationof the original model, which had used only speech-shaped noise, reverberation,and Dutch monosyllables. Subsequent research showed the STI to be a goodpredictor of speech intelligibility (1) in five types of noise spectra; (2)with other distortions besides reverberation, such as filtering, peak-clipping, and automatic gain control; (3) with untrained subjects outside thelaboratory: (4) for sentences in addition to monosyllables; and (5) for sevenother languages besides Dutch (Houtgast and Steeneken, 1983).
Humes at l- (1986) modified the STI by analyzing spectral informationfrom the speech and noise signals in one-third octave rather than octavebands, and by weighting the bands according to the method originally developedby French and Steinberg (1947) for the Al. Humes and his colleagues foundthat these adjustments improved the STI's ability to predict speechrecognition scores in both normal-hearing and hearing-impaired listeners.
In a subsequent effort, Humes aLtal, (1987) tested their modified STI(mSTI) on a large set of existing speech recognition data obtained under avariety of conditions, including low-pass and high-pass filtering, and variousspeech levels and speech-to-noise ratios. They found that the mSTI was a goodpredictor of speech recognition in all conditions, with the exception of low-pass filtering. The investigators speculate that increasing the frequencyresolution of the mSTI (and Al) from 15 to 20 bands might solve this problem.
27
*choesINPUT reverberation OUTPUT
1/F noise VIC
time D timeI 1 6 ~2 ilt ) F t I I m C a 2 n F I'*
0modulation transfer function mIF)
10,m0.
0.4 2 4 S I
modulation frequency F(Iz)
0
Speech Tronsmission Indle
Figure 7. Derivation of the Speech Transmission index.
i. From "Indoor Speech Intelligibility and Indoor Noise Level Criteria" byT. Houtgast, in J. V. Tobias, G. Jansen, and W. D. Ward (Eds.), Proeadinjgn oftho Third !nnhrnatinnI C~ngrang on Nainm &. a Puhli analth Prohlam (ASHA
Reports 10), 1980, Rockville, MD: American Speech-Language-HearingAssociation. Reprinted by permission.
28
D. Sound Level Meter Weighting Networks
Aside from the fact that the sound level meter with its A-weightingnetwork is inexpensive, readily available, and easy to use, it is a goodpredictor of speech interference, especially in noise spectra that are notunduly complex. Klumpp and Webster (1963) found A-weighting far superior tothe other weighting networks, and Webster has effectively substituted A-weighting for SIL in his latest "SIL" chart (see Figure 6). Measuring thenoise, however, gives only part of the information of interest. The A-weighting network can also be used effectively to predict AI and STI bymeasuring both speech and noise levels to obtain a speech-to-noise ratio. Inaddition, Webster (1984) also points out that A-weighting is amenable (as areall weighting networks) to time integration. Second to the Al, CHABA WorkingGroup 83 recommends the A-weighted Leq for predicting the effects on speechintelligibility of time-varying noise (CHABA, 1981).
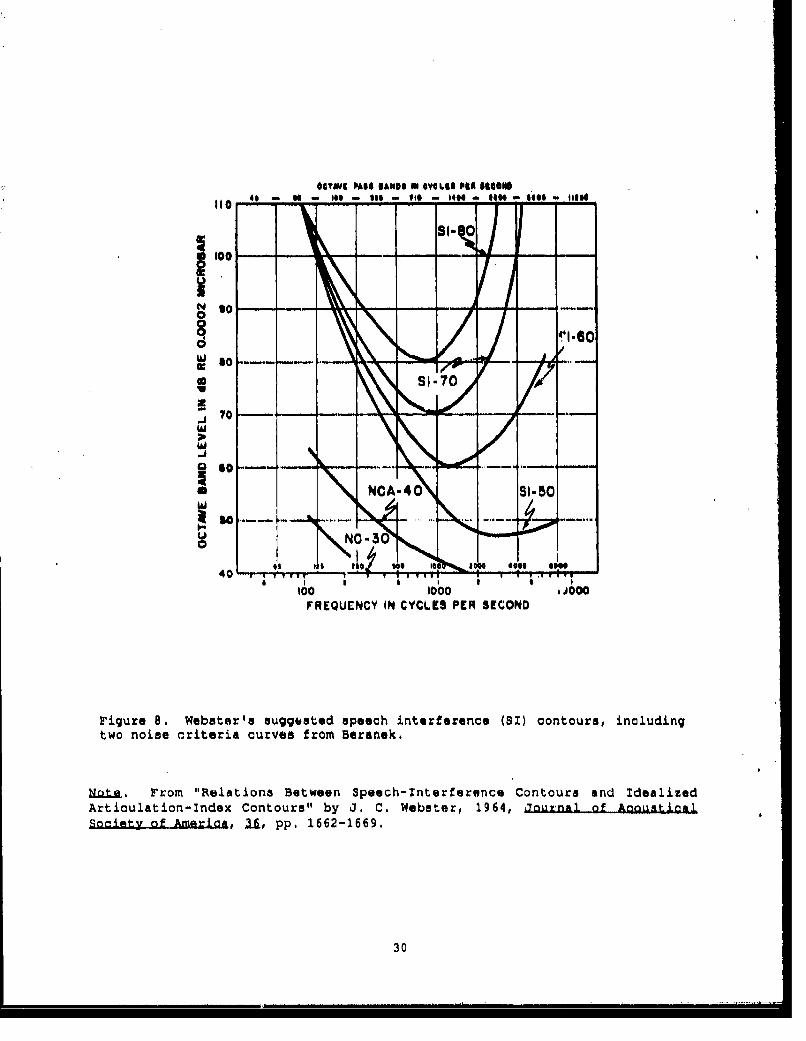
Based on an analysis of 16 equally speech-interfering Navy noises(Klumpp and Webster, 1963), Webster (1964) developed a set of speech-interference (S1) contours which could serve as sound level meter weightingnetworks. In this process, Webster found that as the Al (and consequentlyspeech intelligibility) increased, the frequencies that most effectively maskspeech increase from about 800 Hz to around 3000 Hz (Webster, 1964). Figure 8shows Webster's SI curves, including two curves originally developed byBeranek (1957). The 8-I 50 curve is appropriate for an Al of 0.8, the S-I 60for an Al of 0.5, S-1 70 for an Al of 0.2, and the S-I 80 for an Al of up to0.05. Although these curves have never been incorporated into standard soundlevel meters, they would seem to offer some interesting possibilities.
E. Relationship of Methods to One Another
These predictive methods can be viewed together with respect to theirphysical interrelationships, and to their relative merit as predictors. ANSIS3.14 (ASA, 1977) states that for many common noises, the SIL (yielding 70%intelligibility) will be about 8 dB below the A-weighted sound level.According to ANSI 83.5 (ANSI, 1969), 70% monosyllable intelligibility (for1000 PBs) is achieved at an Al of 0.45, which translates to an approximatespeech-to-noise ratio of 1.5 dB. For speech-shaped noise, the STI and Al havea uniform and predictable relationship. A speech-to-noise ratio (S/N) of 1.5dB corresponding to an Al of 0.45 will yield an STI of 0.55 (see Houtgast,1980). This relationship can be seen as:
AT - (S/N)/30 + 0.4
STI - (S/N)/30 + 0.5
To assess the effectiveness of various rating schemes, Klumpp and Webster(1963) compared AI, dB(A), two versions of the SIL, and various other measuresin 16 equally-interfering Navy noises. They found that the AI showed theleast variability, followed by the SIL 355 Hz to 2800 Hz, dB(A), and SIL 600Hz to 4800 Hz. Kryter and Williams (1965) found that the SIL 600 Hz to 4800Hz outperformed the SIL 355 Hz to 2800 Hz in aircraft noises, which generallycontain a greater proportion of high frequencies than the Navy noises.
29
6O4?MV PA6S IANII U SILIa PiA 81i6111116 -1 too 1111 M~ - 040 Ie- t o" 1 4 111*
SIN
N to0
8d
c I70 I _ 0
NO-4NSI5W
40 -
100 00 0 , oO00FREQUENCY IN CYCLES PER SECOND
Figure 8. Webster's suggested speech interference (SI) contours, includingtwo noise criteria curves from Beranek.
Note. From "Relations Between Speech-Interference Contours and IdealizedArticulation-index Contours" by J. C. Webster, 1964, Journal of AnnuxtioalSociety of Ameriga, 3U, pp. 1662-1669.
30
In a recentd L;tudy, Bradley (1986) compared four methods for predictingspeech intelligibil.ty in medium-uized to large rooms: Al, A-weighted speech-to-noise ratio, AI&, "nd Lochner and •'.,,tr's (1964) "useful/detrimental"sound ratios. In -.tter method, usee'.;. energy is defined as the weightedsum of energy arriving ir the first 0.095 se,,ond. after the arrival of directsound. Detrimental energy is any later-arriving energj from the speech sourceplus background noise in the room (Bradley, 1986. The results showed thatall methods did reasonably well, but the Lochner/Burger method produced thehighestocorrelation with speech intelligibility and the 1.swest error. The Ar
* and A-weighted speech-to-noise ratio performed nearly as well, and the STIranked fourth in effectiveness. The author concludes that a satisfactory and
* simple approach would be to measure the A-weighted speech-to-noise ratio and* the reverberation time at 1000 Ha, and use the regression coefficients he
developed to form prediction equations (see Table I and Figure 9 in Bradley,1986),
VI. ACCEPTABILITY CRITERIA
A, Minimal or "Just Reliable" Communication
There is a paucity of information on the subject of communicationrequirements for specific activities. Quite a few investigators refer tominimum requirements for "Just reliable" communication, but, few elaborate onthe uses of this level of communication, or on the amount of communicationneeded for various purposes, Most agree that the minimum conditions to barelycommunicate range from an Al of 0.3 to 0.45, Table 2 gives recommendationsfor "Just reliable" communication conditions from five sources. Data actuallymentioned by the sources are underlined, and the remaining data have beenfilled in with the help of ANSI S3.5 (1969) (see Figure 3).
Although ANSI 83.5 gives no specificationu for "just reliable"communication, the standard states:
What level of performance is to be required over a givensystem is, of course, dependent upon factors whose importancecan be evaluated only by the users of the communication system.Present-day commercial communication systems are usuallydesigned for operation under conditions that provide AX's inexcess of 0,5. For communication systems to be used under avariety of stress conditions and by a large number of differenttalkers and listeners having varying degrees of skill, an Al of0,7 or higher appears appropriate,(ANSI, 1969)
B. Recommendations for Various Environments and Operations
Although the literature is virtually silent on the specific amount andtype of communication needed for various operations, there exist numerous
31
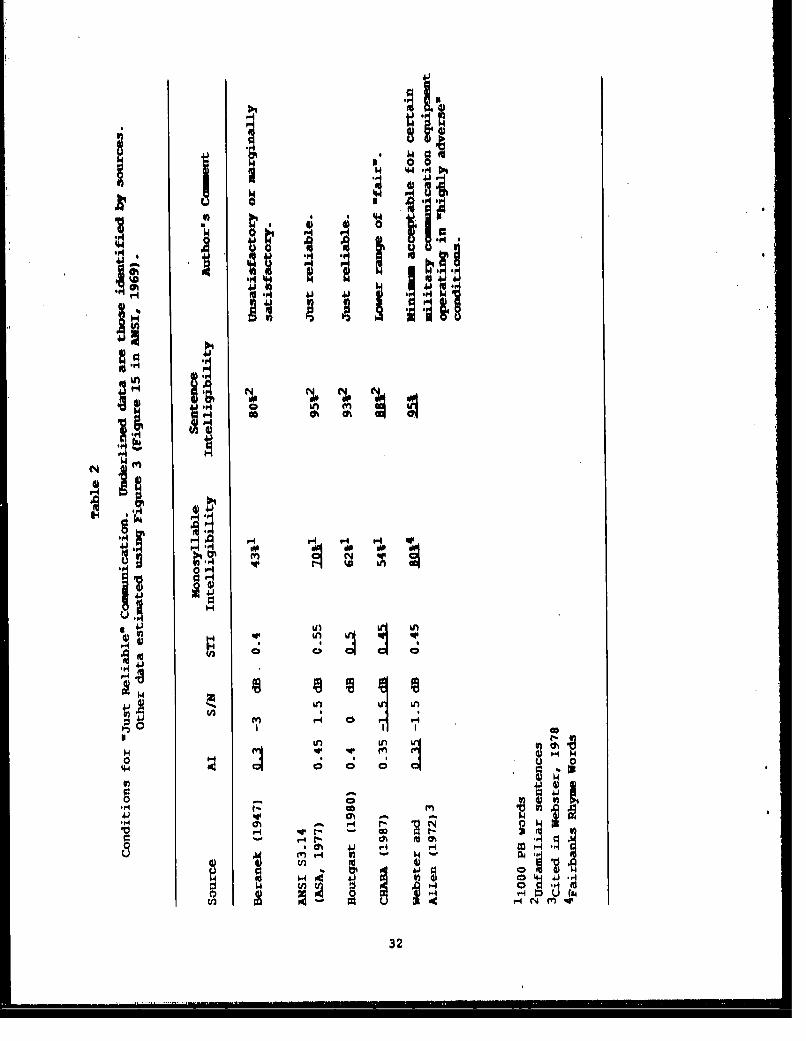
I44
a 1.
Q 00m
M4 H" P . ~q4
W 0 q 64 04 IF~
14'
0.
'44
0 U,
B U)o 1 0, A
0 P-4 F~'
tn N~ m"
32

recommendations for background sound levels that are appropriate for certainactivities and spaces. For example, the German government recommends thefollowing "rating level" (A-weighted Leq with corrections for impulses andtones): maximum of 55 dB for jobs that involve mental activity; maximum of 70dB for simple and mechanized office activities; maximum of 85 dB for all otheractivities (Lazarus, 1983). According to the U.S. Environmental ProtectionAgency (EPA, 1974), A-weighted background noise levels of 45 dB will allow100% intelliqibility of relaxed conversation indoors, and 95% sentenceintelligibility is achieved at a level of about 64 dB.
Table 3 shows recommendations from Beranek aLtLl. (1971) for "preferrednoise criterion" (PNC) curves and A-weighted background noise levels toachieve various levels of communication in various types of spaces. Levels of66 to 80 dB are recommended for work spaces where communication is notrequired. For the others, the recommendations range from 56 to 66 dB for"Just acceptable" speech and telephone communication in shops, garages, power-plant control rooms, etc., to 21 to 30 dB for excellent listening conditionsin large auditoriums and concert halls.
The National Aeronautics and Space Administration (NASA) asked theNational Academy of Sciences/National Research Council's Committee on Hearing,Bioacoustics, and Biomechanics (CHABA) to draft criteria for speechcommunication aboard the future NASA Space Station (CHABA, 1987). In theirreport, the authors direct A-weighted speech levels of 62 dB in the directfield, and 60 dB in the indirect field (greater than one meter), where most ofthe communication would take place. To obtain a minimum speech-to-noise ratioof 5 dB, the maximum noise level should be 55 dB(A). Assuming a one-secondreverberation time, this translates to an STI of 0.45, an Al of 0.35, andsentence intelligibility of 88% (se* Table 2) . The authors mention arecommended range of SThe from 0.45 to 0.6, which would yield sentenceintelligibility of up to 95% (CHABA, 1987). Presumably, however, for an STIof 0.6, either the reverberation time would have to be reduced or the speech-to-noise ratio should be considerably higher.
C. Consequences of Degraded Speech
Although the consequences of degraded speotch uan be extremely serious,most of the references in the literature are anecdotal or subjective. Whilethese kinds of findings lack the power of objuctive, quantified researchresults, they are nevertheless compelling. For example, Williams and hiscoauthors state: "Field reports have indicated situations wherein troopsemplaning from rotary-wing aircraft sometimes experience hearing thresholdshifts of such severity that; they are unable to make use of aural cues indetecting enemy movements." (Williams aLtAlJ, 1970, p. I)
At a recent conference entitled Aural communication in Aviation,sponsored by the Advisory Group for Aerospace Research and Development(AGARD), some of the contributora alluded to the consequences of degradedspeech. Mayer and Lindburg (1981) pointed out that future battles will befought on or near the ground in a "nap of the ear:th" environment. This willincrease the aviator's already heavy workload. The fatiguing effects of highnoise and poor commnunication will have adveae etffects on aviators' combat
33
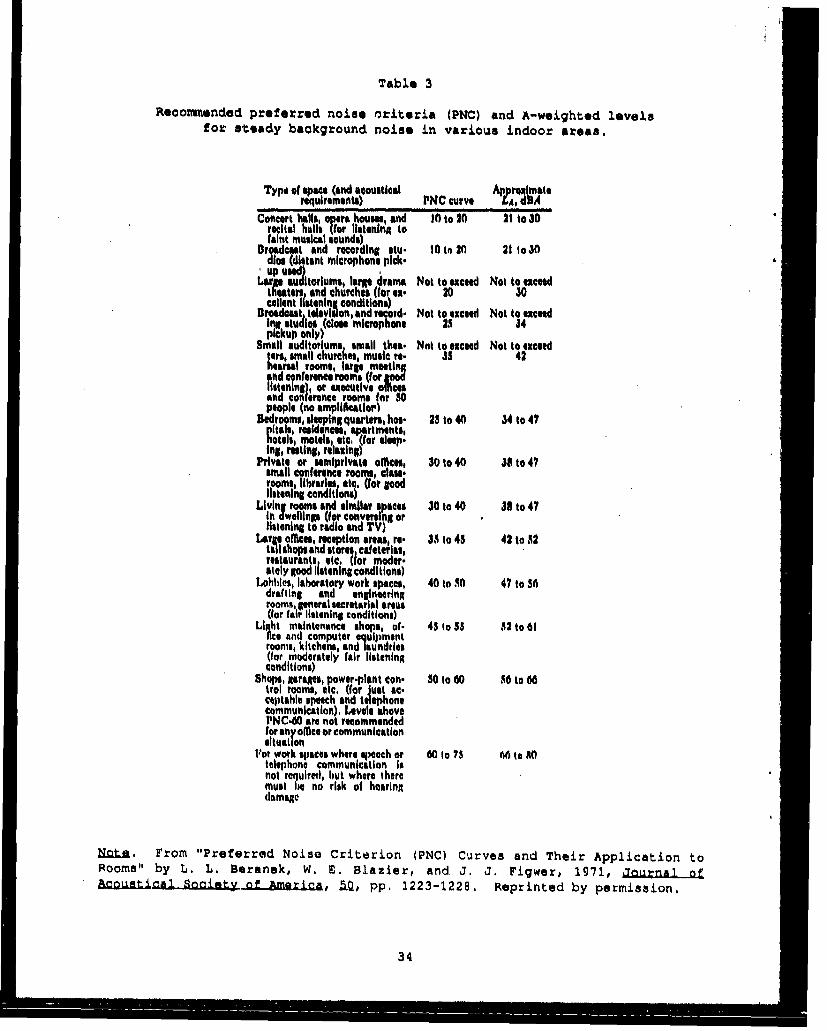
Table 3
Recommended preferred noise ',riteria (PNC) and A-weighted levels
for steady background noise in various indoor areas,
Typo of space (and Acoustical Approximaterequirements) PNC curve L.A, dBA
concert halls, 0ors.a houses. and If) to 20 21 to 30recital halls (for listeningtfaint musical sounds)
tlroadcast and reording; sty. l1to 20 21 IoJOdIe (distant microphone pick.
auIolmlarge drama Not to exceed Not to exceedtheaters, and churches (for ex. 20 30cellent listening conditions)
Broadcast tisevision, and reoid. Not to eceted Not to exceedirg studios (close milcrophone 25 34pickup only)
Small auditoriums small the&- Not to exceed Not to exceedters, small churcfts, music re. 35 42hearsal rooms, large meetingand conference rooms (for ~o
litnn) rexecutive a ctaoadChMr~ne rooms forf SO
people (no Amplilieatioi)edwrooms, slee0ping quarters, hoe. 23 to 40 34 to 47
liis esiecs, apartments,otl.motels, et (for aslep.In#, resting, relaxing)
Private or semiprivate offies, 30 to 40 38 to 4?small conference rooms, class.rooms, libraries etc, (for goodlistening conditions)'
Living rooms and similar spaces 30 to 40 38 to 47In dweilling (for converting orlistening to radio and TV)
Larg offces, reception ariea, re. 33to 45 42 to 52tall shops and stores, cafeterias,restaurantsl etc. (br moder.ately good I stening conditions)
Lobbies, laboratory work spaces, 40 to SO 47 to 56draft Ing and engineeringrooms, general secretarial areafs(for fair listening conditions)Lhtmaintenane shops, of- 45 toS 53 2 to 61itand computer equilment
rooms, kitchens, and laundries(for moderately fair listeningconditions)
Shops, garages, power-plant con: 301to60 56 to 16tro1 roomns, e c (for just ac-ceptable troeth and telephonecommunication), Levels ahovePNC-60 Are hot recommendedfor anromcesor communication
tPor work spaces where speech or 60 to 75 66080totelephone Communication Isnot required, but where theremust lIe no risk of hearingdlamage
Nzta From "Preferred Noise Criterion (PNC) Curves and Their Application toRooms" by L. L. Beranek, W. M. Blazier, and. J. J. Figwer, 1971, joiirnA.l (ifMon ca oit-fAeia q, pp. 1223-1228. Reprinted by permission.
34
effectiveness (Mayer and Lindburg, 1981). Conference Chairman Money referredto the "significance of failure or inadequacy of speech communication or audiowarning systems in military operations..." and the consequent "cost intraining and reduction of operational effectiveness." (Money, 1981, p. ix).In a discussion of clear speech later in the meeting, McKinley remarked:
Your references to standard language has prompted me tomake these remarks about something I have found in examiningtapes of last messages from pilots during accidents. It isthat usually, the message is a short unfamiliar language andin many cases, unintelligible. I think they could have beenintelligible if the system had been designed correctly.
One study that simulates the consequences of communication failures interms of error rates is the study of speech recognition using the M25 gas maskby Garinther and Hodge (1987). The authors cite the Defense Department's MIL-STD-1472C (DoD, 1981) defining "minimally acceptable" communication as a PBscore of 43%f and "normally acceptable" communication as a PB score of 75%.Gas mask wearers were unable to achieve the 75% level at a distance of onlyone moter, and the 43%, minimal, level wai achieved at a distance of 12.5meters. Unmasked listeners could achieve this level at approximately 48meters. Garinther and Hodge note that 12.5 meters is about one-half thedistance at which platoon leaders would like to be able to communicate infield conditions, On the basis of their data, they estimate that usingmaximum vocal effort at a distance of 12.5 meters, individuals wearing gasmasks would have an error rate of 3% with a small set of standard words, 7%with standard, previously known sentences, and 20% with non-standardsentences. One could expect an even higher error rate for non-standard wordsout of context. Garinther and Hodge also point out that maximum vocal effortcan be sustained for only a short period of time.
Any system that allows less than 100% intelligibility assumes that somewords will be lost or misunderstood. Systems that are designed for "justreliable" or "fair" communication depend for an extra margin of safety uponthe normal redundancy of sentences, and especially upon the added redundancyprovided by standard phraseologies, such as air traffic control language.These systems will function relatively effectively under normal conditions.However, normal conditions may be disrupted by any number of causes: anemergency requiring a non-standard word; a sudden decrease in opeech-to-noiseratio; a momentary equipment failure: or a "panic" situation in whichintelligibility is drastically reduced. The consequences of inadequate ormisunderstood instructions in these situations can be dire indeed: in theextreme, loss of life and destruction of expensive equipment.
VII. DETECTION OF WARNING SIGNALS IN NOISE
Noise can mask warning sounds in the same way it masks speech.Theoretically, a warning sound will be audible if any frequency in the soundexceeds the critical ratio with respect to the surrounding band of noise. But
35
because the signal is detectable doeo not necessarily mean it will beeffective. In the dovelopment of criteria for audible warning signals,Wilkins and Martin (1982) differentiate between detectability, demand onattention, and recognizability of signals. They point out that inattentionmay elevate the masked thresholds of warning signals (over the threshold ofdetectability), and that an even greater signal-to-noise ratio could benecessary when the signal is embedded among other meaningful, but irrelevantstimuli. These investigators cite a level of at least 15 dB above maskedthreshold us a widely accepted safety margin, and advocate a signal-to-noiseratio of at least 10 dB for 100% detectability especially if hearingprotection is used (Wilkins and Martin, 1982).
Coleman Li...aL (1984) concur with the need for a 15-da differencebetween signal level and masked threshold to produce "clear audibility" (p.21). They maintain that as the signal approaches this level the listener willregain perceptual abilities and the ability to localize the direction of thesignal source. But the 15-dB difference does not guarantee the signal'sability to claim the subject's attention.
The National Fire Prevention Association asked CHABA to develop anational fire alarm signal (Suets at.AL- , 1975), The criteria were that thesignal must be easily detected above background noise, different from otheralarm signals, and adaptable to existing systems. The CHABA working grouprecommended a standard temporal profile, consisting of two short bursts and along burst, Nominal on-segments should be between 0.4 and 0.6 second and off-segments between 0.3 and 0.6 second, with a rise and decay of 10 dB within0.1 second. The on state should exceed the listener's 24-hour Leq by 15 dB,and should exceed by 5 dB any maximum level for which the duration is greaterthan 30 seconds,
The working group cautioned users not to exceed a level of 30 dB without"consultation with local health authorities".
In a very thorough and well researched effort, Patterson (1982) offers aset of guidelines for auditory warning systems for civil aircraft. He hasidentified numerous problems with existing civil aviation warning systems:
1. The warning levels are too loud, "They flood the flight-deck withvery loud, strident sounds," disrupting thought patterns and communication,and making the systems unpopular with the crews (p. 1).
2. Temporal chtiracteristics are unsatisfactory. The onsets and offsetsare sufficiently abrupt to evoke startle reactions, the temporal patterns arenot sufficiently distinctive, and the total on-times are too long, interferingwith speech communication.
3. Low priority warnings sometimes appear more urgent than highpriority warnings,
4. The ergonomics of these warning systems are "deplorable". They arelacking in a sense of perspective, meaning that many are false and others haveconfused priorities. The aversive character of the sound is likely toconvince the crew to cancel it as quickly as possible, thereby canceling theprotection it provides.
36
5. Voice warnings are not frequently used, and the speech quality 9fexisting systems is nct good.
To correct these defects, Patterson developed a prototype warning systembased on a comprehensive research effort. The following guidelines resulted:
1. Overall level should be at least 15 dB and not more than 25 dB abovemasked threshold.
" 2. The temporal pattern should consist of pulses with 20 to 30 msecrise and decay times, and gating functions that are rounded and concavedownward. Pulse duration should be 100 to 150 msec, and intervals between
* pulses should be less than 150 msec for urgent and greater than 300 msec fornon-urgent warnings. Each warning "ILArst" should consist of a set of 5 ormore pulses in a distinctive temporal pattern.
3. The spectrum should consist of 4 harmonically related componentsbetween the frequencies of 500 to 5000 Hz, with a fundamental, frequencybetween 150 and 1000 Hz. Signals demanding immediate action should contain afew quasi-harmonic components and/or a brief frequency glide.
4. For ergonomic reasons, manual volume control should be avoided, andAVC should be restricted to a 10 to 15 dB range. The total repertoire ofsignals should consist of not more than 6 immediate-action signals and up to 3"attensons" (less urgent but attention demanding sounds like musical chords).
5. Voice warnings for immediate action should be brief, withoutrepetition, and in a key-word format. Less urgent warnings can be full phraseand can be repeated. The system should accommudate a frequency range of 500to 5000 Hz, and there should be progressive amplification of 3 dB/octavebetween those frequencies.
Figure 9 gives the component patterns for an "advanced" warning signaldeveloped by Patterson (1982), showing four regularly spaced pulses followedby two irregularly spaced pulses. Sound level is reflected by the ordinate,and time is on the abcissd. Rows 3 and. 4 show increasing levels of urgency.Figure 10, also from Patterson (1982), shows the time course of a completewarning. Each little trapezoid represents a series of pulses as in Figure 9,and the relative intensities are reflected by trapezoid height. This warningincludes the voice message "undercarriage unsafe".
Subsequent to their development, Patterson's guidelines have been usedwith both conventional and rotary-wing aircraft, as well as in hospitals(Patterson, 1985). Rood at al. (1985) have adapted Patterson's guidelines tothe conditions found in military helicopters. The authors point out certaindifferences between helicopters and civil aircraft. The pace of life on ahelicopter "fliqht deck" is much faster than in a civil airliner, and thenoise spectrum i different.. Rood and his colleagues recommend a double burstof an attenson followed by a voice warning, with repeats as appropriate. Eachprimary warning has its own "attenson", made distinctive by pulse and burstparameters, with urgency controlled both by spectral and temporalcharacteristics. Spectral characteristics are matched to the particularaircraft, helmet, and the response characteristics of transducer in use (Roodet al.~, 1985).
37

* I
Basic tmporal1~ patten -six
Ietclpulses l i0.1 sec.in duration.
2 Basic ptternwith loudness ncontour.
Puls spacin3 compPesed to0 T
increase urgency, " q
Pulse spacing4 compressed to
the limit.
Figure 9. Component patterns for an advanced auditory warning signal.
Note. From Guidelines for Audit~ry Warning Systes on Civil Arcraft (CAAPaper 82017) by R. D. Patterson, 1982, London: Civil Aviation Authority.Reprinted by permission.
38
" _ _ " -*';•'0 .... .. "' _Z-1-1. . . . _ • _ - _ _ " . .. .
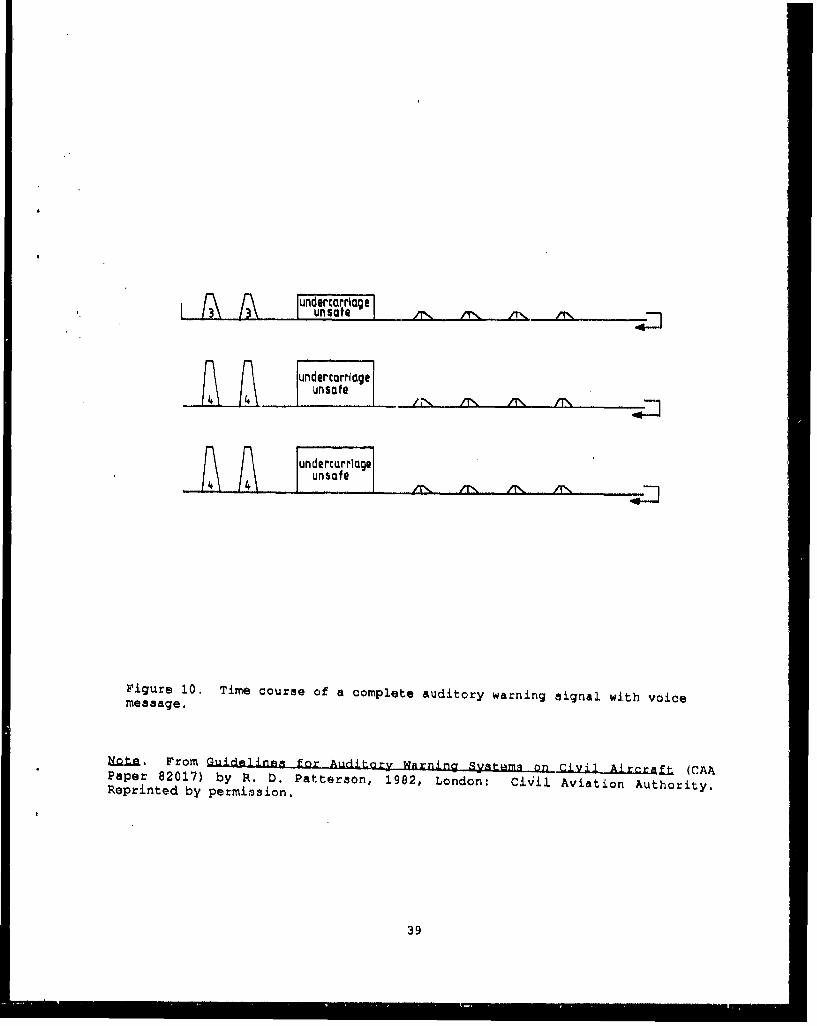
[4 /f\ /T\ /r\o~e
undercurrlage
unsafe
Figure 10. Time course of a complete auditory warning signal with voicemessage.
N1., From Guidelines for Auditory Warning Systgma on civil -AirrafL. (CAAPaper 82017) by R. D. Patterson, 1982, London: Civil Aviation Authority,Reprinted by permission.
39

To assist in tailoring warning signal parameters to specific aircraft,Lower and Wheeler (1985) have developed a desk-top computer program to predictmasked thresholds for warning signals in a given noise environment. Theprogram has been validated by comparing measured and predicted thresholds inrecorded noise from Chinook, Sea King, and Lynx helicopters. Theinvestigators found a high correlation between measured and predicted maskedthresholds (Lower and Wheeler, 1985).
Coleman and his colleagues at the U.K.'s National Coal Board drew'heavily on Patterson's work in developing guidelines for warning signals inindustrial operations in general and coal production in particular (Coleman atLL., 1984). They noted that Patterson's guidelines were designqd for, aircraftcockpits, but they could be effectively used in certain other environmentssuch as control rooms. They also pointed out that Patterson's signalsdiffered mainly in the temporal domain, whereas frequency and levelcharacteristics could also be varied. In addition to Patterson's technique,Coleman at.aL, relied on ideas from Deatherage (1972) and Licklider (1961) informulating the following reoommendations:
Mtta4lnnax fn rha Prmduntion mf nlangiminahla Ratn mr signalm (from ColemanaLjU., 1984, pp. 60-61)
1. Limit the number of signals to six at any one workplace.
2. Use no more than two signals when only one signal characteristic,such as pitch, is altered.
3. Ensure at least three harmonically, or pseudo-harmonically relatedspectral components occur in the range 1-2 kHz for each signal.
4. Ensure that signals differ both in terms of their temporal patternsand their constituent perceptual units.
5. To manipulate temporal pattern use modulation (AM or FM) at ratesof I to 4 Hz, employing rest periods between bursts of sound as part of thetemporal pattern.
6. Ensure that the modulation rate does not correspond with fluctuationrates in the environmental noise.
7. To manipulate within perceptual units, use different pitch, andhigher frequency modulation (AM or FM) at rates above 20 Hz. To manipulatepitch it is best to use complex signals comprising several harmonicallyrelated components. Such signals have a fixed perceived pitch regardless ofthe particular order of the harmonics (see Plomp, 1967). Masking some of thecomponenis will not alter the perceived pitch and signals made up of manyharmonically related components can, therefore, be more resistant to theeffects of short term noises, both in terms of maintaining their audibilityand perceived identity. In following this recommendation it should beremembered that the frequency of the fundamental present in the signal orimplied by the harmonics should be below 1 kHz.
40
VIII, SUMMARY
U•aach Variahla.
The proper assessment, of speech communication conditions requiresknowledge of the speech level. A number of different methods of measuringspeech level are in use now, yielding differing results, although therelationships among these methods are fairly stable. People do not alwaystalk at the same level. In live-voice situations, it should be kept in mindthat people raise their voices about 5-6 dB for every 10-dB increase inbackground-noise, and that vocal effort increases with distance and even withdifferent forms of activity.
Normal speech is highly redundant, especially the special phraseologiesthat are often used in military situations, Because of conditions of noiseand filtering, however, redundancy is significantly reduced. There are avariety of useful speech materials availa :.., and it is important to selectappropriate materials to evaluate the particular noise conditions,communication system, and communication needs at hand.
We seldom listen to speech in ideal circumstances. Filteringcharacterizes communication systems, and noise masking is the most commonuaurce of speech interference. The upward spread of masking makes high levelsof noise disproportionately disruptive. Combined distortions actsynergistically to degrade communication,
Transmiaaieon charateriatliea
Intelligibility of the speech signal is modified by distance,reverberation, and spatial location with respect to the noise source. Speechlevel is reduced by 6 dB per doubling of distance outdoors, but the reductionIs less indoors because of reverberant build-up. Reverberation begins todegrade speech intelligibility at about 0.8 second in quiet, and at less than0.5 second in noisy backgrounds. The effect is greater in small than it is inlarge rooms. Separation in space of the speech and noise aignals can resultin improvements equivalent to a speech-to-noise ratio of 5 dB.
Binaural listening provides improvements of anywhere from 2.5 to 13 dB,depending mainly on noise and reverberation conditions. Telephone listeningis difficult in noise because the filtering involved reduces speechredundancy, and background noise reduces it further. Intelligibility can beimproved by reducing side-tone feedback, through occluding or modifying thetransmitter or by amplifying the signal. Current communication systems arefrequently outmoded, causing strain and delays on the part of the listener,but there are many possibilities for improvement.
41
Tikar ane L aianar VarlabIaa
Although individuals are capable of producing voice levels as high as
100-105 dB, they cannot sustain speaking levels above an asymptotic level of
about 78 dB without considerable discomfort. Individuals who must habitually
communicate in noise over a period of years are subject to voice disorders,
such as hoarseness and vocal nodules. Talker articulation can greatly affect
speech intelligibility. Studies have shown improvements of up to 18% from
speaking clearly in quiet. Improvements also occur in noisy conditions, but
appear to be somewhat less dramatic. Female voices are as intelligible as
male voices in low and moderate noise levels, but may be slightly less
intelligible in high noise levels.
preferree¢ listening levels under earphones are identified as sound
pressure levels of 80-85 dB in quiet. With the introduction of noise,preferred levels are somewhat lower. Tolerable listening levels are lower for
negative than they are for positive speech-to-noise ratios. Comfortablelistening levels should be at a speech-to-noise ratio of at least 5 dB, and
preferably above 10 dB. Non-native listeners have significantly more
difficulty understanding degraded speech in their second language, even though
they may be fluent speakeru of that language. High levels of speech and noise
can cause auditory fatigue (both central and peripheral, it appears), which
reduces speech discrimination both simultaneously and subsequent to the high-
level stimulation.
PrselBitiAn Msthndn
The Articulation Index (AX) is a popular and highly respected method of
predicting speech intelligibility in noise. It has been modified and improved
by the inclusion of corrections for such conditions as reverberation, spread
of masking, peak clipping, changes in vocal effort, lipreading, and hearing
impairment.
Speech Interference Level (SIL) is useful for predicting distances at
which "just reliable" communication can occur. It has recently been modified
to apply to indoor situations and numerous levels of vocal effort. But its
utility is limited because it cannot be used for hearing-impaired people or
for other than face-to-face communication situations, and it uses only one
level of intelligibility.
The Speech Transmission Index (STI) takes into account volume and
reverberation time of the room, noise level, and distance between talker and
listener, yielding a value similar to the AI. Research by the Netherlandsgroup that developed the STI shows this method to be a good predictor of
speech communication in a wide variety of conditions.
The sound level meter's A-weighting network can be a good predictor of
speech interference, and has the advantage of being inexpensive and easy to
use. Other interesting weighting networks have been proposed, but have not
been incorporated into the standard sound level meter.
42
Although the above schemes use different measurement methods, theproducts can be related in a fairly predictable way. For example, 70%monosyllable intelligibility can be achieved at an AI of 0.45 or an STI of0.55, which corresponds to a speech-to-noise ratio of about 1.5 dB.
Acceptability Criteria
There is general agreement that minimal or "just reliable" communicationcan take place at an Al of 0.3 to 0.45, but those who recommend these valuesgive little information about the use of this level of communication.Although the literature is virtually silent on the specific types and amountsof communication needed for various operations, there are numerousrecommendations for the range of background noise levels appropriate forcertain activities and spaces. Examples include lcvels of 56-66 dB(A) forshops, garages, and power plant control rooms, down to 21-30 dB(A) for largeauditoriums and concert halls.
The only references in the literature to the consequences of degradedspeech tend to be anecdotal or subjective. In the military, however, itshould be obvious that normal patterns of communication can break down inomergencies, and the consequences of misunderstood instructions can be asserious as destruction of expensive property, or even loss of life.
Detection of Warning Signals
Because a warning signal is detectable does not necessarily mean it willbe effective. Ideally, a signal should be at least 15 dB but no more than 25dB above its masked threshold. Temporal, spectral, and ergonomic aspectsshould emphasize attentiorn demand, relevance, and appropriate level ofpriority, without being unduly aversive.
IX. RESEARCH RECOMMENDATIONS
1. Probably the most important information about the effects of noiseon military speech communication would be an assessment of the consequences ofcommunication failures. Because servicemen, and especially aircrews, have"admirable tendencies to refrain from complaining" (see Money, 1981), thisinformation is not easily gained. Perhaps the best approach would be acarefully worded survey of personnel working in high-noise environments, suchas tanks and helicopters, which would promise anonymity.
2. Another difficult but important project is to assess the type,
amount, spectrum, dynamic range, actual content, and intelligibility of speechcommunication needed for the most efficient conduct of specific tasks. Oncethese factors are known, communication systems can be successfully matched tothe various tasks.
43

3. A worthwhile research area that has received very little attentionin this country is the effect of high levels of vocal effort on the larynx andthe incidence of vocal abnormalities and pathologies among personnel whocommunicate in high noise levels. A related topic would be the influence ofvocal strain and intense vibration (as in helicopters and tanks) on speechintelligibility.
4. A final area would be an assessment of the adequacy of auditorywarning signals in view of the research and guidelines of Patterson and hiscolleagues.
44

REFEPENCES
Allen, J.B. and Berkley, D.A. Image method for efficiently simulating small-room acoustics, a s11, 943-950, 1979.
Anon. Noisy work situations may impair vocal cords, 3. Amae. Mai. Annas,,2A±, 2133, 1979.
ANSI. American National Standard Method for Measurement of Monosyllabic WordIntelligibility. ANSI 83.2-1960 (R1982).
ANSI. American National Standard: Methods for the Calculation of theArticulation Index, ANSI 83,5# 1969.
ASA, Acoustical Society of America. Proposed American National StandardMethod for Measuring the Intelligibility of Speech Over Communication Systems,ANSI S3.2-198X, (First draft, July 1988).
ASA. Acoustical Society of America, American National Standard Method forDetermining the Electrical Level ot Speech. ANSI 83.38, 190X, (Draft datedSeptember 1986),
ABA. Acoustical Society of America. American National Standard for RatingNoise with Respect to Speech Interference, ANSI 83.14, 1977.
Beattile, R.C, Comfortable speech listening levels: Effects of competitionand instructions. Am. a. in., 2, 192-199, 1982,
Beattie, R.C. and Himes, B.A. Comfortable loudness levels for speech:Effects of signa1-,to-noise ratios and instructions. a_. Aud. -AA., 24, 213-229, 1984.
Beranek, L.L. Revised criteria for noise in buildings. Noise cntrnil., 1,19-27, 1957.
Beranek, L.L. Acoustica. N.Y.: MoGraw-Hill, 1954.
Beranek, L,L. Noise control in office and factory spaces. Ind. Hyg.round,A, Tang. Mullf. 11, 26-33, 1950.
Beranek, L.L. Blazier, W.E., and Figwer, J.J. Preferred noise criterion(PNC) curves and their application to rooms. J. Aeoumt. Son. Am., Ul, 1223-1228, 1971.
Bilger, R.C, Speech recognition test development. Ih M. Elkins (Ed.) SpeechRecognition by the Hearing Impaired. AH ..Report&, 1A, 1984.
Bldck, J.W. Reception of repeatod and overlapping pepeoh patterns. J.A&coUst. Ron. Am., 21,. 494, 1955.
45
Black, .J.W. Accompaniments of word intelligibility. J. Speaeh Hear. Diaord.,
,1., 409-418, 1952.
norchgrevink, H.M. Second language speech comprehension in noise - A hazardto aviation safety. In K.E, Money, (Ed.) Ial nnmmuniatina in Aviation.
NATO, Advisory Group for Aerospace Research Development. AGARD-CP-311, 1981.
Sradley, J.8. Predictors of speech intelligibility in rooms. aL _..Z.Ata.Aaq-.m-, AA, 837-845, 1986.
Iray, P.T. Equivalent peak level: A threshold-independent speech-levelweasure. •. A Ra. Am.., A#, 695-699, 1968.
braida, L.D., Durlacho N..,, Lippmann, R.P., Hicks, B.L., Rabinowitz, W.R.,and Reed, C.M. Hearing aids: A review of past research on linearamplification, amplitude compression, and frequency lowering. Ame. speeh
14ea.4n 1eaw , , 1979.
Brandy, W.T. Reliability of voice tests of speech discrimination. C.
HaA.L-...a, .9, 461-465, 1966.
Broadbent, D.E. parnaepin~I a&nd Qmmuninatin. London, Pergamon, 1958.
CHAZA. Committee on Hearing, Bioacoustics, and Biomechanics. Guidelines forNoise and Vibration Levels for the Space Station. NASA Contractor Report178310, National Aeronautics and Space Administration, Washington, D.C., 1987.
CHABA. Committee on Hearing, Bioacoustics, and Siomechtnics. The Effects ofTime-Varying Noise on Speech intelligibility Indoors. Report of Working Group83. Washington, D.C., National Academy Press, 1981.
CHABA. Committee on Heuring, Bioacoustics, and Biomechanics. A proposedstandard fire alarm signal, .7 tAua•- n. Am-, A.l, 756-757, 1975.
Clarke, F.R. Technique for evaluation of speech mystems. Stanford Researchinstitute Project 5090, U.S. Army Electronics Laboratory, Contract DA 28-043AMC-00227 (t), 1965.
Coleman, G.J,, Graves, R.J., Collier, S.G., Golding, D., Nicholl, A.G. MoK.,Simpson, G.C., Sweetland, K.F., and Talbot, C.F. Communications in noiayenvironments. Final Report on CEC Contract 7206/00/8/09. Institute of Occup.Mod., National Coal Board, Burton-on-Trent, U.K., 1984.
Deatherage, B.H. Auditory and other sensory forms of informationpresentation. Xn: H.P. Van Cott and R.G. Kir'kade (Ed,.), Human EngineeringGuide to Equipment Design. Wash., D.C., U.S. Govt. Printing Oftice, 1972,
DoD. Department of Dtfense. Humani engineering design criteria foL militarysystems, equipment and facilities. MIL-STD-1412C. Washington, D.C., 1981.,.
Dugal, R.L., Braida, L.D. and Curlach, N.I. Implications of prtvi.olsresearch for the ,,electi*•n of frequency-gain characteristicn. In G.Studebaker and I. Hoohberg (Edo.) A•n;u;tg.JA; Factgrs Afefatting HjxAgAidftrfrfmannc. Baltimore: Univ. Park Press, 1980.
46

EPA. U.S. Environmental Protection Agency. information on levels ofenvironmental noise requisite to protect public health and welfare with anadequate margin of safety. EPA 550/9-74-004. Washington, D.C., 1974.
Fairbanka, G. Test of phonemic differentiation: The Rhyme Test. J_ Anu.at...goa Am, ,U, 596-600, 1958.
Florentine, 4. Speech perception in noise by fluent, non-native listeners.Ssupso.", , 5106, 19es.
French, N.R. and Steinberg, J.C. Faotors governing the intelligibility ofspeech sounds. . knt.u4.fe•e k , 1., 90-119, 1947.
Frick, F.C. and Sumby, W.H. Control tower language. J7 Aaou-t- AOna.- ,24, 595-596, 1952.
Gardner, N.B. Effect of noise, system gain, and assigned task on talkinglevels in loudspeaker communication. .An. Alp, 955-965, 1966.
Garinther, G.R. and Hodge, D.C. Effant of tha M2a oaetova mMa2 and hood onapmanh 4n•ali •ifitty anA vgena lyAvl. U.S. Army Human Engineearing Lab., TM19-87, Aberdeen Proving Ground, MD, 1987.
Harris, J.D. Pure-tone acuity and the intelligibility of everyday speech. 1.Antu. Sae. uAm., U7, 824-830, 1965.
Harris, J.D. Combinations of distortions in speeoht The twenty-five percentsafety factor by multiple-cueing. AXieh. Qn•o1•ygnq1., 22, 227-232, 1960.
Harris, J.D., Haines, I.L., Kelsey, P.A., and Clack, T.D. The relationbetween speech intelligibility and eleotroacountic characteristics of lowfidelity circuitry. L R.., I, 357-381, 1961.
van llcusden, M., Plomp, R., and Polo, L.C.W. Effect of ambient noise on thevocal output and the preferred listening level of conversational speech.Appliad ACOustjo&, 12., 31-43, 1979.
Hirth, I.J,, Davis, H., Silverman, S.R., Reynolda, E.G., Eldert, M., andBenson, R.W. Development of materials for speech audiometry. J. Sp~efh Hear.Qig,•. 1.., 321-337, 1952.
Holmses A.F#r Frank, T., and Stoker, R.G. Telephone listening ability in anoisy background. _ax.and Hoa-Ing, 4A, 88-90, 1983.
Hood, J.D. and Poole, J.P. Improving the reliability of speech audiometry.rit•. J. of Audiol., 11, 93-101, 1977.
HormTanne H. and Ortscheid, J. Minfluss von Larm aut Lernvorqangeversohiaden•r zeitlicher Erstreckung. Foruchungsbericht 81-1050104/01 des Umweltbundesamtes, Berlin, 1981.
47
House# A.S., Willi4ms, C.S., looker, M.H.L., and Kryter, K.D. Articulationtesting methods: Consonantal differentiation with a closed-response set. L.
Houtgast, T. and Steeneken, H.J.M, Experimental verification of the STI: Avalid basis for setting indoor noise level criteria. In G. Rossi (Ed.)PEra -edinaa tf the rourth International congroan nn Noina an a Publin Health
I'm..aL. Centro Ricerohe e Studi Amplifon, Milan, Italy, 1983.
Houtgast, T. Indoor speech intelligibility and indoor noise level criteria.In J.V. Tobias, 0. Jansen, and N.D. Ward (Eds.) Praga 'ngs mf fho ThirdTprtnatifnval .ngLr4AA nn jNresas sa 3uhl•e Halth Pbnhgom. ASHA Reports 10,Ameridan Speech-Language-Hearing Assoc,, Rockville, MD, 1980.
Hudgins, C.V., Hawkins, J.1., Karlin, J.A., and Stevens, B.S. The developmentof recorded auditory tesots for measuring hearing loss for speech.
Lax~~aa~~a,11t 57-89p 1947.
Humes, L..,, Boney, S,, and Loven, F. Further validation of the $peachTransmission Index. 7. Apaenh O•-a Rg. , U, 403-410, 1987.
Humea, L.E., Dirks, D.D., Bell, T.5., Ahlstrom, C., and Kincaid, G.E.Application of the Articulation Index and the Speech Transmission Index to therecognition of speech by normal-hearing and hearing-impaired listeners. jLApaggh Hair, Ron., 2.1, 447-462, 1986.
Jerger, J., Specks, C., and Trammell, J.L. A new approach to speechaudiometry. .3 psalmb BaAL.niuazL., U, 318-328, 1968,
aones, D. and Broadbent, D. Side-effects of interference with speech bynoise. 0,nom&, 22, 1073-1081, 1979.
Kalikow, D.N., Stevens, K.N., and llliott, L.L. Development of a test ofspeech intelligibility in noise using sentence materials with controlled wordpredictability. J. Afncnu. Sn-. Am.., 1i, 1337-1351, 1977.
Kamm, C.A., Dirks, D.D., and Bell, T.8. Speech recognition and theArticulation Index for normal and hearing-impaired listeners. 7.AM#, 22, 281-258, 1985.
Klinghols, F., Siegert, C., Schleier, E., and Thamm, R. LarmbedingteStimmatorungen bei Angehorigen untersachiedlicher Berufagruppen. MKNO-2axis,3/3, 193-201, 1978.
Klumpp, R.G. and Webster, J.C. Physical measurements of equally speechinterfering navy noises. 3. A.aount. R. Am., U, 1328-1338, 1963.
Klumpp, R.G. and Webster, J.C. USNEL flight deck communications system: Part5, message analysis and personnel response. NEL Rep. 926, 1960.
Kreul, E.J., Nixon, J.C., Kryter, K.D., Bell, D.W., Lang, J.S., and. Schubert,L.D. A proposed clinical test of speech discrimination. 1,. 39jeh Hear.E.L., 1.1, 536-552, 1968.
48
Krytex, K.D. Phyaingina1. ;aynhegAtaal, and M4al Elfoa cof Noias. NASAReference Publication 1115, National Aeronautics and Space Advinistration,Washington, D.C., 1984.
Kryter, K.D. The Effectsa of Noise on Man. New York: Academic Press, 1970.
Kryter, K.D. Methods for the calculation and use of the Articulation Index.3. knsuat. gan. Am., U•, 1689-1697, 1962a.
Kryter, K.D. Validation of the Articulation Index. - Aaouimt. 5aa. Am., ... ,1698-1702, 1962b..
Kryter, K.D. Effects of ear protective devices on the intelligibility ofspeech in noise, 7. Aeioun. Soo. Am. 11, 413-417, 1946.
Kryter, K.D. and Williams, C.E. Some factors influencing human response toaircraft noise: Masking of speech and variability of subjoctive judgements,rAA-ADS-42, June 1965.
Kuttruff, H. Fnnm Acoustics. London: Applied Science Publishers, 1973.
Lacroix, P.G., Harris, J.D,, and Randolph, K.J. Multiplicative effects onsentence comprehension for combined acoustic distortions. a- Agemah Near.
BAL., 21, 259-269, 1979.
Lazarus, H. Literature reviews 1978-1983 in German language on noise andcommunication., In 0, Rossi (Ed.) 2-meadin•a• the W~urh Tnfe~rnatiOIAI
Ca"Xgaaa on NoJa. am ak uhblo Health .Rrolam. Centre Ricercho a StudiAmplifono Milan, Italy, 1983.
Levitt, H, and Rabiner, L.R. Predicting binaural gain in intelligibility andrelease from masking for speech. J. Aauat. son. Am., Al, 820-829, 1967.
Licklider, J.C.R. Audio warning signals for Air Force weapon systems, WADDTR-60-814, Dayton, OH, Wright-Patterson AFB, 1961.
Licklider, J.C.R. and Pollack, I. Iffects of differentiation, integration andinfinite peak clipping upon the intelligibility of speech. Acoust.Am,., 2&, 42-51, 1948.
Littler, T.S. RhgaLng nj1La Car. London: Pergamon, 1965.
Lochner, J.P.A. and Burger, J.F. The influence of reflectiona on auditoriumacoustics. 3a, Rund Vib., 1, 426-454, 1964.
Lower, M.C. and Wheeler, P.D. Spealfying tha sound -levAlsa-to auditwI s, Paper presented at the 9th Congress of theInternational Ergonomics Association. Bournemouth, England, 1985.
Loftiss, E. An evaluation of the effects of selected psychophysical methodsand judgmental procedures upon comfortable loudness judgments of connectedspeech. Unpubl. doctoral diss., Univ. Illinois, 1964.
49

MacKeith, N.W. and Coles, R.R.A. Binaural advantages in hearing of speech.J. Laryng. Oeal., Al, 213-232, 1971.
Mankovsky, V.S. Anouati4 of StdAuiea n eiditoria., C. Gilford (Ed.), A.G.Clough (Trans.). Londonz Focal Press, 1971.
Martin, D.W., Murphy, R.L. and Meyer, A, Artioultion reduction of combineddistortions of speech waves, J. knnuat, an4, n,, I21, 597-601, 1956.'
Mayer# M.S. and Lindburg, A.W. Electronic voice communications improvementsfor Army aircraft. Zn 1.E, Money (Ed.) i nmunit•un in kyitin, NATO,Advisory Group for Aerospace Research Development. AGAOD-CP-311, 1981.
McKinley, R.L. Voice communication research and evaluation system. :n K.E.Money (Ed.) Ara.Lcnmmuliaeation in Aiatin, NATO, Advisory Group forAerospace Research Development. AGARD'CP-311, 1981.
Miller#, G.A. The masking of speech, Rough-uU..,, A4., 105-129, 1947.
Miller#, G.A, Rleise, G.A., and Lichten, W. The intelligibility of speech as afunction of the context of the test materials. ZL.. Payah-, Al, 329-335,1951.
Money, K.E. Technical evaluation report. In K.2, Money (Ed.) AualQemmunidat inns in Avia. ni,. NATO, Advisory Group for Aerospace ResearchDevelopment. AGARD-CP-31%, 1991.
Moor*r T.J., Nixon, CW,, and McKinley, R.L. Comparative intelligibility ofspeech materials processed by standard Aix Force voice communication systemsin the presence of simulated cockpit noise. In K.M. Money (Ed.) Lx.ltminieatigns in Avlatdinf, NATO, Advisory Group for Aerospace ResearchDevelopment. AGARD-CP-311, 1981.
Moser, HI.M. and Dreher, J.J. Phonemic confusion vectors. J. Acoust. goo.ma1, 2.2, 074.-881, 1955.
Moser, H.M. and Dreher, JJ. Effects of training on listeners inintelligibility studies. L Agist, Soc. Am., 2,"L, 1213-1219, 1955.
Moser, H.M., Dreher, J.J., and Adler, R.F. Project 519, Rept. No. 11, AFCRC-TR-54-81, 1954.
Mosko, J.D. "Clear speech." A strategem for improving radio communicationsand automatic speech recognAtion in noise. In K.E. Money (Ed,) AuralCommunioatians inAyiation, NATO, Advisory Group for Aerospace ResearchDevelopment. AGARD-CP-311, 1981.
Nabelek, A.K. Acoustics of enclosed spaces for linguistically impairedlisteners. In G. Rossi (Ed.) Hnis, as a Public Health P-blar: 2m dingothe.For.thIntarnational CongrsAs. Centre Ricerche e Studi Amplifon,Milan, Italy, 1983.
50

Nabelek, A. Distortions and age effect on speech in noise. In J.V. Tobias,G. Jansen, and W.D. Ward (Eds.) Prnagedingm of the Third IntarnationalCongraga on NnO~m 3A, a Public liealth Problem: ASHA Reports 10, AmericanSpeech-Languagtt-Hearing Assoc., Rockville, MD, 1980.
Nabelek, A.K. and Pickett, J.M. Reception of consonants in a classroom asaffected by monaural and binaural listening, noise, reverberation, andhearing aids. J. Acoust. Son, Am., 5fi, 628-639, 1974.
Nabelek, A.K. and Robinette, L. Reverberation as a parameter in clinicaltesting. hinJ.gy., 12, 239-259, 1978.
NAVSHIPS. Shipboard Aviation Maintenance Communication, 0900-072-2010, 1972.
Parker, D.E., Martens, W.L., and Johnston, P.A. Influence of auditoryfatigue on masked speech intelligibility. J. Agouaj. Am., Al, 1392-1393,1980.
Patterson, R.D. Auditory warning syntema for high-worklnad nvronrmeintn.Paper presented at the 9th Congress of the International Zrgonomics Assoc.,Bournemouth, England, 1985.
Patterson, R.D. Guidolines for Auditory Warning Systems on Civil Aircraft,CAA Paper 82017, Civil Aviation Authority, London, 1982.
Pearsons, K.S. Standardized methods for ireasuring speech levels. In G. Rossi(Ed.) Prooandings of the Fourth International "onqgrmaf on Woise a a. PublicHnaalth ProBlem. Centro Ricerohe a Studi Amplifon, Milan, Italy, 1983.
Pearsons, K.S. Communication in noise: Research after the 1973 Congress onNoise as a Public Health Problem. In J.V. Tobias, G.J. Jansen, and W.D. Ward(Eds.) Proceedings of the Third International Congress on Noise an a PubliaHeialth Problem. ASHA Reports 10, The American Speech-Language-HearingAssocietion, Rockville, Maryland, 1980.
Pearsons, K.S., Bennett, R.L., and Fidell, S. Speech Levels in Various NoiseEnvironments. EPA-600/1-77-025. U.S. Environmental Protection Agency, 1977.
Peterson, G.E. and Lehiste, I. Revised CNC lists fox auditory tests. J.Spnenh Hear. Dis=d, 22, 62-70, 1962.
Picheny, M.A., turlach, N.I., and Braids, L.D. Speaking clearly for the hardof hearing II: Acoustic characteristics of clear and conversational speech.J..•p. and Hear. Res.. 2a, 434-446, 1986.
Picheny, M.A., Durlach, N.I., and Braida, L.D. Speaking clearly for the hard.of hearing I: Intelligibility differences between clear and conversationalspeench. J. Sp. and Hear. Res., 28a, 96-103, 1985.
Pickett, J.M. Effects of vocal force on the intelligibility of speech sounds.J.Acoust- Sno. Am.,, 2a, 902-905, 1956.
51

Platte, H. J. Kouzeption sines "sinnvollen" Sprachverstandnistests unterStorschalleinfluss. Z.- H a ke-Akumtfk, 11, 208-222, 1979.
Platte, H. J. Probleme bei Sprachverstandnistests unter Storschalleinfluss.2. Horgerate-Akuatik, 11., 190'207, 1978.
Plomp, R. Binaural and monaural speech intelligibility of connected discoursein reverberation as a function of azimuth of a single competing sound source(speech or noise). &uaitjaat.. 2, 200-210, 1976.
Plomp, R. Ditoh of complex cones. .. "aust. Soe. Am., J1# 1526-1533, 1967.
Pollack, 1. Speech intelligibility at high noise levels: Effect of short-term exposure. 6. AnagUtL,=, Am., 3A, 282-285, 1958.
Pollack, 1. and Pickett, J.M. Masking of speech by noise at high soundlevels. J. Aount. Soc. Am., U, 127-130, 1958.
Pole, L.C.W., van Heusden, E., and Plomp, R. Preferred listening level forspeech disturbed by fluctuating noise. Applied Acountica, la, 267-279, 1980.
Rabbitt, P.M.A. Channel capacity intelligibility and immediate memory.Quart, a. Emt Psych., 2&, 241-248, 1968.
Rabbitt, P.M.A. Recognition: Memory for words ),',rd correctly in noise.Pxyghonomii.saianca, IL, 383-384, 1966.
Richards, D.L. Teleom mun4iation hy RSpaaht The TreAnmiamign Peaormanoa ogfTelephone Networirk. London: Butterworths, 1973.
Rood, G.M., Chillary, J.A., and Collistor, J.B. Requirements and applicationof auditory warnings to military helicopters. Paper presented at the 9thCongress of the International Ergonomics Asuooiation. Bournemouth, England,1985.
Rubenstein, H. and Pollack, I. Word predictability and intelligibility. J.Verb. Larn. Verb. Behay., 2,, 147-158, 1963.
Rubenstein, H., Decker, L., and Pollack, I. Word length and intelligibility.tang. Soc, 2., 175-177, 1959.
Rupf, J.A. Noise effects on passenger communication in light aircraft. PaperNo. 770446, Soc. Automot. Eng., Warrendale, PA, 1977.
Schaenman, H. Factors influencing judgment of the level of most comfortableloudness (MCL) for speech. Unpub. M.A. thesis, Brooklyn College, 1965.
Schleier, E. Klinische und stroboskopische Befunde bei Larmarbeitern. DrGsaundh.-Wesen, •32, 123-126, 1977.
Schultz, T.J. Predicting sound pressure levels in furnished dwellings andoffices. J. Acount. Soc. Am., S _.1, 71, S90, 1984.
52
Silverman, S.R. and Hirsh, !.J. Problems related to the use of speech inclinical audiometry. Ann. OQto1 Rhinol. Laryngnl, SA, 1234-1244, 1955.
Skinner, M.W. and Miller, J.D. Amplification bandwidth and intelligibility ofspeech in quiet and noise for listeners with sensorinsural hearing loss.Audinolng, 22, 253-279, 1983.
Snidecor, J.C., Malbry, L.A., and Hearsey, E.L. Methods of training talkersfor increasing intelligibility in noise. ORSD Report 3178. New York: ThePsyohological 'Corp., 1944.
Sorin, C. and Thouin-Daniel, C. Effects of auditory fatigue on speech, intelligibility and logical decision in noise. . A- oste. Rsei. Am., U, 456-
466, 1983.
Speaks, C. and Jerger, J. Method for measurement of speech identification.1. Apsanh aar- Ran. , A, 185-194, 1965.
Steoneken, H.J.M. .nd Houtgast, T. Comparison of some methods for measuringspeech levels. Institute for Perception TNO Report IZF 1978-22. Soesterberg,Netherlands, 1978.
Suter, A.H. The ability of mildly hearing-impaired individuals todiscriminate speech in noise. U.S. EPA and U.S. Air Force joint report: EPA550/9-78-100 and AMRL-TR-78-4, Washington, D.C., 1978,
Swets, J.A., Green# DM., Fay, T.H., Kryter, KD-., Nixon, C.M.,Riney, J.S., Schultz, T.J., Tanner, W.P. and Whitcomb, M.A. A proposedstandard fire-alarm signal. J. Anguat. Ron. Am., U., 756-757, 1975.
Thorndike, E.L. and Lorge, 1. T1ha Taagharln Word Rk of 10 -. 2ndEd. New York: Columbia Univ. Press, 1952.
Thwing, E.J. Effect of repetition on articulated scores for PB words. J.,Aiust. Sar• Am-, 2., 302-303, 1956.
Tillman, T.W. and Carhart, R. An expanded test for speech discriminationutilizing CNC mont Ilabic words. Northwestern University Auditory Test No.6. Tech. Rep. SAM-TR-66-55, U.S.A.F. School of Aerospace Medicine, AerospaceMod., Brooks AFB, TX, 1966.
Tolhurst, G.C. Effects of duration and articulation changes onintelligibility, word reception, and listener preference. J. Speach Hear.DnanxdL, 2., 328, 1957.
Tolhurst, GC. The effect on intelligibility scores of specific instructionsregarding talking. USAM Report NM 001 064 01 35. U.S. Naval Air Station,Pensacola, FL, 1955.
U.S. Army Test and Eval. Command. Operational intelligibility testing ofvoice communication equipment. Aberdeen Proving Ground MTP-6-3-521, AD718774, 1971.
53
Volers, W.D, Diagnostic evaluation of speech intelligibility in M.S. Hawley(Ed.) Sasigh !nt *114t•UhLil and ganeignitfen, Dowden, Hutchinson, & Ross,Stroudsburg, PA., 1977.
Webster, J.C. Noise and communication. In DM. Jones and A.J. Chapman (Ede.)Notai and Sooiety. London, John Wiley 6 Sons, 1984.
Webster, J.C. Communicating in noise, 1978-1983. In G..Rossi (Ed.) Noise asa Public Health Problem. Peaodings of the Vnurh Tntarnational QnngrxAn.Centro Ricerche a Studi Amplifon, Milan, Italy, 1983.
Webster, J.C. Speech interference aspects of noise. In D.M. Lipscomb (Ed.)Nglas and Audi61gay, Baltimore, Univ. Park Press, 1978.
Webster, J.C. Compendium of speech testing material and typical noise spectrato be used in evaluating communication equipment. Tech. Doe. 191. HumanFactors Div., Naval Electronics Laboratory Center, San Diegoo CA, 1972.
Webster, J.C. Relations between Speech-Interference contours and idealizedArticulation-lndex contours. .7 Anaust. son. Am.0 , , 1662-1669, 1964.
Webster, J.C. and Allen, C.R. Speech intelligibility in naval aircraftradios. TR 1830. Nay. Electronics Lab. Cent., San Diego, CA, 1972.
Webster, J.C. and Klumpp, R.G. Effects of ambient noise and nearby talkers ona face-to-face communication task. J. noIu~t. Soo. Am., 3U, 936-941, 1962.
Wilkins, P.A. and Martin, A.M. The effect of hearing protectors on theperception of warning sounds. In P.W. Alberti (Ed.) pa•nnnal HIaArinP.tAEMt..LnZ..Tndatry. Now York: Raven Press, 1982.
Williams, C.E., Mosko, J.D., ind Greene, J.W. Evaluating the ability of aircrew personnel to hear speech in their operational environments, Av.iaton,.Spana. & environ. Mod., Al, 154-158, 1976.
Williams, C.E., Forstall, J.R., and Parsons, W.C. The effect of earplugs onpassenge. speech reception in rotary-wing aircraft. NAMRL Rep, 1121. U.S.Naval Aerospace Med. Cent., Pensacola, FL, 1970.
54