the effects of non-recycled plastic (nrp) on … · figure 20: simplified process flow diagram of...
TRANSCRIPT

EARTH ENGINEERING CENTER CITY UNIVERSITY OF NEW YORK
1
THE EFFECTS OF NON-RECYCLED PLASTIC (NRP) ON
GASIFICATION: A QUANTITATIVE ASSESSMENT
Demetra A. Tsiamis and Marco J. Castaldi
Earth Engineering Center | City College
City University of New York
April 30, 2018

EARTH ENGINEERING CENTER CITY UNIVERSITY OF NEW YORK
2
THE EFFECTS OF NON-RECYCLED PLASTIC (NRP) ON GASIFICATION: A
QUANTITATIVE ASSESSMENT
EXECUTIVE SUMMARY
This study measures the effects of increasing the percentage of non-recycled plastics (NRP) in
the feedstock for the Enerkem gasification to methanol process. Gasification transforms
materials, including post-recycled municipal solid waste (MSW), into a useable gaseous product
called synthesis gas (syngas). The syngas is comprised of hydrogen (H2) and carbon monoxide
(CO). Subsequently, it can be combusted to produce electricity and heat or converted into basic
chemicals and fuels such as methanol and ethanol. For reasons discussed in this study,
gasification of non-recycled materials is environmentally beneficial compared to landfill. Most
gasification units process a single-material or homogenous waste stream such as biomass.
However, Enerkem, based in Montreal, Canada, in collaboration with the City of Edmonton in
Alberta, Canada, has commercialized a gasification system that processes a feedstock derived
from heterogeneous municipal solid waste (MSW) into methanol and ethanol.
NRP represents a valuable energy resource that is well suited to thermal conversion systems such
as gasification. A 2015 study done by The Earth Engineering Center (EEC) at The City College
of New York (CCNY) entitled “Determining Accurate Heating Values of Non-Recycled Plastics
(NRP)” found that NRP in the waste stream averaged 30.8 million Btu/ton (1). Since there are
practical limits on mechanical recycling, it is important to understand the environmental impacts
of alternatives to landfill, such as gasification to methanol. In a research study funded by the
American Chemistry Council, Plastics Industry Association (PLASTICS) and the Canadian
Plastics Industry Association (CPIA), the EEC | CCNY worked with the City of Edmonton to
conduct four separate trials on a pilot-scale gasifier that is the same design as Enerkem’s
commercial scale facility in Edmonton. Each trial used a blend of biomass with different
amounts of NRP: 0%, 8%, 15% and 50%. The main objective was to determine how increasing
percentages of NRP in the gasifier feedstock would impact the efficiency of the gasification
process, the yield of methanol, and the production of unmarketable byproduct.

EARTH ENGINEERING CENTER CITY UNIVERSITY OF NEW YORK
3
The study found that the performance of the gasification process improved as the amount of
plastics in the feedstock increased, resulting in:
up to 42% more methanol production
up to 28% improvement in thermal efficiency
up to 80% increase in syngas energy content and only a 2% increase in energy inputs
net displacement of as much as 21,000 tons of CO2 equivalents
decreased char/ash to landfill by up to 76%
Key Findings
In the Enerkem system, methanol production from the measured syngas would increase
by approximately 42% if NRP represented 50% of the gasifier feedstock compared to a
feedstock containing 100% biomass. For comparison purposes, using a theoretical
thermodynamic equilibrium calculation, 100 pounds of biomass would yield 1.99 gallons
of methanol, while a mixture of 50 pounds of plastics and 50 pounds of biomass would
yield 4.18 gallons of methanol.
Increasing NRP to 50% of the gasification feedstock would increase annual methanol
production of the Edmonton facility by 4.2 million gallons. Increased methanol
production offsets the use of petroleum sources for fuel and manufacturing, recovers
NRP otherwise destined for landfill, and reduces greenhouse gas (GHG) emissions. This
additional 4.2 million gallons of methanol derived from NRP and biomass equates to
displacement of 20,895 tons CO2, equivalent to removing 3,907 cars off the road.
Increasing the NRP in the feedstock increases the overall energy efficiency of the
Enerkem process. The energy input required to process the 50% NRP feedstock is
approximately 2% more than that required to process a 100% biomass feedstock.
However, the syngas energy content increased by 80% with a 50% NRP feedstock and
the higher energy content of the syngas also results in an energy savings because less
external energy is required for the methanol production process.

EARTH ENGINEERING CENTER CITY UNIVERSITY OF NEW YORK
4
Increasing NRP in the gasification feedstock results in less byproduct (char/ash) that is
typically landfilled. The amount of byproduct from the gasification process decreases by
76% in volume with a 50% NRP feedstock.
These findings demonstrate that the addition of NRP to an Enerkem-like gasification process
would improve its overall efficiency, increase its output of valuable products and reduce its
overall environmental footprint.

EARTH ENGINEERING CENTER CITY UNIVERSITY OF NEW YORK
5
CONTENTS
EXECUTIVE SUMMARY .......................................................................................................................... 2
Key Findings ............................................................................................................................................. 3
ACKNOWLEDGEMENTS .......................................................................................................................... 8
INTRODUCTION ........................................................................................................................................ 8
MSW Gasification for Methanol Production .......................................................................................... 12
THE CITY OF EDMONTON WASTE MANAGEMENT CENTER AND THE ENERKEM WASTE TO
FUELS AND CHEMICALS PROCESS .................................................................................................... 13
Overview ................................................................................................................................................. 13
City of Edmonton’s Waste Management Center (EWMC) .................................................................... 13
Materials Recovery Facility (MRF) .................................................................................................... 15
Integrated Processing and Transfer Facility (IPTF) .......................................................................... 20
Advanced Energy Research Facility (AERF) ...................................................................................... 23
Enerkem .................................................................................................................................................. 24
Process Description ............................................................................................................................ 24
Enerkem Facilities .............................................................................................................................. 26
NRP WASTE GASIFICATION PILOT STUDY ...................................................................................... 28
Feedstock Mixtures ................................................................................................................................. 28
General Description ............................................................................................................................ 28
Ultimate and Proximate Analyses of Feedstock.................................................................................. 29
Pilot Trials: Operating Conditions and Measurements ........................................................................... 30
IMPACT OF NRP ON WASTE GASIFICATION .................................................................................... 33
Methanol Production ............................................................................................................................... 33
Carbon Conversion and Energy Efficiencies .......................................................................................... 35
Environmental Impact ............................................................................................................................. 39
CONCLUSIONS......................................................................................................................................... 40
REFERENCES ........................................................................................................................................... 41

EARTH ENGINEERING CENTER CITY UNIVERSITY OF NEW YORK
6
LIST OF FIGURES
Figure 1: Sustainable Waste Management Hierarchy (Source: EPA) ......................................................... 9
Figure 2: Lower heating value of NRP compared to traditional fuels ....................................................... 11
Figure 3: City of Edmonton Waste Management Centre (EWMC) ............................................................ 14
Figure 4: City of Edmonton Waste Management Diversion Goals ............................................................ 15
Figure 5: Materials recovery facility (MRF) at EWMC ............................................................................. 17
Figure 6: Screen separation of waste at MRF ............................................................................................ 18
Figure 7: Manual sorting of materials at MRF .......................................................................................... 18
Figure 8: Separated materials at MRF ....................................................................................................... 19
Figure 9: Separated plastic tubs and lids at MRF ...................................................................................... 19
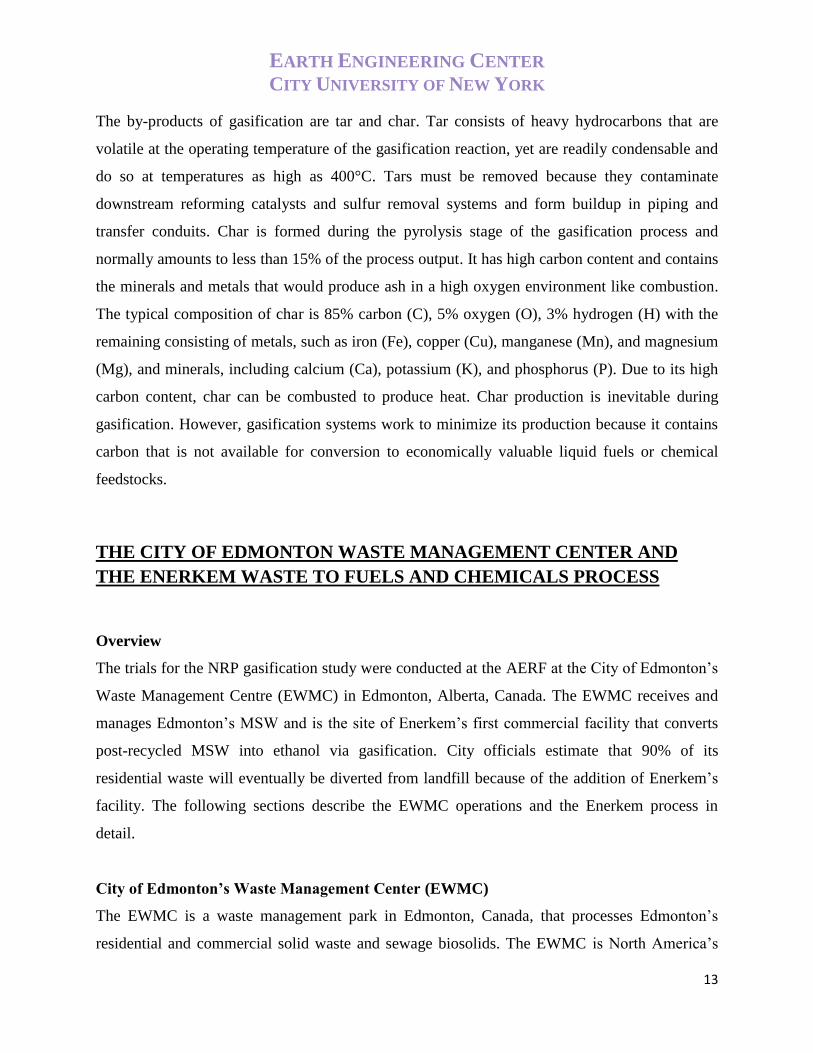
Figure 10: Baled plastic materials from MRF to be recycled into new products ....................................... 20
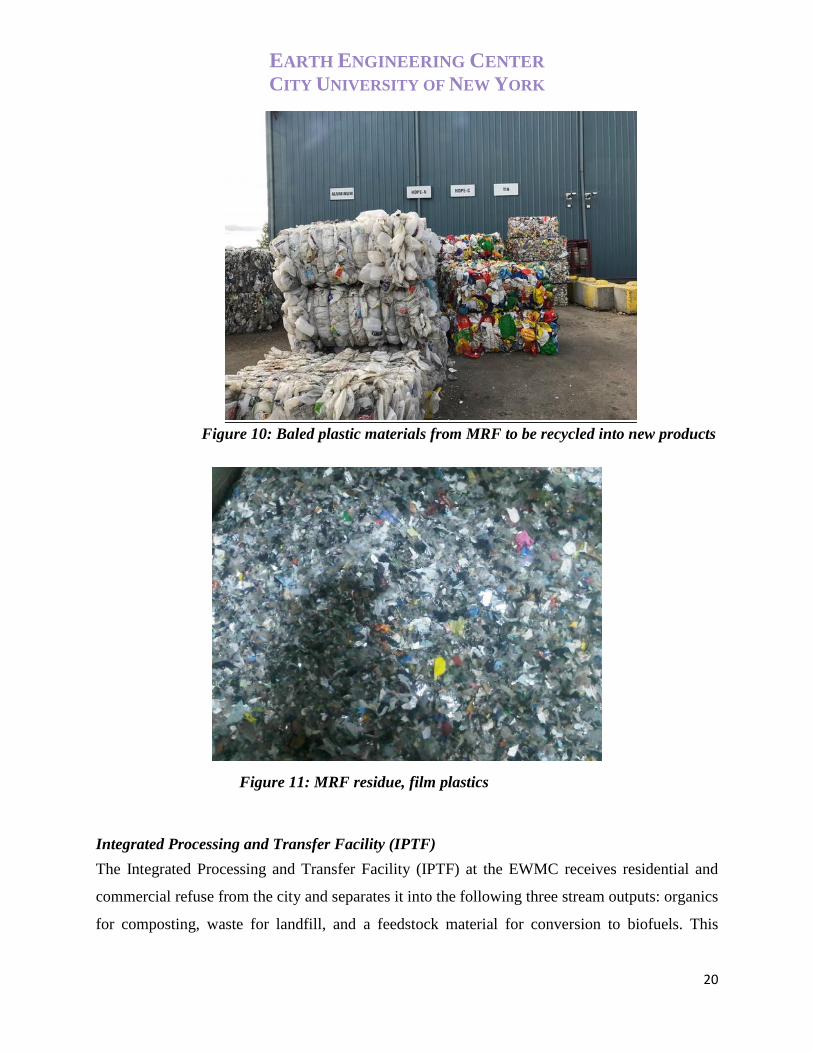
Figure 11: MRF residue, film plastics ........................................................................................................ 20
Figure 12: Residential and commercial solid waste received at the IPTF ................................................. 22
Figure 13: Waste collection area of the IPTF ............................................................................................ 22
Figure 14: Refuse derived fuel-like feedstock from the IPTF ..................................................................... 23
Figure 15: Steam from recently shredded feedstock fluff ........................................................................... 23
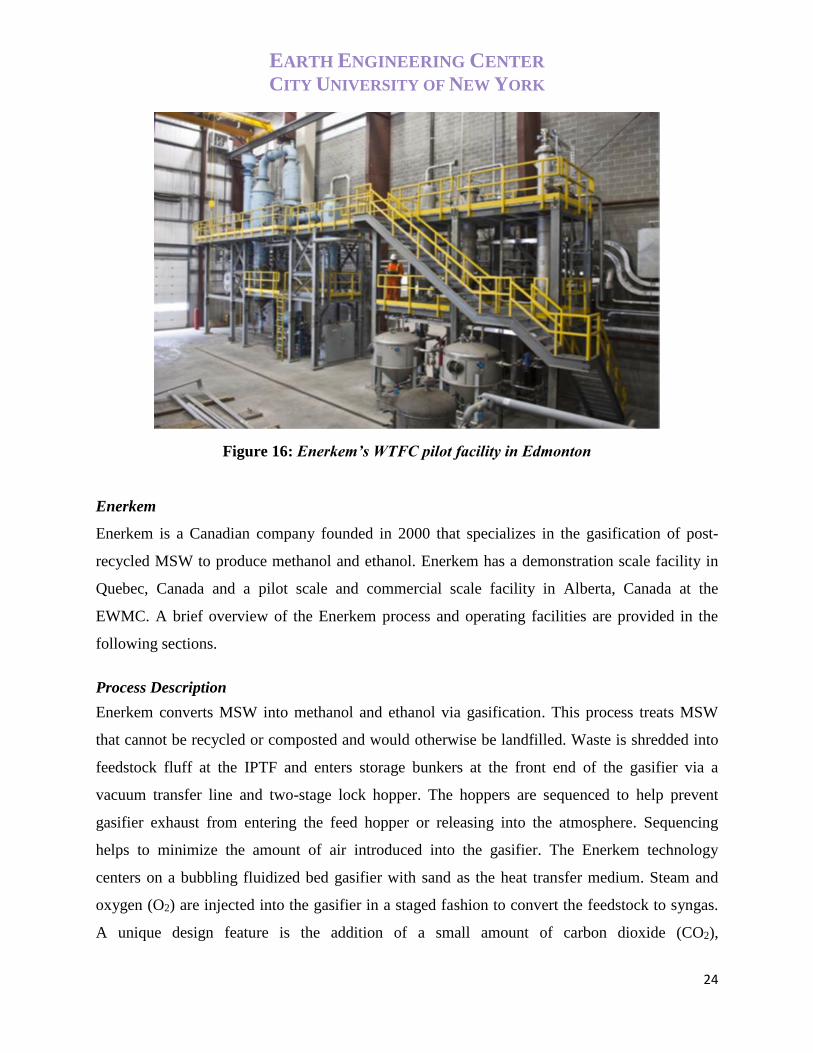
Figure 16: Enerkem’s WTFC pilot facility in Edmonton ............................................................................ 24
Figure 17: Simple Process Flow Diagram of Enerkem Gasifier System .................................................... 26
Figure 18: Enerkem's WTFC commercial facility in Edmonton ................................................................. 27
Figure 19: Syngas concentration trends for NRP pilot trials ..................................................................... 31
Figure 20: Simplified process flow diagram of syngas adjustment to achieve the necessary H2:CO ratio
and quality for methanol production. ......................................................................................................... 32
Figure 21: Ratio of Final Methanol Production for Plastic Feedstock Mixtures Compared to 100% Pure
Biomass Feedstock ...................................................................................................................................... 33

EARTH ENGINEERING CENTER CITY UNIVERSITY OF NEW YORK
7
Figure 22: Ratio of Methanol Production for Plastic Mixture Feedstocks compared to 100% Biomass
Feedstock, includes estimates from equilibrium model .............................................................................. 35
Figure 23: Higher Heating Value of Syngas from Pilot Trials ................................................................... 37
Figure 24: Thermal efficiencies of NRP pilot trials.................................................................................... 38
Figure 25: Ratio of Char Production for Plastic Feedstock Mixture Compared to 100% Pure Biomass
Feedstock .................................................................................................................................................... 39
LIST OF TABLES
Table 1: Items collected for recycling in City of Edmonton ....................................................................... 16
Table 2: Ultimate and Proximate Analysis of Feedstock Mixtures (As Received, weight %) ..................... 29
Table 3: Syngas composition from NRP pilot trials (mol %) ...................................................................... 31
Table 4: Carbon conversion efficiencies for NRP pilot trials..................................................................... 36

EARTH ENGINEERING CENTER CITY UNIVERSITY OF NEW YORK
8
ACKNOWLEDGEMENTS
The authors of this report would like to thank the City of Edmonton Waste Management Center
and Enerkem for their enthusiastic collaboration throughout this study. We thank them for
contributing their facilities, expertise, and time to ensure that we had the robust data and
operational insights that we needed to ultimately address the objective of this study We also
thank the American Chemistry Council, Plastics Industry Association and Canadian Plastics
Industry Association for funding this important research.

EARTH ENGINEERING CENTER CITY UNIVERSITY OF NEW YORK
9
INTRODUCTION
The U.S. generated approximately 258 million tons of municipal solid waste (MSW) in 2014
with approximately 53% sent to landfills (2). Landfilling this material uses green-field space,
contributes to greenhouse gas (GHG) emissions and wastes potentially valuable materials and
resources. Moreover, landfilling squanders the material and energy value that can be recovered
from MSW. Recycling conserves energy and creates new products while thermal conversion
captures the energy value in non-recycled MSW to produce electricity, heat, fuels and chemicals.
In 2014, the EPA calculated that 34.6% of the MSW in the U.S. was recycled (this includes
composting and anaerobic digestion) and 12.8% was sent to waste-to-energy (WTE) plants for
electricity production (2). Recently, states and municipalities across the U.S. have put forth
aggressive sustainability initiatives to reduce the amount of waste that is sent to landfills. For
example, New York City has pledged to send zero waste to landfills by 2030 as part of its
OneNYC plan (3). To achieve these ambitious landfill diversion goals, communities will require
new infrastructure and programs that reflect the Sustainable Materials Management’s (SMM)
focus on environmental outcomes and implement all facets of the waste hierarchy: reduce, reuse,
recycle, composting, digestion, and thermal conversion (see Figure 1). Additionally,
communities should explore the potential environmental and economic benefits that can be
realized from diverting the more valuable constituents in the waste stream, such as plastics, from
landfill.
Figure 1: Sustainable Waste Management Hierarchy (Source: EPA)

EARTH ENGINEERING CENTER CITY UNIVERSITY OF NEW YORK
10
Not all the MSW can be composted or recycled. Composting or anaerobic digestion is limited to
organics (e.g., yard trimmings and food scraps), which make up about 30% of MSW in the U.S.
(2). Mechanical recycling is limited by consumer access to collection programs, material
property constraints and the economic competitiveness of some post-use recycled material
compared to virgin material and products. For example, in NYC, approximately 33% of the
MSW can be recycled (4) but in 2015, only 16% of the MSW was actually recycled (5). This
indicates that approximately half of the recyclables in NYC are being discarded. If reuse,
composting, digestion, and recycling were practiced to their full potential, approximately 70% of
MSW in the U.S. could be diverted from landfills. This is based on waste characterization studies
from megacities (defined to be cities within the population range of 10 million) similar to NYC
(4). This means that, even in an ideal situation, approximately 30% of MSW generated would
still need to be managed. Energy recovery, which includes waste-to-energy (WTE), gasification
and pyrolysis, can help address this remaining 30% by converting it to a usable product such as
electricity, heat, fuels or chemicals.
The 2015 EEC | CCNY study (1), “Determining Accurate Heating Value of Non-recycled
Plastics (NRP),” concluded that non-recycled plastics in MSW had an energy value of 30.8
million Btu per ton, which is 19% higher than petroleum coke and 37% higher than the average
coal mined in the U.S. Therefore, landfilling plastics is essentially burying an energy resource.
Plastics are more energy dense than organics because of their chemical make-up. They consist of
long chains of hydrogen and carbon molecules that contain more energy than oxygenated
molecules that comprise biomass. Non-recycled plastics (NRP) include items such as multi-
layered films, foams, and non-durable goods such as plates, cups and cutlery. A 2014 study by
Themelis and Mussche found that the approximately 32.5 million tons of NRP discarded in
landfills contained enough chemical energy to power 5.7 million households in the U.S. for a
year if used as fuel in WTE plants (6). Figure 2 is from the Themelis and Mussche study and
compares the energy content in NRP to that of traditional fuel sources.

EARTH ENGINEERING CENTER CITY UNIVERSITY OF NEW YORK
11
Figure 2: Heating value of NRP compared to traditional fuels
Because of its molecular makeup, NRP represents a valuable feedstock for gasification and
pyrolysis technologies to produce versatile gaseous products (i.e. synthesis gas or syngas), fuels
or chemicals. One example is the Waste-to-Biofuels-and-Chemicals (WTFC) process developed
by Enerkem. Enerkem’s system is designed to gasify post-recycled residual from MSW into
methanol and eventually ethanol. Methanol (CH3OH) is mainly produced from natural gas but
can also be derived from oil or coal. These energy resources are obtained through mining,
drilling, and other extraction techniques. Methanol is a primary chemical building block for
many different chemicals including acetic acid used to make products such as polyester fibers,
wood glue and even vinegar. Methanol can also be converted into ethanol (C2H5OH) for use as a
transportation fuel. In 2013, 59,000 metric tons of methanol were consumed globally (7). North
America is the largest methanol-consuming region in the world (8). The methanol industry is
working to derive methanol from biomass-based material and reduce its use of fossil energy
resources.

EARTH ENGINEERING CENTER CITY UNIVERSITY OF NEW YORK
12
It is important for communities to understand the environmental and economic impact of various
waste materials. Municipalities can better utilize the principles of SMM, measure lifecycle
environmental outcomes and begin to incorporate alternatives to landfilling. The purpose of this
study was to quantify the operational performance and environmental impact that non-recycled
plastics have on methanol production from Enerkem’s MSW pilot-scale gasification process.
Trials were conducted at Enerkem’s pilot facility at the Advanced Energy Research Facility
(AERF) in Edmonton, Canada. Four different feedstock mixtures were tested: 100% biomass
(i.e. wood chips), 92% biomass/8% NRP, 85% biomass/15% NRP, and 50% biomass/50% NRP.
Detailed and comprehensive measurements were taken to assess the impact of NRP on methanol
production. The results of the NRP gasification pilot study are presented in this report.
MSW Gasification for Methanol Production
Gasification is a thermochemical process that reacts fuel with an oxidant in sub-stoichiometric
quantities to generate a synthesis gas (syngas). Syngas consists primarily of hydrogen (H2) and
carbon monoxide (CO), with lower concentrations of carbon dioxide (CO2) and hydrocarbons
such as methane (CH4). Syngas can be converted into fuels and chemicals via catalytic processes
such as the Fischer-Tropsch process. The Fischer-Tropsch process is a series of catalytic
chemical reactions that convert H2 and CO into liquid hydrocarbons. The Fischer-Tropsch
process has been used for nearly fifty years to gasify coal for conversion to liquid fuels.
Gasification processes generally operate within a temperature range of 700-1100 ˚C and occur in
two stages. In the first stage, hydrocarbons undergo pyrolysis. Pyrolysis is the thermal
decomposition and volatilization of hydrocarbons in the absence of oxygen and occurs at
temperatures less than 600 ˚C. In the second stage, the volatile hydrocarbons are heated in the
presence of a reactive gas to yield syngas. The typical reactive gases used in gasification are
steam, air, or pure oxygen. Gasification with steam is referred to as steam reforming and it
produces a syngas that is rich in H2 and CO2. Gasification with pure O2 creates a higher quality
syngas mixture of H2 and CO than air gasification which produces a syngas containing nitrogen
(N2.)
EARTH ENGINEERING CENTER CITY UNIVERSITY OF NEW YORK
13
The by-products of gasification are tar and char. Tar consists of heavy hydrocarbons that are
volatile at the operating temperature of the gasification reaction, yet are readily condensable and
do so at temperatures as high as 400°C. Tars must be removed because they contaminate
downstream reforming catalysts and sulfur removal systems and form buildup in piping and
transfer conduits. Char is formed during the pyrolysis stage of the gasification process and
normally amounts to less than 15% of the process output. It has high carbon content and contains
the minerals and metals that would produce ash in a high oxygen environment like combustion.
The typical composition of char is 85% carbon (C), 5% oxygen (O), 3% hydrogen (H) with the
remaining consisting of metals, such as iron (Fe), copper (Cu), manganese (Mn), and magnesium
(Mg), and minerals, including calcium (Ca), potassium (K), and phosphorus (P). Due to its high
carbon content, char can be combusted to produce heat. Char production is inevitable during
gasification. However, gasification systems work to minimize its production because it contains
carbon that is not available for conversion to economically valuable liquid fuels or chemical
feedstocks.
THE CITY OF EDMONTON WASTE MANAGEMENT CENTER AND
THE ENERKEM WASTE TO FUELS AND CHEMICALS PROCESS
Overview
The trials for the NRP gasification study were conducted at the AERF at the City of Edmonton’s
Waste Management Centre (EWMC) in Edmonton, Alberta, Canada. The EWMC receives and
manages Edmonton’s MSW and is the site of Enerkem’s first commercial facility that converts
post-recycled MSW into ethanol via gasification. City officials estimate that 90% of its
residential waste will eventually be diverted from landfill because of the addition of Enerkem’s
facility. The following sections describe the EWMC operations and the Enerkem process in
detail.
City of Edmonton’s Waste Management Center (EWMC)
The EWMC is a waste management park in Edmonton, Canada, that processes Edmonton’s
residential and commercial solid waste and sewage biosolids. The EWMC is North America’s

EARTH ENGINEERING CENTER CITY UNIVERSITY OF NEW YORK
14
largest waste processing and waste research facility. It is approximately 233 hectares (576 acres)
in size and receives an estimated 550,000 tons of waste per year (9). The main facilities at the
EWMC are the materials recovery facility (MRF), the integrated processing and transfer facility
(IPTF), and a composting facility. Additional facilities at the EWMC are the AERF, the Global
Electric and Electronic Processing Inc. (GEEP) E-waste recycling facility, and a construction &
demolition (C&D) waste recycling facility. The EWMC also contains a closed sanitary landfill
with a leachate treatment plant, landfill gas recovery facility, and bio-solid lagoons, The City of
Edmonton began operation of an anaerobic digestion facility in 2017 that complements the
operations of the composting facility (10). Figure 3 shows the close proximity of the all the
processing facilities at the EWMC.
Figure 3: City of Edmonton Waste Management Centre (EWMC)
The Enerkem Alberta Biofuels facility, also known as the Waste-to-Biofuels-and-Chemicals
(WTFC or WTB) facility, receives the non-recycled, non-composted MSW and gasifies it to
produce methanol that can be sold for commercial and industrial use. Enerkem began

EARTH ENGINEERING CENTER CITY UNIVERSITY OF NEW YORK
15
commercial operations of methanol production in 2015 and began ethanol production in late
2017 (11). As shown in Figure 4, with the addition of Enerkem’s WTFC facility, the EWMC
projects that it will achieve 90% diversion of the City of Edmonton’s residential waste with 20%
recycled (110,000 tons), 40% composted (220,000 tons), and 30% energy recovery via
gasification for biofuel production (165,000 tons) (9).
Figure 4: City of Edmonton Waste Management Diversion Goals
Materials Recovery Facility (MRF)
The MRF at the EWMC is approximately 6,000 square meters and processes up to 44,000 tons of
mixed recyclables annually (12). The MRF processes all types of recyclables accepted in the
City of Edmonton’s Blue Bag, Blue Bin, and Recycling Depot collection programs. The Blue
Bag program is for single-family homes, duplexes, fourplexes, and some townhouses. Residents
place commingled recyclables in blue transparent bags that are collected by the City of
Edmonton and processed at the MRF (13). The Blue Bin program is for residents in apartment

EARTH ENGINEERING CENTER CITY UNIVERSITY OF NEW YORK
16
complexes and the Recycling Depots are public repository stations where residents and
businesses can drop-off their recyclables. Table 1 lists items that are designated for recycling
under the City of Edmonton’s recycling program.
Table 1: Items collected for recycling in City of Edmonton
Glass
Jars and bottles
only
Metal
Cans
(food, beverage)
Aluminum cans,
trays, and pie
plates
Empty non-
hazardous aerosol
cans
Paper and Cardboard
Newsprint, flyers,
envelopes
Writing and
computer paper
(not shredded)
Paper egg cartons,
paper bags
Magazines and
paperbacks
Phone books
Cardboard boxes
(flatten and
remove liners)
Milk cartons, juice
boxes
Plastic
Household bottles
and containers
only (vinegar,
shampoo,
detergent,
pop/water, milk,
yogurt, margarine,
windshield
washer, etc.)
Grocery, retail,
bread and dry
cleaning bags
(stuff into one bag
and tie closed)
Source: Waste Management Services, City of Edmonton
Once collected and aggregated, recyclables are removed from the waste through a mostly
automated system. The collected recyclables are sent to a shredder where metal teeth rip open the
Blue Bags. Manual pick stations remove large un-desirable materials, such as propane bottles,
and remove plastic bags, including the blue bags. Paper is separated from containers based on
weight via an automated star screen separator and any contamination in the separated streams
(e.g., plastic items in the paper stream) is manually removed. The containers stream goes through
a trommel screen with a large magnet which removes tin cans, and glass is removed by a
separate machine. The remaining containers are sorted by hand (14). The sorted recyclables are
baled and sent to plastics reclaimers where they are processed and sold back into the commodity
markets in Alberta, British Columbia, the western U.S., and Asia (13).

EARTH ENGINEERING CENTER CITY UNIVERSITY OF NEW YORK
17
The sorting at the MRF yields a residue that accounts for approximately 10-15% of the MRF
output stream. Although it changes seasonally, the MRF residue is primarily comprised of film
packaging plastics. CCNY conducted analyses of MRF residue samples at its lab to determine
biogenic content and energy content. Biogenic content indicates how much carbon in the sample
is derived from biomass versus how much is derived from fossil resources. CCNY determined
that the average biogenic content of the MRF residue was approximately 33.5% by weight. This
means that on average approximately 66.5% of the MRF residue samples consisted of plastics.
The higher heating values (HHVs) of the MRF samples were analyzed via oxygen bomb
calorimetry and were determined to range from 28.4 to 36.4 MMBtu/ton (14,210 to 18,180
Btu/lb). On average, the heating value of MRF residue is 33% greater than the heating value of
U.S. coal. The MRF residue accounts for 10-20% of the RDF feedstock that is processed at the
Enerkem WTFC facility.
Figures 5-11 show photos of the EWMC’s MRF operations.
Figure 5: Materials recovery facility (MRF) at EWMC

EARTH ENGINEERING CENTER CITY UNIVERSITY OF NEW YORK
18
Figure 6: Screen separation of waste at MRF
Figure 7: Manual sorting of materials at MRF

EARTH ENGINEERING CENTER CITY UNIVERSITY OF NEW YORK
19
Figure 8: Separated materials at MRF
Figure 9: Separated plastic tubs and lids at MRF
EARTH ENGINEERING CENTER CITY UNIVERSITY OF NEW YORK
20
Figure 10: Baled plastic materials from MRF to be recycled into new products
Figure 11: MRF residue, film plastics
Integrated Processing and Transfer Facility (IPTF)
The Integrated Processing and Transfer Facility (IPTF) at the EWMC receives residential and
commercial refuse from the city and separates it into the following three stream outputs: organics
for composting, waste for landfill, and a feedstock material for conversion to biofuels. This

EARTH ENGINEERING CENTER CITY UNIVERSITY OF NEW YORK
21
feedstock is similar to refuse derived fuel (RDF) that could be combusted in a boiler or cement
kiln. The IPTF is approximately 19,100 square meters and is designed to process approximately
275,000 tons of waste annually (14). The three operational components of the IPTF are transfer
of waste, processing of waste and preparation of the feedstock for gasification. Transfer
operations at the IPTF previously involved collecting and transporting commercial waste to
landfills in Ryley and West Edmonton. These materials, which account for approximately 30%
of the IPTF’s annual throughput, will eventually be sent to the Enerkem facility for conversion to
ethanol.
For pre-processing of waste, the IPTF houses two 120-ton rotating screens with bag breaking
“spikes” to separate materials into different streams. Organics are separated into composting and
RDF feedstock streams based on size. Organics that are 2 to 5 inches in size are sent to the
composting facility and organics that are greater than 5 inches (generally, 5” to 9”) become part
of the RDF stream. An overland conveyor transports the organics to the composting facility. The
composting facility at the EWMC processes 176,000 tons of organics and biosolids annually to
produce compost for use in agriculture and horticulture (10). The City of Edmonton has
constructed an anaerobic digestion facility at the EWMC that is expected to process an additional
52,800 tons of organics per year to produce compost as well as heat and electricity (10). Metals
and inert materials, such as stones, are removed from the refuse stream at the IPTF. The
remaining waste is prepared into a feedstock for the WTFC.
Preparation of RDF – The Feedstock to the Enerkem WTFC Process
The third operation at the IPTF is the preparation of RDF-like feedstock. The feedstock stream
consists of approximately 80-90% material from the IPTF and 10-20% MRF residue by mass on
a wet basis. The feedstock is mechanically shredded into fluff. During mechanical shredding, the
feedstock is slightly heated from the mechanical handling and therefore partially dried. On
average, approximately 1,100 tons of waste is received at the IPTF per day and about 440 tons
per day are converted to this feedstock fluff (40% conversion). CCNY conducted an analysis of
the RDF and determined that the average biogenic content was 45.5% by weight and the HHV
ranged from 27.4 to 35.1 MMBtu/ton (13,680 to 17,530 Btu/lb). These findings are in general
agreement with the City of Edmonton’s estimation that the material breakdown of the feedstock

EARTH ENGINEERING CENTER CITY UNIVERSITY OF NEW YORK
22
stream is approximately 50% paper/50% plastic by mass. The feedstock is transported from the
IPTF to the Enerkem facility storage bunkers. Figures 12-15 show photos of the operations at the
EWMC’s IPTF and the RDF that is the feedstock for the Enerkem facility.
Figure 12: Residential and commercial solid waste received at the IPTF
Figure 13: Waste collection area of the IPTF

EARTH ENGINEERING CENTER CITY UNIVERSITY OF NEW YORK
23
Figure 14: Refuse derived fuel-like feedstock from the IPTF
Figure 15: Steam from recently shredded feedstock fluff
Advanced Energy Research Facility (AERF)
Enerkem’s pilot scale gasification process is housed in the AERF, which is adjacent to
Enerkem’s commercial facility. The AERF contains the pilot gasifier, analytical equipment and
laboratory space to assist Enerkem in the analysis, evaluation, and improvement of its plant
operations. The pilot facility, shown in Figure 16, has an operating capacity of approximately 8
tons per day.
EARTH ENGINEERING CENTER CITY UNIVERSITY OF NEW YORK
24
Figure 16: Enerkem’s WTFC pilot facility in Edmonton
Enerkem
Enerkem is a Canadian company founded in 2000 that specializes in the gasification of post-
recycled MSW to produce methanol and ethanol. Enerkem has a demonstration scale facility in
Quebec, Canada and a pilot scale and commercial scale facility in Alberta, Canada at the
EWMC. A brief overview of the Enerkem process and operating facilities are provided in the
following sections.
Process Description
Enerkem converts MSW into methanol and ethanol via gasification. This process treats MSW
that cannot be recycled or composted and would otherwise be landfilled. Waste is shredded into
feedstock fluff at the IPTF and enters storage bunkers at the front end of the gasifier via a
vacuum transfer line and two-stage lock hopper. The hoppers are sequenced to help prevent
gasifier exhaust from entering the feed hopper or releasing into the atmosphere. Sequencing
helps to minimize the amount of air introduced into the gasifier. The Enerkem technology
centers on a bubbling fluidized bed gasifier with sand as the heat transfer medium. Steam and
oxygen (O2) are injected into the gasifier in a staged fashion to convert the feedstock to syngas.
A unique design feature is the addition of a small amount of carbon dioxide (CO2),

EARTH ENGINEERING CENTER CITY UNIVERSITY OF NEW YORK
25
approximately 34 Nm3/hr or 9% of the input by mass, to the gasifier as a purge gas. The purpose
of the purge gas is to flow countercurrent to the exiting syngas and remove any entrained
particulates, such as sand or un-reacted waste. The gasifier is typically operated in a temperature
range of 700-900 °C at a pressure of approximately 16 pounds per square inch (psi). Enerkem
targets 90-92% carbon conversion in the gasifier with the remaining 8% of carbon going to char.
The resulting syngas from the gasifier is primarily comprised of carbon monoxide (CO),
hydrogen (H2), methane (CH4), and CO2. The syngas exits the top of the gasifier at a pressure of
approximately 16 psi and is compressed to 250 psi in its CO2 removal system. The syngas is
further compressed to approximately 1,000 psi and reacted with commercial catalysts for
methanol production. The final products of Enerkem’s process are methanol and ethanol.
Enerkem is also exploring reacting methanol over catalysts to yield additional down-stream end-
products such as methyl acetates, dimethyl ether (DME), bioethylene, acetic acid and bio-
syndiesel. By-products of Enerkem’s process are char, benzene, toluene, ethylbenzene, and
xylene (BTEX), dissolved air floatation (DAF) water, wastewater, and light and heavy tars. A
simple process flow diagram of the process is provided in Figure 17.

EARTH ENGINEERING CENTER CITY UNIVERSITY OF NEW YORK
26
Figure 17: Simple Process Flow Diagram of Enerkem Gasifier System
Enerkem Facilities
The Edmonton facility is Enerkem’s first commercial scale facility and began operations of
methanol production in 2015 (11). The RDF-like feedstock from the IPTF is stored in a storage
bunker that holds approximately 1,540 tons – or 4 days supply – of gasifier feedstock and is
transported to the commercial facility via mechanical transfer lines. Enerkem Alberta Biofuels,
an Enerkem subsidiary, owns and operates the facility. The designed operating capacity of the
WTFC facility is 110,000 dry tons (100,000 metric tons) of feedstock. Enerkem projects that the
facility will eventually generate approximately 10 million gallons of biofuels annually. This is
approximately 91 gallons (1.65 barrels) of biofuels per dry ton of MSW. Enerkem’s Edmonton
facility is shown in Figure 18.

EARTH ENGINEERING CENTER CITY UNIVERSITY OF NEW YORK
27
Figure 18: Enerkem's WTFC commercial facility in Edmonton
Enerkem also has a demonstration-scale facility located in Westbury, Quebec, Canada. This
demonstration-scale facility processes decommissioned creosote electricity and telephone poles
to produce methanol and ethanol. Creosote is a preservative made from high temperature
processing of coal. It was used to maintain utility poles but many of these poles are being
replaced (16). The annual operating capacity of the Westbury facility is approximately 317 dry
tons/day at an availability of 96% (8,400 hr/yr). The estimated biofuel production of the
Westbury facility is approximately 1.3 million gallons per year which equates to approximately
11 gallons of biofuel per dry metric ton of feedstock.

EARTH ENGINEERING CENTER CITY UNIVERSITY OF NEW YORK
28
NRP WASTE GASIFICATION PILOT STUDY
CCNY conducted pilot-scale tests at the AERF to determine the impact of non-recycled plastics
(NRP) on methanol production from gasification. The details of the tests and the results are
presented in the remainder of this report.
Feedstock Mixtures
General Description
The following four feedstock mixtures were tested in the pilot study:
100% biomass (the baseline feedstock)
92% biomass, 8% NRP
85% biomass, 15% NRP
50% biomass, 50% NRP
The biomass fraction consisted of construction & demolition (C&D) wood chips and the plastics
fraction consisted of residue from Edmonton’s material recovery facility (MRF).
The 92%/8% biomass/NRP mixture was prepared by mixing the wood chips with MRF residue.
The city’s characterization of the MRF residue was approximately 65% non-recycled paper and
35% NRP. The MRF residue was dried and shredded to a uniform size prior to mixing in with
the wood chips.
The remaining mixtures were prepared with wood chips and NRP extracted from the RDF. This
was done to ensure that any changes in the feedstock mixture trials were affected solely by the
NRP and not by the presence of organics from the RDF stream. The NRP fraction for the 15%
and 50% mixtures consisted of a 50/50 mixture of rigid and film plastics by weight. The biomass
and NRP were mixed to achieve the targeted mass compositions for the trials and were fed to the
gasifier system.

EARTH ENGINEERING CENTER CITY UNIVERSITY OF NEW YORK
29
Ultimate and Proximate Analyses of Feedstock
Ultimate and proximate analyses provide insight into the chemical composition of materials.
Proximate analyses provide information on the moisture and ash content of the material as well
as the mass percentage of material that will volatilize when subject to heat. Ultimate analysis
provides the chemical breakdown of the material by weight into carbon (C), hydrogen (H),
oxygen (O), nitrogen (N), and sulfur (S). These analyses provide the H/C ratio on a molecular
basis in the feedstock which influences the amount of methanol (CH3OH) that can be produced.
Higher H/C ratios are anticipated to yield more methanol since hydrogen and carbon are the
necessary building blocks to produce methanol. The ultimate and proximate analyses for the
different feedstock mixtures used in the pilot study trials are shown in Table 2.
Table 2: Ultimate and Proximate Analysis of Feedstock Mixtures (As Received, weight %)
100%
Biomass
(Wood chips)
92% Biomass/8%
Plastics Mixture
85%
Biomass/15%
Plastics Mixture
50% Biomass/50%
Plastics Mixture
C
40.30
44.18
44.50
54.36
H
4.94
5.88
6.23
8.02
N
0.56
0.47
0.43
0.46
O
32.98
30.86
26.96
21.64
S
0.05
0.06
0.08
0.06
Ash
12.83
11.26
9.44
7.09
Moisture Content
(MC)
8.34
7.29
12.36
8.38
TOTAL
100.00
100.00
100.00
100.00
H/C Ratio (molar)
1.46
1.59
1.67
1.76
Higher Heating Value
(Btu/mol)
1,555
2,322
2,495**
2,903**
Empirical formula
(molar basis)
CH1.46O0.61N0.01
CH1.58O0.53N0.01
CH1.67O0.45N0.01
CH1.76O0.30N0.01
**Higher heating values were not reported by Enerkem. Values were calculated as a weighted average of heating
value of non-recyclable plastics reported in the literature and heating value of biomass as reported by Enerkem.

EARTH ENGINEERING CENTER CITY UNIVERSITY OF NEW YORK
30
Pilot Trials: Operating Conditions and Measurements
Enerkem monitored and collected data of the operating conditions of the gasifier system during
the pilot study. This included the gasifier temperature, pressure, and inlet and outlet flows of the
gasifier. CCNY measured the composition of the syngas exiting the gasifier prior to entering the
gas cleaning and conditioning stage of the Enerkem process. The average overall temperature of
the gasifier during the NRP trials was approximately 800 ˚C and average pressure at the top of
the gasifier was 16 psi (1.1 bar).
CCNY used the measured syngas compositions to estimate methanol production rates for the
different NRP trials. The syngas compositions of the NRP trials are shown in Table 3. The
analytical equipment to quantify the syngas composition cannot measure steam; therefore,
CCNY calculated the steam through an equilibrium assumption and mass balance closure. The
assumption was that half of the dry feedstock is converted to steam in the gasifier, and that 50%
of the steam remains as steam while the remaining 50% is reformed. This means that the steam is
converted to H2 and CO. It should be noted that the CO2 concentrations listed in Table 3 exclude
the CO2 that is added as the counter flow stream in the gasifier exit as described above.
Furthermore, the nitrogen measured in the syngas comes from air introduction during the feeding
of the solid material into the gasifier and is not from the biomass or plastic mixture.

EARTH ENGINEERING CENTER CITY UNIVERSITY OF NEW YORK
31
Table 3: Syngas composition from NRP pilot trials (mol %)
100%
Biomass
(Wood chips)
92%
Biomass/8%
Plastics Mixture
85%
Biomass/15%
Plastics Mixture
50%
Biomass/50%
Plastics Mixture
H2 14.69 16.25 15.88 14.60
CO2 46.95 46.17 40.43 34.39
C2H4 0.00 0.92 1.32 2.64
C2H6 0.00 0.00 0.03 0.25
C3H8 0.00 0.00 0.01 0.26
O2 0.00 0.00 0.07 0.10
N2 0.13 0.00 0.12 4.28
CH4 4.56 5.85 7.31 10.82
CO 17.43 18.44 21.89 20.20
H2O 16.24 12.37 12.95 12.44
TOTAL 100.00 100.00 100.00 100.00
H/C Ratio 1.16 1.17 1.28 1.55
Figure 19 compares the concentrations of the major components in the syngas (H2, CH4, and CO)
between the different NRP trials. The points are experimentally measured values and the lines
are included to help observe the trends.
Figure 19: Syngas concentration trends for NRP pilot trials

EARTH ENGINEERING CENTER CITY UNIVERSITY OF NEW YORK
32
The trends shown in Figure 19 provide insight into the impact that NRP in the feedstock has on
syngas composition. Methane (CH4) and ethylene (C2H4) increase in concentration with
increased NRP in the feedstock. These hydrocarbons are desirable in fuel production due to their
high energy content. Steam in the syngas decreases with increased NRP in the feedstock and
consequently improves the energy value of the syngas. The overall H/C ratio in the syngas
shown in Table 3 increases with increasing plastics concentration, which indicates an anticipated
increase in methanol production with plastics. The methanol is calculated using the sum of H2
and CO. This anticipates that the H2 and CO ratio is adjusted using a water gas shift reactor that
reacts steam with the CO in the syngas to produce additional hydrogen targeting an H2:CO ratio
of 2.0. For example, the H2 and CO concentrations for the 50% NRP-biomass mixture results in
an H2:CO ratio of 0.72. However the amount of water present in the syngas is sufficient to react
with the CO. This produces more hydrogen – achieves an H2:CO ratio of 2.25 - in a typical water
gas shift reactor operating at standard pressure and a temperature of 368ºC. The process flow
diagram shown in Figure 20 shows the steps that would be taken to adjust the ratio and prepare
the syngas to enter into the methanol production reactor. The percentages shown going into the
water gas shift reactor are taken from Table 3 and only focus on the primary components
involved in the reaction.
Figure 20: Simplified process flow diagram of syngas adjustment to achieve the necessary
H2:CO ratio and quality for methanol production.
The following section of this report present the findings of NRP impact on gasification and
methanol production based on the measured data.

EARTH ENGINEERING CENTER CITY UNIVERSITY OF NEW YORK
33
IMPACT OF NRP ON GASIFICATION to METHANOL
Methanol Production
CCNY estimated the methanol production for the NRP trials based on the measured syngas
compositions and flow rate. Methanol is produced from H2 and CO in the syngas through the
following chemical equation:
2H2 + CO CH3OH
CCNY calculated methanol production for the Enerkem process based on this chemical equation.
This method estimates the best-case scenario for methanol production since it assumes that all H2
and CO in the syngas is converted to methanol. Figure 21 presents the methanol production of
the different NRP trials compared to methanol production from 100% biomass feedstock.
Figure 21: Ratio of Final Methanol Production for Plastic Feedstock Mixtures Compared to
100% Pure Biomass Feedstock
Figure 21: Methanol Production for Plastic Mixture Feedstocks compared to 100%
Biomass Feedstock.

EARTH ENGINEERING CENTER CITY UNIVERSITY OF NEW YORK
34
Figure 21 shows that methanol production from the Enerkem process should increase as the NRP
concentration increases. CCNY estimated that the methanol production would increase by 42%
when utilizing a feedstock comprised of 50% NRP compared to 100% biomass. Based on the
estimated annual production capacity of the Enerkem commercial facility, this means that 4.2
million more gallons of methanol could be produced each year if the feedstock were 50% NRP
instead of 100% biomass.
The calculated change in methanol production between 15% and 50% NRP trials was not as
significant as that calculated between the 8% and 15% NRP trials. It was expected that the
methanol production for 50% NRP should be greater than was calculated and presented in Figure
21. This is because it has the highest H/C ratio of the syngas compositions shown in Table 3. The
reason for this discrepancy can be attributed to variation between trials that influenced methanol
production such as slightly different operating conditions and inlet flows to the gasifier. For
example, Table 3 shows that much of the hydrogen produced in the gasifier is contained in C2
hydrocarbons and methane – thus not as molecular hydrogen. If the hydrocarbon (C2s and
methane) trends observed for 8% and 15% NRP are extrapolated to 50% NRP, the projected
methanol production ratio compared to biomass would be about 2.1, consistent with the increase
in NRP.
To determine a more accurate methanol production based on a 50% biomass/50% NRP mixture,
CCNY used a thermodynamic equilibrium model to calculate the composition of the syngas for
100% biomass and 50% NRP feedstocks. Based on the equilibrium composition of the syngas,
the methanol production was estimated and the results are shown in Figure 22.

EARTH ENGINEERING CENTER CITY UNIVERSITY OF NEW YORK
35
The results in Figure 22 show that at equilibrium, feedstock with 50% NRP will produce 2.1
times more methanol than pure biomass and is again consistent with the extrapolation shown
above if the hydrocarbon production was consistent. This means that at thermodynamic
equilibrium 100 pounds of biomass would yield 1.99 gallons of methanol, while a mixture of 50
pounds of plastics and 50 pounds of biomass would yield 4.08 gallons of methanol. The
equilibrium was calculated using operating inputs from the testing.
Carbon Conversion and Energy Efficiencies
The carbon conversion for the NRP trials is defined as the ratio of carbon in the syngas to the
total carbon input to the gasifier:
Carbon Conversion (%) = [(carbon in the syngas)/(total carbon in the input)]*100
Figure 22: Ratio of Methanol Production for Plastic Mixture Feedstocks compared to
100% Biomass Feedstock, includes estimates from equilibrium model

EARTH ENGINEERING CENTER CITY UNIVERSITY OF NEW YORK
36
The carbon conversions for the different NRP trials are shown in Table 4.
Table 4: Carbon conversion efficiencies for NRP pilot trials
Trials Carbon conversion
(%)
100% Biomass 66.3
92% Biomass/8% NRP 70.2
85% Biomass/15% NRP 75.0
50% Biomass/50% NRP 67.6
Carbon conversion improves with the addition of plastics as shown in the results in Table 4. The
Enerkem target is 92% conversion of carbon in the gasifier to syngas with the remaining 8% as
char. The results of the NRP trials indicate that increased NRP in the feedstock may assist
Enerkem in achieving their conversion target due to the high H/C ratio in the non-recycled
plastics.
In addition to methanol production, NRP in the feedstock impacts the energy efficiencies of the
process because it influences the energy content of the syngas generated in the gasifier. The
energy content of the syngas for the different trials are shown in Figure 23 and were calculated
based on the measured compositions provided in Table 3.

EARTH ENGINEERING CENTER CITY UNIVERSITY OF NEW YORK
37
The highest energy value of syngas was achieved in the 50% NRP trial and was 81% higher than
that of the syngas generated from 100% biomass. Based on the average annual energy
consumption of U.S. households of 10.8 MWh (P), this means that, for each facility at the scale
of the Edmonton plant, approximately 9,009 more households could be powered annually if 50%
plastics were added to a pure biomass feedstock. This is fully consistent with the addition of
energy dense NRP to a biomass feedstock.
Syngas is the intermediate product in the production of methanol. Therefore, if syngas has a
higher energy content, less external energy is required to produce methanol. It was estimated that
approximately 326 million cubic feet of natural gas could be saved in energy input annually with
50% NRP feedstock compared to a 100% biomass feedstock. This estimate was based on the
annual capacity of the commercial facility and the energy difference of syngas derived from
100% biomass and syngas derived from 50% NRP.
The thermal efficiency for the gasifier is defined below:
Thermal efficiency (%) = [(energy in syngas)/(energy in feedstock)]*100
The thermal energy efficiencies for the different NRP trials are shown in Figure 24.
Figure 23: Higher Heating Value of Syngas from Pilot Trials

EARTH ENGINEERING CENTER CITY UNIVERSITY OF NEW YORK
38
Figure 24 shows that thermal energy efficiency of the process generally increased with
increasing plastics concentration. A 50% increase in NRP compared to pure biomass feedstock
yielded a 28% increase in thermal efficiency. This means that 28% more of the energy available
in the feedstock was recovered in the syngas in the 50% NRP trial versus the 100% biomass trial.
Overall energy efficiency was defined in this study as the ratio between total energy input and
total energy output of the entire Enerkem process. The 15% NRP trial had the highest overall
energy efficiency with a 15% increase compared to efficiency from the 100% biomass trial.
Based on the measured data, the energy input required to process 50% NRP feedstock is
approximately 2% more than that required to process biomass but the methanol production
increases by 42% due to the quality of the syngas that is produced from NRP. It is estimated it
would take approximately 0.180 MMBtu to process 100 pounds of biomass to yield 1.55 gallons
of methanol via the Enerkem process. Meanwhile, it would take approximately 0.184 MMBtu to
process 100 pounds of a mixture containing 50% NRP to yield 2.20 gallons of methanol.
Figure 24: Thermal efficiencies of NRP pilot trials

EARTH ENGINEERING CENTER CITY UNIVERSITY OF NEW YORK
39
Environmental Impact
Char is a common residual of energy recovery processes such as MSW gasification. WTE plants
traditionally dispose of char in landfills but it has growing applications as a material for use in
the production of concrete. The char production for the NRP pilot trials is presented in Figure 25.
Figure 25: Ratio of Char Production for Plastic Feedstock Mixture Compared to 100% Pure
Biomass Feedstock
The char production from the Enerkem process decreases when NRP increases in the feedstock.
The production of char was reduced by 76% with the 50% NRP feedstock compared to 100%
biomass feedstock. The results presented in Figure 25 indicate that increased plastics production
in the feedstock would reduce the amount of char disposal required. If the char residual is
intended to be disposed of in a landfill, the 50% NRP feedstock would reduce that volume by
76% compared to a 100% biomass feedstock.
Additionally, methanol production from alternative sources offsets dependence on petroleum-
based feedstocks and can reduce greenhouse gas (GHG) emissions. The study concluded that the
50% NRP feedstock could increase the annual methanol production by 4.2 million gallons
compared to a 100% biomass feedstock. The energy contained in the additional 4.2 million
gallons of methanol is enough to offset the use of approximately 2.1 million gallons of gasoline.

EARTH ENGINEERING CENTER CITY UNIVERSITY OF NEW YORK
40
One gallon of gasoline produces 0.01 tons of COeq (18); therefore the total additional methanol
produced from 50% NRP feedstock can save the production of 20,895 tons of COeq annually,
which is equivalent to taking 3,907 cars off the road per year.
CONCLUSIONS
Gasification of non-recycled materials, including non-recycled plastics, is a useful process
because it can produce valuable liquid fuels and chemicals. It is also consistent with the
principles of Sustainable Materials Management and a more circular economy. The Enerkem
facility in Edmonton, Alberta has produced methanol for commercial use and began producing
ethanol, an important transportation fuel, in late 2017. The Enerkem facility gasifies an RDF-like
feedstock that is derived primarily from MSW and MRF residue. Currently, the focus of most
waste gasification facilities is to process mostly biomass feedstocks. This is because it is easier to
gasify homogenous materials and fuels derived from biomass in order to receive subsidies,
mandates for use, and favorable regulatory and tax treatment. Nonetheless, non-recycled plastics
(NRP) represent a potentially high value resource when converted to fuels and chemicals instead
of being landfilled. CCNY conducted pilot tests at the Enerkem facility to determine how
different levels of NRP in the feedstock impact methanol production from gasification. The
findings of this study revealed that compared to using biomass-only feedstocks, the inclusion of
NRP is beneficial to the production, efficiency and environmental footprint of the Enerkem
process. The road to producing greater quantities of liquid fuels and chemicals from gasification
is still evolving. Companies will need to optimize feed handling and process efficiencies.
However, this study indicates that NRP is a material stream that should be diverted from landfill
because it offers significant benefits to the overall performance and product yield of gasification
technologies.

EARTH ENGINEERING CENTER CITY UNIVERSITY OF NEW YORK
41
REFERENCES
(1) Tsiamis, Demetra and Castaldi, M.J.. Determining Accurate Heating Values of Non-
Recycled Plastics, City College of New York, 2015.
(2) U.S. EPA, Advancing Sustainable Materials Management: 2014 Fact Sheet, November
2016.
(3) OneNYC; http://www1.nyc.gov/html/onenyc/progress/#sustainability
(4) DSNY, 2013 NYC Curbside Waste Characterization Study,
(5) DSNY, Annual Report: New York City Curbside and Containerized Municipal Refuse:
Fiscal Year 2015, 2015.
(6) Mussche, Charles et. al., 2014 Energy and Economic Value of Municipal Solid Waste
(MSW), including Non-Recycled Plastics (NRP), Currently Landfilled in the Fifty States,
Columbia University, 2014.
(7) IHS Markit, Chemical Economics Handbook- Methanol chapter (2014)
(8) Methanol Institute, Methanol Facts: About Methanol
http://www.methanol.org/wp-content/uploads/2016/06/About-Methanol-FS.pdf
(9) The City of Edmonton. Waste Management Services. Edmonton Waste Management
Centre. Print.
(10) The City of Edmonton, Organics Processing Program, 2016.
https://www.edmonton.ca/programs_services/garbage_waste/edmonton-composting-
facility.aspx

EARTH ENGINEERING CENTER CITY UNIVERSITY OF NEW YORK
42
(11) Enerkem, Enerkem Alberta Biofuel, 2015.
http://enerkem.com/facilities/enerkem-alberta-biofuels/
(12) "Materials Recovery Facility" The City of Edmonton: Edmonton Waste Management
Centre. City of Edmonton.
http://www.edmonton.ca/for_residents/garbage_recycling/materials-recovery-
facility.aspx
(13) The City of Edmonton, Blue Bag Recycling. 2016
https://www.edmonton.ca/programs_services/garbage_waste/garbage-collection-blue-
bag-recycling.aspx
(14) The City of Edmonton, Material Recovery Facility, 2016
https://www.edmonton.ca/programs_services/garbage_waste/materials-recovery-facility-
vi.aspx
(15) "Integrated Processing and Transfer Facility." The City of Edmonton: Edmonton Waste
Management Centre. City of Edmonton.
http://www.edmonton.ca/for_residents/IPTF_FACT_SHEET_final.pdf
(16) The Environmental Literacy Council, Wood Utility Pole Lifecycle. 2015
https://enviroliteracy.org/environment-society/life-cycle-analysis/wood-utility-pole-life-
cycle/
(17) Klinghoffer, Naomi et. al. Waste Conversion Technologies, City College of New York,
2014.
(18) U.S. EPA, Greenhouse Gas Equivalencies Calculator. 2016.
https://www.epa.gov/energy/greenhouse-gas-equivalencies-calculator