the effects of ongoing assessment during a
TRANSCRIPT

Nova Southeastern UniversityNSUWorks
College of Psychology Theses and Dissertations College of Psychology
1-1-2015
The Effects of Ongoing Assessment During aPsychoeducational EvaluationJoseph ElliotNova Southeastern University, [email protected]
This document is a product of extensive research conducted at the Nova Southeastern University College ofPsychology. For more information on research and degree programs at the NSU College of Psychology, pleaseclick here.
Follow this and additional works at: https://nsuworks.nova.edu/cps_stuetd
Part of the Psychology Commons
Share Feedback About This Item
This Dissertation is brought to you by the College of Psychology at NSUWorks. It has been accepted for inclusion in College of Psychology Theses andDissertations by an authorized administrator of NSUWorks. For more information, please contact [email protected].
NSUWorks CitationElliot, J. (2015). The Effects of Ongoing Assessment During a Psychoeducational Evaluation. .Available at: https://nsuworks.nova.edu/cps_stuetd/80

THE EFFECTS OF ONGOING ASSESSMENT DURING A
PSYCHOEDUCATIONAL EVALUATION
By
Elliot Joseph, M.S.
A Dissertation Presented to the College of Psychology
of Nova Southeastern University
in Partial Fulfillment of the Requirements
for the Degree of Doctor of Philosophy
NOVA SOUTHEASTERN UNIVERSITY
2015

ii
DISSERTATION APPROVAL SHEET
This dissertation was submitted by Elliot Joseph under the direction of the
Chairperson of the dissertation committed listed below. It was submitted to the College of
Psychology and approved in partial fulfillment of the requirements for the degree of Doctor
of Philosophy in Clinical Psychology at Nova Southeastern University.
Approved:
__________________ ____________________________________
Date of Defense David Reitman, Ph.D., Chairperson
____________________________________
Stephen Messer, M.A., Ph.D.
____________________________________
Ralph E. Cash, Ph.D., NCSP, ABPP
___________________ ____________________________________
Date of Final Approval David Reitman, Ph.D., Chairperson

iii
ACKNOWLEDGEMENTS
I thank my dissertation chairman and supervisor, Dr. David Reitman, for his
guidance, teaching, supervision, support, example, and patience throughout graduate
school and this process. I also thank Dr. Stephen Messer for his thoughtful approach and
guidance regarding the analyses and more, for this dissertation, as well as for his support
and patience. I also thank Dr. Ralph (Gene) Cash for his feedback and insight into this
research. Next, I thank the coordinators and therapists who screened participants and
carried out this research project with dedication. I thank my parents, my in-law’s, my
family in general, and my friends, for all of their support during these years. I thank my
“little graduate students” for the inspiration they give me. Lastly, I thank my wife for her
strength throughout these years and without whom, this, and so many other things in my
life would not be possible.

iv
TABLE OF CONTENTS
LIST OF TABLES………………………………………………………………….…..viii
LIST OF FIGURES…………………………………………………………………….....x
ABSTRACT……………………………………………………………………………….1
CHAPTER I: STATEMENT OF THE PROBLEM & REVIEW OF
THE LITERATURE……………………………………………………………................3
Pretreatment Reduction in Reported Symptomatology…………………………...3
In Cognitive-Affective Research……………………….………………....3
Studies that Did Not Find a Reduction in Scores…………………5
In Substance Abuse Research…….……………………………………….5
In Other Research Areas………….……………………………………….7
Theoretical Explanations for Pretreatment Reduction in
Reported Symptomatology……………………………………………………......8
Legitimation................................................................................................ 8
Chronicity……….…………………………………………………………8
Diminished Test-Anxiety………………………………………………….8
Mood-Congruent Associative Processing…………………………………9
Sample Attrition…………………………………………………………...9
Natural Coping Mechanisms………………………………………………9
Self-Monitoring…………………………………………………………..10
Response-Shift…………………………………………………………...10
Social Desirability………………………………………………………..10
Mechanical Responding………………………………………………….11
Therapy…………………………………………………………………..11
Effect of Assessment and Repeated assessment...……………………………….11
Assessment Reactivity…………………………………………………...11
In Substance Abuse Research……………………………………12
Substance Abuse Interviews……………………………..13
In Health Psychology Research....……………………………….14
In Other Research Areas…………………………………………15
Studies with No Beneficial Effect of Assessment……………………….15
Effects of Repeated Assessment…………………………………………16
Scientific Concerns of Reduction in Pretreatment Scores….……………………17
Attribution of Change……………………………………………………17
Magnitude of Change…………………………………………………….18
Suggestions to Control for Score Reductions…..………………………..18
Patient-Oriented Research……………………………………………….19
Treatment Monitoring and OQ-45……………………………………….19
Reliable Change Index…………………………………………………...20
Y-OQ……………………………………………………………………..21
Limitations of Treatment Monitoring……………………………………21
Purpose of This Research…………….……………………………….………….23

v
Research Questions…….…………………………………………………24
Reduction in Scores on Y-OQ: Hypothesis #1..…………………………25
Frequency of Administration Leads to Reduction Hypothesis #2……….25
Reduction in Scores on Various Measures and Frequency of
Administration Leads to Reduction: Hypothesis #3 ……..………….…..26
Social Desirability Will Not be Related to Change Scores: Hypothesis
#4…………………………………………………………………………28
Mechanical Responding Will Not be Related to Change Scores:
Hypothesis #5…………………………………………………………….28
Initial Symptomatology Will Moderate Decreases in Symptoms:
Hypothesis #6…………………...………………………………………..28
Parental Symptoms of Depression will Moderate Decreases in
Symptoms: Hypothesis #7……………………………………………….28
CHAPTER II: METHOD………………………………………………………..............30
Participants……………………………………………………………………….30
Measures ........................................................................................................……31
Pretreatment Measures .......................................................................……31
Screening…………………………………………………………31
Routine Assessment Measures…………………………………...31
Conners 3rd Edition, Parent....…………………………....31
Eyberg Child Behavior Inventory………………………..33
Parenting Stress Index-Short Form………………………33
Beck Depression Inventory, 2nd Edition………………....34
Additional Experiment Assessment Measures………….………..34
Youth Outcome Questionnaire…………………………..34
The Parenting Scale……………………………………...37
Demographic Questionnaire…………………………….37
Daily Food List…………………………………………..37
Ongoing /Treatment and Control Measures……………………………...38
Post-treatment Measures…………………………………………. ……..38
Working Alliance Inventory, Assessment Short Form…………..38
Parenting Stress Inventory- Short Form…………………………39
Client Satisfaction Questionnaire………………………………..39
General Questionnaire…………………………………………...40
Marlowe-Crowne Social Desirability Scale……………………...40
Test Taking Survey………………………………………………40
Treatment………………………………………………………………...............41
Procedure……………………………………………………………………...…41
Data Analysis…………………………………………………………………….42
CHAPTER III: RESULTS……………………………………………………………….46
Baseline Characteristics of Sample and Comparison of Groups………………...46
Collateral Information……………………………………………………………53
Preliminary Pre-Post Percentage Change in the Hypothesized Direction……….54
Hypotheses #1 & 2……………………………………………………………….58

vi
Hypothesis #3…………………………………………………………………….59
Symptomatology and Status of Major Presenting Problems…………….59
Eyberg Child Behavior Inventory………………………………..59
Conners 3rd Edition………………………………………………60
Status of Major Presenting Problems…………………………….61
Parenting Stress and Parenting Behavior………………………………...62
Parenting Stress Index-Short Form………………………………62
Parenting Scale…………………………………………………...63
Reported Discipline Behavior……………………………………65
Awareness of Child Behaviors, Parent Interactions with Child,
and Perception of Child…………………………………………………66
Awareness of Positive Behaviors..…….…………………………66
Awareness of Problem Behaviors…….………………………….67
Positive Interactions……………………………………………...67
Negative Interactions…………………………………………….67
Overall Perception of Child……………………………………...67
Therapeutic Alliance and Client Satisfaction……………………………68
Working Alliance Inventory……………………………………..68
Client Satisfaction Questionnaire………………………………..69
Hypotheses #4 & 5……………….………………………………………………69
Social Desirability………………………………………………………..70
Mechanical Responding………………………………………………….70
Hypothesis #6…………………………………………………………………….71
Hypothesis #7…………………………………………………………………….71
CHAPTER IV: DISCUSSION…………………………………………………………..73
Reduction in Scores Over Time...………………………………………………..74
Effects of Repeated Assessment…...…………………………………………….75
Therapeutic Alliance and Client Satisfaction...…….……………………76
Awareness of Child Behaviors…………………………………………...76
Parent Interactions with Child…………………………………………...77
Perception of Child……………………………………………………...77
Plausible Explanations for Lack of Repeated Assessment Effects………………77
Additional Hypotheses Explored………………………………..........................79
Social Desirability……………….……………………………………….79
Mechanical Responding……………………….………………................80
Initial Child Symptomatology……………………………………………81
Maternal Symptoms of Depression…………..…………………………..82
Clinical Implications………….....…….…………………………………………83
Limitations……………………………………………………………………….84
Suggestions for Future Research………………………………………………...87
Conclusion……………………………………………………………………….88
REFERENCES…………………………………………………………………………..89
APPENDICES………………………………………………………………………….108
Appendix A: Study Measures…………………………………………………..108
Appendix B: Attrition Analyses ….……………………………………………123

vii
Appendix C: Y-OQ Scores over Time (Experimental Group)………………...124

viii
LIST OF TABLES
Table 1: Baseline Means, SDs, and Percentages for Participant and Child
Characteristics……………………………………………………………………………46
Table 2: Baseline Means, SDs, and Percentages for Participant and Child
Characteristics for Completers and Non-Completers…...……………………………….47
Table 3: Screening: Academic vs. Behavioral/Social……………………………………49
Table 4: Screening: School vs. Home……………………………………………………50
Table 5: Percentages of Screening Reasons for Control and Experimental Groups:
Academic vs. Behavioral/Social…………………………………………………………51
Table 6: Percentages of Screening Reasons for Control and Experimental Groups:
School vs. Home…………………………………………………………………………51
Table 7: Direction of Change in Scores, Pretest to Posttest, for main Outcome
Measures…………………………………………………………………………………54
Table 8: Descriptive Statistics for the Youth Outcome Questionnaire Across Time
points……………………………………………………………………………………..58
Table 9: Descriptive Statistics for the Eyberg Child Behavior Inventory, Intensity
Scores, Across Time Points…………...…………………………………………………59
Table 10: Descriptive Statistics for the Conners-3, CGI Scale, Across Time Points……60
Table 11: Descriptive Statistics for the General Questionnaire, Status of Major
Presenting Problems…………………………………………………………………..…61
Table 12: Descriptive Statistics for the Parenting Stress Index-Short Form, Total Raw
Score, Across Time Points……………………………………………………………….62
Table 13: Descriptive Statistics for the Parenting Scale, Overreactivity and Laxness
Scales, Across Time Points………………………………………………………………64
Table 14: Descriptive Statistics for the General Questionnaire, Discipline Techniques...65
Table 15: Descriptive Statistics for the General Questionnaire, Awareness of
Behaviors, Changes of Interactions, and Overall Perception…………………………....67
Table 16: Descriptive Statistics for the Working Alliance Inventory and the Client
Satisfaction Questionnaire……………………………………………………………….68

ix
Table 17: Marlowe-Crowne Social Desirability Scale & Test Taking Survey
Correlations with Change Scores of the Y-OQ, ECBI, PSI-SF, Conners CGI, PS-O,
and PS-L…………………………………………………………………………………70
Table 18: BDI-II Correlations with Change Scores of the Y-OQ, ECBI, PSI-SF,
Conners CGI, PS-O, and PS-L………………………………………..…………………71

x
LIST OF FIGURES
Figure 1: Individual Change and Group Change in YOQ, ECBI, and PSI Scores………55
Figure 2: Individual Change and Group Change in Conners CGI, PS-O, and PS-L
Scores…………………………………………………………………………………….56

ABSTRACT
The Effects of Ongoing Assessment During a Psychoeducational Evaluation
by
Elliot Joseph, M.S.
NOVA SOUTHEASTERN UNIVERSITY
Statistically significant reductions in scores from initial pretreatment testing to
subsequent pretreatment testing in self-report measures are a widespread phenomenon
(Arrindell, 2001). If valid, these reductions reflect improvement in psychological
functioning absent any formal treatment (Arrindell, 2001). Many explanations for these
reductions in scores have been offered (Arrindell, 2001) including assessment reactivity
(Epstein et al., 2005), social desirability (Henderson, Byrne, & Duncan-Jones, 1981); and
mechanical responding (Bromet, Dunn, Connell, Dew, & Schulberg, 1986; Durham et al.,
2002). However, relatively few studies have examined this phenomenon empirically.
Even fewer studies have examined pretreatment improvements in parent ratings. The
present study sought to replicate the pre-treatment effect and to evaluate potential causes
of these changes, specifically, repeated assessment, social desirability, and mechanical
responding. Additionally, the study examined the relationship between maternal
depression and parent ratings. Participants included 28 self-referred mothers and their
children, though only 17 completed the study in its entirety. Results indicated
pretreatment reductions in maternal ratings of child symptomatology and parenting stress.
Repeated assessment was not supported as a cause of pretreatment improvements (score
reductions). Social desirability, however, may have been a factor in the mothers’ ratings.
Mechanical responding did not appear as a likely cause. Maternal symptoms of

2
depression were associated with less change over the course of the study. Clinical
implications, study limitations, and suggestions for future research are discussed.

3
CHAPTER I
Statement of the Problem and Review of the Literature
Statistically significant reductions in scores from initial pretreatment testing to
subsequent pretreatment testing in self-report measures are a widespread phenomenon
(Arrindell, 2001). If valid, these reductions reflect improvement in psychological
functioning absent any formal treatment (Arrindell, 2001). Windle’s (1954) review of
objective personality measures in mostly non-clinical samples indicated a tendency
toward pretreatment improvement upon retest. Many subsequent studies have
documented similar findings in both clinical and non-clinical samples using self-report
measures of affective state and trait conditions (Arrindell, 2001), depression and anxiety
(Gilbert, McClernon, Rabinovich, Plath, Jensen, & Meliska, 1998; Posternak & Miller,
2001; Sharpe & Gilbert, 1998), substance use (McCambridge & Day, 2008), and general
distress (Swift, Callahan, Herbert & Heath, 2012; Young, 2006). Willson and Putnam’s
(1982) meta-analysis of 32 studies concluded that at retest people predominantly
endorsed fewer symptoms on affective tests. Widely-used measures such as the Beck
Depression Inventory (BDI; Sharpe & Gilbert, 1998), the Beck Anxiety Inventory, the
Depression Adjective Check Lists, the Symptoms Checklist-90, and the Zung Depression
Scale (Arrindell, 2001) show a reduction in pretreatment scores.
In the cognitive-affective literature, Arrindell (2001) found that mean scores on
the majority of a wide range of symptom and affective state and trait measures decreased
at the second administration among both inpatients and outpatients in the absence of
intervention. Minimal evidence existed to support a relationship between time interval
and magnitude of the decrease. This suggests that duration between test administrations is

4
not associated with a decrease in scores. Posternak and Miller’s (2001) meta-analysis of
19 studies of depression found pretreatment reductions in mean BDI scores of 15.7% and
in Hamilton Rating Scale for Depression scores of 11.9%. Posternak and Miller (2001)
highlight that the rate of symptom improvement for studies that excluded participants
who sought treatment in the interim period was double that of studies which included
participants who had sought treatment. Gilbert et al. (1998) found negative affect ratings
decreased before the initiation of a smoking cessation intervention. Sharpe and Gilbert
(1998) showed that in a non-clinical sample over three assessment points, depression and
anxiety ratings decreased. Ahava, Iannone, Grebstein, and Schirling (1998) found, in a
non-clinical college sample, that BDI scores decreased with four weekly administrations
and leveled off in the four weekly assessments that followed. Rape victims who did not
receive treatment and were administered the BDI and Hamilton Rating Scale for
Depression at two weeks post-assault and one, two, four, eight, and 12 months post-
assault, showed significantly decreased scores through the fourth administration and then
stabilized (Atkeson, Calhoun, Resick, & Ellis, 1982). A similar pattern was found for
BDI scores among an untreated, non-assaulted control group. Wilson and Putnam’s
(1982) meta-analysis showed that 64% of all score changes, and 81% of cognitive
changes, indicated pretreatment improvement. In contrast to Arrindell (2001), duration of
time between testing administrations was related to effect size. Smaller effect sizes were
found for durations of less than a day or over one month. Wilson and Putnam (1982)
conclude that symptom reduction “cannot be safely ignored” (pg. 256) but that
pretreatment symptom reduction may not be uniform across psychological domains (e.g.,
cognitive and affective domains). Jorm, Duncan-Jones, and Scott’s (1989) study of a non-

5
clinical sample found reductions in scores for social desirability, well-being, and
personality measures. Similar to Arrindell (2001), they concluded that duration between
administrations did not diminish the reduction of scores. Jorm et al. found that reductions
in scores only occurred with measures of negative self-characteristics administered
orally. Other studies regarding anxiety have shown reduction in scores (e.g., Knowles,
Coker, Scott, Cook, & Neville, 1996).
In contrast, studies have generally found no such pretreatment improvement of
scores on measures of positive states (Arrindell, 2001; Gilbert et al., 1998; Jorm et al.,
1989; Sharpe & Gilbert, 1998). This suggests that pretreatment improvement of scores is
limited to measures of psychopathology and maladaptive behaviors. Additionally,
Roodman (1996) failed to find a score reduction in a self-report measure of panic attacks.
Barkham, Mullin, Leach, Stiles, and Lucock (2007) also did not find a reduction in scores
on the BDI between client referral and clinical assessment. Despite Roodman’s (1996)
and Barkham et al.’s (2007) findings, it appears that pretreatment reduction of scores is
common in the cognitive-affective research areas, particularly for psychopathology and
maladaptive behaviors (Arrindell, 2001).
Studies of substance use have also shown pretreatment reductions in symptoms.
For example, Epstein et al. (2005) used a retrospective self-report measure of women’s
drinking to examine four pre-treatment screening and assessment data points. Significant
reductions in drinking occurred at all change points. Forty-four percent reported
abstinence before treatment. Epstein et al. (2005) conclude that women changed their
drinking behaviors after seeking treatment but prior to the onset of treatment. These
changes were maintained over the course of treatment. Stephens, Roffman, and Curtin

6
(2000) examined treatments for marijuana users by randomly assigning them either to a
delayed treatment group or to one of two different treatment groups. All groups
completed an assessment at the time of randomization. The delayed treatment group
showed significant reductions in self-reported (and collateral verified) marijuana use and
related consequences at the four-month pre-treatment follow-up. In comparison, the
groups already in treatment experienced significantly greater improvements. Connors,
Tarbox, and Faillace (1992) found that an assessment-only, quasi control group of
alcohol abusers reduced their drinking and their reduction did not differ significantly
from alcohol abusers who had attended outpatient treatment at a one-year follow-up.
Kaminer, Bruleson, and Burke (2008) found that between the baseline intake assessment
of alcohol use, where all teenage participants tested positive for alcohol use, and the first
treatment session, 51.4% of the teenagers reported being abstinent from drinking. This
result however, may be due to the adolescents’ desire to be viewed in a positive manner.
Kaminer et al. (2008) also found, through urinalysis, that of the 81.9% who had tested
positive for drug use at baseline, 29% were abstinent at the first treatment session. The
change ratio of those moving in the desired direction was significant. Lastly, Timko,
Moos, Finney, Moos, and Kaplowitz (1999) studied untreated alcohol abusers by
administering multiple assessments starting at baseline through an eight-year follow-up.
They found self-reported improvements among those who had not entered treatment by
year three. However, the no treatment group reported less improvement than those who
had entered treatment. No further improvement was reported from year three through
eight.

7
A variety of other research has also revealed pretreatment symptom reduction.
Regarding general distress, Young (2006) found that among waitlisted clients, between
initial assessment and the beginning of therapy, 16.5% of the sample showed reliable and
clinically significant pretreatment improvement on the Clinical Outcomes in Routine
Evaluations-Outcome Measures (CORE-OM; Barkham et al. 1998). Reliable
improvement alone was found in 12.2% of the sample. For participants who reported
more initial symptomatology, 25.2% had reliable and clinically significant pretreatment
improvement and 14.6% had only reliable improvement. Swift, Callahan, Herbert and
Heath (2012) studied distressed college students not receiving therapy over a 12-week
period using the Outcome Questionnaire-45 (OQ-45, Lambert et al., 1996). They found
that 38.2% of participants showed reliable and clinically significant reductions in
symptoms on the OQ-45, while 5.3% had only reliable improvement. In a meta-analysis
of tinnitus, “an auditory disorder, defined as the perception of constant sound in ear(s)
without any appropriate external source” (Hesser, Weise, Rief, & Andersson, 2010,
p.378), participants in a wait-list control group for cognitive-behavioral therapy had
statistically significant mean reductions in scores on tinnitus-specific measures of 3% to
8% (Hesser et al., 2010). Similarly, within the disruptive behavior disorders, Milich,
Roberts, Loney, and Caputo (1980) found that teacher’s ratings of hyperactive behaviors
decreased between two administrations. Boys who were initially more hyperactive had a
greater decrease in scores, suggesting regression to the mean as a possible explanation.
Finally, Patterson and Narrett (1990) identified studies of aggressive and oppositional
children which indicate score reductions in parent reports of child behavior problems in
the absence of intervention.

8
Theoretical Explanations for Pretreatment Reduction in Reported Symptomatology
Though numerous studies have documented pretreatment improvements across a
variety of measures, little experimental research has examined possible causal
mechanisms (French & Sutton, 2010). Reduction in scores from the initial point of testing
to a subsequent testing may be a function of a number of factors. The best scenario, from
a client’s perspective, is that actual change occurs (Arrindell, 2001). Arrindell (2001),
Durham et al. (2002), and Sharpe and Gilbert (1998), review a number of reasons,
summarized below, to explain reductions in pretreatment scores.
Legitimation
Arrindell (2001) proposed the “legitimation hypothesis” that suggests clients
attempt to engage the sympathy of the therapist at their initial meeting by exaggerating
their symptoms. Arrindell (2001) reported that no empirical data for this reason exist.
Furthermore, this hypothesis is limited to treatment-seeking samples, whereas
pretreatment reductions in scores have been found in non-clinical samples (e.g., Durham
et al., 2002; Sharpe and Gilbert, 1998).
Chronicity
The chronicity hypothesis (Ormel et al., 1989) states that over time clients will
become accustomed to their symptoms and view them as less problematic. Ormel et al.
(1989), however, did not find support for this hypothesis.
Diminished Test-Anxiety
The diminished test-anxiety hypothesis proposes that clients have less anxiety
during the second testing (Arrindell, 2001). Clients therefore report fewer symptoms.
However, this reason also wasn’t supported since studies have shown (Henderson et al.,

9
1981) that reductions in scores do not necessarily occur for each and every measure
administered at a second testing.
Mood-Congruent Associative Processing
Sharpe and Gilbert, (1998) hypothesized that the reduction in scores might be due
to mood-congruent associative processing (Teasdale & Barnard, 1993), whereby clients
completing measures of negative moods are in a negative mood state and are therefore
more aware of negative moods. This awareness increases the likelihood of negative
responses. The items on the second testing have been habituated from the first testing and
result in the decreased likelihood of eliciting negative moods. No empirical research
about this hypothesis has been conducted.
Sample Attrition
This hypothesis states that reductions in scores are due to sample attrition
(Arrindell, 2001). The hypothesis assumes that only participants whose symptoms
worsen, or who develop symptoms after the first testing, drop out of the study. This
reason however, does not explain pretreatment improvement in samples where attrition
did not happen (Arrindell, 2001).
Natural Coping Mechanisms
Sharpe and Gilbert (1998) postulated another cause of the reduction in scores is
the use of natural coping mechanisms. With the first testing administration, the client is
more aware of their negative mood state and then attempts to cope with it in his or her
own way. The subsequent administration occurs after the client has already coped with
their mood and therefore reports less negatively.

10
Self-Monitoring
Sharpe and Gilbert (1998) allude to another possible hypothesis of self-
monitoring (Korotitsch & Nelson-Gray, 1999) that is similar to natural coping
mechanisms. The first administration acts as a self-monitoring tool for clients to notice
their own behaviors. Then the increased awareness and introspection and the effects
associated with self-monitoring (possibly self-regulation, Walters, Vader, Harris, &
Jouriles, 2009) produce a reduction in scores on the second administration.
Response-Shift
Yet another hypothesis offered by Arrindell (2001) is response-shift (Howard &
Dailey, 1979). This hypothesis postulates that client’s standard for evaluating the
measure has changed between administrations. A similar hypothesis is meaning-shift
(Knowles et al., 1996). The first administration gives clients an increased understanding
of the items on the measure, and during the second administration, clients are less likely
to endorse the items. The client’s perception is that the items have become more serious
and are therefore less likely to be endorsed (Loftus, 1975).
Social Desirability
Henderson, Byrne, and Duncan-Jones (1981) hypothesized that the reduction in
scores is due to social desirability, whereby clients present themselves more favorably on
re-test. Arrindell (2001) reported mixed results from studies in supporting this
hypothesis. Durham et al. (2002), in a non-clinical sample, found that social desirability
did not account for significant score changes.

11
Mechanical Responding
Mechanical responding (Bromet, Dunn, Connell, Dew, & Schulberg, 1986;
Durham et al., 2002) is a hypothesis which states that clients become disinterested in the
assessment, attempt to complete it quickly, and do not carefully consider each item.
Durham et al. (2002), however, in the first and only study of mechanical responding, did
not find disinterest to be a factor in reduction of scores for either parent ratings of child
behavior, or adult self-reported behavior, in non-clinical samples. Durham et al. (2002)
asserted that social desirability and mechanical responding have been the most frequently
suggested reasons for reductions in scores, although they have been scarcely examined.
Therapy
The therapy hypothesis states that assessment itself, and, in particular, repeated
assessment, has beneficial effects (Arrindell, 2001; French & Sutton, 2010; Longwell &
Truax, 2005). According to the therapy hypothesis, pretreatment reductions in scores
reflect true symptom change. This hypothesis has a substantial research base, is the most
important hypothesis for the present study, and is further detailed below.
Effects of Assessment and Repeated Assessment
Studies from a wide range of research areas indicate that participating in
assessment results in beneficial effects, as reported on self-report questionnaires and in
behavior changes (French & Sutton, 2010). In the present study, this effect of assessment
will be referred to as “Assessment Reactivity” and is defined as the “initiation of a
therapeutic change process as a result of the assessment itself” (Epstein et al., 2005,
p.369). Assessment reactivity is the general title of the effect of assessment discussed in
the alcohol field (McCambridge, 2009). It is also a suitable title in other fields because it

12
connotes that assessment itself can be reactive in numerous ways, whether therapeutic or
not. A plethora of titles used to discuss similar phenomena across many research areas
leads to widespread conceptual confusion. The titles include; Reactivity (Epstein et al.,
2005; Moos, 2007; Sobell, Bogardis, Schuller, Leo, & Sobell,1989), Research
Assessment Exposure Reactivity Effects (Clifford et al., 2007), Mere Measurement
Effect and Mere Measurement Interventions (Godin et al., 2008), Measurement-Induced
Improvement (Knowles et al., 1996), Testing effects (Shadish, Cook, & Campbell, 2002),
Practice effects (Lemay, Bedard, Rouleau, &Tremblay, 2004), Pretest Sensitization
Effects (Willson & Putnam, 1982), a Retest Artifact (Durham et al., 2002), a Retest
Effect (Arrindell, 2001; Vermeersch, Lambert, & Burlingame, 2000), the Test-Retest
Effect (Windle, 1954), Assessment Effects (McCambridge, 2009), Subject Reactivity
(Kypri et al., 2006), Reactive Measurement Effects and the Interaction Effect of Testing
(Campbell, 1996), Measurement Reactivity, Self-Erasing Errors of Prediction, Self-
Prophecy Effect, Self-Generated Validity, or the Question-Behavior Effect (Sprott et al.,
2006). Assessment reactivity has been described as an assessment intervention (Walters
et al., 2009) or characterized as a Hawthorne effect (Bouchet et al., 1996). The causes of
assessment reactivity are little understood (French & Sutton, 2010; Knowles et al., 1996),
have been described as an “enigma” (Voas, 1956, p.375), and as continuing to be an
“enigma” (Knowles et al., 1996, p.352).
Assessment reactivity has been found in substance abuse research. Epstein et al.
(2005) found that participants reported pretreatment reductions in their drinking, after a
brief study eligibility screening, without any assessment feedback or motivational
interviewing. They theorized that participants reduced their drinking after each

13
assessment session since “the assessment itself was therapeutic by facilitating self-
reflection” (p. 376). Chang, Wilkins-Haug, Berman, and Goetz (1999) compared a group
of pregnant women which received only a comprehensive alcohol assessment, and no
interviews or assessment feedback, with a group that received the same assessment and a
brief intervention. They found that both groups significantly reduced their antepartum
drinking with no group differences. McCambridge and Day (2008) examined the effects
of the addition of a one-time administration of the Alcohol Use Disorders Identification
Test (AUDIT, World Health Organization, 2001), and no interview or feedback, on two
to three month follow-up data in a randomized control trial. Results indicated, based on
self-report at retest, that the group which completed the AUDIT, in comparison to those
who did not, reported less hazardous drinking. Kypri, Langley, Saunders, and Cashell-
Smith’s (2007) study showed that in comparison to an information-only control group, a
group that received a 10-minute internet-based assessment at baseline with no assessment
feedback, reported lower overall alcohol consumption, fewer heavy drinking episodes,
fewer problems, and a lower AUDIT score at 12 months after baseline.
The beneficial effects of assessment interviews are supported by several
substance abuse studies. It is important to note that the interpersonal nature of assessment
interviews may cause participant improvement and these studies may therefore be distinct
from previous studies where interpersonal interaction during assessment was limited.
Nonetheless, these studies support the beneficial effects of assessment, albeit a different
manner of assessment. Carey, Carey, Maisto, and Henson (2006) found that participation
in a timeline follow-back interview of daily alcohol use reduced drinking relative to a
control group which did not participate in the timeline follow-back interview. Provision

14
of feedback from the timeline follow-back interview to the participants was not reported.
Worden, McCrady, and Epstein (2008) found that alcohol dependent women reduced
their drinking after an initial follow-up interview. This study indicates that an additional
interview assessment beyond treatment may prompt client improvement on self-report
measures. Marsden et al. (2006) in a randomized study, compared a group with a
motivational session, a self-completed assessment, and written information about health
risks of using drugs to a comparison group without the motivational session and found no
group differences at a six-month follow-up. Although this study did not have a pure
assessment group due to the provision of health risk information, completing the
assessment was rated by 87% of the assessment group participants as prompting their
change. Seventy-eight percent of the motivational session group felt their change was
caused by the intervention. McCambridge and Strang (2005) conducted a randomized
study of motivational interviewing with young drug abusers. They found greater
improvement at three months for a single session of motivational interviewing than an
assessment-only group. However, the assessment-only group reported reduced substance
use on two of three drugs examined at the 12-month follow-up. In comparison, the
motivational interviewing group increased their substance use at the 12-month follow-up.
This suggests that the three-month follow-up assessment interview had a beneficial effect
for the assessment-only group.
The beneficial effects of assessment are also indicated in health psychology
research. Sandberg and Conner (2009) found that measuring planned behavior about
cervical screening resulted in greater attendance at the screening than was observed in a
control group whose planned behavior was not measured. Cioffi and Garner (1998) found

15
that students who were sent an email message requesting them to reply “no” if they did
not intend to donate blood the following week were significantly more likely to donate
blood, based on health care records, than students who were not sent the message. It is
important to note that the previous studies used an objective measure of outcome with no
assistance from participants after the initial contact.
Assessment reactivity has also been found in other research areas. Marketing
research has shown that survey participation without intent to influence customers is
associated with “significant and broad-based changes in customers’ behaviors” (Borle,
Dholakia, Singh, & Westbrook, 2007, p. 711; Machin & Fitzsimons, 2005). Similarly,
Falk (2010) found in two studies that answering a questionnaire regarding self-reported
risky driving behavior and attitudes (study one), or personal driving behavior only (study
two), resulted in a significant decrease in self-reported risky driving behavior at the five-
week follow-up.
Some studies, however, have not supported the beneficial effect of assessment.
Sutton, Bickler, Sancho-Aldridge, and Saidi (1994) did not find statistically significant
assessment reactivity on breast cancer screening, another objectively measured health-
related behavior. Hester and Delaney’s (1997) study of heavy drinkers who were
randomized to either an immediate treatment group or a delayed treatment group after
assessment did not support assessment reactivity. The delayed treatment group did not
show any change in their drinking behaviors after assessment prior to beginning
treatment. Lastly, a study by Maisto, Sobell, Sobell, and Sanders (1985) showed no effect
of follow-up interview style (data-oriented or person-oriented) on drinking behaviors. No

16
common factors among these studies could be identified contributing to the absence of
assessment benefits.
Despite the studies that did not find assessment reactivity, many researchers (e.g.,
French & Sutton, 2010; Godin et al., 2010; Walters et al. 2009) suggest that overall,
assessment has beneficial effects. In French and Sutton’s (2010) review they state;
“measurement can affect people’s thoughts, feelings, and behavior, and is therefore
‘reactive’ ” (p.454). Their review concludes that several studies provide evidence that
“people who are asked to complete psychological measures are altered by the experience”
(p. 465). Thus, pretreatment reductions in scores may be a function of assessment
reactivity, i.e., a therapeutic process is initiated by a first assessment, leading to a
reduction in scores on the second assessment that reflects a true decrease in
symptomatology (Arrindell, 2001; Epstein et al., 2005). It should be noted though, that
some have characterized reductions in scores as an artifact (Jorm et al., 1989) or as a
response bias (Heishman et al., 2004), implying that the reductions in scores introduces
error in assessment and controlling for this error is necessary.
In addition to assessment itself having beneficial effects, repeated assessment
may specifically cause improvement. Longwell and Truax (2005), in a randomized
design, found that the frequency of testing accounted for decreases in BDI-II scores
among non-clinical participants. Choquette and Hasselbrock (1987), using an
experimental design, found that BDI and Zung Self-Rating Depression Scale scores
decreased as a function of repeated testing in a sample of inpatients treated for alcohol
problems. Clifford, Maisto, and Davis (2007), also using an experimental design,
compared groups based on the frequency of alcohol assessment. They found that more

17
frequent alcohol assessment resulted in reduced alcohol use and improved related
consequences outcomes after 12 months. Finally, Walters et al. (2009) after all
participants completed a screening questionnaire, compared alcohol users based on the
immediacy and amount of assessment received. Participants in the “immediate”
assessment group (multiple additional time-points of assessment) reported less risky
drinking and more moderation strategies than a “delayed” assessment group (only a
follow-up assessment) at the 12-month follow-up.
Some studies, however, have not found specific beneficial effects of repeated
assessment. Heishman, Saha, and Singleton (2004), in an experimental study, did not find
any benefit of repeated measurement with a tobacco craving questionnaire. Hufford,
Shields, Shiffman, Paty, and Balabanis’s (2002) correlational study also failed to show
that “ecological momentary assessment of drinking behavior” changed either their
drinking behavior or readiness to change their drinking behavior. Studies of repeated
assessment are inconclusive as to whether repeated assessment is beneficial. However,
since assessment is generally regarded as beneficial, as described above, it is reasonable
to assume that more frequent assessment would also be advantageous. The existence of
pretreatment improvement raises scientific and clinical concerns.
Scientific Concerns about Reductions in Pretreatment Scores
The attribution of client change to an intervention, when change, in reality, may
be due to any of the aforementioned causes of the decline in scores is a scientific concern
(Clifford & Maisto, 2000; French & Sutton, 2010). Epstein et al. (2005) caution that
without assessing for pretreatment reductions in scores, one could inaccurately interpret a
study’s outcome as being due to the treatment intervention rather than the effects of

18
assessment. Concern is especially warranted given that the statistical magnitude of the
reductions in scores has ranged from small or medium (Arrindell, 2001; Hesser et al.,
2011; Young, 2006), to large (Sharpe & Gilbert, 1998).The large effect sizes are at least
as large as the improvement rates associated with traditional psychotherapy (Arrindell,
2001). Concern has existed for several years that lengthy assessments and follow-up
interviews might initiate the change process (Bien, Miller, & Tonigan, 1993; Clifford,
Maisto, Franzke, Longabaugh, & Beattie, 2000). Clifford et al. (2000) further state that
pretreatment reductions in scores may reduce the likelihood of finding differential
treatment outcomes. One example of such concern was Project MATCH (Project
MATCH Research Group, 1998), where it is thought that the initial intensive assessments
for all groups prompted change and contributed to the later lack of differences between
intervention groups (DiClemente, Carroll, Connors, & Kadden, 1994). Furthermore, it
has been hypothesized that the phenomenon of reduction in scores leads to numerous
research results where psychotherapy is not more effective than placebos (Arrindell,
2001). Munsinger (1975) seriously questioned the results of studies that did not control
for these reductions in scores.
Various methods to control for reductions in scores have been offered. Windle
(1954) recommended establishing the rate of reduction for each assessment measure to
which further reductions can be compared. Arrindell (2001) suggested using multiple
baseline measures, reducing potential socially desirable responding by emphasizing
confidentiality, using honesty instructions, and implementing statistical corrections.
French and Sutton (2010) suggested using the Solomon four-group design. However,
given our limited understanding of its causes, no comprehensive guidelines to date have

19
been delineated to control for reductions in scores. The search for “nonreactive,
unobtrusive measures” (Campbell, 1996, p. 364) is an unresolved issue in measurement.
Patient-Oriented Research
In addition to scientific concerns, reductions in scores are clinically relevant.
Specifically, reductions in scores are clinically important in patient-oriented research
(Howard, Moras, Brill, Martinovich, & Lutz, 1996) which aims to measure and monitor
an individual’s change over the course of therapy and outcome by repeatedly assessing
clients at each session. Patient-oriented research focusing on treatment monitoring and
outcome research is a recent development in the assessment field (Kazdin, 2005). It
promotes tracking treatment status (i.e., improving or not) by using measures which are
reliable and valid for repeated administration (Howard et al., 1996). It also strives to
ensure that adaptations of interventions are proven effective by tracking changes on
targeted intervention items (Howard et al., 1996). The Outcome Questionnaire-45 (OQ-
45, Lambert et al., 1996) is an example of a measure developed to assist in monitoring
treatment and evaluating outcome for adult clients. The OQ-45 was designed as a weekly
measure of change, as well as a criterion measure, to categorize clients into outcome
groups (improvers, no changers, and deteriorators) (Lambert, 2007). It is considered easy
to administer, sensitive to change over short periods, and yet stable for untreated clients
(Vermeersch et al., 2000). However, research shows a significant decrease in OQ-45
scores between the first and second administration, regardless of the duration between
administrations (Durham et al., 2002). Subsequent to the second administration, scores
stabilized. Using the OQ-45 during treatment has been shown to improve client outcomes
with therapist feedback (Shimokawa, Lambert, & Smart, 2010).

20
Early identification of potential treatment failures is another benefit of treatment
monitoring (Bishop et al., 2005). Improving psychotherapy outcome in routine care by
monitoring progress and providing feedback to both clinicians and clients to guide
treatment are the overall goals of patient-oriented research and the OQ-45 (Lambert,
2007). To that end, a therapist feedback mechanism, using alarm signals of different
colors representing different client trajectories as an intervention for preventing
deterioration, together with clinical support tools, have been studied (Lambert et al.,
2004; Shimokawa et al., 2010). Lambert (2007) states that therapist and client feedback
in comparison to not receiving feedback produces clinically meaningful changes for
clients, which is more than just a statistical difference. The resultant effect sizes are large
enough to lead to the recommendation as a best clinical practice (Lambert, 2007). In
research to date, however, the most important determinant of treatment outcome was
identified as initial client functioning, specifically severity, complexity of disorder, and
somatization, among other variables in a client’s functioning (Lambert & Anderson,
1996).
For the OQ-45, a Reliable Change Index (RCI) (Jacobson & Truax, 1991), a
measure of a client’s change beyond chance, and clinically significant change, a measure
of a client’s functionality, have been established (Lunnen & Ogles, 1998). The RCI has
been supported by subsequent studies (Bauer, Lambert, & Nielsen, 2004; Beckstead et
al., 2003) which state that the RCI is a moderate, but reliable, estimate of treatment
effects. However, Lambert (2007) states that the practical meaning of these scores in
client’s lives needs further research. For example, it is unknown how a depressed client’s

21
change score that exceeds the RCI manifests in the client’s life. Whether the client will
have reliably more social interactions and eat or sleep better is unknown.
There are several limitations of the aforementioned OQ-45 research studies. Most
of the data was collected from one university outpatient clinic by a single research team.
The generalizability of such findings is therefore limited. Another limitation is the
therapists, with no direction given to them, were free to use feedback as they saw fit. The
understanding of the impact of treatment is limited by the usage of only one measure of
improvement. Despite these present limitations, Lambert and colleagues have expanded
their outcome measures and patient-oriented research by developing more efficient,
briefer measures, such as the OQ-30, and the Youth-Outcome Questionnaire (Y-OQ;
Burlingame et al.,1996).
The Y-OQ was developed as the child and adolescent equivalent of the adult OQ-
45 for use in monitoring client progress during treatment (Bishop et al., 2005;
Burlingame, et al.1996). The Y-OQ is designed primarily to assess observed behavior
change. Parents, or others with sufficient interaction with the client, complete the Y-OQ
at intake, which is deemed “baseline”, and then complete it regularly to track the client’s
changes. Lambert and colleagues (Lambert et al., 2003) state that client outcome
improves by repeated measurement. The most reliable gauge of change is the total score
(Burlingame, Cox, Wells, & Lambert, 2003).
Burlingame, Wells, Lambert, and Cox (2004) report that data from thousands of
children of different populations (such as elementary school students, a community
normative sample, outpatients, inpatients, and a clinical normative sample) have been
collected regarding the Y-OQ. Those samples yielded a high internal consistency (r =

22
.97) (Bishop et al., 2005). The total score of the Y-OQ has a strong relationship with the
total score of the Child Behavior Checklist (CBCL; Achenbach, 1991). This supports its
criterion-related validity (Burlingame et al., 2001). Studies have examined how the Y-OQ
behaves over the course of treatment (Burlingame et al., 2004), and cut points for
evaluation (Bishop et al., 2005). Criteria for the early identification of possible treatment
failure have been studied and established (Bishop et al., 2005). It has been suggested that
future studies with the Y-OQ should examine whether providing feedback to therapists or
client’s parents would result in improved client outcomes, as was found for the OQ-45
(Bishop et al., 2005).
Kazdin (2005) asserts that the Y-OQ can be used in different ways to evaluate
treatment progress, such as by looking at only certain subscales or items. However,
Kazdin (2005) comments that the Y-OQ needs further research to establish its validity
since it is a parent-report measure and “no one perspective (e.g., parent, teacher, and
child) can be taken as the truth or may even well represent how the child is doing”
(p.555). Furthermore, parental characteristics such as “psychopathology, stress, and
social isolation influence the data the parent provides about the child and how deviant the
child appears” (Kazdin, 2005, p.555). Thus, initially measuring parents’ level of stress
and depression along with the Y-OQ may be beneficial in interpreting Y-OQ scores.
Durham et al.’s (2002) study was the first to examine reductions in scores based
on the frequency of assessment for parent ratings of their children. They found significant
pretreatment reductions in Y-OQ scores, with more frequent assessment contributing to
greater score reductions. However, they concluded that the reductions were below what
they characterized as clinically significant change.

23
Purpose of this Research
Measures are validated by their sensitivity to change (Vermeersch et al., 2000).
This sensitivity includes scores changing in their predicted post-treatment manner, scores
reflecting treatment changes by discriminating between treated and untreated populations
(i.e., the measure remains stable in an untreated population), and how scores are
influenced by measurement error (Mash & Hunsley, 2005). Pretreatment reductions in
scores obscure treatment measurement interpretation, and call into question the reliability
and validity of measures (Arrindell, 2001).
A significant amount of the previous research on assessment effects have design
limitations which weaken their conclusions. Much of the research is based on pre/post
designs which demonstrate that over time there were reductions in scores reflecting less
symptomatology. The researchers infer that since there was no intervention, the plausible
explanation is that the assessment itself caused score reductions. However, there may be
many reasons (e.g., legitimation, chronicity, etc.) for score reductions. Assessment effects
may be one of the reasons for score reductions, but cannot be established as a cause based
on a pre/post design alone. The present study’s design improves on much of the previous
research by having two groups, one assessed only pre/post and one with multiple
assessments (see Walters et al., 2009). This design renders more valid inferences whether
score reductions are due to assessment itself.
Previous research has also primarily focused on pretreatment score reductions and
assessment reactivity (and related constructs) where individuals reported on their own
behavior. Relatively few studies have examined whether pretreatment improvement
occurs when one rates someone else’s behavior (e.g., a parent rating a child). Patterson

24
and Narrett (1990) and Milich et al. (1980) found reductions in parent and teacher ratings
of aggressive, oppositional, and hyperactive children without intervention. Patterson and
Narrett (1990), and Milich et al. (1980) examined repeated measures as a pre/post design
(i.e., two administrations) and did not look at any further repeated measures during
treatment or assessment. Durham et al. (2002), however, found pretreatment reductions in
Y-OQ scores as a function of multiple assessments (i.e., more than two administrations)
in a non-clinical sample and called for additional studies to explore the reduction in
scores, as this study does.
Pretreatment reductions in scores, particularly repeated assessment of parents’
ratings of their children’s behavior may have benefits in one of two ways: parental
perceptions and parental behaviors. “At their core BRS [behavior rating scales]…are the
quantification of a perception. For parents and teachers it is a perception of a youth’s
behavior or internal experience…” (Smith, 2007, p.139). Burlingame et al. (2004) and
Patterson and Forgatch (1995) agree with this conclusion. Therefore, parental perceptions
of their children are important therapeutic outcomes. Pretreatment reductions in scores
may also indicate changes in parental behaviors and are therapeutic outcomes. For
example, Behavioral Parent Training (Barkley, 1997) is a commonly used intervention in
treating children and adolescents with ADHD (Patterson & Forgatch, 1995; Pelham &
Fabiano, 2008). Repeated assessment may cause parents to change their interactions with
their children before the first treatment session and may benefit their children.
The first problem addressed by the current research was whether pretreatment
score reductions occur in parental ratings of child behavior and in ratings of parenting
behavior. Secondarily, if pretreatment improvement was found, some of its potential

25
causes, such as repeated assessment, social desirability, and mechanical responding, were
examined. These causes have the most substantial research base and are the most
frequently cited reasons for pretreatment reductions in scores (Durham et al., 2002). The
following hypotheses were formulated to address these problems.
Reduction in Youth Outcome Questionnaire Scores (Hypothesis #1)
There will be a reduction in scores on the Y-OQ at its last administration in
comparison to its first administration. Although the Y-OQ is generally considered stable
in an untreated population (Burlingame et al., 2004), this hypothesis was based on
Durham et al.’s (2002) finding reductions in Y-OQ scores in a non-clinical population.
The present research tested the Y-OQ’s stability in a clinical population.
More Frequent Assessment Will Lead to Greater Score Reduction (Hypothesis #2)
The frequency of Y-OQ administration will contribute to a reduction in scores
resulting in a greater reduction in Y-OQ scores in a more frequently assessed group (i.e.,
repeated measurement) than in a minimally assessed group. If the more frequently
assessed group has a greater reduction in scores, then the frequency of Y-OQ
administration will have contributed to the reduction of scores. This conclusion is based
on the notion that, if assessment has beneficial effects, then more assessment would be
advantageous (i.e., a dose effect). The reduction in scores would, therefore, be a true
reflection of present symptomatology. These two hypotheses correspond to Vermeersch
et al.’s, (2000) assertion that it is appropriate to propose that a control group will change
but that the intervention group (i.e., the group with more frequent assessment) will
change significantly more.

26
There Will be Score Reduction Across Domains; Reduction Will be Influenced by
Frequency of Assessment (Hypothesis #3)
Parents will report reductions in scores across domains. Beneficial effects from
repeated assessment will be found for both parents and children.
A. Similar to hypotheses 1 and 2, scores on an independent psychopathology
measure (Conners-3) are hypothesized to decrease at its last administration, in
comparison to its first administration. There will also be a greater decrease for the group
more frequently assessed with the Y-OQ. Repeated assessment as a cause of reductions in
symptomatology will not be supported if both groups’ scores decrease equally.
B. Parenting stress scores, as assessed by the Parenting Stress Index-Short Form,
will decrease at the last administration in comparison to the first administration for both
groups. The more frequently assessed group will show a greater decrease in scores. If
scores decrease, but not based on Y-OQ administration frequency, then repeated
assessment as a cause of reductions in parenting stress scores is not supported.
C. Both groups will report less problem intensity on the Eyberg Child Behavior
Inventory at the last administration in comparison to the first administration. Parents in
the more frequently assessed group will report a greater reduction in scores than those in
the less frequently assessed group.
D. All parents will report more skillful parenting behaviors on the Parenting Scale
at the last administration in comparison to the first administration. Parents in the more
frequently assessed group will report more improvement in their parenting behaviors than
those in the less frequently assessed group.

27
E. Parents in the more frequently assessed group will report greater satisfaction at
the last session, as assessed by the Client Satisfaction Questionnaire, than parents in the
less frequently assessed group. This result, if found, would support repeated assessment
as a cause of reductions in scores.
F. Parents in the more frequently assessed group will report a stronger therapeutic
alliance at the last session, as assessed by the Working Alliance Inventory, than parents in
the less frequently assessed group. This result, if found, would also support repeated
assessment as a cause of reductions in scores.
G. All parents will report an increased awareness of their children’s problem and
positive behaviors as assessed by the general study questionnaire. Parents in the more
frequently assessed group will report a greater awareness. This result, if found, would
further support repeated assessment as a cause of reductions in scores.
H. All parents will report increased positive and decreased negative interactions
with their children as assessed by the general study questionnaire. Parents in the more
frequently assessed group will report more positive and less negative interactions than the
less frequently assessed group. This result, if found, would also support repeated
assessment as a cause of reductions in scores.
I. All parents will report an improved perception of their children as assessed by
the general study questionnaire. Parents in the more frequently assessed group will report
a better perception of their children than the less frequently assessed group. This result, if
found, would further support repeated assessment as a cause of reductions in scores.

28
Social Desirability (Hypothesis #4)
Social desirability, as assessed by the Marlowe-Crown Social Desirability Scale,
will not be significantly related to change scores on other measures, as was found in the
Durham et al. (2002) study, and will not be found as a potential reason for any reduction
in scores.
Mechanical Responding (Hypothesis #5)
Mechanical responding as assessed by the Test-Taking Survey-Revised will not
be significantly related to change scores on other measures, as was found in the Durham
et al. (2002) study, and will not be found as a potential reason for any reduction in scores.
Initial Child Symptomatology (Hypothesis #6)
Initial child symptomatology, as measured on the Conners-3, is hypothesized to
moderate decreases in symptoms, regardless of the frequency of assessment. Children
rated as having more initial symptomatology will have less symptom improvement at the
end of the assessment than those children initially rated as having less symptomatology.
Maternal Depression (Hypothesis #7)
A potential reason for not finding reductions in scores in maternal ratings of child
behaviors is maternal symptoms of depression. Previous research (Chi & Hinshaw, 2002)
suggested that maternal symptoms of depression are associated with ratings of their
children. Depressed mothers incorrectly reported their children had symptoms of ADHD,
i.e., a negative reporting bias (Chi & Hindshaw, 2002). It is not known whether, or how,
maternal depression levels are associated with pretreatment reduction in scores. It was
hypothesized that parental symptoms of depression, as rated by the total score of the
BDI-II, will moderate any reported decreases in scores. Parents with more symptoms of

29
depression at initial testing, in comparison to parents with less symptoms of depression at
the initial testing, will report less decrease in scores (hypotheses #1, 2, & 3) at the last
testing session.

30
CHAPTER II
Method
Participants
Participants were recruited from mothers of clients presenting for a
psychoeducational evaluation at a university based outpatient treatment clinic in South
Florida. Based on a power analysis (G-Power; Erdfelder, Faul, & Buchner,1996) for a
repeated measures analysis of variance (RM-ANOVA) with α = .05, and β = .80, with an
expected medium effect size (based on reported effect sizes of Ahava et al., 1998; French
& Sutton, 2010; and McCambridge, 2009) of F =. 15, thirty-four adult, mother,
participants (N = 34) were initially sought for the study. Mothers were recruited during
routine screening for their childrens’ appropriateness for the treatment clinic. Study
inclusion criteria were: (a) the mother resided with her child, (b) the child was between
the ages of six and 17 years old, (c) the child was not concurrently attending formal
psychological treatment, and (d) the child met criteria for a disruptive behavior disorder
as indicated in their assessment report on file.
Additionally, at the first assessment session each participant was asked to identify
an adult collateral and to give his or her contact information. The collateral was someone
who had regular contact with the child brought for the assessment (i.e., lived in the same
household or spent at least 15 hours per week with the child) and who could also be
called upon to complete the Eyberg Child Behavior Inventory at the beginning and end of
the psycho-educational assessment.

31
Measures
Refer to Appendix A for measures used in the study1.
Pretreatment Measures
Participants completed a phone screening and measures given by their therapist
both as part of the routine clinic assessment and additional assessment measures given in
the course of the experiment.
Screening
Parents were screened for their appropriateness for the clinic and the study. They
were asked to rate, on a one to 10 Likert scale, with a “1” being “no problem or minimal
problem” and a “10” being a “serious or major problem, or a problem you are extremely
worried about” the degree of problems in various areas (e.g., academic problems at
school and behavioral problems at home). Parents were also asked to respond “true” or
“false” to a statement about their child’s school recommendation for an evaluation.
Routine Assessment Measures
The Conners 3rd Edition (Conners-3). The Conners-3 (Conners, 2008) rating
scales, “is a multi-informant assessment of children and adolescents between 6 and 18
years of age” (p. 1). The purpose of the Conners-3 is to serve as a focused and detailed
assessment of Attention Deficit Hyperactivity Disorder (ADHD) and comorbid disorders
of childhood. The Conners-3 may also be used for screening, planning and monitoring of
treatment interventions, for research purposes, and for decision making about eligibility
_______________________ 1The Conners 3rd Edition, Eyberg Child Behavior Inventory, Parenting Stress Index-
Short Form, Beck Depression Inventory, 2nd Edition, and Youth Outcome Questionnaire
could not be included due to copyright laws but are available for purchase at the
following websites (www.mhs.com; www.parinc.com; www.pearsonclinical.com; and
www.oqmeasures.com).

32
for special education. In the present study, the Conners-3 (parent form, full version, 110
items) was used as a measure of child symptomatology. Parents answer questions on a
scale from 0 (Never or Seldom) to 3 (Very true or Very frequently).
Reliability measures for the Conners-3 Parent form are excellent, with internal
consistency coefficients (Cronbach’s Alpha) at .90 or above. Both test-retest and
interrater reliability are acceptable and were corrected for restriction of range due to low
variability in the scores. Adjusted test-retest reliability ranged from .82 to .98 for parent
scales except for Executive Functioning (.72) and Peer/Family Relations (.78). Interrater
reliability correlations across informants (parent and teacher) ranged from .52 to .94. A
Reliable Change Index, which takes into account the difference in test scores between the
two administrations and the Standard Error of Difference, was also calculated (Conners,
2008).
The Conners-3 Parent form has been shown to have high discriminant validity
with good sensitivity and specificity, adequate positive-predictive power, and
classification rate. Construct validity was established through scale structure validity
using exploratory and confirmatory factor analyses. The Conners-3 Parent form yielded a
five-factor solution (Learning Problems, Aggression, Hyperactivity/Impulsivity, Peer
Relations, and Executive Functioning). Construct validity was moderately established by
comparing across informants. The mean parent to teacher correlation was .60, the mean
parent to youth correlation was .56, and the mean teacher to youth correlation was .48
(Conners, 2008).
Convergent validity was demonstrated with significant correlations using three
other instruments, the Behavior Assessment System for Children, 2nd Edition (BASC-2,

33
Reynolds & Kamphaus, 2004), the Achenbach System of Empirically Based Assessment
(ASEBA, Achenbach, 1991), and the Behavior Rating Inventory of Executive Functions
(BRIEF; Gioia, Isquith, Guy, & Kenworthy, 2000).
The Eyberg Child Behavior Inventory (ECBI). The ECBI is a 36-item parent
report measure of child (ages 2-16) conduct problems (Eyberg & Pincus, 1999). It was
given to further assess child symptomatology. Parents are asked about compliance
problems with instructions, concentration, aggression, and defiance. Respondents are
asked to rate how often specific behaviors occur on a scale from 1 (Never) to 7 (Always)
and whether these behaviors are considered to be problematic (Yes or No). Cutoff scores
of 127/11 (Intensity score = 127 or greater; Problem score = 11 or greater) are used to
determine clinical significance. Test-retest reliability (rs = .86 - .88) and internal
consistency is high (α = .95 for the Intensity Scale and α = .93 for the Problem Scale).
Collateral participants also completed the ECBI within approximately one week of the
first assessment session.
The Parenting Stress Index 3rd Edition, Short Form (PSI-SF).The PSI-SF was
created through factor analyses of the full 120-item self-report instrument (Abidin, 1995).
It contains 36 items and has three primary factors; Parental Distress, Parent-Child
Dysfunctional Interaction, and Difficult Child. The PSI-SF’s primary purpose is to
identify parent-child systems under stress and “at risk for the development of
dysfunctional parenting behaviors or behavior problems in the child involved” (Abidin,
1995, p. 6). The Total Stress Scale on the PSI-SF highly correlates with the Total Stress
Scale on the full length PSI (r = .94). Test-retest reliability (rs = .68 - .85) and internal

34
consistency (αs = .80 - .91) are also acceptable to high. It was administered in this study
to measure parenting stress.
The Beck Depression Inventory 2nd Edition (BDI-II). The BDI-II is “a 21-item
self-report instrument for measuring the severity of depression in adults and adolescents
aged 13 years and older” (Beck, Steer, & Brown, 1996, p. 3). The BDI–II has
demonstrated excellent test–retest reliability (1 week; r = .93) and internal consistency
for psychiatric outpatients and non-clinical college students (αs = .92 and .93,
respectively; Beck et al., 1996). The BDI-II shows strong concurrent validity, with a
moderately high correlation with the Hamilton Psychiatric Rating Scale for Depression-
Revised (r = .71) in psychiatric outpatients. A two-factor (Somatic-Affective and
Cognitive) solution accounted for the majority of the common variance in both the
outpatient and the non-clinical college samples. The BDI-II was administered as a
measure of maternal symptoms of depression to determine if they have a relationship
with change scores on measures of symptomatology and parenting stress.
Additional Experiment Assessment Measures
The Youth Outcome Questionnaire (Y-OQ). The Y-OQ is a 64-item parent-
report measure of children’s (ages 4-17) behavioral symptoms (Bishop et al., 2005). Each
item is rated on a 5-point scale and yields scores from -16 to 240, with higher scores
indicating endorsement of more distress and pathology. Seven questions assess positive
behaviors and have negative weights. The Y-OQ has six scales which measure
interpersonal distress (e.g., anxiety, depression), somatic issues, interpersonal relations
(e.g., arguing, fighting), social problems (e.g., violation of social norms), behavioral
dysfunction (e.g., organization, concentration), and critical items (severe symptoms,

35
mainly for inpatient use). The Y-OQ may be used as a screening tool and as an ongoing
assessment (to measure behavioral change over brief periods) and as an outcome
measure. For this study, the Y-OQ was administered as a measure of child
symptomatology in addition to acting as the repeated measure assessment to induce
assessment reactivity in the experimental group. The Y-OQ was designed to be sensitive
to change over time and is estimated to take 5-7 minutes to complete. Burlingame et al.
(2001) reported a sample of children receiving treatment had a significantly greater
change in scores than a sample of children not receiving treatment (17.7 points vs. 4.3
points) over an eight week period. Although divided into six subscales, the total score is
typically used because studies have shown one underlying factor (Burlingame et al.,
2004). Parents rate each item on a 0 “never or almost never”, to 4 “almost always or
always” scale.
The Y-OQ was normed based on three samples (community, inpatient, and
outpatient) and the Y-OQ scores of the three samples were found to be statistically
significantly different from one another on total scores (community mean = 23.2,
outpatient mean = 78.6, inpatient mean = 100) and on all but one subscale. Using the
mean scores, a cutoff score of 46 was calculated for evaluating treatment outcome based
on Jacobson and Truax’s (1991) formula. If clients' scores fall below this number, their
behaviors are assumed to be comparable to the normal community group. A reliable
change index (RCI) of 13 points was also calculated based on the three sample means.
For an individual's score to be reliably or clinically significantly changed over time, it
must be 13 points lower than the initial score and must also cross the cutoff score.

36
Internal consistency reliability estimates (Cronbach's alpha) are high (α = .94),
which suggests a strong single factor underlying the six subscales (Burlingame et al.,
2004). Estimates for subscale reliability range from αs = .51 to .90. Test-retest reliability
at two weeks and four weeks for a normal sample produced an average coefficient of α =
.83 (Burlingame et al., 2004).
Criterion-related validity evidence was shown by comparing total scores and
parallel subscales from the Child Behavior Checklist (CBCL; Achenbach, 1991, like
scales average .51 vs. unlike scales .18) and the Conners' Parent Rating Scale (Conners,
1990, like scales .55 vs. unlike scales .18) with typical and outpatient samples.
Correlations with measures of similar constructs (e.g., CBCL anxious/depressed and Y-
OQ intrapersonal distress) ranged from r =.48 to r = .78 and are within an acceptable
range. In addition, the total CBCL and Y-OQ scales were highly correlated (r = .78).
The Y-OQ’s sensitivity (proportion of members of clinical groups correctly
identified) and specificity (proportion of members of the normal group correctly
identified) has also been studied (Burlingame et al., 2004). The Y-OQ was found to
correctly identify clinical group members 82% of the time and normal group members
89% of the time with the cutoff score of 46. These findings are comparable to the
sensitivity and specificity of the CBCL (Achenbach, 1991). Evidence of discriminant
validity has been shown by the Y-OQ's ability to reliably distinguish between groups of
normal, outpatient, and inpatient samples, with scores significantly increasing with
restrictiveness of setting.
Burlingame et al., (2004) suggest that the Y-OQ be administered on a weekly or
biweekly schedule to detect change over time. However, repeated use of the Y-OQ has

37
shown that scores decrease over time (i.e., less symptoms) in the absence of treatment,
and that there is a greater magnitude of reduction in scores with a more frequent
administration schedule (Durham et al., 2002). No evidence, however, for social
desirability or mechanical responding was found to influence these changes in total
scores.
The Parenting Scale (PS). The PS is 30-item instrument originally developed to
assess the discipline practices of parents of preschool children (Arnold, O’Leary, Wolff,
& Acker, 1993). The shortened 10-item version that was developed for use with
preschool and elementary school children (Karazsia, van Dulmen, & Wildman, 2008;
Reitman et al., 2001) was used in this study and is described here. Confirmatory factor
analysis yielded a two-factor model of laxness and overreactivity (Karazsia et al., 2008).
Internal consistency for the total score of the full 30-item measure was α= .84 (Arnold et
al., 1993). Concurrent validity was demonstrated by significant relationships with
“various measures relevant to parental reports of children’s behavior and constructs
related to parenting behavior” (Karazsia, 2008, p. 511). The PS was administered to
measure maternal parenting behaviors.
A Demographic Questionnaire. The demographic questionnaire asked
participants to report their age, gender, ethnicity, marital status, education level,
employment status and job title, income, and psychological and treatment history.
The Daily Food List. The daily food list is an informational questionnaire
regarding their children’s daily diet. It was modified for this study to refer to the
children’s diet during the past week. The Daily Food List was given at each session for
the control group, and served as an active control group measure (Boot, Simons, Stothart,

38
& Stutts, 2013). In general, an active control group receives a similar therapy to the
intervention group, but the therapy does not specifically target the symptoms (Boot et al.,
2013). The active control group is designed to control for placebo (i.e., expectation)
effects of an intervention. In the present study, the Daily Food List was given to the
minimal assessment group to control for the attention and time that the experimental
group would receive from their therapists by the repeated administration of the Y-OQ.
The Daily Food List was purported to take a comparable amount of time to complete as
the Y-OQ. No data for completion time, however, was collected for any measures during
the study.
Ongoing /Treatment and Control Measures
The Y-OQ (see above for information) was given at each session for the treatment
group. The Daily Food List (see above for information) was given at each session for the
control group.
Post-treatment Measures
At the last scheduled assessment session (assessment report feedback), all
participants received an envelope from their therapist. The envelope included a cover
letter with instructions and the assessment measures in the following order; Conners-3,
Y-OQ, Daily Food List, ECBI, and PS (see above for information regarding the
aforementioned measures). Approximately within one week of the feedback session the
collaterals were scheduled to complete the ECBI.
The Working Alliance Inventory, Assessment Short Form (WAI). A modified
assessment version of the WAI (Horvath & Greenberg, 1989) was used. The WAI in its
full client form is a 36-item questionnaire with each item rated on a scale from 1 “Never”

39
to 7 “Always” which assesses Bordin’s (1979) three elements of alliance: agreement on
therapy goals, agreement on therapy tasks, and the therapeutic bond. Higher scores reflect
a stronger alliance. A strong therapeutic alliance has consistently been found to correlate
with positive therapy outcomes (Fenton, Cecero, Nich, Frankforter, & Carroll, 2001).
Research has also found the therapeutic alliance to be the strongest predictor of
successful treatment outcomes (Orlinsky, Ronnestad, & Willutzki, 2003). Internal
consistency for the entire scale (patient version) has been estimated at .93. The WAI has
also demonstrated high convergent validity with the Empathy Scale of the Barret-
Lennard Relationship Inventory (BLRI; Barrett-Lennard, 1962). The modified
assessment version of the WAI was similar to changes made by Ackerman, Hilsenroth,
Baity, and Blagys (2000) in their study of the “Interaction Therapeutic Process and
Alliance During Psychological Assessment” (p.82). The WAI was administered in this
study to determine if the groups differed in their working alliance.
The PSI-SF. (see above for information)
The Client Satisfaction Questionnaire-8 (CSQ). The CSQ (Attkisson & Zwick,
1982) is an 8-item measure that assesses post-service client satisfaction. Test-retest
reliability coefficients are not reported for the CSQ. Internal consistency was α= .83
(Attkisson & Zwick, 1982). Predictive validity has been demonstrated by higher
satisfaction scores for service completers as compared to non-completers (Attikisson &
Zwick, 1982). Additionally, treatment outcome comparisons between CSQ scores and the
Brief Psychiatric Rating Scale were moderately correlated (Attikisson & Zwick, 1982).
Furthermore, Ogles, Lambert, and Masters (1996) assert that the CSQ has adequate
psychometric properties and has been favorably reviewed by several independent

40
sources. The CSQ was administered to explore whether the groups differed in their
satisfaction levels.
General Questionnaire. The general questionnaire was specifically created for
this study. It was used to determine if any differences between the groups existed in
participants’ thoughts about the study, the assessment process, and whether they changed
any behaviors during the course of the assessment/study.
The Marlowe-Crowne Social Desirability Scale (SDS). The SDS (Crowne &
Marlowe, 1960) is a 33-item, true-false, self-report measure. Crowne and Marlowe
defined social desirability and then selected items which reflect their construct. The items
were described as consisting of “behaviors which are culturally sanctioned and approved
but which are improbable of occurrence (e.g., My table manners at home are as good as
when I eat out in a restaurant)” (Crowne & Marlowe, 1960, p. 350). Test-retest reliability
estimate was .89, and internal consistency was estimated to be .88 (Crowne & Marlowe,
1960). Durham et al. (2002) assert that “it is expected that parents’ sensitivity toward or
motivation to endorse socially sanctioned attributes would also be reflected in the way
they respond to items for their child” (p. 244). The SDS was administered to determine
whether social desirability would be associated with change scores on the main outcome
variables.
The Test Taking Survey (TTS). The TTS (Durham et al., 2002) is a 10-item
preliminary measure of mechanical responding. It was developed for Durham et al.’s
study (2002) as a way to assess mechanical responding based on the Bromet et al.’s
(1986) definition of mechanical responding that includes completing the retest quickly
due to lack of interest and a lack of consideration for the items. Items are scored on a 5-

41
point Likert scale with high scores indicating greater interest and thoughtfulness. The
TTS was developed as a preliminary attempt to measure mechanical responding, no
validity or reliability information is available. Similarly to the SDS, the TTS was
administered to explore whether mechanical responding would be associated with change
scores on the main outcome variables.
Treatment
The variable that was manipulated (the independent variable) was the additional
administration of three Y-OQ measures, one at each assessment session, for the
intervention group in comparison to the control group.
Procedure
Participants who met the above inclusion and exclusion criteria [except criteria
(d) which was collected after completion of assessment] and expressed interest in the
study during screening were informed before their initial appointment that their therapist
would give them an envelope with more information regarding the study. The envelope
contained a cover letter, two informed consent forms, a demographic questionnaire, the
Youth Outcome Questionnaire, and the Daily Food List. The cover letter instructed
participants to read the informed consent form and to sign both copies if interested in
participating in the study. Participants were instructed to complete the demographic
questionnaire, the Y-OQ, and the Daily Food list and place them, along with one copy of
the informed consent, back in the envelope (the other copy for them to keep) and to
return it to their therapist.
Participants were then assigned (within therapist) in an alternating fashion to one
of two groups without the therapists’ knowledge of group assignment: “Traditional”

42
Assessment (control) or “Enhanced” Assessment (intervention). The “Traditional”
Assessment group received an envelope coded with a number that indicated the group
and the session number. At each assessment session an envelope containing a cover letter
and the Daily Food list was presented to be read, completed, and returned to their
therapist. The “Enhanced” Assessment group also received an envelope coded with a
different number representing their group and session number. Their envelope contained
a cover letter and the Y-OQ to be read, completed at each assessment session and
returned to their therapist. The “Enhanced Assessment” group participants, to be included
in the analysis, were required to complete a minimum of two Y-OQs before the
assessment feedback session.
At the last assessment session (assessment report feedback) both groups were
given a packet by their therapist and instructed to complete the following measures: (a)
Y-OQ, and then (b) Conners-3, (c) the Daily Food List, and (d) the ECBI. The
instructions asked participants to complete these questionnaires in reference to their child
as reflecting the child’s present behaviors and functioning. Parents were then instructed
to complete questionnaires that assessed their own functioning, thoughts about the study,
or perceptions of behavior change (i.e., the WAI, the PSI-SF, the CSQ, the SDS, and the
TTS).
Data Analysis
The analyses are organized in the following fashion. Initially presented are the
baseline characteristics of the sample and a comparison table between groups and of the
overall sample. Next, is a comparison table of demographic and baseline measurement
data between participants who completed the study and those who did not. Chi-Square

43
tests for categorical variables, and one way Analyses of Variance (ANOVA) for
continuous variables, are utilized for comparisons. Reasons for the clinic evaluation
based on screening questions are then discussed and tables are presented. Two (time:
pretest, posttest) x 2 (condition: academic, behavioral/social) mixed (i.e., between-within)
Repeated Measures Analyses of Variance (RM-ANOVA) were computed for outcome
measures. Similar RM-ANOVAs are conducted for school vs. home screening variables.
The equality of the control and experimental groups in their reasons for seeking an
evaluation is then presented as percentages. Next, is a count and percentage analysis of
direction of change on the main outcome variables regarding the pre-post effect of time.
Chi-Square analyses were conducted comparing change direction to expected change
direction. Next, graphs of pre-post individual score changes, group mean score changes,
and combined group mean score changes, are presented for the main outcome variables.
The rest of the analyses are organized by hypothesis.
For hypotheses #1 and #2, a 2 (time: pretest, posttest) x 2 (condition:
experimental, control) mixed (i.e., between-within) Repeated Measures Analyses of
Variance (RM-ANOVA) was computed for Y-OQ scores. The between subject factor is
group/condition and the within subject factor is time. The study-wide type I error rate (a)
was set at the .05 level. Cohen’s d, the difference between means in standardized units
(Cohen's d = M1 – M2 / SDpooled), was selected as the effect size. To obtain Cohen’s d, eta
squared (η2= SSM/SST, where SSM is the sum of squares for the effect, and SST is total
amount of variance in the data) was first calculated (Field, 2013). Eta squared is equal to
r2, the coefficient of determination (Field, 2013). The square root of the coefficient of
determination (r, the Pearson Product- Moment Correlation) was then converted to

44
Cohen’s d using Rosenthal’s (1994) formula; d = 2r /√1 − 𝑟2. Interpretation of Cohen’s
d follows his proposed guidelines (Cohen, 1988) of d = .2, small, d = .5, medium, and d =
.8, large.
RM-ANOVA is sensitive to data structure, i.e., the distribution of data and
outliers. Therefore, test assumptions of RM-ANOVA are presented before the RM-
ANOVA. Outliers were identified by examination of their standardized scores.
Significant outliers were determined to be z = 3 Standard Deviations. Additional ways of
determining whether the data distribution met test assumptions included visual inspection
of the plot, the skewness and kurtosis, skewness and kurtosis significance based on
standard scores, the Kolmogorov-Smirnoff skewness test, and Levene’s test for
homogeneity of variance. Following the RM-ANOVA on the Y-OQ, is a descriptive
statistics table for the Y-OQ.
Analyses for Hypothesis #3 are organized in the following order: symptomatology
and status of major presenting problems; parenting stress and parenting behavior;
awareness of child behaviors, parent interactions with child, and parent perception of
child; and therapeutic alliance and client satisfaction. For the symptomatology and status
of major presenting problems section (i.e., ECBI, Conners-3 CGI), RM-ANOVAs with
the same test assumption procedures as described above are presented followed by
descriptive statistics tables. To examine hypotheses between groups, without repeated
measures, such as mothers’ ratings of the status of major presenting problems (from the
General Study Questionnaire), a one-way Analysis of Variance (ANOVA) with the same
test assumption procedures as the RM-ANOVA were selected. As with the RM-ANOVA,
the test assumption analyses are presented first, followed by the ANOVA and Cohen’s d

45
effect size. A descriptive statistics table ends the section. The parenting stress and
parenting behavior section (i.e., PSI-SF, Parenting Scale) is arranged as above with RM-
ANOVA assumptions, RM-ANOVAs, descriptive statistics tables, followed by ANOVA
assumptions, ANOVA (General Study Questionnaire, self-reflection of any discipline
behavior changes) and a descriptive statistics table. The awareness of child behaviors,
parent interactions with child, and perception of child section, and therapeutic alliance
and client satisfaction sections consist of a series of assumptions of ANOVAs and then
ANOVAs followed by descriptive statistics tables.
Hypotheses #4 and #5 utilize Pearson Product-Moment Correlation Coefficients
(r, Pearson) of change scores on the main outcome variables (i.e., YOQ, Conners-3, PSI-
SF, ECBI, PS-O, and PS-L) with ratings of mechanical responding (TTS) and social
desirability (SDS). Change scores are appropriate to use and can be reliable and valid
(Rogosa & Willett, 1983; Williams & Zimmerman, 1996). The Pearson correlation, r, is
also utilized as the effect size (Field, 2013). Test assumptions based on a visual
inspection of plots, a statistical check of skewness and kurtosis, a standard score
significance examination of skewness and kurtosis, and the Kolmogorov-Smirnoff
skewness test are first discussed. The Pearson correlations then follow. Similar to
hypotheses #4 and #5, test assumptions of Pearson correlations, and then Pearson
correlations for Hypotheses #6 and #7 are presented. All references in the results section
to significance or non-significance pertain to statistical significance (p < .05).

46
CHAPTER III
Results
Baseline Characteristics of Sample and Comparison of Groups
In all, 58 mothers were screened as eligible for the study. Twenty-nine mothers
did not enter into the study, 29 consented for the study, and 12 were excluded from the
study and/or specific analyses (see Appendix A). Specifically, participants who did not
complete the last time point were not included in analyses for which completion was
required. However, analyses for which only the first time point was required (e.g.,
baseline demographics) included all participants, whether they completed all study
materials or not. In total, 17 mothers entered into and completed the study in its entirety.
All but two mothers (92.9%) indicated that their highest level of education included at
least some college, with the majority holding either an associate’s or bachelor’s degree
(57.2%). Six mothers (21.5%) reported having a master’s or doctorate degree. Table 1
summarizes baseline demographic and rating scale data by group and by overall sample.
Table 2 compares participants who completed and non-completers on baseline
demographics and measures. No significant differences were found.

47
Table 1
Baseline Means, SDs, and Percentages for Participant and Child Characteristics
Combined
N = 28
M (SD)
Control
N = 11
M (SD)
Experimental
N = 17
M (SD)
P Mother Demographics
Age 41.32(7.69) 38.64(8.12) 43.06(7.10) .140
Racea .905
Non-Hispanic White 25.0% 27.3% 23.5% -
African American 32.1% 27.3% 35.3% -
Other 42.9% 45.4% 41.2% -
Relationship Statusa .657
Married 67.9% 72.7% 64.7% -
Not Married 32.1% 27.3% 35.3% -
Employmenta .903
Full-Time 71.4% 72.7% 70.6% -
Not Full-Time 28.6% 27.3% 29.4% -
% in Psych Txa 10.7% 9.1% 11.8% .823
BDI-II 11.29(10.96) 7.14(5.87) 13.36(12.45) .230
Child Demographics
Age 10.49(3.11) 10.21(2.89) 10.67(3.32) .709
Racea .425
Non-Hispanic White 32.1% 18.2% 41.2% -
African American 25.0% 27.3% 23.5% -
Other 42.9% 54.5% 35.3% -
Gender (% Male)a 85.7% 77.8% 88.2% .636
Baseline Measures -
Y-OQ 50.96(35.76) 42.73(25.51) 56.29(40.92) .336
ECBIb 116.85(39.54) 117.83(42.46) 116.43(39.88) .944
Conners-3 CGIc 71.3(19.19) 65.56(13.89) 75(21.6) .259
PSId 84.14(23.46) 79.75(16.61) 86.85(27.11) .515
PS-O 4.68(1.5) 5.14(1.09) 4.3(1.51) .428
PS-L 5.27(1.27) 5.97(1.05) 5.04(1.48) .165
Note. % in Psych Tx = Percentage of mothers in psychological treatment, BDI-II = Beck
Depression Inventory 2nd Edition, Y-OQ= Youth Outcome Questionnaire, ECBI = Eyberg Child
Behavior Inventory, Conners-3 CGI= Conners 3rd Edition Conners Global Index, PSI = Parenting
Stress Inventory 3rd Edition Short Form, PS-O = Parenting Scale Overreactivity Scale, PS-L =
Parenting Scale Laxness Scale
a Mothers’ Race, Relationship Status, Employment, Psych Tx and Child’s Race and Gender are
presented as percentages. b Total N = 20, Control N = 6 Experimental N = 14. c Total N = 23,
Control N = 9 Experimental N = 14. d Total N = 21, Control N = 8 Experimental N = 13.

48
Table 2
Baseline Means, SDs, and Percentages for Participant and Child Characteristics for
Completers and Non-Completers
Completer
N = 17
M (SD)
Non-Completer
N = 11
M (SD)
p Mother Demographics
Age 41.41(7.36) 41.18(8.54) .940
Racea .905
Non-Hispanic White 23.5% 27.3% -
African American 35.3% 27.3% -
Other 41.2% 45.4% -
Relationship Statusa .203
Married 58.8% 81.8% -
Not Married 41.2% 18.2% -
Employmenta .066
Full-Time 58.8% 90.9% -
Not Full-Time 41.2% 9.1% -
% in Psych Txa 11.8% 9.1% .823
BDI-II 11.21(10.76) 11.43(12.23) .968
Child Demographics
Age 10.13(3.49) 11.04(2.47) .460
Racea .536
Non-Hispanic White 35.3% 27.3% -
African American 17.6% 36.4% -
Other 47.1% 36.4% -
Gender (% Male)a 88.2% 81.8% .636
Baseline Measures -
Y-OQ 48.71(31.89) 54.54(42.46) .686
ECBIb 120.29(40.47) 108.83(39.65) .567
Conners-3 CGIc 70.73(20.19) 72.38(18.42) .850
PSId 83.69(25.53) 85.6(17.4) .878
PS-O 4.65(1.38) 4.73(1.73) .893
PS-L 5.42(1.37) 5.04(1.13) .442
Note. % in Psych Tx = Percentage of mothers in psychological treatment, BDI-II = Beck
Depression Inventory 2nd Edition, Y-OQ= Youth Outcome Questionnaire, ECBI = Eyberg Child
Behavior Inventory, Conners-3 CGI= Conners 3rd Edition Conners Global Index, PSI = Parenting
Stress Inventory 3rd Edition Short Form, PS-O = Parenting Scale Overreactivity Scale, PS-L =
Parenting Scale Laxness Scale. Any percentages that do not equal 100% are due to rounding.
a Mothers’ Race, Relationship Status, Employment, Psych Tx and Child’s Race and Gender are
presented as percentages. b Completer N = 14 Non-Completer N = 6. c Completer N = 15 Non-
Completer N = 8. d Completer N = 16 Non-Completer N = 5.

49
An examination of the clinic screening questions was used to determine the
reasons for the child’s clinic evaluation along two dimensions, academic or
behavioral/social, and school or home. Likert scale screening questions were asked for
academic, behavioral, or social concerns (i.e., 1 to 10, with 10 being a major problem) in
the school or home settings. Scores from the academic, behavioral, and social questions
were added. The individual score which was higher (i.e. reflects more difficulty) was
assigned as the reason for the evaluation. This was decided even when the combined
behavioral and social scores were higher than the academic score, since in almost all
instances the combined behavioral and social scores would be greater than the academic
score. When either the behavioral or social score was greater, the behavioral/social
category was assigned as the reason for the evaluation. A similar procedure was used for
determining the school vs. home dimension. In one instance where the score for home
was higher, the parent indicated that the only reason for the evaluation was that someone
from their child’s school asked or recommended that their child receive an evaluation.
That participant, despite their higher home score, was assigned to the school category as
the reason for the evaluation. It should be noted that it was not possible to determine with
certainty the provider of the ratings (i.e., mother, father, or both). Table 3 compares
academic and behavioral/social reasons for the evaluations and Table 4 compares school
and home reasons. There were no significant differences between groups along the
academic vs. behavioral/social dimension. Along the school vs. home dimension there
were significant differences between the groups on the Y-OQ, ECBI, Conners CGI, and
PSI, with the home reason for the evaluation being rated as more symptomatic.

50
Table 3
Screening: Academic vs. Behavioral/Social
Academic Behavioral/Social
Pre
M (SD)
Post
M (SD)
Pre
M (SD)
Post
M (SD)
p
Y-OQ 59.11(35.74) 45.22(35.89) 40.00(24.08) 19.00(29.69)
Within .015
Interaction N=9 N=7 .582
Between .154
ECBI 128.43(38.91) 114.43(40.74) 114.20(49.09) 97.20(57.46)
Within .168
Interaction N=7 N=5 .888
Between .538
Conners CGI 78.50(21.54) 67.75(21.03) 63.83(15.89) 53.67(15.35)
Within .014
Interaction N=8 N=6 .937
Between .163
PSI 92.89(26.24) 80.11(23.33) 75.17(20.33) 65.50(26.81)
Within .032
Interaction N=9 N=6 .745
Between .201
PS-O 4.49(1.50) 4.42(1.22) 4.60(1.23) 5.06(1.41)
Within .402
Interaction N=9 N=7 .266
Between .570
PS-L 4.91(1.60) 4.89(.83) 6.14(.75) 5.80(.95)
Within .383
Interaction N=9 N=7 .442
Between .060
WAI 73.75(7.04) 74.57(12.86)
Between N=4 N=7 .910
CSQ 28.33(4.41) 27.50(6.25)
Between N=6 N=6 .795 Note. Y-OQ= Youth Outcome Questionnaire, ECBI = Eyberg Child Behavior Inventory, Conners-3 CGI=
Conners 3rd Edition Conners Global Index, PSI = Parenting Stress Inventory 3rd Edition Short Form, PS-O
= Parenting Scale Overreactivity Scale, PS-L = Parenting Scale Laxness Scale, WAI = Working Alliance
Inventory, Assessment, CSQ = Client Satisfaction Questionnaire.

51
Table 4
Screening: School vs. Home
School Home
Pre
M (SD)
Post
M (SD)
Pre
M (SD)
Post
M (SD)
p
Y-OQ 26.00(8.49) 13.63(24.61) 81.20(22.2) 58.43(32.71)
Within .020
Interaction N=8 N=7 .444
Between <.01
ECBI 79.20(15.32) 71.00(40.67) 157.00(18.79) 141.00(26.68)
Within .292
Interaction N=5 N=6 .727
Between <.01
Conners CGI 58.57(10.20) 49.71(8.79) 89.83(16.46) 75.83(21.38)
Within .011
Interaction N=7 N=6 .507
Between .002
PSI 72.50(19.47) 61.25(27.01) 102.50(24.19) 91.33(10.01)
Within .045
Interaction N=8 N=6 .993
Between .015
PS-O 4.90(1.25) 5.13(1.34) 4.14(1.54) 4.37(1.25)
Within .365
Interaction N=8 N=7 .994
Between .269
PS-L 5.65(1.54) 5.68(1.09) 5.00(1.24) 4.89(.76)
Within .800
Interaction N=8 N=7 .693
Between .250
WAI 69.33(11.83) 80.20(5.50)
Between N=6 N=5 .093
CSQ 26.00(5.18) 29.83(4.83)
Between N=6 N=6 .214 Note. Y-OQ= Youth Outcome Questionnaire, ECBI = Eyberg Child Behavior Inventory,
Conners-3 CGI= Conners 3rd Edition Conners Global Index, PSI = Parenting Stress Inventory 3rd
Edition Short Form, PS-O = Parenting Scale Overreactivity Scale, PS-L = Parenting Scale
Laxness Scale, WAI = Working Alliance Inventory, Assessment, CSQ = Client Satisfaction
Questionnaire.

52
The reasons for the evaluation, based on the screening questions, were applied to
the control and experimental groups for comparison. The groups were relatively equal in
their reasons for the evaluations (see Table 5 and Table 6).
Table 5
Percentages of Screening Reasons for Control and Experimental Groups: Academic vs.
Behavioral/Social
Group Academic N School % Behavioral/Social N Home %
All Participants
Control 9 81.8% 2 18.2%
Experimental 12 80.0% 3 20.0%
Completers Only
Control 5 71.4% 2 28.6%
Experimental 6 66.7% 3 33.3%
Table 6
Percentages of Screening Reasons for Control and Experimental Groups: School vs.
Home
Group School N School % Home N Home %
All Participants
Control 5 55.6% 4 44.4%
Experimental 8 53.3% 7 46.7%
Completers Only
Control 3 50.0% 3 50.0%
Experimental 4 44.4% 5 55.6%
The children (four girls and 24 boys), who were the focus of mothers’ ratings for
the study, ranged in age from 6–17 years (M = 10.49, SD = 3.11) with the majority
(85.6%) aged 6-12. Diagnoses of the children were obtained from their evaluations
conducted in the outpatient clinic. Principal Axis I diagnoses were attention-
deficit/hyperactivity disorder (ADHD) combined type (32.1%), ADHD inattentive type
(17.9%), reading disorder (10.7%), oppositional defiant disorder (ODD) (7.1%), and
mathematics disorder (7.1%). Other diagnoses (each 3.6%) included; ADHD

53
hyperactive/impulsive type, disorder of written expression, mood disorder not otherwise
specified, moderate intellectual disabilities, rule-out of depressive disorder not otherwise
specified, and rule-out ADHD combined type. Most children (74%) met criteria for more
than one disorder (M = 2.3, SD = 1.1). The majority of secondary Axis I diagnoses were
ODD (30.0%), anxiety disorder not otherwise specified (15.0%), ADHD combined type
(10.0%), and mathematics disorder (10.0%). Other secondary Axis I disorders, each
comprising five percent of secondary diagnoses included; ADHD inattentive type,
disorder of written expression, expressive language disorder, generalized anxiety
disorder, social phobia, rule-out separation anxiety disorder, and rule-out learning
disorder not otherwise specified. Three children had three diagnoses, while six children
had four diagnoses.
All but one mother provided collateral contact information (i.e., 27 out of 28
mothers). A spouse or common-law partner was chosen by mothers as the collateral 44%
of the time. A parent (of the mother), or an adult, son or daughter of the mother were
each chosen 14.8% of the time. A brother or sister, or grandparent of the mother, were
each chosen once, comprising 3.7% each of the designated collateral. Another relative
was chosen 14.8% of the time while “other” was chosen once. Fourteen collaterals
completed the first ECBI. Nine collaterals did not respond to phone calls. One designated
collateral chose not to provide information while one collateral was not called after the
mother was dropped from the study. Two collaterals were not called within the specified
calling period. Of the 14 collaterals that completed the ECBI at the first time point, only
four completed the second time point. Seven collaterals did not respond to phone calls at

54
the second time point and three collaterals were not able to be called within the specified
calling period.
Preliminary Pre-Post Percentage Change in the Hypothesized Direction
As a preliminary analysis regarding the effect of time, the percentage of
individual pre-post change scores that changed in the hypothesized direction (generally a
decrease in scores reflecting less symptomatology) was calculated for the primary
outcome measures. For this analysis, scores for the Parenting scale (where an increase in
score reflects better parenting) were inverted for ease of comparison across measures so
that now a decrease in score reflects better parenting. Across measures, with the
exception of the Parenting Scale, scores decreased in the hypothesized direction for
between 73.3% and 87.5% of the participants (see Table 7). One-way Chi Square
analyses were conducted to compare the number of score decreases and score increases
for each measure. Significant Chi-Square values were found for the Y-OQ, χ2 (1) = 4.765,
p = .029 and the PSI-SF, χ2 (1) = 9.000, p = .003. Figures 1 and 2 depict changes in
individual scores, changes in group means, and changes in combined group means over
time.

55
Table 7
Direction of Change in Scores, Pretest to Posttest, for main Outcome Measures
Measure/Scale n #Scores
Decrease
% #Scores
Increase
% Chi-Square
p
Y-OQ 17 13 76.5 4 23.5 .029
ECBI 13 10 76.9 3 23.1 .052
PSI-SF 16 14 87.5 2 12.5 .003
Conners-3 CGI 15 11 73.3 4 26.7 .071
PS-O 17* 8 47.1 7 41.2 .808
PS-L 17** 6 35.3 10 58.8 .225
Notes. Y-OQ= Youth Outcome Questionnaire, ECBI = Eyberg Child Behavior Inventory,
Conners-3 CGI= Conners 3rd Edition Conners Global Index, PSI-SF = Parenting Stress Inventory
3rd Edition Short Form, PS-O = Parenting Scale Overreactivity Scale, PS-L = Parenting Scale
Laxness Scale. PS-O and PS-L scores were inverted for comparable interpretation; * = 2 scores
did not change; ** = 1 score did not change; A decrease in scores means fewer reported
symptoms.

56
Figure 1. Individual Change and Group Change in Y-OQ, ECBI, and PSI Scores

57
Figure 2. Individual Change and Group Change in Conners CGI, PS-O, and PS-L Scores

58
There will be decreased scores on the Y-OQ, pre vs. post test (time); the decrease in
scores will differ by group (Hypotheses #1& #2)
A RM-ANOVA was computed for the Y-OQ scores to test hypotheses #1 and #2.
A standard scores inspection for outliers did not indicate any outliers. A visual inspection
of the Y-OQ plot suggested skewness in the data. A statistical examination of the
skewness and kurtosis, where scores closer to an absolute value of 1 indicate more skew,
also suggested skewness in the distribution for the Y-OQ at the pre time point (.831).
Skewness was not significant (absolute value >1.96) for the pre time point based on
skewness standard scores (z = .001). The Kolomogorov-Smirnov (K-S) test, however,
was significant for the pre time point, D (28) = .206, p =.004, but not for the post time
point D (17) = .138, p = .200. Levene’s test for homogeneity of variance was not
significant for the pre time point F(1,15) = 3.333, p = .088, or for the post time point
F(1,15) = .078, p = .784.
Most relevant to hypothesis #1 was a significant within-subject main effect of
time on Y-OQ scores, F(1,15) = 9.44, p = .008, d = 1.5, indicating that mean scores on
the Y-OQ decreased significantly and with a large effect size. Lower mean scores reflect
lesser parent-reported symptom severity. The between-subject main effect of group for
the Y-OQ was not significant, F(1, 15) = .659, p = .43, d = .42. Most relevant to
hypothesis #2, the interaction effect of group by time was not significant, F(1,15) =
1.772, p = .20, d = .54, indicating that mean changes in Y-OQ scores over time did not
vary significantly by condition (See Table 8 for all Y-OQ descriptive statistics).

59
Table 8
Descriptive Statistics for the Youth Outcome Questionnaire Across Time points
Time Group N M SD Range
T1(Pre) Control 11 42.73 25.51 -2 - 92
Experimental 17 56.29 40.92 12 - 133
Combined 28 50.96 35.76 -2 - 133
T5 (Post) Control 7 20.57 37.29 -16 - 89
Experimental 10 40.70 31.22 3 - 92
Combined 17 32.41 34.27 -16 - 92
Note. Higher scores = more problems; Possible scores of -16 to 240
Parents will report reductions in scores and beneficial effects of repeated assessment
will be found for themselves and their child (Hypothesis #3)
Symptomatology (ECBI & Conners-3) and Status of Major Presenting Problems
As part of several analyses to test hypothesis #3, a RM-ANOVA was computed
for ECBI Intensity scores. A standard scores inspection for outliers did not indicate any
outliers. A visual inspection of the ECBI plot suggested skewness in the data. A statistical
examination of the skewness and kurtosis, where scores closer to an absolute value of 1
indicate more skew, suggested kurtosis but not skewness in the distribution for the ECBI
at both the pre (-1.102) and post time points (-1.016). Skewness and kurtosis were not
significant (absolute value >1.96) for either time point based on standard scores
(skewness pre z = .752, post z = .154; kurtosis pre z = -1.111, post z = -.931). The
Kolomogorov-Smirnov (K-S) test was not significant for the pre time point D (20) =
.187, p = .065, or for the post time point D (16) = .119, p = .200. Levene’s test for
homogeneity of variance was not significant for the pre time point F(1,11) = .002, p =
.968, or for the post time point F(1,11) = .766, p = .400.

60
For all RM-ANOVA analyses regarding hypothesis #3, the most relevant analyses
are the within-subject main effect of time and the interaction effect. The within-subject
main effect of time on scores of the ECBI was not significant, F(1,11) = 3.585, p = .085,
d = 1.06, indicating that mean scores on the ECBI did not decrease significantly. Lower
mean scores reflect lesser parent-reported symptom severity. The between-subject main
effect of group for the ECBI was not significant, F(1, 11) = .146, p = .71, d = .23,
indicating that there was no significant difference between the experimental and control
group means. The interaction effect of group by time was not significant, F(1,15) =
1.724, p = .22, d = .69, indicating that mean changes in ECBI scores over time did not
vary significantly by condition. (See Table 9 for ECBI descriptive statistics).
Table 9
Descriptive Statistics for the Eyberg Child Behavior Inventory, Intensity Scores, Across
Time Points
Time Group N M SD Range
T1(Pre) Control 6 117.83 42.46 58 - 177
Experimental 14 116.43 39.88 68 - 187
Combined 20 116.85 39.54 58 - 187
T2(Post) Control 7 93.86 48.32 36 - 170
Experimental 9 107.67 40.64 46 - 173
Combined 16 101.63 43.18 36 - 173
Note. Possible scores of 36 - 252
A RM-ANOVA was conducted for the Conners-3, Conners Global Index scale
(Conners-3 CGI). A standard scores inspection for outliers did not indicate any outliers.
A visual inspection of the Conners-3 CGI plot suggested skewness in the data. A
statistical examination of the skewness and kurtosis, suggested kurtosis in the pre time
point (-1.001). Skewness and kurtosis were not significant for either time point based on
standard scores (skewness pre z = 1.185, post z = .882; kurtosis pre z = -1.071, post z = -

61
.665). The K-S test, however, was significant for the pre time point D (23) = .194, p =
.025, but not for the post time point D (17) = .153, p = .200. Levene’s test was significant
for the pre time point F(1,13) = 11.410, p = .005, but not for the post time point F(1,13) =
.395, p = .541.
There was a significant within-subject main effect for time on scores of the
Conners-3 CGI, F(1,13) = 6.533, p = .02, d = 1.41, indicating that mean scores on the
Conners-3 CGI significantly decreased, and with a large effect size. Lower mean scores
reflect lesser parent-reported symptom severity. The between-subject main effect of
group for the Conners-3 CGI resulted in no significant effect, F(1, 13) = 3.031, p = .11, d
= .97, indicating that there was no significant difference in the experimental and control
group means. The interaction effect of group by time was not significant, F(1,13) = .148,
p = .71, d = .17, indicating that mean changes in Conners-3 CGI scores did not
significantly vary over time by group. (See Table 10 for all Conners-3 CGI descriptive
statistics).
Table 10
Descriptive Statistics for the Conners-3, CGI Scale, Across Time Points
Time Group N M SD Range
T1(Pre) Control 9 65.56 13.89 49 - 95
Experimental 14 75 21.6 46- 109
Combined 23 71.3 19.19 46 - 109
T2(Post) Control 7 57.43 20.97 40 - 94
Experimental 10 68.9 17.77 41 - 102
Combined 17 64.18 19.4 40 - 102
Mothers’ evaluation of the status of the major presenting problems for which they
initially sought assessment for their child was asked on the general questionnaire and
analyzed by an ANOVA. A standard scores inspection for outliers did not indicate any

62
outliers. A visual inspection of the status of the major presenting problems plot of the
general questionnaire suggested skewness in the data. A statistical examination of the
skewness and kurtosis suggested kurtosis (-1.006). Skewness and kurtosis were not
significant based on standard scores (skewness z = 1.174; kurtosis z = .922). The K-S test,
however, was significant D (16) = .307, p <.001. Levene’s test was not significant
F(1,14) = 3.570, p = .080. A one-way ANOVA revealed a significant difference between
the groups, F(1,14) = 5.268, p = .038, d = 1.23. On average, the traditional assessment
group rated the major presenting problem as being “somewhat improved”, while the
experimental group rated the status of the problem as being “the same” (See Table 11 for
descriptive statistics).
Table 11
Descriptive Statistics for the General Questionnaire, Status of Major Presenting
Problems
Time Group N M SD Range
T2(Post) Control 7 4.14 .9 3- 5
Experimental 9 3.33 .17 3- 4
Note. Possible scores of 1 - 5
Parenting Stress and Parenting Behavior
As with the ECBI and Conners-3 CGI, a similar RM-ANOVA was conducted for
the PSI-SF total raw score. A standard scores inspection for outliers did not indicate any
outliers. A visual inspection of the PSI-SF total raw score plot suggested skewness in the
data. A statistical examination of the skewness and kurtosis, suggested kurtosis in the pre
(1.156) and post (-1.356) time points. Skewness and kurtosis were not significant for
either time point based on standard scores (skewness pre z = .764, post z = -.06; kurtosis
pre z = 1.189, post z = -1.276). The K-S test was also not significant for either the pre

63
time point D (21) = .107, p = .200, or the post time point D (17) = .185, p = .125.
Levene’s test was not significant for either the pre time point F(1,14) = 1.792, p = .202,
or the post time point F(1,14) = .046, p = .834.
There was a significant within-subject main effect for time on scores of the PSI,
F(1,14) = 6.922, p = .02, d = 1.39, indicating that mean scores on the PSI significantly
decreased with a large effect size. Lower mean scores reflect lesser parent-reported
parental stress. The between-subjects main effect of group for the PSI resulted in a non-
significant effect, F(1, 14) = 1.826, p = .20, d = .72, indicating that there was no
significant difference in the experimental and control group means. The interaction effect
of group by time was not significant, F(1,14) = .328, p = .58, d = .25, indicating that
mean changes in PSI-SF scores did not significantly vary over time by group (See Table
12 for all PSI-SF descriptive statistics).
Table 12
Descriptive Statistics for the Parenting Stress Index-Short Form, Total Raw Score,
Across Time Points
Time Group N M SD Range
T1(Pre) Control 8 79.75 16.61 43 - 98
Experimental 13 86.85 27.11 46 - 145
Combined 21 84.14 23.46 43 - 145
T2(Post) Control 7 59.71 20.27 36 - 89
Experimental 10 79.7 24.96 39 - 112
Combined 17 71.47 24.64 36 - 112
Note. Possible scores of 36 - 180
A final set of RM-ANOVAs was conducted for the Parenting Scale-
Overreactivity (PS-O) and Parenting Scale-Laxness (PS-L) scales. For the PS-O scale, a
standard scores inspection for outliers did not indicate any outliers. A visual inspection of
the PS-O plot suggested skewness in the data. A statistical examination of the skewness
and kurtosis, did not suggest skewness (pre = -.561, post= .163) or kurtosis (pre = -.492,

64
post = -.078). Skewness and kurtosis were not significant for either time point based on
standard scores (skewness pre z = -1.272, post z = -.296; kurtosis pre z = -.573, post z = -
.074). The K-S test was also not significant for either the pre time point D (28) = .136, p
= .197, or the post time point D (17) = .138, p = .200. Levene’s test was not significant
for either the pre time point F(1,15) = 1.550, p = .232, or the post time point F(1,15) =
1.080, p = .315.
No significant within-subject main effect for time was observed on the PS-O
scale, F(1,15) = .251, p = .62, d = .12, indicating that mean scores on the PS-O scale did
not significantly increase. Higher means reflect more effective parenting, i.e., less
overreactivity. There was no significant effect for the between-subjects main effect of
group for the PS-O scale, F(1, 15) = 2.294, p = .15, d = .78, indicating that there was no
significant difference in the experimental and control group means. No significant
interaction effect of group by time was found, F(1,15) = .058, p = .81, d = .12, indicating
that mean changes in PS-O scores did not vary significantly over time by group (See
Table 13 for all Parenting Scale descriptive statistics).
For the PS-L scale, a standard scores inspection for outliers did not indicate any
outliers. A visual inspection of the PS-L plot suggested skewness in the data. A statistical
examination of the skewness and kurtosis, did not suggest skewness (pre = -.663, post=
.416) or kurtosis for the pre time point (-.011) but indicated slight kurtosis in the post
time point (-.800). Skewness and kurtosis were not significant for the either time point
based on standard scores (skewness pre z = -1.503, post z = .756; kurtosis pre z = -.013,
post z = -.753). The K-S test was also not significant for either the pre time point D (28) =
.106, p = .200, or the post time point D (17) = .131, p = .200. Levene’s test was not

65
significant for either the pre time point F(1,15) = .604, p = .449, or the post time point
F(1,15) = .256, p = .621.
No significant within-subject main effect for time was observed for the PS-L
scale, F(1,15) = 1.154, p = .30, d = .54, indicating that mean scores on the PS-L scale did
not significantly increase. Higher mean scores reflect more effective parenting, i.e., less
laxness. There was no significant effect for the between-subjects main effect of group,
F(1, 15) = 2.059, p = .17, d = .74, indicating that there was no significant difference in the
experimental and control group means. No significant interaction effect of group by time
was found, F(1,15) = .749, p = .40, d = .43, indicating that mean changes in Laxness
scores did not vary significantly over time by group.
Table 13
Descriptive Statistics for the Parenting Scale, Overreactivity and Laxness Scales,
Across Time Points
Scale Time Group n M SD Range
Overreactivity T1(Pre) Control 7 5.14 1.09 2.8 - 6.8
Experimental 10 4.3 1.51 1.4 - 6.4
Combined 17 4.68 1.5 1.4 - 6.8
T2(Post) Control 7 5.31 1.38 3.6 - 7.0
Experimental 10 4.36 1.11 2.2 - 6.0
Combined 17 4.75 1.28 2.2 - 7.0
Laxness T1(Pre) Control 7 5.97 1.05 4.2 - 7.0
Experimental 10 5.04 1.48 2.4 - 6.8
Combined 17 5.27 1.27 2.4 - 7.0
T2(Post) Control 7 5.6 .91 4.8 - 7.0
Experimental 10 5.0 .96 3.8 - 6.4
Combined 17 5.25 .96 3.8 - 7.0
Note. Possible scores of 1-7 for each scale
Mothers were asked on the general questionnaire whether their discipline
behavior changed over the course of the evaluation. Their answers were analyzed by an
ANOVA. A standard scores inspection for outliers did not indicate any outliers. A visual
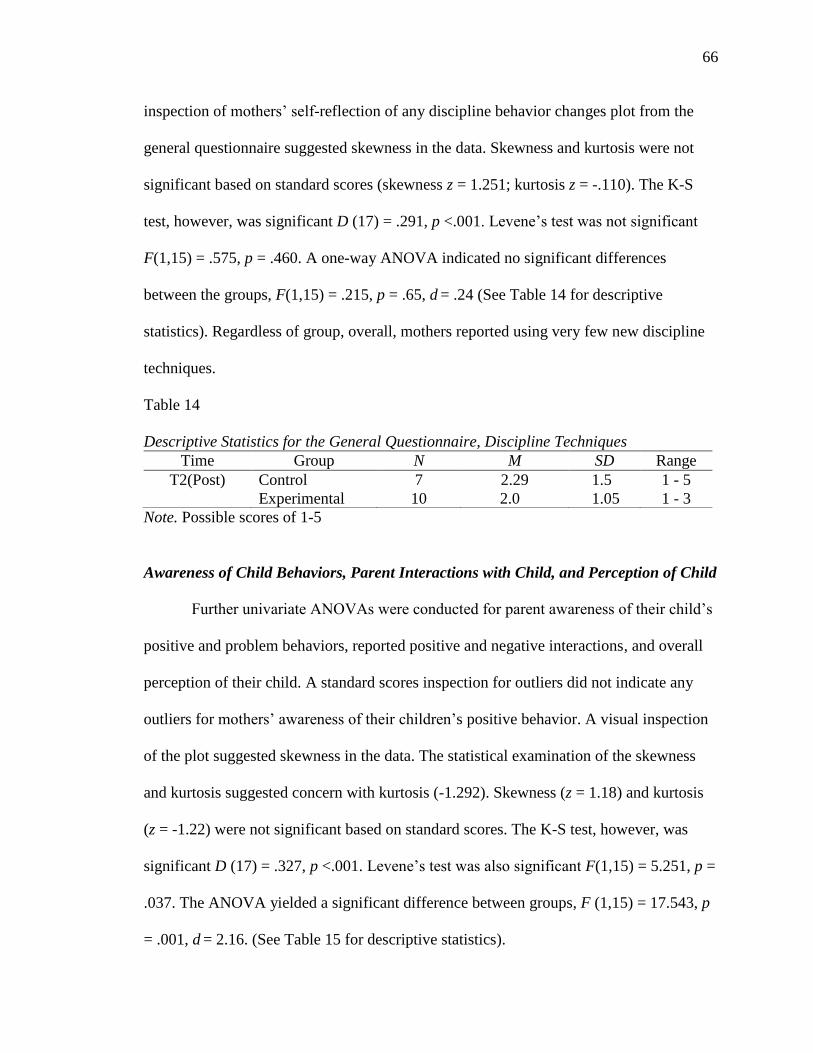
66
inspection of mothers’ self-reflection of any discipline behavior changes plot from the
general questionnaire suggested skewness in the data. Skewness and kurtosis were not
significant based on standard scores (skewness z = 1.251; kurtosis z = -.110). The K-S
test, however, was significant D (17) = .291, p <.001. Levene’s test was not significant
F(1,15) = .575, p = .460. A one-way ANOVA indicated no significant differences
between the groups, F(1,15) = .215, p = .65, d = .24 (See Table 14 for descriptive
statistics). Regardless of group, overall, mothers reported using very few new discipline
techniques.
Table 14
Descriptive Statistics for the General Questionnaire, Discipline Techniques
Time Group N M SD Range
T2(Post) Control 7 2.29 1.5 1 - 5
Experimental 10 2.0 1.05 1 - 3
Note. Possible scores of 1-5
Awareness of Child Behaviors, Parent Interactions with Child, and Perception of Child
Further univariate ANOVAs were conducted for parent awareness of their child’s
positive and problem behaviors, reported positive and negative interactions, and overall
perception of their child. A standard scores inspection for outliers did not indicate any
outliers for mothers’ awareness of their children’s positive behavior. A visual inspection
of the plot suggested skewness in the data. The statistical examination of the skewness
and kurtosis suggested concern with kurtosis (-1.292). Skewness (z = 1.18) and kurtosis
(z = -1.22) were not significant based on standard scores. The K-S test, however, was
significant D (17) = .327, p <.001. Levene’s test was also significant F(1,15) = 5.251, p =
.037. The ANOVA yielded a significant difference between groups, F (1,15) = 17.543, p
= .001, d = 2.16. (See Table 15 for descriptive statistics).

67
A standard scores inspection for outliers of mothers’ awareness of problem
behaviors did not indicate any outliers. A visual inspection of the plot suggested
skewness in the data. A statistical examination of the skewness and kurtosis suggested
concern with kurtosis (1.521). Skewness (z = -1.26) and kurtosis (z = 1.43) were not
significant based on standard scores. The K-S test, however, was significant D (17) =
.335, p <.001. Levene’s test was also significant F(1,15) = 4.783, p = .045. The ANOVA
was not significant, F (1,15) = .810, p = .38, d = .46.
A visual inspection of the plot of mothers reported changes in positive
interactions suggested skewness in the data. A statistical examination of the skewness
and kurtosis suggested concern with kurtosis (-2.083). Based on standard scores, kurtosis
(z = 1.96) was significant but skewness (z = -.235) was not. The K-S test was significant
D (17) = .306, p <.001. Levene’s test was not significant F(1,15) = 1.501, p = .239. The
ANOVA was not significant, F (1,15) = 3.97, p = .065, d = 1.03.
A visual inspection of the plot of changes in negative interactions with their child
suggested skewness in the data. A statistical examination of the skewness and kurtosis
suggested concern with kurtosis (-1.714). Based on standard scores, neither skewness (z =
0) or kurtosis (z = 1.612) was significant. The K-S test was significant D (17) = .229, p
=.018. Levene’s test was not significant F(1,15) = .071, p = .794. The ANOVA was not
significant, F (1,15) = 3.341, p = .09, d = .94.
A visual inspection of the plot of mothers’ overall perception of their children
suggested skewness in the data. A statistical examination of the skewness and kurtosis
suggested concern with kurtosis (-.975). Based on standard scores, neither skewness (z =
1.076) or kurtosis (z = .917) was significant. The K-S test was significant D (17) = .290,

68
p <.001. Levene’s test was not significant F(1,15) = 2.001, p = .178.The ANOVA
resulted in a significant difference between the groups, F (1,15) = 10.855, p = .005, d =
1.70. Regardless of group, on average, mothers reported that their awareness of problem
behaviors “remained the same,” positive interactions with their children were “somewhat
more common,” and negative interactions were “somewhat less common.”
Table 15
Descriptive Statistics for the General Questionnaire, Awareness of Behaviors,
Changes of Interactions, and Overall Perception
Question Time Group n M SD Range
Awareness of Positive Bx T2(Post) Control 7 4.43 .79 3 - 5
Experimental 10 3.2 .42 3 - 4
Combined 17 3.71 .85 3 - 5
Awareness of Problem Bx T2(Post) Control 7 2.86 1.46 1 - 5
Experimental 10 3.3 .48 3 - 4
Combined 17 3.12 .99 1 - 5
Positive Interactions T2(Post) Control 7 4.57 .79 3 - 5
Experimental 10 3.7 .95 3 - 5
Combined 17 4.06 .97 3 - 5
Negative Interactions T2(Post) Control 7 1.57 .79 1 - 3
Experimental 10 2.3 .82 1 - 3
Combined 17 2.0 .87 1 - 3
Overall Perception of Child T2(Post) Control 7 4.29 .76 3 - 5
Experimental 10 3.3 .48 3 - 4
Combined 17 3.71 .77 3 - 5
Notes. Possible scores of 1 – 5; Bx = Behavior
Therapeutic Alliance and Client Satisfaction
Parental alliance with therapist and client satisfaction were evaluated using the
Working Alliance Inventory (WAI) and the Client Satisfaction Questionnaire (CSQ).
Separate ANOVAs were conducted for each outcome variable. For the WAI, a visual
inspection of the plot suggested skewness in the data. A statistical examination of the
skewness and kurtosis suggested concern with both skewness (-1.890) and kurtosis

69
(4.555). Based on standard scores, both skewness (z = 2.97) and kurtosis (z = 3.70) were
significant. The K-S test, however, was not significant D (12) = .192, p =.200. Levene’s
test was not significant F(1,10) = 1.376, p = .268. The ANOVA was not significant,
F(1,11) = 4.293, p = .065, d = 1.31 (See Table 16 for WAI descriptive statistics).
Regarding the CSQ, a visual inspection of the plot suggested skewness in the
data. A statistical examination of the skewness and kurtosis did not suggest concern with
either one. Based on standard scores, neither skewness (z = -1.506) or kurtosis (z = -.688)
was significant. The K-S test was significant D (13) = .292, p =.003. Levene’s test was
not significant F(1,10) = .002, p = .962. The ANOVA was also not significant, F (1,11) =
.529, p = .48, d = .44 (See Table 12 for CSQ descriptive statistics).
Table 16
Descriptive Statistics for the Working Alliance Inventory and the Client Satisfaction
Questionnaire
Measure & Scale Time Group n M SD Range
WAI T2(Post) Control 6 80.17 5.154 71 - 84
Experimental 6 69.33 11.725 47 - 80
Combined 12 74.75 10.323 47 - 84
CSQ T2(Post) Control 5 29.00 5.66 19 - 32
Experimental 8 26.88 4.79 20 - 32
Combined 13 27.69 5.02 19 - 32
Note. WAI = Working Alliance Inventory; CSQ = Client Satisfaction Questionnaire;
Possible scores on the WAI are 12-84; Possible Scores on the CSQ are 8 - 32
Social Desirability and Mechanical Responding will not be significantly related to
change scores (Hypotheses #4 & #5)
The potential relationships of socially desirable and mechanical responding with
mothers’ ratings were measured by the MCSDS and the TTS. The MCSDS and the TTS
total scores were each correlated using Pearson correlations with change scores of the
main outcome measures (i.e., YOQ, ECBI, Connors-3 CGI, PSI-SF, and the PS-O and

70
PS-L). A visual inspection of the plot suggested skewness in the data, and one outlier,
who was subsequently excluded from the analysis, for hypothesis #4 (the MCSDS). Upon
reexamining the plot without the outlier, skewness continued to be apparent. A statistical
examination of the skewness and kurtosis suggested concern with skewness (-.690) but
not kurtosis (.397). Based on standard scores, skewness (z = -1.190) and kurtosis (z =
.354) were both not significant. The K-S test was also not significant D (15) = .128, p
=.200. Only the Pearson correlation of the MCSDS and the ECBI was significant r =
.699, p = .017. However, the effect sizes for the correlations with the Y-OQ, ECBI, PSI-
SF, and Conners CGI changes scores were in the medium and large ranges, which
suggested that participants responded in a socially desirable way, see Table 17 for all
correlations. Descriptive statistics of the MCSDS also suggest socially desirable
responding (M = 23.20, SD = 4.41, Min = 13, Max = 29).
A visual inspection of the plot suggested skewness in the data, and one outlier,
who was subsequently excluded from the analysis, for hypothesis #5 (mechanical
responding). Upon reexamining the plot without the outlier, skewness continued to be
apparent. A statistical examination of the skewness and kurtosis suggested concerns with
skewness (.931) but not kurtosis (.489). Based on standard scores, skewness (z = 1.61)
and kurtosis (z = .436) were both not significant. The K-S test was also not significant D
(15) = .166, p = .200. The Pearson correlations indicated that none of the change scores
for the main outcome measures were significantly correlated with the TTS. However,
effect sizes for the Y-OQ, PSI-SF, and Conners CGI were negative and in the moderate
to large range, see Table 17 for all correlations. This suggests that as change scores
increased, TTS scores decreased, meaning less overall participant interest and

71
thoughtfulness in completing the questionnaires. Nonetheless, descriptively, TTS scores
indicated an overall interest and thoughtfulness in completing the questionnaires (M =
40.73, SD = 2.40, Min = 38, Max = 46).
Table 17
Marlowe-Crowne Social Desirability Scale & Test Taking Survey Correlations with
Change Scores of the Y-OQ, ECBI, PSI-SF, Conners CGI, PS-O, and PS-L
MCSDS TTS
Measure/Scale r p r p
Y-OQ .390 0.151 -.501 0.057
ECBI .699 0.017 -.159 0.640
PSI-SF .346 0.226 -.447 0.109
Conners CGI .373 0.189 -.388 0.171
PS-O -.128 0.649 -.027 0.925
PS-L .021 0.942 .044 0.875
Notes. MCSDS= Marlowe-Crowne Social Desirability Scale; TTS= Test Taking Survey;
Y-OQ = Youth Outcome Questionnaire; ECBI = Eyberg Child Behavior Inventory; PSI-
SF = Parenting Stress Inventory- Short Form; Conners CGI= Conners 3rd Edition,
Conners Global Index; PS-O = Parenting Scale- Overreactivity Scale; PS-L = Parenting
Scale-Laxness Scale.
Initial client symptomatology, as measured on the Conners-3 CGI will be associated
with change scores (Hypotheses #6)
A Pearson correlation of initial child symptomatology on the Conners-3 CGI and
Conners-3 CGI change scores was conducted to test whether initial child
symptomatology was associated with change scores. The relationship between initial
child symptomatology on the Conners-3 CGI and change scores was not significant but
yielded a medium-large effect size, r = .434, p = .106.
Maternal symptoms of depression, as measured on the BDI-II, will be associated with
change scores (Hypothesis #7)
To test whether maternal depression was associated with change scores, Pearson
correlations of maternal symptoms of depression (as rated by the total score of the BDI-

72
II) and change scores of the main outcome variables were conducted. A visual inspection
of the BDI-II plot suggested skewness in the data. A statistical examination of the
skewness and kurtosis suggested concerns with skewness (1.154) but not kurtosis (.284).
Based on standard scores, skewness (z = 2.30) was significant while kurtosis (z = .292)
was not. The K-S test was not significant D (21) = .177, p = .085.There was a significant
relationship, and a large effect size, between the BDI-II and the change score of the
ECBI, r = -.718, p = .019. While all other relationships were not significant, the Y-OQ,
PSI-SF, and PS-L yielded large or medium effect sizes, see Table 18 for all correlations.
This suggests that for the aforementioned measures, more maternal depression is
associated with less change.
Table 18
BDI-II Correlations with Change Scores of the Y-OQ, ECBI, PSI-SF, Conners CGI,
PS-O, and PS-L
Measure/Scale R p
Y-OQ -.441 0.114
ECBI -.718 0.019
PSI-SF -.331 0.270
Conners CGI .005 0.988
PS-O -.190 0.515
PS-L -.396 0.161
Notes.BDI-II= Beck Depression Inventory, 2nd Edition; Y-OQ = Youth Outcome
Questionnaire; ECBI = Eyberg Child Behavior Inventory; PSI-SF = Parenting Stress
Inventory- Short Form; Conners CGI= Conners 3rd Edition, Conners Global Index; PS-O
= Parenting Scale- Overreactivity Scale; PS-L = Parenting Scale-Laxness Scale.

73
CHAPTER IV
Discussion
The purpose of this study was to explore whether pretreatment reductions in
scores occur during the assessment period for parent-self ratings and ratings of their
children. An additional goal was to explore possible causes of reductions in ratings (if
found), such as repeated assessment, social desirability, and mechanical responding.
Participants included 28 mothers of children presenting at a university-based outpatient
ADHD clinic for a psychoeducational evaluation. The Y-OQ was expected to show a
reduction in scores from its first administration to its last administration. Greater
reduction in scores was expected for the more frequently assessed group. Similar overall
reductions in scores, and greater reductions for the more frequently assessed group, were
expected to be found for child symptomatology, parenting stress, and parenting behavior.
Mothers who were more frequently assessed were expected to report greater satisfaction
and working alliance with their assessor than mothers who were not as frequently
assessed. This result would lend further support for beneficial effects of repeated
assessment. Additionally, parents were differentially, by group, expected to report an
increased awareness of their children’s behaviors, an increase in positive interactions
with their children, and improved perception of their children. This would be additional
support for the beneficial effects of repeated assessment. Another hypothesis was the
absence of the relationship between social desirability and mechanical responding with
change scores of measures of the aforementioned constructs. Lastly, initial client
symptomatology on the Conners-3, and maternal symptoms of depression, were
separately hypothesized to be associated with change scores.

74
Reduction in Scores over Time
Across domains (i.e., child symptomatology, parenting stress, parenting behavior)
and measures (i.e., Y-OQ, ECBI, Conners CGI, PSI, PS-O, and PS-L) it was
hypothesized that scores would decrease pre vs. post test (i.e., time). A preliminary
analysis of change in the hypothesized direction generally indicated a decrease in scores
across the main outcome measures over time, with some change analyses (i.e., Y-OQ,
PSI-SF) reaching statistical significance. The one exception to the decrease in scores was
the mothers’ reported parenting behaviors which did not indicate improvement.
Collectively, mothers reported less child symptomatology, and less parenting stress over
time, in the absence of intervention.
Results from RM-ANOVAs for the Y-OQ and the Conners-3 CGI showed
statistically significant decreases in mean scores over time with large effect sizes. These
results support the hypothesis. The pretreatment reductions in scores on the Y-OQ and
Conners-3 CGI are consistent with previous research showing symptom reduction on the
Y-OQ and other measures and constructs (Arrindell, 2001; Durham et al., 2002; Sharpe
& Gilbert, 1998; Swift et al., 2012; Young, 2006). Reduction in mean scores on the ECBI
approached statistical significance and had a large effect size. This again is consistent
with the hypothesis and with previous research (French & Sutton, 2010). Mean scores on
the PSI-SF decreased in a statistically significant way with a large effect size. This result
is consistent with the hypothesis and with the findings regarding child symptomatology.
Maternal ratings of child parenting stress can therefore also be added to the research base
(Arrindell, 2001; French & Sutton, 2010) as another area where pretreatment reductions

75
in scores has been found. Results from the PS-O and PS-L scales, regarding parenting
behavior, however, indicated non-significant mean changes.
In comparison to Durham et al.’s (2002) study on the Y-OQ, this study found a
greater magnitude of change, over a longer period of time (Mean = 23.6 weeks) from pre-
to post-assessment. Durham et al. (2002) reported that over a nine-week period the
weekly administration group had a 10.45 point reduction, the biweekly group a 9.64 point
reduction, the monthly group a 6.13 point reduction, and the pre/post group a 4.34 point
reduction. This study found for the pre/post control group a mean reduction of 22.16
points. The pre/post mean reduction for the experimental group was 15.59 points. The
mean for both groups combined was an 18.55 point reduction on the Y-OQ. These
reductions also reflect reliable change as they are greater than the Y-OQ’s 13-point
Reliable Change Index. There are a couple of ways to understand the large magnitude of
change without intervention; the Y-OQ is not as stable of a measure over longer periods
of time, or a large magnitude of change can occur over time without intervention. Future
research is necessary to further understand these reductions.
Effects of Repeated Assessment
It was hypothesized that across domains (i.e., child symptomatology, parenting
stress, parenting behavior) and measures (i.e., Y-OQ, ECBI, Conners CGI, PSI, PS-O,
and PS-L) repeated assessment would lead to greater score reductions. Results indicated
that for all domains and measures this hypothesis was not supported. This finding is in
opposition to previous research (e.g., Clifford et al., 2007; Longwell & Truax, 2005).
Repeated assessment was also hypothesized to influence parental perceptions of
the status of the major presenting problems. Contrary to expectations, the control group

76
rated the major presenting problem as being somewhat improved while the experimental
group rated the status of the problem as being the same. The frequency of assessment also
did not influence mothers’ self-reported discipline practices. Regardless of group, overall,
mothers reported using very few new discipline techniques.
Therapeutic Alliance and Client Satisfaction
Repeated assessment was also expected to influence working alliance and produce
greater client satisfaction. Again, counter to expectations, control group mothers reported
a stronger working alliance and no satisfaction differences existed between the groups. It
should be noted though, that both groups reported strong alliance with their therapists and
high satisfaction with the relationship.
Awareness of Child Behaviors
Parents were expected to report increased awareness of their children’s behaviors,
an increase in positive interactions, a decrease in negative interactions with their children,
and improved perception of their children. The more frequently assessed group was
hypothesized to report more beneficial change than the less frequently assessed group.
Contrary to the hypothesis, on average, the control group mothers reported increases in
awareness of their children’s positive behaviors. The experimental group’s awareness of
their children’s positive behaviors was unchanged. Also counter to expectations, all
mothers’ awareness of problem behaviors did not increase and awareness did not
significantly differ between the groups.

77
Parent Interactions with Child
Control group mothers reported positive interactions were more common while
positive interactions in the experimental group remained the same. Both groups reported
that negative interactions with their children were less common. Control group mothers
reported that negative interactions with their children were considerably less common
while experimental group mothers reported that negative interactions with their children
were only somewhat less common. Results for both positive and negative interactions
were contrary to the hypothesis that the frequency of assessment would cause a
differential increase in positive interactions and a decrease in negative interactions.
Perception of Child
Mother’s overall perception of their children differed significantly between the
groups. Control group mothers reported that their overall perception of their children was
somewhat more positive in contrast to experimental group mothers who reported that
their overall perception of their children remained the same. This result is counter to the
hypothesis. It should be noted that these results are from a measure that is face valid, has
no estimates of reliability or validity, and no normative sample with which to compare. It
was a preliminary attempt to measure maternal awareness of their children’s behavior,
interactions with their children, and perceptions of their children.
Plausible Explanations for Lack of Repeated Assessment Effects
There are a number of plausible explanations for not finding beneficial effects of
repeated assessment. It is possible, as mentioned previously as a scientific concern, that
the initial intensive assessment that mothers completed, from both clinical and research
contexts, prompted change across both groups and obscured group differences over time.

78
An initial intensive assessment was hypothesized as a reason for not finding differences
between groups on Project MATCH (DiClemente et al., 1994). Additionally, other
research (Ahava et al., 1998) suggested that initial assessment has stronger effects than
subsequent testing. Additional assessments would therefore not lead to any further
decrease in reported symptoms. French and Sutton (2010) suggest that decreases in
scores upon the second administration of a test are a systematic source of variance. It
follows that with additional assessment the true score becomes more apparent and likely
closer to the initial assessment score. This pattern, however, was not evident by the
experimental group Y-OQ data (see Appendix C). Scores on the Y-OQ showed a non-
significant increase at the second administration and then significantly decreased for the
following two administrations.
It is also possible that the experimental manipulation (either the amount of
repeated assessment, or the assessment measure, i.e, the Y-OQ, or both) was not strong
enough to cause change. The weakness of the experimental manipulation is also
compounded by the small sample size, which will be further discussed in the limitations
section. It should be noted though, that other studies (e.g., McCambridge & Day, 2008)
found beneficial effects of assessment with only one extra assessment. Furthermore,
during this study, at the time of the third and fourth extra assessments, no other
assessment measures or interviews with mothers occurred. Nonetheless, given the amount
of initial assessment and interviews, the administration of three additional questionnaires
may not have been sufficiently potent to induce change.
A final possible explanation for the present pattern of results is that repeated
assessment does not have the same effect for parental-report as it appears to have with

79
self report. Durham et al. (2002), however, found greater reductions in Y-OQ scores with
more frequent administration. Further research is necessary to understand the effects of
repeated assessment for parent-reports. In summary, pretreatment reductions in scores
were generally found, but repeated assessment did not emerge as a causal factor.
Additional Hypotheses Explored
Social Desirability
It was hypothesized that socially desirable responding would not be significantly
related to change scores of reported symptomatology, parenting stress, and parenting
behaviors. Contrary to the hypothesis, and previous work by Durham et al. (2002),
correlations of a medium to large effect size were found between a measure of socially
desirable responding and measures of parent-reported child symptomatology and
parenting stress. Moreover, in finding socially desirable responding, questions arise about
the validity of the results. Socially desirable responding suggests that mothers may have
answered according to their perception of the study’s goals. However, mothers were
qualitatively asked their perceptions of the reasons for the study and none were able to
accurately identify the study’s specific goals. Thus, the likelihood that their socially
desirable responses were due to the study is minimal. Alternatively, mothers’ socially
desirable responding may be due to their desire to please their child’s assessor from a
clinical perspective. Indeed, the mothers were simultaneously in a research and in a
clinical context. Furthermore, the clinical context may have had more impact on their
responses because it was their main impetus for presenting to the outpatient clinic.
Context has been found to be important in outcomes of measures (Knowles et al., 1996)

80
and future research should design a study whereby the effects of context may be
delineated.
Socially desirable responding by parents completing child behavior rating scales
has not been well researched. In the child maltreatment area specifically, parents
engaging in socially desirable responding is an obvious and well-documented concern
(Bennett, Sullivan, & Lewis, 2006). However, in psychoeducational assessment and for
more commonly used parent-report measures (i.e., ECBI, Conners-3), research on
socially desirable responding is lacking. Only two other research studies, to this
researcher’s knowledge, have evaluated the extent of parent’s socially desirable
responding while rating their children. Durham et al.’s (2002) study did not find socially
desirable responding in relation to the Y-OQ. Merydith, Plout, and Blaha (2003) found,
based on correlation and regression analyses, that socially desirable responding was
associated with Child Behavior Checklist ratings. The relationship between social
desirability and Child Behavior Checklist ratings was strongest for externalizing
behaviors and in particular for aggressive behaviors and attention problems. Merydith et
al.’s (2003) findings may therefore explain the large correlation and effect size that the
ECBI had with the SDS. The ECBI, to a great extent, is a measure of externalizing and
inattentive behaviors (Burns & Patterson, 2000). Based on the results of this study,
further research on socially desirable responding with other child behavior rating scales is
necessary.
Mechanical Responding
Results suggested a negative relationship between mechanical responding and two
symptomatology measures (the Y-OQ & Conners CGI) and parenting stress (PSI-SF),

81
with medium to large effect sizes. The correlations for the Y-OQ and the PSI-SF
approached significance. These results suggest that for these measures, as change scores
increased, TTS scores decreased, which implies less overall participant interest and
thoughtfulness in completing the questionnaires. Mothers may not be as invested in
responsibly reporting once they see children improving. However, it is unknown whether
more careful reporting would have lead to an increase or decrease in reported
symptomatology. Despite the aforementioned associations, descriptive TTS scores
indicated that mothers took an overall interest and carefully considered the items when
completing the questionnaires. Although the results in reference to social desirability
suggest that mothers likely answered in a socially desirable fashion, this response style
may not have been their intended outcome as they also reported that they responsibly
answered the questionnaires.
Initial Child Symptomatology
It was hypothesized that initial child symptomatology, as measured on the
Conners-3 CGI, would be associated with change scores. Specifically, children rated as
having more initial symptomatology were expected to have less symptom improvement
at the end of the assessment than those children initially rated as having less
symptomatology. Contrary to expectations, there was a positive relationship, which
approached significance between initial symptomatology and change scores on the
Conners-3 CGI. Children who were rated as having more symptomatology at the
beginning of the study were reported to have more change (i.e., less symptomatology)
over the course of the study. This is consistent with previous research that has reported
large pretreatment reduction in scores (Arrindell, 2001; Hesser et al., 2011; Sharpe &

82
Gilbert, 1998; Young, 2006;) but is in contrast to other research which predicts less
change for more symptomatic participants (Lambert et al., 1996).
The greater reduction in scores for children, who were initially rated as having
more symptomatology, should not be confused with regression to the mean. Extreme
scores would be expected to regress to the mean with retesting (Barkham et al., 2007). In
this study, mothers were not selected based on the high scores that they rated their
children, so regression to the mean should not be assumed. Secondly, even children
initially rated as having fewer symptoms showed a decrease in reported symptomatology.
Again, regression to the mean is not implied.
Maternal Symptoms of Depression
Maternal symptoms of depression, as rated by the BDI-II, were hypothesized to
be negatively associated with change scores, such that mothers with more symptoms of
depression at pre-test would report less decrease in their children’s scores. The
hypothesis was generally supported. Greater initial maternal depression was associated
with less change reported on four out of the six main outcome measures. These results
had medium and large effect sizes of which one (the ECBI) was also statistically
significant. These outcomes continue the findings of previous research (Chi & Hinshaw,
2002) suggesting that maternal symptoms of depression are associated with ratings of
their children. In previous research (Chi & Hinshaw, 2002) depressed mothers displayed
a negative bias and reported that their children had ADHD symptoms when in actuality
they did not. In the present study, maternal symptoms of depression were associated with
less change. Maternal ratings of their children may therefore also be negatively biased

83
and do not account for the full scope of beneficial change in their children’s
symptomatology.
Clinical Implications
Maternal ratings of child symptomatology and parenting stress were shown to
decrease in advance of any treatment. When asked directly about changes in perceptions
of their children results were mixed. However, based on symptomatology and parenting
stress measures, it appears that parental perceptions of their children changed. Parent
reports essentially measure these changes and are important therapeutic outcomes
(Burlingame et al., 2004; Patterson et al. 1995; Smith, 2007). Immediate improvements
may enhance a client’s or a parent’s investment in evaluation or treatment (Korotitsch &
Nelson-Gray, 1999). Clinicians should therefore consistently use formal measures of
child symptomatology and parenting stress in their practices on an ongoing basis from the
onset of an evaluation or treatment.
Another clinical implication is that of clients on a treatment waitlist or between an
assessment and the initiation of treatment. The present study found a reduction in scores
for mothers who reported no significant event occurred with their child that would have
changed their child’s ratings between assessment time-points. Similarly, other studies
(Posternak & Miller, 2001) that excluded participants who sought treatment in the interim
period have found reductions in scores that were double the rate of symptom reduction in
comparison to studies that included participants who sought treatment. This suggests that
the pretreatment improvement in scores is not merely due to therapy obtained elsewhere
(Young, 2006). Clinicians should therefore be aware that after an initial assessment, a
decrease in scores can occur even when clients have not sought therapy elsewhere.

84
Therefore, at the beginning of treatment clinicians should reassess present
symptomatology.
From a measurement perspective, as has been previously suggested (Arrindell,
2001; Diamon & Deane, 1990) clinicians conducting psychoeducational assessments with
children should use multiple baselines to more accurately understand child
symptomatology and parenting stress as rated by mothers. Consequently, it may be
beneficial to extend the timeframe of an evaluation to better comprehend child and parent
functioning.
Lastly, clinicians should be aware that social desirability may influence parental
ratings of their children (Smith, 2007). Although research in this area is lacking, the
present research suggests that socially desirable responding occurs with several parent-
report measures of their children. Clinicians may benefit from routinely assessing for
socially desirable responding to enhance their interpretations of other administered
measures.
Limitations
Although substantial and significant reductions in scores were found, this study
has several limitations. The study had participant attrition (see Appendix B). The greatest
percentage of attrition was caused by a failure to complete the final set of assessments.
Not completing the final set of assessments, or other assessments, in turn, was caused by
a combination of clinical realities on behalf of the therapists (e.g., time constraints,
misplacing research assessment packets) and the researcher not inducing the therapists
strongly enough to administer the assessments. It is also possible that participants were
not incentivized enough to complete the study. Another reason participants dropped out

85
of the study related to financial constraints in the clinic assessment. Not completing the
psychoeducational clinic assessment coincided with not completing the study. Other
reasons included participant time constraints, and research study errors. For example, the
child’s father, rather than the mother, erroneously completed the final assessments for
one participant. Another participant, despite denying it at screening, disclosed that her
son was currently in psychological treatment (i.e., a study exclusion criterion).
Statistically, since post-test data was unable to be collected from all participants,
analyses may have been influenced by participant dropout. However, no significant
differences were found on baseline demographics that were measured or on baseline
assessments ratings (see Table 2). Furthermore, the rate of participant dropout was
comparable between groups. Nonetheless, other factors which are beyond the scope of
this study may have been influenced by participant dropout.
From a statistical perspective, the study’s small sample size and the fact that the
groups were not equal in number likely biased the results of the RM-ANOVAs and
ANOVAs. Additionally, no adjustment was made for the multiple statistical tests, thus
the chances of a spurious finding were increased. However, significant effects were found
in addition to medium and large effect sizes, suggesting that the sample size was
sufficient to observe reductions in scores and differences between the groups. Confidence
intervals were not calculated for the effect sizes. Confidence intervals could have
clarified the findings by providing a range that includes the sampling error as opposed to
the point estimates of the effect sizes.
There are limitations regarding measurement. Data gathered from the TTS, WAI
assessment version, and the study’s general questionnaire were preliminary attempts to

86
understand these constructs in an assessment setting. No normative data exists for these
measures. Social desirability was identified as a concern and implies that mothers rated
the measures to please their therapists. Furthermore, only mothers’ ratings were collected
with no teacher or father perspective of children’s behaviors. No direct observations of
children’s behavior were conducted to corroborate mothers’ ratings. Despite attempts to
obtain collateral ratings at the end of the study, they were obtained in insignificant
numbers to yield valid results. The primary reason was that collaterals did not respond to
repeated phone calls by the researcher. Also, the researcher was unable to contact some
of the collaterals within the set timeframe.
Other limitations regard the study’s design. It is possible that the reductions in
scores and differences between the groups were diluted, or not discovered, due to the
amount of clinical and research tests and tasks that mothers were required to complete.
Mothers’ participation in a clinical assessment interview about their children between the
assessments may have contributed to a reduction in scores because the interviews are an
interpersonal interaction and may add therapeutic benefit (Ackerman et al., 2000).
However, in this study, both times that the mothers completed the measures were not in
the context of an interview. Furthermore, studies have shown that reductions of scores
can occur even absent an interview or interpersonal interactions (e.g., Durham et al.,
2002; Epstein et al., 2005; Godin et al., 2010). Nonetheless, placebo and expectation
effects (Weinberger & Eig, 1999) due to interactions with the therapist cannot be ruled
out.
The conceptualization and definition of placebo effects has been debated, as has
their applicability to psychotherapy research (Parloff, 1986; Stewart-Williams & Podd,

87
2004; Wampold &Imel, 2015). Placebo effects are nonetheless considered a genuine
phenomenon (Stewart-Williams & Podd, 2004). They have been characterized as
common elements in psychotherapy (Parloff, 1986) or as nonspecific variables (Horvath,
1988). Placebo effects may have been in operation in the current study contributing to
score reductions.
An additional limitation is that participants began the study at different times, and
took a variable amount of time to complete the study. History effects could therefore not
be ruled out. Mothers and children may have been exposed to different events outside of
the assessment that affected their reporting. Lastly, the generalizability of the results may
also be limited. The study was comprised of only mother’s perspectives of a small sample
of children mainly comprised of males from only one clinic in the South Florida region.
As such, caution should be taken when generalizing these results.
Suggestions for Future Research
Pretreatment reduction in scores has been found in a wide range of research areas
(Arrindell, 2001). As has been called for before (Arrindell, 2001; Longwell et al., 2005),
a meta-analysis is needed to determine the magnitude of pretreatment reduction across
studies and research areas. Future research should also utilize a larger, more
heterogeneous sample, from multiple clinics and geographic areas, to explore reductions
in symptoms and the effect of repeated measurement which may also allow for an
analysis of context factors. Behavioral observations to corroborate ratings should also be
undertaken to determine whether mothers’ ratings correspond to their children’s actual
behavior. Incorporating father’s ratings of children’s behavior would also be beneficial to
understanding whether the present findings are limited to mothers. Confidence intervals

88
should be calculated as they allow for a better understanding of reductions in scores and
the effects of repeated assessment. Reliable and valid measures should be developed with
normative data about mechanical responding and working alliance during an assessment.
Lastly, future research is necessary to determine the effects of socially desirable
responding on parent ratings in child behavior assessment.
Conclusion
Results generally indicated a significant decrease in scores across the main
outcome measures over time. The one exception was mothers’ reported parenting
behaviors which did not indicate improvement. Collectively, mothers reported less child
symptomatology and less parenting stress over time, in the absence of intervention.
However, more frequent assessment did not lead to a greater decrease in scores. As such,
the present study failed to replicate earlier research (e.g., Epstein et al., 2005;
McCambridge & Day, 2008) which suggested that repeated assessment alone could have
therapeutic effects. Results for mother’s awareness of children’s positive and negative
behaviors, positive and negative interactions, and overall perceptions of their children
also did not support any benefits of repeated assessment. Increased therapeutic alliance
and client satisfaction as an outcome of repeated assessment were not supported by the
results. Mothers likely engaged in socially desirable responding but did not necessarily
engage in mechanical responding. Children who were rated as having more initial
symptomatology were reported to experience greater change (i.e., less symptomatology)
over the course of the study. Lastly, maternal symptoms of depression were associated
with less change reported over the course of the study.

89
REFERENCES
Abidin, R.R. (1995). Parenting Stress Index (3rd ed.) Professional Manual. Lutz, FL:
Psychological Assessment Resources, Inc.
Achenbach, T.M. (1991). Manual for the child behavior checklist and 1991 profile.
Burlington: University of Vermont, Department of Psychiatry.
Ackerman, S.J., Hilsenroth, M.J., Baity, M.R., & Blagys,M.D. (2000). Interaction of
therapeutic process and alliance during psychological assessment. Journal of
Personality Assessment, 75, 82-109. doi:10.1207/S15327752JPA7501_7
Ahava,G.W., Iannone, C., Grebstein, L., & Schirling, J. (1998). Is the Beck Depression
Inventory reliable over time? An evaluation of multiple test-retest reliability in a
nonclinical college student sample. Journal of Personality Assessment, 70(2),
222-231. doi: 10.1207/s15327752jpa7002_3
Arnold, D.S., O’Leary, S.G., Wolff, L.S., & Acker, M.M. (1993). The parenting scale: A
measure of dysfunctional parenting in discipline situations. Psychological
Assessment, 5(2), 137-144. doi:10.1037/1040-3590.5.2.137
Arrindell, W.A. (2001). Changes in waiting-list patients over time: data on some
commonly-used measures. Beware! Behaviour Research and Therapy, 39, 1227-
1247. doi:10.1016/S0005-7967(00)00104-2
Atkeson, B.M., Calhoun, K.S., Resick, P., and Ellis, E.M. (1982). Victims of rape:
Repeated assessment of depressive symptoms. Journal of Consulting and Clinical
Psychology, 50, 96-102. doi: 10.1037/0022-006X.50.1.96

90
Attkisson, C. C., & Zwick, R. (1982) The Client Satisfaction Questionnaire:
Psychometric properties and correlations with service utilization and
psychotherapy outcome. Evaluation and Program Planning, 5, 233-237. doi:
10.1016/0149-7189(82)90074-X
Babor T. F., Higgins-Biddle J. C., Saunders J. B., Monteiro M.G. The Alcohol Use
Disorders Identification Test. Guidelines forUse in Primary Care.
WHO/MSD/MSB/01.6a. Geneva: World Health Organization; 2001. Available at:
http://whqlibdoc.who.int/hq/2001/WHO_MSD_MSB_01.6a.pdf, (accessed 6 June
2010).
Barkham, M., Evans, C., Margison, F., McGrath, G., Mellor-Clark, J., Milne, D., et al.
(1998). The rationale for developing and implementing core batteries in service
settings and psychotherapy outcome research. Journal of Mental Health, 7, 35–
47.
Barkham, M., Mullin, T., Leach, C., Stiles, W.B., & Lucock, M. (2007). Stability of the
CORE-OM and the BDI-I prior to therapy: Evidence from routine practice.
Psychology and Psychotherapy: Theory, Research and Practice, 80, 269–278.
doi:10.1348/147608306X148048
Barkley, R.A. (1997). Defiant children: A clinician’s manual for assessment and parent
training (2nd ed.). New York: The Guilford Press.
Barrett-Lennard, G. T. (1962). Dimensions of Therapist Response as Causal Factors in
Therapeutic Change. Psychological Monographs, 76 (43, Whole Number 562).

91
Bauer, S., Lambert, M. J., & Nielsen, S. L. (2004). Clinical significance methods: A
comparison of statistical techniques. Journal of Personality Assessment, 82, 60-
70. doi:10.1207/s15327752jpa8201_11
Beck, A. T., Steer, R. A., & Brown, B. K. (1996). Beck depression inventory manual
(2nd ed.). San Antonio, TX: Psychological Corporation.
Beckstead, D. J., Hatch, A. L., Lambert, M. J., Eggett, D. L., Goates, M. K., &
Vermeersch, D. A. (2003). Clinical significance of the Outcome Questionnaire
(OQ-45.2). The Behavior Analyst Today, 4, 79-90.
Bennett, D.S, Sullivan, M.W., & Lewis, M. (2006). Relations of parent report and
observation of parenting to maltreatment history. Child Maltreatment, 11, 63-75.
doi: 10.1177/1077559505283589
Bien, T.H., Miller, W.R., & Tonigan, J.S. (1993). Brief interventions for alcohol
problems: A review. Addiction, 88 (3), 315-335. doi: 10.1111/j.1360-
0443.1993.tb00820.x
Bishop, M.J., Bybee, T.S., Lambert, M.J., Burlingame, G.M., Wells, M.G., & Poppleton,
L.E. (2005). Accuracy of a rationally derived method for identifying treatment
failure in children and adolescents. Journal of Child and Family Studies, 14(2),
207-222. doi:10.1007/s10826-005-5049-1
Boots, W.R., Simons, D.J., Stothart, C. & Stutts, C. (2013). The pervasive problem with
placebos in psychology: Why active control groups are not sufficient to rule out
placebo effects. Perspectives on Psychological Science, 8, 445-454. doi::
10.1177/1745691613491271

92
Bordin, E. (1979). The generalizability of the psychoanalytic concept of the working
alliance. Psychotherapy: Theory, Research & Practice, 16, 252-260.
doi:10.1037/h0085885
Borle, S., Dholakia, U.M., Singh, S.S., & Westbrook, R.A., (2007) The impact of survey
participation on subsequent customer behavior: An empirical investigation.
Marketing Science, 26(5), 711-726. doi: 10.1287/mksc.1070.0268
Bromet, E.J., Dunn, L.O., Connell, M.M., Dew, M.A., Schulberg, H.C. (1986). Long-
term reliability of diagnosing lifetime major depression in a community sample.
Archives of General Psychiatry, 43(5), 435-440.
Brown, G.S., Burlingame, G.M., Lambert, M.J., Jones, E., & Vaccaro, J. (2001). Pushing
the quality envelope: A new outcomes management system. Psychiatric Services,
52, 925-934. doi:10.1176/appi.ps.52.7.925
Burlingame, G., Cox, J., Wells, A., & Lambert, M. (2003). Youth Outcome
Questionnaire: Updated psychometric properties. In M. Maruish (Ed.), The 2003
behavioral outcomes and guidelines source book. New York: Faulkner and Gray.
Burlingame, G.M., Mosier, J.I., Wells, M.G., Atkin, Q.G., Lambert, M.J., Whoolery, M.,
& Latkowski, M. (2001). Tracking the influence of mental health treatment: The
development of the Youth Outcome Quesitonnaire. Clinical Psychology and
Psychotherapy, 8, 361-379. doi:10.1002/cpp.315

93
Burlingame, G.M., Wells, M.G., Lambert, M.J., & Cox, J.C. (2004). Youth Outcome
Questionnaire (Y-OQ). In M. Maruish (Ed.), The use of psychological testing for
treatment planning and outcomes assessment: Volume 2: Instruments for children
and adolescents (3rd ed). (pp. 235-273). Mahwah, New Jersey: Lawrence
Erlbaum Associates Publishers.
Burlingame, G.M., Wells, M.G., Hoag, M., Hope, C., Nebeker, S., Konkel, K.,
McCollam, P., Peterson, G., Lambert, M.J., Latkowski, M., Ferre, R., &
Reisinger, C. (1996). Adminstration and scoring manual for the Y-
OQ.2.Setauket,NJ: American Professional Credentialing Services.
Burns, G.L. & Patterson, D.R. (2000). Factor structure of the Eyberg Child Behavior
Inventory: A parent rating scale of oppositional defiant behavior toward adults,
inattentive behavior, and conduct problem behavior. Journal of Clinical Child
Psychology, 29, 569-577.
Campbell, D.T. (1996). Unresolved issues in measurement validity: An autobiographical
overview. Psychological Assessment, 8 (4), 363-368. doi: 10.1037/1040-
3590.8.4.363
Carey,K.B., Carey, M.P., Maisto, S.A., & Henson, J.M. (2006). Brief motivational
interventions for heavy college drinkers: A randomized controlled trial. Journal of
Consulting and Clinical Psychology, 74(5), 943-954. doi: 10.1037/0022-
006X.74.5.943
Chang, G., Wilkins-Haug, L., Berman, S., & Goetz, M.A. (1999). Brief intervention for
alcohol use in pregnancy: A randomized trial. Addiction, 94(10), 1499-1508.
doi: 10.1046/j.1360-0443.1999.941014996.x

94
Chi, T. C., & Hinshaw, S. P. (2002). Mother–child relationships of children with ADHD:
The role of maternal depressive symptoms and depression-related distortions.
Journal of AbnormalChild Psychology, 30, 387–400.
Choquette, K.A., & Hasselbrock, M.N. (1987). Effects of retesting with the Beck and
Zung depressions scales in alcoholic. Alcohol and Alcoholism, 22, 277-283.
Cioffi, D., & Garner, R. (1998).The effect of response options on decisions and
subsequent behavior: Sometimes inaction is better. Personality and Social
Psychology Bulletin, 24(5), 463-472. doi: 10.1177/0146167298245002
Clifford, P.R. & Maisto, S.A. (2000). Subject reactivity effects and alcohol treatment
outcome research. Journal of Studies on Alcohol, 61, 787-793.
Clifford, P.R., Maisto, S.A., & Davis, C.M. (2007). Alcohol treatment research exposure
subject reactivity effects: Part I. Alcohol use and related consequences. Journal of
Studies on Alcohol and Drugs, 68, 519-528.
Clifford, P.R., Maisto, S.A., Franzke, L.H., Longabaugh, R., & Beattie, M.C. (2000).
Alcohol treatment research follow-up interviews and drinking behaviors. Journal
of Studies on Alcohol, 61(5), 736-743.
Cohen, J. (1988). Statistical power analysis for the behavioral sciences. (2nd ed.)
Hillsdale, NJ: Lawrence Earlbaum Associates.
Conners, C. (1990). Conners' Rating Scales manual. North Tonawanda, NY: Multi-
Health Systems.
Conners, C.K. (2008). Conners 3rd Edition. Multi-Health Systems, Inc.: North
Tonawanda, NY.

95
Connors, G.J., Tarbox, A.R., & Faillace, L.A. (1992). Achieving and maintaining gains
among problem drinkers: Process and outcome results. Behavior Therapy, 23(3),
449-474. doi:10.1016/S0005-7894(05)80169-8
Crowne, D.P. & Marlowe, D. (1960). A new scale of social desirability independent of
psychopathology. Journal of Consulting Psychology, 24, 349-354.
doi:10.1037/h0047358
Diamon, J.M., & Deane, F.P. (1990). Conners teacher's questionnaire: Effects and
implications of frequent administration. Journal of Clinical Child Psychology, 19
(3), 202-204. doi:10.1207/s15374424jccp1903_1
DiClemente, C.C., Carroll, K.M., Connors, G.J., & Kadden, R.M. (1994)Process
assessment in treatment matching research. Journal of Studies on Alcohol, 12,
156-162.
Durham, C.J., McGrath, L.D., Burlingame, G.M., Schaalje, G.B., Lambert, M.J., &
Davies, D.R. (2002). The effects of repeated administrations on self-report and
parent-report scales. Journal of Psychoeducational Assessment, 20, 240-257.
doi:10.1177/073428290202000302
Epstein, E.E., Drapkin, M.L., Yusko, D.A., Cook, S.M., McCrady, B.S. & Jensen, N.K.
(2005). Is alcohol assessment therapeutic? Pretreatment change in drinking among
alcohol-dependent women. Journal of Studies on Alcohol, 66, 369-378.
Erdfelder, E., Faul, F., & Buchner, A. (1996). GPOWER: A general power analysis
program. Behavior Research Methods, Instruments, & Computers, 28, 1-11.

96
Eyberg, S. M., & Pincus, D. (1999). Eyberg Child Behavior Inventory and Sutter-Eyberg
Student Behavior Inventory: Professional manual. Odessa, FL: Psychological
Assessment Resources.
Falk, B. (2010). Do drivers become less risk-prone after answering a questionnaire on
risky driving behaviour? Accident Analysis and Prevention, 42(1), 235-244. doi:
10.1016/j.aap.2009.08.003
Fenton, L.R., Cecero, J.J., Nich, C., Frankforter, T.L., & Carroll, K.M. (2001).
Perspective is everything: The predictive validity of six working alliance
instruments. The Journal of Psychotherapy Practice and Research, 10(4), 262-
268.
French, D.P. & Sutton, S. (2010). Reactivity of measurement in health psychology: How
much of a problem is it? What can be done about it? British Journal of Health
Psychology, 15, 453–468. doi:10.1348/135910710X492341
Gilbert, D.G., McClernon, F., Rabinovich, N.E., Plath, L.C., Jensen, R.A., & Meliska,
C.J. (1998). Effects of smoking abstinence on mood and craving in men:
Influences of negative-affect-related personality traits, habitual nicotine intake
and repeated measurements. Personality and Individual Differences, 25(3), 399-
423. doi: 10.1016/S0191-8869(98)00003-8
Gioia, G.A., Isquith, P.K., Guy, S.C., & Kenworthy, L. (2000).Behavior Rating Inventory
of Executive Function. Child Neuropsychology, 6(3), 235-238. doi:
10.1076/chin.6.3.235.3152

97
Godin, G., Sheeran, P., Conner, M., Delage, G., Germain, M., Belanger-Gravel, A., &
Naccache, H. (2008). Asking questions changes behavior: Mere measurement
effects on frequency of blood donation. Health Psychology, 27(2), 179–184.
doi:10.1037/0278-6133.27.2.179
Hatfield, D.R., Ogles, B.M. (2007). Why some clinicians use outcome measures and
others do not. Administration and Policy in Mental Health & Mental Health
Services Research, 34, 283–291. Doi: 10.1007/s10488-006-0110-y
Heishman, S.J, Saha, S., & Singleton, E.G. (2004). Imagery-induced tobacco craving:
Duration and lack of assessment reactivity bias. Psychology of Addictive
Behaviors, 18, 284-288. doi:10.1037/0893-164X.18.3.284
Henderson, A.S., Byrne, D.G., & Duncan-Jones, P. (1981) Neurosis and the Social
Environment. New York, NY: Academic Press.
Hesser, H., Weise, C., Rief, W., & Andersson, G. (2010). The effect of waiting: A meta-
analysis of wait-list control groups in trials for tinnitus distress. Journal of
Psychosomatic Research, 70, 378–384. doi:10.1016/j.jpsychores.2010.12.006
Hester, R.K., & Delaney, H.D. (1997). Behavioral self-control program for Windows:
Results of a controlled clinical trial. Journal of Consulting and Clinical
Psychology, 65(4), 686-693. doi: 10.1037/0022-006X.65.4.686
Horvath, A., & Greenberg, L. (1989). Development and validation of the Working
Alliance Inventory. Journal of Counseling Psychology, 36, 223–233.
doi:10.1037//0022-0167.36.2.223

98
Howard, G.S., & Dailey, P.R. (1979).Response-shift bias: A source of contamination of
self-report measures. Journal of Applied Psychology, 64 (2), 144-150. doi:
10.1037/0021-9010.64.2.144
Howard, K.I., Moras, K, Brill, P.L., Martinovich, Z., and Lutz, W. (1996). Evaluation of
Psychotherapy: Efficacy, effectiveness, and patient progress. American
Psychologist, 51 (10), 1059-1064. doi:10.1037/0003-066X.51.10.1059
Hufford, M.R., Shields, A.L., Shiffman, S., Paty, J., & Balabanis, M. (2002). Reactivity
to ecological momentary assessment: An example using undergraduate problem
drinkers. Psychology of Addictive Behaviors, 16(3), 205-211. doi: 10.1037/0893-
164X.16.3.205
Jacobson, N. S., & Truax, P. (1991). Clinical significance: A statistical approach to
defining meaningful change in psychotherapy research. Journal of Consulting and
Clinical Psychology,59, 12-19. doi:10.1037//0022-006X.59.1.12
Jorm, A.F., Duncan-Jones, P., & Scott, R. (1989). An analysis of the re-test artifact in
longitudinal studies of psychiatric symptoms and personality. Psychological
Medicine, 19, 487-493. doi: 10.1017/S0033291700012514
Kaminer, Y., Bruleson, J.A., & Burke, R.H. (2008). Can assessment reactivity predict
treatment outcome among adolescents with alcohol and other substance use
disorders? Substance Abuse,29(2), 63-69.
Karazsia, B.T., val Dulmen, M.H.M., & Wildman, B.G. (2008). Confirmatory factor
analysis of Arnold et al.’s Parenting Scale across race, age, and sex. Journal of
Child and Family Studies, 17, 500-516. Doi: 10.1007/s10826-007-9170-1

99
Kazdin, A. E. (2005). Evidence-based assessment for children and adolescents: Issues in
measurement development and clinical application. Journal of Clinical Child and
Adolescent Psychology, 34, 548–558. doi:10.1207/s15374424jccp3403_10
Knowles, E.S., Coker, M.C., Scott, R.A., Cook, D.A., and Neville, J.W.(1996).
Measurement-induced improvement in anxiety: Mean shifts with repeated
assessment. Journal of Personality and Social Psychology, 71(2), 352-363. doi:
10.1037/0022-3514.71.2.352
Korotitsch, W. J., & Nelson-Gray, R. O. (1999). An overview of self-monitoring research
in assessment and treatment. Psychological Assessment, 11(4), 415-425.
doi:10.1037//1040-3590.11.4.415
Kypri, K., Langley, J.D., Saunders, J.B., & Cashell-Smith, M.L. (2007). Assessment may
conceal therapeutic benefit: Findings from a randomized controlled trial for
hazardous drinking. Addiction, 102(1), 62-70. doi: 10.1111/j.1360-
0443.2006.01632.x
Lambert, M. (2007). Presidential address: What we have learned from a decade of
research aimed at improving psychotherapy outcome in routine care.
Psychotherapy Research, 17(1), 1-14. doi:10.1080/10503300601032506
Lambert, M. J., & Anderson, E. M. (1996). Assessment for time-limited psychotherapies.
Annual Review of Psychiatry, 15, 23- 47.
Lambert, M. J., Burlingame, G. M., Umphress, V. J., Hansen, N. B., Vermeersch, D.,
Clouse, G., & Yanchar, S. (1996). The reliability and validity of the Outcome
Questionnaire. ClinicalPsychology and Psychotherapy, 3, 106-116.
doi:10.1002/(SICI)1099-0879(199612)3:4<249::AID-CPP106>3.3.CO;2-J

100
Lambert, M.J., Hansen, N.B., Umphress, V., Lunnen, K., Okiishi, J., Burlingame, G., et
al. (1996). Administration and scoring manual for the Outcome Questionnaire
(OQ 45.2). Wilmington, DE: American Professional Credentialing Services.
Lambert, M. J., Whipple, J. L., Harmon, C., Shimokawa, K., Slade, K., & Christofferson,
C. (2004). Clinical support tools manual. Provo, UT: Department of Psychology,
Brigham Young University.
Lambert, M. J., Whipple, J. L., Hawkins, E. J., Vermeersch, D. A., Nielsen, S. L., &
Smart, D.W. (2003). Is it time for clinicians to routinely track patient outcome? A
meta-analysis. Clinical Psychology: Science and Practice, 10, 288-301.
doi:10.1093/clipsy.bpg025
Lemay, S., Bedard, M.A., Rouleau, I., &Tremblay, P.L.G. (2004). Practice effect and
test-retest reliability of attentional and executive tests in middle-aged to elderly
subjects. The Clinical Neuropsychologist, 18(2), 284-302. doi:
10.1080/13854040490501718
Loftus, E.F. (1975). Leading questions and the eyewitness report. Cognitive Psychology,
7(4), 560-572. doi: 10.1016/0010-0285(75)90023-7
Longwell, B., & Truax, P. (2005). The differential effects of weekly, monthly, and
bimonthly administrations of the Beck Depression Inventory-II: Psychometric
properties and clinical implications. Behavior Therapy, 36(3), 265-275. doi:
10.1016/S0005-7894(05)80075-9
Lunnen, K. M., & Ogles, B. M. (1998). A multiperspective, multivariable evaluation of
reliable change. Journal of Consulting and Clinical Psychology, 66, 400-410.
doi:10.1037//0022-006X.66.2.400

101
Machin, J.E., & Fitzsimons, G.J. (2005). Marketing by Mistake: The Unintended
Consequences of Consumer Research. In Kardes, F.R., Herr, P.M., Nantel, J.
(Eds.). Applying social cognition to consumer-focused strategy (pp. 81-95).
Mahwah, NJ: Lawrence Erlbaum Associates Publishers.
Maisto, S.A., Sobell, L.C., Sobell, M.B., & Sanders, B. (1985).Effects of outpatient
treatment for problem drinkers. The American Journal of Drug and Alcohol
Abuse, 11 (1-2), 131-149. doi: 10.3109/00952998509016855
Marsden, J., Stillwell, G., Barlow, H., Boys, A., Taylor, C., Hunt, N., & Farrell, M.
(2006). An evaluation of a brief motivational intervention among young ecstasy
and cocaine users: No effect on substance and alcohol use outcomes. Addiction,
101(7), 1014-1026. doi: 10.1111/j.1360-0443.2006.01290.x
Mash, E.J., & Hunsley, J. (2005). Evidence-based assessment of child and adolescent
disorders: Issues and challenges. Journal of Clinical Child and Adolescent
Psychology, 34 (3), 362-379. doi:10.1207/s15374424jccp3403_1
McCambridge, J. (2009). Commentary: Research assessments: Instruments of bias and
brief interventions of the future? Addiction, 104(8), 1311-1312. doi:
10.1111/j.1360-0443.2009.02684.x
McCambridge, J. & Day, M. (2008). Randomized controlled trial of the effects of
completing the Alcohol Use Disorders Identification Test questionnaire on self-
reported hazardous drinking. Addiction, 103, 241-248. doi:10.1111/j.1360-
0443.2007.02080.x

102
McCambridge, J., & Strang, J. (2005). Deterioration over time in effect of Motivational
Interviewing in reducing drug consumption and related risk among young people.
Addiction, 100(4), 470-478. doi: 10.1111/j.1360-0443.2005.01013.x
Merydith, S.P., Prout, H.T., & Blaha, J. (2003). Social desirability and behavior rating
scales: An exploratory study with the Child Behavior Checklist/4-18. Psychology
in the Schools, 40, 225-235. doi: 10.1002/pits.10077
Milich, R., Roberts, M.A., Loney, J., & Caputo, J. (1980). Differentiating practice effects
and statistical regression on the Conners Hyperkinesis Index. Journal of
Abnormal Child Psychology, 8(4), 549-552. doi: 10.1007/BF00916506
Moos, R.H. (2007). Commentary: Context and mechanisms of reactivity to assessment
and treatment. Addiction, 103, 249-250.
Munsinger, H. (1975) The adopted child's IQ: A critical review. Psychological Bulletin,
82(5), 623-659. doi: 10.1037/0033-2909.82.5.623
Ogles, B.M., Lambert, M.J., & Masters, K.S. (1996). Assessing outcome in clinical
practice. Needham Heights, MA: Allyn & Bacon.
Orlinsky, D. E., Ronnestad, M. H. & Willutzki, U. (2003). Fifty years of process outcome
research: Continuity and change. In M. J. Lambert (Ed.), Bergin and Garfield’s
handbook of psychotherapy and behavior change (5th ed., pp. 307-390). New
York: Wiley.
Ormel, J., Koeter, M.W.J., & van den Brink, W. (1989). Measuring change with the
General Health Questionnaire (GHQ): The problem of retest effects. Social
Psychiatry and Psychiatric Epidemiology, 24, 227- 232.
doi:10.1007/BF01788963

103
Patterson, G.R. & Forgatch, M.S. (1995). Predicting future clinical adjustment from
treatment outcome and process variables. Psychological Assessment, 7, 275-285.
doi:10.1037//1040-3590.7.3.275
Patterson, G.R., & Narrett, C.M. (1990). The development of a reliable and valid
treatment program for aggressive young children. International Journal of Mental
Health, 19(3), 19-26.
Pelham, W.E. Jr., & Fabiano, G.A. (2008). Evidence-based psychosocial treatments for
attention-deficit/hyperactivity disorder. Journal of Clinical Child & Adolescent
Psychology, 37(1), 184-214. doi:10.1080/15374410701818681
Posternak, M.A., & Miller, I. (2001). Untreated short-term course of major depression: a
meta-analysis of out-comes from studies using wait-list control groups. Journal of
Affective Disorders, 66, 139–146. doi:10.1016/S0165-0327(00)00304-9
Project MATCH Research Group. (1998). Matching alcoholism treatments to client
heterogeneity: Treatment main effects and matching effects on drinking during
treatment. Journal of Studies on Alcohol, 59, 631-639.
Reitman, D., Currier, R.O., Hupp, S.D.A., Rhode, P.C., Murphy, M.A., & O’Callaghan,
P.M. (2001). Psychometric characteristics of the Parenting Scale in a Head Start
population. Journal of Clinical Child Psychology,30(4), 514-524. doi:
10.1207/S15374424JCCP3004_08
Reynolds, C.R., & Kamphaus, R.W. (2004). Behavior assessment for children (2nd ed.).
Circle Pines, MN: AGS Publishing.

104
Roodman, A.A. (1996). A test of the effects of assessment and feedback on individuals
with panic attacks. Unpublished Masters Thesis, Virginia Polytechnic Institute
and State University, Blacksburg.
Rosenthal, R. (1994). Parametric measures of effect size. In H. Cooper & L. V. Hedges
(Eds.), The Handbook of Research Synthesis. New York, NY: Sage. pp. 239.
Runyan, J.D., Steenbergh, T.A., Bainbridge C., Daugherty, D.A., Oke L., Fry, B.N.
(2013). A Smartphone Ecological Momentary Assessment/Intervention ‘‘App’’
for Collecting Real-Time Data and Promoting Self-Awareness. PLoS ONE 8(8):
e71325. doi:10.1371/journal.pone.0071325
Shadish, W.R., Cook, T.D., & Campbell, D.T. (2002) Experimental and quasi-
experimental designs for generalized causal inference. Boston, MA: Houghton,
Mifflin and Company.
Sharpe, J.P., & Gilbert, D.G. (1998). Effects of repeated administration of the Beck
Depression Inventory and other measures of negative mood states. Personality
and Individual Differences, 24(4), 457-463. doi: 10.1016/S0191-8869(97)00193-1
Shimokawa, K., Lambert, M.J., & Smart, D.W. (2010). Enhancing treatment outcome of
patients at risk of treatment failure: Meta-analytic and mega-analytic review of a
psychotherapy quality assurance system. Journal of Consulting and Clinical
Psychology, 78 (3), 298–311. doi:10.1037/a0019247
Smith, S.R. (2007). Making sense of multiple informants in child and adolescent
psychopathology: A guide for clinicians. Journal of Psychoeducational
Assessment, 25(2), 139-149. doi:10.1177/0734282906296233

105
Sobell, M. B., Bogardis, J., Schuller, R., Leo, G. I., & Sobell, L. C. (1989). Is self-
monitoring of alcohol consumption reactive? Behavioral Assessment, 11, 447-
458.
Sprott, D.E., Spangenberg, E.R., Block, L.G., Fitzsimons, G.J., Morwitz, V.G., &
Williams, P. (2006). The question-behavior effect: What we know and where we
go from here. Social Influence, 1, 128-137. doi:10.1080/15534510600685409
Stephens, R.S., Roffman, R.A., & Curtin, L. (2000). Comparison of extended versus
brief treatments for marijuana use. Journal of Consulting and Clinical
Psychology, 68(5), 898-908. doi: 10.1037/0022-006X.68.5.898
Sutton, S., Bickler, G., Sancho-Aldridge, J., & Saidi, G. (1994). Prospective study of
predictors of attendance for breast screening in inner London. Journal of
Epidemiology and Community Health, 48(1), 65-73. doi: 10.1136/jech.48.1.65
Swift, J.K., Callahan, J.L., Herbert, G.L., & Heath, C.J. (2012). Naturalistic changes in
subjective distress outside of therapy. Journal of Clinical Psychology, 68(4), 421–
431. doi: 10.1002/jclp.20869
Teasdale, J.D., & Barnard, P.J. (1993). Affect, cognition, and change: Re-modelling
depressive thought. Hillsdale, NJ: Lawrence Erlbaum Associates.
Timko, C., Moos, R.H., Finney, J.W., Moos, B.S., & Kaplowitz, M.S. (1999).Long-term
treatment careers and outcomes of previously untreated alcoholics. Journal of
Studies on Alcohol, 60(4), 437-447.
Voas, R.B. (1956). Comparison of the Taylor Anxiety Scale administered separately and
within the MMPI. Psychological Reports, 2, 373-376. doi: 10.2466/PR0.2.7.373-
376

106
Vermeersch, D.A., Lambert, M.J., & Burlingame, G.M. (2000). Outcome Questionnaire:
Item sensitivity to change. Journal of Personality Assessment, 74, 242-261.
doi:10.1207/S15327752JPA7402_6
Walters, S.T., Vader, A.M., Harris, R., & Jouriles, E.N. (2009). Reactivity to alcohol
assessment measures: An experimental test. Addiction, 104, 1305–1310.
doi:10.1111/j.1360-0443.2009.02632.x
Wampold, B.E. & Imel, Z.E. (2015). The great psychotherapy debate: The evidence for
what makes psychotherapy work 2nd Edition. New York, NY: Routledge.
Warren, J.S., Nelson, P.L., Mondragon, S.A., Baldwin, S.A., & Burlingame, G.M.
(2010). Youth psychotherapy change trajectories and outcomes in usual care:
Community mental health versus managed care settings. Journal of Consulting
and Clinical Psychology,78 (2), 144-155. doi: 10.1037/a0018544
Weinberger, J. & Eig, A. (1999). Expectancies: The ignored common factor in
psychotherapy. In I. Kirsch (Ed), (1999). How expectancies shape experience (pp.
357-382). Washington, DC, US: American Psychological Association.
Willson, V.L., & Putnam, R.R. (1982). A meta-analysis of pretest sensitization effects in
experimental design. American Educational Research Journal, 19 (2), 249-258.
doi:10.2307/1162568
Windle, C. (1954). Test-retest effect on personality questionnaires. Educational and
Psychological Measurement, 14(4), 617-633. doi:10.1177/001316445401400404
Worden, B.L., McCrady, B.S., & Epstein, E.E. (2008). Assessment reactivity to follow-
up in a study of women’s treatment for alcohol dependence. Addicitve Behaviors,
33, 831-835. doi:10.1016/j.addbeh.2007.12.004

107
Young, C. (2006). What happens when people wait for therapy? Assessing the clinical
significance of the changes observed over the waiting period for clients referred to
a primary care psychology service. Primary Care Mental Health, 4, 113-119.

108
APPENDICES
Appendix A: Study Measures
Screening Questions
On a scale from 1to 10 with a “1” being “no problem or minimal problem” and a “10”
being a “serious or major problem, or a problem you are extremely worried about,”
Please rate the following on the 1 to 10 scale.
a. Academic Problems at School:_____
b. Behavioral Problems at School:_____
c. Academic Problem at Home (Homework):_____
d. Behavioral Problems at Home:_____
e. Social Relationship Problems at Home (i.e., making and keeping friends):_____
f. Social Relationship Problems at School (i.e., making and keeping friends):____
Please answer the following “True or False”
If someone from my child’s school had not asked or recommended that I get an
evaluation or therapy for my child, I would not have called __________________for help
TRUE or FALSE (circle one)

109
Background Information
Today’s Date:_______________
MM/DD/YR
Background Information
**Except for where indicated, items refer to you (NOT your child).**
Please circle/write one response per number item.
1. Your name:________________________
2. Age: _______
3. Ethnicity: African American American Indian Asian Caucasian
Hispanic
Other______________
4. Marital status: Single Married Separated Divorced Widowed
5. Highest Grade Completed:
6th-8th 9th 10th 11th 12th Some
College
Associate’s Degree Bachelor’s Degree Master’s Degree Doctorate
6. Employment status: Full-time Part-time Unemployed Retired
7. Does your child presently reside with you? YES NO
8. Are you presently being treated for an emotional or behavior problem? YES NO
9. Is your child presently being treated for an emotional or behavior problem? YES NO
Assessment Study
Office Use Only
ID#_________

110
Collateral Locator Form
As mentioned in the consent form for this study, we are asking all participants to
provide the name and telephone numbers of one adult (friend or relative, NOT teacher)
who has regular contact (lives with, or spends at least 15 hours per week) with your
child to also report about your child’s behaviors. This person will be contacted, in
confidence via telephone, once at the beginning of the assessment and once at the end of
the assessment to report on your child’s behaviors.
This person will only be told that you are participating in a study and we want to
interview them to report about your child’s behaviors at the beginning and end of the
study.
We will not give out any other information about you or your child.
The short questionnaire will take 5-10 minutes to complete.
________________________________________________________________
Please provide below the name and telephone numbers of one adult friend or relative that
you would be willing to have interviewed and who has regular contact (lives with or
spends at least 15 hours per week) with your child.
Full Name: ___________________ ________________ ________________
Last First Middle
Home Phone #: (______)___________________
Cell Phone #: (______)_____________________
Your relationship to the Collateral (circle one):
_ (1) Spouse/Common-law (4) Brother/Sister (7) Roommate
__ (2) Parent _(5) Grandparent (8) Employer
__ (3) Son/Daughter (6) Other Relative (9)Friend/Other

111
Daily Food List Instructions • Fill out the Daily Food List, to the best of your knowledge, regarding the foods that your child ate during the past week.
Represent your child’s eating habits during the past week by marking the foods your child ate during the past week as an “average” day of the past week.
In other words, please view your child’s eating habits of the past week and mark down those habits into a one-day picture of what your child’s eating habits were in the past week.
• The Daily Food List asks about some (but NOT all) of the foods your child eats. • The Daily Food List asks how many different times your child eats a food each day (NOT how many pieces or servings your child eats each time). • If you make a mistake, cross out the incorrect answer. Turn to Daily Food List

112

113
Parenting Scale
ID:________________ Today’s Date:_________________
Instructions:
At one time or another, all children misbehave or do things that could be harmful, that
are “wrong”, or that parents don’t like. Example include:
hitting someone whining not picking up toys
forgetting homework throwing food refusing to go to bed
having a tantrum lying wanting a cookie before
dinner
running into the street arguing back coming home late
Parents have many different ways or styles of dealing with these types of problems.
Below are items that describe some styles of parenting.
For each item, fill in the circle that best describes your style of parenting during the
past two months with the child indicated above.
SAMPLE ITEM:
At meal time…
I let my child decide 0---0--- ---0---0---0---0 I decide how much
how much to eat. my child eats.
1. When I’m upset or under stress…
I am picky and on my 0---0---0---0---0---0---0 I am no more
child’s back. picky than usual.
2. When my child misbehaves…
I usually get into a long 0---0---0---0---0---0---0 I don’t get into
argument with my child. an argument.
3. When my child misbehaves…
I raise my voice 0---0---0---0---0---0---0 I speak to my
or yell. child calmly.

114
4. When I want my child to stop doing something…
I firmly tell my 0---0---0---0---0---0---0 I coax or beg
child to stop. my child to stop.
5. After there’s been a problem with my child…
I often hold a grudge 0---0---0---0---0---0---0 Things get back
to normal quickly.
6. When my child does something I don’t like…
I do something about it 0---0---0---0---0---0---0 I often let it go.
every time it happens.
7. When there is a problem with my child…
Things build up and I do 0---0---0---0---0---0---0 Things don’t get
things I don’t mean to do. out of hand.
8. When my child doesn’t do what I ask…
I often let it go or end 0---0---0---0---0---0---0 I take some
up doing it myself. other action.
9. If saying “No” doesn’t work…
I take some other 0---0---0---0---0---0---0 I offer my child
kind of action. something nice
so he/she will
behave.
10. If my child gets upset when I say “No”…
I back down and 0---0---0---0---0---0---0 I stick to what I
give in to my child. said.

115
Working Alliance Inventory, Assessment Short Form
Instructions
On the following pages there are sentences that describe some of the different ways a person
might think or feel about his or her clinician. As you read the sentences mentally insert the
name of your clinician in place of _____________in the text.
Below each statement inside there is a seven point scale:
1 2 3 4 5 6 7
Never Rarely Occasionally Sometimes Often Very Often Always
If the statement describes the way you always feel (or think) circle the number 7; if it never
applies to you circle the number 1. Use the numbers in between to describe the variations
between these extremes.
This questionnaire is CONFIDENTIAL; neither your therapist nor the agency will see your
answers.
Work fast, your first impressions are the ones we would like to see. (PLEASE DON'T FORGET TO
RESPOND TO EVERY ITEM.)
Thank you for your cooperation.
1. _______________ and I agreed about the things I needed to do during the evaluation to help
improve my child’s situation.
1 2 3 4 5 6 7
Never Rarely Occasionally Sometimes Often Very Often Always
2. What I did during the evaluation gives me new ways of looking at my child’s problem.
1 2 3 4 5 6 7
Never Rarely Occasionally Sometimes Often Very Often Always
3. I believe _______________ likes me.
1 2 3 4 5 6 7
Never Rarely Occasionally Sometimes Often Very Often Always
4. _______________ did not understand what I was trying to accomplish during the evaluation.
1 2 3 4 5 6 7
Never Rarely Occasionally Sometimes Often Very Often Always

116
5. I am confident in _______________ 's ability to help my child.
1 2 3 4 5 6 7
Never Rarely Occasionally Sometimes Often Very Often Always
6. _______________ and I are working towards mutually agreed upon goals.
1 2 3 4 5 6 7
Never Rarely Occasionally Sometimes Often Very Often Always
7. I feel that _______________ appreciates me.
1 2 3 4 5 6 7
Never Rarely Occasionally Sometimes Often Very Often Always
8. We agreed on what is important for my child to work on.
1 2 3 4 5 6 7
Never Rarely Occasionally Sometimes Often Very Often Always
9. _______________ and I trust one another.
1 2 3 4 5 6 7
Never Rarely Occasionally Sometimes Often Very Often Always
10. _______________ and I have different ideas on what my child’s problems are.
1 2 3 4 5 6 7
Never Rarely Occasionally Sometimes Often Very Often Always
11. We have established a good understanding of the kind of changes that would be good for
my child.
1 2 3 4 5 6 7
Never Rarely Occasionally Sometimes Often Very Often Always
12. I believe the way we evaluated my child’s problem was correct.
1 2 3 4 5 6 7
Never Rarely Occasionally Sometimes Often Very Often Always

117
Client Satisfaction Questionnaire Please help us improve our program by answering some questions about the services you
have received.
We are interested in your honest opinion, whether they are positive or negative. Please
answer all of the questions. We also welcome your comments and suggestions.
Thank you very much, we really appreciate your help.
CIRCLE YOUR ANSWER
1. How would you rate the quality of service you received ?
4 3 2 1
Excellent Good Fair Poor
2. Did you get the kind of service you wanted ?
4 3 2 1
No, definitely not No, not really Yes, generally Yes, definitely
3. To what extent has our program met your needs ?
4 3 2 1
Almost all of my Most of my needs Only a few of my None of my needs
needs have been met have been met needs have been met have been met
4. If a friend were in need of similar help, would you recommend our program to him or
her ?
4 3 2 1
No, definitely not No, not really Yes, generally Yes, definitely
5. How satisfied are you with the amount of help you have received ?
4 3 2 1
Quite dissatisfied Indifferent or mildly Mostly satisfied Very satisfied
dissatisfied
Turn to page 2

118
6. Have the services you received helped you to deal more effectively with your
problems?
4 3 2 1
Yes, they helped a Yes, they helped No, they really didn’t No, they seemed to
great deal somewhat help make things worse
7. In an overall, general sense, how satisfied are you with the service you have received ?
4 3 2 1
Very satisfied Mostly satisfied Indifferent or mildly Quite dissatisfied
dissatisfied
8. If you were to seek help again, would you come back to our program ?
4 3 2 1
No, definitely No, I don’t think so Yes, I think so Yes, definitely
Any comments or suggestions?
________________________________________________________________________
________________________________________________________________________
________________________________________________________________________
________________________________________________________________________
________________________________________________________________________
________________________________________________________________________

119
General Study Questionnaire
For items 1-7 please circle one statement each. For item 8, please print your answer.
1. Since the assessment began, positive interactions with my child are:
A. considerably less common
B. somewhat less common
C. the same
D. somewhat more common
E. much more common
2. Since the assessment began, negative interactions with my child are:
A. considerably less common
B. somewhat less common
C. the same
D. somewhat more common
E. much more common
3. Regarding my techniques of discipline since the assessment began, I discipline:
A. the same way as before the assessment
B. using very little new techniques
C. using a few new techniques
D. using several new techniques
E. using very many new techniques
4. My awareness of my child’s positive behaviors since the beginning of the assessment
has:
A. considerably decreased
B. somewhat decreased
C. remained the same
D. somewhat increased
E. considerably increased
Turn to page 2

120
5. My awareness of my child’s problem behaviors since the beginning of the assessment
has:
A. considerably decreased
B. somewhat decreased
C. remained the same
D. somewhat increased
E. considerably increased
6. The major behavior problems that my child presented with before the start of the
assessment are at this time:
A. considerably worse
B. somewhat worse
C. the same
D. somewhat improved
E. greatly improved
7. My overall perception of my child since the beginning of the assessment has:
A. become considerably more negative
B. become somewhat more negative
C. remained the same
D. become somewhat more positive
E. become considerably more positive
8. In your view, the purpose of this study is:____________________________________
________________________________________________________________________
________________________________________________________________________
________________________________________________________________________
________________________________________________________________________
________________________________________________________________________
________________________________________________________________________

121
Personal Reaction Inventory
Listed below are a number of statements concerning personal attitudes and traits. Read
each item and decide whether the statement is true or false as it pertains to you
personally.
1. Before voting I thoroughly investigate the qualifications of all the candidates T F
2. I never hesitate to go out of my way to help someone in trouble T F
3. It is sometimes hard for me to go on with my work if I am not encouraged T F
4. I have never intensely disliked anyone T F
5. On occasion I have had doubts about my ability to succeed in life T F
6. I sometimes feel resentful when I don’t get my way T F
7. I am always careful about my manner of dress T F
8. My table manners at home are as good as when I eat out in a restaurant T F
9. If I could get into a movie without paying and be sure I was not seen
I would probably do it T F
10. On a few occasions I have given up doing something because I thought too little
of my ability T F
11. I like to gossip at times T F
12. There have been times when I felt like rebelling against people in authority even though
I knew they were right T F
13. No matter who I’m talking to, I’m always a good listener T F
14. I can remember “playing sick” to get out of something T F
15. There have been occasions when I took advantage of someone T F
16. I’m always willing to admit it when I make a mistake T F
17. I always try to practice what I preach T F
18. I don’t find it particularly difficult to get along with loud mouthed, obnoxious people T F
19. I sometimes try to get even rather than forgive and forget T F
20. When I don’t know something I don’t at all mind admitting it T F
21. I am always courteous, even to people who are disagreeable T F
22. At times I have really insisted on having things my own way T F
23. There have been occasions when I felt like smashing things T F
24. I would never think of letting someone else be punished for my wrong-doings T F
25. I never resent being asked to return a favor T F
26. I have never been irked when people expressed ideas very different from my own T F
27. I never make a long trip without checking the safety of my car T F
28. There have been times when I was quite jealous of the good fortune of others T F
29. I have almost never felt the urge to tell someone off T F
30. I am sometimes irritated by people who ask favors of me T F
31. I have never felt that I was punished without cause T F
32. I sometimes think when people have a misfortune they only got what they deserved T F
33. I have never deliberately said something that hurt someone’s feelings T F

122
Test-Taking Survey
Please circle the answer that best describes your experience taking these tests over the
past weeks. We are interested in how you really felt about taking the same test a number
of times. For example, did you get bored, did you not mind doing it, did you feel you
observed your child more carefully, etc. Please use the following scale:
N = Never R= Rarely S= Sometimes F= Frequently AA= Almost
Always
1 2 3 4 5
1. I carefully completed the test each time I took it N R S F AA
2. I got tired of taking the test and just marked the answers N R S F AA
3. I took time to think about my answers N R S F AA
4. I didn’t read the questions thoroughly before answering N R S F AA
5. I marked answers just to get done quicker N R S F AA
6. I didn’t mind re-taking the test N R S F AA
7. I got better at observing my child’s behavior by
taking the test more than once N R S F AA
8. I skimmed the questions instead of reading them through N R S F AA
9. I tried to answer each question like I had answered it before N R S F AA
10. Sometimes I got bored and lost interest in finishing it N R S F AA
During the assessment, have there been any significant events that have affected your
child and might have resulted in a change in his/her scores?
________________________________________________________________________
________________________________________________________________________
________________________________________________________________________

123
Appendix B: Attrition Analyses
Attrition Analyses
Never Entered Into Study Dropped From Study
Reason #of
Mothers
Reason # of
Mothers
Decided not to come in for
clinic assessment
12 Did not complete final
measures
4
Not interested in the study 11 Did not complete time-points
2-5
2
Researcher not able to
consent
3 Financial reasons
1
Wanted to decide about
study after 1st clinic
session/first research time
point
1 Time constraints 1
Did not sign consent forms
1 Did not complete clinic
assessment/lack of contact
1
Mother could not participate
twice (had two children at
clinic for assessments)
1 Consented but did not
complete any materials
1
Dad completed final packet
and missing many initial
measures
1
Disclosure that son is in
psychological treatment
(screening error)
1

124
Appendix C: Y-OQ Scores over Time (Experimental Group)
A repeated measures analysis of variance (RM-ANOVA) was conducted to test
the effect of time for the Y-OQ in the experimental group. Mauchly’s test indicated that
the sphericity assumption was violated, χ2 (9) = 25.09, p = .004. The Greenhouse-Geisser
corrected test was therefore used (ε = .54). Results, approaching significance, showed
that Y-OQ scores decreased over time, F (2.160) = 3.119, p = .067, partial η2 = .280.
Contrast tests revealed a cubic trend, F (1) = 8.674, p = .019, partial η2 = .520, suggesting
two inflection points in the Y-OQ scores. Post hoc tests, with no adjustments due to lack
of power, suggested significant differences between the second and third administration
(p = .04), second and fourth administration (p = .004), and third and fourth administration
(p = .013) (See Table C1 and Figure C1 on the right). Table C2 and Figure C1 (on the
left) show the total sample descriptive statistics, and plotted means.
Table C1
Descriptive Statistics for the Youth Outcome Questionnaire Across Time points,
Experimental Group, RM-ANOVA Sample
Time N M SD
T1 9 55.00 36.38
T2 9 62.67 36.27
T3 9 54.56 34.94
T4 9 44.00 30.47
T5 9 44.89 29.99
Note. Higher scores = more problems; Possible scores of -16 to 240
Table C2
Descriptive Statistics for the Youth Outcome Questionnaire Across Time points,
Experimental Group, Total Sample
Time N M SD Range
T1 17 56.29 40.92 12 - 133
T2 14 57.5 37.03 7 - 121
T3 14 54.21 37.53 6 - 119
T4 12 50.92 35.89 -4 - 110
T5 10 40.70 31.22 3 - 92
Note. Higher scores = more problems; Possible scores of -16 to 240

125
Figure C1 Experimental Group Change Over Time in Y-OQ Total, Raw Score Means,
Total Sample in Comparison to RM-ANOVA only Sample
Figure C2 Experimental Group, Individual Change Over Time in Y-OQ Total, Raw Score