the effects of outbound mergers and acquisitions (m&as) on
TRANSCRIPT
International Business Research; Vol. 14, No. 7; 2021
ISSN 1913-9004 E-ISSN 1913-9012
Published by Canadian Center of Science and Education
36
The Effects of Outbound Mergers and Acquisitions (M&As) on
Chinese Automobile Corporations‟ Performance: A Case Study of
Geely‟s Acquisition of Volvo
Ziming Meng1, & Xin Wang2
1 EDHEC Business School, Nice, France
2 Kyung Hee university, Suwon, South Korea
Correspondence: Ziming Meng, EDHEC Business School, Nice, France. E-mail: [email protected]
Received: May 24, 2021 Accepted: June 10, 2021 Online Published: June 16, 2021
doi:10.5539/ibr.v14n7p36 URL: https://doi.org/10.5539/ibr.v14n7p36
Abstract
Pursuing M&As is an important growth strategy for many companies. This study examines whether Geely has
succeeded in improving the acquirer‟s performance as expected over a long-time span. In particular, it: (i)
assesses the short-term and long-term post-acquisition firm performance respectively; and (ii) establishes a
post-acquisition performance evaluation framework for Chinese automobile companies‟ overseas M&As based
on their motivations. By investigating the influence of acquiring Volvo on Geely‟s performance as a case of
outbound M&A during the financial crisis, this research will serve as an example of evaluating M&As as a
mechanism for corporate growth in the automobile industry of China or other emerging economies.
Keywords: corporate growth, emerging economies, Geely, mergers and acquisitions, performance evaluation
1. Introduction
Pursuing mergers and acquisitions (M&As) is an important growth strategy for many companies. The volume of
global M&As after the 2008 financial crisis peaked in 2015 but experienced volatile decreases up to the present
(J.P. Morgan 2019). Surviving well from the global financial crisis, China has been playing an increasingly
active role in the global M&A market (Sun et al. 2012; Institute for Mergers, Acquisitions and Alliances 2019).
Notably, the success rate of Chinese outbound deals has not been satisfying so far. Chinese outbound M&As
seemed to be slightly silent after 2016, with the volume falling year over year (J.P. Morgan 2020). Additionally,
according to McKinsey & Company (2017), over the decade 2007-2017, about 60% of outward investments by
Chinese businesses created little or no value for acquirers. Unlike multinationals in the US and major European
countries, Chinese businesses are less experienced in M&A transactions, since experienced buyers usually create
value and outperform occasional ones by a wide margin (BCG 2019).
Nevertheless, the young Chinese automaker Zhejiang Geely Holding Group‟s acquiring 100% stake of Swedish
Volvo Cars from Ford for $1.8 billion in 2010 astonished the world instantly and was deemed to have created
win-win outcomes for both companies successfully in a few years after the deal. Geely acquired the whole chain
of Volvo, from research and development (R&D) to international supplier and marketing channels. Volvo also
reported a first-time profit within one year of the deal, after three consecutive years‟ losses in the charge of Ford
(Lai et al. 2013). Therefore, its strategic influence is quite remarkable among previous Chinese automotive
cross-border acquisitions, such as Shanghai Automobile Industrial Corporation (SAIC) - Shuanglong (South
Korea), SAIC/Nanjing Automobile Corporation - MG Rover (UK), and Beijing Automotive Industry
Corporation - Saab (Sweden) (Huang 2009; Collinson 2013, Guo et al. 2017).
Given that it has been a whole decade since 2010 and most prior studies (Ma and Wu 2012; Lai et al. 2013; Ren
2013) were focused around two or three years after the deal, this study aims to fill in this gap by tracking the
performance of Geely after the acquisition. The aim is to examine whether Geely has succeeded in improving the
acquirer‟s performance as expected over a long-time span. In particular, this study aims to: (i) assess the
short-term and long-term post-acquisition firm performance respectively; and (ii) establish a post-acquisition
performance evaluation framework for Chinese automobile companies‟ overseas M&As based on their
motivations.

http://ibr.ccsenet.org International Business Research Vol. 14, No. 7; 2021
37
To investigate the acquisition‟s influence on Geely‟s firm performance using the multidimensional evaluation
framework, we have collected secondary data from three sources: annual reports, financial databases such as
Bloomberg, and government websites. We found that the shareholder value decreased within the short term of
the acquisition announcement, as the stock market did not respond positively in this stage. In the longer term, the
acquisition of Volvo affected the profitability of Geely negatively in the first five years, but the situation reversed
in recent years up to 2018.
We also found that the efficiency performance of Geely was susceptible to the vehicle demand apart from the
pure managerial efficiency, and thus the acquisition‟s impact on it was not quite obvious. Geely managed well its
long-term solvency after the acquisition despite taking over all of Volvo‟s debts through the acquisition. The
innovative and internationalization performance of Geely was boosted significantly by acquiring Volvo, but the
international presence weakened gradually in recent years. By investigating the influence of acquiring Volvo on
Geely‟s performance as a case of outbound M&A during the financial crisis, this research will serve as an
example of evaluating M&As as a mechanism for corporate growth in the automobile industry of China or other
emerging economies.
2. Overview of Zhejiang Geely Holding Group
2.1 China’s Automobile Industry
China‟s automobile industry was launched in the early 1950s, falling behind the world‟s car industry for over
half a century. Under a planned economy, the central government determined the pattern of industrial
development in China. Based on the production model of transplants from the former Soviet Union, three large
state-owned enterprises (SOEs) were founded: First Auto Works (FAW), Dongfeng Motors (DFM), and SAIC
(Balcet et al. 2017).
The development of the passenger car segment took place mainly after 1978 when China shifted towards a
market economy through Chinese economic reform (Chu 2011). This transitional stage was featured by
increasing foreign direct investments in China. Supported by the Chinese government, nearly all top 10 world
automakers established joint ventures (such as SAIC Volkswagen and Changan Ford) with local SOEs.
Joining the World Trade Organization (WTO) in 2001 marked the third stage of China‟s automotive industry.
Before this, private companies were not allowed to produce vehicles in China. It was during this period that
Chinese automakers began to progressively catch up at an early stage of globalization (Balcet et al. 2017). In
2009, China overtook the US as the world‟s largest car market (Alon and Fetscherin 2011).
2.2 History of Geely
Geely was founded in 1986 by Li Shufu in Zhejiang Province, China, initially manufacturing refrigerator parts
and motorcycles. To bring all Geely businesses into one group, Geely Group was established in 1996 and entered
the automotive industry by setting up Geely Automobile Holdings Limited (Geely Auto) in 1997.
There have been three eras in the history of Geely. From 1997, Geely‟s vision in its 1.0 era was “producing cars
that ordinary people can afford”. In this stage, Geely started by producing low-end cars through reverse
engineering, i.e. the process of imitating a product by disassembling its components and parts, analysing and
reproducing them (Balcet et al. 2017), leading to the low cost and affordability of Geely cars. Geely Auto was
granted a licence to produce vehicles in 2001 on the eve of China‟s entry into the WTO, becoming the first
private automobile manufacturer in China.
As early as 2002, only one year after Geely being an official automaker, Li Shufu revealed his ambition by
requesting his team to prepare to buy one of the international carmakers. In 2003, Zhejiang Geely Holding Group
(Geely Holding) was established, with all of Geely‟s automotive businesses placed under it. Meanwhile, driven
by fierce competition in the Chinese domestic market, Geely debuted in the export market as its first step in
overseas expansion.
In 2005, Geely Auto was listed on the Hong Kong Stock Exchange. In 2006, Geely kicked off its first
asset-seeking acquisition of a 19.97% stake in Manganese Bronze Holdings and established a joint venture to
produce the iconic London taxi in Shanghai. In 2007, Geely announced its entry into its 2.0 era with a major
strategic transformation from price to technology and performance competitive advantages, to narrow its gap
with major automobile multinational corporations in terms of technology and product branding. Later in this year,
Geely also announced its “Go Global” Globalization Strategy with a promise to make the “safest, eco-friendliest,
most energy-efficient cars that can be driven all over the world.”
In 2009 Geely acquired DSI, the world‟s second-largest maker of automatic transmissions. In 2010, Geely

http://ibr.ccsenet.org International Business Research Vol. 14, No. 7; 2021
38
completely acquired Volvo from Ford, becoming the Chinese first multinational automotive group. After three
consecutive years‟ substantial losses, Volvo finally turned a profit in 2010 (Lai et al. 2013). Thanks to this deal,
Geely Holding entered the Fortune 500 list in 2012 for the first time. In 2013, Geely completed the 100%
acquisition of Manganese Bronze Holdings and its subsidiary London Taxi International and established China
Euro Vehicle Technology (CEVT) R&D centre jointly with Volvo.
Geely announced its entry into its 3.0 era in 2014 with a new brand mission and value proposition focusing on
“Making Refined Cars for Everyone.” It also opened up a new strategy development pathway of new energy
commercial vehicles in 2015 and announced the Blue Geely Initiative promising that 90% of its vehicles sold by
2020 would be using either hybrid or pure electric powertrains. In 2017, Geely bought a 49.9% stake in
Malaysian automaker Proton, 51% control of luxury sports car brand Lotus, and Terrafugia Inc, a US flying-car
developer.
In 2018, the ambitious company also acquired a 9.7% share of Daimler AG in pursuit of further partnership,
becoming the single largest shareholder of Daimler AG. As of 2019, Geely ranked in 4th place by sales volume
among the top 10 passenger vehicle manufacturers in China (see Figure 1). Its share of Chinese total export of
passenger vehicles also increased from 3.7% in 2018 to 8.0% in 2019. In February 2020, Geely announced
preliminary discussions with Volvo Cars AB, previously partially acquired in 2017, regarding a possible
combination of the businesses of the two corporations into a strong global group (Geely Auto 2020; Zhejiang
Geely Holding Group 2020).
Figure 1. Top 10 passenger carmakers by sales volume in China, 2019 (‟000 cars)
Source. China Association of Automobile Manufacturers (2020)
3. Relevant Literature
3.1 Waves and Types of M&As
Back in the 18th century, M&As originated in the US and started one century later in Europe (Focarelli et al.,
2002). Unlike in the US and Europe, few M&A related pieces of research had been done before the last three
decades in developing countries such as China, India, and Malaysia (Malik et al. 2014; Lebedev et al. 2015). In
the literature (Lipton 2006; Roberts et al. 2010; Fuad and Gaur 2019), global M&As have been divided into five
waves based on their types.
The first wave (approximately 1897-1903) predominantly involved horizontal acquisitions in the same sectors.
Due to the completion of the national railroad system, the US companies were able to evolve into large
integrated firms by virtue of the new national product market and prosperous stock exchanges (Banerjee and
Eckard 1998).
With the widespread availability of bank loans and automobiles accelerating the integration, the second wave
(approximately 1918-1929) was characterized by the significant growth of vertical mergers forward or
backwards along the supply chains. The third wave (approximately 1955-1970) saw the large conglomerates
seeking acquisitions of unrelated companies in unrelated industries.
Generally referred to as the mega-merger wave, the fourth wave (approximately 1980-1989) experienced an
increase in hostile takeovers and corporate raiding by large companies. The fifth wave (approximately 1994 to
present) was characterized by expanding cross-border transactions, fueled by economic globalization and
2046 2002 1600
1362 1277 1242 911 815 800 771
0
500
1000
1500
2000
2500

http://ibr.ccsenet.org International Business Research Vol. 14, No. 7; 2021
39
emerging technologies. It was during this period that Chinese automotive corporations‟ outbound M&As sprang
up (Ma and Wu 2012).
3.2 Theories in Motivations of M&A
The literature elaborates on different rationales concerning motivations for M&As, including Transaction Cost
Theory, Market Power theory, and Synergy theory. The study of Coase (1937) shows that lower transaction costs
are regarded as the main M&A objective according to the Transaction Cost theory. The Market Power theory
(Comanor 1967; Bessler and Murtagh 2002; Ongena and Penas 2009) stresses reducing competitors and
achieving the market monopoly by horizontal and vertical M&A.
According to the Synergy theory, acquiring companies aim to optimize resource allocation on a global scale and
improve the efficiency of both parties in three aspects: managerial, operational, and financial synergy (Trautwein
1990). Although the Synergy theory fits in most M&A cases, cross-border M&As springing up after the 2008
global financial crisis in developed countries by acquirers from emerging economies showed some unique
motivations from those in previous M&A waves (Du et al. 2016).
Based on previous literature, market-seeking, strategic assets, and internationalization are the three main motives
for Geely, typically in emerging market countries. Not driven by monopoly status, Chinese automobile
companies are forced to expand the overseas market by harsh domestic competition. They also view M&A as a
good way of avoiding trade barriers and rapidly entering the host countries for production and sales activities
(Deng 2009).
Besides, the Chinese domestic market is the major goal of them, as China overtook the US to become the world‟s
biggest auto market in 2009 (Alon and Fetscherin 2011). Since most competition in the Chinese auto market
came from leading multinationals such as Audi, Mercedes-Benz, and BMW, Geely was keen to improve its
competitive position and enter the domestic luxury car market by virtue of the Volvo brand.
In the automobile industry, strategic assets including intellectual property, brands, sales channels, and
technologies (Deng 2009; Su and Liu 2013) are critical to the growth of firms. An important motive of acquiring
Volvo is to obtain strategic assets including technology innovations, managerial capacity, human capital, and
brand names (Yakob et al. 2018). Volvo‟s integrating safe and high technology into environmentally friendly cars
fitted Geely‟s mission of producing the safest, most environmentally friendly, and most energy-efficient vehicles
(Alon and Fetscherin 2011).
Another interesting motive of investing in developed countries by emerging economies is corporate
internationalization (Sun et al. 2012). As part of China‟s “Go Global” strategy, Chinese automobile companies
were driven to invest overseas to improve their international presence and competitive edge (Deng 2004; Du et al.
2016). Chinese government created incentives to accelerate consolidation in the vehicle industry and to support
at least one Chinese vehicle manufacturer in becoming one of the global top ten automakers (Rakita and
Markovic 2014). By acquiring the Volvo brand, Geely could save many years to internationalize itself (Chen and
Liu 2011).
3.3 M&As and Firm Performance
The measures of M&As‟ effects on firm performance have varied in terms of short and long term, financial and
non-financial, objective and subjective metrics. They include the event study, accounting-based measures, and
management subjective assessments.
3.3.1 Event Study
A traditional study into the impact on the acquiring firm performance is the event study, first proposed by Fama
et al. (1969). It assessed the outcomes of M&A by computing the daily abnormal returns caused by the
unexpected event, assuming that stock prices react very quickly to new information if the market is efficient.
Fama et al. examined the impacts of stock splits on share prices and provided the framework for future event
studies and tests of semi-strong market efficiency.
Despite being the most widely used tool for studying M&As‟ effect, the event study has several limitations.
Firstly, Sitthipongpanich (2011) concluded that in the circumstance of market inefficiency, the stock prices may
not fully or immediately reflect all information. Secondly, unforeseen events could have a co-effect on the stock
returns and thus abnormal returns are not entirely the direct market response to a specific event of interest.
Thirdly, changes in investors‟ expectations reflected by stock prices observed in the event study may be biased
due to subjective behavioural elements (Focarelli et al. 2002). Lastly, this method is proved to mainly work for
the short-run stock price performance.

http://ibr.ccsenet.org International Business Research Vol. 14, No. 7; 2021
40
Having reviewed 87 research papers on M&A performance from top Management and Finance Journals, Zollo
and Degenhard (2007) concluded that 41% used the short-term event study method, while only 16% used the
long-term event study, as the stock value change is only significant over a short period around the M&A
announcement date.
With the limitations of the event study, King et al. (2004) applied meta-analytic techniques to empirically
evaluate the influence of the most commonly researched antecedent variables on M&A performance. The authors
claimed that additional long-term post-acquisition performance researches were needed in addition to the event
study to cast light on other dimensions of firm performance.
3.3.2 Accounting-based Measures
Another popular method is accounting-based measures, especially in M&A researches in emerging market
economies (Krishnakumar and Sethi 2012). It evaluates the long-term organizational financial performance by
comparing accounting data and ratios calculated from financial statements.
Major debates are surrounding the usefulness of accounting research on M&A performance. Stanton (1987)
suspected the validity of accounting information as it is easily manipulated with accounting policies and earnings
management. Sitthipongpanich (2011) argued that inaccuracies in financial statements might gain an inaccurate
assessment of firm performance. Another difficulty lies in the combination of the parent and subsidiary
companies‟ financial performance. In some cases, the target ceases to exist, while in other cases becomes a
subsidiary of the acquirer. It is also uncertain whether the holding company is listed by itself or by a
representative subsidiary within the group. This will increase the difficulty of evaluating the synergy effect of the
group as a whole and comparing deals in the same industry.
Despite these limitations, many academics still adopt accounting information to assess the operational
performance affected by takeovers. The figures presented in financial statements are usually deemed to be true
and fair, especially for listed companies that are audited regularly. Tuch and O'Sullivan (2007) concluded the
rationale of this method: for takeovers seeking growth instead of value, the final aim of earning a higher return
on capital and any benefits arising from acquisitions will end in appearing in the accounting records.
The financial performance can be normally subdivided into profitability, efficiency and solvency. However,
researchers have different preferences for their chosen indicators. Meeks (1977) found ROA is the best among
these ratios to evaluate impacts of M&A, comparing profit margin, return on equity and return on assets (ROA).
In the study of Barber and Lyon (1996), operating cash flows is regarded to be optimal in assessing firm
performance after significant events including acquisitions, as earnings are easily manipulated.
In terms of the evaluation of Geely‟s post-acquisition performance, previous researchers (Lai et al. 2013; Ren
2013; Gao 2015; Feng and Liu 2016; Fan et al. 2018) dominantly used accounting-based measures such as
profitability, solvency and operating capacity to assess the acquirer‟s financial situation, but few of them once
used the event study to statistically examine the impact on the value of the firm.
3.3.3 Management Subjective Assessments
The management subjective assessments rate the extent to which M&As are able to realize business stakeholders‟
initial objectives several years after completing the transactions (Harvey 2015). Their preliminary objectives are
described and quantified by financial and non-financial indicators. For Chinese outbound investments in
developed countries, the acquirers normally have ambitions for operational expansion, brand image
improvement, international brand awareness, managerial synergy, technological innovation capacity, and
diversity of professionals (Shaker 2010; Alon and Fetscherin 2011; Chen and Liu 2011).
These non-financial purposes should also be comprehensively reflected by the indicators in the evaluation
framework of the M&A success and the acquiring firms‟ performance. As there is hardly a consensus
surrounding the definition and dimensions of firm performance, the performance measurement model is
inevitably subjective (Santos and Brito 2012), especially in terms of non-financial measures. Namely, the
management subjective measures might not reflect all key dimensions of post-acquisition performance or be
entirely used in other cases with different M&A objectives.
Traditional firm performance measurement systems cannot be entirely employed for post-acquisition
performance evaluation. The most popular among them is the balanced scorecard (Kaplan and Norton 1992)
which emphasizes a balance between both financial and non-financial measures (including customer satisfaction,
internal processes, and the organization‟s innovation and improvement activities) to achieve strategic alignment.
It acted as a catalyst for further research on developing performance measurement systems (Bourne et al. 2000;
Hudson et al. 2001; Santos and Brito 2012).

http://ibr.ccsenet.org International Business Research Vol. 14, No. 7; 2021
41
Neely et al. (1995) defined firm performance as a function of the efficiency and effectiveness of actions a
business undertakes. According to this, they surveyed small and medium-sized manufacturing businesses in the
UK and pointed out four categories of firm performance, i.e. quality, time, cost and flexibility, and their
dimensions. However, individual performance measurement system designers tend to focus on different aspects
of performance and the collection of dimensions.
Santos and Brito (2012) enriched the measurement model with seven financial and strategic indicators, including
profitability, growth, market value, customers‟ satisfaction, employees‟ satisfaction, environmental performance,
and social performance. The indicators of performance measurement system often vary with researchers.
Although previous evaluation systems cannot be directly applied to the case in this study, their coverage of
indicators is broad and inspiring for the design of M&A performance evaluation frameworks.
Among performance analyses of the Geely-Volvo case, Fan et al. (2018) overcame the limitation of
predominantly using accounting-based measures by previous literature (Ren 2013; Gao 2015; Feng and Liu 2016)
and established a two-tier evaluation framework to investigate Geely‟s firm performance from 2009 to 2016 in
four aspects of acquisition objectives, including profitability, management efficiency, technological innovation
and internationalization. They concluded that acquiring Volvo had significantly strengthened Geely‟s innovation
capability but insignificantly improved profitability, efficiency and international presence. This research made
important progress in incorporating subjective non-financial indicators but neglected the solvency of financial
performance and might have missed more obvious performance trends in a longer period (Ren 2013).
In summary, Chinese automobile companies‟ outbound investments showed three main motives of
market-seeking, strategic assets and internationalization. Surrounding the literature debates about measures of
post-acquisition performance, a vast majority of researchers used the event study and a portfolio of accounting
indicators. Some of them also included specialized non-financial indicators to measure the extent to which
M&As had realized the acquirer management‟s preliminary objectives.
In the case of Geely, whilst it has been ten years since the announcement of Geely‟s acquisition of Volvo, there
exist few studies tracing this event over a decade. Most performance analyzes were concentrated around two or
three years after the acquisition. Ren (2013) suggested future research should be based on a long-time horizon to
observe the case‟s long-term influence. Besides, many researches on the Geely-Volvo case did not use the
traditional event study or introduce multidimensional non-financial indicators to evaluate the post-acquisition
performance. Therefore, we will try to address these limitations by developing an evaluation framework
incorporating the event study, selective financial and non-financial indicators to reflect the influence on the
acquirer‟s short- and long-term performance in line with Geely‟s specific acquisition motives. To achieve this
aim, our study sought to answer the following research questions:
1) How did the short-term shareholder value change around the acquisition announcement?
2) What was the long-term financial performance of the deal?
3) Did the long-term non-financial performance realize the acquisition motivations?
This case is expected to set an example of M&As in economic recession and provide experience for Chinese
automobile businesses that aim to conduct cross-border M&A and accelerate global expansion in the future.
4. Method
4.1 Research Strategy
We have selected case study analysis as our research strategy. According to Yin (2018), a case study is an
in-depth inquiry into a topic or phenomenon within its real-life setting. It has three advantages over other
research strategies in achieving our research objectives and answering the research questions. Firstly, case study
research is conducted within a certain real-life context, especially when the boundaries between phenomenon
and context are not always apparent. Since performances of different M&A cases are susceptible to their specific
participants and circumstances, understanding the context is fundamental to analyze in M&A researches.
Secondly, interactions between a phenomenon and its context are best understood through in-depth case studies
(Dubois and Gadde 2002), which allow a mixture of research methods, both qualitatively and quantitatively, to
explore and interpret the effects of the situation and implications for action. Thirdly, a case study has the capacity
of generating insights into a critical contemporary or historical event through in-depth and intensive research in
its real-life settings (Paterson et al. 2016; Saunders et al. 2019).
The case of Geely is deemed to be a typical win-win transaction in the history of Chinese outbound M&As and
global economic crises, and the strengths of the case study in answering “how” questions can provide an

http://ibr.ccsenet.org International Business Research Vol. 14, No. 7; 2021
42
in-depth understanding of the phenomena (Yin 2018). The conclusions to this case will be educational for future
emerging economies‟ outbound investments in the automotive industry, especially during the ongoing global
economic recession. In addition, as the effects of M&As on acquirers‟ firm performance are attributable to
interactions of a number of variables, the case study should be used focusing on exploration and description with
no single cause-effect link (WritePass 2017).
In the literature review section, we have reviewed three main post-acquisition performance measures and
identified the gaps of evaluation methods in prior researches on the Geely-Volvo case. To address these gaps and
achieve the first research objective, we will design a multidimensional performance evaluation framework
consisting of the event study, accounting-based and management subjective assessment methods, based on a
longitudinal time horizon.
4.2 Data Collection and Analysis
To answer our first research question (i.e. “How did the short-term shareholder value change around the
acquisition announcement?”), we conducted the event study which requires a variety of data including the
acquirer‟s daily stock prices around the announcement date, historical daily stock market indices and short-term
government bond yield, to identify the event‟s direct effect on the stock market and analyze the deviation of
shareholders‟ actual return from their expected normal return.
The data are secondary and were collected from major financial databases and government website (e.g.
Bloomberg and U.S. Department of the Treasury). Bloomberg terminals available at Coventry University
Business School‟s Trading Floor were used to provide reliable information including historical daily stock
market indices and corporate stock prices (Coventry University 2020). As Geely Holding itself was not listed, we
collected the daily stock prices of its listed subsidiary Geely Auto instead to reflect the stock market‟s
expectation of the acquisition. The analysis of short-term stock price changes will be conducted using predefined
Excel spreadsheet functions. In the event study, FTSE 100 index was selected to estimate the market return, and
the 90-day US Treasury Bill rates were collected from the U.S. Department of the Treasury (2020) website to
estimate the contemporary daily risk-free interest rate.
The event study is based on the market efficiency hypothesis that share prices react to new information in a
timely and unbiased manner, representing the expected present value of future cash flows to shareholders (Tuch
and O'Sullivan 2007). Usually, the announcement date is set as the event date; the normal returns are estimated
by the Capital Asset Pricing Model (CAPM):
titftmiitfti rrrr .,,,. )( (1)
Where,
ri,t = the return to stock i at time t
rf,t = risk-free rate at time t (i.e. short-term government bond yield)
rm,t = the return to the market (e.g. FSTE 100) at time t
αi = intercept term
βi = sensitivity of the return to stock i to market returns
εi,t = zero mean disturbance term
A 120-day estimation period is chosen to calculate the expected returns, removing the effects before the
announcement date. Afterwards, the abnormal return (AR), the difference between actual return and expected
return estimated by the CAPM during the event window, is obtained as follows:
)]([)( ,,,, tftmiitftii rrrrAR (2)
The cumulative abnormal return (CAR) is the sum of daily ARs during the event window, which is calculated by
the following formula:
n
ttii ARCAR
1, (3)
Where,
n = the number of days within the event window
The M&A effects will be ultimately measured by the deviation of AR from zero through the t-test and CAR. A
positive deviation implies the M&A has a positive impact on corporate performance, while a negative deviation
suggests the market‟s displeasure with the acquisition (Hitt et al. 1998; Bruner 2002).

http://ibr.ccsenet.org International Business Research Vol. 14, No. 7; 2021
43
To answer the second research question (i.e. “What was the long-term financial performance of the deal?”), we
collected accounting data from the 2008-2019 annual reports of Geely Auto. The time horizon constitutes 2 years
before and 9 years after the transaction to generate a comparison between the pre-acquisition and ex-post
performance. The starting point 2008 was selected because it is the next year of Geely‟s announcing its entry into
its 2.0 era with an increased focus on technology and quality, and its “Go Global” Globalization Strategy (Geely
Auto 2020).
2008 is also a milestone year because on 1 July 2008 Geely Holding acquired the additional interests in its five
major operating associates, allowing it to fully consolidate their financial results into the group‟s consolidated
financial statements onwards. Consequently, we have excluded the distracting influence of other critical events
in the history of Geely, such as going public in 2005 and establishing a joint venture with Manganese Bronze
Holdings in 2006. We have also started from 2008 to ensure the year-on-year comparability. As Geely has always
maintained the managerial autonomy of Volvo and did not plan a full merge until February 2020 (Zhejiang Geely
Holding Group 2020), 2019 should be a proper end in our research into the current stage of Geely-Volvo
acquisition performance.
Accounting-based measures were used to evaluate the long-term financial performance from three aspects, i.e.
profitability, efficiency and solvency in accordance with the literature. Accounting-based measures are credible
because financial statements are audited and widely used by investors for judging corporate performance (Bruner
2002). They reflect the real M&A impact on operating performance net of capital market inefficiency and
mispricing bias (Krishnakumar and Sethi 2012). The analysis of accounting-based indicators will be basically
through horizontal analysis method showing data changes over a longitudinal time horizon. The changing trends
of these indicators will be visualized through charts and tables. Several accounting indicators (e.g. gross profit
margin, operating margin, debt ratio) are calculated with the vertical analysis method, where line items on the
income statement and balance sheet are expressed as a fraction of a base figure, normally total revenue or total
assets, to compare companies of different sizes or performances of a single company over time (Jagels 2006;
Ungureanu et al. 2013).
To answer the third research question (i.e. “Did the long-term non-financial performance realize the acquisition
motivations?”), we collected non-financial data (e.g. annual transnationality indices) from the “Chinese Top 100
Transnational Corporations and Transnationality Indices” report. The report has been issued by China Enterprise
Confederation and China Enterprise Directors Association for nine consecutive years. The Chinese top 100
transnational corporations are selected from all China headquartered non-financial enterprises registered and
operated in more than one country, ranked by the scale of foreign assets.
Since the performance evaluation framework should be designed based on the motivations of the acquirer, there
should be subjective indicators selected specifically for this case to assess the extent to which the performance
outcome has realized the management expectations. Therefore, we will introduce R&D intensity and
Transnationality Index (TNI) into the evaluation framework (see Table 1).
Table 1. Indicators of the evaluation performance framework
Dimensions Indicators
Financial performance
Stock price (short-term) CAR
Profitability
ROA
Gross profit margin
Operating margin
Earnings per share (EPS)
Efficiency
Asset turnover
Inventory turnover
Receivables turnover
Solvency
Current ratio
Quick ratio
Debt ratio
Non-financial performance
Innovative performance R&D intensity
Brand internationalization TNI
All ethical approvals have been obtained before conducting this research. With no primary data involved, the
ethical considerations of our research have been focused on protecting research data from unauthorized access
and unwanted loss, through appropriate data storage and data security strategies. To avoid the risk of storage on

http://ibr.ccsenet.org International Business Research Vol. 14, No. 7; 2021
44
external devices or online shared drives (Saunders et al. 2019), we have stored all our data through computer
hard drives. According to UK Data Archive (2011), threats to digital data security may come from physical,
network, and computer systems and files aspects. We have several corresponding strategies in place, including
firewall, password protection of computer systems, controlled access to data files, and back-ups of important
data on different media and locations.
5. Findings and Discussions
5.1 Short-term Shareholder Value Performance
In answering the first research question “How did the short-term shareholder value change around the
acquisition announcement?”, the event study was selected to reflect the market’s expectations for the M&A
success and the growth of shareholder wealth related to the acquisition (Perepeczo 2007). Normally, the M&A
announcement day, 28 March 2010 (Geely Auto 2010), is set as the event date. However, since the stock was not
traded on that day, the next trading day 29 March is set as the event date (i.e. time 0 in Table 3) instead. The
event window is determined to be 20 before and after the event date. A 120-day estimation period has been
selected to obtain the expected returns. In the estimation period, the intercept (α) and slope (β) of the CAPM
are calculated to be 0.005910407 and 0.820432541.
Table 2 shows the calculations of Geely’s and the market’s excess returns in the CAPM, from the beginning of
the estimation period to the end of the event window. The third column Pt of Table 2 is Geely Auto’s stock
prices. The daily risk-free interest rate (rf,t) is estimated from the 90-day US Treasury Bill annual rate divided by
365. Although Geely was listed on the Hong Kong Stock Exchange, it became a constituent of the Hang Seng
Index from 13 February 2017. Thus, the FTSE 100 index is used to reflect the market share price instead.
Table 2. Calculations of the event study
Date Time (t) Pt
(USD) 90 Day Treasury
Bill rate (%) Mktp (FTSE 100
Index) Ri Rf,t Rm,t Ri - Rf,t Rm,t - Rf,t
04/09/2009 -141 0.23 0.14 4933.2
08/09/2009 -140 0.28 0.14 4947.3 0.1967 3.83562E-06 0.0029 0.1967 0.0029
09/09/2009 -139 0.29 0.14 5004.3 0.0351 3.83562E-06 0.0115 0.0351 0.0115 10/09/2009 -138 0.28 0.14 4987.7 -0.0351 3.83562E-06 -0.0033 -0.0351 -0.0033
11/09/2009 -137 0.26 0.14 5011.5 -0.0741 3.83562E-06 0.0048 -0.0741 0.0048
14/09/2009 -136 0.25 0.14 5018.9 -0.0392 3.83562E-06 0.0015 -0.0392 0.0015
15/09/2009 -135 0.25 0.13 5042.1 0.0000 3.56164E-06 0.0046 0.0000 0.0046
16/09/2009 -134 0.25 0.10 5124.1 0.0000 2.73973E-06 0.0161 0.0000 0.0161
17/09/2009 -133 0.25 0.10 5164.0 0.0000 2.73973E-06 0.0078 0.0000 0.0078 18/09/2009 -132 0.25 0.08 5172.9 0.0000 2.19178E-06 0.0017 0.0000 0.0017
21/09/2009 -131 0.27 0.11 5134.4 0.0770 3.0137E-06 -0.0075 0.0770 -0.0075
22/09/2009 -130 0.37 0.11 5142.6 0.3151 3.0137E-06 0.0016 0.3151 0.0016
23/09/2009 -129 0.30 0.11 5139.4 -0.2097 3.0137E-06 -0.0006 -0.2097 -0.0006
24/09/2009 -128 0.33 0.10 5079.3 0.0953 2.73973E-06 -0.0118 0.0953 -0.0118
25/09/2009 -127 0.31 0.10 5082.2 -0.0625 2.73973E-06 0.0006 -0.0625 0.0006 28/09/2009 -126 0.28 0.11 5165.7 -0.1018 3.0137E-06 0.0163 -0.1018 0.0163
29/09/2009 -125 0.29 0.13 5159.7 0.0351 3.56164E-06 -0.0012 0.0351 -0.0012
30/09/2009 -124 0.29 0.14 5133.9 0.0000 3.83562E-06 -0.0050 0.0000 -0.0050
01/10/2009 -123 0.28 0.10 5047.8 -0.0351 2.73973E-06 -0.0169 -0.0351 -0.0169
02/10/2009 -122 0.28 0.10 4988.7 0.0000 2.73973E-06 -0.0118 0.0000 -0.0118
05/10/2009 -121 0.27 0.08 5024.3 -0.0364 2.19178E-06 0.0071 -0.0364 0.0071 06/10/2009 -120 0.33 0.08 5138.0 0.2007 2.19178E-06 0.0224 0.2007 0.0224
07/10/2009 -119 0.32 0.09 5108.9 -0.0308 2.46575E-06 -0.0057 -0.0308 -0.0057
08/10/2009 -118 0.31 0.06 5154.6 -0.0317 1.64384E-06 0.0089 -0.0318 0.0089
09/10/2009 -117 0.31 0.07 5161.9 0.0000 1.91781E-06 0.0014 0.0000 0.0014
12/10/2009 -116 0.31 0.07 5210.2 0.0000 1.91781E-06 0.0093 0.0000 0.0093
13/10/2009 -115 0.33 0.07 5154.1 0.0625 1.91781E-06 -0.0108 0.0625 -0.0108 14/10/2009 -114 0.34 0.07 5256.1 0.0299 1.91781E-06 0.0196 0.0299 0.0196
15/10/2009 -113 0.36 0.07 5223.0 0.0572 1.91781E-06 -0.0063 0.0572 -0.0063
16/10/2009 -112 0.36 0.07 5190.2 0.0000 1.91781E-06 -0.0063 0.0000 -0.0063
19/10/2009 -111 0.39 0.08 5281.5 0.0800 2.19178E-06 0.0174 0.0800 0.0174
20/10/2009 -110 0.38 0.08 5243.4 -0.0260 2.19178E-06 -0.0072 -0.0260 -0.0072
21/10/2009 -109 0.36 0.07 5257.9 -0.0541 1.91781E-06 0.0028 -0.0541 0.0028 22/10/2009 -108 0.35 0.06 5207.4 -0.0282 1.64384E-06 -0.0097 -0.0282 -0.0097
23/10/2009 -107 0.36 0.07 5242.6 0.0282 1.91781E-06 0.0067 0.0282 0.0067

http://ibr.ccsenet.org International Business Research Vol. 14, No. 7; 2021
45
26/10/2009 -106 0.35 0.08 5191.7 -0.0282 2.19178E-06 -0.0098 -0.0282 -0.0098
27/10/2009 -105 0.37 0.08 5201.0 0.0556 2.19178E-06 0.0018 0.0556 0.0018 28/10/2009 -104 0.38 0.07 5080.4 0.0267 1.91781E-06 -0.0235 0.0267 -0.0235
29/10/2009 -103 0.40 0.06 5137.7 0.0513 1.64384E-06 0.0112 0.0513 0.0112
30/10/2009 -102 0.37 0.05 5044.5 -0.0780 1.36986E-06 -0.0183 -0.0780 -0.0183
02/11/2009 -101 0.36 0.06 5104.5 -0.0274 1.64384E-06 0.0118 -0.0274 0.0118
03/11/2009 -100 0.36 0.06 5037.2 0.0000 1.64384E-06 -0.0133 0.0000 -0.0133
04/11/2009 -99 0.37 0.05 5107.9 0.0274 1.36986E-06 0.0139 0.0274 0.0139 05/11/2009 -98 0.39 0.04 5125.6 0.0526 1.09589E-06 0.0035 0.0526 0.0035
06/11/2009 -97 0.38 0.06 5142.7 -0.0260 1.64384E-06 0.0033 -0.0260 0.0033
09/11/2009 -96 0.39 0.07 5235.2 0.0260 1.91781E-06 0.0178 0.0260 0.0178
10/11/2009 -95 0.41 0.07 5230.5 0.0500 1.91781E-06 -0.0009 0.0500 -0.0009
11/11/2009 -94 0.44 0.07 5266.8 0.0706 1.91781E-06 0.0069 0.0706 0.0069
12/11/2009 -93 0.47 0.06 5276.5 0.0660 1.64384E-06 0.0018 0.0660 0.0018 13/11/2009 -92 0.47 0.07 5296.4 0.0000 1.91781E-06 0.0038 0.0000 0.0038
16/11/2009 -91 0.46 0.06 5382.7 -0.0215 1.64384E-06 0.0162 -0.0215 0.0162
17/11/2009 -90 0.47 0.04 5345.9 0.0215 1.09589E-06 -0.0069 0.0215 -0.0069
18/11/2009 -89 0.51 0.02 5342.1 0.0817 5.47945E-07 -0.0007 0.0817 -0.0007
19/11/2009 -88 0.47 0.02 5267.7 -0.0817 5.47945E-07 -0.0140 -0.0817 -0.0140
20/11/2009 -87 0.49 0.05 5251.4 0.0417 1.36986E-06 -0.0031 0.0417 -0.0031 23/11/2009 -86 0.50 0.05 5355.5 0.0202 1.36986E-06 0.0196 0.0202 0.0196
24/11/2009 -85 0.49 0.05 5324.0 -0.0202 1.36986E-06 -0.0059 -0.0202 -0.0059
25/11/2009 -84 0.49 0.03 5364.8 0.0000 8.21918E-07 0.0076 0.0000 0.0076
27/11/2009 -83 0.46 0.06 5245.7 -0.0632 1.64384E-06 -0.0225 -0.0632 -0.0225
30/11/2009 -82 0.51 0.06 5190.7 0.1032 1.64384E-06 -0.0105 0.1032 -0.0105
01/12/2009 -81 0.51 0.05 5312.2 0.0000 1.36986E-06 0.0231 0.0000 0.0231 02/12/2009 -80 0.55 0.06 5327.4 0.0755 1.64384E-06 0.0029 0.0755 0.0029
03/12/2009 -79 0.54 0.06 5313.0 -0.0183 1.64384E-06 -0.0027 -0.0184 -0.0027
04/12/2009 -78 0.53 0.04 5322.4 -0.0187 1.09589E-06 0.0018 -0.0187 0.0018
07/12/2009 -77 0.56 0.03 5310.7 0.0551 8.21918E-07 -0.0022 0.0551 -0.0022
08/12/2009 -76 0.59 0.03 5223.1 0.0522 8.21918E-07 -0.0166 0.0522 -0.0166
09/12/2009 -75 0.60 0.02 5203.9 0.0168 5.47945E-07 -0.0037 0.0168 -0.0037 10/12/2009 -74 0.57 0.03 5244.4 -0.0513 8.21918E-07 0.0078 -0.0513 0.0078
11/12/2009 -73 0.54 0.04 5261.6 -0.0541 1.09589E-06 0.0033 -0.0541 0.0033
14/12/2009 -72 0.57 0.05 5315.3 0.0541 1.36986E-06 0.0102 0.0541 0.0102
15/12/2009 -71 0.57 0.04 5285.8 0.0000 1.09589E-06 -0.0056 0.0000 -0.0056
16/12/2009 -70 0.57 0.04 5320.3 0.0000 1.09589E-06 0.0065 0.0000 0.0065
17/12/2009 -69 0.53 0.05 5217.6 -0.0728 1.36986E-06 -0.0195 -0.0728 -0.0195 18/12/2009 -68 0.50 0.08 5196.8 -0.0583 2.19178E-06 -0.0040 -0.0583 -0.0040
21/12/2009 -67 0.45 0.08 5294.0 -0.1054 2.19178E-06 0.0185 -0.1054 0.0185
22/12/2009 -66 0.49 0.07 5328.7 0.0852 1.91781E-06 0.0065 0.0852 0.0065
23/12/2009 -65 0.57 0.05 5372.4 0.1512 1.36986E-06 0.0082 0.1512 0.0082
24/12/2009 -64 0.56 0.11 5402.4 -0.0177 3.0137E-06 0.0056 -0.0177 0.0056
29/12/2009 -63 0.55 0.10 5437.6 -0.0180 2.73973E-06 0.0065 -0.0180 0.0065 30/12/2009 -62 0.54 0.05 5397.9 -0.0183 1.36986E-06 -0.0073 -0.0184 -0.0073
31/12/2009 -61 0.55 0.06 5412.9 0.0183 1.64384E-06 0.0028 0.0183 0.0028
04/01/2010 -60 0.55 0.08 5500.3 0.0000 2.19178E-06 0.0160 0.0000 0.0160
05/01/2010 -59 0.57 0.07 5522.5 0.0357 1.91781E-06 0.0040 0.0357 0.0040
06/01/2010 -58 0.57 0.06 5530.0 0.0000 1.64384E-06 0.0014 0.0000 0.0014
07/01/2010 -57 0.55 0.05 5526.7 -0.0357 1.36986E-06 -0.0006 -0.0357 -0.0006 08/01/2010 -56 0.54 0.05 5534.2 -0.0183 1.36986E-06 0.0014 -0.0184 0.0014
11/01/2010 -55 0.54 0.04 5538.1 0.0000 1.09589E-06 0.0007 0.0000 0.0007
12/01/2010 -54 0.53 0.05 5498.7 -0.0187 1.36986E-06 -0.0071 -0.0187 -0.0071
13/01/2010 -53 0.54 0.06 5473.5 0.0187 1.64384E-06 -0.0046 0.0187 -0.0046
14/01/2010 -52 0.53 0.05 5498.2 -0.0187 1.36986E-06 0.0045 -0.0187 0.0045
15/01/2010 -51 0.53 0.06 5455.4 0.0000 1.64384E-06 -0.0078 0.0000 -0.0078 18/01/2010 -50 0.51 0.06 5494.4 -0.0385 1.64384E-06 0.0071 -0.0385 0.0071
19/01/2010 -49 0.53 0.05 5513.1 0.0385 1.36986E-06 0.0034 0.0385 0.0034
20/01/2010 -48 0.52 0.06 5420.8 -0.0190 1.64384E-06 -0.0169 -0.0190 -0.0169
21/01/2010 -47 0.49 0.06 5335.1 -0.0594 1.64384E-06 -0.0159 -0.0594 -0.0159
22/01/2010 -46 0.47 0.06 5303.0 -0.0417 1.64384E-06 -0.0060 -0.0417 -0.0060
25/01/2010 -45 0.48 0.07 5260.3 0.0211 1.91781E-06 -0.0081 0.0211 -0.0081 26/01/2010 -44 0.45 0.08 5276.9 -0.0645 2.19178E-06 0.0032 -0.0645 0.0031
27/01/2010 -43 0.42 0.08 5217.5 -0.0690 2.19178E-06 -0.0113 -0.0690 -0.0113
28/01/2010 -42 0.45 0.08 5145.7 0.0690 2.19178E-06 -0.0139 0.0690 -0.0139
29/01/2010 -41 0.45 0.10 5188.5 0.0000 2.73973E-06 0.0083 0.0000 0.0083

http://ibr.ccsenet.org International Business Research Vol. 14, No. 7; 2021
46
01/02/2010 -40 0.45 0.10 5247.4 0.0000 2.73973E-06 0.0113 0.0000 0.0113
02/02/2010 -39 0.46 0.10 5283.3 0.0220 2.73973E-06 0.0068 0.0220 0.0068 03/02/2010 -38 0.48 0.09 5253.1 0.0426 2.46575E-06 -0.0057 0.0426 -0.0057
04/02/2010 -37 0.44 0.10 5139.3 -0.0870 2.73973E-06 -0.0219 -0.0870 -0.0219
05/02/2010 -36 0.43 0.12 5060.9 -0.0230 3.28767E-06 -0.0154 -0.0230 -0.0154
08/02/2010 -35 0.42 0.12 5092.3 -0.0235 3.28767E-06 0.0062 -0.0235 0.0062
09/02/2010 -34 0.40 0.11 5111.8 -0.0488 3.0137E-06 0.0038 -0.0488 0.0038
10/02/2010 -33 0.44 0.11 5132.0 0.0953 3.0137E-06 0.0039 0.0953 0.0039 11/02/2010 -32 0.47 0.10 5161.5 0.0660 2.73973E-06 0.0057 0.0660 0.0057
12/02/2010 -31 0.46 0.10 5142.5 -0.0215 2.73973E-06 -0.0037 -0.0215 -0.0037
15/02/2010 -30 0.47 0.10 5167.5 0.0215 2.73973E-06 0.0048 0.0215 0.0048
16/02/2010 -29 0.46 0.10 5244.1 -0.0215 2.73973E-06 0.0147 -0.0215 0.0147
17/02/2010 -28 0.47 0.11 5276.6 0.0215 3.0137E-06 0.0062 0.0215 0.0062
18/02/2010 -27 0.46 0.11 5325.1 -0.0215 3.0137E-06 0.0091 -0.0215 0.0091 19/02/2010 -26 0.45 0.12 5358.2 -0.0220 3.28767E-06 0.0062 -0.0220 0.0062
22/02/2010 -25 0.45 0.12 5352.1 0.0000 3.28767E-06 -0.0011 0.0000 -0.0011
23/02/2010 -24 0.47 0.13 5315.1 0.0435 3.56164E-06 -0.0069 0.0435 -0.0069
24/02/2010 -23 0.46 0.13 5342.9 -0.0215 3.56164E-06 0.0052 -0.0215 0.0052
25/02/2010 -22 0.50 0.13 5278.2 0.0834 3.56164E-06 -0.0122 0.0834 -0.0122
26/02/2010 -21 0.50 0.14 5354.5 0.0000 3.83562E-06 0.0144 0.0000 0.0143 01/03/2010 -20 0.51 0.14 5405.9 0.0198 3.83562E-06 0.0096 0.0198 0.0095
02/03/2010 -19 0.53 0.14 5484.1 0.0385 3.83562E-06 0.0144 0.0385 0.0144
03/03/2010 -18 0.51 0.15 5533.2 -0.0385 4.10959E-06 0.0089 -0.0385 0.0089
04/03/2010 -17 0.51 0.16 5527.2 0.0000 4.38356E-06 -0.0011 0.0000 -0.0011
05/03/2010 -16 0.52 0.16 5599.8 0.0194 4.38356E-06 0.0130 0.0194 0.0130
08/03/2010 -15 0.52 0.15 5606.7 0.0000 4.10959E-06 0.0012 0.0000 0.0012 09/03/2010 -14 0.52 0.16 5602.3 0.0000 4.38356E-06 -0.0008 0.0000 -0.0008
10/03/2010 -13 0.54 0.15 5640.6 0.0377 4.10959E-06 0.0068 0.0377 0.0068
11/03/2010 -12 0.54 0.17 5617.3 0.0000 4.65753E-06 -0.0041 0.0000 -0.0041
12/03/2010 -11 0.52 0.16 5625.6 -0.0377 4.38356E-06 0.0015 -0.0377 0.0015
15/03/2010 -10 0.53 0.15 5593.9 0.0190 4.10959E-06 -0.0057 0.0190 -0.0057
16/03/2010 -9 0.52 0.16 5620.4 -0.0190 4.38356E-06 0.0047 -0.0191 0.0047 17/03/2010 -8 0.53 0.16 5644.6 0.0190 4.38356E-06 0.0043 0.0190 0.0043
18/03/2010 -7 0.53 0.15 5642.6 0.0000 4.10959E-06 -0.0004 0.0000 -0.0004
19/03/2010 -6 0.52 0.14 5650.1 -0.0190 3.83562E-06 0.0013 -0.0191 0.0013
22/03/2010 -5 0.52 0.14 5644.5 0.0000 3.83562E-06 -0.0010 0.0000 -0.0010
23/03/2010 -4 0.53 0.14 5673.6 0.0190 3.83562E-06 0.0051 0.0190 0.0051
24/03/2010 -3 0.53 0.14 5677.9 0.0000 3.83562E-06 0.0008 0.0000 0.0008 25/03/2010 -2 0.53 0.15 5727.6 0.0000 4.10959E-06 0.0087 0.0000 0.0087
26/03/2010 -1 0.55 0.16 5703.0 0.0370 4.38356E-06 -0.0043 0.0370 -0.0043
29/03/2010 0 0.53 0.16 5710.7 -0.0370 4.38356E-06 0.0013 -0.0370 0.0013
30/03/2010 1 0.54 0.16 5672.3 0.0187 4.38356E-06 -0.0067 0.0187 -0.0068
31/03/2010 2 0.54 0.16 5679.6 0.0000 4.38356E-06 0.0013 0.0000 0.0013
01/04/2010 3 0.55 0.18 5744.9 0.0183 4.93151E-06 0.0114 0.0183 0.0114 06/04/2010 4 0.55 0.17 5780.4 0.0000 4.65753E-06 0.0062 0.0000 0.0062
07/04/2010 5 0.55 0.17 5762.1 0.0000 4.65753E-06 -0.0032 0.0000 -0.0032
08/04/2010 6 0.54 0.17 5712.7 -0.0183 4.65753E-06 -0.0086 -0.0184 -0.0086
09/04/2010 7 0.54 0.16 5771.0 0.0000 4.38356E-06 0.0102 0.0000 0.0101
12/04/2010 8 0.52 0.16 5777.6 -0.0377 4.38356E-06 0.0011 -0.0377 0.0011
13/04/2010 9 0.49 0.16 5761.7 -0.0594 4.38356E-06 -0.0028 -0.0594 -0.0028 14/04/2010 10 0.48 0.16 5796.3 -0.0206 4.38356E-06 0.0060 -0.0206 0.0060
15/04/2010 11 0.47 0.16 5825.0 -0.0211 4.38356E-06 0.0049 -0.0211 0.0049
16/04/2010 12 0.47 0.16 5744.0 0.0000 4.38356E-06 -0.0140 0.0000 -0.0140
19/04/2010 13 0.46 0.16 5727.9 -0.0215 4.38356E-06 -0.0028 -0.0215 -0.0028
20/04/2010 14 0.49 0.16 5783.7 0.0632 4.38356E-06 0.0097 0.0632 0.0097
21/04/2010 15 0.48 0.15 5723.4 -0.0206 4.10959E-06 -0.0105 -0.0206 -0.0105 22/04/2010 16 0.46 0.16 5665.3 -0.0426 4.38356E-06 -0.0102 -0.0426 -0.0102
23/04/2010 17 0.47 0.16 5723.6 0.0215 4.38356E-06 0.0102 0.0215 0.0102
26/04/2010 18 0.47 0.16 5753.9 0.0000 4.38356E-06 0.0053 0.0000 0.0053
27/04/2010 19 0.45 0.16 5603.5 -0.0435 4.38356E-06 -0.0265 -0.0435 -0.0265
28/04/2010 20 0.46 0.16 5586.6 0.0220 4.38356E-06 -0.0030 0.0220 -0.0030
We have depicted Figure 2 which shows that Geely‟s stock prices climbed slowly after the announcement date
but experienced a significant drop from the 8th day until the end of the event window. The temporary slight
increase in the share price before the announcement might indicate some abnormal trading in the acquiring firm’

http://ibr.ccsenet.org International Business Research Vol. 14, No. 7; 2021
47
s shares by anticipators or informed traders holding private information (Kedia and Zhou 2014; Mohil et al.
2020). Overall, the acquisition announcement had a positive impact on the acquirer’s share price in a short term
but did not stimulate the market to react dramatically. Investors tended to conservatively expect the performance
of this event, with the stock price falling below $0.5 in only 9 days.
Figure 2. Geely‟s stock price changes
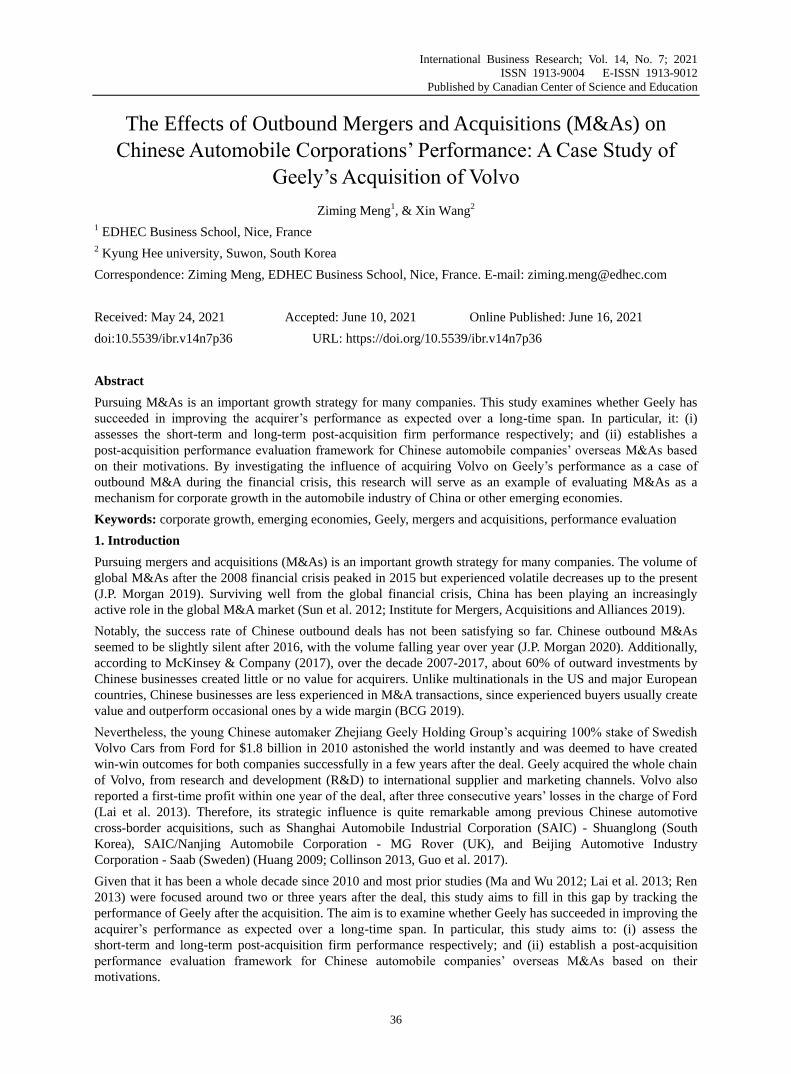
As shown in Table 3, which demonstrates the daily AR and CAR from -20 to 20 trading days around the event
date and the t-test results of ARs, daily AR for Geely’s shareholders floated up and down, with more negative
ARs than positive ones. To present the aggregate impact on the AR, we created a graph of the CAR changing
trend (see Figure 3). There were negative CARs from 10 days prior to the announcement, and much more
significantly negative CARs after the announcement date. This indicated that the market was anticipating an
event of which investors’ anticipation negatively affected the shareholder’s return, in accordance with the
findings of Zhang (2017). The announcement date witnessed a comparatively greater AR of -4.41%; the
t-statistic -0.6960 was also significantly different from zero (see Table 3), again suggesting the markets’ passive
reaction to this acquisition. To summarize, the shareholder value decreased in the short term, complying with
Lebedev et al. (2015) who claimed that M&As often decrease the shareholder value of the acquiring firm in the
short term. However, the long-term operating performance needs a longer time to inspect.
Table 3. Daily AR, t-statistic of AR, and CAR
Time AR T-statistic CAR Time AR T-statistic CAR
-20 0.61% 0.0956 0.61% 1 1.83% 0.2893 -10.04%
-19 2.08% 0.3281 2.68% 2 -0.70% -0.1100 -10.74%
-18 -5.17% -0.8165 -2.49% 3 0.31% 0.0483 -10.43%
-17 -0.50% -0.0793 -2.99% 4 -1.10% -0.1732 -11.53%
-16 0.28% 0.0442 -2.71% 5 -0.33% -0.0523 -11.86%
-15 -0.69% -0.1093 -3.40% 6 -1.72% -0.2716 -13.58%
-14 -0.53% -0.0832 -3.93% 7 -1.42% -0.2250 -15.00%
-13 2.62% 0.4145 -1.30% 8 -4.46% -0.7043 -19.46%
-12 -0.25% -0.0397 -1.55% 9 -6.31% -0.9963 -25.77%
-11 -4.49% -0.7086 -6.04% 10 -3.14% -0.4967 -28.91%
-10 1.78% 0.2807 -4.26% 11 -3.10% -0.4899 -32.01%
-9 -2.88% -0.4555 -7.15% 12 0.56% 0.0881 -31.46%
-8 0.96% 0.1518 -6.19% 13 -2.51% -0.3967 -33.97%
-7 -0.56% -0.0888 -6.75% 14 4.93% 0.7790 -29.04%
-6 -2.60% -0.4115 -9.35% 15 -1.79% -0.2832 -30.83%
-5 -0.51% -0.0805 -9.86% 16 -4.01% -0.6334 -34.84%
-4 0.89% 0.1409 -8.97% 17 0.72% 0.1137 -34.12%
-3 -0.65% -0.1032 -9.62% 18 -1.02% -0.1618 -35.14%
-2 -1.31% -0.2063 -10.93% 19 -2.77% -0.4370 -37.91%
-1 3.47% 0.5475 -7.46% 20 1.85% 0.2929 -36.06%
0 -4.41% -0.6960 -11.87%
http://ibr.ccsenet.org International Business Research Vol. 14, No. 7; 2021
48
Figure 3. Trend in cumulative abnormal return (CAR)
5.2 Long-term Financial Performance
To answer the second research question “What was the long-term financial performance of the deal?”, we
evaluated the long-term financial performance of Geely by considering profitability, efficiency; and solvency.
5.2.1 Profitability
The sales volume of passenger vehicles fell by 10% in 2019, as a joint result of the deterioration of consumer
confidence in China caused by economic uncertainties of the US-China trade dispute, the completed elimination
of purchase tax subsidies for fuel-efficient vehicles, and the implementation of new emission standards by local
governments in China. These external factors negatively affected Geely’s profitability substantially this year.
However, to investigate the effects of the case of acquiring Volvo, we should focus more on the years before
2019.
As the first layer of profitability, gross profit margin shows the profit potential of a firm before deducting
miscellaneous selling, general, and administrative costs. Geely’s gross profit margin increased generally stably
until 2018, except in 2014, aligning with decreases of the other three ratios in the corresponding period. The fall
in 2014 was primarily imputed to the 24% contemporary drop in sales revenue, resulting from the reshuffle of
the group’s sales and marketing system in China, and the deterioration of the political and economic
environment in some major export countries. The gross profit margin shows Geely performed well in sales
increase and had a health profit foundation of post-acquisition integration.
Unlike the stable gross profit margin, ROA and operating margin got even worse in four years after the
acquisition but recovered gradually until 2018. We can see that the acquisition harmed the acquirer’s
profitability significantly in the following few years, as the ex-post integration of cross-border M&As was still a
challenge for private acquirers. The target‟s financial problems could also offset part of the acquirer’s
profitability.
Nevertheless, the situation improved quickly after 2014, in which year Geely’s cooperation with Volvo made
remarkable progress in running a new independent R&D centre, CEVT in Sweden to deliver world-class product
technologies and attributes, and facilitate considerable cost saving for both Volvo and the group. This reveals the
financial benefits to Geely resulting from the synergy of technology and product quality in the long term.
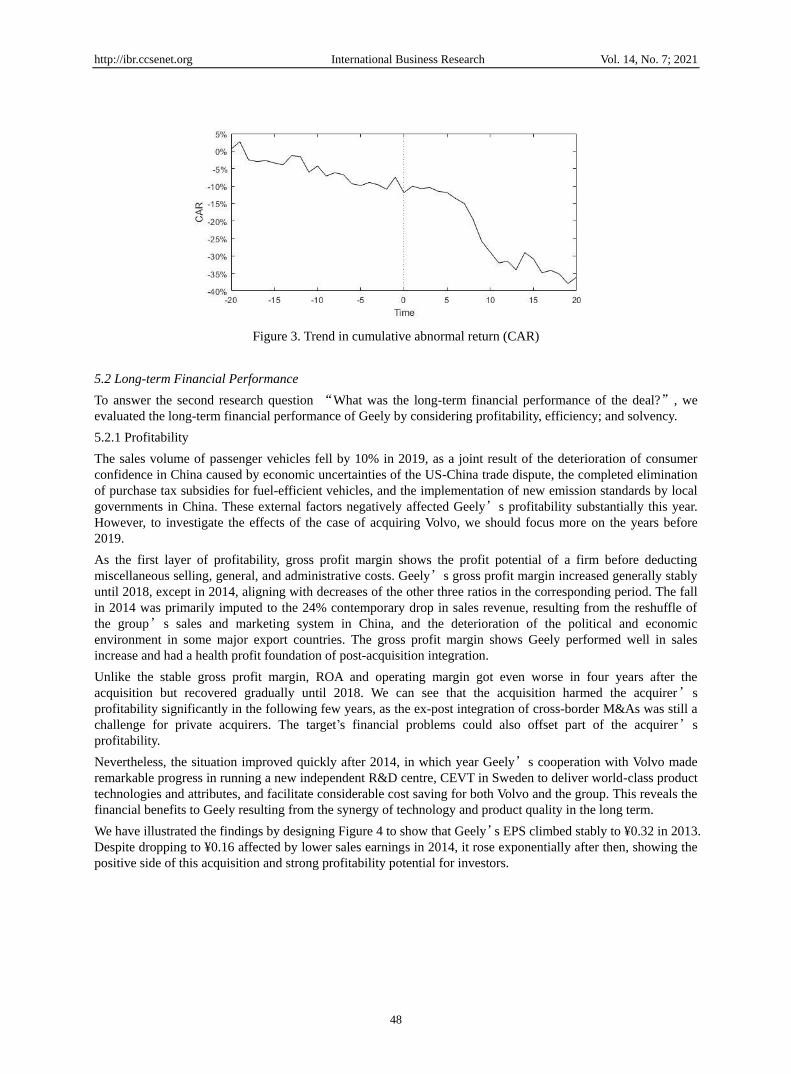
We have illustrated the findings by designing Figure 4 to show that Geely’s EPS climbed stably to ¥0.32 in 2013.
Despite dropping to ¥0.16 affected by lower sales earnings in 2014, it rose exponentially after then, showing the
positive side of this acquisition and strong profitability potential for investors.

http://ibr.ccsenet.org International Business Research Vol. 14, No. 7; 2021
49
Figure 4. Profitability ratios
5.2.2 Efficiency
The asset turnover ratio indicates the efficiency with which firms are using their assets to generate sales. As
shown in Figure 5, Geely’s asset turnover remained relatively stable below the industry average level until 2016
(IiMedia Research 2018) but rose to over 1.2 after 2017. This reveals Geely was able to improve the efficiency
of utilizing assets internally and obtained from the target, which supported Feng and Liu (2016) in suggesting
Geely had no over-expansion issues. As Volvo’s financial data were not included in Geely’s financial statements,
the assets of Volvo would not affect the total assets of Geely, thus avoiding the abrupt volatility of asset turnover
after the acquisition.
As credit sales account for the major part of automotive companies‟ current assets, the receivables turnover is
critical for measuring the effectiveness of credit policies and collecting money from customers. The changing
trend of receivables turnover was similar to that of asset turnover. Specifically, the receivables turnover fell
relatively greatly in 2011, with the 23.22% increase in receivables being more than 4.31% increase in revenue
compared with in 2010. This increase mainly came from the rising trade receivables from related companies
controlled by the substantial shareholder of Geely, and the acquisition might also decrease the acquirer’s ability
to collect its accounts receivable to some degree. From 2014, however, the receivables turnover performed
increasingly well, due to the significant increase in sales and cost of sales.
The inventory turnover is a comprehensive indicator of how efficiently a firm manages ordering, manufacturing
and inventory levels. More importantly for car dealerships, it measures how rapidly they are selling the existing
inventory of cars. Geely‟s inventory turnover experienced an annual decrease from 2010 and then peaked at
20.45 in 2016. The decreasing trend might imply either weak sales or overstocking, leading to lower liquidity
and additional cost for storage. This disproved the findings of Lai et al. (2013) that Geely had appropriately dealt
with the large pile of stocks resulting from the acquisition. The peak in 2016 was mostly due to the unexpected
increase of revenue by 78.3%, as strong domestic sales volume growth in China overtook the weaker exports.
Accordingly, Geely should be conscious of the insufficient inventory risk in the case of a high inventory turnover
ratio.
2008 2009 2010 2011 2012 2013 2014 2015 2016 2017 2018 2019
ROA 13.25% 9.11% 7.19% 6.61% 6.95% 8.25% 4.09% 5.75% 9.41% 14.07%14.37% 8.29%
Gross profit margin 15.18%18.06%18.41%18.22%18.51%20.08%18.23%18.15%18.32%19.38%20.18%17.37%
Operating margin 21.40%11.02% 9.45% 10.41%10.27%11.51% 8.94% 9.54% 11.55%13.77%14.03% 9.89%
EPS (RMB cents) 15 17.08 18.59 20.72 27.05 31.74 16.25 25.68 57.96 119 140 90
0
20
40
60
80
100
120
140
160
0.00%
5.00%
10.00%
15.00%
20.00%
25.00%

http://ibr.ccsenet.org International Business Research Vol. 14, No. 7; 2021
50
Figure 5. Efficiency ratios
5.2.3 Solvency
Given that Geely completed the acquisition of Volvo by bearing all of its debts which is one of the most critical
risks for Chinese private acquirers (Feng and Liu 2016), the ability to meet its short- and long-term debts and
financial obligations is essential for assessing the post-acquisition performance.
The changing trends of current and quick ratios were quite similar. They experienced an obvious drop by roughly
15-16% in the first year of acquisition, indicating the short-term solvency negatively affected by abruptly taking
on all debts of Volvo through the acquisition. After three-year increases due to well digesting the target’s assets,
from 2015 however, the current and quick ratios fell continuously back to the initial levels preceding the
acquisition year. This suggested the liquidity benefit of this acquisition had faded away.
The debt ratio is a good measure of a company’s long-term solvency. As shown in Figure 6, this ratio decreased
steadily after the end of 2011 to an appropriate range of 40-60% (Lai et al. 2013), indicating Geely had a greater
portion of assets funded by equity rather than debt. In 2012-2013, for example, the decrease in debt ratio was
mainly due to a combination of the full exercise of all warrants and the partial conversion of convertible bonds,
and improved cash reserve for repayment of borrowings upon maturity. Therefore, Geely went smoothly in terms
of managing credit financing after the acquisition.
Figure 6. Solvency ratios
5.3 Long-term Non-financial Performance
Our third research question is “Did the long-term non-financial performance realize the acquisition motivations?”
In the light of Geely‟s acquisition motives (i.e. market-seeking, strategic assets, and internationalization)
discussed before, we have divided its non-financial performance into innovative performance and brand
2008 2009 2010 2011 2012 2013 2014 2015 2016 2017 2018 2019
Asset turnover 0.66 0.97 0.93 0.81 0.84 0.88 0.61 0.76 0.98 1.22 1.21 0.98
Inventory turnover 14.53 20.46 20.16 14.63 12.62 12.72 10.45 17.34 20.45 16.45 16.81 18.05
Receivables turnover 2.95 3.13 2.50 1.89 1.92 2.03 1.39 1.93 2.45 2.97 3.78 4.00
0.00
5.00
10.00
15.00
20.00
25.00
2008 2009 2010 2011 2012 2013 2014 2015 2016 2017 2018 2019
Current ratio 0.97 1.37 1.33 1.13 1.19 1.29 1.42 1.24 1.16 1.06 0.98 1.03
Quick ratio 0.88 1.30 1.24 1.04 1.08 1.19 1.33 1.18 1.09 0.94 0.88 0.93
Debt ratio 52.89%62.26%62.65%63.22%57.92%51.70%53.15%53.33%63.47%59.04%50.39%49.11%
0.000.200.400.600.801.001.201.401.60

http://ibr.ccsenet.org International Business Research Vol. 14, No. 7; 2021
51
internationalization and will evaluate the acquisition’s non-financial motivation achievements in these two
aspects.
Accessing the competitive strength of technological innovation is one of the main motives for acquiring Volvo.
The fast-changing automobile market also pushed Geely to continuously develop new products adopting
advanced technologies to be competitive in terms of design, performance, and price. Therefore, the continued
success of Geely, in turn, largely depends on its R&D capabilities.
In Figure 7, the absolute R&D costs showed an overall upward trend, disproving the findings of Hitt et al. (1998)
that acquisition activities reduce a firm’s commitment to continued R&D funding. The R&D intensity, which is
calculated by dividing the total R&D costs charged to profit or loss by the total revenue, increased to 2.57% in
2015, meaning the R&D investment in every single unit of sales increased during this period due to the
establishment of CEVT. This proves the findings of Liu and Zou (2008) that importing foreign technology and
investing in domestic R&D positively influence domestic innovation. Despite dropping to 1.59% in 2017, the
R&D intensity recovered quickly to 3.15% in 2019. This suggests that the strong R&D advantage brought about
by the acquisition can diminish but Geely is increasingly seeking to strengthen its homegrown innovation
capabilities in a long term.
Noticeably, the R&D intensity did not rise obviously in the first year of acquisition. This might be attributable to
the delay of the technological cooperation with Volvo and the post-acquisition resource integration. Concurrently,
it also concerns Geely that the R&D efforts probably could not be applied to products that will be accepted by
the market or promptly to take advantage of the opportunities presented in the market.
Figure 7. Innovative performance
The extent that the Geely-Volvo acquisition has achieved its brand internationalization motivation is evaluated
by the TNI, annually issued by China Enterprise Confederation and China Enterprise Directors Association from
2011. It is calculated as the arithmetic mean of three ratios of foreign assets to total assets, foreign sales to total
sales, and foreign employment to total employment, as developed by the United Nations Conference on Trade
and Development. As the indicator was not available before 2011, we cannot compare the internationalization of
Geely with its pre-acquisition performance.
As shown in Table 4, Geely outperformed a vast majority of Chinese corporations in internationalization, with
the average TNI of those on the list being much lower than the average level (around 60-65%) of global top 100
transnational corporations. Geely‟s TNI had always ranked first between 2011 and 2016 but dropped to the fifth
from 2018. Although its foreign assets and foreign sales increased quickly in recent three years (see Figure 8),
they were not able to surpass those of other multinationals in the proportions to total amounts. Consequently, we
can see that the internationalization benefit for Geely of acquiring Volvo maintained for quite a long time but
weakened gradually with the strong growth of other domestic multinationals. While leading the international
2008 2009 2010 2011 2012 2013 2014 2015 2016 2017 2018 2019
R&D costs (RMB’000) 51,273119,63181,04216,77416,78527,21502,61774,781,088,1,478,1,926,3,067,
R&D intensity 1.20%0.85%0.90%1.03%1.69%1.84%2.31%2.57%2.03%1.59%1.81%3.15%
0.00%
0.50%
1.00%
1.50%
2.00%
2.50%
3.00%
3.50%
0
500,000
1,000,000
1,500,000
2,000,000
2,500,000
3,000,000
3,500,000

http://ibr.ccsenet.org International Business Research Vol. 14, No. 7; 2021
52
presence of Chinese firms, Geely was simply equal or inferior to the average performance of global top 100
transnational corporations and could still improve its growth internationally.
Figure 8. Brand internationalization
Table 4. Internationalization performance of Geely Holding
2011 2012 2013 2014 2015 2016 2017 2018 2019
Ranking on
list 9 9 10 10 13 19 19 14 13
Foreign
assets
(RMB
million)
70,332.8 68,852.4 76,565.1 82,395.7 83,050.9 103,503.9 129,202.9 164,290.8 192,505.2
Foreign
sales
(RMB
million)
49,847.2 127,760.5 129,278.0 N/A 129,513.4 121,319.6 145,296.9 173,487.3 196,461.0
Foreign
employees 14,042 19,800 20,530 N/A 25,260 24,112 26,546 32,932 43,107
TNI 62.03% 67.48% 67.25% 67.61% 68.91% 65.43% 58.60% 54.16% 50.69%
TNI ranking 1 1 1 1 1 1 4 5 5
Chinese top
100 average
TNI
13.37% 12.93% 13.98% 13.60% 13.66% 14.40% 14.85% 15.80% 15.96%
In summary, the modest share price changes, negative AR and CAR indicated the market‟s passive reaction to
the acquisition of Volvo which depressed the shareholder value in the short term of the announcement. The
acquisition did not significantly increase the profitability of Geely within the first five years, but the situation
reversed in recent years.
As the efficiency performance was susceptible to the external factor of vehicle demand apart from the pure
managerial efficiency, the acquisition‟s impact on it was not that obvious. Although the liquidity benefit of this

http://ibr.ccsenet.org International Business Research Vol. 14, No. 7; 2021
53
acquisition had faded away, Geely managed well its long-term solvency after the acquisition despite taking over
all of Volvo‟s debts through the acquisition.
In terms of the deal‟s non-financial achievements, Volvo did boost Geely‟s innovative capability and
international presence substantially through technological partnership, expanded overseas market, and brand
image influence. However, with the acquisition‟s effect diluted after 2015, the brand internationalization
performance of Geely weakened in recent years.
6. Conclusion
This study aims at tracing the post-acquisition performance of the acquirer (Geely) to examine whether this
astonishing deal at that time succeeded in improving the buying group‟s performance as expected over a
long-time span. In particular, it develops a post-acquisition performance evaluation framework for the Chinese
automobile industry‟s overseas M&As; and assesses the short-term and long-term post-acquisition firm
performance respectively.
We found that the modest share price changes, negative AR and CAR indicated the acquisition did not
significantly increase the shareholder value. However, the short-term stock price changes cannot reflect the
acquisition synergy impact on firm performance.
In terms of the long-term financial performance, the acquisition of Volvo did not bring much profitability to
Geely instantly in the first five years, after which, however, the profitability of the group improved more quickly
than before. Geely compromised some operating and net profits initially to strive for resource integration with
Volvo, while the profitability of its main business activities was not largely affected due to the steady gross profit
margin. The EPS grew quickly after 2015, indicating that the acquisition was rewarding for shareholders
especially when the synergy effect started paying off.
Besides, the acquisition had a slightly negative impact on the acquirer‟s operating efficiency in the short term but
recovered gradually later on. Geely should particularly focus on monitoring the volatile inventory turnover level
to improve the efficiency of the group. The acquisition also did not bring many benefits to the short-term
liquidity of Geely, while the long-term solvency performance of Geely remained relatively healthy after the
acquisition. Geely still has room to improve its liquidity by managing the working capital.
Regarding the long-term non-financial performance, there was a one-year delay in huge improvements of R&D
in proportion to sales. This means the technological cooperation with Volvo needed some time to take actions
such as establishing R&D centres. Although the R&D intensity experienced a two-year fall from 2016 to 2017, it
increased quickly in general with the annual R&D costs, revealing that Geely was seeking to generate its
homegrown sustainable innovation capabilities apart from the support from Volvo.
As the Transnationality Index was not released before 2011, we cannot compare Geely‟s pre-acquisition
internationalization with its current performance. Nevertheless, according to the available data, Geely performed
well in the five years after the acquisition, but its international presence became decreasingly competitive in
recent years. Therefore, Geely has to seek its international expansion more independently.
Our main contribution is that we have designed an evaluation framework aligning with the acquirer‟s
multidimensional acquisition motives. The framework consists of the traditional event study and
accounting-based measures that are most widely adopted in the M&A-related literature. Additionally, the
framework also introduces two non-financial branches of the acquisition performance and corresponding
indicators, in terms of innovation performance and brand internationalization. All of the above make this study
among the few pieces of research integrating both the event study and non-financial indicators into the
mainstream accounting-based analysis by Chinese domestic researchers of post-acquisition performance in the
Geely-Volvo case. The case of Geely is expected to set an example of M&As in the ongoing economic recession
and provide experience for Chinese private automobile enterprises that seek cross-border M&As and accelerate
global expansion in the future.
Like any other studies, our study has limitations. The consolidated annual reports of the acquirer Geely Holding
were not available. This increased the difficulty of evaluating the overall synergy effects after acquisition.
However, this was overcome to a large extent by using the annual reports of its listed subsidiary, Geely Auto‟s
annual reports instead to reflect the synergy benefits, as Geely Auto contains the acquirer group‟s only three auto
brands (i.e. Geely Auto, Lynk & Co, and Geometry) that are developed independently or jointly with Volvo. In
other words, the other auto brands within the group were obtained by acquisitions. Therefore, the acquirer‟s
listed entity, Geely Auto, could be most directly affected by the acquisition in our case study, in terms of for
example sales, R&D, and brand internationalization.

http://ibr.ccsenet.org International Business Research Vol. 14, No. 7; 2021
54
Additionally, our study focused only on one single case of a Chinese automobile company acquiring another
Swedish car manufacturer. The case study strategy determines the limitation that the findings and experience in
this study might not be generalized to all Chinese automobile enterprises‟ cross-border M&As.
Future studies should replicate and extend this study to include other cases of automobile enterprises in China
and/or other emerging markets. Future studies should also use patenting frequency, which refers to the number of
newly granted patents per year (Granstrand and Holgersson 2012), to evaluate the innovation performance in
technology-motivated M&As.
References
Alon, I., & Fetscherin, M. (2011). Chinese international investments. London: Palgrave Macmillan.
https://doi.org/10.1057/9780230361577
Balcet, G., Wang, H., & Richet, X. (2017). Catching up strategies and multinational growth: the case of Geely
Volvo. In Chinese Investment in Europe: Corporate Strategies and Labour Relations. ed. by Drahokoupil, J.
Brussels: ETUI aisbl, 61-77.
Banerjee, A., & Eckard, E. (1998). Are mega-mergers anticompetitive? Evidence from the first great merger
wave. The RAND Journal of Economics, 29(4), 803-827. https://doi.org/10.2307/2556095
Barber, B., & Lyon, J. (1996). Detecting abnormal operating performance: The empirical power and
specification of test statistics. Journal of Financial Economics, 41, 359-399.
https://doi.org/10.1016/0304-405X(96)84701-5
BCG. (2019). The 2019 M&A report: downturns are a better time for deal hunting.
https://www.bcg.com/publications/2019/mergers-and-acquisitions-report-shows-downturns-are-a-better-tim
e-for-deal-hunting.aspx
Bessler, W., & Murtagh, J. (2002). The stock market reaction to cross-border acquisitions of financial services
firms: An analysis of Canadian banks. Journal of International Financial Markets, Institutions and Money
12(4-5), 419-440. https://doi.org/10.1016/S1042-4431(02)00022-7
Bourne, M., Mills, J., Wilcox, M., Neely, A., & Platts, K. (2000). Designing, implementing and updating
performance measurement systems. International Journal of Operations & Production Management, 20(7),
754-771. https://doi.org/10.1108/01443570010330739
Bruner, R. (2002). Does M&A pay? A survey of evidence for the decision-maker. Journal of applied finance
12(1), 48-68.
Chen, C., & Liu, J. (2011). Brand adapting management in merger and acquisition: A case study of
Geely/Volvo's brand acquisition. Unpublished Master‟s thesis. Småland: Linnaeus University.
China Association of Automobile Manufacturers. (2020). Top 10 passenger carmakers by sales volume in China,
2019. Retrieved from http://www.caam.org.cn/chn/4/cate_30/con_5228409.html
Chu, W. (2011). How the Chinese government promoted a global automobile industry. Industrial and Corporate
Change, 20(5), 1235-1276. https://doi.org/10.1093/icc/dtr010
Coase, R. (1937). The nature of the firm. Economica, 4(16), 386-405.
https://doi.org/10.1111/j.1468-0335.1937.tb00002.x
Collinson, S. (2013). The making of an innovative multinational firm: Chinese capability development through
the acquisition of MG-Rover. Birmingham Business School Discussion Paper Series 2013-04.
Comanor, W. (1967). Vertical mergers, market powers, and the antitrust laws. The American Economic
Review, 57(2), 254-265.
Coventry University. (2020). Trading floor. Retrieved from
https://www.coventry.ac.uk/study-at-coventry/faculties-and-schools/coventry-business-school/about-us/tradi
ng-floor/
Deng, P. (2004). Outward investment by Chinese MNCs: Motivations and implications. Business Horizons,
47(3), 8-16. https://doi.org/10.1016/S0007-6813(04)00023-0
Deng, P. (2009). Why do Chinese firms tend to acquire strategic assets in international expansion? Journal of
World Business, 44(1), 74-84. https://doi.org/10.1016/j.jwb.2008.03.014
Du, M., Boateng, A., & Newton, D. (2016). The impact of state ownership, formal institutions and resource
seeking on acquirers‟ returns of Chinese M&A. Review of Quantitative Finance and Accounting, 47(1),

http://ibr.ccsenet.org International Business Research Vol. 14, No. 7; 2021
55
159-178. https://doi.org/10.1007/s11156-015-0498-0
Dubois, A., & Gadde, L. (2002). Systematic combining: An abductive approach to case research. Journal of
Business Research, 55(7), 553-560. https://doi.org/10.1016/S0148-2963(00)00195-8
Fama, E., Fisher, L., Jensen, M., & Roll, R. (1969). The adjustment of stock prices to new
information. International Economic Review, 10(1), 1-21. https://doi.org/10.2307/2525569
Fan, Z., Gu, J., & Fu, Y. (2018). Research on performance evaluation of "Snake-Elephant" overseas M&A mode
- Taking Geely Group as an example. Friends of Accounting, 16, 60-65.
Feng, Y., & Liu, Y. (2016). Chinese private enterprises cross-border M&A financial performance analysis -
Taking Geely acquiring Volvo as an example. Modern Management Science, 3, 97-99.
Focarelli, D., Panetta, F., & Salleo, C. (2002). Why do banks merge? Journal of Money, Credit and Banking,
34(4), 1047-1066. https://doi.org/10.1353/mcb.2002.0054
Fuad, M., & Gaur, A. (2019). Merger waves, entry-timing, and cross-border acquisition completion: A frictional
lens perspective. Journal of World Business, 54(2), 107-118. https://doi.org/10.1016/j.jwb.2018.12.001
Gao, Z. (2015). The enterprise merger and acquisition effect on firm value—A discussion on Geely‟s acquisition
of Volvo for example. Modern Economy, 6, 717-726. https://doi.org/10.4236/me.2015.66068
Geely Auto. (2010). Geely signs definitive stock purchase agreement with Ford to acquire Volvo Car
Corporation. Retrieved from
http://global.geely.com/2010/03/28/geely-signs-definitive-stock-purchase-agreement-with-ford-to-acquire-v
olvo-car-corporation/
Geely Auto. (2020). Our history. Retrieved from http://global.geely.com/history/
Granstrand, O., & Holgersson, M. (2012). The anatomy of rise and fall of patenting and propensity to patent: The
case of Sweden. International Journal of Intellectual Property Management, 5(2), 169-198.
https://doi.org/10.1504/IJIPM.2012.047503
Guo, B., Li. Q., & Chen, X. (2017). The rise to market leadership of a Chinese automotive firm: the case of
Geely. in The Rise to Market Leadership: New Leading Firms from Emerging Countries. ed. by Malerba, F.,
Mani, S., and Adams, P. Cheltenham: Edward Elgar Publishing Limited, 20-42.
https://doi.org/10.4337/9781783476794.00008
Harvey, S. (2015). The role of mergers and acquisitions in firm performance: A Ghanaian case study. Journal of
Applied Business & Economics, 17(1).
Hitt, M., Harrison, J., Ireland, R., & Best, A. (1998). Attributes of successful and unsuccessful acquisitions of US
firms. British Journal of Management, 9(2), 91-114. https://doi.org/10.1111/1467-8551.00077
Huang, H. (2009). China‟s first transnational auto M&A case with the SAIC-South Korea Shuanglong event.
Journal of Shanghai Business School, 10(2), 21-23.
Hudson, M., Smart, A., & Bourne, M. (2001). Theory and practice in SME performance measurement systems.
International Journal of Operations & Production Management, 21(8), 1096-1115.
https://doi.org/10.1108/EUM0000000005587
IiMedia Research. (2018). Automotive industry: Average asset turnover. Retrieved from
https://data.iimedia.cn/71115/detail/12738320.html
Institute for Mergers, Acquisitions and Alliances. (2019). The great buy-out: M&A in China. Retrieved from
https://imaa-institute.org/great-buy-ma-china/
J. P. Morgan (2019). 2019 global M&A outlook. Retrieved from
https://www.jpmorgan.com/jpmpdf/1320746694177.pdf
J. P. Morgan (2020). 2020 global M&A outlook. Retrieved from
https://www.jpmorgan.com/jpmpdf/1320748081210.pdf
Jagels, M. (2006). Analysis and interpretation of financial statements‟ in Hospitality Management Accounting. ed.
by Jagels, M. New York: Wiley, 99-107.
Kaplan, R., & Norton, D. (1992). The balanced scorecard: The measures that drive performance. Harvard
Business Review, January-February, 71-79.
Kedia, S., & Zhou, X. (2014). Informed trading around acquisitions: Evidence from corporate bonds. Journal of

http://ibr.ccsenet.org International Business Research Vol. 14, No. 7; 2021
56
Financial Markets, 18, 182-205. https://doi.org/10.1016/j.finmar.2013.07.002
King, D., Dalton, D., Daily, C., & Covin, J. (2004). Meta-analyzes of post-acquisition performance: Indications
of unidentified moderators. Strategic Management Journal, 25(2), 187-200. https://doi.org/10.1002/smj.371
Krishnakumar, D., & Sethi, M. (2012). Methodologies used to determine mergers and acquisitions‟ performance.
Academy of Accounting and Financial Studies Journal, 16(3), 75.
Lai, C., Zheng, Y., & Hu, J. (2013). Chinese private automotive companies‟ cross-border M&A performance
evaluation and experience analysis - Case of Zhejiang Geely‟s acquisition of Sweden Volvo. Special Zone
Economy, 7, 48-51.
Lebedev, S., Peng, M., Xie, E., & Stevens, C. (2015). Mergers and acquisitions in and out of emerging
economies. Journal of World Business, 50(4), 651-662. https://doi.org/10.1016/j.jwb.2014.09.003
Lipton, M. (2006). Merger Waves in the 19th, 20th and 21st Centuries. The Davies Lecture, Osgoode Hall Law
School, York University, 14, 21.
Liu, X., & Zou, H. (2008). The impact of greenfield FDI and mergers and acquisitions on innovation in Chinese
high-tech industries. Journal of World Business, 43(3), 352-364. https://doi.org/10.1016/j.jwb.2007.11.004
Ma, J., & Wu, T. (2012). Feasibility study on the current overseas mergers and acquisitions of Chinese
automobile enterprises: Based on the analysis of Geely's acquisition of Volvo. Modern Property
Management, 12, 75-77.
Malik, M., Anuar, M., Khan, S., & Khan, F. (2014). Mergers and acquisitions: A conceptual review. International
Journal of Accounting and Financial Reporting, 4(2), 520-533. https://doi.org/10.5296/ijafr.v4i2.6623
McKinsey & Company. (2017). A pocket guide to Chinese cross-border M&A. Retrieved from
http://mckinseychina.com/wp-content/uploads/2017/04/McKinsey_A-Pocket-Guide-to-Chinese-Cross-Bord
er-MA-English.pdf
Meeks, G. (1977). Disappointing marriage: A study of the gains from merger. Cambridge: Cambridge University
Press.
Mohil, S., Nayyar, R., & Patro, A. (2020). When is informed trading more prevalent?—An examination of
options trading around Indian M&A announcements. Journal of Future Markets, 40(6), 1011-1029.
https://doi.org/10.1002/fut.22102
Neely, A., Gregory, M., & Platts, K. (1995). Performance measurement system design: A literature review and
research agenda. International Journal of Operations & Production Management, 15(4), 80-116.
https://doi.org/10.1108/01443579510083622
Ongena, S., & Penas, M. (2009). „Bondholders‟ wealth effects in domestic and cross-border bank mergers.
Journal of Financial Stability, 5(3), 256-271. https://doi.org/10.1016/j.jfs.2008.08.003
Paterson, A., Leung, D., Jackson, W., Maclntosh, R., & O‟Gorman, K. (2016). Research methods for accounting
and finance. Oxford: Goodfellow Publishers Limited. https://doi.org/10.23912/978-1-910158-88-3-3090
Perepeczo, A. (2007). Event study in the evaluation of effects of mergers and acquisitions. Folia Oeconomica
Stetinensia, 6(1), 107-122. https://doi.org/10.2478/v10031-007-0007-2
Rakita, B., & Markovic, D. (2014). The prospects of international acquisitions in car industry during the global
economic crisis - The case of Geely Volvo. Journal of Economic and Social Development 1(1), 159-170.
Ren, G. (2013). Financial performance analysis of enterprise M&A: Taking Geely's acquisition of Volvo as an
example. Friends of Accounting, 28, 65-68.
Roberts, A., Wallace, W., & Moles, P. (2010). Mergers and Acquisitions. Edinburgh: Edinburgh Business School
Herriot-Watt University.
Santos, J., & Brito, L. (2012). Toward a subjective measurement model for firm performance. BAR-Brazilian
Administration Review, 9(SPE), 95-117. https://doi.org/10.1590/S1807-76922012000500007
Saunders, M., Lewis, P., & Thornhill, A. (2019). Research methods for business students (8th ed.) Harlow:
Pearson Education Limited.
Shaker, N. (2010). Internationalization strategies of the Chinese automotive industry: Challenges and a plan for
going global. Master‟s thesis. Trollhättan: University West.
Sitthipongpanich, T. (2011). Understanding the event study. Journal of Business Administration, 34(130), 59-68.

http://ibr.ccsenet.org International Business Research Vol. 14, No. 7; 2021
57
Stanton, R. (1987). Accounting rates of return as measures of post-merger performance. Australian Journal of
Business, 12, 293-394. https://doi.org/10.1177/031289628701200209
Su, J., & Liu, J. (2013). Research on the motivation of Chinese enterprises‟ mergers and acquisitions: Based on
the comparison between Western theories and Chinese enterprises. Nankai Business Review, 16(2), 57-63.
Sun, S., Peng, M., Ren, B., & Yan, D. (2012). A comparative ownership advantage framework for cross-border
M&As: The rise of Chinese and Indian MNEs. Journal of World Business, 47(1), 4-16.
https://doi.org/10.1016/j.jwb.2010.10.015
Trautwein, F. (1990). Merger motives and merger prescriptions. Strategic Management Journal, 11(4), 283-295.
https://doi.org/10.1002/smj.4250110404
Tuch, C. & O'Sullivan, N. (2007). The impact of acquisitions on firm performance: A review of the
evidence. International journal of management reviews, 9(2), 141-170.
https://doi.org/10.1111/j.1468-2370.2007.00206.x
U.S. Department of the Treasury. (2020). Daily treasury yield curve rates. Retrieved April 2, 2020, from
https://www.treasury.gov/resource-centre/data-chart-centre/interest-rates/Pages/TextView.aspx?data=yieldY
ear&year=2009>
UK Data Archive. (2011). Managing and sharing data: Best practice for researchers. Retrieved from
https://ukdataservice.ac.uk/media/622417/managingsharing.pdf
Ungureanu, M., Frasineanu, C., Nedelut, M., & Ioanas, C. (2013). The use of the financial rates to analyze and
interpret the financial statements. Metalurgia International, 18(5), 248.
WritePass. (2012). How to write a dissertation methodology. Retrieved from
https://writepass.com/journal/2017/08/write-methodology-dissertation-help/
Yakob, R., Nakamura, H., & Ström, P. (2018). Chinese foreign acquisitions aimed for strategic asset-creation and
innovation upgrading: The case of Geely and Volvo Cars. Technovation, 70, 59-72.
https://doi.org/10.1016/j.technovation.2018.02.011
Yin, R. (2018). Case study research and applications: Design and methods (6th ed.) London: Sage.
Zhang, C. (2017). Chinese outbound mergers and acquisitions: The case of Geely’s acquisition of Volvo.
Unpublished Master‟s thesis. London: Cass Business School
Zhejiang Geely Holding Group. (2020). Geely history. Retrieved from http://zgh.com/geely-history/?lang=en
Zollo, M., & Degenhard, M. (2007). Understanding the performance of corporate acquisitions. INSEAD
Working Paper. https://doi.org/10.2139/ssrn.1032168
Copyrights
Copyright for this article is retained by the author(s), with first publication rights granted to the journal.
This is an open-access article distributed under the terms and conditions of the Creative Commons Attribution
license (http://creativecommons.org/licenses/by/4.0/).