the effects of reform scenarios for unemploymet benefits ... · for reforming the unemployment...
TRANSCRIPT

Unclassified ECO/WKP(2016)34 Organisation de Coopération et de Développement Économiques Organisation for Economic Co-operation and Development 06-Jul-2016
___________________________________________________________________________________________
_____________ English - Or. English ECONOMICS DEPARTMENT
THE EFFECTS OF REFORM SCENARIOS FOR UNEMPLOYMENT BENEFITS AND SOCIAL
ASSISTANCE ON WORK INCENTIVES AND POVERTY IN LITHUANIA
ECONOMICS DEPARTMENT WORKING PAPERS No. 1310
By Jekaterina Navickė, Silvia Avram and Lilas Demmou
OECD Working Papers should not be reported as representing the official views of the OECD or of its member
countries. The opinions expressed and arguments employed are those of the author(s)
Authorised for publication by Robert Ford, Deputy Director, Country Studies Branch, Economics Department.
All Economics Department Working Papers are available at www.oecd.org/eco/workingpapers
JT03399066
Complete document available on OLIS in its original format
This document and any map included herein are without prejudice to the status of or sovereignty over any territory, to the delimitation of
international frontiers and boundaries and to the name of any territory, city or area.
EC
O/W
KP
(20
16)3
4
Un
classified
En
glish
- Or. E
ng
lish
Cancels & replaces the same document of 04 July 2016

ECO/WKP(2016)34
2
OECD Working Papers should not be reported as representing the official views of the OECD or of its member countries. The opinions expressed and arguments employed are those of the author. Working Papers describe preliminary results or research in progress by the author(s) and are published to stimulate discussion on a broad range of issues on which the OECD works. Comments on Working Papers are welcomed, and may be sent to OECD Economics Department, 2 rue André Pascal, 75775 Paris Cedex 16, France, or by e-mail to [email protected]. All Economics Department Working Papers are available at www.oecd.org/eco/workingpapers.
This document and any map included herein are without prejudice to the status of or sovereignty over any territory, to the delimitation of international frontiers and boundaries and to the name of any territory, city or area. The statistical data for Israel are supplied by and under the responsibility of the relevant Israeli authorities. The use of such data by the OECD is without prejudice to the status of the Golan Heights, East Jerusalem and Israeli settlements in the West Bank under the terms of international law.
© OECD (2016)
You can copy, download or print OECD content for your own use, and you can include excerpts from OECD publications, databases and multimedia products in your own documents, presentations, blogs, websites and teaching materials, provided that suitable acknowledgment of OECD as source and copyright owner is given. All requests for commercial use and translation rights should be submitted to [email protected]

ECO/WKP(2016)34
3
Abstract/Résumé
The effects of reform scenarios for unemployment benefits and social assistance
on financial incentives to work and poverty in Lithuania
In 2015 the Lithuanian government launched an ambitious Social Model reform agenda aimed at balancing flexibility
of the labour market and security provided through the system of social protection. We simulate alternative scenarios
for reforming the unemployment benefit and cash social assistance systems in Lithuania. We first analyse a reform of
the social insurance unemployment benefit along the lines currently proposed by the Lithuanian authorities within the
new “Social Model”. The social assistance reforms were left outside of the Social Model. However, social assistance,
as currently designed, has strong negative effects on the work incentives of the recipients. We construct and consider
several reform scenarios: extending the current system of in-work payments; establishing earnings disregards; and
modifying the equivalence scale for family. We look at the effects of reforms on financial incentives to search and
accept a vacancy as measured by the share of additional income that is taxed away through direct taxes, social
insurance contributions or through benefit withdrawal when increasing labour supply (effective marginal tax rate).
We also investigate the impact of reforms on poverty, income distribution as well as their first-order financial costs.
We use microsimulation techniques applied to a representative sample of Lithuanian households. Our simulations are
carried out using EUROMOD –a static tax-benefit microsimulation model developed for the European Union. The
model uses micro-data from the 2012 Lithuanian component of the European Union-Survey of Income and Living
Conditions (SILC).
This Working Paper relates to the 2016 OECD Economic Survey of Lithuania
(www.oecd.org/eco/surveys/economic-survey-lithuania.htm).
Key words: Unemployment benefits, social assistance benefits, in-work benefits, simulations, Effective tax rate,
Survey on Income and Living conditions (SILC), EUROMOD
JEL: J2, I3, J6, D3, D04
******
Les effets de différents scénarios de réforme des assurances chômage et aides sociales
sur les incitations financières au travail et la pauvreté en Lituanie
En 2015, le gouvernement Lituanien a lancé un programme de réforme ambitieux du modèle social visant à trouver
un équilibre entre flexibilité de la législation du marché du travail et sécurité fournie par le système de protection
sociale. Nous simulons des scénarios alternatifs de réformes des allocations d’assurance chômage et du régime d’aide
sociale (allocations payées sous forme d’aide en liquidités) en Lituanie. Nous analysons d'abord les effets d’une
réforme de l'allocation d'assurance chômage selon les lignes actuellement proposées par les autorités lituaniennes
dans le cadre du nouveau « Modèle Social ». Ce nouveau modèle social ne prévoit pas de reformes de l'aide sociale.
Toutefois, le régime d’aide sociale, tel qu'il est actuellement conçu, a des effets fortement négatifs sur les incitations
au travail des bénéficiaires. Nous construisons et considérons plusieurs scénarios de réforme du régime d’aide social:
une extension du système de prestations liées à l’exercice d’un emploi; la mise en place de mesures d’exemptions de
rémunération; et une réforme du facteur d‘équivalence tenant compte de la taille des familles lors de l’octroi des
allocations. Nous examinons les effets des réformes sur les incitations financières à rechercher et accepter un poste tel
que mesuré par la part du revenu supplémentaire qui est effectivement imposé via les impôts directs, les cotisations
d'assurance sociale ou par le retrait des prestations (taux effectif marginal d'imposition). Nous étudions également
l'impact des réformes sur la pauvreté, la répartition des revenus ainsi que leurs coûts financiers (de premier tour).
Nous utilisons des techniques de microsimulation appliqués à un échantillon représentatif des ménages lituaniens.
Nos simulations sont effectuées à l'aide du modèle statique de micro-simulation des taxes et prestations sociales
EUROMOD développé pour l'Union européenne. Le modèle utilise des micro-données tirées de l’enquête de l’Union
Européenne sur les conditions de revenu et de vie (SILC) 2012.
Ce document de travail se rapporte à l’Étude économique de l’OCDE de la Lituanie 2016
(www.oecd.org/fr/eco/etudes/etude-economique-lituanie.htm).
Mots clés: Allocation d’assurance chômage, aide sociale, prestations liées à l’exercice d’un emploi,
simulations, taux de taxation effective, Enquête sur le revenu et les conditions de vie (SILC), EUROMOD.
Classification JEL : J2, I3, J6, D3, D04

ECO/WKP(2016)34
4
TABLE OF CONTENTS
THE EFFECTS OF REFORM SCENARIOS FOR UNEMPLOYMENT BENEFITS AND SOCIAL
ASSISTANCE ON FINANCIAL INCENTIVES TO WORK AND POVERTY IN LITHUANIA .............. 6
Introduction .................................................................................................................................................. 6 Brief overview of the Lithuanian labour market .......................................................................................... 8 Reform of the unemployment benefit system ............................................................................................ 10
Current characteristics of the unemployment benefit system ................................................................. 10 Characteristics of the reform .................................................................................................................. 12 Methodology .......................................................................................................................................... 12 Impact of the unemployment insurance reform on the replacement rate ............................................... 15 Impact of the unemployment insurance reform on the replacement rate at the household level ........... 16 Impact of the reform on the participation tax rate .................................................................................. 17 Effect of the unemployment benefit reform on disposable income and inequality ................................ 19
Reform scenarios of the social assistance scheme ..................................................................................... 19 Characteristics of the current social assistance benefit system .............................................................. 19 First reform option: extending the in-work benefit scheme ................................................................... 21 Second reform scenario: introducing income disregards ....................................................................... 26 Third reform scenario: re-designing support for large families ............................................................. 30
Macro-level costs and benefits ................................................................................................................... 35 Impact on the coverage of social protection ........................................................................................... 35 Impact on the budgetary cost.................................................................................................................. 36
Conclusions ................................................................................................................................................ 38
BIBLIOGRAPHY ......................................................................................................................................... 40
ANNEX 1: CHARACTERISTICS OF THE CURRENT SYSTEM OF SOCIAL ASSISTANCE, SYSTEM
BEFORE 2012 AND ANALYSED REFORM DESIGNS ........................................................................... 43
ANNEX 2: INDICATORS OF FINANCIAL INCENTIVES TO WORK AT THE EXTENSIVE
MARGIN: SCENARIOS B AND C .............................................................................................................. 44
Tables
1. Characteristics of the current and proposed model ................................................................................ 12 2. Average national gross wage - all economy with individual enterprises, in EUR ................................. 12 3. Mean and cut point of net earnings’ quintiles in EUR per month: ........................................................ 16 4. Recipients and expenditure on cash social assistance and additional payments for long-term SA
recipients on finding a job, 2013-2014 ...................................................................................................... 23 5. Recipients of cash social assistance and additional payments for long-term recipients on finding a job,
2014 ........................................................................................................................................................... 23 6. Third scenario: main assumptions.......................................................................................................... 31 7. State supported income as % of the median eq. household disposable income and monthly minimums
salary .......................................................................................................................................................... 32
ECO/WKP(2016)34
5
Figures
1. The risk of unemployment is comparatively high in Lithuania ............................................................... 8 2. The social assistance system is an important income buffer for joblessness ......................................... 10 3. NRR1s for unemployment benefits by earnings quintile and month of receipt before and after the
reform ......................................................................................................................................................... 15 4. Average annual NRR1s for unemployment benefits by earnings quintile before/ after the reform and
relative change ........................................................................................................................................... 16 5. Total annual NRR2s by quintile of earnings before and after the reform .............................................. 17 6. Average annual PTRs before and after the reform by earnings decile and by family type ................... 18 7. Change in the total household disposable income by income decile ..................................................... 19 8. Number of recipients and total expenditure on social assistance in-work payments ............................. 22 9. Change in amounts of social assistance with growth in net earnings for singles and couples previously
unemployed for 6-12 months ..................................................................................................................... 24 10. Average change in PTR in the total population ................................................................................... 25 11. Change in the household disposable income by income deciles .......................................................... 25 12. Change in amounts of social assistance with growth in net earnings for singles and couples ............. 27 13. METR among those with positive employment income and among social assistance recipients,
current situation ......................................................................................................................................... 28 14. Change in the marginal effective tax rates among social assistance recipients by family type ........... 29 15. Change in the marginal effective tax rates by income decile ............................................................... 29 16. Changes in the eq. household disposable income due to reform by deciles of household disposable
income and family type .............................................................................................................................. 30 17. Change in amounts of social assistance with growth in net earnings for singles and couples ............. 33 18. Change in the marginal effective tax rates ........................................................................................... 34 19. Changes in the eq. household disposable income due to reform ......................................................... 35 20. Effects of different scenarios on the number of recipients of out-of-work benefits ............................ 36 21. Effects of different reform scenarios on expenditure ........................................................................... 37 22. Potential effects of the reform scenarios on the at-risk-of-poverty gap, rate and inequality ............... 38
Boxes
Box 1. Unemployment social insurance benefit in Lithuania (current - as of December 1st 2015) ........... 11
Box 2. Measures of financial incentives to take a job for unemployed ..................................................... 14 Box 3. Social assistance benefit in Lithuania (as of December 1
st 2015) .................................................. 20
Box 4. Measures of work incentives for social assistance recipients ........................................................ 21

ECO/WKP(2016)34
6
THE EFFECTS OF REFORM SCENARIOS FOR UNEMPLOYMENT BENEFITS AND SOCIAL
ASSISTANCE ON FINANCIAL INCENTIVES TO WORK AND POVERTY IN LITHUANIA
by Jekaterina Navickė, Silvia Avram and Lilas Demmou1
Introduction
1. With one out of five persons at risk of poverty, fighting poverty and inequality is a major
challenge in Lithuania. A starting point to promote inclusiveness is to establish institutions that are
conducive to better labour market performances as being in work is often an important way to exit poverty
(OECD, 2015). The design of out-of-work benefits is especially important as they provide a minimum
income buffer and affect participation in the labour market which is an important factor to exit poverty
(OECD, 2015). Out-of-work benefits should optimally provide both adequate levels of social protection
and sufficient financial incentives to work (Immervoll and Pearson, 2009). Against that background this
paper discusses potential directions for reforming unemployment insurance and social assistance benefits
in Lithuania.
2. In 2015 the Lithuanian Ministry of Social Security and Labour commissioned a group of
researchers from the three major Lithuanian academic institutions to analyze potential reforms of the
system of social protection (Vilnius University, Mikolas Riomeris University, Lithuanian Social Research
Centre; see Socialinis modelis, 2015). The result is a set of reform proposals collectively called the new
Social model for Lithuania. The proposed reform is aimed at increasing the flexibility of the Lithuanian
labour market through a more liberal labour code, while providing more security through the system of
cash social benefits, social insurance benefits in particular. The first contribution of this paper is to present
the potential impact of a reform of unemployment benefit system along the lines planned by the authorities.
We especially look at the impacts on the replacement rate, the incentives to work and income inequality.
3. The sphere of social assistance remains outside of the reform package, as an important reform
was already implemented in 2012. However, additional directions for reform are discussed considering the
high level of poverty in Lithuania and the importance of the social assistance system in shaping work
incentives for those with the lowest incomes.2 Previous research on Lithuania suggests that financial
incentives to work more (measured by effective taxation) are relatively high in the middle and upper part
of the Lithuanian income distribution and are substantially lower for people in the lower income quintiles
(Tamašauskienė 2003, Lazutka & Poviliūnas 2010, UNDP 2010, Lazutka et al. 2013, Jara & Tumino 2013,
Navickė & Lazutka 2015). Such a regressive profile of work incentives is not atypical in comparative
perspective (see e.g. Jara & Tumino 2013). It is due mainly to the withdrawal of cash social assistance
benefits when income increases, a narrow gap between in-work income and cash benefit provisions and
flat tax-rate systems of personal income taxation and social insurance contributions (Navickė & Lazutka
2015). The second contribution of this paper is to analyse possible reforms of cash social assistance
benefits in Lithuania aimed at delivering stronger support for the most in need while providing stronger
incentives to participate in the labour market (i.e. by allowing recipients to keep a larger share of the extra
earned income and making work pay). We consider three reforms scenario of the social assistance benefit
system characterized by different parameters regarding the coverage, the level of benefits and the design of
in-work benefits. In the first scenario, we examine an extension of in-work payments for social assistance
1. Jekaterina Navicke is researcher at Vilnius University, Silvia Avram is researcher at Essex University and
Lilas Demmou is senior economist at the OECD. The authors would like to thank for their comments
Herwig Immervoll, Nicolas Ruiz, Ann Vourch, Ben Westmore and Andreas Wörgötter. Special thanks to
Corinne Chanteloup, Sisse Nielsen and Heloise Wickramanayake for statistical and editorial support.
2. Details on the reform can be found in Lazutka (2014).

ECO/WKP(2016)34
7
recipients; in the second scenario we look at the introduction of income disregards and in the last scenario,
we investigate the effects of a change in the design of cash social assistance benefits.
4. We estimate the effect of our reforms scenarios on work incentives and on the income
distribution using microsimulation techniques applied to a representative sample of Lithuanian households.
Our simulations are carried out using EUROMOD version 2.75+ (Sutherland & Figari 2013). EUROMOD
is a static tax-benefit microsimulation model developed for the European Union, which is based on
household and individual micro-data and allows for the simulation of direct taxes, social insurance
contributions as well as of a large number of benefits, including unemployment benefits and social
assistance. Labour market income and other non-simulated income sources are taken directly from the data
and updated based on average growth. Information on average growth by income source is obtained from
administrative sources or official projections. For our simulations, we use micro-data from the 2012
Lithuanian component of the European Union-Survey of Income and Living Conditions3. EUROMOD
models the intended functioning of the system as if the reforms were introduced in 2015. As our data refers
to a period when Lithuania was still in the midst of the economic and labour market crisis, the estimates of
the impact on poverty, inequality and costs of the analysed reforms are presented and should be interpreted
in relative terms. Our simulations assume full benefit take-up and tax compliance.
5. EUROMOD is an a static microsimulation model meaning that it helps estimate first-order
effects of the reforms assuming that individual behavior will not change as a result of the reform. This
approach is standard in the evaluation of distributional changes of tax and benefit reforms and allows
highlighting the winners and losers of a reform. The assumption of unchanged behaviors may appear quite
restrictive at a first stance but it is fully consistent with the existence of behavioral response under some
conditions. It has in particular proven to provide a good approximation of welfare effect when changes are
small and individuals are not rational optimizers (Bourguignon and Spadaro, 2006). Behavioral responses
may also be limited by demand constraints (for ex: unavailability of part-time jobs, fixed working hours
etc.). A large part of our analysis focuses on calculating work incentives, which are generally used to
determine behavioral reactions (and so are unaffected by them). However, behavioral responses are likely
to be more important when analyzing macro and distributional effects such as budgetary effects or the
impact of reforms on poverty rates (based on a pre-determined threshold).
6. We calculate a series of indicators, which are slightly different in the case of the unemployment
benefit reform and in the case of social assistance reforms. First, we calculate a series of work incentives
indicators. These are net replacement rates (NRRs), participation tax rates (PTRs) and marginal effective
tax rates (METRs)4. Second, we look at the impact of reforms on the income distribution by looking at
three dimensions: disposable income, poverty indicators and GINI indicators.
7. In the next section we present briefly the situation of the labour market in Lithuania and the role
played by unemployment and social benefits systems in case of job loss. Next, we present the potential
effect of a reform of the unemployment benefit system. In the third section, we discuss the different reform
scenarios of the social assistance system. In the case of each reform, we look at the impact on net earnings,
work incentives, and disposable income, both at the individual and household levels. Finally we present the
potential macro-cost and benefits of those reforms.
3. The current system is simulated as of the 30
th of June 2015.
4. Worth noting that the OECD indicators of work incentives for model families are largely consistent with
the EUROMOD-based estimates (Navicke & Lazutka, 2015). The two sources of information differ,
however, as in the first case impact is evaluated among the model families with pre-selected characteristics,
while EUROMOD helps model the effect on the actual population as captured by the EU-SILC.

ECO/WKP(2016)34
8
Brief overview of the Lithuanian labour market
8. The Lithuanian labour market has been hit hard by the recent economic crisis but has quickly
recovered. The unemployment rate has halved since the crisis and it was below 9% in 2015, after having
peaked at 18% in 2010. The current level remains higher than the OECD average and the gap is even
higher for some specific groups, in particular youth, the low-skilled and seniors. This picture implies that
the risk of unemployment is comparatively high in Lithuania. Overall, job destructions during the last
financial crisis were large and the unemployment rate follows closely the economic cycle suggesting weak
barriers to hiring and firing despite a comparatively restrictive labour code5. The relationship between GDP
and unemployment changes in Lithuania (so-called Okun’s law) is estimated at 0.49 for Lithuania which is
similar to the United States (IMF, 2014; OECD, 2016b).
Figure 1. The risk of unemployment is comparatively high in Lithuania
1. 2013 data for OECD (unweighted average).
Source: OECD Economic Outlook 98 database; Statistics Lithuania database; OECD Labour Market Statistics; OECD Education at a glance database; Eurostat LFS Main indicators database.
9. Against that background, the Lithuanian unemployment insurance benefit system provides weak
support in case of job loss. It is very restrictive by international standards and combines strict eligibility
5. Legislation is however comparatively restrictive. A discussion on that gap between practice and legislation
can be found in Demmou (2016) or OECD (2015b).
0
4
8
12
16
20
24
28
2000 2001 2002 2003 2004 2005 2006 2007 2008 2009 2010 2011 2012 2013 2014- 15
- 10
- 5
0
5
10
15
20
GDP growth and unemployment rate
Real GDP growth (%, left scale) Unemployment rate (% of labour force, right scale)
0
10
20
30
40
50
0
10
20
30
40
50
Total (15-64) Females (15-64) Youth (15-24) Older population (55-64) Low skilled¹(25-64) Long-termunemployment (% oftotal unemployment)
Unemployment rate% of total labour force in each group, 2014
Lithuania OECD
ECO/WKP(2016)34
9
criteria (implying a long minimum contribution period), low duration and a low level of benefits
(Lagenbusher, 2015). The average net replacement rate for low-paid earners (67% of average wage) is for
instance on average 55% compared with an average 63% in the OECD during the initial year of
unemployment. When looking over a five year period, it is on average at 13% compared with 28% in the
OECD (OECD, 2016). Furthermore, less than 20% of the unemployed are covered by the unemployment
benefit system (chapter 2; Lagenbusher, 2015). Youth and people with interrupted careers in particular
encounter more difficulty accessing benefits.
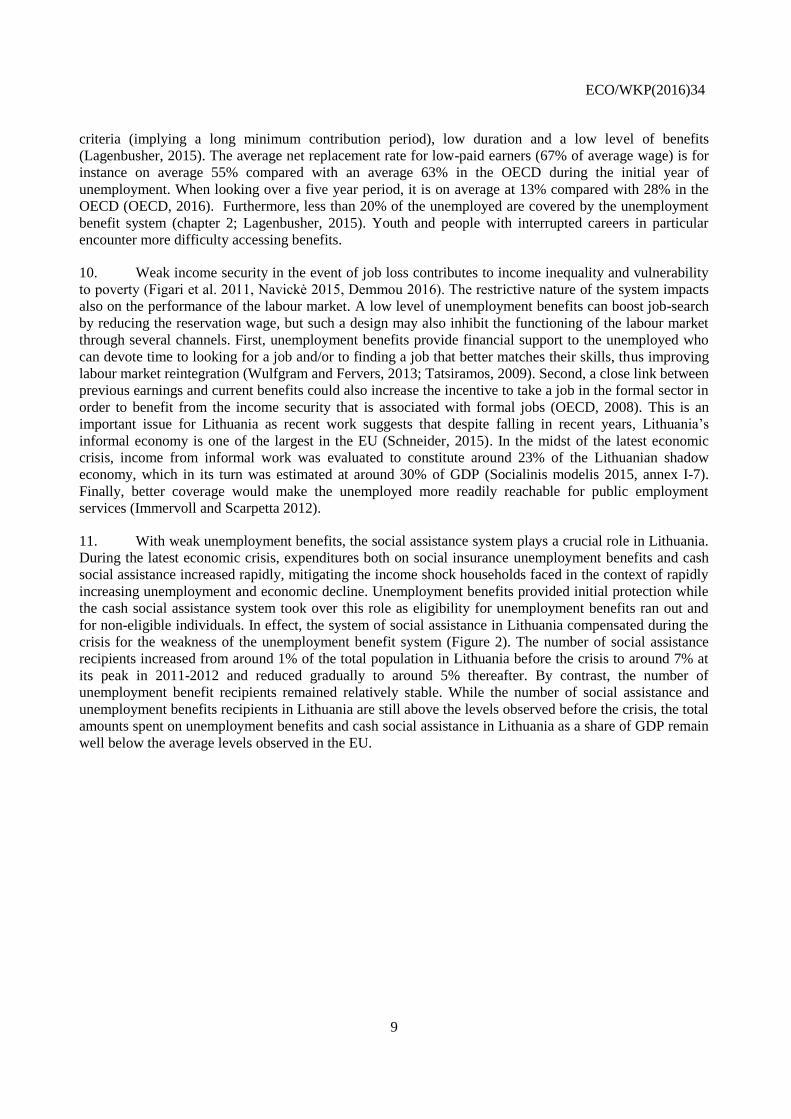
10. Weak income security in the event of job loss contributes to income inequality and vulnerability
to poverty (Figari et al. 2011, Navickė 2015, Demmou 2016). The restrictive nature of the system impacts
also on the performance of the labour market. A low level of unemployment benefits can boost job-search
by reducing the reservation wage, but such a design may also inhibit the functioning of the labour market
through several channels. First, unemployment benefits provide financial support to the unemployed who
can devote time to looking for a job and/or to finding a job that better matches their skills, thus improving
labour market reintegration (Wulfgram and Fervers, 2013; Tatsiramos, 2009). Second, a close link between
previous earnings and current benefits could also increase the incentive to take a job in the formal sector in
order to benefit from the income security that is associated with formal jobs (OECD, 2008). This is an
important issue for Lithuania as recent work suggests that despite falling in recent years, Lithuania’s
informal economy is one of the largest in the EU (Schneider, 2015). In the midst of the latest economic
crisis, income from informal work was evaluated to constitute around 23% of the Lithuanian shadow
economy, which in its turn was estimated at around 30% of GDP (Socialinis modelis 2015, annex I-7).
Finally, better coverage would make the unemployed more readily reachable for public employment
services (Immervoll and Scarpetta 2012).
11. With weak unemployment benefits, the social assistance system plays a crucial role in Lithuania.
During the latest economic crisis, expenditures both on social insurance unemployment benefits and cash
social assistance increased rapidly, mitigating the income shock households faced in the context of rapidly
increasing unemployment and economic decline. Unemployment benefits provided initial protection while
the cash social assistance system took over this role as eligibility for unemployment benefits ran out and
for non-eligible individuals. In effect, the system of social assistance in Lithuania compensated during the
crisis for the weakness of the unemployment benefit system (Figure 2). The number of social assistance
recipients increased from around 1% of the total population in Lithuania before the crisis to around 7% at
its peak in 2011-2012 and reduced gradually to around 5% thereafter. By contrast, the number of
unemployment benefit recipients remained relatively stable. While the number of social assistance and
unemployment benefits recipients in Lithuania are still above the levels observed before the crisis, the total
amounts spent on unemployment benefits and cash social assistance in Lithuania as a share of GDP remain
well below the average levels observed in the EU.

ECO/WKP(2016)34
10
Figure 2. The social assistance system is an important income buffer for joblessness
Notes: UB – cash unemployment benefits, SA- cash social assistance (social exclusion n.e.c. Years excluded if data not available. Averaging across the last decade helps eliminate the volatility of expenditures on cash social benefits due to the recent crisis across the EU.
Source: Eurostat [social exclusion n.e.c. – cash benefits: spr_exp_fex], [unemployment – cash benefits: spr_exp_fun]. Extracted on 12/23/2015.
Reform of the unemployment benefit system
Current characteristics of the unemployment benefit system
12. The unemployment benefit systems contains a redistributive element due to a fixed basic part,
which is estimated in relation to the State Supported Income (SSI) - a parameter also used as a base for the
estimation of social assistance benefits in Lithuania. As a result, the replacement rate decreases as previous
earnings increase. This ensures a relatively high replacement rate in the lower part of the income
distribution. The variable part of the benefits provides a link with previous earnings, although its initial
replacement rate is low at 40% and reduces to 20% of the previous insured income after three months (see
Box 1). Weak links between the level of previous earnings and unemployment benefit payments in
0
50
100
150
200
250
0
50
100
150
200
250
2007 2008 2009 2010 2011 2012 2013 2014
ThousandEUR million
Expenditure and annual number of recipients of unemployment benefits and social assistance in Lithuania
SA expenditure UB expenditure
SA recipients (right scale) UB recipients (right scale)
0.0
0.5
1.0
1.5
2.0
2.5
3.0
3.5
4.0
0.0
0.5
1.0
1.5
2.0
2.5
3.0
3.5
4.0
HR
V
ES
T
BG
R
MLT
PO
L
RO
U
HU
N
LTU
LVA
GR
C
CZ
E
SV
N
SV
K
ITA
GB
R
AU
T
SW
E
LUX
PR
T
DE
U
EU
27
EU
15
DN
K
FIN
FR
A
IRL
NLD
ES
P
BE
L
International comparison: expenditure as % of GDP, 2004-13
Social assistance
Unemployment benefits

ECO/WKP(2016)34
11
Lithuania result in a relatively high financial incentive to take a job especially in the middle and higher part
of the distribution. At the same time, such a design compromises benefit adequacy, can result in shorter job
search and poorer job match, and may also reduce the incentives to participate in the formal labour market.
Box 1. Unemployment social insurance benefit in Lithuania (current - as of December 1st
2015)
Eligibility to unemployment benefits
The unemployment social insurance benefit (nedarbo draudimo išmoka) is organized via a compulsory insurance system and covers individuals receiving remuneration for work. Eligible persons are working age persons, aged 16 up to the statutory retirement age. The required insurance record is at least 18 months during the last 36 months and a person must be actively looking for a job.
Duration of unemployment benefits
The duration of benefit payments depends on the unemployment insurance history:
6 months – if the insurance record is less than 25 years;
7 months – if the insurance record is between 25 and 29 years;
8 months – if the insurance record is between 30 and 34 years;
9 months – if the insurance record is 35 years or more.
The duration of the payment can be extended by two months when the unemployed is close the retirement age (no more than five years), or by the duration of the leave when the unemployed has been on sick leave or maternity leave while eligible for unemployment benefit payments.
Level of unemployment benefits
The monthly benefit amount (U) comprises fixed (F) and variable (V) components (U=F+V). The fixed benefit component is equal to the State supported income (SSI) and the variable benefit component is equal to 40% of the former insured income.
The level of unemployment benefit is reduced with the duration of the unemployment spell:
During the first three months – U is paid in full.
For the remaining unemployment duration period: U = F+0.5*V (fixed component plus 50% of the variable component).
A ceiling for the full unemployment benefit applies, i.e.: U<=0.7*CYI, where CYI stands for the level of the current year’s insured income set by law. The ceiling is applicable during the entire period of benefit payment. The benefit is not means tested.
Current year’s insured income 2011-2015, EUR
2011 2012 2013 2014 2015 2016
Current year’s insured income (CYI) 339 431 431 431 431 445
Note: Exchange rate of 3.4528 applied for conversion of the CYI to EUR up to 2015, rounded up values
Unemployment benefits may be received simultaneously with a number of other social insurance benefits but the unemployment benefit is reduced by the amount of these other benefits: state social assistance benefits/pensions or state pensions (except survivor and orphan pensions), work incapacity periodical compensations due to occupational injuries and occupational diseases, vocational rehabilitation, maternity, paternity or maternity (paternity) social insurance benefits. The unemployment benefit cannot be paid together with the old-age pension or early retirement pension.
Source: EUROMOD Country Report for Lithuania. Available at: https://www.iser.essex.ac.uk/euromod/using-euromod/country-reports

ECO/WKP(2016)34
12
Characteristics of the reform
13. The objective of the reform is to strengthen the income protection of the unemployed by
increasing the level, the duration and the coverage of benefits (Table 1). The reform aims also at
strengthening the links with previous earnings to motivate participation in the formal economy and in the
social insurance system in particular.
Table 1. Characteristics of the current and proposed model
Current system Planned reform Benefit amount
Constant part: state-supported income (set at 102 euros) Variable part: - 40% of former earnings during the first three months - 20% of the former earnings after three months.
Constant part: 30% of the minimum monthly wage Variable part:
- 50% of former earnings during the first three months - 40% between the fourth and sixth month, - 30% between the seventh and ninth month
Benefit ceiling 70% of CYI (see Box 1) 75% of the gross average wage (see Table 2)
Duration - 6 months – if the insurance record is less than 25 years; - 7 months (insurance record 25-29 years); - 8 months (insurance record 30-34 years); - 9 months (insurance record 35+ years). + extra 2 months for special groups
9 months + extra 2 months for special groups
Required contribution history
24 months during the previous 36 months 12 months during the last 24 months
Table 2. Average national gross wage (ANGW) - all economy with individual enterprises, in EUR
2014q1 2014q2 2014q3 2014q4 2015q1 2015q2
ANGW 655.3 667.1 681.4 699.2 686.4 700.9
Source: Statistics Lithuania - http://osp.stat.gov.lt/ [accessed on 2015.11.09]
Methodology
14. To understand the work incentives provided by the unemployment benefit system, we first show
net replacement rates provided by unemployment benefits relative to lost earnings (NNR1), both for the
current system and the proposed reform. This provides information on the wage level relative to the
previous wage at which it would make financial sense to enter new employment while in receipt of
unemployment benefits. We also discuss interactions with other elements of the tax benefit system and
other market incomes by providing the overall net replacement rates (NNR2), i.e. calculating the
proportion of previous disposable income that is kept when unemployed and showing which sources of
income play the most important role in providing resources to the unemployed. Next, we look at the
participation tax rates (PTRs) which can be interpreted as the fraction of earnings taxed away through
taxes, social insurance contributions and withdrawal of benefits if the unemployed person finds a job with
a salary level equal to earnings before unemployment. Both NRR2 and PTR indicators are calculated as
yearly averages and take into account all income sources of all the household members, including the
unemployed person.
15. The main difficulty for the simulations is to compare the income of individuals when they are at
work with their potential revenue when unemployed. This requires having information on the eligibility of
each worker to unemployment benefits and their level of earnings and to make assumptions on the length

ECO/WKP(2016)34
13
of unemployment for individuals who lose their jobs. In the dataset we observe periods of employment,
unemployment and inactivity only during a year, we do not observe a wage for individuals who are
currently unemployed and we do not have information on the contribution records over the qualifying
period (36 months). Hence, we make the following assumptions:
We can only calculate replacement rate for individuals who are employed for some period in our
dataset. This allows us to avoid estimating shadow wages for people who are not in employment
(and whose potential wage is thus unobserved). It should be acknowledged that excluding those
with no observed earnings may results in a biased estimate of work-incentive indicators in the
total population as the potential earnings of this group can systematically differ compared to
those with observed earnings. While we do not correct for the potential selection bias, the work
incentives are disaggregated into five quintiles by earnings size. The level of employment in the
reference year of our data (2012 SILC refers to 2011 incomes) was at 66.9% compared to 73.4%
in the target year of simulations, i.e. 20156.
We assume that the length of the unemployment spell is equal to that of the observed spell of
employment, i.e. periods of inactivity are unaltered and periods of unemployment in the baseline
become periods of inactivity. We simulate tax liabilities, benefit entitlements and household
disposable income for each individual who is observed to be in employment for at least 1 month
in our dataset. We then re-compute the same tax liabilities, benefit entitlements and household
disposable income under the assumption that the person becomes unemployed for the same
amount of time she has been observed in employment.
One way EUROMOD simulations get around the problems of unobserved contribution histories
is to assume that the observed insurance record within the 12 months is proportional to the whole
qualifying period. In our case however, this assumption is not sufficient as both the currently
required insurance record (18 months within the last 36 months) and that of the reformed system
(12 months within the last 24 months) constitute half of the total qualifying period. To overcome
this limitation and in absence of administrative data on the distribution of the insurance records
among the unemployed, we make the following assumptions. First, based on the data from the
latest wave of the longitudinal EU-SILC component for Lithuania, the share of those with an
insurance record between 12 and 18 months was calculated among those who become
unemployed in the final year of the panel. While the share of people with such insurance records
may differ along a number of characteristics (e.g. age, region, sphere of employment), we
disaggregate only by education and gender, as these two dimensions proved to be the most
salient. A more detailed split was not possible due to too low sample sizes observed in the data.
Using this information, we then randomly select in our data individuals who are unemployed but
not entitled to unemployment benefits under the current system to be eligible for unemployment
benefits in the reform system (i.e. 23% of males with non-tertiary education, 5% of females with
tertiary education and 10% of males with tertiary education and females with non-tertiary
education).
6. Eurostat (2016). Employment and activity – LFS adjusted series [lfsi_empl]. Database. Online source
[accessed on 17/05/2016].

ECO/WKP(2016)34
14
Box 2. Measures of financial incentives to take a job for unemployed
1) NRR1: The level and change in the share of lost earnings replaced by the unemployment benefit
across five quintiles of individual earnings
𝑁𝑅𝑅1𝑖 =𝑈𝐵𝑖
𝐸𝑖⁄ , for every employed individual 𝑖 in our dataset, where UB=individual unemployment
benefit and E=individual gross earnings. We obtain 𝑈𝐵𝑖 by simulating the amount of unemployment
benefit an individual would be entitled to should she become unemployed. We simulate both eligibility and
the amount of unemployment benefits a person is entitled to for every month of the unemployment spell
up to a maximum of 12 months, as well as the average yearly entitlement.
2) NRR2: The level and change in the share of household disposable income when the person is
employed that is kept when the person becomes unemployed
𝑁𝑅𝑅2𝑖 =𝐷𝑃𝐼(𝑈)𝑖
𝐷𝑃𝐼(𝐸)𝑖⁄ , for every individual 𝑖 in our dataset where DPI(U)=equivalised household
disposable income when the person is unemployed and DPI(E) = equivalised household disposable
income when the person is employed; in both cases we equivalise household disposable income using
the modified OECD scale7. We also decompose the NRR2 indicator to show which income sources play a
larger role in providing resources in unemployment. For this purpose, we disaggregate household
disposable income into seven components, which are calculated for each employed individual at the
household level when the individual becomes unemployed. We then show what share of previous
household disposable income is accounted for by each income source
Thus, more formally
𝐷𝑃𝐼(𝑈)𝑖 = ∑ 𝐼(𝑈)𝑘𝑖7𝑘=1 , where 𝐼(𝑈)𝑘 is one of: market incomes, public pensions, non means-tested
benefits (including the unemployment benefit), means tested benefits (including social assistance), minus
direct taxes, minus social insurance contributions paid by employees or minus social insurance
contributions paid by the self-employed, all calculated when the individual is unemployed
𝑁𝑅𝑅2𝑘𝑖 =𝐼(𝑈)𝑘𝑖
𝐷𝑃𝐼(𝐸)𝑖⁄
3) The level and change in the participation tax rate (PTR) which is a measure of work incentives at
the extensive margin:
𝑃𝑇𝑅𝑖 = 1 −𝐷𝑃𝐼(𝐸)𝑖−𝐷𝑃𝐼(𝑈)𝑖
𝐸𝑖, where 𝐷𝑃𝐼(𝐸)𝑖= household disposable income when the person i is employed,
𝐷𝑃𝐼(𝑈)𝑖 is household disposable income when person i is unemployed and 𝐸𝑖 = earnings of individual i.
We decompose the PTR into seven income components in the same way we decompose the NRR2
indicator. More specifically, for each of six income sources: public pensions, non-means-tested benefits,
means-tested benefits, direct taxes, social insurance contributions paid by the employees and social
insurance contributions paid by the self-employed we calculate
𝑃𝑇𝑅𝑘𝑖 =𝐼(𝐸)𝑘𝑖−𝐼(𝑈)𝑘𝑖
𝐸𝑖, where 𝐼𝑘 is one of the six income components described above.
7. This scale gives a weight of 1 to the first adult, 0.5 to the other adults in the household and 0.3 to children
(defined as individuals aged less than 14).

ECO/WKP(2016)34
15
Impact of the unemployment insurance reform on the replacement rate
16. As the replacement rate varies depending on unemployment duration and on earnings, the impact
of the reform on the average replacement rate is analysed by quintile of individual earnings and broken
down by month of receipt. Replacement rates by month are averaged across every quarter of benefit
receipt.
17. The reform would result in increased NRR1s across all earnings quintiles: the level of the
average annual replacement rate increases over the entire distribution of earnings from around 22% to
around 44%. This is due to the increase in the replacement rate of the additional part of the benefit,
increased benefit ceilings and its increased duration. The effect is especially visible for the months 7-9 of
receipt as one of the aims of the reform is to prolong the duration of the benefit (Figure 3).
18. The unemployment benefit is reduced over time to provide higher income stabilization during the
initial months of unemployment and higher incentives to take up a new job thereafter. For instance, during
the initial first three months, NRR1s after the reform reach around 75% in the first three quintiles
(previously around 55%), while the replacement rates drop to around 66% in the following three months
(previously around 46%).
19. The establishment of a ceiling for high earners results in a flat profile of replacement rates for
this group. This implies that financial incentives to take a job for this group are high already starting from
the first months of receiving unemployment benefits both in the current system and in the reform scenario.
This is the case of quintiles 3-5 before the reform and quintiles 4-5 after the reform.
Figure 3. NRR1s for unemployment benefits by earnings quintile and month of receipt before and after the reform
Percent
0
10
20
30
40
50
60
70
80
90
1 2 3 4 5 6 7 8 9 10 11 12
Month
Status quo: 2015Net Replacement Rates, %
0
10
20
30
40
50
60
70
80
90
1 2 3 4 5 6 7 8 9 10 11 12
Month
UB ReformNet Replacement Rates, %
Q1 Q2 Q3 Q4 Q5 Total

ECO/WKP(2016)34
16
Table 3. Mean and cut point of net earnings’ quintiles in EUR per month:
Source: Statistics Lithuania - http://osp.stat.gov.lt/ [accessed on 2015.11.09]
Net earnings quintile: 1 2 3 4 5
Mean 289.3 481.0 668.8 900.4 1568.6
Max 381.9 575.6 771.0 1066.1 3789.5
20. The replacement rates are higher in the lower income quintiles both before and after the reform.
The replacement rate is lower for the higher income quintiles, but in relative terms the reform would imply
a higher increase for this group (Figure 4). This results in a closer link between benefits and earnings after
the reform. The average replacement rate after the reform and during the initial three months in receipt is
around 55% for the 4th quintile (compared to around 33% before the reform) and around 35% for the 5
th
earnings quintile (compared to around 20% before the reform). The gap with previous earning for the
highest quintiles would however remain substantial (at 45%-65%), and hence strong incentives for job
search remain.
Figure 4. Average annual NRR1s for unemployment benefits by earnings quintile before/ after the reform and relative change
% of the previous earnings
Impact of the unemployment insurance reform on the replacement rate at the household level
21. The impact of the reform at the household level, when taking into account the inter-connections
between unemployment benefits and other elements of the social protection system (i.e. means-tested
benefits, taxes, social insurance contributions) as well as the effects of earnings of other household
members, are in line with previous results obtained at the individual level (Figure 5):
The unemployment benefit makes up a higher share of previous disposable income after the
reform for all quintiles (i.e. around 35% on average in the reform scenario compared to
around 20% in the current system). This results in more generous total annual replacement
rates (i.e. on average around 75% versus around 60% in the current system).
0
10
20
30
40
50
60
1 2 3 4 5 Total
UB Replacement Rates, %
Status quo: 2015
0
10
20
30
40
50
60
1 2 3 4 5 Total
UB Replacement Rates, %
UB Reform
0
20
40
60
80
100
120
140
1 2 3 4 5 Total
Change in UB Replacement Rates, %
Relative change

ECO/WKP(2016)34
17
The declining pattern across the income distribution is less pronounced after the reform due
to the increase in the unemployment benefit’s ceilings: the annual average NNR2 in the top
quintile stands at around 55% after the reform versus around 40% in the current system.
Within the context of the widely spread shadow economy in Lithuania this could potentially
increase the motivation to participate in the unemployment social insurance system for those
with high earnings.
Compared to the replacement rate at the individual level (NRR1s), the replacement rate at the
household level (NRR2s) increase less in relative terms at the top of the income distribution.
This is because those at the top usually have more (market) income sources to rely on and
thus can better insure themselves against unemployment shocks. For those living in the
worse-off households, social insurance is more important for mitigating income shock and
preventing poverty risk in case of unemployment
Figure 5. Total annual NRR2s by quintile of earnings before and after the reform
% of the total household disposable income
Impact of the reform on the participation tax rate
22. Financial incentives to take a job are measured by the participation tax rates (PTRs) which
indicates the fraction of earnings taxed away through taxes, social insurance contributions and withdrawal
of benefits if the unemployed person finds work with a salary level equal to earnings before
unemployment.8 The financial disincentives to take a job is higher for those at the bottom of the income
distribution and for those family types where the incidence of cash social assistance is higher (i.e. couples
with many children and single parents). The PTR indicator reaches almost 80% for the first decile, twice
the rate observed at the top, which comes mostly through the system of cash social assistance rather than
8. As previously the indicator is reported in average annual terms, i.e. averaging unemployment benefit
receipt and other income components across a one-year period
-20
0
20
40
60
80
100
1 2 3 4 5 All
2015 earnings quintiles
Status quo: 2015
Net Replacement Rates, %
-20
0
20
40
60
80
100
1 2 3 4 5 All
2015 earnings quintiles
UB reform
Net Replacement Rates, %
Pensions Means-tested benefits Non-means tested benefits Direct taxes
Employee SICs Self-employed SICs Market income Total NRR

ECO/WKP(2016)34
18
unemployment benefits. By contrast, the effects of the unemployment benefit and other income
components are around equally distributed across deciles and family types (Figure 6, Panel A).
23. An increase in the PTRs is expected for all family types due to increased benefit generosity,
higher ceilings and longer duration. The magnitude of an average increase in the PTRs is at around 16 ppts
in the total population. The unemployment benefits reform increases the PTRs for those in the middle and
upper part of the income distribution most, as these groups are those for which unemployment benefits
increase most (Figure 6, Panel B).
24. The system of unemployment benefits interacts with the system of means-tested benefits: the
increase in the generosity of the unemployment benefits will in part be counteracted by withdrawal of
means-tested benefits for those in receipt of social assistance. This effect is stronger for lone parents, large
families and for those at the bottom of the income distribution (Figure 6).
Figure 6. Average annual PTRs before and after the reform by earnings decile and by family type
Note: family types I – for adult, i – for a child, earn- for earner.
0
10
20
30
40
50
60
70
80
1 2 3 4 5 6 7 8 9 10 Total
Average Participation Tax Rates, %
By earnings decile: 2015
0
10
20
30
40
50
60
70
80
One
ear
ner
coup
les,
no
child
ren
One
ear
ner
coup
les
with
1 c
hild
One
ear
ner
coup
les
with
2 c
hild
ren
One
ear
ner
coup
les
with
3+
chi
ldre
n
Tw
o ea
rner
cou
ples
, n
o ch
ildre
n
Tw
o ea
rner
cou
ples
, 1
chi
ld
Tw
o ea
rner
cou
ples
, 2
chi
ldre
n
Tw
o ea
rner
cou
ples
, 3
+ c
hild
ren
Sin
gle
pare
nts
Sin
gle
pers
ons
All
Average Participation Tax Rates, %By family type: 2015
-10
-5
0
5
10
15
20
25
1 2 3 4 5 6 7 8 9 10 Total
Change in average PTRs (ppts)
Change by earnings decile: reform
-10
-5
0
5
10
15
20
25
One
ear
ner
coup
les,
no
child
ren
One
ear
ner
coup
les
with
1 c
hild
One
ear
ner
coup
les
with
2 c
hild
ren
One
ear
ner
coup
les
with
3+
chi
ldre
n
Tw
o ea
rner
cou
ples
, n
o ch
ildre
n
Tw
o ea
rner
cou
ples
, 1
chi
ld
Tw
o ea
rner
cou
ples
, 2
chi
ldre
n
Tw
o ea
rner
cou
ples
, 3
+ c
hild
ren
Sin
gle
pare
nts
Sin
gle
pers
ons
All
Change in average PTRs (ppts)
Change by family type: reform
Means-tested benefits Non-means tested benefits Direct taxes
Employee SICs Self-employed SICs Total change

ECO/WKP(2016)34
19
Effect of the unemployment benefit reform on disposable income and inequality
25. In addition to the work incentives indicators presented above, the distributional effects of the
reforms are calculated. While the effects on the unemployment benefit replacement rates are the most
pronounced among those with highest earnings (see Figure 4), those at the bottom of the income
distribution benefit most from the reform relative to their total disposable income, i.e. relative to their
income before the reform (Figure 7). In addition, the positive distributional effect is likely to be further
strengthened due to the differential prevalence of the risk of unemployment across the income distribution.
26. As previously, individuals at the lowest end of the income distribution who would be eligible for
unemployment benefit would potentially lose their entitlement to social assistance benefits (Figure 7). This
would partly mitigate the positive effect of the reform, especially for the group of families with 3+ children
and single parents.
Figure 7. Change in the total household disposable income by income decile
Percent
Reform scenarios of the social assistance scheme
Characteristics of the current social assistance benefit system
27. Social assistance is the main means-tested element of the Lithuanian system of cash social
benefits. However, the adequacy of the system in providing for basic needs and reducing income poverty
in Lithuania is insufficient despite a significant increase of the SSI just before the crisis (Latzutka 2014).
The social assistance base amount (SSI) is currently set at 102 EUR, which only covers food expenses9. It
made up only around 63% of the at-risk-of-poverty line at 40% of the median equivalized disposable
income in 201310
(2014 SILC). In addition, there is evidence that the design of the current system
generates negative effects on work incentives at the bottom of the income distribution (Navicke & Lazutka
2015).11
9. According to unpublished estimations by Lazutka et al. in scope of the European Reference Budgets
Network: www.referencebudgets.eu.
10. According to estimations by Zabarauskaitė (2008) if updated to 2013 by inflation, absolute poverty was at
around 40% of the median equivalized income in Lithuania, i.e. 160 EUR in 2013 (2014 SILC)
11. Another important point regarding benefit adequacy which is not discussed in this paper but worth to note
is the absence of regular indexation rules of the SSI level which is adjusted on an ad-hoc basis (the last
-5
0
5
10
15
-5
0
5
10
15
1 2 3 4 5 6 7 8 9 10 All
% change in HDI
% change in HDI
2015 HDI deciles
UB reform
Means-tested benefitsNon-means tested benefitsNet total change

ECO/WKP(2016)34
20
28. The social assistance benefit system was reformed in 2012 with a view to reduce expenditure and
improve work incentives among recipients. Some of the measures implied a decline in benefits such as the
reduction of social assistance benefits with time and the introduction of equivalence scales assuming
economies of scales in household spending (in place of the per capita calculations applied before). On the
other hand, the introduction of extra in-work payments for social assistance recipients who have been long-
term unemployed and who found a job provides higher financial incentive to take a job without
undermining benefit adequacy. However, this scheme has been used very little in Lithuania so far.
Box 3. Social assistance benefit in Lithuania (as of December 1st
2015)
The social assistance benefit (socialinė pašalpa) acts as a top-up and a last resort income relief for
those in need in Lithuania. It is granted to families or single persons if they pass established eligibility
criteria, i.e. assets and income tests. The family unit for determining entitlement to social assistance
consists of partners and their own dependent children. Dependent children are persons aged under 18
or under 24 if in full-time education or unemployed; they cannot be married, cohabiting with a partner,
nor parents themselves.
The base for the estimation of social assistance is the amount of State Supported Income (SSI):
2007 2008 2009-2015
State supported income (SSI), EUR
60 83 102 (since 2008.08.01)
102
Source: Based on the relevant version of Government of Lithuanian Republic Resolution „Dėl valstybės
remiamų pajamų dydžio patvirtinimo“.
Note: Exchange rate of 3.4528 applied for conversion of the SSI to EUR up to 2015, rounded up values.
The amount of the social assistance benefit is estimated in the following way:
SA = (SSI – I/n)*eq, (1)
where SSI – level of the State supported income, I – total income of the individual or family, n – number
of family members, eq – the sum of the equivalence scale applied for social assistance. The
equivalence scale applied for determining social assistance benefits allows for the maximum social
assistance amount to reach 100% of SSI only for a single adult or the first family member. The second
family member is eligible for assistance at 80% of SSI, while third and subsequent members at 70% of
SSI. Before the reform of social assistance in 2012 the maximum level of assistance for an individual /
family member was at 90% of SSI.
This implies the following relation between assistance withdrawal and extra income:
∆𝑆𝐴 = (𝑆𝑆𝐼 ∗ 𝑒𝑞 − 𝐼 ∗𝑒𝑞
𝑛) − (𝑆𝑆𝐼 ∗ 𝑒𝑞 − 𝐼 ∗
𝑒𝑞
𝑛) , (2)
∆𝑆𝐴 = ∆𝐼 ∗𝑒𝑞
𝑛 (3)
Hence the withdrawal rate of social assistance is at 100% for single persons and close to that margin for
other family types.
adjustment took place in 2008 ). The lack of automatic indexation leads to erosion of the real value of
assistance through inflation. On the other hand, it makes the system vulnerable to ad-hoc increases in SSI
towards the minimum wage, eroding the work incentives of beneficiaries.

ECO/WKP(2016)34
21
29. In this section, we simulate three reform scenarios aimed at further strengthening work incentives
without eroding the social protection floor provided by the system of social assistance:
a. A first reform scenario consists of extending the current system of in-work payments for social
assistance recipients who have been unemployed between 6-12 months (compared to at least 12
months in the current system).
b. The second reform is more ambitious as it aims at introducing earnings disregards for all benefit
recipients (up to 102 EUR / 130 EUR). This would strengthen work incentives for all low-paid
workers whatever their previous status and without limitation in the duration.
c. The third reform scenario aims at making the equivalence scale steeper in order to strengthen the
financial incentives for large families to take a job. To maintain benefits adequacy the reform is
combined with flat-rate supplements for children.
d. 30. To evaluate work incentives under our proposed social assistance reforms we calculate the
financial impact of increasing labour supply at the extensive margin with the participation tax rate
indicator and at the intensive margin with the marginal effective tax rates (METRs).
Box 4. Measures of work incentives for social assistance recipients
The level and change in the marginal effective tax rate (METR) are defined as:
𝑀𝐸𝑇𝑅𝑖 = 1 −𝐷𝑃𝐼(𝐸1)𝑖−𝐷𝑃𝐼(𝐸0)𝑖
𝐸1𝑖−𝐸0𝑖 , where E0=current earnings, E1=increased earnings, DPI(E1)=household
disposable income when the earnings of person i are increased, DPI(E0)= current household disposable
income. We decompose the METR into six income sources (public pensions, non-means-tested benefits,
means-tested benefits, direct taxes, social insurance contributions paid by the employees and social
insurance contributions paid by the self-employed) and we calculate
𝑀𝐸𝑇𝑅𝑘𝑖 =𝐼(𝐸1)𝑘𝑖−𝐼(𝐸0)𝑘𝑖
𝐸1𝑖−𝐸0𝑖 , where 𝐼𝑘 is one of the six income components described above.
To calculate METRs, we simulate a 3% increase in earnings which is roughly equivalent to working an
extra hour per week (intensive margin).
On an extensive margin we simulate an increase in earnings from their current level to the level of the
monthly full-time minimum wage for social assistance recipients (METR2).
First reform option: extending the in-work benefit scheme
Extending the in-work benefit scheme to a wider range of non-employed
31. The first reform scenario of the social assistance benefit in Lithuania involves an extension of the
current system of in-work payments to unemployed social assistance recipients upon finding a job. The in-
work payments are extended to cover those who have been in receipt of cash social assistance between 6 to
12 months before finding a job. This could potentially increase incentives to find and take-up jobs for short
term unemployed social assistance recipients, preventing them from becoming detached from the labour
market.

ECO/WKP(2016)34
22
32. The current system allows the long-term unemployed social assistance recipients to keep 50% of
their previous assistance benefit amount for up to 6 months if they get into employment with a salary at
above ¾ of the minimum monthly wage (MMW) and below the level of 2 MMW. However, the in-work
payments are targeted at a selected group of recipients and for a limited time. As a result, the current
system has limited scope (see Figure 8). The absolute number of beneficiaries receiving additional in-work
payments (i.e. 2820 cases in 2014, 2383 cases in 2013) made up only around 2% of the total number of
social assistance recipients and around 4% of all the long-term social assistance recipients while the
associated total expenditure was less than 0.3% of the total expenditure on social assistance (Table 4).
33. At the same time it is worth noting that in the current system, 32% of social assistance recipients
who found a job receive in-work benefits. This suggests that this scheme may potentially be effective at
increasing work incentives but more could be done to ensure that the system reaches its full potential.
34. A potential explanation for the low take-up of in-work benefit may be related to the characteristic
of the targeted population with comparatively low job prospects. Around half of recipients of social
assistance are long-term recipients, receiving cash social assistance for a period of more than 12 months.
These are the individuals targeted by the current in-work benefit scheme. They may encounter more
difficulties to find work in the context of the still high unemployment levels in Lithuania as well as due to
their detachment from the labour market.12
The remaining half of recipients were in receipt for a period up
to one year, including 31.5% were in receipt for up to six months, and 18.3% of social assistance recipients
were in receipt for a period of between six to twelve months. Importantly, the latter groups are likely closer
to the labor market and could hence be more sensitive to in-work benefits.
35. Another potential explanation for the low take up of in-work benefit is the limited duration of the
benefits as it is only granted for up to 6 months and is withdrawn thereafter. Once the in-work payment is
expired its amount is included into the income test for social assistance. Hence social assistance payments
are likely to be discontinued. This may have a negative effect on the incentives to take up a temporary or
otherwise unstable or little paid job and could be another area of reform. Several countries have for
instance implemented unlimited in-work benefits (Immervoll and Pearson, 2009).
Figure 8. Number of recipients and total expenditure on social assistance in-work payments,
2013-2015
Source: SOCMIN
12. Another potential explanation is that the extra payment is relatively new and potential beneficiaries may
not be aware of it.
0
300
600
900
1 200
1 500
1 800
2 100
0
20
40
60
80
100
120
140
2013-IV 2014-I 2014-II 2014-III 2014-IV 2015-I 2015-II 2015-III
NumberEUR
thousand
Expenditure
Recipients (right scale)
0
7
14
21
28
35
0
10
20
30
40
50
(0; 6] (6;12] (12; 24] (24; 36] (36;48] (48;60] 60+
Share of SA recipients, %
Thousands
Duration of SA receipt, months
SA recipients
Share of the total, % (right scale)

ECO/WKP(2016)34
23
Table 4. Recipients and expenditure on cash social assistance and additional payments for long-term SA
recipients on finding a job, 2013-2014
A. Social assistance
B. Additional payments on finding a job
Share in % (B/A)
recipients
expenditure, thous. EUR
recipients expenditure, thous. EUR
recipients expenditure
2013 190 009 147 174.1 2 383 188.2 1.25 0.13
2014 140 114 103 786.5 2 820 270.2 2.01 0.26
Source: SOCMIN. Notes: Average annual numbers of recipients.
Assumptions for an extension of the in-work benefit scenario
36. To implement the scenario on the extension of in-work benefits we need to establish who among
social assistance recipients is entitled to the in-work payments and who is potentially eligible under the
new scheme, depending on the duration of non-employment. However, the length of social assistance
receipt in the EU-SILC data is not observable. To model social assistance recipients’ eligibility for
additional in-work payments, we make the following assumptions:
Based on administrative statistics (see Table 5) we identify the fraction of social assistance
recipients who were unemployed for more than 12 months among all social assistance
recipients who found a job (2820 out of 8920, i.e. 32% of newly employed who were social
assistance recipients).
The newly eligible population after the reform is equal to the share of those in receipt of social
assistance for 6-12 month in the total population of short-term assistance recipients (i.e. 38%).
Assuming equal employment rates among all the short term social assistance recipients (0-12
months) we pick randomly the newly eligible recipients of in-work benefits among the
remaining newly employed individuals who were previously recipients of social assistance.
The total share of the newly employed who would receive in-work payments after the reform
is hence found to be equal to around 58% of newly employed social assistance recipients
compared to 32% in the current system.
Table 5. Recipients of cash social assistance and additional payments for long-term recipients on finding a job, 2014
2014
A. Additional recipients of SA payments on employment 2 820
B. SA recipients who found a job 8 920
C. Long-term SA recipients registered at the Labour Exchange 26 163
D. SA recipients registered at the Labour Exchange 46 447
E. Long-term SA recipients (12+ months) 70 359
F. Short-term SA recipients (6; 12 months] 25 584
G. Short-term SA recipients (0; 6 months] 44 171
F. SA recipients 140 114
Source: authors’ calculations based on statistics provided on request by SOCMIN

ECO/WKP(2016)34
24
37. While a reform along those lines is aimed at increasing incentives to take jobs and hence would
likely increase the number of social assistance recipients who find a job, we assume no behavioral changes
in our simulations. This likely results in an underestimation of the potential impact of the reform. In
addition, better employment prospects in Lithuania would also contribute to a higher take up of in-work
benefits. Since EUROMOD does not capture the dynamic effects of the reform, which are difficult to
predict, the effects demonstrated below should be interpreted as lower bound estimates.
Impact of earnings on work incentives
38. The new design of the in-work payments increases the social assistance amount for which a
newly employed individual was eligible before employment by half (i.e. by max 51 EUR). For the
individuals at the lowest level of earnings this would contribute to an increase in income by around 25%,
while for those social assistance recipients at the highest earnings’ level – by around 10%. Families and
single parents with children gain less relative to their previous level of income compared to single
individuals.
Figure 9. Change in amounts of social assistance with growth in net earnings for singles and couples previously unemployed for 6-12 months
Reform A
Note: Income including social assistance in the reformed system – dashed line; in the current system– solid line. All family members assumed to qualify for social assistance subject to income test; for couples one earner assumed.
39. The in-work benefit as currently designed implies a non-linearity in the social assistance system.
The non-linearity is reflected in the increase in income once the person becomes eligible for in-work
payments and abrupt decrease once payments expire. Only those who get into employment at a level of ¾
of the minimum salary and a maximum of 2 minimum salaries are eligible for receipt of the in work
benefit. For some (e.g. single individuals) this level of earnings is well above the maximum social
assistance threshold of 102 EUR. Others (e.g. single parents, couples) may become eligible while still in
receipt of social assistance.
40. The extension of the in-work benefit to those unemployed in receipt of social assistance for 6-12
months brings only a marginal change to the PTRs in the total Lithuanian population, and the effect is
concentrated in the lowest income decile (Figure 10). This low average impact is mostly due to the limited
number of beneficiaries of the reform. As discussed above, the total number of in-work benefit recipients is
only a small fraction of social assistance recipients (around 2%). Hence, even as the number of in-work
benefit recipients almost doubles in our scenario, the overall impact remains marginal. Still, incentives to
0
100
200
300
400
500
600
0 100 200 300 400 500 600
Net earnings, EUR
Reform A
Single
Single, 1 ch.
Single, 2 ch.
Single, 3 ch.
Net earnings
Net earnings + SA benefit, EUR
0
100
200
300
400
500
600
0 100 200 300 400 500 600
Net earnings, EUR
Reform A
Couple
Couple, 1 ch.
Couple, 2 ch.
Couple, 3 ch.
Net earnings
Net earnings + SA benefit, EUR

ECO/WKP(2016)34
25
take-up jobs for potential recipients of in-work payments are substantial. As mentioned above in-work
payments may contribute up to around 25% increase in income for eligible social assistance recipients.
Figure 10. Average change in PTR in the total population,
Percentage points
Impact on disposable income
41. In line with previous results, the average change of disposable income across the total Lithuanian
population is marginal. The main effect is concentrated in the lowest income decile. The overall low
impact is related to the methodology (the hypothesis of no behavioral change), but also to the fact that the
population targeted by the reform is quite narrow (social assistance recipients unemployed for a period
between 6 and 12 months). To obtain a more substantial and long-term impact on poverty and work
incentives, a more substantial reform covering a larger population of poor is needed.
Figure 11. Change in the household disposable income by income deciles
Percent
-1.2
-1
-0.8
-0.6
-0.4
-0.2
0
-1.2
-1
-0.8
-0.6
-0.4
-0.2
0
1 2 3 4 5 6 7 8 9 10 All
Change in average PTRs
(ppts)
Change in average PTRs
(ppts)
2015 HDI deciles
SA reform: A - All
Means-tested benefits
Total change
0
0.02
0.04
0.06
0.08
0
0.02
0.04
0.06
0.08
1 2 3 4 5 6 7 8 9 10 All
% change in HDI
% change in HDI
2015 HDI deciles
SA reform: A
Means-tested benefits
Total change

ECO/WKP(2016)34
26
Second reform scenario: introducing income disregards
Providing wider financial incentives to working poor
42. Another direction for reform is to implement income disregards. This would extend the
maximum level of earnings at which singles and couples are eligible for social assistance by not taking into
account a portion of the recipient’s earnings when establishing eligibility to social assistance. Similar
income disregards are implemented in social assistance programs in Finland (at 20% rate), Luxemburg
(30% exemption), Portugal (20% exemption), Slovakia (25% exemption); deductions from earned income
can also be made e.g. in Germany, other countries disregard certain types of income, such as child or
family allowances (e.g. Estonia) (MISSOC 2015).
43. This scheme differs from in-work benefits as currently implemented in Lithuania in important
ways. Whereas receipt of in-work benefits usually requires recipients to be newly employed at a minimum
number of hours, earnings disregards simply reduce the withdrawal rate of social assistance when earnings
increase. Those benefits make low pay jobs more attractive and can also encourage benefits recipients to
work even for a limited number of hours due to a lower rate of social assistance withdrawal. Compared to
the previous scenario, such a reform would benefit social assistance recipients who are already in work
(and have not experienced any recent unemployment spell) and those in receipt for less than six months.
The introduction of earnings disregard makes the income test for social assistance less strict and will only
affect eligibility for those legally in work. For those without earnings the eligibility for social assistance
will not change (as only earnings are disregarded; the treatment of other types of income remains the
same). It is also worth noting that, income disregards may lower the incentive to hide earned income and
could potentially make working in the formal sector more attractive. On the other hand, the current high
share of informal work-related income may jeopardize the practical implementation of this scenario. 13
Main assumptions
44. We consider two possible reforms (B1 and B2): in both cases 30% of net earnings are
disregarded when applying the income test. In reform B1, we cap the level of the disregard at 102 EUR
(the level of SSI) per earner. In reform scenario B2 we cap the maximum level of the disregard at a higher
level of 130 EUR per earner. As the cap of the income disregard is reached any extra earned income is
withdrawn at the same pace as before the reform (i.e. flattening line as visible in Figure 12). By design, the
effects of the two reforms (B1 and B2) on work incentives are similar, while B1 (with a lower threshold on
the maximum disregard) is less favorable for those with more dependent family members. In reform B2,
families with children can keep a fraction of their earnings up to a higher threshold, i.e. adding up to a
maximum of 130EUR compared to a lower threshold of 102EUR in reform B1.
Impact on income and on work incentives
45. The reform improves possibilities to combine earnings with social assistance recipients for all
family types from the first additionally earned Euro. This results in higher levels of disposable income due
to a lower withdrawal rate of social assistance. By contrast, increases in earned income for current social
assistance recipients have only marginal effect on their disposable income.
46. Under the earnings disregard capped at 102EUR (B1) the level of net earnings at which
individuals or families are eligible for assistance increases to around 130 EUR for singles without
13. According to a European Survey, 6% of dependent employees declared receiving informal payment in
2014, which above the European average at 3% but also 5 percentage point less than in 2007
(Eurobarometer, 2015).

ECO/WKP(2016)34
27
children, up to 500 EUR for singles with three children, 290 EUR for one-earner couples without children
and up to 600 EUR for one-earner couples with three children. The maximum levels of net earnings at
which individuals or families are eligible for social assistance are higher in the second scenario (B2) as a
higher cap on the earnings disregard is applied.
Figure 12. Change in amounts of social assistance with growth in net earnings for singles and couples
Reform B1 & B2
Note: Income including cash social assistance in the reformed system – dashed line; in the current system– solid line. All family members assumed to qualify for social assistance subject to income test; for couples one earner assumed.
47. While the reform scenario extending in-work benefits (A) potentially has an effect on the work
incentives at the extensive margin (incentives to get a job), the introduction of the income disregards would
also affect work incentives at an intensive margin (incentives to increase working efforts). Hence we use
the indicators of the marginal effective tax rates (METR) for further analysis.
48. Financial incentives to increase labour supply among the population at the bottom of the
distribution and among the social assistance recipients are comparatively low in the current system (Figure
13). This is due to the negative effect of the means-tested benefits, cash social assistance in particular.
Splitting by family type the total METR is at or above 80% for all the identified family types who receive
social assistance. This is especially true for single individuals and couples with no dependents as the
withdrawal of benefit with earned income is lower as the family size increases due to use of equivalence
scales (See Box 3 and Annex 1 for details).
0
100
200
300
400
500
600
700
0 100 200 300 400 500 600 700
Net earnings, EUR
Reform B1
Single
Single, 1 ch.
Single, 2 ch.
Single, 3 ch.
Net earnings
Net earnings + SA benefit, EUR
0
100
200
300
400
500
600
700
0 100 200 300 400 500 600 700
Net earnings, EUR
Reform B1
Couple
Couple, 1 ch.
Couple, 2 ch.
Couple, 3 ch.
Net earnings
Net earnings + SA benefit, EUR
0
100
200
300
400
500
600
700
0 100 200 300 400 500 600 700
Net earnings, EUR
Reform B2
Single
Single, 1 ch.
Single, 2 ch.
Single, 3 ch.
Net earnings
Net earnings + SA benefit, EUR
0
100
200
300
400
500
600
700
0 100 200 300 400 500 600 700
Net earnings, EUR
Reform B2
Couple
Couple, 1 ch.
Couple, 2 ch.
Couple, 3 ch.
Net earnings
Net earnings + SA benefit, EUR

ECO/WKP(2016)34
28
Figure 13. METR among those with positive employment income and among social assistance recipients, current situation
Note: family types I – for adult, i – for a child, earn- for earner.
49. The reform would result on average in around 25 p.p. decrease in the marginal effective tax rates
among the current social assistance recipients (Figure 14). 14
The effect is evenly distributed among the
different family types and is more pronounced among singles and two-earner couples. For other family
types the effect is slightly lower as even in the current system the withdrawal rate of social assistance is
below 100% due to the application of the equivalence scales (see Box 3 and Annex 1 for details). The
higher ceiling of the disregard in the reform scenario B2 does not seem to have a significant effect
compared to B1 scenario.
50. The METR would decrease for those already eligible and in receipt of social assistance in the
current system (Figure 14). However, there will be a spill-over effect on those who are currently not
eligible for social assistance, but become eligible under the less strict income test. As a result, families
higher up in the income distribution can experience an increase of their METRs (Figure 15). The total
effect reaches up to 6 ppts for the third decile. As a result, the reform might overall lead to an increase of
the average level of METR in the total population, but the average impact is moderate: less than 1 ppts15
.
14. METRs are calculated assuming a 3% increase in earnings, roughly corresponding to the working one
more hour per week. In addition, METR were calculated when earnings are increased from their current
level to the level of the monthly full-time minimum wage for social assistance recipients. Results are very
similar. See Annex 2;
15. The average increase in the METR experienced by the whole population, and especially by the second and
third income decile do not offset the gains observed for lower deciles, and especially social assistance
recipients.
0
10
20
30
40
1 2 3 4 5 6 7 8 9 10 All
Average Marginal Effective Tax Rates, % Employed individuals-Status quo: 2015
0
20
40
60
80
100
One
ear
ner
coup
les,
no
child
ren
One
ear
ner
coup
les
with
1 c
hild
One
ear
ner
coup
les
with
2 c
hild
ren
One
ear
ner
coup
les
with
3+
chi
ldre
n
Tw
o ea
rner
cou
ples
, n
o ch
ildre
n
Tw
o ea
rner
cou
ples
, 1
chi
ld
Tw
o ea
rner
cou
ples
, 2
chi
ldre
n
Tw
o ea
rner
cou
ples
, 3
+ c
hild
ren
Sin
gle
pare
nts
Sin
gle
pers
ons
All
Average Marginal EffectiveTax Rates, %Assistance recipients - Status quo: 2015
Means-tested benefits Non-means tested benefits Direct taxes
Employee SICs Self-employed SICs

ECO/WKP(2016)34
29
Figure 14. Change in the marginal effective tax rates among social assistance recipients by family type
Note: family types: I – for adult, i – for a child, earn- for earner.
Figure 15. Change in the marginal effective tax rates by income decile
Effects of the reform scenarios on household disposable income
51. In both scenarios the household disposable income increases by around 3% on average in the
lowest income decile. The two reform scenarios have similar effects. The introduction of earnings
disregard would only support the working poor, while those without earnings won't be affected. Hence this
effect can be interpreted as a lower bound (i.e. before any behavioral reaction to the reform occurs).
Individuals at the bottom of the income distribution benefit more from the introduction of the income
disregards but the increase in household disposable income extends towards families in the third income
decile. This is due to the fact that poor families eligible for social assistance can live in relatively well-off
households (as social assistance eligibility is determined at the family level, not the household level in
-35
-30
-25
-20
-15
-10
-5
0
One
ear
ner
coup
les,
no
child
ren
One
ear
ner
coup
les
with
1 c
hild
One
ear
ner
coup
les
with
2 c
hild
ren
One
ear
ner
coup
les
with
3+
chi
ldre
n
Tw
o ea
rner
cou
ples
, n
o ch
ildre
n
Tw
o ea
rner
cou
ples
, 1
chi
ld
Tw
o ea
rner
cou
ples
, 2
chi
ldre
n
Tw
o ea
rner
cou
ples
, 3
+ c
hild
ren
Sin
gle
pare
nts
Sin
gle
pers
ons
All
Change in average METRs (ppts)
SA Reform: B1 - SA recipients
Family types
-35
-30
-25
-20
-15
-10
-5
0
One
ear
ner
coup
les,
no
child
ren
One
ear
ner
coup
les
with
1 c
hild
One
ear
ner
coup
les
with
2 c
hild
ren
One
ear
ner
coup
les
with
3+
chi
ldre
n
Tw
o ea
rner
cou
ples
, n
o ch
ildre
n
Tw
o ea
rner
cou
ples
, 1
chi
ld
Tw
o ea
rner
cou
ples
, 2
chi
ldre
n
Tw
o ea
rner
cou
ples
, 3
+ c
hild
ren
Sin
gle
pare
nts
Sin
gle
pers
ons
All
Change in average METRs (ppts)
SA Reform: B2 - SA recipients
Family types
Means-tested benefits Total change
-2
-1
0
1
2
3
4
5
6
7
1 2 3 4 5 6 7 8 9 10 All
Change in average METRs (ppts)
SA Reform: B1 - All
2015 HDI deciles
-2
-1
0
1
2
3
4
5
6
7
1 2 3 4 5 6 7 8 9 10 All
Change in average METRs (ppts)
SA Reform: B2 - All
2015 HDI deciles
Means-tested benefits Total change

ECO/WKP(2016)34
30
Lithuania). Working parents with 3 and more children benefit most as they can use higher amounts of
income disregards before exceeding the income test of social assistance scheme.
Figure 16. Changes in the eq. household disposable income due to reform by deciles of household disposable income and family type
Third reform scenario: re-designing support for large families
52. Financial incentives to take a job depend strongly on the family size in Lithuania due to the
comparatively flat equivalence scales for family members (see Box 3). The support for single individuals is
for instance on average at 23% of median income while support for a married couple with two children
reaches up to 42% of median income. As a result, moving from unemployment or inactivity to a job at two-
third the average wage could generate a loss up to 83% of their additional income for the family while this
loss is only 50% for singles (OECD, 2016). On the one hand, the current scheme provides only weak
financial work incentives for large families. On the other hand, the current SSI level is inadequate for
supporting single individuals. The third reform scenario is hence designed to tackle high effective taxation
for large families while keeping an adequate support and to increase the support to singles (Figure 14 and
16).
0.0
0.5
1.0
1.5
2.0
2.5
3.0
3.5
1 2 3 4 5 6 7 8 9 10 All
% change in HDISA Reform: B1
2015 HDI deciles
0.0
0.5
1.0
1.5
2.0
2.5
3.0
3.5
1 2 3 4 5 6 7 8 9 10 All
% change in HDISA Reform: B2
2015 HDI deciles
0.0
0.5
1.0
1.5
2.0
2.5
One
ear
ner
coup
les,
no
child
ren
One
ear
ner
coup
les
with
1 c
hild
One
ear
ner
coup
les
with
2 c
hild
ren
One
ear
ner
coup
les
with
3+
chi
ldre
n
Tw
o ea
rner
cou
ples
, n
o ch
ildre
n
Tw
o ea
rner
cou
ples
, 1
chi
ld
Tw
o ea
rner
cou
ples
, 2
chi
ldre
n
Tw
o ea
rner
cou
ples
, 3
+ c
hild
ren
Sin
gle
pare
nts
Sin
gle
pers
ons
All
% change in HDI
SA Reform: B1
Family types
0
0.5
1
1.5
2
2.5
One
ear
ner
coup
les,
no
child
ren
One
ear
ner
coup
les
with
1 c
hild
One
ear
ner
coup
les
with
2 c
hild
ren
One
ear
ner
coup
les
with
3+
chi
ldre
n
Tw
o ea
rner
cou
ples
, n
o ch
ildre
n
Tw
o ea
rner
cou
ples
, 1
chi
ld
Tw
o ea
rner
cou
ples
, 2
chi
ldre
n
Tw
o ea
rner
cou
ples
, 3
+ c
hild
ren
Sin
gle
pare
nts
Sin
gle
pers
ons
All
% change in HDI
SA Reform: B2
Family types
Means-tested benefits Net total change

ECO/WKP(2016)34
31
Main assumptions
53. While the generous equivalence may reduce financial incentives to take a job, the low base of
social assistance support complicates any effort to make it steeper without taking the risk to expose social
assistance recipients to higher poverty risk. In this third reform scenario, we hence combined steeper
equivalence scale with flat rate supplements for children which would not jeopardize work incentives as
they are not withdrawn in case the recipient takes a job as long as he is entitled to social assistance
benefits. A similar structure of the general assistance amount plus supplement for families with children
has been implemented e.g. in Estonia (MISSOC 2015). The third proposed reform scenarios have the
following characteristics:
We assume an increase of the level of SSI by around 30% (to 130EUR)16
. The level of SSI for a
single person with one child would still be substantially below the level of net monthly minimum
wage, i.e. increasing from 36% in the current system to 46%17
(See Table 7).
We replace the existing equivalence scale (see Annex 1) with two alternative steeper scales. In
the literature these are commonly referred to as an original and modified OECD equivalence
scales (see e.g. OECD 2013). The scales account for economies of scale in the cost of living and
recognize the higher spending needs of adolescents (aged 14 or older) compared to younger
children18
.
To compensate the negative effect of the he steeper equivalence scale for large families, we
include a flat rate supplement for children modeled as part of social assistance19
. Hence the flat
rate supplement is received at its full rate as long as the family is entitled to social assistance.20
Table 6. Third scenario: main assumptions
Current system Reform scenario C1 Reform scenario C2
SSI 102 130 130
Equivalence scale 1; 0.9; 0.7 1; 0.7; 0.5 1; 0.5; 0.3
Children supplement No 20 euros (lump sum, for lone parents and families with 3+ children)
30 euros per child
16. SSI is used for other instruments of the Lithuanian system of social benefits – e.g. for unemployment
benefit, child benefits. The reform only implies an increase in SSI level for assistance benefits
17. This ratio is expected to be lower once taking into account the increase in the MMA and tax allowances as
planned for 2016.
18. While the OECD currently advocates for using the scale equal to square root of the household size, we use
the so-called original and modified OECD scales. These scales are widely used and known in the
Lithuanian and EU context. The modified OECD scale is applied for estimation of the official at-risk-of-
poverty rates by Eurostat and in Lithuania.
19. An alternative is to pay it through the child benefit scheme.
20. Supplement can be lower if the child benefits are excluded from the income text of social assistance as is
currently the case in Lithuania.

ECO/WKP(2016)34
32
Table 7. State supported income (SSI) as % of the median eq. household disposable income (HDI) and monthly minimums salary (MMS)
per month, EUR 2014 2015 Reform: C1& C2
SSI 101.4 102 130
Net MMS (single, one child), (I) 254 280 280
40% median HDI (II) 160.8 n/a 160.8
50% median HDI (III) 201.0 n/a 201.0
SSI/minimum wage 40% 36% 46%
SSI/40% of median HDI 63% n/a 81%
SSI/50% of median HDI 50% n/a 65%
Note: median equivalized household disposable incomes (HDI) based on EU-SILC estimates lagged by one year to correspond to the income reference period.
Source: SSI based on the relevant version of the Resolution of the Government of Lithuanian Republic “Dėl valstybės remiamų pajamų dydžio patvirtinimo“; Eurostat for median income; authors’ calculations.
Impact on income and work incentives
54. The proposed combination of a higher SSI, steeper equivalence scale and supplements for
children ensures that none of the family types is worse off after the reform. In both scenarios assistance
levels increase for single persons due to an increase in the SSI not depending on their working status. For
other family types assistance levels only increase for those with positive earnings as the increase in the
level of SSI is offset by steeper scale.
55. The reform introduces a non-linearity of the social assistance system caused by the flat-rate child
supplement. When the income level of social assistance recipients crosses the income test child
supplements are withdrawn altogether. In reform C1, the non-linearity due to withdrawal of child
supplements is small (amounts to max 20EUR), but the positive impact on work incentives is also lower. In
reform C2, where a steeper equivalence scale is associated with higher child supplements, the non linearity
is more abrupt, but a higher fraction of social assistance can be kept with the growth in earnings. 21
21. The negative effect of the non-linearity in the system after C2 reform may be overcome by integrating the
supplement for children into the system of child benefits, rather than paying it as a social assistance top-up.
As currently the income test level for receipt of the child benefits is substantially higher compared to the
system of social assistance (i.e. 1.5 SSI per family member), the withdrawal of child benefit would appear
at a higher income level and in relative terms would constitute a smaller share of family’s income.

ECO/WKP(2016)34
33
Figure 17. Change in amounts of social assistance with growth in net earnings for singles and couples
Reform C1 & C2
56. The introduction of the steeper equivalence scales improves work incentives and decreases
METRs across all family types. Compared to the previous scenario with an income disregard this effect is
stronger, particularly for families with children. This is because a lower withdrawal rate of social
assistance is applied as the number of children increases. The withdrawal rate of social assistance is equal
to eq/n, where eq is the sum of the applied equivalence scale for the family and n is the number of family
members (see equation 3 in Box 3). As a result, the potential effect on the METR of families with children
is about twice higher for the C2 compared to the scenario C1. By contrast, the METR of individuals
without children are not significantly affected.22
57. Similarly to previous reform scenarios (B1 and B2), two counteracting effects can be identified:
on the one hand, METR decrease for those eligible and in receipt of social assistance; on the other hand,
there is a spill-over effect on families higher up in the income distribution who are currently not eligible
for social assistance, but become eligible as the SSI level is increased. The reform scenario with a steeper
equivalence scale (C2) has a more profound effect higher up in the income distribution (i.e. in the 3rd
decile).
22. The effect of such reform can even be negative for single. According to addition simulations at the
extensive margin, the change in METR when taking a job at the minimum wage could increase for single.
See Annex 2.
0
100
200
300
400
500
600
700
800
0 100 200 300 400 500 600 700
Net earnings, EUR
Reform C1
Single
Single, 1 ch.
Single, 2 ch.
Single, 3 ch.
Net earnings
Net earnings + SA benefit, EUR
0
100
200
300
400
500
600
700
800
0 100 200 300 400 500 600 700
Net earnings, EUR
Reform C1
Couple
Couple, 1 ch.
Couple, 2 ch.
Couple, 3 ch.
Net earnings
Net earnings + SA benefit, EUR
0
100
200
300
400
500
600
700
800
0 100 200 300 400 500 600 700
Net earnings, EUR
Reform C2
Single
Single, 1 ch.
Single, 2 ch.
Single, 3 ch.
Net earnings
Net earnings + SA benefit, EUR
0
100
200
300
400
500
600
700
800
0 100 200 300 400 500 600 700
Net earnings, EUR
Reform C2
Couple
Couple, 1 ch.
Couple, 2 ch.
Couple, 3 ch.
Net earnings
Net earnings + SA benefit, EUR

ECO/WKP(2016)34
34
Figure 18. Change in the marginal effective tax rates
Note: family types: I – for adult, i – for a child, earn- for earner.
Impact of the reform on household disposable income
58. Both reforms C1 and C2 have a positive distributional effect. The increase in disposable income
is concentrated in the first income decile and is more than twice as high on average compared to the
scenarios introducing income disregards (B1 and B2). This is due to the increase in the SSI level and
supplements for children, which are affecting the whole population of social assistance recipients. In
contrast, income disregards are only affecting families with at least one employed member. Comparing the
two reform scenarios C1 and C2, the distributional effect is of a similar magnitude and similarly
distributed. The second reform has somewhat larger effects on household disposable income at the lower
part of the income distribution. All the family types are better off after the reform due to a combination of
the increased SSI level, supplements for children and lower withdrawal rate with earned income. The
reform is most beneficial for families with 3 or more children and for single parents. These types of
-30
-25
-20
-15
-10
-5
0
One
ear
ner
coup
les,
no
child
ren
One
ear
ner
coup
les
with
1 c
hild
One
ear
ner
coup
les
with
2 c
hild
ren
One
ear
ner
coup
les
with
3+
chi
ldre
n
Tw
o ea
rner
cou
ples
, n
o ch
ildre
n
Tw
o ea
rner
cou
ples
, 1
chi
ld
Tw
o ea
rner
cou
ples
, 2
chi
ldre
n
Tw
o ea
rner
cou
ples
, 3
+ c
hild
ren
Sin
gle
pare
nts
Sin
gle
pers
ons
All
Change in average METRs (ppts)
SA Reform: C1 - SA recipients
Family types
-30
-25
-20
-15
-10
-5
0
One
ear
ner
coup
les,
no
child
ren
One
ear
ner
coup
les
with
1 c
hild
One
ear
ner
coup
les
with
2 c
hild
ren
One
ear
ner
coup
les
with
3+
chi
ldre
n
Tw
o ea
rner
cou
ples
, n
o ch
ildre
n
Tw
o ea
rner
cou
ples
, 1
chi
ld
Tw
o ea
rner
cou
ples
, 2
chi
ldre
n
Tw
o ea
rner
cou
ples
, 3
+ c
hild
ren
Sin
gle
pare
nts
Sin
gle
pers
ons
All
Change in average METRs (ppts)
SA Reform: C2 - SA recipients
Family types
-2
0
2
4
6
8
10
1 2 3 4 5 6 7 8 9 10 All
Change in average METRs (ppts)
SA Reform: C1 - All
2015 HDI deciles
-2
0
2
4
6
8
10
1 2 3 4 5 6 7 8 9 10 All
Change in average METRs (ppts)
SA Reform: C2 - All
2015 HDI deciles
Means-tested benefits Total change

ECO/WKP(2016)34
35
families would gain between 2-10% in relation to their total equivalized household disposable income pre-
reform.
Figure 19. Changes in the eq. household disposable income due to reform
Note: family types: I – for adult, i – for a child, earn- for earner.
Macro-level costs and benefits
Impact on the coverage of social protection
59. According to simulations the unemployment benefit reform would increase the number of benefit
recipients by around 13%. This is due to a less strict requirement of the previous contribution history
compared to the current situation (i.e. 12 months during the previous 24 months, instead of 18 months
before the previous 36 months). The increase in the coverage of the unemployment benefit system would,
however, reduce the number of social assistance claimants, i.e. a more robust system of benefits in
unemployment will substitute the need for assistance.
0
2
4
6
8
10
12
1 2 3 4 5 6 7 8 9 10 All
% change in HDISA Reform: C1
2015 HDI deciles
0
2
4
6
8
10
12
1 2 3 4 5 6 7 8 9 10 All
% change in HDISA Reform: C2
2015 HDI deciles
0
2
4
6
8
10
One
ear
ner
coup
les,
no
child
ren
One
ear
ner
coup
les
with
1 c
hild
One
ear
ner
coup
les
with
2 c
hild
ren
One
ear
ner
coup
les
with
3+
chi
ldre
n
Tw
o ea
rner
cou
ples
, n
o ch
ildre
n
Tw
o ea
rner
cou
ples
, 1
chi
ld
Tw
o ea
rner
cou
ples
, 2
chi
ldre
n
Tw
o ea
rner
cou
ples
, 3
+ c
hild
ren
Sin
gle
pare
nts
Sin
gle
pers
ons
All
% change in HDI
SA Reform: C1
Family types
0
2
4
6
8
10
One
ear
ner
coup
les,
no
child
ren
One
ear
ner
coup
les
with
1 c
hild
One
ear
ner
coup
les
with
2 c
hild
ren
One
ear
ner
coup
les
with
3+
chi
ldre
n
Tw
o ea
rner
cou
ples
, n
o ch
ildre
n
Tw
o ea
rner
cou
ples
, 1
chi
ld
Tw
o ea
rner
cou
ples
, 2
chi
ldre
n
Tw
o ea
rner
cou
ples
, 3
+ c
hild
ren
Sin
gle
pare
nts
Sin
gle
pers
ons
All
% change in HDI
SA Reform: C2
Family types
Means-tested benefits Net total change
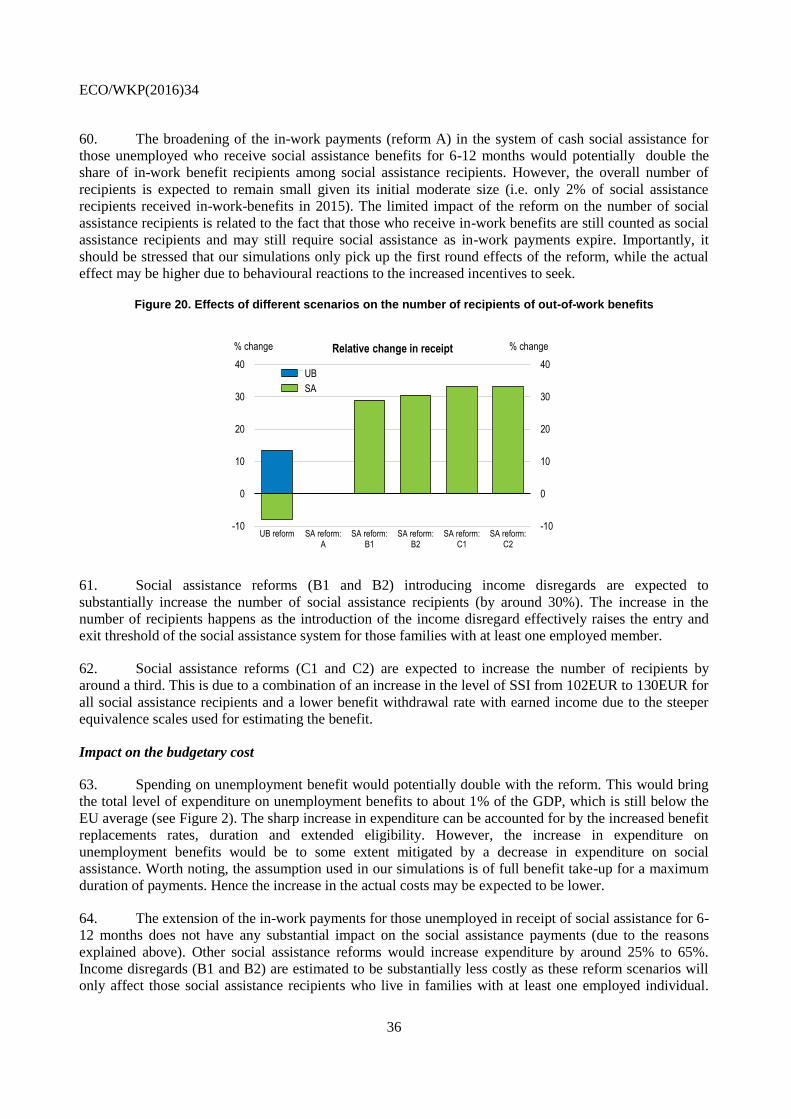
ECO/WKP(2016)34
36
60. The broadening of the in-work payments (reform A) in the system of cash social assistance for
those unemployed who receive social assistance benefits for 6-12 months would potentially double the
share of in-work benefit recipients among social assistance recipients. However, the overall number of
recipients is expected to remain small given its initial moderate size (i.e. only 2% of social assistance
recipients received in-work-benefits in 2015). The limited impact of the reform on the number of social
assistance recipients is related to the fact that those who receive in-work benefits are still counted as social
assistance recipients and may still require social assistance as in-work payments expire. Importantly, it
should be stressed that our simulations only pick up the first round effects of the reform, while the actual
effect may be higher due to behavioural reactions to the increased incentives to seek.
Figure 20. Effects of different scenarios on the number of recipients of out-of-work benefits
61. Social assistance reforms (B1 and B2) introducing income disregards are expected to
substantially increase the number of social assistance recipients (by around 30%). The increase in the
number of recipients happens as the introduction of the income disregard effectively raises the entry and
exit threshold of the social assistance system for those families with at least one employed member.
62. Social assistance reforms (C1 and C2) are expected to increase the number of recipients by
around a third. This is due to a combination of an increase in the level of SSI from 102EUR to 130EUR for
all social assistance recipients and a lower benefit withdrawal rate with earned income due to the steeper
equivalence scales used for estimating the benefit.
Impact on the budgetary cost
63. Spending on unemployment benefit would potentially double with the reform. This would bring
the total level of expenditure on unemployment benefits to about 1% of the GDP, which is still below the
EU average (see Figure 2). The sharp increase in expenditure can be accounted for by the increased benefit
replacements rates, duration and extended eligibility. However, the increase in expenditure on
unemployment benefits would be to some extent mitigated by a decrease in expenditure on social
assistance. Worth noting, the assumption used in our simulations is of full benefit take-up for a maximum
duration of payments. Hence the increase in the actual costs may be expected to be lower.
64. The extension of the in-work payments for those unemployed in receipt of social assistance for 6-
12 months does not have any substantial impact on the social assistance payments (due to the reasons
explained above). Other social assistance reforms would increase expenditure by around 25% to 65%.
Income disregards (B1 and B2) are estimated to be substantially less costly as these reform scenarios will
only affect those social assistance recipients who live in families with at least one employed individual.
-10
0
10
20
30
40
-10
0
10
20
30
40
UB reform SA reform:A
SA reform:B1
SA reform:B2
SA reform:C1
SA reform:C2
% change% change Relative change in receipt
UB
SA

ECO/WKP(2016)34
37
The increase in the level of SSI in conjunction with a steeper equivalence scale and supplements for
children would require more funds and affect all recipients of social assistance. The total spending on
social assistance after the reform would be in the range of 0.35% to 0.45% of the GDP, which is slightly
above the EU average (see Figure 2).
Figure 21. Effects of different reform scenarios on expenditure
65. All the analysed reforms potentially have a positive effect on reducing the at-risk-of-poverty rate,
gap and inequality. Changes in the unemployment benefits have smaller effects on the at-risk of poverty
rate and inequality as by design the reform is not targeted at the poor, but at increasing the benefit
replacement rates for insured individuals. The unemployment benefit reform only affects positively the
poverty rate estimated at the higher threshold of 60% of the median equivalized household disposable
income. This finding is not unexpected as those at the very bottom of the income distribution are mostly
not eligible for social insurance payments or their eligibility has expired.
66. The social assistance reforms make a stronger contribution to reduce poverty. Social assistance
reforms B1 and B2 as well as C1 and C2 are expected to have a substantial first-round effect on reduction
of poverty risk rate, gap and inequality. At its highest in scenario C2, the poverty rate would decrease by
around 9% which would reduce the at-risk-of-poverty indicator by around 1.7 ppts. Inequality, as measured
by the Gini coefficient, would decrease by up to 2%, implying a decline of the indicator by around 0.7
points. Scenarios B1 and B2 would affect only social assistance recipients who are in work and hence, the
effect on the at-risk-of-poverty indicators is less pronounced compared to the reform scenarios C1 and C2
that include an increase in the SSI level.
-30
0
30
60
90
120
150
-30
0
30
60
90
120
150
UB reform SA reform:A
SA reform:B1
SA reform:B2
SA reform:C1
SA reform:C2
% change% change Relative change in expenditure
UB
SA
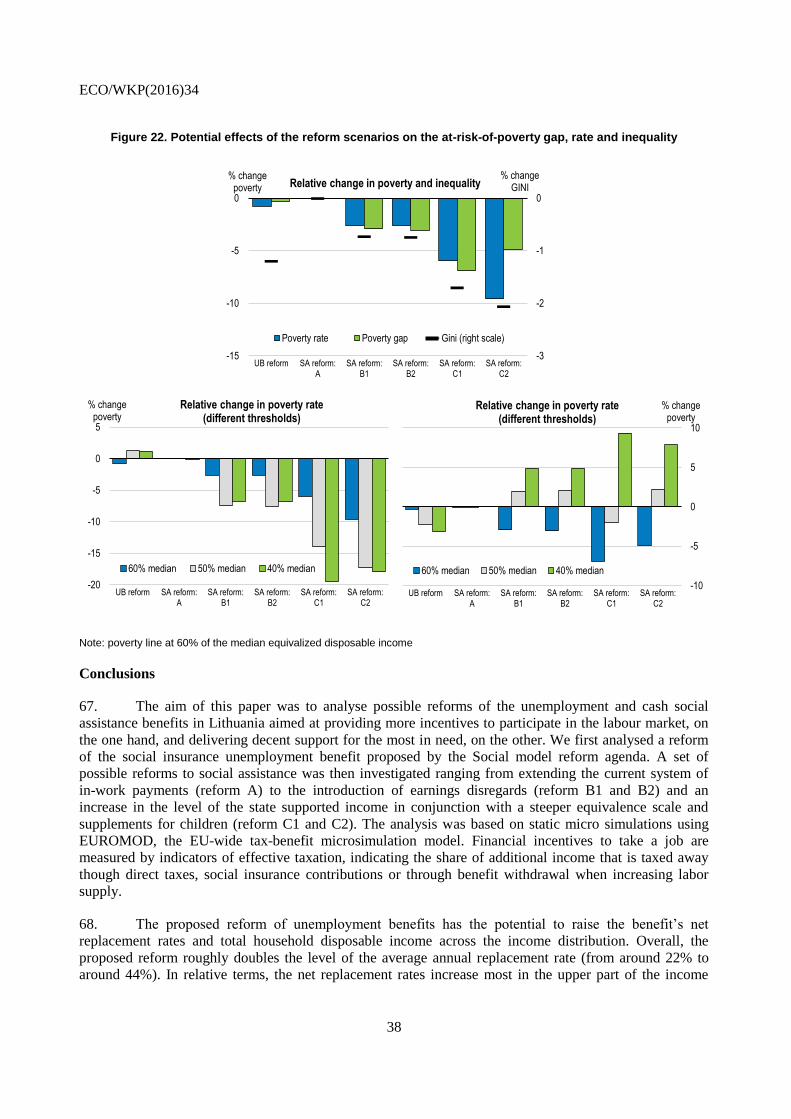
ECO/WKP(2016)34
38
Figure 22. Potential effects of the reform scenarios on the at-risk-of-poverty gap, rate and inequality
Note: poverty line at 60% of the median equivalized disposable income
Conclusions
67. The aim of this paper was to analyse possible reforms of the unemployment and cash social
assistance benefits in Lithuania aimed at providing more incentives to participate in the labour market, on
the one hand, and delivering decent support for the most in need, on the other. We first analysed a reform
of the social insurance unemployment benefit proposed by the Social model reform agenda. A set of
possible reforms to social assistance was then investigated ranging from extending the current system of
in-work payments (reform A) to the introduction of earnings disregards (reform B1 and B2) and an
increase in the level of the state supported income in conjunction with a steeper equivalence scale and
supplements for children (reform C1 and C2). The analysis was based on static micro simulations using
EUROMOD, the EU-wide tax-benefit microsimulation model. Financial incentives to take a job are
measured by indicators of effective taxation, indicating the share of additional income that is taxed away
though direct taxes, social insurance contributions or through benefit withdrawal when increasing labor
supply.
68. The proposed reform of unemployment benefits has the potential to raise the benefit’s net
replacement rates and total household disposable income across the income distribution. Overall, the
proposed reform roughly doubles the level of the average annual replacement rate (from around 22% to
around 44%). In relative terms, the net replacement rates increase most in the upper part of the income
-3
-2
-1
0
-15
-10
-5
0
UB reform SA reform:A
SA reform:B1
SA reform:B2
SA reform:C1
SA reform:C2
% change GINI
% change poverty Relative change in poverty and inequality
Poverty rate Poverty gap Gini (right scale)
-20
-15
-10
-5
0
5
UB reform SA reform:A
SA reform:B1
SA reform:B2
SA reform:C1
SA reform:C2
% change poverty
Relative change in poverty rate (different thresholds)
60% median 50% median 40% median
-10
-5
0
5
10
UB reform SA reform:A
SA reform:B1
SA reform:B2
SA reform:C1
SA reform:C2
% change poverty
Relative change in poverty rate (different thresholds)
60% median 50% median 40% median

ECO/WKP(2016)34
39
distribution, due to a stronger link between unemployment benefit entitlements and previous earnings.
Both the increased generosity and replacement rates could potentially increase the attractiveness of the
unemployment social insurance system, boosting the incentives to participate especially for those with high
earnings. Within the context of the widespread shadow economy in Lithuania these effects bring an
additional value to the planned reform. Finally, the reforms are expected to reduce income inequalities.
69. While all three proposed social assistance reforms are targeted at increasing work incentives, they
all differ in the extent to which they achieve this goal, as well as in the generosity of benefits and affected
groups.
70. The extension of the current system of in-work payments towards a group of unemployed
recipients of social assistance of 6-12 months (reform A) may add up to around 25% of the total income for
those eligible and with lowest earnings. The number of recipients would potentially double compared to
the current system. However, the overall impact would remain limited by the fact that the measure is short-
term and currently covers only a small fraction of those eligible for social assistance (2%). Nevertheless,
the reform would potentially cover a substantial part of social assistance recipients taking a job (one-third
currently and more than half in the reform scenario).
71. The establishment of earnings disregards into the system of social assistance in Lithuania
(reforms B1 and B2) would have potentially stronger effects. An earnings disregard of 30% for all social
assistance recipients would decrease the marginal effective tax rates among the current social assistance
recipients by on average 25 ppts. The lower rate of benefit withdrawal with earned income would make
working pay from the first earned euro. The reform would support only the working poor, while those
without earnings won't be affected. Working social assistance recipients with dependent members (i.e.
children) would benefit most from the reform.
72. The introduction of the steeper equivalence scales would reduce effective taxation of social
assistance recipients by 6 ppts on average under the assumption of scenario C1 and by 13 ppts on average
with the steeper scale assumed in scenario C2. The effect is expected to be stronger for families with
children, i.e. result in a drop of the marginal effective tax rate by up to 15 ppts and up to 30 ppts,
respectively, for scenarios C1and C2. Lower levels of social assistance for large families under the
assumption of a different equivalence scale are balanced by the introduction of flat-rate child supplements.
This allows keeping financial incentives to work as the child supplements are not withdrawn with earned
income. Nevertheless flat-rate child supplements introduce a non-linearity to the social assistance system,
i.e. a drop in income due to withdrawal of child supplements when income test threshold gets exceeded.
This effect is small for the reform C1 but it becomes more abrupt in scenario C2, which requires higher
child supplements to offset a steeper equivalence scale.
73. Introducing earnings disregards and increasing the level of SSI would potentially come with an
increase of the marginal effective tax rate at the country level. This is driven by the fact that some families
who are currently not eligible for social assistance become eligible under the less strict income test (i.e. the
income test incorporating income disregards or using a higher SSI level). Nevertheless, the effect on the
average METR in Lithuania is expected to be small (by around 1 ppts at the aggregate level). On the other
hand, the METR would decline significantly for those facing a higher risk of poverty traps in the current
system.
74. All the analysed reforms of social assistance and unemployment benefits can potentially
contribute to reducing at-risk-of-poverty and inequality rates in Lithuania. However, they require
additional expenditure and an expansion of the number of cash benefit recipients. The planned
unemployment benefit reform is expected to increase the number of benefit recipients by around 13% and
more than double the total level of expenditure on unemployment insurance benefits (to about 1% of the

ECO/WKP(2016)34
40
GDP, which is still below the EU average). Social assistance reforms, except the expansion of the current
system of in-work benefits, would have a more profound effect on reducing the level of poverty and
inequality. They would require increasing the total spending on social assistance by around 25-65%
depending on the chosen parameters of the reform (i.e. to around 0.35-0.45% of the GDP, which is slightly
above the EU average). They would also generate an increase of around 30% in the number of recipients.
75. A word of caution needs to be given regarding the limitations of this paper. Most importantly,
only the intended first order effects of the reforms are taken into account assuming full benefit take-up and
full tax compliance. The effect of the reforms would be lower given there is benefit non take-up or
misreporting of income. In particular the use of “envelope wages” in Lithuania implies that earnings
related policies such as income disregards may have unwanted effects and requires active policies against
fraud to keep the cost of the policy under control and to be sure it will benefit the most vulnerable. On the
other hand, more generous unemployment benefits and additional work incentives in the system of social
assistance may positively affect labour supply and participation in the legal economy, positively
contributing to the effect of the reform and reducing its budgetary cost over the medium-term.
BIBLIOGRAPHY
Avram, S. (2013), “Outcomes of Social Assistance in Central and Eastern Europe: A Pre-Transfer Post-
Transfer Comparison”, Institute for Social Economic Research Working Paper, No. 2013-08.
Bourguignon, F., Spadaro, A. (2006). Microsimulation as a tool for evaluating redistribution policies. The
Journal of Economic Inequality, Vol. 4(1), p. 77-106.
Demmou L. (2016), “Growing Together : Making the Convergence Process More Inclusive in Lithuania”,
Economics Department working paper No. 1308, OECD Publishing, Paris,
www.oecd.org/eco/surveys/economic-survey-lithuania.htm.
Figari, F., Salvatori, A., Sutherland, H. (2011). ‘Economic downturn and stress testing European welfare
systems’. Research in Labor Economics 32: 257-286.
Immervoll, H. and S. Scarpetta (2012), “Activation and Employment Support Policies in OECD Countries.
An Overview of Current Approaches”, IZA Journal of Labour Policy, Vol. 1:9.
Immervoll, H. and M. Pearson (2009), “A Good Time for Making Work Pay? Taking Stock of In-Work
Benefits and Related Measures across the OECD”, OECD Social, Employment and Migration
Working Papers, No. 81, OECD Publishing.
IMF (2014), "Republic of Lithuania: Article IV", IMF Country Report No. 14/113.
Jara, H.X., Tumino, A. (2013). Tax-Benefit Systems, Income Distribution and Work Incentives in the
European Union. EUROMOD Working Paper No. EM7/13, p. 37.
Lagenbusher, 2015, “How Demanding are Eligibility Criteria for Unemployment Benefits? Quantitative
Indicators for OECD and EU Countries”, OECD Social, Employment and Migration Working
Papers, No. 166, OECD Publishing.

ECO/WKP(2016)34
41
Lazutka R., Poviliunas A. (2010). Lithuania: In-work poverty and labour market segmentation. A Study of
National Policies. European Commission, DG Employment, p. 37.
Lazutka, R. (2014). The minimum income scheme reform in Lithuania. Ekonomika. Vol. 93(4), pp. 24-40.
ISSN 1392-1258.
Lazutka, R., Skučienė, D., Černiauskas, G., Bartkus, A., Navickė, J., Junevičienė, J. (2013). Socialinis
draudimas Lietuvoje: kontekstas, raida, rezultatai. LSTC: Vilnius.
MISSOC (2015). Mutual Information System on Social Protection. Information base // MISSOC
Comparative Tables Database. Online source:
http://www.missoc.org/MISSOC/INFORMATIONBASE
/COMPARATIVETABLES/MISSOCDATABASE/comparativeTableSearch.jsp .
Navicke, J. (2015). Between a risk society and a welfare state: social risk resilience and vulnerability to
poverty in Lithuania. STEPP: Social theory, empirics, policy and prasctice. Vilnius: Vilnius
University, nr. 10., p. 95-109.
Navickė, J., Lazutka, R. (2015). "Work incentives at the bottom of the income distribution and for model
families in Lithuania". EUROMOD Working Paper Series EM14/15 .
OECD(2008). “Declaring Work or Staying Underground: Informal Employment in Seven OECD
Countries”, Employment Outlook 2008, OECD Publishing.
OECD (2013). Framework for Statistics on the Distribution of Household Income, Consumption and
Wealth. OECD, online source: http://www.oecd.org/statistics/OECD-ICW-Framework-Chapter8.pdf
OECD (2015a). In it Together: Why less inequality benefits all, OECD publishing.
OECD (2015b). Investing in Youth: Lithuania, OECD publishing.
OECD (2016a). Tax-Benefit Models, Online source: http://www.oecd.org/social/soc/benefits-and-wages-
statistics.htm
OECD (2016b), OECD Economic Surveys: Lithuania 2016: Economic Assessment, OECD Publishing,
Paris.
Schneider, F (2015), “Size and Development of the Shadow Economy of 31 European and 5 other OECD
Countries from 2003 to 2015: Different Developments”, mimeo.
http://www.econ.jku.at/members/Schneider/files/publications/2015/ShadEcEurope31.pdf
Socialinis modelis (2015). Darbo santykių ir valstybinio socialinio draudimo teisinis-administracinis
modelis Socialinės apsaugos ir darbo ministerija, Vilniaus Universitetas, Mykolio Riomerio
Universitetas, Lietuvos Socialinių Tyrimų Centras,77p. Online source: http://www.socmodelis.lt/wp-
content/uploads/Modelio-ataskaita.pdf
Sutherland, H., Figari, F. (2013). EUROMOD: the European Union tax-benefit microsimulation model.
International Journal of Microsimulation, 6(1): 4-26. Available at:
http://www.microsimulation.org/ijm/issues/volume-61-spring-2013/
Tamašauskienė, Z. (2003). Piniginė socialinė parama Šiaulių mieste ir jos tobulinimas. Ekonomika ir
vadyba: aktualijos ir perspektyvos, Vol. 2, pp. 205-210.

ECO/WKP(2016)34
42
Tatsiramos (2009). “Unemployment Insurance in Europe: Unemployment Duration and Subsequent
Employment Stability”, Journal of the European Economic Association, Vol. 7(6).
UNDP (2010). Darbo paskatų ir priklausomybės nuo paramos priešpastatymo analize pagrįstos
rekomendacijos: dėl trumpalaikių politikos priemonių, skirtų Lietuvos socialinės paramos sistemos
reformai. Jungtinių Tautų vystymo programa (JTVP) Lietuvoje LR socialinės apsaugos ir darbo
ministerija.
Wulfgram and Fervers (2013). “Unemployment and Subsequent Employment Stability: Does Labour
Market Policy Matter?”, IZA Discussion Paper, No. 7193.
Zabarauskaitė, R. (2008). Skurdo matavimas ir mažinimo kryptys Lietuvoje. Daktaro disertacija
(Ekonomika, 04S). Technika. p.16.

ECO/WKP(2016)34
43
ANNEX 1: CHARACTERISTICS OF THE CURRENT SYSTEM OF SOCIAL ASSISTANCE,
SYSTEM BEFORE 2012 AND ANALYSED REFORM DESIGNS
Table A1.1. Sum of equivalence scales (eq) applied for calculations of social assistance benefits:
Name of the system: Before 2012 2015 & B1 & B2 C1 C2
Eq. scale: 0.9 per capita 1, 0.8, 0.7 1; 0.7; 0.5 1; 0.5; 0.3 Single adult 0.9 1 1 1
Couple, no children 1.8 1.8 1.7 1.5 Couple, 1 child 2.7 2.5 2.2 1.8 Couple, 2 children 3.6 3.2 2.7 2.1 Couple, 3 children 4.5 3.9 3.2 2.4
Couple, 4 children 5.4 4.6 3.7 2.7
Single, 1 child 1.8 1.8 1.5 1.3 Single, 2 children 2.7 2.5 2 1.6 Single, 3 children 3.6 3.2 2.5 1.9 Single, 4 children 4.5 3.9 3 2.2
Source: calculations by the authors. Note: more generous scale in green, less generous scale in red.
Table A1.2. Maximum amount of social assistance benefit (SSI*eq) and withdrawal rate for an earned EUR (eq / n):
Before 2012 2015
B1, B2 C1 C2
Before 2012 2015
B1 , B2 C1 C2
Single 91.8 102 102 130 130 90% 100% 70% 100% 100%
Couple, 0 ch. 183.6 183.6 183.6 221 195 90% 90% 63% 85% 75% Couple, 1 ch. 275.4 255 255 286 234+30 90% 83% 58% 73% 60% Couple, 2 ch. 367.2 326.4 326.4 351 273+60 90% 80% 56% 68% 53% Couple, 3 ch. 459 397.8 397.8 416+20 312+90 90% 78% 55% 64% 48% Couple, 4 ch. 550.8 469.2 469.2 481+20 351+120 90% 77% 54% 62% 45%
Single, 1 ch. 183.6 183.6 183.6 195+20 169+30 90% 90% 63% 75% 65% Single, 2 ch. 275.4 255 255 260+20 208+60 90% 83% 58% 67% 53% Single, 3 ch. 367.2 326.4 326.4 325+20 247+90 90% 80% 56% 63% 48%
Single, 4 ch. 459 397.8 397.8 390+20 286+120 90% 78% 55% 60% 44%
Source: calculations by the authors. Note: better-off situation in green (higher assistance / lower withdrawal rate), worse-off
situation in red (lower assistance / higher withdrawal rate).

ECO/WKP(2016)34
44
ANNEX 2: INDICATORS OF FINANCIAL INCENTIVES TO WORK AT THE EXTENSIVE
MARGIN: SCENARIOS B AND C
Figure A2.1. METR2 for transition from the observed level of earnings to the minimum wage, by family type
(Income disregards scenarios: B1 and B2)
Note: family types: I – for adult, i – for a child, earn- for earner.
The effect of income disregards on the extensive margin is similar to the one at the intensive margin.
However, singles benefit much less. This is due to the low level of the SSI. While the earnings disregards
makes the income test less strict (i.e. at around 130EUR for a single person), this level is much below
compared to the level of the minimums wage. The current rules of social assistance in Lithuania require a
potential social assistance recipient to be employed for no less than ¾ of time, which implies that single
persons without dependents can in practice only be eligible for social assistance if unemployed.
Figure A2.2. METR2 for transition from the observed level of earnings to the minimum wage, by family type
(third scenario: C1 and C2)
Note: family types: I – for adult, i – for a child, earn- for earner.
-30
-25
-20
-15
-10
-5
0
One
ear
ner
coup
les,
no
child
ren
One
ear
ner
coup
les
with
1 c
hild
One
ear
ner
coup
les
with
2 c
hild
ren
One
ear
ner
coup
les
with
3+
chi
ldre
n
Tw
o ea
rner
cou
ples
, n
o ch
ildre
n
Tw
o ea
rner
cou
ples
, 1
chi
ld
Tw
o ea
rner
cou
ples
, 2
chi
ldre
n
Tw
o ea
rner
cou
ples
, 3
+ c
hild
ren
Sin
gle
pare
nts
Sin
gle
pers
ons
All
Change in average METRs (ppts)
SA Reform: B1 - SA recipients
Family types
-30
-25
-20
-15
-10
-5
0
One
ear
ner
coup
les,
no
child
ren
One
ear
ner
coup
les
with
1 c
hild
One
ear
ner
coup
les
with
2 c
hild
ren
One
ear
ner
coup
les
with
3+
chi
ldre
n
Tw
o ea
rner
cou
ples
, n
o ch
ildre
n
Tw
o ea
rner
cou
ples
, 1
chi
ld
Tw
o ea
rner
cou
ples
, 2
chi
ldre
n
Tw
o ea
rner
cou
ples
, 3
+ c
hild
ren
Sin
gle
pare
nts
Sin
gle
pers
ons
All
Change in average METRs (ppts)
SA Reform: B2 - SA recipients
Family types
Means-tested benefits Total change
-30
-20
-10
0
10
20
One
ear
ner
coup
les,
no
child
ren
One
ear
ner
coup
les
with
1 c
hild
One
ear
ner
coup
les
with
2 c
hild
ren
One
ear
ner
coup
les
with
3+
chi
ldre
n
Tw
o ea
rner
cou
ples
, n
o ch
ildre
n
Tw
o ea
rner
cou
ples
, 1
chi
ld
Tw
o ea
rner
cou
ples
, 2
chi
ldre
n
Tw
o ea
rner
cou
ples
, 3
+ c
hild
ren
Sin
gle
pare
nts
Sin
gle
pers
ons
All
Change in average METRs (ppts)
SA Reform: C1 - SA recipients
Family types
-30
-20
-10
0
10
20
One
ear
ner
coup
les,
no
child
ren
One
ear
ner
coup
les
with
1 c
hild
One
ear
ner
coup
les
with
2 c
hild
ren
One
ear
ner
coup
les
with
3+
chi
ldre
n
Tw
o ea
rner
cou
ples
, n
o ch
ildre
n
Tw
o ea
rner
cou
ples
, 1
chi
ld
Tw
o ea
rner
cou
ples
, 2
chi
ldre
n
Tw
o ea
rner
cou
ples
, 3
+ c
hild
ren
Sin
gle
pare
nts
Sin
gle
pers
ons
All
Change in average METRs (ppts)
SA Reform: C2 - SA recipients
Family types
Means-tested benefits Total change

ECO/WKP(2016)34
45
The impact of the reform on marginal effective tax rates when earnings are increased for the recipients of
social assistance from their current level to that of the monthly full-time minimum wage implies a decrease
of the METR among social assistance recipients across most family types. The exception is single
individuals, for whom the METR increase as the higher amount of social assistance is withdrawn due to
increase in the SSI level from 102EUR to 130EUR.