the effects of simplifications on isolated wheel aerodynamics
TRANSCRIPT
n CorrE-m
The effects of simplifications on isolated wheel aerodynamics
Sammy Diasinos a,n, Tracie J. Barber b, Graham Doig b,c
a Macquarie University, Sydney 2109, NSW, Australiab School of Mechanical and Manufacturing Engineering, The University of New South Wales, Sydney, NSW 2052, Australiac Aerospace Engineering Department, California Polytechnic State University, San Luis Obispo, CA 93407, USA
Keywords:CFDVehicle aerodynamicsWind tunnel correlationWheelsModel simplifications
esponding author.ail address: [email protected] (S. Di
a b s t r a c t
In order to study the aerodynamic forces and flow features of rotating wheels, compromises and sim-plifications are often made in wind tunnel testing, and more frequently so in numerical modelling. A CFDapproach similar to that commonly used in industry was utilised to investigate common assumptionsinvolving; the influence of geometric fidelity in wheel hub regions, ground representation, the modellingof the contact patch, and the effects of rotation on separation. It was found that the separation and wakecharacteristics were strongly influenced by the rotation of the wheel; the separation point changed by asmuch as 90% compared to a stationary wheel, and drag was close to 20% less – downforce wasapproximately 40% greater. In addition, the modelling of the contact patch, treated here as a small step tofacilitate skew-free meshing necessary for a reliable converged result, was seen to cause up to a 52%difference in predicted lift characteristics, and an increase in the step of just 2 mm decreased themaximum wake thickness by close to 50% – considerable changes stemming from superficially-minorsimplifications. Including indented wheel hubs proved to be more influential on the production ofvortices and wake structures, causing the merging of previously-separate vortex structures. The resultspoint to a need for very careful evaluation of the goals of any study when determining which simplifi-cations can be made in both physical testing and numerical analysis.
1. Introduction
In studying the effects of flowfields around wheels, simplifi-cations are often applied in order to reduce the complexity of theaerodynamics to a level which can be simulated in a reasonabletimeframe using computational fluid dynamics (CFD). In motor-sport applications, time-consuming but more realistic–transientanalysis is rare due to tight deadlines. In the wind tunnel, theinfluence of stings, the ability or otherwise to rotate the wheel atall or at a suitable velocity, and the interaction with the groundplane all serve as critical points which can affect the usefulness ofthe results (Burgin et al. 1986, Lajos et al., 1986). On top of this,satisfactory correlation of wind tunnel and/or CFD results to trackdata is notoriously difficult and the focus of much time and effort(Cruickshank and Doig 2014).
Publicly-available aerodynamic investigations of an isolatedwheel applicable to open wheel racing cars commenced with thethree dimensional experimental study undertaken by Morelli(1969). Open-wheel vehicles are used in common types of racingall the way up to Formula 1, with the tyres almost always “slick”, in
asinos).
that they rarely feature a tread pattern. Category rules dictate thatthe wheels not be shrouded or enclosed, thus fully exposing themto the oncoming flow. The wheel wakes therefore have a verystrong bearing on the aerodynamic performance of other vitalcomponents (Diasinos et al., 2014).
In Morelli’s study, the ground was represented by a stationaryground board which included a recess for the wheel to rotatewithin (i.e. the wheel was not in contact with the surface), whichresulted in a cumulative downforce-this was later shown to bepurely a product of the ground representation by Cogotti (1983),who demonstrated that an isolated wheel in contact with a trueground should produce lift. This was re-enforced by the experi-ments of Stapleford and Carr (1970), who concluded that the onlyway of making certain that the flow features reproduced during anexperiment are representative of that of a wheel belonging to anopen wheeler racing car is to have a rotating wheel in contact witha moving ground.
Fackrell and Harvey (1973, 1975) and Fackrell (1975) experi-mental investigations for three wheel widths and two wheelshoulder shapes would become the benchmark for later researchundertaken on exposed wheels, although information about thesting geometry and other influential parameters was not detailed.Lift and drag were determined to be approximately 42% and 25%lower respectively than experienced by a stationary wheel in
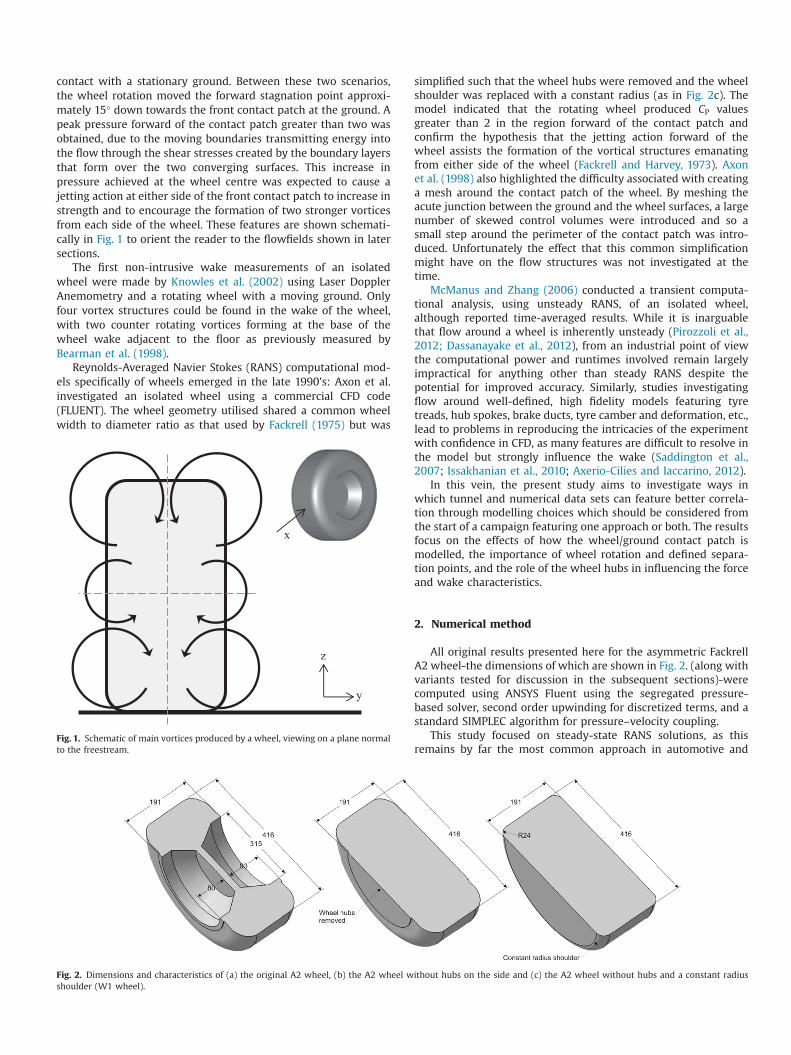
contact with a stationary ground. Between these two scenarios,the wheel rotation moved the forward stagnation point approxi-mately 15° down towards the front contact patch at the ground. Apeak pressure forward of the contact patch greater than two wasobtained, due to the moving boundaries transmitting energy intothe flow through the shear stresses created by the boundary layersthat form over the two converging surfaces. This increase inpressure achieved at the wheel centre was expected to cause ajetting action at either side of the front contact patch to increase instrength and to encourage the formation of two stronger vorticesfrom each side of the wheel. These features are shown schemati-cally in Fig. 1 to orient the reader to the flowfields shown in latersections.
The first non-intrusive wake measurements of an isolatedwheel were made by Knowles et al. (2002) using Laser DopplerAnemometry and a rotating wheel with a moving ground. Onlyfour vortex structures could be found in the wake of the wheel,with two counter rotating vortices forming at the base of thewheel wake adjacent to the floor as previously measured byBearman et al. (1998).
Reynolds-Averaged Navier Stokes (RANS) computational mod-els specifically of wheels emerged in the late 1990’s: Axon et al.investigated an isolated wheel using a commercial CFD code(FLUENT). The wheel geometry utilised shared a common wheelwidth to diameter ratio as that used by Fackrell (1975) but was
z
y
x
Fig. 1. Schematic of main vortices produced by a wheel, viewing on a plane normalto the freestream.
Fig. 2. Dimensions and characteristics of (a) the original A2 wheel, (b) the A2 wheel wshoulder (W1 wheel).
simplified such that the wheel hubs were removed and the wheelshoulder was replaced with a constant radius (as in Fig. 2c). Themodel indicated that the rotating wheel produced CP valuesgreater than 2 in the region forward of the contact patch andconfirm the hypothesis that the jetting action forward of thewheel assists the formation of the vortical structures emanatingfrom either side of the wheel (Fackrell and Harvey, 1973). Axonet al. (1998) also highlighted the difficulty associated with creatinga mesh around the contact patch of the wheel. By meshing theacute junction between the ground and the wheel surfaces, a largenumber of skewed control volumes were introduced and so asmall step around the perimeter of the contact patch was intro-duced. Unfortunately the effect that this common simplificationmight have on the flow structures was not investigated at thetime.
McManus and Zhang (2006) conducted a transient computa-tional analysis, using unsteady RANS, of an isolated wheel,although reported time-averaged results. While it is inarguablethat flow around a wheel is inherently unsteady (Pirozzoli et al.,2012; Dassanayake et al., 2012), from an industrial point of viewthe computational power and runtimes involved remain largelyimpractical for anything other than steady RANS despite thepotential for improved accuracy. Similarly, studies investigatingflow around well-defined, high fidelity models featuring tyretreads, hub spokes, brake ducts, tyre camber and deformation, etc.,lead to problems in reproducing the intricacies of the experimentwith confidence in CFD, as many features are difficult to resolve inthe model but strongly influence the wake (Saddington et al.,2007; Issakhanian et al., 2010; Axerio-Cilies and Iaccarino, 2012).
In this vein, the present study aims to investigate ways inwhich tunnel and numerical data sets can feature better correla-tion through modelling choices which should be considered fromthe start of a campaign featuring one approach or both. The resultsfocus on the effects of how the wheel/ground contact patch ismodelled, the importance of wheel rotation and defined separa-tion points, and the role of the wheel hubs in influencing the forceand wake characteristics.
2. Numerical method
All original results presented here for the asymmetric FackrellA2 wheel-the dimensions of which are shown in Fig. 2. (along withvariants tested for discussion in the subsequent sections)-werecomputed using ANSYS Fluent using the segregated pressure-based solver, second order upwinding for discretized terms, and astandard SIMPLEC algorithm for pressure–velocity coupling.
This study focused on steady-state RANS solutions, as thisremains by far the most common approach in automotive and
ithout hubs on the side and (c) the A2 wheel without hubs and a constant radius
autosport applications (including comparisons to time-averagedwind tunnel data), though it is acknowledged that the flow wouldexhibit unsteady characteristics in real life which may furtherexaggerate the influence of simplifications made to the wheelrepresentation. For this reason, additional simulations were run astransient (unsteady RANS) and the flowfields were time-averagedin order to assess the suitability of steady-state simulations for thepresent investigation. Because of a similar industry standard, allsimulations were run as incompressible, although local densitychanges, particularly in the contact patch region, may have a slightinfluence on the flow (Doig et al., 2011; Doig, 2014; Keogh et al.2014).
Convergence was deemed acceptable for steady-state solutionswhen the residual errors dropped below a normalised level of10e�4, which typically was achieved after 2000 iterations. Fur-thermore, the simulation was only deemed complete when theaerodynamic coefficients ceased to change by more than 0.1% overa continued further 1000–2000 iterations, indicating the solutionhad reached an established level which would not be altered orimproved for that particular mesh and turbulence model.
Two transient comparison simulations were run at timesteps of0.00025 s and 0.0005 s, which were calculated to be sufficient toaccount for flow movement through a single cell in one timestepbased on the cell-to-velocity ratios existing in the smaller-volumecells – maximum CFL was 0.95 in the vicinity of the wheel. Thesimulations were initiated using the steady-state solution as astarting point, after which 2 s of real-time was allowed to pass inorder for the transient flowfield to fully-establish before data wastaken.
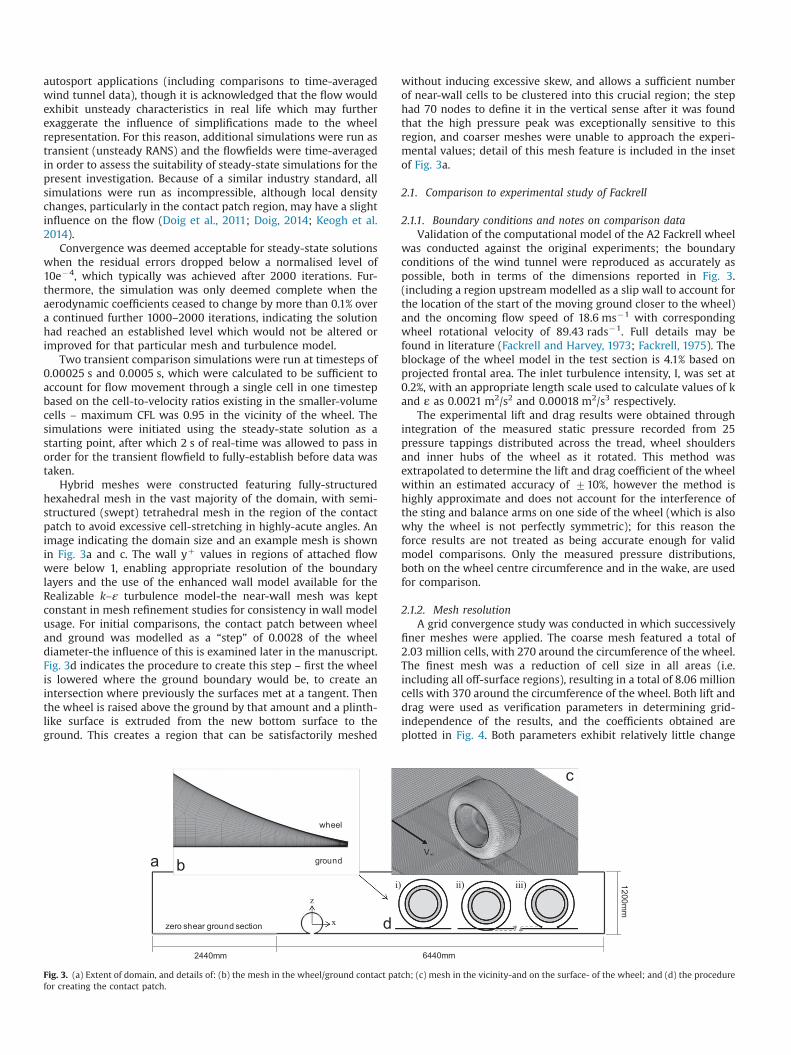
Hybrid meshes were constructed featuring fully-structuredhexahedral mesh in the vast majority of the domain, with semi-structured (swept) tetrahedral mesh in the region of the contactpatch to avoid excessive cell-stretching in highly-acute angles. Animage indicating the domain size and an example mesh is shownin Fig. 3a and c. The wall yþ values in regions of attached flowwere below 1, enabling appropriate resolution of the boundarylayers and the use of the enhanced wall model available for theRealizable k–ε turbulence model-the near-wall mesh was keptconstant in mesh refinement studies for consistency in wall modelusage. For initial comparisons, the contact patch between wheeland ground was modelled as a “step” of 0.0028 of the wheeldiameter-the influence of this is examined later in the manuscript.Fig. 3d indicates the procedure to create this step – first the wheelis lowered where the ground boundary would be, to create anintersection where previously the surfaces met at a tangent. Thenthe wheel is raised above the ground by that amount and a plinth-like surface is extruded from the new bottom surface to theground. This creates a region that can be satisfactorily meshed
zero shear ground section
2440mm
ground
wheel
iz
x
Fig. 3. (a) Extent of domain, and details of: (b) the mesh in the wheel/ground contact pafor creating the contact patch.
without inducing excessive skew, and allows a sufficient numberof near-wall cells to be clustered into this crucial region; the stephad 70 nodes to define it in the vertical sense after it was foundthat the high pressure peak was exceptionally sensitive to thisregion, and coarser meshes were unable to approach the experi-mental values; detail of this mesh feature is included in the insetof Fig. 3a.
2.1. Comparison to experimental study of Fackrell
2.1.1. Boundary conditions and notes on comparison dataValidation of the computational model of the A2 Fackrell wheel
was conducted against the original experiments; the boundaryconditions of the wind tunnel were reproduced as accurately aspossible, both in terms of the dimensions reported in Fig. 3.(including a region upstream modelled as a slip wall to account forthe location of the start of the moving ground closer to the wheel)and the oncoming flow speed of 18.6 ms�1 with correspondingwheel rotational velocity of 89.43 rads�1. Full details may befound in literature (Fackrell and Harvey, 1973; Fackrell, 1975). Theblockage of the wheel model in the test section is 4.1% based onprojected frontal area. The inlet turbulence intensity, I, was set at0.2%, with an appropriate length scale used to calculate values of kand ε as 0.0021 m2/s2 and 0.00018 m2/s3 respectively.
The experimental lift and drag results were obtained throughintegration of the measured static pressure recorded from 25pressure tappings distributed across the tread, wheel shouldersand inner hubs of the wheel as it rotated. This method wasextrapolated to determine the lift and drag coefficient of the wheelwithin an estimated accuracy of 710%, however the method ishighly approximate and does not account for the interference ofthe sting and balance arms on one side of the wheel (which is alsowhy the wheel is not perfectly symmetric); for this reason theforce results are not treated as being accurate enough for validmodel comparisons. Only the measured pressure distributions,both on the wheel centre circumference and in the wake, are usedfor comparison.
2.1.2. Mesh resolutionA grid convergence study was conducted in which successively
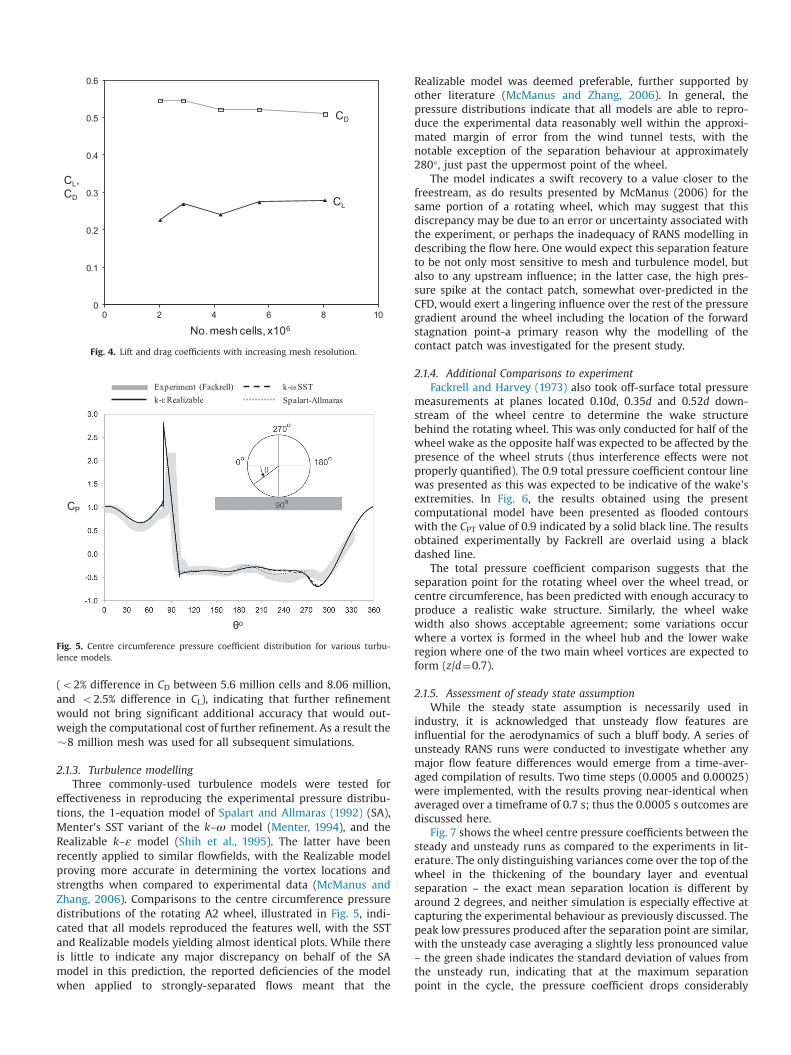
finer meshes were applied. The coarse mesh featured a total of2.03 million cells, with 270 around the circumference of the wheel.The finest mesh was a reduction of cell size in all areas (i.e.including all off-surface regions), resulting in a total of 8.06 millioncells with 370 around the circumference of the wheel. Both lift anddrag were used as verification parameters in determining grid-independence of the results, and the coefficients obtained areplotted in Fig. 4. Both parameters exhibit relatively little change
1200mm
6440mm
V∞
) ii) iii)
tch; (c) mesh in the vicinity-and on the surface- of the wheel; and (d) the procedure
0
0.1
0.2
0.3
0.4
0.5
0.6
0 2 4 6 8 10
CL, CD
No. mesh cells, x106
CL
CD
Fig. 4. Lift and drag coefficients with increasing mesh resolution.
CP
θo
Experiment (Fackrell)k-ε Realizable
k-ω SSTSpalart-Allmaras
Fig. 5. Centre circumference pressure coefficient distribution for various turbu-lence models.
(o2% difference in CD between 5.6 million cells and 8.06 million,and o2.5% difference in CL), indicating that further refinementwould not bring significant additional accuracy that would out-weigh the computational cost of further refinement. As a result the�8 million mesh was used for all subsequent simulations.
2.1.3. Turbulence modellingThree commonly-used turbulence models were tested for
effectiveness in reproducing the experimental pressure distribu-tions, the 1-equation model of Spalart and Allmaras (1992) (SA),Menter's SST variant of the k–ω model (Menter, 1994), and theRealizable k–ε model (Shih et al., 1995). The latter have beenrecently applied to similar flowfields, with the Realizable modelproving more accurate in determining the vortex locations andstrengths when compared to experimental data (McManus andZhang, 2006). Comparisons to the centre circumference pressuredistributions of the rotating A2 wheel, illustrated in Fig. 5, indi-cated that all models reproduced the features well, with the SSTand Realizable models yielding almost identical plots. While thereis little to indicate any major discrepancy on behalf of the SAmodel in this prediction, the reported deficiencies of the modelwhen applied to strongly-separated flows meant that the
Realizable model was deemed preferable, further supported byother literature (McManus and Zhang, 2006). In general, thepressure distributions indicate that all models are able to repro-duce the experimental data reasonably well within the approxi-mated margin of error from the wind tunnel tests, with thenotable exception of the separation behaviour at approximately280°, just past the uppermost point of the wheel.
The model indicates a swift recovery to a value closer to thefreestream, as do results presented by McManus (2006) for thesame portion of a rotating wheel, which may suggest that thisdiscrepancy may be due to an error or uncertainty associated withthe experiment, or perhaps the inadequacy of RANS modelling indescribing the flow here. One would expect this separation featureto be not only most sensitive to mesh and turbulence model, butalso to any upstream influence; in the latter case, the high pres-sure spike at the contact patch, somewhat over-predicted in theCFD, would exert a lingering influence over the rest of the pressuregradient around the wheel including the location of the forwardstagnation point-a primary reason why the modelling of thecontact patch was investigated for the present study.
2.1.4. Additional Comparisons to experimentFackrell and Harvey (1973) also took off-surface total pressure
measurements at planes located 0.10d, 0.35d and 0.52d down-stream of the wheel centre to determine the wake structurebehind the rotating wheel. This was only conducted for half of thewheel wake as the opposite half was expected to be affected by thepresence of the wheel struts (thus interference effects were notproperly quantified). The 0.9 total pressure coefficient contour linewas presented as this was expected to be indicative of the wake’sextremities. In Fig. 6, the results obtained using the presentcomputational model have been presented as flooded contourswith the CPT value of 0.9 indicated by a solid black line. The resultsobtained experimentally by Fackrell are overlaid using a blackdashed line.
The total pressure coefficient comparison suggests that theseparation point for the rotating wheel over the wheel tread, orcentre circumference, has been predicted with enough accuracy toproduce a realistic wake structure. Similarly, the wheel wakewidth also shows acceptable agreement; some variations occurwhere a vortex is formed in the wheel hub and the lower wakeregion where one of the two main wheel vortices are expected toform (z/d¼0.7).
2.1.5. Assessment of steady state assumptionWhile the steady state assumption is necessarily used in
industry, it is acknowledged that unsteady flow features areinfluential for the aerodynamics of such a bluff body. A series ofunsteady RANS runs were conducted to investigate whether anymajor flow feature differences would emerge from a time-aver-aged compilation of results. Two time steps (0.0005 and 0.00025)were implemented, with the results proving near-identical whenaveraged over a timeframe of 0.7 s; thus the 0.0005 s outcomes arediscussed here.
Fig. 7 shows the wheel centre pressure coefficients between thesteady and unsteady runs as compared to the experiments in lit-erature. The only distinguishing variances come over the top of thewheel in the thickening of the boundary layer and eventualseparation – the exact mean separation location is different byaround 2 degrees, and neither simulation is especially effective atcapturing the experimental behaviour as previously discussed. Thepeak low pressures produced after the separation point are similar,with the unsteady case averaging a slightly less pronounced value– the green shade indicates the standard deviation of values fromthe unsteady run, indicating that at the maximum separationpoint in the cycle, the pressure coefficient drops considerably

x/d = 0.104 x/d = 0.350 x/d = 0.520
1-1 coef. of total pressure
reference projection of wheel outline
Experimental (Fackrell)total pressure coef. of 1
CFD total pressure coef. of 1
Fig. 6. Contours of coefficient of total pressure at planes normal to the freestream in comparison to experiment.
Experiment (Fackrell)Unsteady RANS (av.)
Steady RANSUnsteady RANS (max. min.)
CP
θo
CL CD
t* (s)
CL CD
0 1 2
0.30
0.25
0.570.530.49
Fig. 7. Centre circumference pressure distribution for steady state vs. unsteady(averaged) results, and (inset) sample transient CL and CD values over a typical 2.5 speriod.
below the steady state prediction to almost �1. However, for themajority of the timeframe the flow remains attached towards thefurthest extent, at around 270°. The inset graph of Fig. 7 (forcecoefficients) indicates that the unsteady results exhibited regularvortex shedding induced by the oscillating upper separation point,however the magnitude of variation and the notable consistencyhighlights the diffusivity of the RANS approach in general; thevariations in coefficients are too regular and narrow in range to betruly typical of what could be expected in reality or from anequivalent LES or DES simulation. Nevertheless the validity of thesteady-state RANS approach over averaged unsteady RANS issatisfactory as the mean outcomes are near-identical.
A further indication of the similarity between the two types ofsimulation is seen in Fig. 8, where total pressure coefficient valueson perpendicular planes close to the middle of the wheel atx¼0.104d and further downstream at 0.350d are plotted. There arevery subtle differences in the lateral extent of the averaged pres-sure field which “pumps” out of the hub region, and the tyre“squish” from flow being pushed out of the contact patch zone isslightly affected. In addition, as is clearer at x¼0.350d, the slightlyearlier average separation point creates a slightly taller wake (as
seen in the contours extending above z/d¼1), though one which isgenerally equivalent in strength and structure to the steady stateresult. Due to these similarities, continued transient runs were notdeemed necessary in order to productively examine the particularinfluences that form the focus of the main investigation.
3. Effect of wheel rotation and separation on force and wakecharacteristics
The initial hypothesis proposed by Fackrell (1975) to explainthe large variation in the primary wheel vortex position betweenrotating (with moving ground) and stationary (with stationaryground) models suggested that a pair of additional vortices formforward of the rotating wheel, due to the flow separating from theground. It was believed that these vortices alter the path of theoncoming flow around the front contact patch allowing the pri-mary wheel vortices to form in a more central and higher positionwithin the wake of a rotating wheel. The computational resultsobtained thus far have provided no evidence of these vortices, inagreement with other reports (McManus and Zhang, 2006).
An alternative theory proposes that the cause of the wider andlower position of the primary wheel vortices associated with astationary wheel is due to the ejected flow from the front contactpatch being deflected to a lesser extent by the oncoming flow dueto the boundary layer formation over the stationary ground(McManus and Zhang, 2006). As a result, the jetting action wasexpected to contribute a greater cross component in the stationarywheel wake than that which would be experienced by the rotatingwheel with a moving ground.
To examine this, the stationary ground was replaced with a slipcondition so that the boundary layer would be completely elimi-nated, and the stationary wheel was used. A moving groundcondition was not used since a boundary layer, albeit smaller,would still develop (Barber et al., 2002; Kim and Geropp, 1998).According to the hypothesis, a wheel wake structure that containsthe primary vortices in a position that more closely resembles thatof a rotating wheel should be obtained since the ejected flow cannow be deflected to the full extent of the oncoming free streamvelocity.
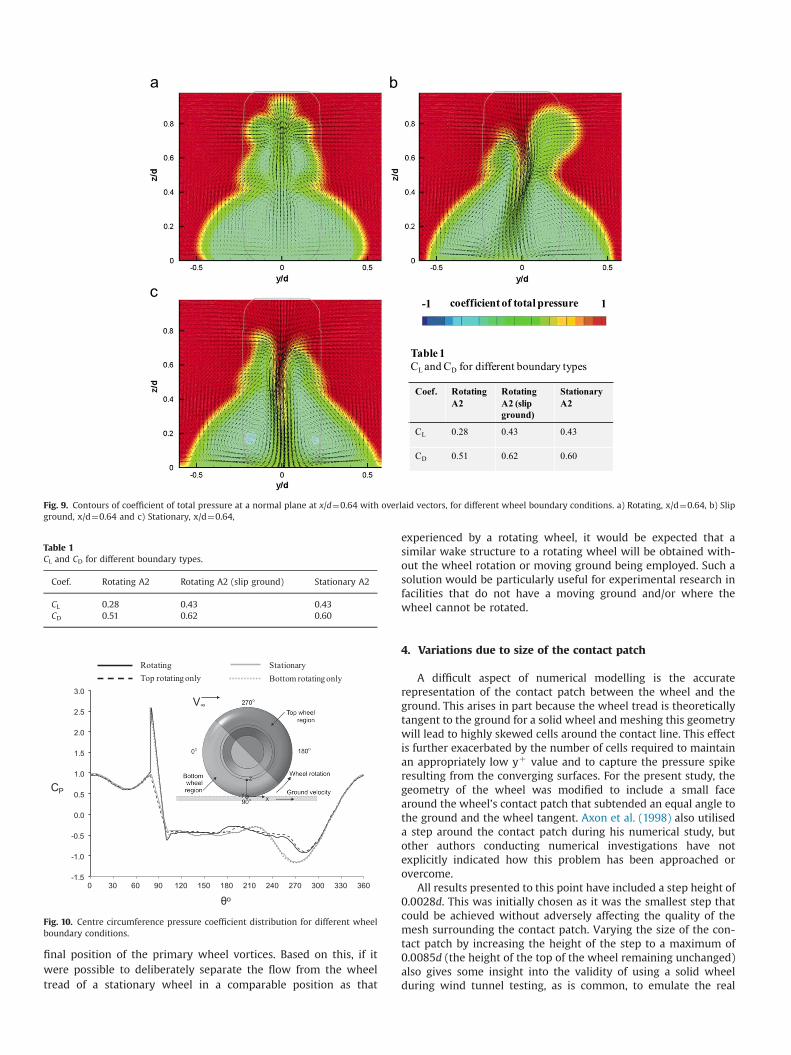
Total pressure contours and in-plane vectors located atx/c¼0.64 were plotted with the wheel outline shown in grey forreference (Fig. 9). The results indicate that replacing the stationary

x = 0.104d
CPT
Unsteady av. Steady state
Unsteady av. Steady state
x = 0.350d
Fig. 8. Total pressure coefficient contours on planes bisecting the wheel close tothe centre and towards the rear, for unsteady vs. steady state results.
ground with a slip condition does not alter the lower wheel wakein any significant manner. Despite the wheel wake taking a moreasymmetric shape, the primary wheel vortices have formed in asimilar position (Fig. 7b, y/d¼�0.2, z/d¼0.2 and y/d¼0.15, z/d¼0.15) compared to stationary wheel results (Fig. 7c, y/d¼�0.2,z/d¼0.15 and y/d¼0.15, z/d¼0.2). The lift and drag values alsoclosely resemble those of a stationary wheel, further confirmingthat no significant variation has been obtained (Table 1). Thereforethe influence that the boundary layer developing over a stationaryground has on the jetting action can be largely eliminated as anexplanation for the variation in the lower wheel wake shapebetween a stationary and rotating wheel.
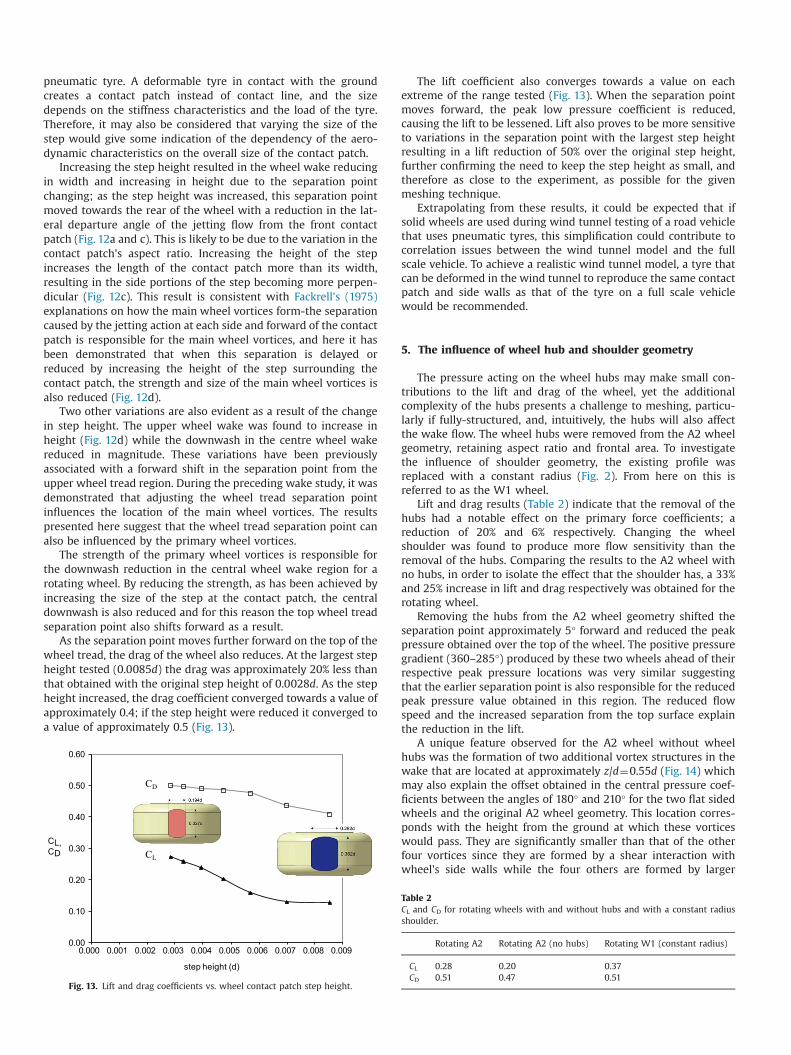
Further to the increased jetting action forward of the frontcontact patch, Fackrell also indicated that the wheel rotationcauses an earlier separation point from the top wheel tread. Iso-lating these two characteristics of a rotating wheel in the A2 CFDmodel was achieved by splitting the wheel boundary into upperand lower boundaries and then only applying the wheel rotationto either boundary. In the case where the lower wheel region wasrotated, a moving ground was also employed. As demonstrated inthe inset in Fig. 10, the lower wheel boundary included the regionof the wheel between �45°oθo135° while the remaining por-tion of the wheel was included in the upper wheel boundary.
This unorthodox approach successfully managed to indepen-dently create the main features associated with a rotating wheel.The ability to apply such a boundary condition with ease alsodemonstrates one advantage of using a computational model forsuch an investigation in comparison to taking a purely experi-mental approach. By applying the wheel rotation at the top, anearlier separation point that closely resembles that of the rotatingwheel has been achieved while at the base, the y-velocity com-ponents indicates that no additional jetting action has been pro-duced The opposite holds when the wheel rotation is applied onlyto the bottom portion of the wheel, with the separation beingrepresentative of the stationary case while the jetting actionexperienced is indicative of a rotating wheel.
The circumferential pressure coefficients (Fig. 10) also confirmthat the flow features located at the base or at the top of a rotatingwheel have been reproduced and that the two characteristicsassociated with the wheel rotation have been created indepen-dently. The high pressure coefficient peak of the rotating wheel,which is responsible for the increased jetting action, was repli-cated when only the bottom portion of the wheel rotated. This hashad no effect on the separation point from the top of the wheelwith pressure coefficients in the region of 190°oθo360° of thewheel being identical to those associated with a stationary case.
To determine the influence of wheel rotation on the vorticeswithin the wake structure, total pressure contours and in-planevelocity vectors were used to compare the wake on the x/c¼0.75plane (Fig. 9). Based upon these results, the separation point fromthe top wheel tread appears to be the critical flow feature thatcauses the primary wheel vortices to form in a higher and moreinboard position (Fig. 11a, y/d¼�0.1, z/d¼0.45 and y/d¼0.15, z/d¼0.4). The top-rotating wheel also reproduced the upper wheelvortices associated with the wheel tread separation (Fig. 11b, y/d¼�0.1, z/d¼0.75 and y/d¼0.1, z/d¼0.75). When only the topportion of the wheel boundary was rotated, the primary wheelvortices were located more inboard and higher than those asso-ciated with a completely rotating wheel (Fig. 11b, y/d¼�0.15, z/d¼0.3 and y/d¼0.15, z/d¼0.3) suggesting that the jetting actiondraws the primary wheel vortices outboard and lower.
This also indicates that the wheel tread separation point con-trols the distribution of flow entrainment into the wheel wakefrom either the top of the wheel or around the sides and istherefore independent of the extent of the jetting action forwardof the wheel. As the separation point from the top surface of thewheel moves forward, less flow is entrained from the top of thewheel and this is compensated by an increased entrainment fromthe sides of the wheel. For this reason the rotating wheel lacks thelarge downwash component in the central wake region observedfor the stationary wheel (Fig. 11d). The main vortices for the sta-tionary wheel are forced down and apart by this downwashcomponent and therefore form further from the central plane andcloser to the ground causing the wider lower wheel wake.
Therefore, while the jetting action may make a small con-tribution to the final position of the primary wheel vortices, whenthe top wheel tread separation is delayed, the downwash in thewheel wake becomes the dominant feature in determining the
-1 coefficient of total pressure
Coef. Rotating A2
RotatingA2 (slip ground)
Stationary A2
CL 0.28 0.43 0.43
CD 0.51 0.62 0.60
1
Table 1CL and CD for different boundary types
Fig. 9. Contours of coefficient of total pressure at a normal plane at x/d¼0.64 with overlaid vectors, for different wheel boundary conditions. a) Rotating, x/d¼0.64, b) Slipground, x/d¼0.64 and c) Stationary, x/d¼0.64,
Table 1CL and CD for different boundary types.
Coef. Rotating A2 Rotating A2 (slip ground) Stationary A2
CL 0.28 0.43 0.43CD 0.51 0.62 0.60
-1.5
-1.0
-0.5
0.0
0.5
1.0
1.5
2.0
2.5
3.0
0 30 60 90 120 150 180 210 240 270 300 330 360
CP
θo
RotatingTop rotating only
StationaryBottom rotating only
V∞
Fig. 10. Centre circumference pressure coefficient distribution for different wheelboundary conditions.
final position of the primary wheel vortices. Based on this, if itwere possible to deliberately separate the flow from the wheeltread of a stationary wheel in a comparable position as that
experienced by a rotating wheel, it would be expected that asimilar wake structure to a rotating wheel will be obtained with-out the wheel rotation or moving ground being employed. Such asolution would be particularly useful for experimental research infacilities that do not have a moving ground and/or where thewheel cannot be rotated.
4. Variations due to size of the contact patch
A difficult aspect of numerical modelling is the accuraterepresentation of the contact patch between the wheel and theground. This arises in part because the wheel tread is theoreticallytangent to the ground for a solid wheel and meshing this geometrywill lead to highly skewed cells around the contact line. This effectis further exacerbated by the number of cells required to maintainan appropriately low yþ value and to capture the pressure spikeresulting from the converging surfaces. For the present study, thegeometry of the wheel was modified to include a small facearound the wheel’s contact patch that subtended an equal angle tothe ground and the wheel tangent. Axon et al. (1998) also utiliseda step around the contact patch during his numerical study, butother authors conducting numerical investigations have notexplicitly indicated how this problem has been approached orovercome.
All results presented to this point have included a step height of0.0028d. This was initially chosen as it was the smallest step thatcould be achieved without adversely affecting the quality of themesh surrounding the contact patch. Varying the size of the con-tact patch by increasing the height of the step to a maximum of0.0085d (the height of the top of the wheel remaining unchanged)also gives some insight into the validity of using a solid wheelduring wind tunnel testing, as is common, to emulate the real

reference projection
of wheel outline
1-1 coefficient of total pressure
Fig. 11. Contours of coefficient of total pressure at a normal plane at x/d¼0.64 with overlaid vectors, for rotating, stationary, and part-rotating wheel surfaces. a) Rotating,x/d¼0.64, b) Tap rotating, x/d¼0.64, c) Bottom Rotating, x/d¼0.64, d) and Stationary, x/d¼0.64.
Fig. 12. Contours of coefficient of total pressure at a normal plane at x/d¼0.64 and on the ground plane, with overlaid vectors, for contact patch step heights of 0.0028d and0.0085d. a) z/d¼0.015, step height¼0.0028d b) x/d¼0.64, step height¼0.0028d c) z/d¼0.015, step height¼0.0085d d) x/d¼0.64, step height¼0.0085d.
pneumatic tyre. A deformable tyre in contact with the groundcreates a contact patch instead of contact line, and the sizedepends on the stiffness characteristics and the load of the tyre.Therefore, it may also be considered that varying the size of thestep would give some indication of the dependency of the aero-dynamic characteristics on the overall size of the contact patch.
Increasing the step height resulted in the wheel wake reducingin width and increasing in height due to the separation pointchanging; as the step height was increased, this separation pointmoved towards the rear of the wheel with a reduction in the lat-eral departure angle of the jetting flow from the front contactpatch (Fig. 12a and c). This is likely to be due to the variation in thecontact patch’s aspect ratio. Increasing the height of the stepincreases the length of the contact patch more than its width,resulting in the side portions of the step becoming more perpen-dicular (Fig. 12c). This result is consistent with Fackrell’s (1975)explanations on how the main wheel vortices form-the separationcaused by the jetting action at each side and forward of the contactpatch is responsible for the main wheel vortices, and here it hasbeen demonstrated that when this separation is delayed orreduced by increasing the height of the step surrounding thecontact patch, the strength and size of the main wheel vortices isalso reduced (Fig. 12d).
Two other variations are also evident as a result of the changein step height. The upper wheel wake was found to increase inheight (Fig. 12d) while the downwash in the centre wheel wakereduced in magnitude. These variations have been previouslyassociated with a forward shift in the separation point from theupper wheel tread region. During the preceding wake study, it wasdemonstrated that adjusting the wheel tread separation pointinfluences the location of the main wheel vortices. The resultspresented here suggest that the wheel tread separation point canalso be influenced by the primary wheel vortices.
The strength of the primary wheel vortices is responsible forthe downwash reduction in the central wheel wake region for arotating wheel. By reducing the strength, as has been achieved byincreasing the size of the step at the contact patch, the centraldownwash is also reduced and for this reason the top wheel treadseparation point also shifts forward as a result.
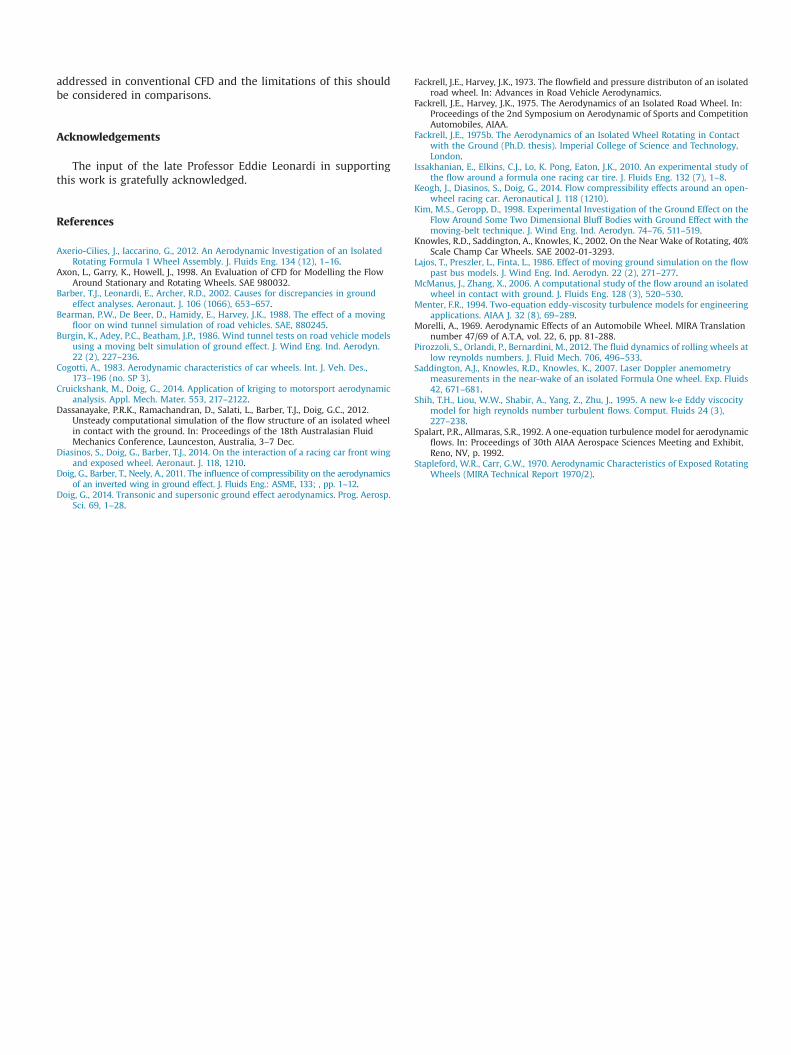
As the separation point moves further forward on the top of thewheel tread, the drag of the wheel also reduces. At the largest stepheight tested (0.0085d) the drag was approximately 20% less thanthat obtained with the original step height of 0.0028d. As the stepheight increased, the drag coefficient converged towards a value ofapproximately 0.4; if the step height were reduced it converged toa value of approximately 0.5 (Fig. 13).
0.00
0.10
0.20
0.30
0.40
0.50
0.60
0.000 0.001 0.002 0.003 0.004 0.005 0.006 0.007 0.008 0.009
CL, CD
step height (d)
CD
CL
Fig. 13. Lift and drag coefficients vs. wheel contact patch step height.
The lift coefficient also converges towards a value on eachextreme of the range tested (Fig. 13). When the separation pointmoves forward, the peak low pressure coefficient is reduced,causing the lift to be lessened. Lift also proves to be more sensitiveto variations in the separation point with the largest step heightresulting in a lift reduction of 50% over the original step height,further confirming the need to keep the step height as small, andtherefore as close to the experiment, as possible for the givenmeshing technique.
Extrapolating from these results, it could be expected that ifsolid wheels are used during wind tunnel testing of a road vehiclethat uses pneumatic tyres, this simplification could contribute tocorrelation issues between the wind tunnel model and the fullscale vehicle. To achieve a realistic wind tunnel model, a tyre thatcan be deformed in the wind tunnel to reproduce the same contactpatch and side walls as that of the tyre on a full scale vehiclewould be recommended.
5. The influence of wheel hub and shoulder geometry
The pressure acting on the wheel hubs may make small con-tributions to the lift and drag of the wheel, yet the additionalcomplexity of the hubs presents a challenge to meshing, particu-larly if fully-structured, and, intuitively, the hubs will also affectthe wake flow. The wheel hubs were removed from the A2 wheelgeometry, retaining aspect ratio and frontal area. To investigatethe influence of shoulder geometry, the existing profile wasreplaced with a constant radius (Fig. 2). From here on this isreferred to as the W1 wheel.
Lift and drag results (Table 2) indicate that the removal of thehubs had a notable effect on the primary force coefficients; areduction of 20% and 6% respectively. Changing the wheelshoulder was found to produce more flow sensitivity than theremoval of the hubs. Comparing the results to the A2 wheel withno hubs, in order to isolate the effect that the shoulder has, a 33%and 25% increase in lift and drag respectively was obtained for therotating wheel.
Removing the hubs from the A2 wheel geometry shifted theseparation point approximately 5° forward and reduced the peakpressure obtained over the top of the wheel. The positive pressuregradient (360–285°) produced by these two wheels ahead of theirrespective peak pressure locations was very similar suggestingthat the earlier separation point is also responsible for the reducedpeak pressure value obtained in this region. The reduced flowspeed and the increased separation from the top surface explainthe reduction in the lift.
A unique feature observed for the A2 wheel without wheelhubs was the formation of two additional vortex structures in thewake that are located at approximately z/d¼0.55d (Fig. 14) whichmay also explain the offset obtained in the central pressure coef-ficients between the angles of 180° and 210° for the two flat sidedwheels and the original A2 wheel geometry. This location corres-ponds with the height from the ground at which these vorticeswould pass. They are significantly smaller than that of the otherfour vortices since they are formed by a shear interaction withwheel’s side walls while the four others are formed by larger
Table 2CL and CD for rotating wheels with and without hubs and with a constant radiusshoulder.
Rotating A2 Rotating A2 (no hubs) Rotating W1 (constant radius)
CL 0.28 0.20 0.37CD 0.51 0.47 0.51

reference projection
of wheel outline
10 normalized x-vorticitymagnitude
Fig. 14. Flow structures associated with the A2 wheel,with and without the hubs, at downstream locations of x/d¼0.64 and 0.75. a) A2 Rotating, x/d¼0.64 b) A2 No HubsRotating, x/d¼0.64 c) A2 Rotating, x/d¼0.75 d) A2 No Hubs Rotating, x/d¼0.75.
pressure variations that occur in the wheel wake due to separa-tion. As a result, these two vortices dissipate by the x/d¼0.75plane leaving the four initial vortices commonly reported furtherdownstream; this effect was originally speculated to occur byCogotti (1978).
While McManus and Zhang (2006) and Fackrell (1975) foundno evidence of a third pair of vortices in the wheel wake, theresults here suggest that this could simply be because theirresearch was conducted with hubs and not with flat sided wheels.
Consistent with the observations linking the separation pointwith the wake width and height, the A2 wheel without hubsproduced a narrower and higher wake in comparison to the ori-ginal geometry. This smaller wake structure was expected giventhe reduction in total drag already reported for this configuration.The formation of the two middle vortices increased the entrain-ment from the sides in the lower wheel wake region and reducedthe downwash behind the wheel caused by the earlier separationpoint from the top surface.
Examining the constant-radius shoulder case, where the overallwidth was maintained but the tread was effectively wider, a largerregion of increased static pressure was observed forward of thewheel that is responsible for the steeper pressure gradient thatshown in the central pressure coefficients (360–285°), and wouldalso be expected to contribute to the drag increase obtained bythis wheel geometry.
A wider and lower wheel wake was also observed in thisinstance. The wider wheel tread results in a more extensive
contact patch and therefore the jetting action for this wheel occursfurther from the wheel centre line than that which resulted pre-viously from the A2 wheel without hubs (Fig. 15). This forces thelower wheel vortices to form further outboard in the wheel wakeand this influences the separation point located on the upperportion of the wheel tread. In the middle of the upper wheel wakeregion, a larger downwash component was obtained which iscaused by an increased flow over the top surface of the wheel anda reduced entrainment from the sides. This variation assists withdelaying the separation point, and is also responsible for the 85%increase in lift obtained by changing the wheel shoulder relative tothe original.
Despite these large variations in the flow around the wheel, thebasic flow structures associated with a rotating wheel weremaintained. The two upper wheel vortices appear to have incre-ased in strength, and this may be due to the increased entrainmentexperienced in the upper central wake region and the steeperadverse pressure gradient experienced by the flow when passingaround the rearward portion of the wheel shoulder.
6. Conclusions
Several common modelling assumptions and simplificationswith regards to isolated wheels have been examined to determinetheir influence on the flowfields obtained. Geometric variationscan alter the details in flow of either a rotating or stationary wheel

reference projection
of wheel outline
1.30 V/V∞ 1-1 coefficient of total pressure
Fig. 15. Wake comparisons of the A2 wheel with and without the hubs and with a constant radius shoulder. a) A2 Rotating, y/d¼0 b) A2 Rotating, x/d¼0 c) A2 No HubsRotating, y/d¼0 d) A2 No Hubs Rotating, x/d¼0 e) W1 Rotating, y/d¼0 f) W1 Rotating, x/d¼0.
and as a result create significant changes to the final lift and dragvalues obtained for a wheel. In comparing rotating to stationarywheels, the main wheel vortices form in a higher and more centralposition because of the earlier separation caused by the wheelrotation. This causes a reduction of flow entrainment from the topremoving the downwash from the central wake region associatedwith a stationary wheel, and is replaced by an increase inentrainment from the sides for a rotating wheel. The lift and draghave also been shown to be sensitive to the separation locationwith a more forward separation point causing both the lift anddrag to decrease. Only the drag was found to be sensitive to thejetting action at the contact patch. Removing the wheel hubs
proved to be influential with regards to predicted lift (30% less),but less so in terms of drag (8%), despite a significantly alteredwake structure. Equally influential was the imposition of a con-stant-radius wheel shoulder, which increased the lift by 30%.Relatively small simplifications such as these can therefore exert alarge influence on the results, and one can imagine the influenceon bodywork downstream for simulations of full vehicles, forinstance.
In general it has been re-enforced that, if one is comparingnumerical to wind tunnel tests, the more exact the match to theexperimental conditions the better the correlation. However, theissue of accurately modelling the contact patch region is not easily
addressed in conventional CFD and the limitations of this shouldbe considered in comparisons.
Acknowledgements
The input of the late Professor Eddie Leonardi in supportingthis work is gratefully acknowledged.
References
Axerio-Cilies, J., Iaccarino, G., 2012. An Aerodynamic Investigation of an IsolatedRotating Formula 1 Wheel Assembly. J. Fluids Eng. 134 (12), 1–16.
Axon, L., Garry, K., Howell, J., 1998. An Evaluation of CFD for Modelling the FlowAround Stationary and Rotating Wheels. SAE 980032.
Barber, T.J., Leonardi, E., Archer, R.D., 2002. Causes for discrepancies in groundeffect analyses. Aeronaut. J. 106 (1066), 653–657.
Bearman, P.W., De Beer, D., Hamidy, E., Harvey, J.K., 1988. The effect of a movingfloor on wind tunnel simulation of road vehicles. SAE, 880245.
Burgin, K., Adey, P.C., Beatham, J.P., 1986. Wind tunnel tests on road vehicle modelsusing a moving belt simulation of ground effect. J. Wind Eng. Ind. Aerodyn.22 (2), 227–236.
Cogotti, A., 1983. Aerodynamic characteristics of car wheels. Int. J. Veh. Des.,173–196 (no. SP 3).
Cruickshank, M., Doig, G., 2014. Application of kriging to motorsport aerodynamicanalysis. Appl. Mech. Mater. 553, 217–2122.
Dassanayake, P.R.K., Ramachandran, D., Salati, L., Barber, T.J., Doig, G.C., 2012.Unsteady computational simulation of the flow structure of an isolated wheelin contact with the ground. In: Proceedings of the 18th Australasian FluidMechanics Conference, Launceston, Australia, 3–7 Dec.
Diasinos, S., Doig, G., Barber, T.J., 2014. On the interaction of a racing car front wingand exposed wheel. Aeronaut. J. 118, 1210.
Doig, G., Barber, T., Neely, A., 2011. The influence of compressibility on the aerodynamicsof an inverted wing in ground effect. J. Fluids Eng.: ASME, 133; , pp. 1–12.
Doig, G., 2014. Transonic and supersonic ground effect aerodynamics. Prog. Aerosp.Sci. 69, 1–28.
Fackrell, J.E., Harvey, J.K., 1973. The flowfield and pressure distributon of an isolatedroad wheel. In: Advances in Road Vehicle Aerodynamics.
Fackrell, J.E., Harvey, J.K., 1975. The Aerodynamics of an Isolated Road Wheel. In:Proceedings of the 2nd Symposium on Aerodynamic of Sports and CompetitionAutomobiles, AIAA.
Fackrell, J.E., 1975b. The Aerodynamics of an Isolated Wheel Rotating in Contactwith the Ground (Ph.D. thesis). Imperial College of Science and Technology,London.
Issakhanian, E., Elkins, C.J., Lo, K. Pong, Eaton, J.K., 2010. An experimental study ofthe flow around a formula one racing car tire. J. Fluids Eng. 132 (7), 1–8.
Keogh, J., Diasinos, S., Doig, G., 2014. Flow compressibility effects around an open-wheel racing car. Aeronautical J. 118 (1210).
Kim, M.S., Geropp, D., 1998. Experimental Investigation of the Ground Effect on theFlow Around Some Two Dimensional Bluff Bodies with Ground Effect with themoving-belt technique. J. Wind Eng. Ind. Aerodyn. 74–76, 511–519.
Knowles, R.D., Saddington, A., Knowles, K., 2002. On the Near Wake of Rotating, 40%Scale Champ Car Wheels. SAE 2002-01-3293.
Lajos, T., Preszler, L., Finta, L., 1986. Effect of moving ground simulation on the flowpast bus models. J. Wind Eng. Ind. Aerodyn. 22 (2), 271–277.
McManus, J., Zhang, X., 2006. A computational study of the flow around an isolatedwheel in contact with ground. J. Fluids Eng. 128 (3), 520–530.
Menter, F.R., 1994. Two-equation eddy-viscosity turbulence models for engineeringapplications. AIAA J. 32 (8), 69–289.
Morelli, A., 1969. Aerodynamic Effects of an Automobile Wheel. MIRA Translationnumber 47/69 of A.T.A, vol. 22, 6, pp. 81-288.
Pirozzoli, S., Orlandi, P., Bernardini, M., 2012. The fluid dynamics of rolling wheels atlow reynolds numbers. J. Fluid Mech. 706, 496–533.
Saddington, A.J., Knowles, R.D., Knowles, K., 2007. Laser Doppler anemometrymeasurements in the near-wake of an isolated Formula One wheel. Exp. Fluids42, 671–681.
Shih, T.H., Liou, W.W., Shabir, A., Yang, Z., Zhu, J., 1995. A new k-e Eddy viscocitymodel for high reynolds number turbulent flows. Comput. Fluids 24 (3),227–238.
Spalart, P.R., Allmaras, S.R., 1992. A one-equation turbulence model for aerodynamicflows. In: Proceedings of 30th AIAA Aerospace Sciences Meeting and Exhibit,Reno, NV, p. 1992.
Stapleford, W.R., Carr, G.W., 1970. Aerodynamic Characteristics of Exposed RotatingWheels (MIRA Technical Report 1970/2).