the effects of soft drink taxes on child and adolescent...
TRANSCRIPT

The Effects of Soft Drink Taxes on Child and Adolescent Consumption and Weight Outcomes*
Jason M. Fletcher†, David E. Frisvold‡ and Nathan Tefft§
August 26, 2009
Abstract Childhood and adolescent obesity is associated with serious lifetime health consequences and has seen a recent rapid increase in prevalence. Soft drink consumption has also expanded rapidly, so much so that soft drinks are currently the largest single contributors to energy intake. In this paper, we investigate the potential for soft drink taxes to combat rising levels of adolescent obesity through a reduction in consumption. Our results, based on state soft drink sales and excise tax information between 1988 and 2006 and the National Health Examination and Nutrition Survey, suggest that soft drink taxation, as currently practiced in the United States, leads to a moderate reduction in soft drink consumption by children and adolescents. However, we show that this reduction in soda consumption is completely offset by increases in consumption of other high calorie drinks.
JEL classification codes: I18; H75 Keywords: Obesity; Soft Drink Taxation
* This study was supported, in part, by the Robert Wood Johnson Foundation and the Emory Global Health Institute. We thank Jeremy Green, Alejandra Carrillo Roa, and John Zimmerman for excellent research assistance. We thank Alexandra Ehrlich and Stephanie Robinson for support with the restricted NHANES data. We also thank Meena Fernandes and participants at the International Health Economics Association World Congress for helpful comments. † School of Public Health, Division of Health Policy and Administration, Yale University, 60 College Street, New Haven, CT 06510, USA, email: [email protected]. ‡ Department of Economics, Emory University, Atlanta, GA 30322-2240, USA, email: [email protected]. § Department of Economics, Bates College, 4 Andrews Road, Lewiston, ME 04240, email: [email protected].
1
Introduction
While soft drink taxes have been used for decades as a way to raise revenues, lately there
have been an increasing number of proposals to considerably increase these taxes in order to
combat the rapidly growing obesity epidemic in the United States. These proposals have often
framed soda taxation as a “sin tax” and made comparisons between soft drink taxation and
cigarette taxation, which has both lowered tobacco consumption and raised considerable
revenues. The price elasticity for soda is estimated to range between -0.8 and -1.0 (Andreyeva et
al. in press), which indicates that further taxation could lead to substantial consumption
reduction. Additionally, soft drink revenues in the United States are approximately $70.1 billion
per year, suggesting a relatively large tax revenue potential, even accounting for the drop in
consumption from a soda tax (Sicher 2007); in comparison tobacco revenues are approximately
$93.1 billion per year (Tobacco-NAFTA Industry Guide 2009). Thus soft drink taxation could
improve health by lowering consumption, as well as generate substantial revenues to relax
government budget constraints and could potentially be used for further obesity prevention or
reduction. However, the potential behavioral responses to increasing soda taxes have not been
fully examined. There is relatively weak information on the tax elasticity on consumption of soft
drink taxes, and, importantly, the substitution patterns between soft drinks and other (potentially
high-calorie) beverages has not been adequately explored in this context. Thus soda taxes could
have unintended consequences and may be an ineffective “obesity tax”.
There are multiple examples documenting how behavioral responses to public policies
can counteract the intent of the policies or lead to unintended consequences. One of the best
known examples in the economics literature is an evaluation of a set of automobile safety
regulations in the late 1960s, where Peltzman (1975) shows that drivers responded to increased
2
safety regulations by driving faster, which completely offset any reductions in highway fatalities.
More recently, Adams and Cotti (2008) show that smoking bans in bars have lead to increases in
fatal accidents due to an increase in the distance driven to bars that allow smoking. Adda and
Cornaglia (in press) find that smoking bans increase the exposure of non-smokers to tobacco
smoke as a result of the relocation of smokers away from bars and restaurants. There is also
some evidence documenting an unintended rise in obesity and weight due to smoking bans
(Fletcher 2009) and higher cigarettes taxes, although there is mixed evidence on taxes (Chou et
al. 2004, 2006, Gruber and Frakes 2006, Baum 2009). Courtemanche (in press) seeks to
harmonize these disparate findings and has shown a counterintuitive reduction in obesity
following cigarette taxation, where the proposed behavioral mechanisms are through changes in
exercise and food consumption. Additionally, Evans and Farrelly (1998) find that smokers
respond to higher cigarette taxes by smoking cigarettes with higher tar and nicotine content.
Similarly, Adda and Cornaglia (2006) find that smokers adjust their behavior to smoke more
intensely in response to higher taxes. Finally, recent theoretical and simulation research by
Schroeter, Lusk, and Tyner (2008) shows there are plausible scenarios where taxes on certain
types of food (e.g. food away from home) could lead to increases in body weight simply due to
substitution among types of food. Likewise, soda taxes could cause substitution to other, high
calorie beverages and increase or have no effect on net caloric intake. In the extreme, these
potential substitution patterns could result in a case where individuals consume no soda but
offset soda consumption with other high calorie beverages, such as fruit juice, juice drinks, or
whole milk. The impact of these behavioral responses would be no tax revenues as well as no
weight reduction and the policy would accomplish neither of its proposed goals.

3
In this paper we combine newly collected soft drink tax data between 1988 and 2006 with
the restricted-access version of the nationally representative National Health Examination and
Nutrition Survey (NHANES) in order to examine the effects of soft drink taxes on child and
adolescent soft drink consumption, substitution patterns, and weight outcomes. We use standard
empirical specifications from the cigarette taxation literature (Chaloupka and Warner, 2000),
including year and state fixed effects, and conduct a series of robustness checks to increase
confidence in the results. Overall, we find evidence of moderate reductions in soft drink
consumption from current soda tax rates. However, we also show that reductions in calories from
soda are completely offset by increases in calories from other beverages. Thus, we find that, as
currently practiced, soda taxes do not reduce weight in children and adolescents and is, therefore,
likely an ineffective “obesity tax”. These results suggest that public health policymakers should
consider behavioral responses when crafting policies to reduce obesity.
Background Literature
The rise in childhood and adolescent obesity in the US and other developed countries has
been the source of considerable debate and public policy effort. The effects of obesity on
chronic health conditions have been compared to the effects of aging twenty years in adults, and
the health costs associated with obesity are even greater than two other behaviors widely
recognized to cause significant harm: cigarette smoking and alcohol consumption (Sturm, 2002).
Since childhood and adolescent obesity may increase the risk of adult obesity (Nader et al.,
2006), prevention, rather than treatment, of adult obesity may be the more effective tool in
limiting lifetime health care costs. Finkelstein et al. (2009) estimate that the medical costs
attributable to obesity were as high as $147 billion in 2008, which is nearly 10% of all medical
4
spending nationally. The additional medical costs of obesity represent an externality because the
obese do not fully pay for their higher costs within pooled health insurance and public health
insurance programs and because being insured increases obesity (Bhattacharya et al. 2009).
There have been many efforts at reducing the burden of obesity, some focus on food prices and
advertising (Chou, Rashad, and Grossman 2005) and others highlight the need to increase
exercise opportunities (Cawley, Meyerhoefer, and Newhouse 2007). Recently, there have been a
large number of proposals that focus on reducing consumption of products with little nutritional
value, such as soft drinks.
Soft drinks were the single largest contributor to energy intake during the last decade
(7%) (Block 2004) and soft drink consumption increased by almost 500% during the past 50
years (Putnam and Allshouse 1999). While soft drinks are a large and growing category of
caloric intake, it may be unclear whether focusing on a single class of consumption can lead to
weight change. In fact, there is emerging evidence that small net changes in caloric consumption
can lead to substantial changes in the prevalence of obesity over time (Cutler, Glaeser, and
Shapiro, 2003). For example, Hill et al. (2003) suggest that reducing energy intake by only 100
calories per day, which is less than one fewer can of soda per day, could prevent weight gain in
over 90% of the population. Ludwig et al. (2001) demonstrate that consuming one additional
sugary drink per day over a period of eighteen months increased the odds of being obese in
children by 60%. Harnack, Stang, and Story (1999) find that total energy intake is positively
associated with the consumption of nondiet soft drinks. Thus, it may be possible to effectively
reduce weight by targeting a single food item.

5
A policy that has garnered recent attention as a possible method for reducing weight and
thus improving health is a tax on soft drinks.1 The taxation of soft drinks by states, which dates
back to at least 1920 (New York Times, 1920), has historically been used to raise revenue
(Caraher and Cowburn, 2005). Recently, however, taxes on soft drinks have been proposed at
federal, state, and local levels as an indirect tax to reduce obesity, while continuing to raise
revenue (Chouinard et al., 2007; Brownell and Frieden, 2009). For example, in May 2009 the
Center for Science in the Public Interest planned to propose a federal excise tax on sweetened
soft drinks and other beverages.2 Brownell and Frieden (2009) suggest a tax equal to a penny
per ounce, which is larger than all prior taxes on soft drinks, to our knowledge. Governor David
Paterson of New York proposed an “obesity tax” in December 2008, which consisted of an 18%
tax on sugared beverages.3 4
These tax proposals have been offered with little evidence to assess their potential
effectiveness. In fact, most of the rigorous evidence that exists appears to suggest limited
effectiveness. For example, in the context of adult outcomes, Fletcher, Frisvold, and Tefft (in
press) use repeated cross sections of the Behavioral Risk Factor Surveillance System (BRFSS)
data combined with state and year fixed effects to show that the reduced from effect of soft drink
taxes on adult weight is negligible. The reduced form approach was unable, though, to shed light
on whether there were consumption responses to taxation.
5
1 See Chriqui et al (2008) for an overview of U.S. soft drink taxes in 2007.
2 http://online.wsj.com/article/SB124208505896608647.html#mod=rss_Health (last accessed May 12, 2009) 3 http://www.cnn.com/2008/HEALTH/12/18/paterson.obesity/ (last accessed May 11, 2009) 4 In addition to attempting to reduce obesity, the goals of these proposals were also to raise revenue. The tax in New York was proposed to raise revenues to help balance the state budget and the Center for Science in the Public Interest proposed to raise revenues to pay for national health care reform. 5Powell, Chriqui, and Chaloupka (2009) also take a reduced form approach and focus on adolescent weight. Like Fletcher et al. (in press), they find no evidence of reduced form effects on adolescent weight. However, the interpretation of their results is unclear because they are unable to control for unobserved state-level characteristics that could be correlated with soft drink taxes. They also are only able to examine a small set of ages (8th, 10th, and
6
While the current evidence suggests no effects from soft drink taxation on adult weight, it
is possible that there may be differential effects of soda taxation on children. For example,
Chaloupka et al. (2000) review multiple studies of cigarette price elasticity, noting that youth
have often been found to be more responsive to price than adults (although these conclusions are
complicated by the fact that youth are also subject to access restrictions). One explanation for
this possibility is that children and adolescents may spend a larger share of their budget on soft
drinks than adults or households and are therefore more responsive to changes in price. If youth
exhibit a relatively strong price response as in the case of cigarette consumption, policies that
moderately change soft drink prices could lead to substantial declines in obesity over time among
children and adolescents.
Conceptual and Empirical Framework
We conceptualize the demand for soft drinks by child i in state s as a function of
individual and family socio-demographic characteristics (X), household income (I), and the
prices of soda (Ps) and other beverages (Po):
( )iiossis IXPPfsoda ,,),(τ= , (1)
where soft drink prices are a function of soft drink taxes imposed by the state ( sτ ). Our focus in
this paper is estimating the effects on soda consumption and weight from increasing soda tax
rates.6
s
s
s
is
s
is PP
sodasodaττ ∂∂
∂∂
=∂
∂
But in order to gain a complete understanding of the effects, it is useful to recall the
decomposition of the effects:
, (2)
12th graders), and can provide no evidence of whether adolescents are price sensitive in their soda consumption decisions. 6 We assume the income effect is unimportant in these decisions.

7
where s
is
Psoda∂
∂ is the price elasticity of demand of soda and s
sPτ∂∂ is the proportion of tax pass-
through or shifting from suppliers to consumers. Because we do not have adequate price data for
the individuals in this sample and because price is endogenous in demand analysis (Gruber and
Frakes 2006), we focus on the reduced form effects of (exogenous) taxes on consumption.
Before presenting our empirical model, we outline what is known about the two components of
the reduced form estimates. This discussion also highlights the uncertainty of calculating
consumption responses when not using evidence from direct tax effects.
Estimates of the price elasticity of demand for soft drinks are available, but there does not
seem to be a consensus. While a recent survey of the literature suggest typical price elasticities
of -0.8 to -1.0 (Andreyeva et al. in press), more recent examples of compensated price elasticity
estimates range from -0.15 (Zheng and Kaiser, 2008) to -1.90 (Dharmasena and Capps, 2009).
The differences in estimates are, in part, due to the specificity of food and drink categories that
might be considered candidates for complements or substitutes. In any case, there is a relatively
large range of uncertainty for policy makers to predict demand responses to price changes given
the evidence accumulated thus far.
In addition to the uncertainty surrounding price elasticities, there is scant evidence on
how soft drink taxes might affect behavior through prices. Since policy makers often do not set
prices directly, they must rely on indirect methods such as taxation. Kotlikoff and Summers
(1987) describe the theory of tax incidence and show that tax shifting, or the proportion of a tax
that is reflected by a change in price, varies by market. In fact, Besley and Rosen (1999) show
that the change in soft drink price exceeds a tax change by 29 percent and suggest that this

8
overshifting of the tax burden is the result of imperfect competition in the soft drink industry.7
Even after establishing the effect of taxes on consumption behavior through prices, the
further question remains regarding how effectively reducing soft drink consumption will
improve child weight and obesity prevalence. In fact, if youths reduce their consumption of
caloric and non-caloric soft drinks in response to a tax but increase their consumption of non-
taxed high calorie beverages such as juice or whole milk, then a tax on soft drinks could actually
increase weight (Schroeter, Lusk, and Tyner, 2008). For example, while a 12 ounces can of soda
contains 140 calories, 12 ounces of whole milk contains 225 calories. The empirical uncertainty
surrounding soft drink price elasticity and tax shifting combined with the theoretical ambiguity
of the effect of soft drink taxes on obesity warrants an analysis of the direct tax effects on both
consumption and weight outcomes when considering the dual policy goals of revenue generation
and child health.
Overall, however, as a result of the recent changes in states’ soft drink taxes, additional work is
needed in this area.
Empirical Framework
Our empirical strategy regarding soft drink taxes follows the literature on cigarette
taxation (Chaloupka and Warner, 2000) and work examining adult BMI (Fletcher, Frisvold, and
Tefft, 2009) by estimating state and year fixed effects models using the repeated cross-sections
of the NHANES datasets. Specifically, we estimate the empirical models,
istqqtsstqistqistq TXY εγδµββ +++++= 21' , (1)
where istqY is the consumption or weight outcome of individual i in state s in year t in quarter q,
which is determined by individual and environmental characteristics ( istqX ), the soft drink tax in
7 Kenkel (2005) also finds evidence of overshifting between alcohol taxes and prices.
9
state s in year t in quarter q ( stqT ), and state, year, and quarter of year fixed effects.8
A limitation of this strategy is the potential that unobserved characteristics that vary
within states and over time are related to soft drink taxes and BMI. To address this limitation,
we estimate additional specifications that also include variables that measure state economic and
health conditions.
Using this
strategy, the impacts of soft drink tax rates are identified from changes in the tax rate within
states over time. To estimate the direct impact of soft drink taxes on soda consumption, we
examine whether any soft drinks are consumed, the amount of calories from soft drinks, and the
total grams of soft drinks that are consumed. To estimate whether children respond to soft drink
taxes by changing their consumption of other beverages, we examine the amount of calories
consumed from juice, juice-related drinks, and whole milk. To estimate the impact of soft drink
taxes on weight outcomes, we examine an age and sex-specific normalized measure of body
mass index and the weight classifications of obese, overweight, and underweight.
Data
Soft Drink Taxes
States currently tax soft drinks through excise taxes, sales taxes, and special exceptions to
food exemptions from sales taxes. For this paper, we define the soft drink tax as the tax on soft
drinks net of taxes on other food items.
To determine the soft drink tax rate, we combine sales tax information with details on
other soft drink taxes. The “Book of the States” (The Council of State Governments, 1990-
2007) is used to identify state sales tax information. Published annually, it lists tax information 8 With our relatively short panels of states (1988-1994 and 1999-2006) and because not every state is included in the survey in every year, we do not include state-specific time trends in our preferred results, but we do perform several robustness checks outlined below.
10
and whether each state has a sales tax food exemption. This resource, LexisNexis Academic, and
state departments of revenue web sites allow us to compile state sales tax rates and effective food
tax rates by quarter. To understand how states tax soft drinks, we conduct further research with
the above resources. Using LexisNexis Academic and departments of revenue web sites, we are
able to determine if soft drinks fall under food exemptions, or if they are taxed wholly or
additionally by sales or excise taxes.
We convert all tax descriptions such that they may be incorporated into tax rates.9
Using the effective dates of each tax, we are able to combine information on excise taxes
and sales taxes to calculate quarterly soft drink tax rates for each state. We confirm this data
collection effort by comparing with soft drink tax descriptions in Jacobson and Brownell (2000)
and Chriqui et al. (2008).
For
taxes that are quoted in dollars per quantity, we convert any level tax into a percent of
expenditure using the Bureau of Labor Statistics annual nationwide price index for a quantity of
soda. We do not include taxes on soft drink syrups because we do not have information on the
expected amount of syrup per quantity of soft drink.
Table 1 shows the average annual tax rates across all states for 1988 through 2006. The
average soft drink tax rate varies between 1.5 and 2.3 percent during this period. The number of
states with any tax on soft drinks in each year varies between 19 and 24 and, among states with a
tax, the average rate varies between 4.1 and 5.1 percent. Also, there were 53 tax rate changes
within states over time.
NHANES
9 “Soft drinks” are commonly defined similarly across states, although this is not always true. They are often defined broadly to include non-alcoholic, artificially sweetened or “diet” drinks, and carbonated water.
11
The NHANES surveys are administered by the National Center for Health Statistics
(NCHS) of the CDC to assess the health and nutritional status of the civilian, non-
institutionalized population of the United States using a complex, multistage probability sample
design. NHANES III includes nearly 34,000 respondents and was conducted between 1988 and
1994. In 1999, the NHANES program changed to consist of a nationally representative sample
of about 5,000 persons each year; however, the sampling design remained similar to NHANES
III. Of these recent surveys, we will utilize information from 1999 to 2006.
NHANES data is collected through survey questionnaires and physical examinations that
occur primarily in a mobile examination center. Importantly for this analysis, the NHANES data
contain information on body mass index (BMI), youth’s soft drink and other beverage
consumption, and demographic characteristics. Additionally, state of residence information is
available through the NCHS Restricted Data Center, which allows us to merge our state-level tax
information with the individual level data.
Height and weight were measured by trained health technicians during the physical
examinations and BMI was calculated as weight in kilograms divided by height in meters
squared. We construct dichotomous measures of obese (BMI ≥ 95th percentile of the historical
age of month- and sex-specific distribution), overweight and obese (which we call overweight
throughout the text) (BMI ≥ 85th percentile), and underweight (BMI < 5th percentile) and the
continuous measure of BMI z-score10
10 The BMI z-score for an individual is calculated as the BMI minus the mean BMI of the reference population, which is then divided by the standard deviation of the reference population, where the reference population is all individuals of the same sex and month of age. Thus, the units of the BMI z-score are standard deviations from the mean.
from BMI for all individuals between the ages of 3 and 18
using the sex-specific BMI for age thresholds from the 2000 CDC Growth Charts.

12
During the physical examinations, survey respondents completed a 24-hour dietary recall
with a trained dietary interviewer that detailed all foods and beverages, except water, that were
consumed in the previous 24 hours.11 Children aged five years and younger, and many children
aged six to 11 years, completed the dietary recall through a proxy respondent. The dietary
interviewers contacted schools and other care providers to obtain complete dietary intake
information. Individual foods were coded and classified using the U.S. Department of
Agriculture’s Survey Nutrient Database System. Using the dietary intake information, we
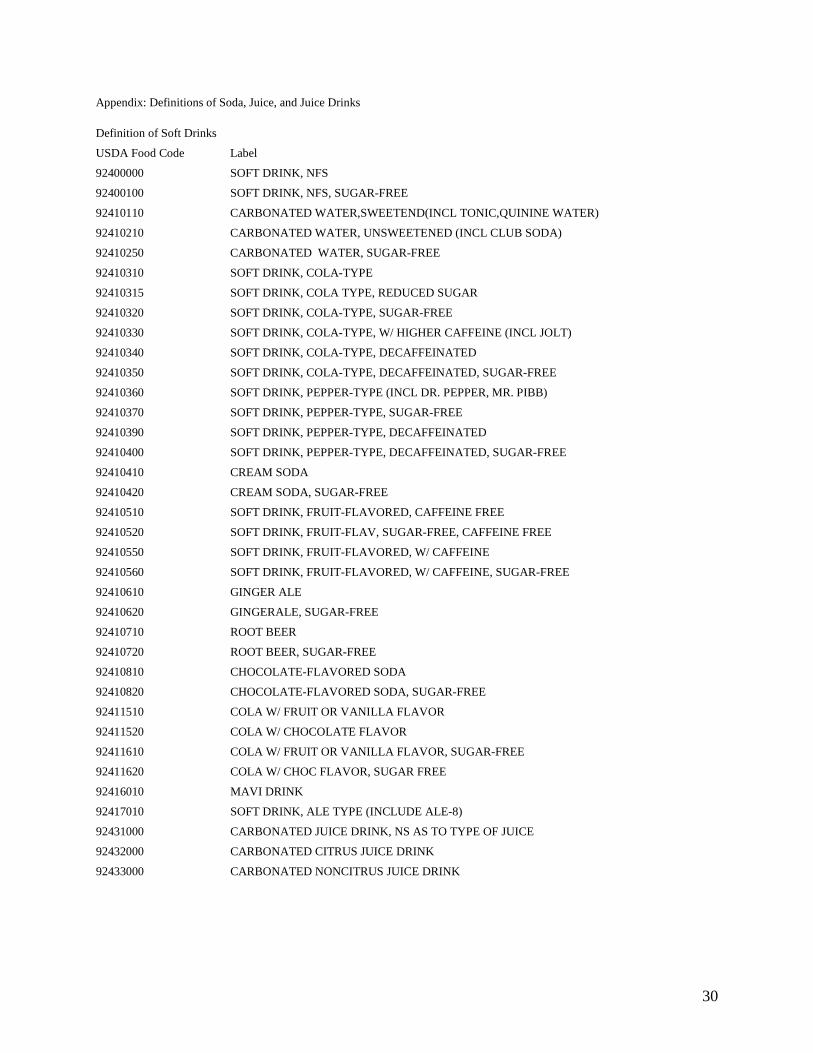
construct measures of soft drink consumption, including whether the youth consumed a soft
drink during the recall period, the total grams consumed, and the total calories consumed from
soft drinks. To explore the possibility of substitution effects, we also construct similar measures
for juice, juice-like drinks, and whole milk.12
We merge NHANES III data with the NHANES 1999-2006 data. All relevant survey
questions are asked similarly across the survey years, with the exception of race and ethnicity.
We measure race and ethnicity as black non-Hispanic, white non-Hispanic, and other race or
ethnicity to construct categories which are consistent throughout the survey. We restrict the
sample to children and adolescents between the ages of 3 and 18 with non-missing height and
weight or soft drink consumption information.
Table 2 displays the summary statistics. Fifteen percent of children are obese and 30
percent are overweight or obese. Fifty nine percent of children consume any soft drink during
the day with an average of 332 grams or 12 ounces and 122 calories per day. Although the
average caloric intake from soda represents only 6 percent of the average total caloric intake, soft
11 To be consistent with NHANES III and NHANES 1999-2004, we use recall data from only the first day of the dietary interview for the 2005-2006 survey wave. 12 These categories are defined in the appendix. Although we are unable to distinguish between diet and regular soft drinks between 1999 and 2006, we have information on grams of consumption as well as calories, which allows us some ability to distinguish diet and regular soda consumption since diet soda does not have calories.
13
drinks represent a significant component of children’s diets compared to other beverages.
Children are approximately twice as likely to drink any soft drink during the day as juice, juice-
related drinks, or whole milk and the calories consumed from soft drinks are also approximately
twice the amount of calories consumed from these other drinks.
Results
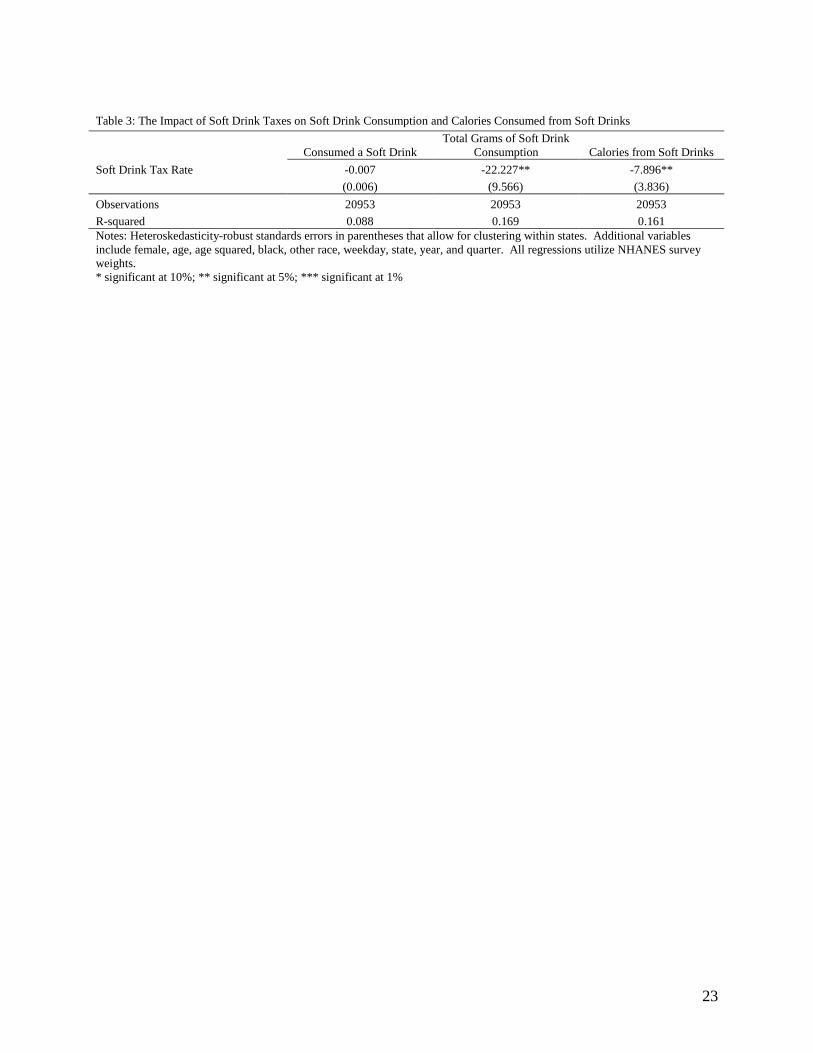
Table 3 presents the baseline associations between soft drink tax rates and soft drink
consumption. The soft drink tax coefficients represent the effects of a one percentage point
increase in the tax rate on the probability of consuming a soft drink, the total grams of soft drinks
consumed, and the total calories from soft drinks consumed. All regression models throughout
the paper include year, quarter, and state fixed effects (unreported), and standard errors are
clustered at the state level. Regressions are estimated using ordinary least squares and NHANES
survey weights are used throughout the paper.13 14
As shown in Table 3, we find little influence of a tax on soft drinks on the probability that
a youth consumes soda. However, a tax on soft drinks does influence the amount of soda that
youths consume. A one percentage point increase in the soft drink tax rate reduces the amount of
calories consumed by soda by nearly 8 calories, which is about 6 percent of the sample mean.
This reduction in calories is likely not caused by a switch to diet soft drinks as there is a 22 gram
13 The outcomes variables that measure the grams and calories consumed of different beverages are naturally censored at 0. An alternative to linear regression in the presence of censored dependent variables is the Tobit model. Our results are qualitatively similar to estimates based on Tobit models. However, estimates from Tobit models are not consistent in the presence of heteroskedastic errors or fixed effects. Following Angrist (2001), we report the linear regression estimates as our preferred estimates. 14 For regressions with one of the consumption outcomes as the dependent variable, we use the survey weights for the dietary recall data. For regressions with one of the weight outcomes as the dependent variable, we use the survey weights for the mobile examination center data. To construct survey weights for our combined NHANES dataset, we follow the NCHS recommended analytic guidelines and divide the NCHS-supplied weights for each cycle by the number of cycles in our dataset. These weights incorporate the probability of being surveyed and adjustments for non-response.
14
decrease in soft drink consumption from a one percentage point increase in the soft drink tax
rate, which is also about 6 percent of the sample mean.
Thus, our initial findings suggest that increasing the taxes on soft drinks will lead to
reductions in soft drink consumption by children and adolescents. The magnitude of the
reduction is somewhat modest. As discussed before, there is evidence that reducing
consumption by 100 calories per day could prevent weight gain in 90 percent of the population
(Ludwig et al. 2001), but typical increases in the soda tax of 1 to 2 percentage points would not
dramatically affect caloric intake. The point estimates suggest, though, that an increase in the tax
rate of over 12 percentage points would be required to affect a reduction in soda of
approximately 100 calories per day; however, an increase of this magnitude is outside the
support of our data. Indeed, several recent proposals have called for this magnitude of tax rate
increase—for example Governor Patterson of New York recently suggested an 18% “obesity
tax” on soft drinks. However, while soda consumption may be reduced with a large tax increase,
it is important to understand whether this represents a reduction in total calories or whether
individuals may respond to the tax by increasing consumption of non-taxed items of similar
calories.
We next examine potential substitution patterns between soft drinks and other high-
calorie consumption items that are not typically included in soft drink tax definitions, such as
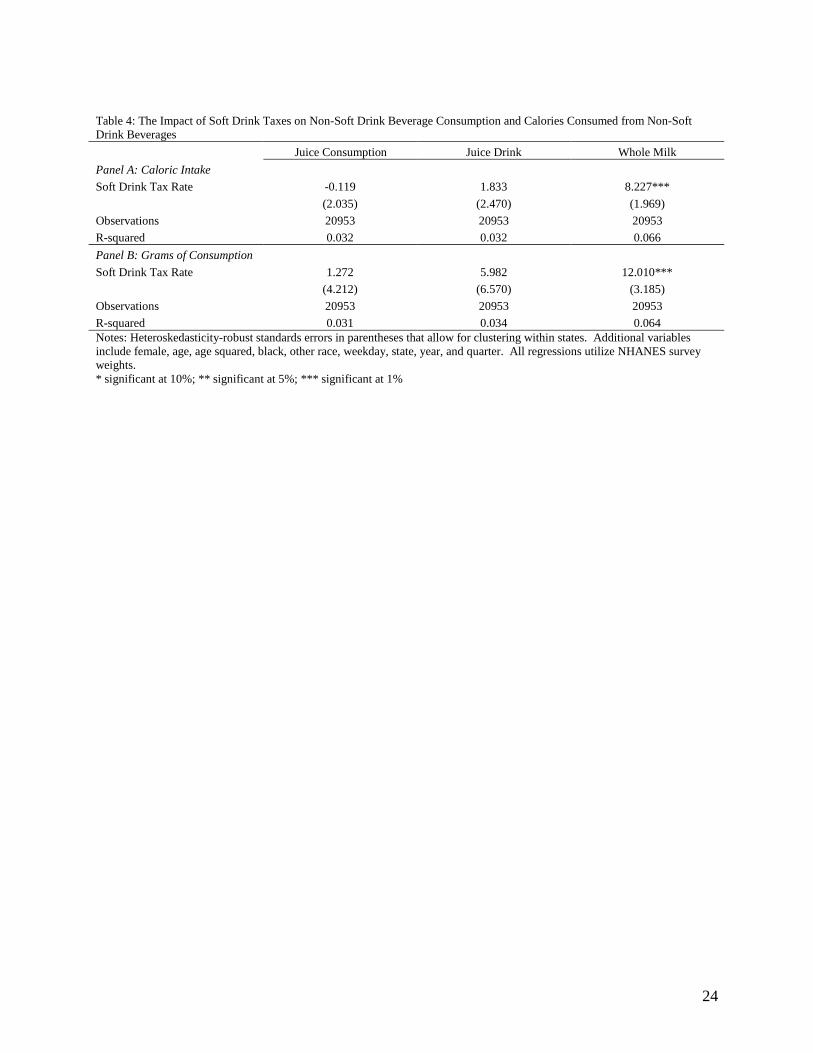
juice, juice-related drinks, and whole milk. As shown in Table 4, there is some suggestive
evidence that soft drink taxes affect the consumption of juice or juice-related drink. The results
do show that whole milk is a substitute for soft drinks; a one percentage point increase in the soft
drink tax rate increases caloric intake from whole milk by 8 calories per day, which is 14 percent
of the sample mean. Similarly, a one percentage point increase in the soft drink tax rate
15
increases whole milk consumption by 12 grams or 13 percent of the sample mean. The decrease
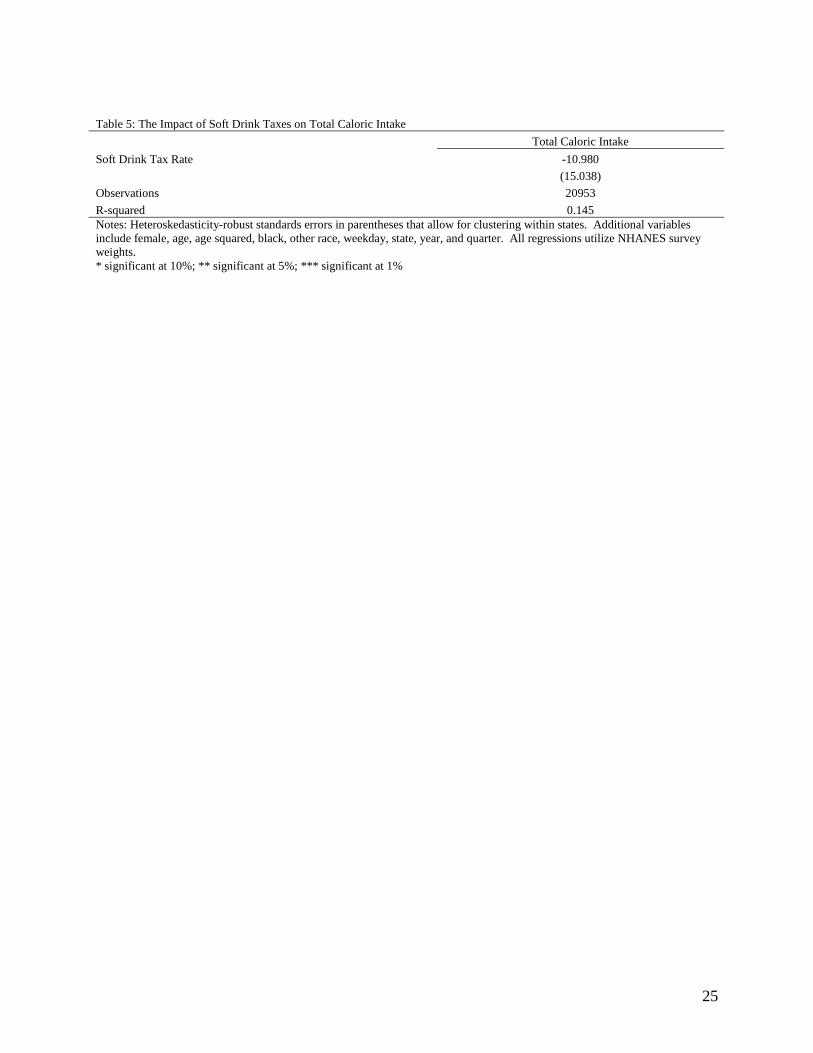
in calories from soft drinks in response to an increase in the soft drink tax rate is completely
offset by the increase in calories from whole milk. Thus, in Table 5, the results show that there
is no statistically significant impact of the soft drink tax rate on total calories.
Given the results that a change in the soft drink tax rate induces youths to substitute
whole milk for soft drinks and that the magnitude of these effects is similar, it is not likely that
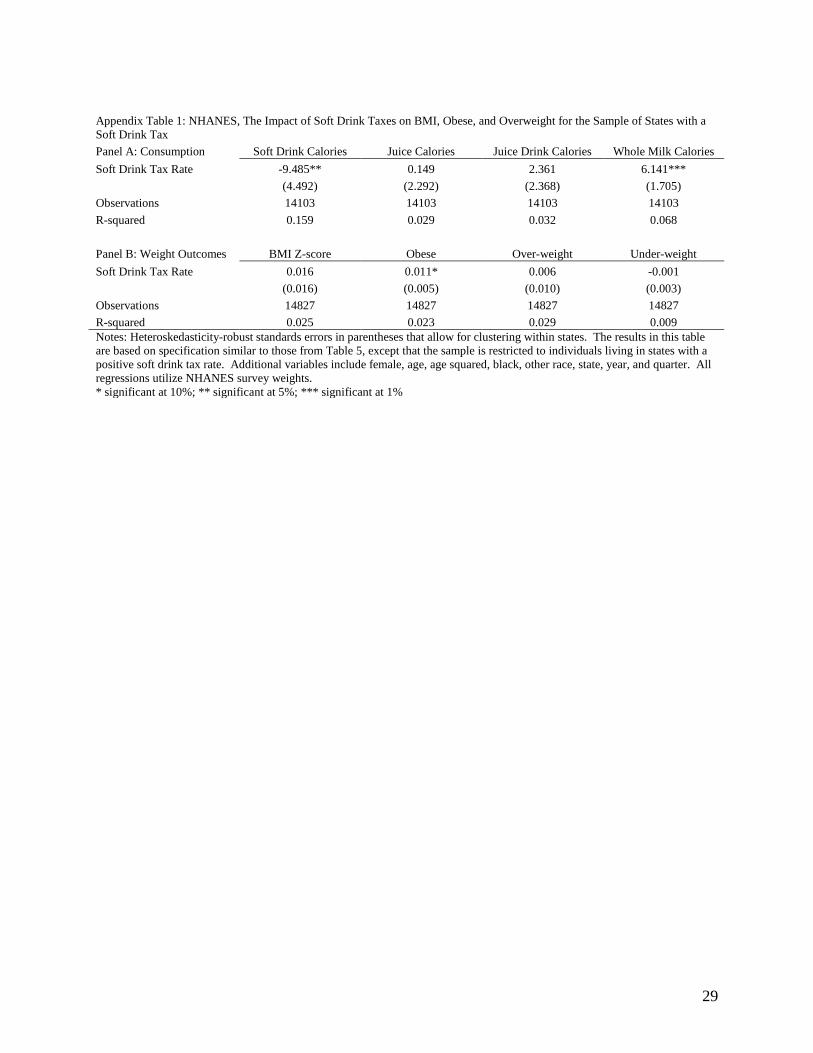
an increase in soft drink taxes would decrease obesity. Indeed as shown in Table 6, the results
confirm that soft drink taxes have little influence on BMI, overweight, or obesity among children
and adolescents. Similar to Fletcher, Frisvold, and Tefft’s (2009) estimates for adults, the
estimates are small in magnitude and not statistically significant.15
Overall, our estimates, which are identified using variation within state over time,
demonstrate that soft drink taxes reduce soft drink consumption. However children and
adolescents are found to respond to the taxes by shifting consumption to other high-calorie
beverages, such as whole milk. Therefore, the net effect of soda taxes on caloric intake is
minimal, and we find no effect on weight outcomes in children and adolescents. Soda taxes
seem to be an ineffective “obesity tax” due to a standard behavioral response to the policy, where
children and adolescents consume more calories of relatively cheaper beverages, which is milk in
this case.
Robustness Checks
In addition to our baseline results, we also perform several robustness checks in order to
increase confidence that we are estimating the causal effects of soft drink taxes on outcomes.
15 As shown in Appendix Table 1, restricting the sample to states that have ever had a soft drink tax has little influence on the results shown in Tables 3 through 6.
16
One concern about the validity of these estimates is whether changes in state soft drink taxes are
endogenous. To address this possibility, we include time-varying state characteristics as
additional covariates. As shown in Table 7, the main results are robust to the inclusion of the
one-year lagged state mean of adult BMI, one-year lagged unemployment rates, and cigarette tax
rates. These additional results demonstrate that the main findings in this paper are unaffected by
the possibility that states raise soft drink taxes in response to changes in population weight or
changes in the macro economy.
Given that children spend a large portion of their time in school, an additional concern is
that the changes in soft drink tax rates coincide with changes in school food policies. For
example, Clark and Gleason (2006) find that participation in the National School Lunch Program
is associated with a decrease in soft drink consumption and an increase in whole milk
consumption. To address this possibility, we examine the impact of soft drink taxes on beverage
consumption on weekdays and on weekends. As shown in Table 8, we find evidence of a
decrease in calories consumed from soft drinks and an increase in calories consumed from whole
milk on both the weekend and on weekdays.
Conclusion
In this paper, we present the first evidence of whether soft drink taxes are linked with
consumption decisions and weight outcomes of children and adolescents. We use a national
sample that contains weight outcomes and consumption patterns of children and adolescents
between 1988 and 2006. We then merge newly collected state-level soft drink tax data for this
time period with the survey data in order to use a quasi-natural experimental design to estimate
the short term effects of soft drink taxation. Our results suggest that soft drink taxation, as
17
currently practiced in the United States, leads to a moderate decrease in the quantity of soft
drinks consumed by children and adolescents. As a result, soft drink taxation may yield lower
revenues for states than expected if behavioral responses to the tax are not accounted for.
Additionally, soft drink taxes do not appear to have countered the rise in obesity prevalence
because any reduction in soft drink consumption has been offset by the consumption of other
calories. Cast in this light, the revenue generation and health benefits of soft drink taxes appear
to be weaker than expected.
Despite this evidence against the effectiveness of soft drink taxes to reduce obesity, we
believe that there are at least two directions for further inquiry in this area. First, although there
is no evidence that soft drink taxes improve weight outcomes in children and adolescents, the
fact that children and adolescents substitute more nutritious whole milk for soft drinks when
taxed suggests that there may be broader health benefits that are not yet understood. Second,
most historical tax rates are considerably lower than those that have been recently proposed, so
that extrapolating our results to much larger increases in tax rates may not be appropriate. It is
possible that there is a tax rate threshold at which consumers’ reactions are greatly magnified, so
it is unclear whether consumer substitution patterns would be sufficiently different with large tax
changes to reduce total caloric intake. Findings from these areas of inquiry could suggest that
there are pathways by which it is possible that soft drink taxes could indirectly improve child and
adolescent health. However, the evidence to date is that soft drink taxes are ineffective as an
“obesity tax”.
18
References Adams, Scott and Chad Cotti. (2008). Drunk driving after the passage of smoking bans in bars Journal of Public Economics Volume 92, Issues 5-6, Pages 1288-1305 Adda, Jerome and Francesca Cornaglia. (2006). Taxes, Cigarette Consumption, and Smoking Intensity. American Economic Review, 96(4) 1013-1028. Adda, Jerome and Francesca Cornaglia. (in press). The Effect of Bans and Taxes on Passive Smoking. American Economic Journal: Applied Economics. Andreyeva, Tatiana, Michael Long, and Kelly Brownell. (in press). The Impact of Food Prices on Consumption: A Systematic Review of Research on Price Elasticity of Demand for Food. American Journal of Public Health. Angrist, Joshua D. (2001) “Estimation of Limited Dependent Variable Models with Dummy Endogenous Regressors: Simple Strategies for Empirical Practice,” Journal of Business & Economic Statistics, 19(1), 2-16. Baum, C., 2009. The effects of cigarette costs on BMI and obesity, Health Economics 18 (1), 3–19. Bhattacharya, Jay, Kate Bundorf, Noemi Pace, and Neeraj Sood (2009). Does Health Insurance Make You Fat? NBER Working Paper 15163. Block, G. (2004). “Foods Contributing to Energy Intake in the US: Data from NHANES III and NHANES 1999-2000.” Journal of Food Composition and Analysis, 17: 439-447 Brownell, KD, and Frieden, TR, (2009). “Ounces of Prevention – The Public Policy Case for Taxes on Sugared Beverages.” N Engl J Med 360;18. Cawley, J. S. Markowitz and J. Tauras, Lighting up and slimming down: the effects of body weight and cigarette prices on adolescent smoking initiation, Journal of Health Economics 23 (2004), pp. 293–311 Cawley, John, Chad Meyerhoefer, and David Newhouse. (2007). The Impact of State Physical Education Requirements on Youth Physical Activity and Overweight. Health Economics, 16(12), 1287-1301. Chaloupka, F and K. Warner, (2000). The economics of smoking. In: A. Cuyler and J. Newhouse, Editors, Handbook of Health Economics, North-Holland, Elsevier Science, Netherlands. Chou, S.-Y., M. Grossman and H. Saffer, “An economic analysis of adult obesity: results from the behavioral risk factor surveillance system,” Journal of Health Economics 23 (2004), pp. 565–587.
19
S. Chou, M. Grossman and H. Saffer, Reply to Jonathan Gruber and Michael Frakes, Journal of Health Economics 25 (2006), pp. 389–393. Chriqui, J. F., S. S. Eidson, H. Bates, S. Kowalczyk and F. J. Chaloupka (2008). "State Sales Tax Rates for Soft Drinks and Snacks Sold through Grocery Stores and Vending Machines, 2007." J Public Health Pol 29(2): 226-249. Clark, Melissa and Phil Gleason (2006) “School Meal Participation, Beverage Consumption, and Child Obesity: Evidence from the CSFII,” working paper. The Council of State Governments, 1990-2007. The Book of the States, Lexington, KY: Council of State Governments. Courtemanche, Charles. (in press). "Rising Cigarette Prices and Rising Obesity: Coincidence or Unintended Consequence?", Journal of Health Economics. Dharmasena, S., Capps, O. (2009). “Demand Interrelationships of At-Home Nonalcoholic Beverage Consumption in the United States.” Presented at the Agricultural & Applied Economics Association’s 2009 AAEA & ACCI Joint Annual Meeting, Milwaukee, Wisconsin, July 26-29, 2009. Evans, William N. and Matthew C. Farrelly. (1998). The Compensating Behavior of Smokers: Taxes, Tar, and Nicotine. RAND Journal of Economics, 29(3), 578-595. Finkelstein, E.A., Trogdon, J.G., Cohen, J.W., Dietz, W. “Annual Medical Spending Attributable to Obesity: Payer- And Service-Specific Estimates.” Health Affairs, doi: 10.1377/hlthaff.28.5.w822 Fletcher, JM. (2009) "The Effect of Smoking Cessation on Weight Gain: Evidence Using Workplace Smoking Restrictions." Working Paper Fletcher, JM., Frisvold, D, and Tefft, N, (2009). "Can Soft Drink Taxes Reduce Population Weight?," Contemporary Economic Policy (in press). Gruber, J and Frakes, M, (2006). “Does falling smoking lead to rising obesity?” Journal of Health Economics, 25:2, 183-197. Harnack L, Stang J &, Story M (1999): Soft drink consumption among US children and adolescents: nutritional consequences. J. Am. Diet. Assoc. 99, 436–441. Hill JO, Wyatt HR, Reed GW, Peters JC. (2003). “Obesity and the environment: where do we go from here?” Science 299: 853-7. Jacobson, M and K. Brownell. (2000). “Small taxes on soft drinks and snack foods to promote health.” American Journal of Public Health, 90(6): 854-857
20
Kenkel DS. (2005). Are alcohol tax hikes fully passed through to prices: evidence from Alaska. American Economic Review 95(2):273-277. Ludwig, D.S., Peterson, K.E., & Gortmaker, S.L. (2001). Relation between consumption of sugar-sweetened drinks and childhood obesity: a prospective, observational analysis. The Lancet, Vol. 357 505-508. Nader PR, O'Brien M, Houts R, Bradley RH, Belksy J, Crosnoe R, Friedman S, Mei Z, Susman EJ, Development National Institute of Child Health and Human Development Study of Early Child Care and Youth (2006) “Identifying risk for obesity in early childhood,” Pediatrics, 118: e594-e601. Office of the Surgeon General (2001) The Surgeon General’s Call to Action to Prevent Overweight and Obesity, Rockville, MD: U.S. Department of Health and Human Services. Peltzman, Sam. (1975). The Effects of Automobile Safety Regulation The Journal of Political Economy, Vol. 83, No. 4 pp. 677-726 Powell, LM, Chriqui, J, and Chaloupka, FJ, (2009). “Associations between State-level Soda Taxes and Adolescent Body Mass Index.” Journal of Adolescent Health (in press). Putnam JJ, Allshouse JE. (1999). “Food consumption, prices, and expenditures, 1970–97.” Washington, DC: Food and Consumers Economics Division, Economic Research Service, US Department of Agriculture Schroeter, C., J. Lusk and W. Tyner (2008). "Determining the Impact of Food Price and Income Changes on Body Weight." Journal of Health Economics 27(1): 45-68. Sicher, John.(2007). “Special Issue: Top-10 CSD Results for 2006.” Beverage Digest Volume 50 (5). Sturm, R., 2002. The Effects of Obesity, Smoking, and Drinking on Medical Problems and Costs. Health Affairs 21, 245. Tobacco-NAFTA Industry Guide. (2009). Datamonitor, February 2009, available at: http://www.researchandmarkets.com/reports/706797/tobacco_north_america_nafta_industry_guide.
Zheng, Y. and Kaiser, HM. (2008). “Advertising and U.S. Nonalcoholic Beverage Demand.” Agricultural and Resource Economics Review, 37:2, pg 147-159.

21
Table 1. Summary Statistics: Soft Drink Tax Rates, 1988-2006 All States States with a Positive Tax Rate
Year Mean Tax Rate Standard Deviation Count Mean Tax Rate
Standard Deviation
1988 1.552 2.311 19 4.166 1.829 1989 1.623 2.335 20 4.139 1.841 1990 1.839 2.526 21 4.465 1.906 1991 1.971 2.591 22 4.569 1.882 1992 2.067 2.587 23 4.583 1.776 1993 2.334 2.919 24 4.960 2.220 1994 2.334 2.919 24 4.960 2.220 1995 2.084 2.618 23 4.621 1.822 1996 2.076 2.608 23 4.604 1.815 1997 2.076 2.608 23 4.604 1.815 1998 1.954 2.603 21 4.745 1.742 1999 1.934 2.584 21 4.698 1.748 2000 1.875 2.544 20 4.783 1.549 2001 1.758 2.488 19 4.718 1.564 2002 1.728 2.550 18 4.897 1.642 2003 1.755 2.589 18 4.974 1.663 2004 1.895 2.676 19 5.087 1.661 2005 1.888 2.667 19 5.067 1.658 2006 1.890 2.674 19 5.074 1.677
Note: Column variables represent means or percents across all states for the given year.

22
Table 2: Descriptive Statistics Variable Mean Standard Error BMI Z-score 0.420 0.011 Obese 0.149 0.004 Overweight 0.298 0.005 Underweight 0.033 0.002 Total Calories 2062.073 9.650 Total Calories from Soft Drinks 122.349 2.000 Consumed any Soft Drink 0.587 0.005 Total Grams of Soft Drink Consumption 331.803 5.099 Total Calories from Juice 50.631 1.072 Consumed any Juice 0.329 0.005 Total Grams of Juice Consumption 109.150 2.244 Total Calories from Juice Drinks 66.060 1.266 Consumed any Juice Drinks 0.368 0.005 Total Grams of Juice Drinks Consumption 165.472 3.272 Total Calories from Whole Milk 58.235 1.334 Consumed any Whole Milk 0.253 0.004 Total Grams of Whole Milk Consumption 93.469 2.147 Dietary Recall is Based on a Weekday 0.626 0.005 Female 0.490 0.005 Age 10.510 0.043 Black 0.149 0.002 Other Race/Ethnicity (including Hispanic) 0.240 0.004 White 0.610 0.005 Soft Drink Tax Rate 2.718 0.029 N(weight variables) 22045 N(drink variables) 20953 N(demographics) 22342 Notes: Descriptive statistics are weighted using the NHANES survey weights. Sources: NHANES 1998-1994 and 1999-2006.
23
Table 3: The Impact of Soft Drink Taxes on Soft Drink Consumption and Calories Consumed from Soft Drinks
Consumed a Soft Drink Total Grams of Soft Drink
Consumption Calories from Soft Drinks Soft Drink Tax Rate -0.007 -22.227** -7.896** (0.006) (9.566) (3.836) Observations 20953 20953 20953 R-squared 0.088 0.169 0.161 Notes: Heteroskedasticity-robust standards errors in parentheses that allow for clustering within states. Additional variables include female, age, age squared, black, other race, weekday, state, year, and quarter. All regressions utilize NHANES survey weights. * significant at 10%; ** significant at 5%; *** significant at 1%
24
Table 4: The Impact of Soft Drink Taxes on Non-Soft Drink Beverage Consumption and Calories Consumed from Non-Soft Drink Beverages Juice Consumption Juice Drink Whole Milk Panel A: Caloric Intake Soft Drink Tax Rate -0.119 1.833 8.227*** (2.035) (2.470) (1.969) Observations 20953 20953 20953 R-squared 0.032 0.032 0.066 Panel B: Grams of Consumption Soft Drink Tax Rate 1.272 5.982 12.010*** (4.212) (6.570) (3.185) Observations 20953 20953 20953 R-squared 0.031 0.034 0.064 Notes: Heteroskedasticity-robust standards errors in parentheses that allow for clustering within states. Additional variables include female, age, age squared, black, other race, weekday, state, year, and quarter. All regressions utilize NHANES survey weights. * significant at 10%; ** significant at 5%; *** significant at 1%
25
Table 5: The Impact of Soft Drink Taxes on Total Caloric Intake Total Caloric Intake Soft Drink Tax Rate -10.980 (15.038) Observations 20953 R-squared 0.145 Notes: Heteroskedasticity-robust standards errors in parentheses that allow for clustering within states. Additional variables include female, age, age squared, black, other race, weekday, state, year, and quarter. All regressions utilize NHANES survey weights. * significant at 10%; ** significant at 5%; *** significant at 1%

26
Table 6: The Impact of Soft Drink Taxes on BMI, Obese, and Overweight BMI Z-score Obese Over-weight Under-weight Soft Drink Tax Rate 0.014 0.008 0.003 -0.001 (0.017) (0.006) (0.011) (0.003) Observations 22045 22045 22045 22045 R-squared 0.027 0.023 0.027 0.008 Notes: Heteroskedasticity-robust standards errors in parentheses that allow for clustering within states. Additional variables include female, age, age squared, black, other race, state, year, and quarter. All regressions utilize NHANES survey weights. * significant at 10%; ** significant at 5%; *** significant at 1%

27
Table 7: Alternative Specifications that Control for Additional State Characteristics
BMI Z-score Obese
Over-weight
Soft Drink
Calories Juice
Calories
Juice Drink
Calories
Whole Milk
Calories Total
Calories Controlling for Lagged State Average BMI 0.018 0.008 0.005 -6.956* 0.449 2.402 8.197*** -9.925 (0.016) (0.007) (0.011) (3.471) (1.805) (2.250) (2.125) (14.848) N 21785 21785 21785 20717 20717 20717 20717 20717 Controlling for Lagged State Unemployment Rate 0.015 0.008 0.003 -8.162** -0.131 1.646 8.208*** -11.304 (0.018) (0.006) (0.011) (3.480) (2.059) (2.266) (2.010) (14.945) N 22045 22045 22045 20953 20953 20953 20953 20953 Controlling for Cigarette Taxes 0.016 0.009 0.005 -6.155 0.034 1.317 7.836*** -12.488 (0.018) (0.006) (0.011) (3.805) (2.014) (2.385) (2.112) (15.106) N 22045 22045 22045 20953 20953 20953 20953 20953 Controlling for All of the Above 0.023 0.009 0.007 -6.165* 0.487 1.313 7.874*** -12.677 (0.019) (0.007) (0.011) (3.464) (1.846) (2.073) (2.401) (15.145) N 21785 21785 21785 20717 20717 20717 20717 20717 Notes: Heteroskedasticity-robust standards errors in parentheses that allow for clustering within states. Each cell represents a separate regression. Additional variables include female, age, age squared, black, other race, state, year, and quarter. All regressions utilize NHANES survey weights. * significant at 10%; ** significant at 5%; *** significant at 1%

28
Table 8: The Impact of Soft Drink Taxes on Consumption during on Weekdays and the Weekend
Calories from Soft
Drinks
Total Grams of Soft Drink Consumption
Juice Calories
Juice Drink Calories
Whole Milk Calories
Total Calories
Panel A: Weekday Soft Drink Tax Rate -8.917** -25.915** -2.033 2.129 8.398*** -29.444* (4.357) (11.572) (1.999) (3.270) (2.230) (17.373) Observations 14227 14227 14227 14227 14227 14227 R-squared 0.153 0.163 0.048 0.035 0.071 0.150 Panel B: Weekend Soft Drink Tax Rate -7.309 -20.504 4.046 1.086 5.471** 19.617 (6.549) (15.637) (4.076) (2.758) (2.402) (23.360) Observations 6726 6726 6726 6726 6726 6726 R-squared 0.182 0.188 0.031 0.054 0.079 0.154 Notes: Heteroskedasticity-robust standards errors in parentheses that allow for clustering within states. Additional variables include female, age, age squared, black, other race, state, year, and quarter. All regressions utilize NHANES survey weights. * significant at 10%; ** significant at 5%; *** significant at 1%
29
Appendix Table 1: NHANES, The Impact of Soft Drink Taxes on BMI, Obese, and Overweight for the Sample of States with a Soft Drink Tax Panel A: Consumption Soft Drink Calories Juice Calories Juice Drink Calories Whole Milk Calories Soft Drink Tax Rate -9.485** 0.149 2.361 6.141*** (4.492) (2.292) (2.368) (1.705) Observations 14103 14103 14103 14103 R-squared 0.159 0.029 0.032 0.068 Panel B: Weight Outcomes BMI Z-score Obese Over-weight Under-weight Soft Drink Tax Rate 0.016 0.011* 0.006 -0.001 (0.016) (0.005) (0.010) (0.003) Observations 14827 14827 14827 14827 R-squared 0.025 0.023 0.029 0.009 Notes: Heteroskedasticity-robust standards errors in parentheses that allow for clustering within states. The results in this table are based on specification similar to those from Table 5, except that the sample is restricted to individuals living in states with a positive soft drink tax rate. Additional variables include female, age, age squared, black, other race, state, year, and quarter. All regressions utilize NHANES survey weights. * significant at 10%; ** significant at 5%; *** significant at 1%
30
Appendix: Definitions of Soda, Juice, and Juice Drinks Definition of Soft Drinks
USDA Food Code Label
92400000 SOFT DRINK, NFS
92400100 SOFT DRINK, NFS, SUGAR-FREE
92410110 CARBONATED WATER,SWEETEND(INCL TONIC,QUININE WATER)
92410210 CARBONATED WATER, UNSWEETENED (INCL CLUB SODA)
92410250 CARBONATED WATER, SUGAR-FREE
92410310 SOFT DRINK, COLA-TYPE
92410315 SOFT DRINK, COLA TYPE, REDUCED SUGAR
92410320 SOFT DRINK, COLA-TYPE, SUGAR-FREE
92410330 SOFT DRINK, COLA-TYPE, W/ HIGHER CAFFEINE (INCL JOLT)
92410340 SOFT DRINK, COLA-TYPE, DECAFFEINATED
92410350 SOFT DRINK, COLA-TYPE, DECAFFEINATED, SUGAR-FREE
92410360 SOFT DRINK, PEPPER-TYPE (INCL DR. PEPPER, MR. PIBB)
92410370 SOFT DRINK, PEPPER-TYPE, SUGAR-FREE
92410390 SOFT DRINK, PEPPER-TYPE, DECAFFEINATED
92410400 SOFT DRINK, PEPPER-TYPE, DECAFFEINATED, SUGAR-FREE
92410410 CREAM SODA
92410420 CREAM SODA, SUGAR-FREE
92410510 SOFT DRINK, FRUIT-FLAVORED, CAFFEINE FREE
92410520 SOFT DRINK, FRUIT-FLAV, SUGAR-FREE, CAFFEINE FREE
92410550 SOFT DRINK, FRUIT-FLAVORED, W/ CAFFEINE
92410560 SOFT DRINK, FRUIT-FLAVORED, W/ CAFFEINE, SUGAR-FREE
92410610 GINGER ALE
92410620 GINGERALE, SUGAR-FREE
92410710 ROOT BEER
92410720 ROOT BEER, SUGAR-FREE
92410810 CHOCOLATE-FLAVORED SODA
92410820 CHOCOLATE-FLAVORED SODA, SUGAR-FREE
92411510 COLA W/ FRUIT OR VANILLA FLAVOR
92411520 COLA W/ CHOCOLATE FLAVOR
92411610 COLA W/ FRUIT OR VANILLA FLAVOR, SUGAR-FREE
92411620 COLA W/ CHOC FLAVOR, SUGAR FREE
92416010 MAVI DRINK
92417010 SOFT DRINK, ALE TYPE (INCLUDE ALE-8)
92431000 CARBONATED JUICE DRINK, NS AS TO TYPE OF JUICE
92432000 CARBONATED CITRUS JUICE DRINK
92433000 CARBONATED NONCITRUS JUICE DRINK
31
Definition of Juice
USDA Food Code LABEL
61201000 GRAPEFRUIT JUICE, NFS
61201010 GRAPEFRUIT JUICE, FRESHLY SQUEEZED
61201020 GRAPEFRUIT JUICE, UNSWEETENED, NS AS TO FORM
61201220 GRAPEFRUIT JUICE, CANNED, BOTTLED, CARTON, UNSWEET
61201230 GRAPEFRUIT JUICE, CANNED, BOTTLED, CARTON, W/ SUGAR
61201620 GRAPEFRUIT JUICE, FROZEN, UNSWEETENED (RECONST)
61201630 GRAPEFRUIT JUICE, FROZEN, W/ SUGAR (RECONSTITUTED)
61204000 LEMON JUICE, NS AS TO FORM
61204010 LEMON JUICE, FRESH
61204200 LEMON JUICE, CANNED OR BOTTLED
61204600 LEMON JUICE, FROZEN
61207000 LIME JUICE, NS AS TO FORM
61207010 LIME JUICE, FRESH
61207200 LIME JUICE, CANNED OR BOTTLED
61207600 LIME JUICE, FROZEN
61210000 ORANGE JUICE, NFS
61210010 ORANGE JUICE, FRESHLY SQUEEZED
61210220 ORANGE JUICE, CANNED/BOTTLED/CARTON, UNSWEETENED
61210230 ORANGE JUICE, CANNED/BOTTLED/CARTON, W/ SUGAR
61210250 ORANGE JUICE, W/ CALCIUM, CAN/BOTTLE/CARTON, UNSWEETENED
61210620 ORANGE JUICE, FROZEN, UNSWEETENED, RECONST W/ WATER
61210630 ORANGE JUICE, FROZEN, W/ SUGAR, RECONST W/ WATER
61210720 ORANGE JUICE, FROZEN, UNSWEETENED, NOT RECONSTITUTD
61210730 ORANGE JUICE, FROZEN, W/ SUGAR, NOT RECONSTITUTED
61210820 ORANGE JUICE,FROZ, W/,CALCIUM ADDED,RECON W/WATER
61213000 TANGERINE JUICE, NFS
61213220 TANGERINE JUICE, CANNED, UNSWEETENED
61213230 TANGERINE JUICE, CANNED, W/ SUGAR
61213620 TANGERINE JUICE, FROZEN, UNSWEET, RECONST W/ WATER
61213800 FRUIT JUICE BLEND, INCL CITRUS, 100% JUICE
61214000 GRAPE-TANGERINE-LEMON JUICE
61216000 GRAPEFRUIT & ORANGE JUICE, NFS
61216010 GRAPEFRUIT & ORANGE JUICE, FRESH
61216220 GRAPEFRUIT & ORANGE JUICE, CANNED, UNSWEETENED
61216230 GRAPEFRUIT & ORANGE JUICE, CANNED, W/ SUGAR
61216620 GRAPEFRUIT & ORANGE JUICE, FROZEN, (RECONSTITUTED)
61219000 ORANGE & BANANA JUICE
61219100 PINEAPPLE-ORANGE-BANANA JUIICE
61219150 ORANGE-WHITE GRAPE-PEACH JUICE
61219650 APRICOT-ORANGE JUICE
32
61222000 PINEAPPLE-GRAPEFRUIT JUICE, NFS
61222200 PINEAPPLE-GRAPEFRUIT JUICE, CANNED, NS SWEETENED
61222220 PINEAPPLE-GRAPEFRUIT JUICE, CANNED, UNSWEETENED
61222230 PINEAPPLE-GRAPEFRUIT JUICE, CANNED, W/ SUGAR
61222600 PINEAPPLE-GRAPEFRUIT JUICE, FROZEN, RECONST W/WATER
61225000 PINEAPPLE-ORANGE JUICE, NFS
61225200 PINEAPPLE-ORANGE JUICE, CANNED, NS AS TO SWEETENER
61225220 PINEAPPLE-ORANGE JUICE, CANNED, UNSWEETENED
61225230 PINEAPPLE-ORANGE JUICE, CANNED, W/ SUGAR
61225600 PINEAPPLE-ORANGE JUICE, FROZEN, RECONST W/ WATER
61226000 STRAWBERRY-BANANA-ORANGE JUICE
64100100 FRUIT JUICE, NFS (INCLUDE MIXED FRUIT JUICES)
64100110 FRUIT JUICE BLEND, 100% JUICE, W/ VITAMIN C
64100120 AMBROSIA JUICE (INCL KNUDSEN'S)
64100200 FRUIT JUICE BLEND, WITH CRANBERRY, 100% JUICE
64101010 APPLE CIDER (INCLUDE CIDER, NFS)
64104010 APPLE JUICE
64104050 APPLE JUICE, W/ ADDED VITAMIN C
64104090 APPLE JUICE WITH ADDED VITAMIN C AND CALCIUM
64104150 APPLE-CHERRY JUICE
64104200 APPLE-PEAR JUICE
64104450 APPLE-RASPBERRY JUICE
64104500 APPLE-GRAPE JUICE
64104550 APPLE-GRAPE-RASPBERRY JUICE
64104600 BLACKBERRY JUICE (INCL BOYSENBERRY JUICE)
64105400 CRANBERRY JUICE, UNSWEETENED
64105500 CRANBERRY-WHITE GRAPE JUICE MIXTURE, UNSWEETENED
64116010 GRAPE JUICE, NS AS TO ADDED SWEETENER
64116020 GRAPE JUICE, UNSWEETENED
64116030 GRAPE JUICE, W/ SUGAR
64116040 GRAPE JUICE, LOW CALORIE SWEETENER
64116050 GRAPE JUICE, NS AS TO SWEETENED, W/ ADDED VITAMIN C
64116100 GRAPE JUICE, UNSWEETENED, W/ ADDED VITAMIN C
64116150 GRAPE JUICE, W/ SUGAR, W/ ADDED VITAMIN C
64120010 PAPAYA JUICE
64121000 PASSION FRUIT JUICE
64122030 PEACH JUICE, W/ SUGAR
64123000 PEAR-WHITE-GRAPE-PASSION FRUIT JUICE,W/ADDED VIT C
64124010 PINEAPPLE JUICE, NS AS TO SWEETENED
64124020 PINEAPPLE JUICE, UNSWEETENED
64124030 PINEAPPLE JUICE, W/ SUGAR
64124060 PINEAPPLE JUICE, UNSWEETENED, W/ VIT C
64124200 PINEAPPLE-APPLE-GUAVA JUICE, W/ ADDED VITAMIN C
33
64125000 PINEAPPLE JUICE-NON-CITRUS JUICE BLEND, UNSWEETENED
64132010 PRUNE JUICE, NS AS TO ADDED SWEETENER
64132020 PRUNE JUICE, UNSWEETENED
64132030 PRUNE JUICE, W/ SUGAR
64132500 STRAWBERRY JUICE
64133100 WATERMELON JUICE
74301100 TOMATO JUICE
74301150 TOMATO JUICE, LOW SODIUM
74302000 TOMATO JUICE COCKTAIL
74303000 TOMATO & VEGETABLE JUICE, MOSTLY TOMATO (INCL V-8)
74303100 TOMATO & VEGETAGLE JUICE, MOSTLY TOMATO, LOW SODIUM
74304000 TOMATO JUICE W/ CLAM OR BEEF JUICE

34
Definition of Juice Drink
USDA Food Code LABEL
92510120 APPLE-CHERRY DRINK
92510150 APPLE JUICE DRINK
92510170 APPLE-CRANBERRY-GRAPE JUICE DRINK
92510200 APPLE-ORANGE-PINEAPPLE JUICE DRINK
92510310 BANANA-ORANGE DRINK
92510410 BLACK CHERRY DRINK
92510610 FRUIT DRINK (INCLUDE FRUIT PUNCH & FRUIT ADE)
92510630 FRUIT JUICE DRINK, NFS
92510650 TAMARIND DRINK, P.R. (REFRESCO DE TAMARINDO)
92510720 FRUIT PUNCH, MADE W/ FRUIT JUICE & SODA
92510730 FRUIT PUNCH, MADE W/ SODA, FRUIT JUICE & SHERBET
92510810 GRAPEADE & GRAPE DRINK
92510820 GRAPE JUICE DRINK
92510910 GRAPEFRUIT JUICE DRINK
92510950 GUAVA JUICE DRINK
92511000 LEMONADE, FROZEN CONCENTRATE, NOT RECONSTITUTED
92511010 LEMONADE
92511020 LEMON-LIMEADE
92511110 LIMEADE
92511190 ORANGE JUICE DRINK
92511200 ORANGE-MANGO JUICE DRINK
92511220 ORANGE DRINK (INCLUDE ORANGE ADE, YABA DABA DEW)
92511240 ORANGE-LEMON DRINK
92511250 CITRUS FRUIT JUICE DRINK (INCL 5-ALIVE)
92511260 ORANGE-CRANBERRY JUICE DRINK
92511270 ORANGE-PEACH JUICE DRINK
92511280 ORANGE-GRAPE-BANANA JUICE DRINK
92511290 PAPAYA JUICE DRINK
92511340 PINEAPPLE-ORANGE JUICE DRINK
92511350 ORANGE-RASPBERRY JUICE DRINK
92511400 RASPBERRY-FLAVORED DRINK
92511510 STRAWBERRY-FLAVORED DRINK
92512040 FROZEN DAIQUIRI MIX, CONCENTRATE, NOT RECONSTITUTED
92512050 FROZEN DAIQUIRI MIX, FROM FROZ CONC, RECONSTITUTED
92512090 PINA COLADA, NONALCOHOLIC
92512110 WHISKEY SOUR, NONALCOHOLIC (INCL LEMIX)
92520410 FRUIT DRINK, LOW CALORIE
92520810 GRAPE DRINK, LOW CALORIE
92520910 LEMONADE, LOW CALORIE
92530310 CHERRY DRINK W/ VITAMIN C ADDED

35
92530410 CITRUS DRINK W/ VITAMIN C ADDED
92530510 CRANBERRY JUICE DRINK W/VIT C ADDED(INCL COCKTAIL)
92530520 CRANBERRY-APPLE JUICE DRINK W/ VITAMIN C ADDED
92530610 FRUIT PUNCH/DRINK/ADE W/ VIT C ADDED (INCL HI-C)
92530710 GRAPE DRINK W/ VITAMIN C ADDED
92530810 GRAPEFRUIT JUICE DRINK W/ VITAMIN C ADDED
92530840 GUAVA JUICE DRINK W/ VIT C ADDED
92530910 LEMONADE W/ VITAMIN C ADDED
92530950 VEGETABLE & FRUIT JUICE DRINK, W/ VIT C
92531010 ORANGE DRINK & ORANGEADE W/ VITAMIN C ADDED
92531020 ORANGE BREAKFAST DRINK, FROM FROZEN CONCENTRATE
92531030 ORANGE BREAKFAST DRINK
92531120 PINEAPPLE-ORANGE JUICE DRINK W/ VITAMIN C ADDED
92531210 SRAWBERRY-FLAVORED DRINK W/ VITAMIN C ADDED
92541010 FRUIT-FLAVORED DRINK, FROM SWEETENED PWDR,FORTIFIED W/ VIT C
92541020 LEMONADE-FLAV DRINK, FROM POWDER, W/ SUGAR & VIT C
92541040 LEMONADE-FLAV DRINK, FROM POWDER, LO CAL, W/ VIT C
92541100 APPLE CIDER DRINK, FROM MIX, SUGAR & VIT C ADDED
92542000 FRUIT-FLAVORED DRINK, FROM POWDER, W/HI VIT C(TANG)
92544000 FRUIT-FLAVOR DRINK, FROM UNSWEET PWDR,W/ VIT C,W/ SUGAR
92550050 APPLE-WHITE GRAPE JUICE DRINK,LOW CAL,W/VIT C ADDED
92550110 CRANBERRY JUICE COCKTAIL, LO CAL, W/ VIT C ADDED
92550210 CRANBERRY-APPLE JUICE DRINK, LO CAL, VIT C ADDED
92550300 GRAPEFRUIT JUICE DRINK,LOW CALORIE,W/ VITAMIN C
92550110 CRANBERRY JUICE DRINK OR COCKTAIL, LOW CAL, W/ HIGH VIT C
92550610 FRUIT-FLAVORED DRINK, LOW CAL, W/ VITAMIN C ADDED
92550620 FRUIT FLAVORED DRINK, LOW CALORIE
92551600 CITRUS JUICE DRINK, LOW CALORIE
92551700 JUICE DRINK, LOW CALORIE
92552000 FRUIT-FLAV DRINK, FROM MIX, HI VIT C ADDED, LOW CAL
92552010 FRUIT FLAVORED DRINK, MADE FROM PWDR, LOW CALORIE
92552050 ORANGE BREAKFAST DRINK, LOW CALORIE
92552100 ORANGE-CRANBERRY JUICE DRINK,LOW CAL,W/ VIT C ADDED
92553000 FRUIT-FLAVORED THIRST QUENCHER BEVERAGE, LOW CAL
92560000 FRUIT-FLAVORED THIRST QUENCHER BEVERAGE
92560100 GATORADE THIRST QUENCHER SPORTS DRINK
92560200 POWERADE SPORTS DRINK
92570100 FLUID REPLACEMNT,ELECTROLYTE SOLUTN(INCL PEDIALYTE)
92570500 FLUID REPLACEMENT, 5% GLUCOSE IN WATER
92582100 CITRUS JUICE DRINK, CALCUIM FORTIFIED
92582110 ORANGE BREAKFAST DRINK, CALCIUM FORTIFIED