the effects of trade liberalization on economic...
TRANSCRIPT

The Effects of Trade
Liberalization on Economic
Performance and Income
Inequality Zubair Faisal Abbasi
Principal Consultant, Impact Consulting

2 | P a g e D i s c u s s i o n p a p e r o n T r a d e P o l i c y - I m p a c t C o n s u l t in g
Impact Consulting
540, Street, 105, I-8/4, Islamabad, Pakistan
Phone & Fax: +92-051-4437300
First published: May 11, 2008
Cover Design: Impact Consulting
Author: Zubair Faisal Abbasi
Trade policy, economic performance, and income inequality have a complex relationship.
There are many ways to understand and explain the relationship each of which
contributing a new perspective. The primary purpose of this discussion paper is to
encourage debate and promote dialogue around current development issues from
different perspectives. Special efforts have been made to keep it accessible to a common
reader of economics and students of development studies.

3 | P a g e D i s c u s s i o n p a p e r o n T r a d e P o l i c y - I m p a c t C o n s u l t in g
Discussion Paper
The Effects of Trade Liberalization on
Economic Performance and Income Inequality
Zubair Faisal Abbasi
May 11, 2008

4 | P a g e D i s c u s s i o n p a p e r o n T r a d e P o l i c y - I m p a c t C o n s u l t in g
Introduction
'For well over a century scholars .... have debated the merits of free trade .... this debate has
traditionally revolved around two questions: (i) Does freer trade result in faster economic growth?
And (ii) how does freer trade affect .... income distribution? (Edwards, 1997)
The above mentioned remarks provide a broader context for this essay which tries to explain the
effect of trade liberalization on economic performance and income inequality. With the rise of neo-
liberalism in the early 1980s, the drive for liberalization of trade regimes under the auspices of the
WTO, the World Bank and the IMF has been strengthened. As a result, the world trade has grown
'nearly five times faster than world output' and economic growth of many countries has been an
improvement over the growth trajectory of the past (Santos-Paulino and Thirlwal, 2004; Chang,
2005).
While trade liberalization has potential to significantly and permanently enhance economic growth
(SPDC, 2006), the main goals of trade liberalisation in IMF-supported programmes tend to be: to
improve the economic efficiency by creating a transparent and neutral system of incentives that
eliminates anti-export bias, direct impediments to trade, and economic distortions caused by the
trade regime (IMF, 1998, p. 4).
Under the WTO arrangement, tariffs are being bound and downwardly revised in an irreversible way
and the debate around liberalization and its relationship with economic growth and income
distribution is still in question (Chang, 2005). At the same time, the analysis on inequality has
recently started taking into account the 'possible connections between global trade and rising
inequality of wages and incomes' (Richardson, 1995).
Interestingly, the evidence on direction of causality between trade policy and economic growth is
still ambiguous and there are difficulties in measuring diverse dimensions of trade policy in terms of
their effectiveness. For openness to work, it should accompany other flanking policies such as
creating investment climate, building human capital, establishing mechanisms of conflict resolution
along with improved macro-economic policy making processes, and efforts to tackle inequality
(Winter, 2004; UNDP, 2005; Ulku, 2008).
Notwithstanding, increased trade, at least provides vent for surplus commodities, apart from
generating potential for new, which brings otherwise unemployed resource into employment and
hence effects economic performance (Thirlwal 2003 p. 626).
Therefore, in developing countries 'simplification of import procedures, the reduction or elimination
of quotas, and the rationalisation of the tariff structures are the most widespread reforms' (Santos-
Paulino 2005, p. 783).
After this introduction, the discussion paper presents a survey of theoretical and empirical literature
on trade in relation to economic performance and income inequality. In section 2, description of
data and methodology used for analysis of data for Pakistan is presented which is followed by a
detailed report on the country in section 3. Conclusion is provided in the end.

5 | P a g e D i s c u s s i o n p a p e r o n T r a d e P o l i c y - I m p a c t C o n s u l t in g
1. Survey of Theoretical and Empirical Literature
1.1. Theoretical Literature: Economic Performance
The neoclassical model assert that trade influences economic growth with its contribution to total
factor productivity growth and to factor accumulation (Ulku, 2008). According to the theory of
comparative advantage, static and dynamic gains from trade creation occur for economies. The
theory explains that static gains from trade come in the shape of savings on relative opportunity
costs of factor employment. However, the dynamic gains occur because export markets widen the
trade horizon while making accumulation easier due to increasing returns to scale. In addition, trade
increases competition, new idea and dissemination of knowledge, possibility of FDI, changes in
attitudes and perceptions (Thirwal, 2003).
However, diminishing returns 1 on primary commodities and increasing returns on industrial
investments create inequalities (Thirwal, 2003). The new trade theory, allegedly called neo-
marcantalist theory, explains this increasing returns to scale in relation to production possibilities
and non-comparative advantage trade.
It means that countries specialize not only in their relative advantages but due to increasing returns.
While 'the convexity in traditional production possibility frontier is due to different factor intensities,
when increasing returns are introduced, they push against the convexity and if they are strong
enough the curve bends the other way' argues Krugman (1992).
This is the mobility of factor intensity and increasingly returns to scale which led to the possibility of
rapid industrialization (i.e., making production capital intensive) and also trade restrictions for
import substitution industrialization (ISI) (Colman and Nixson, 1994).
1.2. Empirical Literature: Economic performance
The period between the late 1980s and the 1990s has witnessed a number of studies trying to
explain the linkages and effects of liberalization and economic growth. Notable amongst these have
been Dollar (1992), Sachs and Warner (1995), Edwards (1998) and Frankel and Romer (1999).
However, such studied were criticized on many grounds specially the methodology. 'The current
regression analyses, though sophisticated do not fully account for 'omitted variables' and
'simultaneity issue', argues Ulku (2008) and these concerns are also voiced in Rodriguez and Rodrik
(2001) who claim that direction of causality is difficult to establish.
Frankel and Romer (1990) insist that trade influences growth through human capital accumulation
and induces increasing returns. Srinivasan and Bhagwati (1999, p. 6) argue that '[i]n-depth analyses
of country experiences .... during the 1960s and 1970s have shown .... that trade does seem to create,
even sustain, higher growth’. Lewer and Berg (2003, p. 363), also produce evidence of a positive
correlation between trade and growth using time series regression models, and claim 'one
percentage growth in exports is associated with one-fifth percentage point increase in economic
growth'.
There are several ways in which trade liberalization impacts economic performance. It encourages
investment, generates larger volumes, causes specialization, induces learning by doing and
technological upgrading (Thirwal, 2003, Richardson, 1995). Levine and Renelt (1992, p. 959) find a
positive correlation between 'average growth rates and the average share of investment'. Hausmann,
et al. (2005), claim that competition to produce high quality competitive goods is generated by
liberalization.
1 'Adding successive units of any input ... increases the output ... but less and less' (Stiglitz, 1993, p.39)

6 | P a g e D i s c u s s i o n p a p e r o n T r a d e P o l i c y - I m p a c t C o n s u l t in g
Literature analysing relationship between liberalization, exports and GDP growth, shows that
'exports have tended to grow fastest in countries with more liberal trade regimes, and these
countries have experienced the fastest growth of GDP' (Thirlwal, 2003, p. 637-638). Bernard and
Jenson (1999), argue that empirical evidence suggests that exporting provides larger market access
advantages to productive firms2. Growth in such firms influences economic development, high paid
and stable jobs.
Trade integration is said to be a strong stimulus to growth. Brahmbhatt and Dadush (1996),
developed speed of integration index 3 which indicates that East Asians were integrationist
economies as compared to Sub-Saharan Africa so grew quickly.
However, UNDP (2005) claims that the successful globalizers invest in human development and
sequentially integrate into global economy. It claims that Vietnam by balancing growth and human
development considerations with trade: income poverty fell from 58% to 28% during 1990s; life
expectancy at birth increased six years; child mortality cut in half (from 40 to 20/1000 live births).
The Table 1 illustrates the UNDP (2005) claim while juxtaposing it with Mexico which is another
globalizer.
Table 1
A Tale of Two Globalizers: Vietnam and Mexico
Indicators Vietnam Mexico
Average annual growth rate of exports, 1990-2003 (%) 20.2 11.4
Average annual growth rate of income, 1990-2003 (%) 5.9 1.4
Extreme Poverty Rate (%) (national poverty line)
1990
2002
30
15
22.5
20.3
Income share of the poorest 20% (2002) 7.5 3.1
Source: UNDP (2005)
World Bank (1987), compared trade performance of 41 countries on trade orientation summarized
as outward and inward oriented concluded, 'economic performance of the outward oriented
economies has been broadly superior to that of inward oriented economies in all respects'. However,
on World Bank's classification, Chang (2003, p. 258) argues that 'a smaller country is more likely to be
classified as outward-oriented than a large country, even when there is there is no difference in their
policies as typically small countries have high share of export growth'.
Winter (2004, p. F-4), argues that though methodological challenges on how to draw conclusions
from evidence are 'the most plausible conclusion is that liberalisation generally induces a temporary
(but possibly long-lived) increase in growth'. Edwards (1992; 1998), also claims that open economies
2 At any given time, exporter are at least 12-19% more productive than non-exporters (Bernard and Jenson,
1999, p. 23) 3 The index divides countries into four categories: fast, moderate, weak, slow integrator (Brahmbhatt and
Dadush, 1996)

7 | P a g e D i s c u s s i o n p a p e r o n T r a d e P o l i c y - I m p a c t C o n s u l t in g
attract and absorb exogenous technology more efficiently, grow faster, and there appears 'a positive
relation between openness and productivity growth'.
1.3. Theoretical Literature: Inequality
Other things remaining same, price elasticity of demand is a major indicator which helps in making
product choice. The choice of product ultimately creates difference in capital accumulation and thus
inequality.
However, there are other reasons as well. Thirlwal (2003, p. 622), argues that firstly, the pattern of
demand has shifted to goods with least primary-commodity component. Secondly, technological
shift towards synthetic substitutes of raw materials, and thirdly, protectionist policies of developed
countries. Owing to this situation, 'trade does not seem to work to the equal advantage of both sets
of countries' (ibid, p. 623).
Discussing inequality, Krugman and Obstfeld (2003, p. 38), explain that Ricardian model assumes
free mobility of labour in international specialization. The model further assumes that every
individual gains due to trade with no issues of income distribution. However, in real world inequality
is a reality with at least two important reasons behind this phenomena. One is time lag and cost
associated with resource reallocation and the others induced differentiation in factor intensity in
industrial production. So, 'Trade may benefit a nation as a whole, it often hurts significant groups
within the country at least in the short run.' Krugman and Obstfeld (2003)
1.4. Empirical Literature: Inequality and Liberalisation
Edwards (1997, p. 209), concludes that 'there is no evidence linking openness or trade liberalization
to increases in inequality'. Richardson (1995), however, claims that 'trade is a moderate contributing
source of income inequality trends' while it affects only in the short run.
Employment and wages is a possible channel of inequality under liberalization. Arbache et al (2004),
claim that under trade liberalization wages fall in the traded sector due to greater competition. They
also claim that trade liberalization generate 'reductions in rents ...... and hence wage reductions'.
While liberalization induces technological upgrading (Richardson, 1995), on the opposite side, low
capacity of developing countries to absorb foreign technology can be a cause behind trade
benefiting developed countries4 more and creating inequality (Coe et al, 1997; Ulku, 2008).
Despite competing claims about trade and economic growth and trade and inequality linkage, Dollar
and Kraay (2004), argue that 'over half the developing world lives in globalising ....[and]... catching up
the rich countries while the rest of the developing world is falling farther behind'. In addition, they
also argue that when economic growth happens in a country the poor also gain because global
integration 'leads to faster growth and poverty reduction in poor countries'. However, White and
Anderson (2001) while categorising growth into 'pro' and 'anti' poor claim that distributional systems
offset the growth effects in one fourth of the cases.
The below given tables 2 and 3, show that growth rates during 1980s and 1990s have not picked up
for many regions as compared to 1960-80 (Chang, 2005). However, about Sub-Saharan Africa, Dollar
and Kraay (2004) assertion that some developing countries falling behind is vindicated.
4 In 1991, 92% of world R&D was concentrated in seven OECD countries. R&D is supposed to have linkages
with productivity and average long-run rate of return on R & D investment was around 120% (Coe et al, 1997, p. 134)

8 | P a g e D i s c u s s i o n p a p e r o n T r a d e P o l i c y - I m p a c t C o n s u l t in g
Table 2
Per Capita GNP Growth Performance of the Developing Countries, 1960-80
1960-70
(%)
1970-80
(%)
1960-80
(%)
Low-income countries 1.8 1.7 1.8
Sub-Saharan Africa 1.7 0.2 1.0
Asia 1.8 2.0 1.9
All developing countries 3.1 2.8 3.0
Industrialized Countries 3.9 2.4 3.2
Source: Chang (2005)
Table 3
Per capita GDP Growth Rates of the Developing Countries, 1980-2000
1980-90 (%) 1990-2000
(%)
1980-2000
(%)
Developing Countries 1.4 2.0 1.7
Sub-Saharan Africa -1.2 -0.2 -0.7
East Asia and Pacific 6.4 6.0 6.2
Developed Countries 2.5 1.7 2.1
Source: Chang, (2005)
In a nutshell, empirical evidences do not unambiguously show causal linkage between trade
liberalisation and economic growth as well as impact on income inequality. However, it appears that
trade liberalization impacts economic performance in a complex way. The next section presents the
country report of Pakistan.
2. Description of Data and Methodology
For this essay, secondary data from different sources was used. These sources included economic
survey from Pakistan's Ministry of Finance, World Development Indicators from the World Bank,
World Trade Organization, research papers and academic works produced by scholars and research
institutions.
An attempt was made to collect data and information from different sources so that, though in a
limited sense, triangulation is assured. Therefore, the government such as Ministry of Finance (2007),
research institutions such as SPDC (2006), independent economists such as Zaidi (2005), Kemal
(1999), and Nabi (1999) were identified. International sources of data and information such as the
World Bank and the World Trade Organization were also used where appropriate.
For analysis of data and information to draw inferences, literature study method (Barrientos, 1998)
was used. To provide evidence-based inferences this method was jointly administered with
interpreting trends in economic growth and income distribution.

9 | P a g e D i s c u s s i o n p a p e r o n T r a d e P o l i c y - I m p a c t C o n s u l t in g
The next section using this methodology, attempts to explain Pakistan's experience with
liberalization and its impact on economic performance and inequality.
3. Pakistan: Effects of Trade Liberalization on Economic Performance and Inequality
Beginning as a primary-commodity producer and exporter in 1947, Pakistan has tried to manage its
industrial development and modernization process through tariff and trade policy regimes (Kemal,
1999). Now it mainly exports, manufactured and semi-manufactured goods (Zaidi, 2005; Ministry of
Finance, 2007). Table 4, given below explains the percentage share of primary, semi, and
manufactured exports5.
In essence, the import substitution strategy followed during 1950s and 1960s was managed by tariff
protection, exchange rate manipulations, quotas, import licences, and other instruments of
commercial policy (Ahmed and Amjad, 1984; Zaidi, 2005; SPDC, 2006).
However, during 1960s, Pakistan started export-orientation and schemes like Export Bonus was
introduced to incentivize exports (Zaidi, 2005). During 1970s, trade controls were further liberalized
specially on imports which culminated into serious efforts for liberalisation during the late 1980s.
During 1970-80s, export rebates, tax and credit facilities were also offered to boost exports (SPDC,
2006).
Table 4
Source: Ministry of Finance (2007)
It is argues that with neo-liberal ascendency since 1980s and initiation of structural adjustment
programmes in 1988 (Zaidi, 2005), 'there has been a clear effort to reduce trade barriers and
liberalize the economy' (SPDC, 2006). The Figure 1 illustrates tariff reduction since mid 1980s.
5 For key economic indicator please see Table A in appendix A.

10 | P a g e D i s c u s s i o n p a p e r o n T r a d e P o l i c y - I m p a c t C o n s u l t in g
Figure 1
Source: SPDC (2006), Chart 1.3 in the source.
Under liberalization programmes, real imports have increased 5.5% in the period of liberalization i.e,
1990-2005 as compared to 3.8% in 1976-90 where as real exports declined from 11.4% to 10.9%
between 1990-2005 (SPDC, 2006). Notwithstanding, the ideal of export-oriented growth spurt
which happened in East Asia is still awaited. Nabi (1999, p. 175-6) claims that Pakistan's exports
constitute barely 0.2 (see table 5 below for details) per cent of total world trade and trade to GDP
ratio hover at around 30% leaving Pakistan less outward oriented as compared to rest of the East
Asia though better than India. The below given figure 2 shows that merchandise trade and GDP
growth does not show abnormal peak since the early 1970s apart from a spurt except in mid 1970s
when Pakistan currency was devalued against dollar and trade controls were further relaxed (Zaidi,
2005; SPDC, 2006). The dip in the early 1970s is due to political economic upheavals
dismemberment of East and West Pakistan in 1971.
Figure 2
Source: World Bank. http://devdata.worldbank.org/data-query/
On export side, since 2002 to 2005-06 Pakistan exports have been growing at average of 16%. This
strategy has been called export-led growth (Ministry of Finance, 2007, p. 131).
Along with reduction in tariff, Pakistan has also reduced export taxes and duties on imports for raw
materials used in manufacture. In some cases such as cotton yarn, it has been brought to zero (SPDC,
2006). However, Pakistan's percentage in global exports has been consistently low. The below given
table 5 illustrates this point.
1985 1990 1995 2000 2004
0
20
40
60
80
100
Average Tariffs
Average Tariffs (Unweighed)
Years
Av
erag
e Ta
rtif
fs %

11 | P a g e D i s c u s s i o n p a p e r o n T r a d e P o l i c y - I m p a c t C o n s u l t in g
Table 5
Pakistan's Share in World Exports (%)
1990 0.16
1995 0.16
2000 0.14
2004 0.15
Source: World Trade Organization www.wto.org
On the import side, there has been an import surge average rate of 29.0 percent per annum) during
the last four years. Ministry of Finance (2007) claims that:
'Four years of strong economic growth strengthened domestic demand which triggered a
consequential pick up in investment. The rise in investment demand led to a massive surge in
imports'.
3.1. GDP Growth and Trade
The bellow given figure 3 shows the annual growth rate of Pakistan along with export and import. It
shows that the period during 1990s, imports started increasing while there was decrease in exports
as well as in GDP. After 2002, imports exports and GPD all start picking up. SPDC (2006) claims that
‘real GDP growth performance showed a general downward trend over much of the liberalization
period, until financial year 2001. Since then, however, economic growth has steadily increased,
reaching 8.4 percent in 2005’.
It is argued that during 1990s, due to changes in geo-strategic realities and inefficiencies of 1980s
(Sayyed, 1995), trade policy reforms of 1990s took time to show results. Therefore, 2000s is the
period when flanking policies of investment coordination and further privatization, liberalization,
and deregulation has generated potential for economic growth.
Figure -3
Source: World Bank. http://devdata.worldbank.org/data-query/
12 | P a g e D i s c u s s i o n p a p e r o n T r a d e P o l i c y - I m p a c t C o n s u l t in g
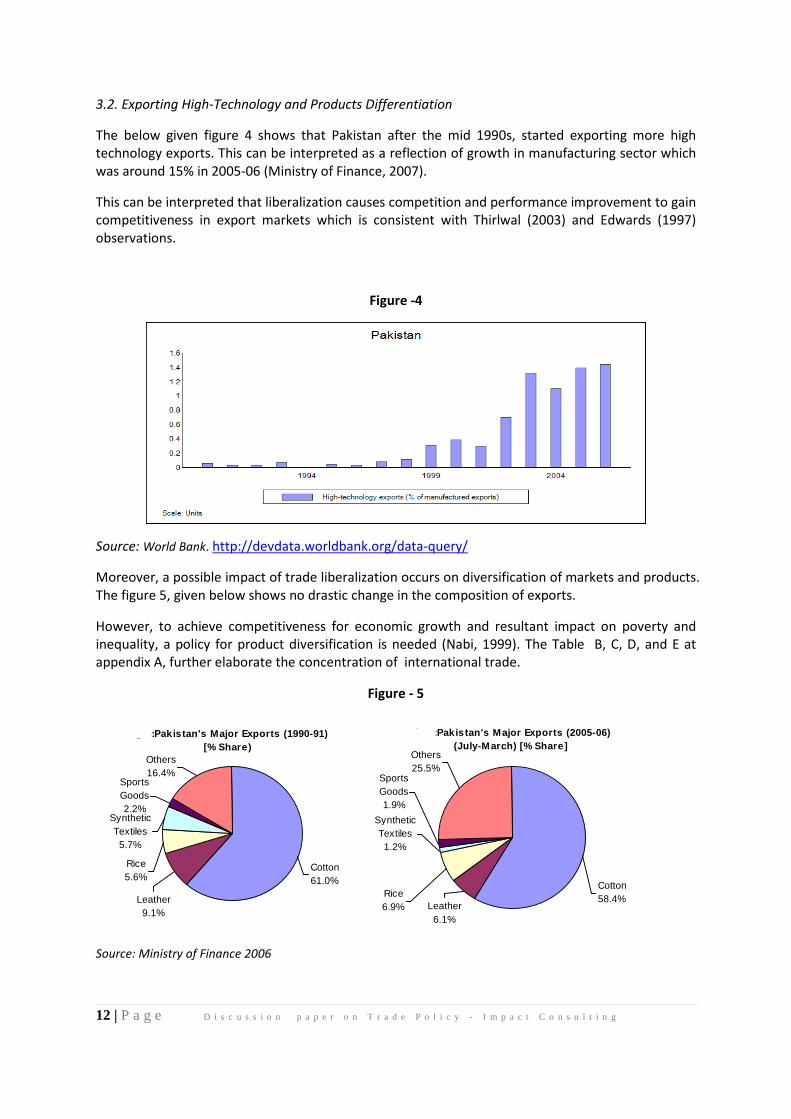
3.2. Exporting High-Technology and Products Differentiation
The below given figure 4 shows that Pakistan after the mid 1990s, started exporting more high
technology exports. This can be interpreted as a reflection of growth in manufacturing sector which
was around 15% in 2005-06 (Ministry of Finance, 2007).
This can be interpreted that liberalization causes competition and performance improvement to gain
competitiveness in export markets which is consistent with Thirlwal (2003) and Edwards (1997)
observations.
Figure -4
Source: World Bank. http://devdata.worldbank.org/data-query/
Moreover, a possible impact of trade liberalization occurs on diversification of markets and products.
The figure 5, given below shows no drastic change in the composition of exports.
However, to achieve competitiveness for economic growth and resultant impact on poverty and
inequality, a policy for product diversification is needed (Nabi, 1999). The Table B, C, D, and E at
appendix A, further elaborate the concentration of international trade.
Figure - 5
Source: Ministry of Finance 2006
Fig-5:Pakis tan's Major Exports (2005-06)(July-March) [% Share]
Synthetic Textiles1.2%
Sports Goods1.9%
Others25.5%
Rice6.9% Leather
6.1%
Cotton58.4%
Fig-4:Pakis tan's Major Exports (1990-91) [% Share)
Sports Goods2.2%
Synthetic Textiles
5.7%
Others16.4%
Rice5.6%
Leather9.1%
Cotton61.0%

13 | P a g e D i s c u s s i o n p a p e r o n T r a d e P o l i c y - I m p a c t C o n s u l t in g
3.3. Employment, Poverty, and Inequality
The below given table 5, provides data about employment, poverty, and inequality. SPDC (2006)
argues that before between 1991-95, consumer price (inflation) was high (11.1%) and employment
growth was low. However, employment rate picked up during the second half of 1990s with fall in
inflation though income inequality has consistently increased in Pakistan (see Gini coefficient in
table 5). SPDC (2006) argues that with liberalization of economy, employment has increased though
it is not clear whether the employment was generated for unskilled or was biased towards highly
skilled urban area workers.
Table 5
Average Annual Growth %of Employment Poverty % (Headcount) Income inequality (Gini)
76-80 3.5 33.8 0.328881-85 2.2 25.6 0.349586-90 2.6 21.4 0.368791-95 1.1 21.3 0.386396-00 2.9 25.1 0.402301-05 3 31 0.4140*
Average Level ofYears
Source: SPDC 2006, table 2.1 in source
• data refers to year 01-03.
3.4. Sectoral Employment
According to the Labour Forces Survey (1990-2004), which is undertaken by the Government of
Pakistan (shown in Figure -6) total employment grew by 40% while manufacturing sector showed
57% and agriculture sector around 27%. It appears that employment in agriculture sector has
shrunken while in the industrial sector it has increased.
It can be inferred that the rural areas which accommodate around 65% of the population of Pakistan
might have lagged behind and inequality further entrenched. According to SPDC (2006), evidence
suggests that people in rural areas have got less employment opportunities as compared to the
urban areas while migration of labour force does not reveal the whole story.
It appears that though the economy of Pakistan has created jobs but it has missed the rural poor.
Interestingly, Zaidi (2005) argues that Gini Coefficient between 1963-99 has decreased in urban
areas of Pakistan i.e., from 0.368 to 0.330 but in rural areas it has deteriorated from 0.355 to 0.410
for the corresponding period. It is interesting to note how growth, poverty and income distribution
have been witnessed during last fifty years of Pakistan.
Zaidi (2005, p. 439) argues that during 1950s, growth was stagnated and poverty persisted while
data for income distribution is not available. During 1960s, growth was robust, poverty increased but
income distribution improved. During 1970s, growth stagnated, poverty declined, but income
distribution worsened. 1980s brought growth back, poverty declined, but income distribution first
deteriorated and then improved. During the period of structural adjustment and liberalization i.e.,
1990s, growth declined substantially, poverty increased considerably, and income distribution
worsened.

14 | P a g e D i s c u s s i o n p a p e r o n T r a d e P o l i c y - I m p a c t C o n s u l t in g
Figure -6
Employment Growth by Sector (1990-91-2003-04)
40
57.1
27
50
0
10
20
30
40
50
60
Total manfacturing Agriculture others
Sectors
Gro
wth
in P
erce
ntag
e
Sectors
Source: Labour Force Survey, cited in SPDC 2006 in Box. 2.2
In the literature review, it was argued that macro-economic stability (Winter, 2004) is necessary for
openness to deliver. SPDC argues that 1990s was the period in which economic fundamental were in
real bad shape. 'Despite a commitment to trade liberalization and other policy reforms in the areas of
deregulation, privatization and greater reliance on market forces, an adequate degree of
macroeconomic stability eluded the economy', the report argues (SPDC, 2006).
The challenges of macro-economic situation were enormous. For example, during 1980s Pakistan did
massive over-spending and budget deficit to GDP was 5.6% in 1988 which was progressively brought
under control to 3.8% in 2005 (SPDC, 2006).
While Ulku (2008), Rodrik (2000), and Winter (2004) mention that institutions of conflict
management and governance are essential to economic growth, Pakistan had the opposite during
1990s. It had extreme political uncertainty and corruption along with a massive exogenous shock in
the aftermath of nuclear test in 1998 (SDPC, 2006).
In a nutshell, the liberalization period 1990s witnessed many economic and non-economic stresses
which influenced economic performance and income distribution mechanisms. It becomes difficult
to unambiguously determine the effects liberalization on economic performance and income
inequality specially when urban rural and sectoral distribution is also taken into account.
Conclusion
Pakistan has gone through different phases in its trade policy reforms. It had been protectionist and
control based during 1950s and since then tried to liberalize the import export regimes. During
1960s and 1970s, export-orientation was emphasized. The real liberalisation started in 1988 with
structural adjustment programmes sponsored by the World Bank and the IMF. The period when
trade policy reforms were taking place i.e., 1990s, the country had many political as well as
economic stresses. These stresses impacted Pakistan's economic performance under liberalization.
Resultantly, poverty increased along with worsening income distribution.
Pakistan appears to be a good candidate for policy reforms as institutional reforms which Rodrick
(2000) alludes to. In fact, institutional reforms can ensure that export-led growth is evenly
distributed and inequality tackled through broad-based employment creation and other flanking
policies.

15 | P a g e D i s c u s s i o n p a p e r o n T r a d e P o l i c y - I m p a c t C o n s u l t in g
So far, it appears, that the country has tried to manage reforms as stand alone trade reforms
whereas it had a more comprehensive and complex liberalization agenda to pursue during 1990s.
However, during 2000s, as geo-strategic 6 situation started changing, it has started getting
investment and economy has shown a turn around. However, it still awaits diversification in
products and destinations to achieve international competitiveness which East Asian economies
have.
It appears that the linkages between trade liberalization, economic performance, and inequality are
complex which often involve non-economic intervening variables such as geo-strategic environment
and institutional arrangements of political and economic governance.
6 With special reference to US led war on terror in Afghanistan and elsewhere since September 9, 2001.

16 | P a g e D i s c u s s i o n p a p e r o n T r a d e P o l i c y - I m p a c t C o n s u l t in g
References
Ahmed, V. and Amjad, R (1984), 'The Management of Pakistan's Economy 1947-82', Oxford
University Press, Karachi.
Arbache, J. S., Dickerson,A. and Green, F. (2004), 'Trade Liberalisation and Wages, in Developing
Countries, The Economic Journal, Vol. 114, pp. F73–F96.
Barrientos, S. (1998), 'How to do a literature Study', in Finding out Fast: Investigative Skills for Policy
and Development, Thomas, A., Chataway, J., and Wuyts, M. (eds), SAGE, London.
Benard, A. B. and Jensen, J. B., (1999), Exceptional Performance: Cause, Effect, or Both?, Journal of
International Economics, Volume 47, Issue, 1, pp. 1-25.
Brahmbhatt and Dadush (1996), 'Disparities in Global Integration', Finance and Development,
September. [Online] available:
http://www.imf.org/external/pubs/ft/fandd/1996/09/pdf/brahmbha.pdf [last accessed: May 5,
2008]
Chang, H-J. (2003), ‘Trade and Industrial Policy Issues’, in Rethinking Development Economics, Chang,
H-J. (ed.) Anthem Press, UK, pp. 257-276.
Chang, H-J (2005), 'Why Developing Countries Need Tariffs: How WTO NAMA Negotiations Could
Deny Developing Countries' Right to Future', South Centre, Geneva.
Coe, D.T., Helpman, E., and Hoffmaister A. W. (1997), 'North-South R &D Spillovers', The Economic
Journal, Vol. 107, Issue 440, pp. 134-149.
Colman, D. & Nixson, F., (1994), ‘Economics of Change in Less Developed Countries’, University Press,
Cambridge, UK.
Dollar, D. (1992) ‘Outward-oriented Developing Economies Really Do Grow More Rapidly: Evidence
from 95 LDCs - 1976–1985’, Economic Development and Cultural Change, Vol. 40, No. 3, pp. 523–44.
Dollar, D. and Kraay, A., (2004), 'Trade, Growth, and Poverty', The Economic Journal, Vol. 114, pp.
F22-F49
17 | P a g e D i s c u s s i o n p a p e r o n T r a d e P o l i c y - I m p a c t C o n s u l t in g
Easterly, W., (2003), ‘The Political Economy of Growth without Development: A Case Study of
Pakistan’, in ‘In Search of Prosperity: Analytical Narrative on Economic Growth’, Rodrik, D. (eds).,
Princeton University Press, New Jersey. pp. 439-472.
Edwards, S. (1992), 'Trade orientation, Distortions and Growth in Developing Countries', National
Bureau of Economic Research Working Paper Series, Working Paper No. 3716.
Edward, S. (1997), 'Trade Policy, Growth, and Income Distribution', The American Economic Review,
Papers and Proceedings of the Hundred and Fourth Annual Meeting of the American Economic
Association, Vol. 87, No. 2, pp. 205-210.
Edwards, S. (1998), 'Openness, Productivity and Growth: What do we Really Know', Economic
Journal, Vol, 108, pp. 383-398.
Frankel and Romer (1999), ‘Does Trade Cause Growth?’, American Economic Review, Vol. 89, No. 3,
pp. 379–99.
Hausmann, R, Hwang, J., Rodrik, D, (2005), 'What You Export Matters', National Bureau of Economic
Research Working Paper Series, Working Paper No. 11905.
International Monetary Fund (IMF) (1998), 'Trade Liberalization in IMF Supported Programs', World
Economic and Financial Surveys, Washington.
Kemal, A.R., (1999), 'Patterns and Growth of Pakistan's Industrial Sector', in Fifty Years of Pakistan's
Economy: Traditional topics and Contemporary Concerns, Khan, S.R. (eds), Oxford University Press,
Karachi, pp. 150-174.
Krugman, P. R., and Obstfeld, M. (2003), 'International Economics, Theory and Policy', Pearson,
Boston.
Krugman, P. (1992), 'Does the New Trade Theory Require a New Trade Policy', The World Economy,
Vol. 15, Issue 4, pp. 423-442

18 | P a g e D i s c u s s i o n p a p e r o n T r a d e P o l i c y - I m p a c t C o n s u l t in g
Levine, R. and Renelt, D. (1992), 'A Sensitivity Analysis of Cross-Country Growth Regressions',
American Economic Review, Vol. 82, Issue 4, pp. 942-963.
Lewer, J, J. and Berg, H. V. (2003), How Large International Trade's Effect on Economic Growth?',
Journal of economic Surveys, Vol. 17, Issue 3, pp. 363-396.
Ministry of Finance (2006), 'Economic Survey of Pakistan 2005-06', Ministry of Finance, Pakistan.
Ministry of Finance (2007), 'Economic Survey of Pakistan 2006-07', Ministry of Finance, Pakistan.
Nabi, I., (1999), 'The Competitiveness of Pakistani Exports', in Fifty Years of Pakistan's Economy:
Traditional topics and Contemporary Concerns'. , Khan, S.R. (eds), Oxford University Press, Karachi,
pp. 175-200.
Richardson, J., D. (1995), 'Income Inequality and Trade: How to Think, What to Conclude' The Journal
of Economic Perspectives, Vol. 9, No. 3, pp. 33-55.
Rodrik, D. (2000), ‘Institutions for High-Quality Growth: What They are and How to Acquire Them’.
National Bureau of Economic Research, Working Paper no. 7540.
Rodrik, D. (2001), 'The Global Governance of Trade as if Development Really Matters', [Online]
available http://www.servicesforall.org/html/Governance/Rodrik-Trade%20&%20Development.pdf,
[Accessed: May 2, 2008]
Rodriguez and Rodrik (2001), ‘Trade Policy and Economic Growth: A Skeptic’s Guide to the
Crossnational Evidence’, in Macroeconomics Annual 2000, Bernanke, B., and Rogoff, K.S. (eds.), pp.
261–324, MIT Press for NBER, Cambridge, MA.
Sachs and Warner (1995), ‘Economic Convergence and Economic Policies’, Brookings Papers in
Economic Activity, Vol. 1, pp. 1–95.
Santos-Paulino, A.U., (2005), 'Trade Liberalisation and Economic Performance: Theory and Evidence
for Developing Countries', World Institute for Development Economics Research, Blackwell
Publishing , UK.

19 | P a g e D i s c u s s i o n p a p e r o n T r a d e P o l i c y - I m p a c t C o n s u l t in g
Santos-Paulino, A.U, and Thirlwal, A.P.,(2004), 'Trade Liberalization and Economic Performance in
Developing Countries - Introduction', The Economic Journal, Vol. 114, pp. F1-F3
Sayyed, A. U. (1995), 'Political Alignments, the State and Industrial Policy in Pakistan: A Comparison
of Performance in the 1960s and 1980s', Unpublished Ph.D. Dissertation, University of Cambridge,
Cambridge.
SPDC (2006), 'Social Development in Pakistan: Trade Liberalization, Growth, and Poverty', Social
Policy and Development Centre, Karachi.
Srinivasan, T.N., and Bhagwati, J. (1999). ‘Outward-orientation and Development: Are Revisionists
Right?’, mimeo, Yale University.
Stiglitz, J. (1993), 'Economics', W.W. Norton, New York.
Thirlwal, A.P., (2003), ‘Growth & Development: With Special Reference to Developing Economies’,
Palgrave Macmillan, New York.
Ulku, H. (2008), 'Trade, Growth, and Poverty', Lecture notes, Lecture 10 of Trade Policy and
Development, IDPM 60291, University of Manchester.
UNDP (2005), 'International Cooperation at a Crossroads: Aid, Trade and Security in an Unequal
World: Human Development Report 2005', United Nations Development Programme, New York.
White, H. and Anderson, E (2001), 'Growth versus Distribution: Does the Pattern of Growth Matter?',
Development Policy Review, Vol. 19, No. 3, pp. 267-289.
Winters, L. A., (2004), 'Trade Liberalisation and Economic Performance: An Overview' The Economic
Journal, Vol. 114, pp. F4- F21.
World Bank, (1987), 'World Development Report 1987', World Bank, Washington.
World Bank (1990), 'Poverty: World Development Report 1990', World Bank, Oxford University Press,
Washington.

20 | P a g e D i s c u s s i o n p a p e r o n T r a d e P o l i c y - I m p a c t C o n s u l t in g
World Bank (2008), World Development Report 2008, Washington.
World Bank (2008), [Online] available: http://devdata.worldbank.org/data-query/
Zaidi, S.A. (2005), 'Issues in Pakistan's Economy', Oxford University Press, Karachi.

21 | P a g e D i s c u s s i o n p a p e r o n T r a d e P o l i c y - I m p a c t C o n s u l t in g
Appendix A
Table - A
Key Economic Indicators
Gross domestic product (2006) US $ 128,830 million
Average annual growth rate (2000-06) 5.4%
Value added as per cent of GDP (2006)
Agriculture
Industry
Services
20
27
53
External balance of goods and services (2006) -9
Export
Imports
US $ 16,917 million
US $ 29,825 million
High technology exports (% of manufactured
exports 2005)
2 %
Current account balance US $ -3608 million
Foreign direct investment (2005) US $ 2183 million
External debt (2005) US $ 33,675 million
Domestic credit provided by banking sector 42%
Source: World Bank (2008)
Table -B
Source: Ministry of Finance, 2007

22 | P a g e D i s c u s s i o n p a p e r o n T r a d e P o l i c y - I m p a c t C o n s u l t in g
Table C
Source: Ministry of Finance, 2007
Table D
Source: Ministry of Finance, 2007

23 | P a g e D i s c u s s i o n p a p e r o n T r a d e P o l i c y - I m p a c t C o n s u l t in g
Table E
Source Ministry of Finance, 2007

24 | P a g e D i s c u s s i o n p a p e r o n T r a d e P o l i c y - I m p a c t C o n s u l t in g
Impact Consulting offers services for the social, private, and public sector. It
maintains a high quality of professionalism in managing and delivering
assignments and projects. Committing itself to always extend good value for
money, it maintains a core team of advisors alongside a large pool of expert
consultants related to the offered services.
The firm offers combinations of research, management, and training resources
which range from community level development planning and execution to
national, regional and global policy development and analysis.
Impact Consulting
540, Street, 105, I-8/4, Islamabad, Pakistan
Phone & Fax: +92-051-4437300