the effects of ultra-long-range flights on the alertness ... effects of ultra-long-range flights on...
TRANSCRIPT
NASA/TM—2006–213484
The Effects of Ultra-Long-Range Flights on the Alertness and Performance of Aviators John A. Caldwell Ames Research Center, Moffett Field, CA Melissa M. Mallis Ames Research Center, Moffett Field, CA Laura M. Colletti QSS Group, Inc., Moffett Field, CA Raymond L. Oyung, Summer L. Brandt, and Lucia Arsintescu San José State University Foundation, Moffett Field, CA Charlie W. DeRoshia Ames Research Center, Moffett Field, CA Dinah D. Reduta-Rojas and Patrick M. Chapman San José State University Foundation, Moffett Field, CA April 2006
https://ntrs.nasa.gov/search.jsp?R=20060024526 2018-06-12T14:56:19+00:00Z

NASA STI Program ... in Profile
Since its founding, NASA has been dedicated to the advancement of aeronautics and space science. The NASA scientific and technical information (STI) program plays a key part in helping NASA maintain this important role.
The NASA STI program operates under the
auspices of the Agency Chief Information Officer. It collects, organizes, provides for archiving, and disseminates NASA’s STI. The NASA STI program provides access to the NASA Aeronautics and Space Database and its public interface, the NASA Technical Report Server, thus providing one of the largest collections of aeronautical and space science STI in the world. Results are published in both non-NASA channels and by NASA in the NASA STI Report Series, which includes the following report types:
• TECHNICAL PUBLICATION. Reports of
completed research or a major significant phase of research that present the results of NASA programs and include extensive data or theoretical analysis. Includes compilations of significant scientific and technical data and information deemed to be of continuing reference value. NASA counterpart of peer-reviewed formal professional papers but has less stringent limitations on manuscript length and extent of graphic presentations.
• TECHNICAL MEMORANDUM. Scientific and technical findings that are preliminary or of specialized interest, e.g., quick release reports, working papers, and bibliographies that contain minimal annotation. Does not contain extensive analysis.
• CONTRACTOR REPORT. Scientific and technical findings by NASA-sponsored contractors and grantees.
• CONFERENCE PUBLICATION. Collected papers from scientific and technical conferences, symposia, seminars, or other meetings sponsored or co-sponsored by NASA.
• SPECIAL PUBLICATION. Scientific, technical, or historical information from NASA programs, projects, and missions, often concerned with subjects having substantial public interest.
• TECHNICAL TRANSLATION. English-language translations of foreign scientific and technical material pertinent to NASA’s mission. Specialized services also include creating
custom thesauri, building customized databases, and organizing and publishing research results.
For more information about the NASA STI
program:
• Access the NASA STI program home page at http://www.sti.nasa.gov
• E-mail your question via the Internet to [email protected]
• Fax your question to the NASA STI Help Desk at (301) 621-0134
• Phone the NASA STI Help Desk at (301) 621-0390
• Write to: NASA STI Help Desk NASA Center for AeroSpace Information 7121 Standard Drive Hanover, MD 21076-1320

NASA/TM—2006–213484
The Effects of Ultra-Long-Range Flights on the Alertness and Performance of Aviators John A. Caldwell Ames Research Center, Moffett Field, CA Melissa M. Mallis Ames Research Center, Moffett Field, CA Laura M. Colletti QSS Group, Inc., Moffett Field, CA Raymond L. Oyung, Summer L. Brandt, and Lucia Arsintescu San José State University Foundation, Moffett Field, CA Charlie W. DeRoshia Ames Research Center, Moffett Field, CA Dinah D. Reduta-Rojas and Patrick M. Chapman San José State University Foundation, Moffett Field, CA National Aeronautics and Space Administration Ames Research Center Moffett Field, CA 94035-1000 April 2006

Acknowledgments
The success of this project would not have been possible without the assistance and hard work of many people. Thus, we recognize and thank the following people and their associated organizations for their contributions to the Ultra-Long-Range study, in particular Dr. Mary M. Connors (NASA Ames Research Center); Dr. Kevin P. Jordan, Sean A. Belcher, Steve A. Farlow, Colleen T. Geven, and Richard W. Geven (San José State University); Dr. Heike K. Rentmeister-Bryant (U.S. Navy); Marlene L. Hernan and Wendy J. Krikorian (QSS Group, Inc.); Terrence Rager, David Brown, Diane Carpenter, Bob Cornell, Jeff Dewey, Ian Maclure, Jim Miller, Ramesh Panda, Charlie Ross, Ghislain Saillant, and Gary Uyehara (NASA Ames Crew Vehicle Systems Research Facility); Dr. Jeffrey Smith, Stan Hardy, Emily Holton, Fritz Moore, Dee O’Hara, Rick Ryzinga, Tianna Shaw, Stephen Voels, and John Watkins (NASA Ames Human Research Facility).
Last, but not least, we thank the additional Fatigue Countermeasures Group members for their
exceptional efforts and dedication to aviation safety research: Sigurd H. Mejdal (Monterey Technologies), Sandy L. Bowman (QSS Group, Inc.), and Antonio F. Puentes (San José State University).
Note: John Caldwell works for the US Air Force Research Laboratory, Brooks AFB, TX, but is on
detail at Ames Research Center, Moffett Field, CA for one year from July 2005 to August 2006. Melissa Mallis, Summer Brandt, and Dinah Reduta-Roja are now at Alertness Solutions, Cupertino, CA; Raymond Oyung is now at Z-Tech Corporation, Santa Clara, CA; and Patrick Chapman is now at Google, Inc., Mountain View, CA.
Available from: NASA Center for AeroSpace Information National Technical Information Service 7121 Standard Drive 5285 Port Royal Road Hanover, MD 21076-1320 Springfield, VA 22161 (301) 621-0390 (703) 487-4650
This report is also available in electronic form at
http://human-factors.arc.nasa.gov/zteam/fcp/FCP.pubs.html

iii
TABLE OF CONTENTS INTRODUCTION ............................................................................................................................. 1 The Potential for Fatigue-Related Difficulties...................................................................... 1
Extended Work and Wakefulness Periods ............................................................................ 2 Night Duty ............................................................................................................................ 2 Additional Fatigue Factors.................................................................................................... 3 Summary............................................................................................................................... 3
OBJECTIVES OF THE CURRENT RESEARCH............................................................................ 3 METHOD .......................................................................................................................................... 4 Participants............................................................................................................................ 4 Materials and Apparatus ....................................................................................................... 5 Design and Procedure ........................................................................................................... 7 RESULTS .......................................................................................................................................... 11 Actigraphy ............................................................................................................................ 11 The Psychomotor Vigilance Task (PVT).............................................................................. 12 Subjective Variables ............................................................................................................. 16 Flight Performance................................................................................................................ 25 DISCUSSION.................................................................................................................................... 29 Psychomotor Vigilance......................................................................................................... 30 Self-Rated Well-being .......................................................................................................... 30 Operational Performance ...................................................................................................... 31 SUMMARY AND CONCLUSIONS ................................................................................................ 32 Recommendations for Future Research ................................................................................ 32 REFERENCES .................................................................................................................................. 33


1
INTRODUCTION The US economy is demanding unprecedented air travel in both domestic and international sectors.
The FAA's annual traffic forecast indicates that the post-9/11 falloff in passenger numbers has bottomed out and that domestic air travel will increase by about 3.5% per year while international travel will increase by more than 4% per year (U.S. Department of Transportation, 2005). Currently, there is stiff competition among air carriers as they attempt to attract and service increased numbers of customers while reducing operational costs. One potential method for accomplishing both of these objectives on international routes is to introduce the ultra-long-range (ULR) flights that have been enabled by new aircraft designs. Both Boeing and Airbus are presently marketing ULR aircraft. The Boeing 777-200LR is capable of connecting almost any two cities in the world nonstop, and can carry 301 passengers and their baggage for up to 9,420 nautical miles (17,445 kilometers) (Boeing, 2005). Similarly, the Airbus A340-500 can fly 313 passengers over 8,650 nautical miles (16,000 kilometers) without stopping for maintenance or refueling (Wikipedia, 2005).
Thus, it is now possible to offer passengers point-to-point international service without the delays imposed by refueling stops or changes in equipment. In fact, in November, 2005, United Airlines began flying directly from Chicago to New Delhi, India, a 16-hour, non-stop route. Such flights benefit customers by permitting shorter overall transit times (by minimizing stops), and they benefit the airlines with lower fuel and maintenance costs. However, at the same time, ULR flights may pose problems in terms of aircrew performance and job satisfaction (and subsequent worker retention) because of fatigue-related difficulties that extend well beyond those which have already been identified in more traditional types of aviation operations. ULR flight operations will create longer duty periods than those encountered in current domestic and international flights and will increase the demands for crews to work nonstandard and nighttime duty schedules. Without proper management, ULR operations may exacerbate the fatigue levels that have already been shown to impair safety, alertness, and performance in existing flight operations (Neri, 2005). As discussed in more detail below, such decrements can pose significant risks in the aviation environment.
The Potential for Fatigue-Related Difficulties
Surveys of pilots and aircrew members reveal that fatigue is an important concern throughout today’s 24/7 flight operations (Caldwell, 2005). Long duty periods obviously contribute to sleep deprivation, and working around the clock is complicated by circadian factors. Simply remaining awake and on the job for 18.5–21 hrs can produce performance changes similar to those seen with blood alcohol concentrations of 0.05–0.08% (Dawson and Reid, 1997), and it has been shown that flights longer than 10 continuous hours are at significantly greater risk for fatigue-related mishaps (Goode, 2003).
Pilot fatigue is an insidious threat throughout aviation, but especially in operations involving sleep loss from circadian disruptions, increased sleep pressure from extended duty, and impaired arousal associated with night duty (Åkerstedt, 1995a). Aviator fatigue is associated with degradations in response accuracy and speed, the unconscious acceptance of lower standards of performance, impairments in the capacity to integrate information, and narrowing of attention that can lead to forgetting or ignoring important aspects of flight tasks (Perry, 1974). Fatigued pilots tend to decrease their physical activity, withdraw from social interactions, and lose the ability to effectively divide mental resources among different tasks. As sleepiness levels increase, performance becomes less consistent and vigilance deteriorates (Dinges, 1990).
Clearly, fatigue is a threat to flight safety. In fact, a recent consensus statement by a 28-member panel of experts concluded that fatigue was likely a causative or contributory factor in 15–20% of transportation mishaps, and that existing statistics (such as those reported below) likely present an underestimation of fatigue-related problems (Åkerstedt, 2000). A National Transportation Safety Board (NTSB) study of major accidents in domestic air carriers from 1978 through 1990 in part concluded that “. . . Crews

2
comprising captains and first officers whose time since awakening was above the median for their crew position made more errors overall, and significantly more procedural and tactical decision errors” (NTSB, 1994, No. SS-94-01, p. 75). Kirsch (1996) estimates that fatigue may be involved in 4–7% of civil aviation mishaps, and data from the U.S. Army suggest fatigue is involved in 4% of Army accidents (Caldwell and Gilreath, 2002). Furthermore 25% of the Air Force’s night tactical fighter Class A accidents were attributed to fatigue between 1974 and 1992 (Ramsey and McGlohn, 1997), and over the past 30 years, it has been determined that approximately 8% of the Air Force’s total Class A mishaps have been in part due to fatigue (Caldwell, 2005). Fatigue-related problems in aviation operations are primarily the result of extended duty periods, body-clock disruptions associated with non-standard work schedules and time-zone crossings, and the requirement to work through circadian “low points.”
Extended Work and Wakefulness Periods
Extended duty times (work shifts that exceed 8 hrs) are already common in aviation, and ULR flights will no doubt require additional hours on the job. Gander, Gregory, Graeber, et al. (1998) found that one sample of pilots involved in short-haul trips worked an average of 10.6 hrs per day, while another sample of long-haul pilots worked an average of 9.8 hrs per day (Gander, Gregory, Miller, et al. 1998). Rosekind et al. (1994) indicated the duty times of long-haul pilots in one study ranged from 8.4 to 14.8 hrs per day. However, the important fact is that “duty time” fails to depict the duration of “time awake”, which is of primary importance in determining crew alertness levels. No doubt, many of the pilots in the Rosekind et al. (1994) study were continuously awake for several more hours beyond the 8–15 hrs logged as “duty time” considering that commute times and other nonwork activities are not considered as “duty.” In fact, Gander, Gregory, Miller, et al. (1998) found that the average period of wakefulness for the crews in one of her investigations was in excess of 20 hrs on outbound flight legs. Samel, Wegmann, and Vejvoda (1997) reported similarly lengthy periods of continuous wakefulness in another sample of long-haul pilots.
Note that in ULR flight operations, extended flight duty periods and prolonged bouts of continuous wakefulness may be even more problematic. This is disconcerting in light of existing evidence that work shifts longer than 8 hrs have been associated with decrements in alertness and performance (Åkerstedt, 1995b; Hamelin, 1987; Morisseau and Persensky, 1994; Rosa, 1995; Rosa and Bonnet, 1993), and Samel, Wegmann, and Vejvoda (1997) have shown that pilot fatigue increases progressively as a function of flight length.
Night Duty
The potential impact of extended work hours in ULR aviation must be considered in conjunction with the effects of working at times that are incompatible with the body’s internal circadian rhythms. Nightshift performance is generally poorer than daytime performance, and the sheer length of ULR flights will necessitate that a large portion of these flights will occur at night. Monk and Folkard (1985) found a consistent pattern of impaired nighttime performance on a wide variety of non-aviation tasks, and Åkerstedt (1995b) pointed out that the probability of accidents on highways, in industry, and in aviation is greater at night, especially after long periods of continuous wakefulness. Such scientific data have been substantiated by a number of high-profile catastrophes including the grounding of the Exxon Valdez, the crash of Korean Air flight 801, and the near meltdown at Three Mile Island. All of these were at least partially attributable to the fatigue associated with night work (Mitler, Carskadon, Czeisler, et al., 1988; NTSB, 1990; NTSB, 1999).
In existing long-haul flights, nighttime segments have been found especially vulnerable to cognitive lapses or “microsleeps”— brief periods during which sleep uncontrollably intrudes into wakefulness. Moore-Ede (1993) found that while microsleeps occurred in the simulator cockpit throughout the day, there also was a tenfold increase between the hours of 04:00 and 06:00, during which time pilots made the greatest number of errors. Wright and McGown (2001) found that while sleepiness of long-haul pilots

3
increased during both daytime and overnight flights, the occurrence of sleep was more frequent on flights that departed late in the night compared to those that departed earlier. Many of the microsleeps were so short (less than 20 seconds) that the crewmembers may not have been aware of them. Rosekind et al. (1994) also found that long-haul flights, particularly those occurring at night, were plagued by a substantial increase in electroencephalogram (EEG) micro-events as well as escalating decrements in vigilance and alertness.
Additional Fatigue Factors
As discussed above, long-haul aircrews are susceptible to fatigue due to a variety of factors, not the least of which are extended duty periods (with extended periods of wakefulness) and the requirement to work on nonstandard schedules. In addition, circadian disruptions from traveling across time zones, and sleep restrictions associated with short layovers (combined with sleep opportunities that are out of phase with normal body rhythms) can impair alertness and performance (Gander, Gregory, Miller, et al., 1998). The avoidance of circadian disruptions and night work in conjunction with 18–22 hr flight operations will be impossible because, after factoring in report times, preflight activities, and postflight debriefs, the 24-hr duty point will be nearly met or exceeded. Combining such work hours with cockpits that are highly automated and sometimes cramped, poorly ventilated, noisy, and dimly lit, can make pilots uniquely susceptible to fatigue (Battelle, 1998). The situation will be further complicated by the fact that efficacious fatigue countermeasures such as cockpit naps (Rosekind et al., 1994), and/or pharmacological interventions (Caldwell, Caldwell, Smythe, and Hall, 2000; Caldwell, Smythe, LeDuc, and Caldwell, 2000) may be unusable because of regulatory or other concerns.
Summary
Several investigations have indicated fatigue already is an issue for crews manning existing long-haul flights. The already documented presence of EEG microsleeps while on trips lasting more than 8 hrs in duration (Cabon, Coblentz, Mollard, and Fouillot, 1993; Samel, Wegmann, Vejvoda, Drescher, et al., 1997; Rosekind et al., 1994; Wright and McGown, 2001) demonstrates that crew members flying the long flights already in service are suffering from cognitive difficulties while on duty (Belyavin and Wright, 1987; Ogilvie, Simons, Kuderian, MacDonald, and Rustenburg, 1991; Ogilvie, Wilkinson, and Allison, 1989). Such data further suggest that ULR flights may be even more problematic, especially when such flights depart late at night. Thus, an important question for ULR operations is whether the strains imposed by further extending flight duty hours beyond the limits already flown will effectively be mitigated by the standard fatigue countermeasures, which in part have been responsible for the acceptable safety record of existing flight operations. Will 18–20 hour flights produce decrements that are not completely countered by existing on-board-bunk-rest, especially if the timing of the rest period is not carefully planned? Will the on-board sleep difficulties already noted in ULR flights (Signal, 2005) necessitate the introduction of expanded counter-fatigue strategies? This study provides baseline information on the effects of a ULR flight with no fatigue countermeasures applied, which will form the basis for exploring these questions in future investigations.
OBJECTIVES OF THE CURRENT RESEARCH
Thus far, the very few studies of ULR flights have been conducted in actual operational circumstances where there is little flexibility in terms of experimental control and measurement strategies (furthermore, almost none of the data from these investigations have been published to date). Thus, it is currently impossible to establish the degree to which ULR operations may exacerbate the fatigue-related problems that already have been identified in more typical aviation operations. Before conducting work on optimal countermeasures for this new realm of commercial aviation, it is first necessary to document 1) whether problems will exist (as expected), 2) whether the magnitude of any observed problems is significantly more severe than what would be expected in existing short-haul and long-haul operations,

4
and 3) whether the scheduling of flights (i.e., daytime versus nighttime departures) would be expected to exert substantial effects on crew alertness and behavior. These data are critical to form a baseline from which the effectiveness of prescribed fatigue countermeasures can be established. Therefore, the objectives of the current research are to:
1) Establish the extent of performance and alertness decrements associated with 20 hrs on duty (with no fatigue countermeasures)
2) Determine the extent to which performance and alertness are affected by daytime versus nighttime departures
3) Evaluate the degree to which flight duration and departure time interact to affect pilots’ abilities to perform
4) Establish a baseline against which future fatigue-countermeasures strategies can be judged.
METHOD Participants Twenty commercial aviation pilots with current Class I physicals volunteered to participate in the
present study between September 2004 and February 2005. Three participants were removed from analyses due to various criteria; therefore, N = 17 participants were analyzed. Participants were male, between the ages of 35 and 60 (M = 48 years, SD = 7.9), and were current Air Transport Pilots (ATP) or ATP pilots who had retired within the previous six months (see table 1). The participants were from the long-haul pilot population flying the Boeing 737 (n = 1), 747 (n = 8), 757/767 (n = 6) and 777 (n = 2) with flight hours ranging between 3,500 and 34,000 hrs (M = 16,666 hrs, SD = 8,997.7). Pilots were compensated for their participation and were treated in accordance with “Ethical Principles of Psychologists and Code of Conduct” (American Psychological Association, 2002). Participants were recruited through the Subject Recruitment Office at NASA Ames Research Center. The Subject Recruitment Office distributed flyers to local airports and contacted previous qualified NASA participants.
TABLE 1. PARTICIPANT DEMOGRAPHICS Participant ID
Age Aircraft certified
Current position in aircraft
Flight hours Position in study
Departure group
A 45 747-400 First Officer 13,000 Captain AM B 36 757 First Officer 20,000 First Officer AM C 47 747-400 First Officer 13,200 Captain AM D 43 757, 767 First Officer 15,000 First Officer AM E 35 777 First Officer 8,500 Captain PM F 54 757, 767 Captain 20,000 First Officer PM G 57 737 First Officer 6,100 First Officer AM H 50 757, 767 Captain 32,000 First Officer AM I 60 747-400 Captain 30,000 Captain AM J 44 747-400 First Officer 3,500 Captain PM K 58 747-400 First Officer 11,000 Captain PM L 54 747-400 First Officer 34,000 Captain AM M 47 757, 767 Captain 21,000 First Officer PM N 51 777 First Officer 8,500 First Officer PM O 38 757 First Officer 11,500 First Officer PM P 56 747-400 Captain 22,000 Captain AM Q 41 747-400 First Officer 14,000 Captain PM

5
Materials and Apparatus
Pre-study assessments Prior to the participants’ arrival at the NASA Ames Research Center, participants were mailed wrist
activity monitors and sleep/activity logs to collect data on sleep and wake activities. On the first day of the study at the research facility, participants filled out written questionnaires.
Wrist activity monitors. To assess the sleep/activity rhythms of participants prior to their arrival, the Actiwatch (AW-64, Mini-Mitter, Bend, OR) wrist monitors were issued to each participant five to seven days prior to the on-site report date. The AW-64 is an accelerometer that generates and stores data based on physical movements. The sampling frequency is 32 Hz, and the data are segmented into one-minute epochs. The monitors were attached to the non-dominant wrist with removable straps and were worn 24 hrs a day, except during activities likely to cause equipment damage. Actigraph data were visually inspected along with activity logs to determine the amount of sleep participants obtained during the five to seven days immediately prior to the subjects’ on-site report date. Once at the research facility, participants continued to wear the monitors until they were released from the study. Note that actigraphy data correlate well with standard polysomnographic assessements (Ancoli-Israel, 2000).
Sleep/activity logs. To further confirm the data collected by the wrist activity monitors, a hand-held electronic device (Palm Pilot; Palm 5x, Palm, Inc., Milpitas, CA) consisting of questions about sleep and wakeup times, sleep quality, daytime activities, beverage consumption, alertness/sleepiness levels, medication (optional), and daytime naps was sent to the participants five to seven days prior to their on-site report date. Participants completed the log/questionnaire at various times throughout the day. Participants continued to report on sleep quality and quantity after each rest period during the study.
Background questionnaire. The 46-item background questionnaire was administered on the first day of the study at the research facility to collect information on sleep habits, caffeine usage, demographic information, and flight experience. This questionnaire was developed by the Fatigue Countermeasures Group, and it had been used in various studies in the past (Rosekind, Co, Gregory, and Miller, 2000).
Multivariate Apnea Index (MAP). The MAP questionnaire also was administered on the first day of the study. The MAP index (Maislin et al., 1995) consists of 13 items concerning sleep apnea-related symptoms, difficulty sleeping symptoms, excessive daytime sleepiness symptoms and narcolepsy-like symptoms (each of which is rated on a scale of 0 to 4). The results of this questionnaire were used to compute the apnea index, which indicates the likelihood of the presence of sleep apnea in each of the participants (these data were not used in the inclusion/exclusion criteria of participants).
Morningness/Eveningness Questionnaire (MEQ). The MEQ (also administered on the first day of the study) is a 19-item questionnaire (Horne and Ostberg, 1976) used to assess whether participants normally feel most alert in the morning or the evening. Research has shown that one’s chronotype may have some impact on individual responsiveness to sleep deprivation. The data from the MEQ will be used in a future effort to identify predictors of fatigue vulnerability.
Study assessments Various subjective, cognitive, physiological, operational, and behavioral tools were used to assess
participants throughout the baseline/training day, on the ULR flight days, and after recovery sleep. All of the instruments are described below.
Effort to Stay Awake (ESA). The ESA questionnaire is one item administered on the Palm Pilot, measuring the subjective effort made by the participants to stay awake throughout the flight. Participants were asked to identify on a four-point scale ranging from “very little effort” to “an extreme effort” as to how much effort it required of them to stay awake since the last test bout.
Karolinska Sleepiness Scale (KSS). The KSS is a nine-point Likert-type scale of subjective sleepiness ranging from “1 = very alert” to “9 = very sleepy, fighting sleep.” Participants were asked to indicate on the Palm Pilot their sleepiness level during the last five minutes until answering the question. This scale has been shown to be sensitive to sleep loss and circadian rhythmicity (Åkerstedt and Folkard, 1997).

6
Visual Analog Scale (VAS). To evaluate the participants' subjective impressions about alertness, energy, confidence, anxiousness, irritability, jitteriness, sleepiness, and talkativeness, a modified version of the VAS, used by Penetar et al. (1993), was administered on the Palm Pilot. An adjective such as "anxious" or "sleepy" was placed over the center of a line (100 pixels long) with the words "not at all" appearing at the far left and “extremely” appearing at the far right. Participants were instructed to move the arrow to the point on the line that indicated how they felt at that moment. The scores for each VAS item consisted of the number of pixels from the left side of each line to the point at which the subject placed his mark. Each VAS produced eight scores for analysis.
Psychomotor Vigilance Task (PVT). To assess the effects of long-duration flights on vigilance, the PVT (Dinges and Powell, 1985) was administered throughout the study while at the research facility. The PVT is a hand-held test that delivers a three-mm visual stimulus (a reaction-time counter) which requires the participant to make a pushbutton response within 1.5 seconds with interstimulus interval varying from one to 10 seconds. Participants were instructed to press the response button as rapidly as possible once the visual stimulus appeared; however, participants were cautioned against pressing the button too soon to avoid a "false start." Before and after each reaction time test, the PVT displayed a visual analog 10-point scale to assess subjective sleepiness. The total task duration for each PVT trial was 10 minutes. The number of performance lapses (trials in which the subject failed to generate a response) and reaction times during each PVT trial were analyzed. Prior research has shown that PVT is an excellent test for detecting performance impairments from hypovigilance, fatigue, or drowsiness (Dinges and Kribbs, 1991).
Eyes-open EEG. To gain some objective indication of physiological alertness/sleepiness, a five-minute resting EEG (adapted from Cummings, Dane, Rhodes, Lynch, and Hughes, 2000) was collected immediately following each PVT administration. Participants were instructed to relax, focus on a visual fixation point, and remain quiet while five minutes of eyes-open EEG were collected via standard EEG recording electrodes. Data were recorded from C3, C4, O1, O2, EOG-R, and EOG-L referenced to A1 and A2 (located behind ears) with submental EMG-1 referenced to EMG-2. Unfortunately, due to equipment and experimental factors (i.e., the use of ambulatory recorders and the requirement to avoid task interference), it was not possible to monitor the data quality in real time and to intervene when movement artifacts and/or electrode problems compromised the data quality. As a result, the final data set was found to be insufficient for meaningful statistical analyses, and was therefore discarded.
Performance Evaluation and Effort Rating Scales (PEERS). The PEERS is a three-item scale (Dinges, Kribbs, Steinberg, and Powell, 1992) presented at the end of each test battery on the Palm Pilot. The scales involve self-ratings of performance quality, motivation, and compensatory effort needed for the tasks just completed. The results of this test will be included in a future report.
Flight simulator. The training, baseline, and ULR simulator flights occurred in the Boeing 747-400 flight simulator in the Crew Vehicle Systems Research Facility (CVSRF) at NASA Ames Research Center. The high-fidelity simulator possesses full-motion capabilities that were not utilized for the current study due to safety concerns, as the pilots exited their seats during break times (there is a requirement that when the simulator is “on motion” everyone must be securely strapped into their respective seats). The simulator cockpit was equipped with video cameras and microphones that connected to the Experimenter Control Room, where researchers monitored participants continuously throughout the flights.
Operational flight tasks. To examine the impact of long-range flights on actual flight performance, several operational events occurred during each flight. There were eight five-minute hand-flying sessions which were included during the cruise portion. In each of these segments, all pilots (with captains hand-flying first) disengaged the autopilot, autothrottles, and flight director and attempted to maintain a steady heading, altitude, and airspeed. Additionally, there were two other manually-flown maneuvers. The captain hand flew the aircraft below 10,000 feet with only the flight director engaged and performed a 720º turn (two 360º turns) at an altitude of 7,000 feet (while maintaining steady airspeed, altitude, and roll angle) and an ILS approach to landing (accurately tracking the localizer and glide slope).
Behavioral monitoring. All simulator flights were videotaped for quality assurance and for later review (if necessary). Research experimenters supervised the testing that took place at 90-min intervals

throughout the study, and they periodically checked the impedances of physiological sensors and the proper operation of data-collection equipment.
Polysomnography. Polysomnography, using EEG, electro-oculography (EOG), and electromyogram (EMG), were recorded during the baseline and recovery sleep opportunities to evaluate sleep quality and quantity and during the ULR flight to assess alertness (e.g., the presence of microsleeps). Data were recorded via the same montage used for the eyes-open EEG test. The time constant for the EEG and EOG channels was 0.68 seconds, and the high filter was set at 35 Hz. For EMG, the time constant was 0.015 seconds and the high filter was set at 75 Hz. The 60 Hz notch filter was used as necessary. These data have been sent to a sleep specialist for determination of the time of sleep onset and wakeup as well as the percentages of time spent in stages 1–4 and REM sleep and overall sleep efficiency. A subsequent report will outline the polysomnographic findings and compare these to the wrist activity data described earlier.
De-brief interview. A 20-minute interview was administered at the end of the experiment to inform each individual participant of the purpose of the study and to collect information about his experiences during the study. The interview also provided an opportunity for the experimenters to address safety concerns following the participants’ release (i.e., to advise participants to avoid driving or operating complex machinery until full recovery from the sleep-deprivation testing).
Design and Procedure
Pre-study Volunteers were sent a participant package five to seven days prior to arriving at NASA Ames
Research Center which included a wrist activity monitor (AW-64, Mini-Mitter, Bend, OR) a sleep/activity log (Palm 5x, Palm, Inc., Milpitas, CA), equipment instructions, flight documents, and a copy of the protocol and consent form. Participants were instructed to review the documents before arriving at the research facility and to begin collecting sleep/activity data immediately. Participants were asked to refrain from all forms of caffeine, nicotine, and alcohol starting on the first day at the research facility and continuing throughout the remainder of the protocol. To control for the intake of caffeine, sugar, melatonin, and other ingredients known to affect alertness or sleepiness, specific foods (e.g., caffeinated beverages, chocolate) were not provided to the participants once at the research facility.
IRB
cons
ent f
orm
brie
fing
Test
batte
ry tr
ainin
g, b
out 1
Sim
ulat
or o
rient
ation
Test
bout
2Tr
aini
ng fl
ight
Lunc
hEE
G in
strum
entat
ion
Test
bout
3Ba
selin
e flig
ht
Test
bout
4Pr
e-stu
dy as
sess
men
t rev
iew
Que
stion
naire
sTr
ansp
ort t
o be
d-re
st fa
cility
Din
ner
Free
tim
e
Test
bout
5Re
lease
for b
ed
9:00 10:00 11:00 12:00 13:00 14:00 15:00 16:00 17:00 18:00 19:00 20:00 21:00
Figure 1. Baseline/training day timeline.
Baseline/training The baseline/training day was designed to familiarize the participants with test procedures and to
collect baseline data. Training was conducted in the CVSRF either in a briefing room or in the Boeing 747-400 simulator cockpit. In most cases baseline/training occurred on Monday1. Participants arrived in the local area earlier on Sunday and stayed in a nearby local hotel Sunday night. On Monday morning, participants reported for in-processing at approximately 09:00. After completing the schedule outlined in Figure 1, participants were transferred to a separate bed-rest facility. The “off-duty” period began at
7
1 Except one experimental run, which started the protocol sequence on Tuesday.

8
21:20, at which time participants were free to initiate sleep at the time of their choice (realizing that on Tuesday, the AM group would be awakened at 06:45 and the PM group would be awakened at 09:30). According to the actigraph-based sleep estimates, the AM group typically slept from 22:06 to 06:47, and the PM group slept from 22:21 to 08:50 (the additional sleep time allotted for the PM group was designed to partially compensate for the fact they would subsequently remain awake far longer than the AM group).
Pre-study assessments. At the start of the baseline/training day, following the Institutional Review Board consent form briefing, the actigraphy and sleep/activity log data were extracted, and the equipment was returned to the participants. On the baseline/training day, a researcher reviewed with the participants the sleep/wake activity to verify sleep and wakeup times as well as other events. Also on the baseline day, participants were informed about the different types of data to be collected during the study. The pre-study questionnaires were completed at that time, and EEG electrodes were applied.
Test battery training. Before the simulator training, an experimenter trained the participants on the test battery procedures and equipment. Each test bout lasted approximately 20 minutes and began with the Palm-Pilot based ESA, KSS, and VAS assessments. Participants were then instructed to perform the 10-minute PVT and subjective sleepiness rating. At the end of the PVT, the participants returned to the Palm Pilot to focus on a fixation point during the five-minute eyes-open EEG evaluation. Afterwards, they completed the PEERS assessment. During the baseline/training day, a total of five test bouts (consisting of each of these tasks) were completed.
Simulator training. Participants were familiarized with the simulator during their first exposure on the training/baseline day and trained to perform the maneuvers and tasks of interest during their second exposure on the same day. Given that participants were rated for different aircraft, the 747-400 rated pilot always functioned as the captain during the study and performed all takeoffs and landings. The first officer for each group maintained a glass cockpit rating and received training to perform all necessary functions required by the study. Participants received a briefing before each flight and were instructed to fly a normal, uneventful flight. During each flight, the captain was instructed to hand-fly the aircraft with autopilot and autothrottles off during takeoff, landing, and when flying below 10,000 feet.
For the training flight, the participants took off from SFO heading to LAX. After top-of-climb, the captain was instructed to perform a five-minute hand-flying session where he turned off the autopilot, autothrottle, and flight director and attempted to maintain a steady heading, altitude, and airspeed. After top-of-descent, with autopilot off, the captain was instructed to complete a 720º turn (two 360º turns) before being diverted to OAK as an alternate airport. For the baseline flight, the participants took off from LAX heading to SFO. While enroute, after top-of-descent, the aircraft was again diverted, this time to ONT as an alternate airport. At the conclusion of each flight, the captain executed an ILS approach into the destination airport. Both flights were approximately 2 hours long.
ULR flight Days two and three (Tuesday and Wednesday) of the study involved the ULR flight. The schedules
for the AM and PM departure group are shown below (see figures 2 and 3). AM departure group schedule. For the AM departure group, participants were awakened at 06:45 on
day two and began preparing for a flight departure at 10:57. All AM flights took off on time at 10:57 and landed at approximately 06:20 the following morning. The AM departure group experienced a minimum of 24 hrs of sleep deprivation during the ULR flight (see figure 2).
PM departure group schedule. For the PM departure group, participants were awakened at 09:30 on day two, but their flight did not depart until approximately 22:57. Although the PM group did not fly until the evening, they performed the PVT at times consistent with those of the AM group. However, they did not perform the subjective measures or the eyes-open EEG (their EEG electrodes were removed upon awakening from baseline sleep and were not reapplied until right before departure). To pass the time, participants in the PM group were allowed to watch television and movies, read books, play cards or games, or browse the Internet. Physical activity was kept to a minimum and naps were not permitted. All

PM flights took off on time at 22:57 (on Tuesday) and landed at approximately 18:20 on Wednesday evening. The PM departure group experienced a minimum of 34 hrs of sleep deprivation (see figure 3).
9
Wak
eup
Test
bout
6Sh
ower
Brea
kfas
tEE
G In
strum
enta
tion
Tran
spor
t to
CVSR
F
Flig
ht re
view
Test
bout
7Co
ckpi
t pre
para
tion
Take
off
Lunc
h
Test
bout
8H
and-
fly 1
Stre
tch
brea
kTe
st bo
ut 9
Restr
oom
/snac
k br
eak
Test
bout
10
Han
d-fly
2St
retc
h br
eak
Test
bout
11
Din
ner
Test
bout
12
6:00 7:00 8:00 9:00 10:00 11:00 12:00 13:00 14:00 15:00 16:00 17:00 18:00
Ultra-Long-Range Flight
Han
d
-fly
3St
retch
bre
akTe
st bo
ut 1
3H
and-
fly 4
Restr
oom
/snac
k br
eak
Test
bout
14
Han
d-fly
5St
retch
bre
akTe
st bo
ut 1
5H
and-
fly 6
Restr
oom
/snac
k br
eak
Test
bout
16
Han
d-fly
7St
retc
h br
eak
Test
bout
17
Han
d-fly
8Re
stroo
m/sn
ack
brea
k
Test
bout
18
Restr
oom
/snac
k br
eak
Test
bout
19
Land
ing
Test
bout
20
Tran
spor
t to
bed-
rest
faci
lity
Brea
kfas
t
19:00 20:00 21:00 22:00 23:00 00:00 1:00 2:00 3:00 4:00 5:00 6:00 7:00
Ultra-Long-Range Flight cont. Figure 2. ULR flight timeline for AM departure group.
Wak
eup
Test
bout
6Br
eakf
ast
Show
erFr
ee ti
me
PVT
1Lu
nch
PVT
2
PVT
3
PVT
4
Dinn
erPV
T 5
6:00 7:00 8:00 9:00 10:00 11:00 12:00 13:00 14:00 15:00 16:00 17:00 18:00
EEG
instr
umen
tatio
nTr
ansp
ort t
o CV
SRF
Flig
ht re
view
Test
bout
7Co
ckpi
t pre
para
tion
Take
off
Restr
oom
/snac
k br
eak
Test
bout
8H
and-
fly 1
Stre
tch b
reak
Test
bout
9Re
stroo
m/sn
ack
brea
kTe
st bo
ut 1
0H
and-
fly 2
Stre
tch b
reak
Test
bout
11
Brea
kfas
t
Test
bout
12
Han
d-fly
3St
retch
bre
ak
19:00 20:00 21:00 22:00 23:00 00:00 1:00 2:00 3:00 4:00 5:00 6:00 7:00
Ultra-Long-Range Flight
Test
bout
13
Hand
-fly
4Re
stroo
m/sn
ack
brea
k
Test
bout
14
Hand
-fly
5St
retc
h br
eak
Test
bout
15
Hand
-fly
6Lu
nch
Test
bout
16
Hand
-fly
7St
retc
h br
eak
Test
bout
17
Hand
-fly
8Re
stroo
m/sn
ack
brea
k
Test
bout
18
Restr
oom
/snac
k br
eak
Test
bout
19
Land
ing
Test
bout
20
Tras
npor
to b
ed-re
st fa
cility
Snac
k./D
inne
r
8:00 9:00 10:00 11:00 12:00 13:00 14:00 15:00 16:00 17:00 18:00 19:00 20:00
Ultra-Long-Range Flight cont.
Figure 3. ULR flight timeline for PM departure group.

10
ULR flights. For both the AM and PM departure groups, the ULR flights were identical in terms of flight plan, testing sessions and break opportunities. The cockpit lighting and simulator environment were designed to replicate the real-world light exposure that would occur during an actual ULR flight. Specifically, lighting was standardized within each group so that all members of the AM group received the same lighting cues and all members of the PM group received the same lighting cues. To keep the simulated sunrise and sunset constant, the flight simulation was programmed to run on the same, specifically chosen calendar day (before the change to Daylight Saving Time) for each experimental run. During simulated nighttime hours, the simulator cabin, simulator bay, and pilot lounge lights were dimmed, and the natural light from the windows was blocked with a dark tarp to ensure that nighttime conditions were maintained throughout all testing (and breaks).
Throughout the flight, participants were not allowed to sleep. To ensure that participants maintained wakefulness, an experimenter monitored, from the experimenter station, the eyes of each participant during the entire flight. If a participant’s eyes closed for longer than 90 seconds, the experimenter contacted the participant individually through the headset and asked the participant to please stay awake. All participants were responsive to this procedure.
For all departure groups, participants were briefed on the flight plan from LAX to WSSS (Singapore) with the captain assigned the flying pilot for takeoff and landing. Air traffic control chatter was present during takeoff to top-of-climb and top-of-descent to landing; however, only datalink communication was allowed during the cruise portion of the flight when the participants completed position reports or requested a change in altitude. Instructions for test bouts, hand-flying sessions, and break opportunities were communicated by an experimenter over a headset.
While in the simulator, participants were instructed to begin each test bout at 90-minute intervals. Thus, there was a total of 14 test bouts during each 20-hour flight. After eight of these test bouts, during the cruise portion of the flight, participants were instructed to perform a five-minute hand-flying session with the captain flying first and the first officer flying second. Following each of the in-flight testing sessions, a researcher instructed the participants to take one of the following: (a) a five-minute stretch break (n = 5) to move about the cockpit freely; (b) a seven-minute snack/restroom break (n = 5) to exit the cockpit for the Pilot Lounge to use the restroom, and/or have a snack; or (c) a 20-minute meal break (n = 2) to exit the cockpit and eat a meal in the Pilot Lounge. All breaks were taken separately so that one pilot always remained in command of the simulator. At the end of the flight, soon after top-of-descent, the captain was instructed to hold prior to the approach by performing a 720º turn. The captain was then diverted to a different runway before being cleared for ILS approach and landing.
Recovery/post-flight After the ULR flight, participants were transported back to the Ames Research Center bed-rest
facility, provided a meal if hungry, and released for the recovery sleep opportunity. The recovery sleep opportunity for the AM group started at 07:00 and ended at 20:00, allowing for 13 hrs of recovery. The recovery sleep for the PM group started at 19:00 and ended at 09:00, allowing for 14 hrs of recovery.2 If a participant woke and stayed awake before the end of the sleep opportunity, an unscheduled additional test battery was requested within 15 minutes of awakening. All participants performed a final test bout at the end of the designated sleep opportunity and were then de-instrumented (EEG electrodes were removed). After a short de-brief interview, participants were released from the study and transported to a hotel, home, or airport.
2 Note: at the beginning of the study both groups were allowed 14 hrs of recovery, but after the first two runs it was decided that the AM group should be allowed one hour less recovery at the bed-rest facility. This decision was based on the fact that after the initial sleep period, the AM participants tried to maintain themselves awake in order to be able to fall asleep at night and therefore, to align with the circadian clock. Consequently, they were transported to the hotel one hour earlier in order to prepare for the night sleep.

11
RESULTS To investigate performance and alertness changes during 20-hr ULR flights, a series of statistical
analyses were performed on objective non-flight assessments (actigraphy and the Psychomotor Vigilance Task (PVT)) and subjective self reports (Pre-PVT sleepiness scale, the Effort to Stay Awake (ESA), the Karolinska Sleepiness Scale (KSS), and the Visual Analog Scale (VAS)) during baseline, flight and recovery phases of the study. In addition, analyses were performed on the flight performance data collected during the eight five-minute straight-and-level maneuvers, and the 720º turn and the ILS approach maneuvers. These analyses investigated the circadian effects stemming from the different departure times and, if applicable, average performance changes from the baseline training sessions, to the flight period, to the post-recovery period. Note that the EEG data, which were collected to provide a physiological measure of alertness status during the flights, were found, unfortunately, to be overly contaminated with recording artifacts and, therefore, insufficient for analysis.
To investigate the overall effects of departure time across study phases, a series of 2-way mixed effects model analyses of variance (ANOVA) were performed. There were two levels of the grouping factor (departure group: AM vs. PM) and three levels of the within-subjects factor (phase of study: baseline, ULR flight, recovery). When statistically-significant main effects or interactions occurred, test of simple effects, post-hoc contrasts and independent t-tests or F-tests were performed to pinpoint the exact nature of the effect.
Following these evaluations, the higher-resolution effects of the ULR flight were assessed via an additional mixed-model ANOVA in which the grouping factor remained the same as above (departure group: AM vs. PM), but the within-subjects factor consisted of 14 levels (trials during the ULR flight: Trial 1 – Trial 14). Depending on the nature of statistically-significant effects, follow-up assessments consisted of either independent t-tests or trend analyses.
When necessary, all ANOVA p-values were corrected for sphericity violations using Greenhouse-Geisser epsilon adjusted degrees of freedom. For the post-hoc comparisons, corrections for alpha inflation were not applied at this stage due to the fact that when investigating issues related to flight safety, it is more conservative to potentially make a Type I error than to make a Type II error (Kirk, 1968).
Actigraphy
The activity monitor worn by participants during the study, provided objective data of sleep time and wake activity as scored by the Actiware-Sleep software version 3.3 (Mini-Mitter, Portland, OR). As there were only two conditions in this data set (baseline sleep vs. recovery sleep), independent t-tests were performed. These analyses indicated there were significant differences in total sleep time between the two groups at baseline sleep (t(15) = -3.85, p < .01) and recovery sleep (t(15) = -7.09, p < .001). The PM group slept more during both baseline (M = 10.15, SD = 1.41) and recovery (M =11.57, SD = 2.06) compared to the AM group at baseline (M = 8.34, SD = 0.50) and recovery (M = 5.83, SD = 1.21).
The differences in the total amount of sleep obtained by pilots during baseline may have been due to the testing schedule, which allowed the PM group to sleep longer in order to partially compensate for the fact that they arose in the morning but did not depart until almost 23:00 (overall, they were required to remain awake longer than the AM group). The significant differences in the total sleep time obtained by pilots during the recovery period may have been due to a combination of factors. Firstly, the PM group (who landed at approximately 18:30) had their sleep period during the night whereas the AM group (who landed at 06:30) had their recovery sleep period during the day. Thus, based on circadian factors alone, the PM group would have been expected to sleep more during recovery (simply because they were sleeping at night). Secondly, due to the departure times, the PM group remained continuously awake for 34 hrs prior to recovery as opposed to the 24 hrs experienced by the AM group. Thus, when the time for recovery sleep occurred, the PM group was under greater homeostatic sleep pressure.

12
The Psychomotor Vigilance Task (PVT)
The PVT allowed an examination of sustained attention throughout the flights in that this test required participants to rapidly respond to visual stimuli appearing at random intervals. Table 2 shows when each trial was performed during baseline, flight, and recovery.
TABLE 2. THE PACIFIC STANDARD TIMES CORRESPONDING TO THE NUMBER OF TRIALS (TEST BOUTS) FOR EACH EXPERIMENTAL PERIOD FOR AM AND PM DEPARTURE GROUPS
AM departure PM departure Trial# Trial #
within period
Period Trial time
Day Trial# Trial # within period
Period Trial time
Day
1 1 Baseline 09:50 1 1 1 Baseline 09:50 1 2 2 Baseline 10:40 1 2 2 Baseline 10:40 1 3 3 Baseline 14:20 1 3 3 Baseline 14:20 1 4 4 Baseline 16:35 1 4 4 Baseline 16:35 1 5 5 Baseline 21:00 1 5 5 Baseline 21:00 1 6 6 Baseline 07:00 2 6 6 Baseline 09:52 2 7 1 Flight 09:52 2 7 1 Flight 21:52 2 8 2 Flight 12:30 2 8 2 Flight 00:30 3 9 3 Flight 14:00 2 9 3 Flight 02:00 3
10 4 Flight 15:30 2 10 4 Flight 03:30 3 11 5 Flight 17:00 2 11 5 Flight 05:00 3 12 6 Flight 18:30 2 12 6 Flight 06:30 3 13 7 Flight 20:00 2 13 7 Flight 08:00 3 14 8 Flight 21:30 2 14 8 Flight 09:30 3 15 9 Flight 23:00 2 15 9 Flight 11:00 3 16 10 Flight 00:30 3 16 10 Flight 12:30 3 17 11 Flight 02:00 3 17 11 Flight 14:00 3 18 12 Flight 03:30 3 18 12 Flight 15:30 3 19 13 Flight 05:00 3 19 13 Flight 17:00 3 20 14 Flight 06:25 3 20 14 Flight 18:25 3 21 1 Recovery Early
wakeup 3 21 1 Recovery Early
wakeup 4
22 2 Recovery 20:00 3 22 2 Recovery 09:15 4
Data for analyses were extracted using the REACT data analysis software (Version 1.1.05) for the PVT-192 (Ambulatory Monitoring, Inc., NY). Although the PVT generates a variety of summary data following each administration, only a subset of these data were examined. The measures that were incorporated, based on the most commonly used PVT performance metrics published in previous studies (Dinges and Kribbs, 1991), consisted of the following: 1) Lapses – the cumulative number of reaction times exceeding 500 milliseconds—a purported indicator of fatigue and deficits in sustained attention; 2) Median reaction times to measure central tendency in response times uninfluenced by outliers; and 3) Optimum response times – or the fastest 10% of reciprocal response times for all trials—an indication of the best performance a participant is capable of producing.
Lapses were transformed using the sqr(x) + sqr(x + 1) transformation (Dinges and Kribbs, 1991). These procedures substantially decrease the contribution of long lapses and emphasize slowing in the optimum and intermediate range of responses (Dinges et al., 1987). One participant was removed from all

PVT analyses due to excessive false starts indicating non-compliance on the task. Therefore, N = 16 participants were included for the PVT analyses unless otherwise specified.
As described previously, the data first were analyzed using the 2 (group) x 3 (phase) mixed-effects ANOVA to examine overall differences among baseline, flight, and recovery phases. Post-hoc contrasts will examine changes from the baseline phase. Second, the data were examined with the 2 (group) x 14 (trials) mixed-effects ANOVA to pinpoint specific times during the ULR flights when alertness was compromised.
Lapsing Across Phases of the Study. The ANOVA revealed a significant phase-by-departure interaction (F(2,
28) = 8.15, p < .01), as shown in figure 4. Tests for simple effects showed that the mean number of lapses for both the AM and PM groups were significant across phase (F(2, 16) = 3.93, p < .05 and F(1.15, 6.89) = 31.85, p = .001, respectively). Post-hoc contrasts showed that the AM and PM groups displayed significant increases in lapses from baseline to flight (F(1, 8) = 15.70, p < .01 and F(1, 6) = 42.22, p = .001, respectively) but showed no significant difference between baseline and recovery (F(1, 8) = 0.11, n.s. and F(1, 6) = 0.64, n.s., respectively). Independent t-tests revealed a significant difference between the groups during the flight (p < .05).
During the Flight. The ANOVA revealed a significant trials-by-departure interaction (F(13, 182) = 11.95, p < .001) as shown in figure 5. Tests for simple effects showed that the mean number of lapses for both the AM and PM groups were significant across trials (F(13, 104) = 10.69, p < .001, and F(13, 91) = 8.95, p < .001, respectively). Post-hoc contrasts showed that the AM group displayed significant linear (p < .001) and quadratic (p < .01) trends, whereas the PM group displayed only a quadratic trend (p < .01). Independent t-tests on individual trials indicated a significant increase in mean number of lapses for the PM group compared to the AM group on trials 3–8 and 11 (p < .05). Although lapsing between the groups was not significant near the end of the study, one can visually see in figure 5 that the lapsing of the AM group was increasing as the PM group was decreasing. Thus, as expected, performance of both groups appears to coincide with the endogenous circadian rhythm. Additionally, the PM group was likely more compromised during their circadian “low points” because they had been awake for 10 hrs longer than the AM group.
13
0
2
4
6
8
10
Phase of study
Num
ber o
f lap
ses
AM departurePM departure
Baseline Flight Recovery
0
2
4
6
8
10
12
0 1 2 3 4 5 6 7 8 9 10 11 12 13 14
Trials
Num
ber o
f lap
ses
AM departurePM departure
10:00 14:00 17:00 20:00 23:00 02:00 05:00 AM times 22:00 02:00 05:00 08:00 11:00 14:00 17:00 PM times
**
*
**
*
*
*Significant trials
Landing
Takeoff
Figure 4. Significant interaction between phase and departure group for lapses. Note that the PM group lapsed more during the flight than the AM group.
Figure 5. Interaction between departure group and trials for lapses during the flight. The PM group lapsed significantly more than the AM group on trials 3–8 (between 02:00 and 09:00) and trial 11 (14:00).

Median reaction times (RT) Prior to conducting the mixed-effects ANOVA on this data set, it was observed that there were
baseline differences in performance between the two departure groups. Independent t-tests on the median reaction times revealed differences between the PM vs. AM groups during baseline (t(14) = 3.80, p < .01) even though efforts were made to avoid differences by randomly assigning pilots to the conditions of the study. These results indicate that the PM group was faster than the AM group prior to the study interventions. Therefore, instead of conducting the ANOVA on raw data, the analyses were conducted on change-from-baseline median RT.
Across Phases of the Study. The ANOVA revealed a significant phase-by-departure interaction (F(2, 28) = 3.94, p < .05), as shown in figure 6. Tests for simple effects showed that the median RT for both the AM and PM groups were significantly different across phases (F(2, 16) = 4.44, p < .05, and F(1.11, 6.66) = 43.42, p < .001, respectively). Post-hoc contrasts on the AM and PM groups showed that both groups displayed significant increases in median RT from baseline to flight (F(1, 8) = 19.58, p < .01, and F(1, 6) = 47.66, p < .001, respectively). However, only the PM group showed a significant increase in RT from the baseline to the recovery phase (F(1, 6) = 30.31, p < .01). Thus, the RT of the PM group increased from baseline measures despite 12 hours of recovery sleep. Independent t-tests revealed a significant difference between the groups during the flight (p < .01).
During the Flight. The ANOVA revealed a significant trials-by-departure interaction (F(5.11, 71.55) = 10.08, p < .001), as shown in figure 7. Tests for simple effects showed that the median RT for both the AM and PM groups were significantly different across phase (F(13, 104) = 12.32, p < .001, and F(13, 91) = 7.70, p < .001, respectively). Post-hoc contrasts showed that the AM group displayed significant linear (p < .001) and quadratic (p < .01) trends whereas the PM group displayed significant quadratic (p < .01) and cubic (p < .05) trends. Independent t-tests revealed a significant difference between the AM and PM groups on trials 2–8 (p < .05). As mentioned earlier, while the PM group was slower during their circadian nadir (trials 2–8 at 00:00–10:00), the AM group exhibited similar performance decrements at their circadian nadir (trials 12–13 at 03:00–05:00) although there were no group differences at this point.
14
0
10
20
30
40
50
60
Phase
Cha
nges
in R
T (m
s)
AM departurePM departure
Baseline Flight Recovery -20
0
20
40
60
80
100
120
140
160
0 1 2 3 4 5 6 7 8 9 10 11 12 13 14
Trials
Cha
nges
in R
T fr
om b
asel
ine AM departure
PM departure
10:00 14:00 17:00 20:00 23:00 02:00 05:00 AM times 22:00 02:00 05:00 08:00 11:00 14:00 17:00 PM times
*
*
**
*
*
*Takeoff
Landing
*Significant trials Figure 6. The PM group had a slower median RT during the flight compared to the AM group.
Figure 7. The trials-by-departure interaction for median RT. The PM group was slower than the AM group during the first half of the flight (corresponding to their circadian nadir).

Optimum reaction times (fastest 10% RT) As was the case with median RT, independent t-tests conducted prior to the mixed-effects ANOVA
indicated a baseline difference between the groups on the fastest 10% of RT (t(14) = -5.37, p < .001). Therefore, the data analyzed consisted of change-from-baseline RT.
Across Phases of the Study. The phase-by-departure ANOVA revealed a significant main effect of phase (F(2, 28) = 13.23, p < .001) but no main effect for departure group and no interaction. The phase main effect was due to an overall significant slowing (increase in RT) from baseline to flight (F(1, 14) = 28.21, p < .001) and from baseline to recovery (F(1, 14) = 8.34, p < .05), as depicted in figure 8.
During the Flight. The ANOVA revealed a significant trials-by-departure interaction (F(5.79, 81.06) = 7.58, p < .001). Tests for simple effects on the AM and PM groups showed that the optimum RT for both groups were significantly different across trials (F(13, 104) = 10.15, p < .001, and F(13, 78) = 4.82, p < .001, respectively). Post-hoc contrasts showed that the AM group displayed significant linear (p < .001), quadratic, and cubic trends (p < .05) whereas the PM group displayed significant quadratic and cubic trends (p < .05). The interaction was found to be the result of significant differences between the departure groups on trials 3–7 (p < .05), at which point the PM group was slower to respond than the AM group. In addition, visual inspection of these data (and the presence of a linear trend) indicated that as the flight progressed, the performance of the AM group slowed substantially as well (see figure 9).
0
10
20
30
40
50
Phase
Cha
nges
in R
T fr
om b
asel
ine AM departure
PM departure
Baseline Flight Recovery
0
10
20
30
40
50
0 1 2 3 4 5 6 7 8 9 10 11 12 13 14
Trials
Cha
nges
in R
T fr
om b
asel
ine
AM departurePM departure
10:00 14:00 17:00 20:00 23:00 02:00 05:00 AM times22:00 02:00 05:00 08:00 11:00 14:00 17:00 PM times
*
*Significant trials
*
* **
Landing
Takeoff
Figure 8. The fastest 10% of RT, changes from baseline levels, obtained from pilots across the three phases of the study.
Figure 9. The fastest 10% RT, changes from baseline levels, obtained from pilots during the ULR flight.
PVT summary In general, the results showed that psychomotor vigilance performance (i.e., sustained attention)
deteriorated as a function of both circadian and homeostatic factors for both groups. Specifically, for the PM group, both median RT and optimum responses decreased while the number of lapses increased during the first portion of the flight (during their circadian nadir), whereas the AM group experienced the greatest difficulties during the latter part of the flight (during their circadian nadir). In both groups, poorest performance generally occurred at night after a number of hours of continuous wakefulness. Note that prior to departure, the PM group had already been awake 10 hrs longer than the AM group.
The results comparing baseline-to-recovery phases also suggest that performance may not return to baseline levels after a single period of recovery sleep, as seen in optimum RT in both the AM and PM groups. Similar results were observed in median RT, although it was only significant for the PM group (the AM group’s median RT tended to increase but not significantly).
15

Subjective Variables
In order to investigate the subjective sleepiness as reported by pilots during the study, the following variables were collected during baseline, the ULR flight, and recovery: Pre-PVT sleepiness scale, the Effort to Stay Awake (ESA) scale, the Karolinska Sleepiness Scale (KSS), and various moods scored using a Visual Analog Scale (VAS). The same statistical analyses were performed on these variables as were used for the PVT measures to investigate the effects of the different departure times across phases of the study and the higher-resolution impact of time-on-duty and time-of-day across the test trials during the cruise portion of the flight. As was the case earlier, the times used throughout the analyses are Pacific Standard times. The data analyzed are based on the responses of 17 participants.
Pre-PVT sleepiness Across Phases of the Study. Pre-PVT sleepiness is a subjective measure of sleepiness (on a 10-pt
scale) administered by the PVT device before the initiation of the vigilance task. The ANOVA on these data revealed a significant phase-by-departure interaction (F(2, 26) = 9.59, p = .001), as shown in figure 10. Tests for simple effects revealed that the mean sleepiness levels for both the AM and PM groups were significantly different across phases (F(2, 12) = 5.13, p < .05, and F(2, 14) = 34.72, p < .001, respectively). Post-hoc contrasts showed that the AM and PM groups displayed significant increases in sleepiness from baseline to flight (F(1, 6) = 15.39, p < .01, and F(1, 7) = 47.98, p < .001, respectively) but showed no significant difference between baseline and recovery (F(1, 6) = 1.30, n.s., and F(1, 7) = 0.73, n.s., respectively). Independent t-tests revealed a significant difference between the groups during the flight (p = .001).
16
0
2
4
6
8
10
Phase
Pre-
PVT
slee
pine
ss
AM departurePM departure
Baseline Flight Recovery
0
1
2
3
4
5
6
7
8
9
10
0 1 2 3 4 5 6 7 8 9 10 11 12 13 14Trials
Pre-
PVT
slee
pine
ss
AM departurePM departure
10:00 14:00 17:00 20:00 23:00 02:00 05:00 AM times 22:00 02:00 05:00 08:00 11:00 14:00 17:00 PM times
*
**
*
** * *
Takeoff
Landing
*Significant trials
Figure 10. The subjective ratings of “Sleepy?” for the two departure groups from baseline, flight, and recovery phases.
Figure 11. During the ULR flight, the PM group felt significantly sleepier than the AM group on trials 2–9 (between 00:00 and 11:00), whereas the AM group suffered from a gradual increase in sleepiness across the in-flight trials.
During the Flight. The ANOVA showed a significant trials-by-departure interaction (F(13, 143) =
8.54, p < .001). Tests for simple effects indicated that the change in subjective sleepiness for both the AM and PM groups was significant across trials (F(13, 78) = 23.68, p < .001, and F(13, 65) = 5.88, p < .001, respectively). Post-hoc contrasts showed that the AM group displayed a significant linear trend (p < .001), whereas the PM group displayed significant quadratic (p < .001) and cubic trends (p < .01). Independent t-tests revealed a significant difference between the groups on trials 2–9 (p < .05). As shown in figure 11, the PM group experienced the greatest sleepiness during the first half of the flight, whereas the AM group
was most impaired during the second half of the flight. In both cases, these times corresponded to the groups’ circadian troughs.
Effort to Stay Awake (ESA) Ratings of the Effort to Stay Awake were derived from a four-point scale item in which participants
rated themselves from level “1 = very little effort (no problems staying awake)” to “4 = an extreme effort (could hardly stay awake).” These data were analyzed in the same fashion as the data from all other assessments (with the exception of the hand-flying flight data).
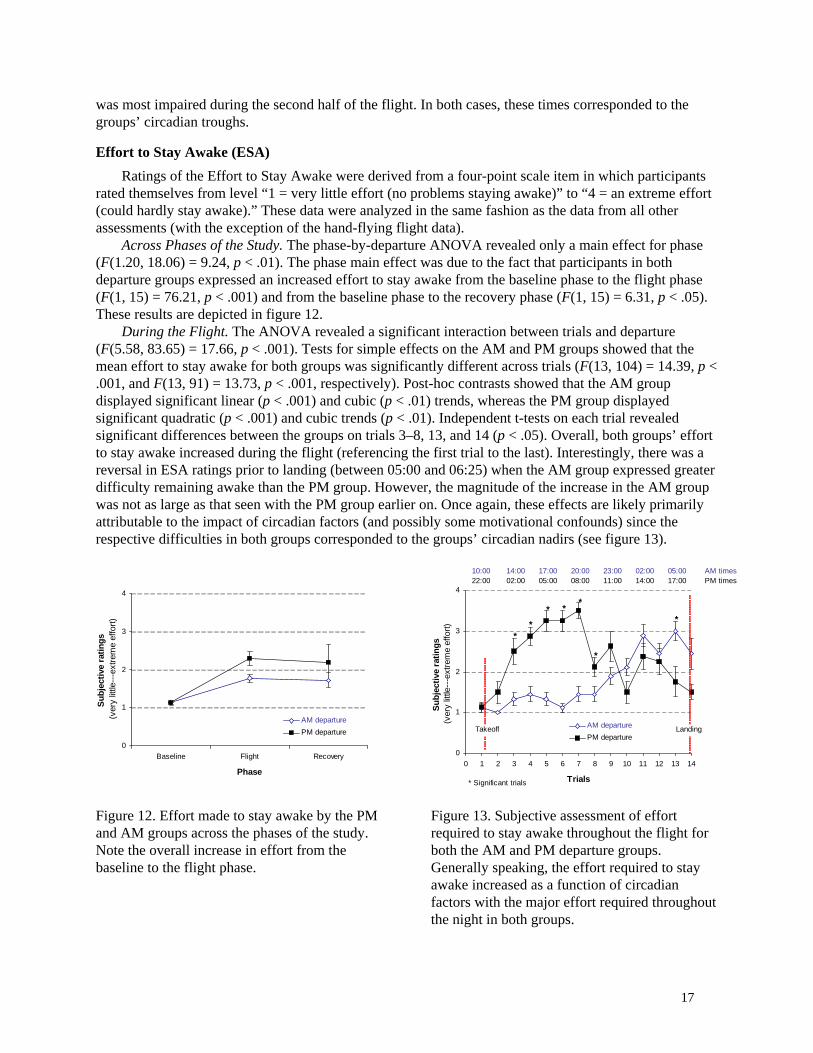
Across Phases of the Study. The phase-by-departure ANOVA revealed only a main effect for phase (F(1.20, 18.06) = 9.24, p < .01). The phase main effect was due to the fact that participants in both departure groups expressed an increased effort to stay awake from the baseline phase to the flight phase (F(1, 15) = 76.21, p < .001) and from the baseline phase to the recovery phase (F(1, 15) = 6.31, p < .05). These results are depicted in figure 12.
During the Flight. The ANOVA revealed a significant interaction between trials and departure (F(5.58, 83.65) = 17.66, p < .001). Tests for simple effects on the AM and PM groups showed that the mean effort to stay awake for both groups was significantly different across trials (F(13, 104) = 14.39, p < .001, and F(13, 91) = 13.73, p < .001, respectively). Post-hoc contrasts showed that the AM group displayed significant linear (p < .001) and cubic (p < .01) trends, whereas the PM group displayed significant quadratic (p < .001) and cubic trends (p < .01). Independent t-tests on each trial revealed significant differences between the groups on trials 3–8, 13, and 14 (p < .05). Overall, both groups’ effort to stay awake increased during the flight (referencing the first trial to the last). Interestingly, there was a reversal in ESA ratings prior to landing (between 05:00 and 06:25) when the AM group expressed greater difficulty remaining awake than the PM group. However, the magnitude of the increase in the AM group was not as large as that seen with the PM group earlier on. Once again, these effects are likely primarily attributable to the impact of circadian factors (and possibly some motivational confounds) since the respective difficulties in both groups corresponded to the groups’ circadian nadirs (see figure 13).
17
0
1
2
3
4
Baseline Flight Recovery
Phase
Subj
ectiv
e ra
tings
(ver
y litt
le---
extre
me
effo
rt)
AM departurePM departure
0
1
2
3
4
0 1 2 3 4 5 6 7 8 9 10 11 12 13 14
Trials
Subj
ectiv
e ra
tings
(ver
y litt
le---
extre
me
effo
rt)
AM departurePM departure
10:00 14:00 17:00 20:00 23:00 02:00 05:00 AM times 22:00 02:00 05:00 08:00 11:00 14:00 17:00 PM times
Takeoff Landing
* Significant trials
**
* * *
*
*
Figure 12. Effort made to stay awake by the PM and AM groups across the phases of the study. Note the overall increase in effort from the baseline to the flight phase.
Figure 13. Subjective assessment of effort required to stay awake throughout the flight for both the AM and PM departure groups. Generally speaking, the effort required to stay awake increased as a function of circadian factors with the major effort required throughout the night in both groups.
Karolinska Sleepiness Scale (KSS) The KSS is a nine-point Likert-type scale of subjective sleepiness ranging from “1 = very alert” to “9
= very sleepy, fighting sleep.” As discussed earlier, the KSS was administered after the PVT during each test trial.
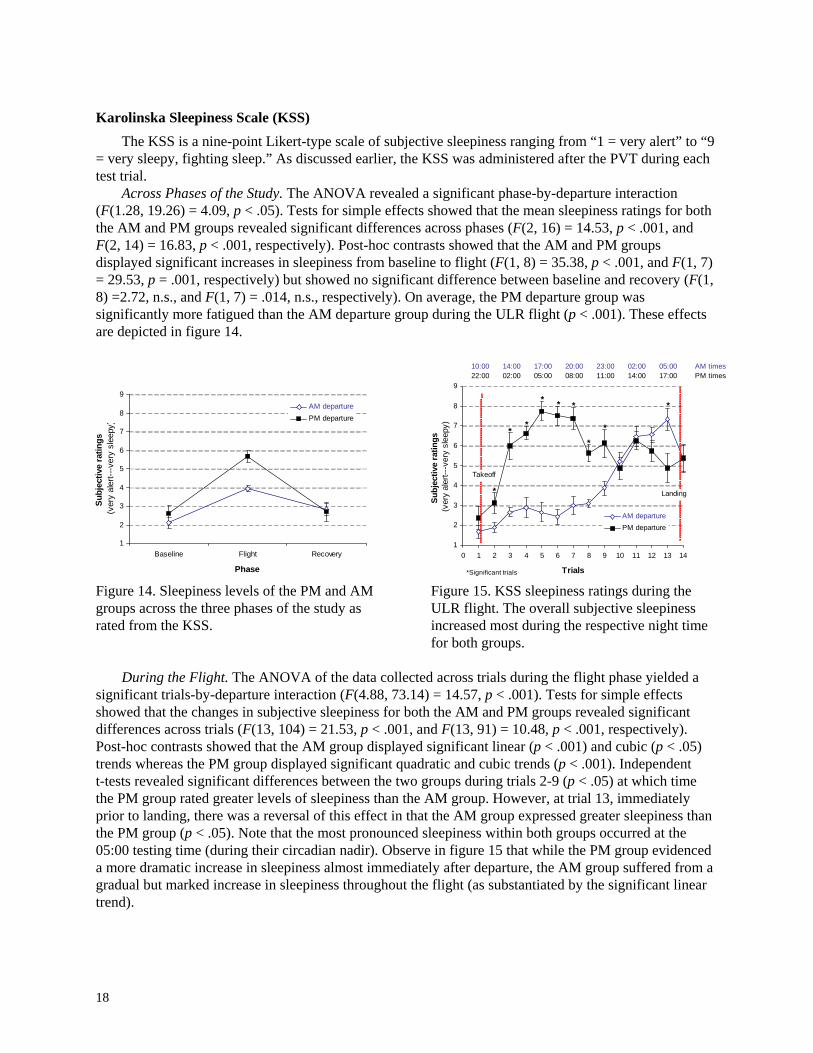
Across Phases of the Study. The ANOVA revealed a significant phase-by-departure interaction (F(1.28, 19.26) = 4.09, p < .05). Tests for simple effects showed that the mean sleepiness ratings for both the AM and PM groups revealed significant differences across phases (F(2, 16) = 14.53, p < .001, and F(2, 14) = 16.83, p < .001, respectively). Post-hoc contrasts showed that the AM and PM groups displayed significant increases in sleepiness from baseline to flight (F(1, 8) = 35.38, p < .001, and F(1, 7) = 29.53, p = .001, respectively) but showed no significant difference between baseline and recovery (F(1, 8) =2.72, n.s., and F(1, 7) = .014, n.s., respectively). On average, the PM departure group was significantly more fatigued than the AM departure group during the ULR flight (p < .001). These effects are depicted in figure 14.
18
1
2
3
4
5
6
7
8
9
Baseline Flight Recovery
Phase
Subj
ectiv
e ra
tings
(ver
y al
ert--
-ver
y sl
eepy
)
AM departurePM departure
1
2
3
4
5
6
7
8
9
0 1 2 3 4 5 6 7 8 9 10 11 12 13 14
Trials
Subj
ectiv
e ra
tings
(ver
y al
ert--
-ver
y sl
eepy
)
AM departurePM departure
10:00 14:00 17:00 20:00 23:00 02:00 05:00 AM times 22:00 02:00 05:00 08:00 11:00 14:00 17:00 PM times
*Significant trials
*
**
* * *
**
*
Landing
Takeoff
Figure 14. Sleepiness levels of the PM and AM groups across the three phases of the study as rated from the KSS.
Figure 15. KSS sleepiness ratings during the ULR flight. The overall subjective sleepiness increased most during the respective night time for both groups.
During the Flight. The ANOVA of the data collected across trials during the flight phase yielded a
significant trials-by-departure interaction (F(4.88, 73.14) = 14.57, p < .001). Tests for simple effects showed that the changes in subjective sleepiness for both the AM and PM groups revealed significant differences across trials (F(13, 104) = 21.53, p < .001, and F(13, 91) = 10.48, p < .001, respectively). Post-hoc contrasts showed that the AM group displayed significant linear (p < .001) and cubic (p < .05) trends whereas the PM group displayed significant quadratic and cubic trends (p < .001). Independent t-tests revealed significant differences between the two groups during trials 2-9 (p < .05) at which time the PM group rated greater levels of sleepiness than the AM group. However, at trial 13, immediately prior to landing, there was a reversal of this effect in that the AM group expressed greater sleepiness than the PM group (p < .05). Note that the most pronounced sleepiness within both groups occurred at the 05:00 testing time (during their circadian nadir). Observe in figure 15 that while the PM group evidenced a more dramatic increase in sleepiness almost immediately after departure, the AM group suffered from a gradual but marked increase in sleepiness throughout the flight (as substantiated by the significant linear trend).

Visual Analog Scale (VAS) – Subjective Evaluations The VAS provided information on eight subjective states: alert/being able to concentrate, anxious,
energetic, confident, irritable, jittery/nervous, sleepy, and talkative. The adjectives were placed over the center of a 100-pixel line with the words “not at all” appearing at the far left and “extremely” appearing at the far right.
Alert/able to concentrate Across Phases of the Study. The ANOVA across study phases revealed only a significant main effect
of phase (F(1.43, 21.46) = 6.16, p < .05) on ratings of being alert or able to concentrate. This was due to a significant difference from baseline to flight (F(1, 15) = 7.54, p < .05). There was no significant difference in ability to concentrate from baseline to recovery (F(1, 15) = 3.03, n.s.). This effect is shown in figure 16.
During the Flight. The ANOVA revealed a significant trials-by-departure interaction (F(4.05, 6.78) = 5.08, p = .001). Tests for simple effects showed that the concentration levels for both the AM and PM groups were significantly different across trials (F(13, 104) = 7.62, p < .001, and F(13, 91) = 5.88, p < .001, respectively). Post-hoc contrasts showed that the AM group displayed a significant linear trend (p < .001) whereas the PM group displayed significant quadratic and cubic trends (p < .01). Independent t-tests revealed a difference between the two groups only on trials 4–7 (p < .05). As was the case with the other data analyzed thus far, the interaction was due to the fact that the AM group was more alert than the PM group for the first period of the flight, whereas there were no group differences in the second part. These effects are depicted in figure 17. In addition, it should be noted that while the PM group once again showed the greatest fatigue in the first portion of testing, the AM group experienced a gradual but significant decrease in alertness as the flight progressed. In both groups, the major decline in alertness occurred at circadian “low points.”
19
0
10
20
30
40
50
60
70
80
90
100
0 1 2 3 4 5 6 7 8 9 10 11 12 13 14
Trials
Subj
ectiv
e ra
tings
(not
at a
ll---
extre
mel
y)
AM departurePM departure
*Significant trials
Takeoff
* * *
*
Landing
10:00 14:00 17:00 20:00 23:00 02:00 05:00 AM times22:00 02:00 05:00 08:00 11:00 14:00 17:00 PM times
Figure 16. Subjective ratings of being able to concentrate for both groups across the three phases of the study.
Figure 17. Subjective ratings of being able to concentrate. The PM group showed a dramatic decline in alertness between 03:00 and 08:00 followed by an increase at about 09:00. The AM group was more alert/able to concentrate at the beginning of the flight (14:00 to 18:00) with a decline toward the end of the flight.
0
10
20
30
40
50
60
70
80
90
100
Baseline Flight Recovery
Phase
Subj
ectiv
e ra
tings
(not
at a
ll---
extre
mel
y)
AM departurePM departure

Anxious Across Phases of the Study. The phase-by-departure ANOVA revealed no differences between the
two groups in anxiety ratings across the three phases, as shown in figure 18. During the Flight. The ANOVA performed on the individual testing trials within each flight,
however, revealed a main effect for trials (F(2.97, 44.47) = 3.40, p <.05). Subsequent analyses of this main effect indicated a significant linear trend (F(1, 15) = 4.93, p < .05) that resulted from the fact that both groups became more anxious after the end of the flight. Additionally, the AM group’s anxiety level appeared to linearly increase during the second half of the flight after 23:00. This effect is shown in figure 19.
20
0
10
20
30
40
50
60
70
80
90
0
10
20
30
40
50
60
70
80
90
100
0 1 2 3 4 5 6 7 8 9 10 11 12 13 14
Trials
Subj
ectiv
e ra
tings
(not
at a
ll---e
xtre
mel
y)
AM departurePM departure
Takeoff
Landing
10:00 14:00 17:00 20:00 23:00 02:00 05:00 AM times22:00 02:00 05:00 08:00 11:00 14:00 17:00 PM times
Figure 18. Subjective ratings of feeling anxious made by the PM and AM groups across the three phases of the study.
Figure 19. Subjective ratings of feeling anxious made by the two departure groups throughout the flight.
Energetic Across Phases of the Study. The ANOVA revealed a significant interaction between phase and
departure (F(2, 30) = 4.42, p < .05). Tests for simple effects showed that the energetic ratings were significantly different across phases for the PM group (F(2, 14) = 13.81, p < .001) but not for the AM group (F(2, 16) = 1.31, n.s.). Post-hoc contrasts for the PM group showed that energetic levels displayed significant differences from baseline to flight (F(1, 7) = 24.55, p < .01) but showed no change between baseline and recovery (F(1, 7) = .001, n.s.). Thus, the interaction was due to a significant difference in energy levels between the groups during the ULR flight (p < .001). These effects are shown in figure 20.
During the Flight. The ANOVA performed on the individual trials during the flight revealed a significant trials-by-departure interaction (F(4.52, 67.80) = 7.50, p < .001). Tests for simple effects showed that the change in energy levels for both the AM and PM groups were significant across trials (F(13, 104) = 14.39, p < .001, and F(13, 91) = 8.84, p < .001, respectively). Post-hoc contrasts showed that the AM group displayed a significant linear trend (p = .001) whereas the PM group displayed significant linear (p < .05), quadratic (p < .001), and cubic (p = .001) trends. Although the AM group indicated greater overall energy than the PM group, analysis of the interaction showed that this was largely due to significant differences during trials 2–9 and trial 11 (p < .05). In each case, the AM group was significantly more energetic than the PM group, although as can be seen in figure 21, the AM group gradually deteriorated throughout the flight.
100
Baseline Flight Recovery
Phase
Subj
ectiv
e ra
tings
(not
at a
ll---e
xtre
mel
y)
AM departurePM departure

21
0
10
20
30
40
50
60
70
80
90
100
Baseline Flight Recovery
Phase
Subj
ectiv
e ra
tings
(not
at a
ll---e
xtre
mel
y)
AM departurePM departure
0
10
20
30
40
50
60
70
80
90
100
0 1 2 3 4 5 6 7 8 9 10 11 12 13 14
Trials
Subj
ectiv
e ra
tings
(not
at a
ll---
extre
mel
y)
AM departurePM departure
10:00 14:00 17:00 20:00 23:00 02:00 05:00 AM times22:00 02:00 05:00 08:00 11:00 14:00 17:00 PM times
*Significant trials
Takeoff
** *
* **
* *
*
Landing
Figure 20. Ratings of subjective energy during the phases of the study, showing that the PM group was less energetic than the AM group during the flight.
Figure 21. Subjective ratings of energy obtained from pilots during the flight.
Feel confident Across Phases of the Study. The phase-by-departure ANOVA revealed a significant interaction (F(2,
30) = 4.15, p < .05). Tests for simple effects showed that the confidence ratings for both the AM and PM groups were significantly different across phases (F(2, 16) = 3.63, p = .05 , and F(2, 14) = 13.31, p = .001, respectively). Post-hoc contrasts for the AM group showed a trend for differences between baseline and flight (F(1, 8) = 5.08, p = .054) but not baseline and recovery (F(1, 8) = 0.17, n.s.). Contrasts for the PM group showed that confidence levels decreased from baseline to flight (F(1, 7) = 9.97, p < .05) and increased between baseline and recovery (F(1, 7) = 6.11, p < .05). Independent t-tests for each phase revealed a significant difference between the groups after recovery sleep only (p = .01). As shown in figure 22, the PM group was more confident than the AM group following recovery sleep.
0
10
20
30
40
50
60
70
80
90
100
0 1 2 3 4 5 6 7 8 9 10 11 12 13 14
Trials
Subj
ectiv
e ra
tings
(not
at a
ll---
extre
mel
y)
AM departurePM departure
10:00 14:00 17:00 20:00 23:00 02:00 05:00 AM times22:00 02:00 05:00 08:00 11:00 14:00 17:00 PM times
*Significant trial
Takeoff
*
Landing
Figure 22. Subjective ratings of feeling confident across the three phases of the study. The PM departure group was more confident after recovery sleep.
Figure 23. Subjective ratings of confidence obtained from pilots during the ULR flight. The PM group felt more confident than the AM group at trial 13.
0
10
20
30
40
50
60
70
80
90
100
Baseline Flight Recovery
Phase
Subj
ectiv
e ra
tings
(not
at a
ll---
extre
mel
y)
AM departurePM departure

During the Flight. The ANOVA performed on the confidence ratings made during the individual
trials throughout the flight revealed a significant trials-by-departure interaction (F(4.38, 65.64) = 4.29, p < .01). Tests for simple effects showed that the confidence levels for both the AM and PM groups were significantly different across trials (F(13, 104) = 5.36, p < .001, and F(13, 91) = 3.93, p < .001, respectively). Post-hoc contrasts indicated that the AM group displayed a significant linear trend (p < .01) whereas the PM group displayed a significant quadratic trend (p < .05). Independent t-tests that were conducted to explore the nature of the interaction revealed significant differences between the groups only on trial 13 during the flight (p < .01). At this point, the gradual decrease in confidence experienced by the AM group placed their ratings lower than those of the PM group, the members of which were likely benefiting from a combination of circadian-related improvements and the knowledge that their 20-hr flight was almost complete (although the AM group also was at the end of their flight, they were in the circadian trough at this point). These effects are depicted in figure 23.
Irritable Across Phases of the Study. The phase-by-departure ANOVA revealed a significant main effect of
phase (F(2, 30) = 6.37, p < .01) due to the significant changes in irritability from baseline to flight (F(1, 15) = 10.66, p < .01). The contrast between baseline and recovery was not significant (F(1, 15) = 0.05, n.s.), suggesting that pilots’ irritability ratings returned to baseline levels after recovery sleep. The main effects of departure and the phase-by-departure interaction were not significant (see figure 24).
During the Flight. The trials-by-departure ANOVA revealed only a significant main effect of trials (F(3.05, 45.71) = 5.59, p < .01), but no departure main effect or trials-by-departure interaction. Subsequent analysis of the differences across trials indicated the presence of a linear trend (F(1, 15) = 7.45, p < .05), which was primarily due to increased irritability at the very end of the flight (see figure 25). This may have been due to the fact that pilots were faced with an unexpected requirement to divert to another airport right before landing or the requirement to perform another test bout after completing the 20-hr ULR flight.
22
0 0
10
20
30
40
50
60
70
80
90
100
0 1 2 3 4 5 6 7 8 9 10 11 12 13 14
Trials
Subj
ectiv
e ra
tings
(not
at a
ll---
extre
mel
y)
AM departurePM departure
10:00 14:00 17:00 20:00 23:00 02:00 05:00 AM times 22:00 02:00 05:00 08:00 11:00 14:00 17:00 PM times
Takeoff
Landing
Figure 24. Subjective ratings of feeling irritable obtained from pilots across the three phases of the study.
Figure 25. Subjective ratings of irritability. There were no differences between the two groups in feeling irritable, but both groups became irritable at the last test bout immediately after landing.
10
20
30
40
50
60
70
80
90
100
Baseline Flight Recovery
Phase
Subj
ectiv
e ra
tings
(not
at a
ll---
extre
mel
y) AM departurePM departure

Jittery/nervous Across Phases of the Study. The phase-by-departure ANOVA revealed no significant differences
between the two groups across the three phases in terms of their self-ratings of jittery/nervousness. In addition, there was no interaction (see figure 26).
During the Flight. As was the case with the previous analysis, the trials-by-departure ANOVA revealed no significant main effects for departure group or trial, nor was there an interaction (see figure 27).
23
00
10
20
30
40
50
60
70
80
90
100
0 1 2 3 4 5 6 7 8 9 10 11 12 13 14
Trials
Subj
ectiv
e ra
tings
(not
at a
ll---
extre
mel
y)
AM departurePM departure
10:00 14:00 17:00 20:00 23:00 02:00 05:00 AM times 22:00 02:00 05:00 08:00 11:00 14:00 17:00 PM times
Takeoff
Landing
Figure 26. Subjective ratings of feeling nervous across the phases of the study.
Figure 27. Subjective ratings of feeling nervous obtained from pilots during the ULR flight. There were no differences between the two groups.
Sleepy Across Phases of the Study. The phase-by-departure ANOVA revealed a significant interaction (F(2,
30) = 7.88, p < .01). Tests for simple effects showed that the sleepiness ratings for both the AM and PM group changed significantly across phases (F(2, 16) = 12.72, p < .001, and F(1.11, 7.79) = 36.87, p < .001). Post-hoc contrasts for the AM group showed significant differences between baseline and flight (F(1, 8) = 21.22, p < .01) but not between baseline and recovery (F(1, 8) = 1.16, n.s.). Post-hoc contrasts for the PM group showed significant differences between baseline and flight (F(1, 7) = 18.88, p < .01) and between baseline and recovery (F(1, 7) = 7.58, p < .05). Thus, sleepiness ratings increased for both groups during the flight. After the 14-hr rest opportunity, the PM group’s sleepiness ratings decreased from baseline levels.
During the Flight. The trials-by-departure ANOVA performed on sleepiness ratings collected during each flight revealed a significant trials-by-departure interaction (F(4.88, 73.17) = 10.57, p < .001). Tests for simple effects showed that the change in sleepiness levels for both the AM and PM groups was significant across trials (F(13,104) = 18.85, p < .001, and F(13,91) = 10.49, p < .001, respectively). Post-hoc contrasts showed that the AM group displayed a significant linear trend (p < .001), whereas the PM group displayed significant linear (p < .05), quadratic (p < .001), and cubic (p < .01) trends.
As observed in other alertness measures, the PM group was sleepier during the early portion of the flight (trials 2–7 and trial 9; p < .05) whereas the sleepiness levels of the AM group progressively increased across the flight. Note the reversal in highest sleepiness levels at trial 13 between the groups, immediately prior to landing when the PM group was less sleepy than the AM group, as shown in figure 29. As was found with other measures, the PM group felt sleepier during the first half of the flight, but tended to improve somewhat as they emerged from their circadian nadir. In contrast, the AM group was more alert during the first half of the flight, but expressed increased sleepiness throughout the night with a
10
20
30
40
50
60
70
80
90
100
Baseline Flight Recovery
Phase
Subj
ectiv
e ra
tings
(not
at a
ll---
extre
mel
y)
AM departurePM departure

peak around 05:00 (at which time they were actually sleepier than the PM group). These data show the impact of flying at night when circadian-driven alertness is low.
24
0
10
20
30
40
50
60
70
80
90
0
10
20
30
40
50
60
70
80
90
100
0 1 2 3 4 5 6 7 8 9 10 11 12 13 14
Trials
Subj
ectiv
e ra
tings
(not
at a
ll---e
xtre
mel
y)
AM departurePM departure
10:00 14:00 17:00 20:00 23:00 02:00 05:00 AM times 22:00 02:00 05:00 08:00 11:00 14:00 17:00 PM times
*Significant trials
Takeoff *
**
* * *
*
Landing
Figure 28. Subjective ratings of sleepiness across the three phases of the study.
Figure 29. Subjective ratings of sleepiness obtained for both groups throughout the ULR flight. Note the initial increase in sleepiness within the PM group, whereas the AM group experienced a gradual decrement from departure to landing.
Talkative Across Phases of the Study. The phase-by-departure ANOVA revealed a significant main effect of
phase (F(2, 30) = 5.57, p < .01), which was due to a difference from baseline to flight (F(1, 15) = 8.79, p = .01). However, ratings of talkativeness returned to baseline levels after recovery sleep, as revealed by the contrast between baseline and recovery (F(1, 15) = 0.87, n.s.). There was no main effect of departure, nor was there an interaction between departure and phase. Figure 30 presents a graphic depiction of these data.
During the Flight. The ANOVA revealed no main effects; however, there was a significant trials-by-departure interaction (F(5.20, 77.94) = 2.46, p < .05). Tests for simple effects showed that the talkative levels for the PM were significantly different across trials (F(13, 91) = 3.2, p = .001) but not for the AM group (F(13, 104) = 1.13, n.s.). Post-hoc contrasts suggest that the PM group displayed significantly higher order trends above cubic. Independent t-tests at each trial indicated that the PM group felt more talkative than the AM group toward the end of the flight, at trials 12 and 13 (p < .05), but that there were no group differences at other times (see figure 31).
100
Baseline Flight Recovery
Phase
Subj
ectiv
e ra
tings
(not
at a
ll---
extre
mel
y)
AM departurePM departure
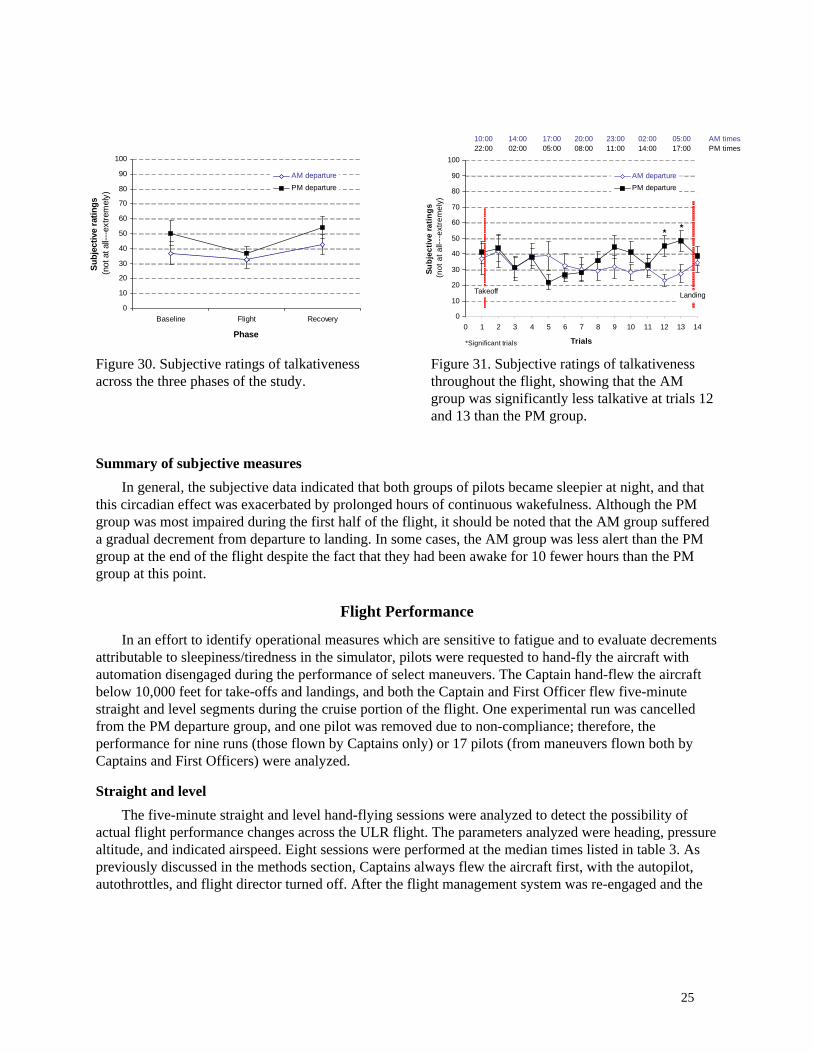
25
0
10
20
30
40
50
60
70
80
90
100
0 1 2 3 4 5 6 7 8 9 10 11 12 13 14
Trials
Subj
ectiv
e ra
tings
(not
at a
ll---
extre
mel
y)
AM departurePM departure
*Significant trials
Takeoff
**
Landing
10:00 14:00 17:00 20:00 23:00 02:00 05:00 AM times 22:00 02:00 05:00 08:00 11:00 14:00 17:00 PM times
Figure 30. Subjective ratings of talkativeness across the three phases of the study.
Figure 31. Subjective ratings of talkativeness throughout the flight, showing that the AM group was significantly less talkative at trials 12 and 13 than the PM group.
Summary of subjective measures In general, the subjective data indicated that both groups of pilots became sleepier at night, and that
this circadian effect was exacerbated by prolonged hours of continuous wakefulness. Although the PM group was most impaired during the first half of the flight, it should be noted that the AM group suffered a gradual decrement from departure to landing. In some cases, the AM group was less alert than the PM group at the end of the flight despite the fact that they had been awake for 10 fewer hours than the PM group at this point.
Flight Performance
In an effort to identify operational measures which are sensitive to fatigue and to evaluate decrements attributable to sleepiness/tiredness in the simulator, pilots were requested to hand-fly the aircraft with automation disengaged during the performance of select maneuvers. The Captain hand-flew the aircraft below 10,000 feet for take-offs and landings, and both the Captain and First Officer flew five-minute straight and level segments during the cruise portion of the flight. One experimental run was cancelled from the PM departure group, and one pilot was removed due to non-compliance; therefore, the performance for nine runs (those flown by Captains only) or 17 pilots (from maneuvers flown both by Captains and First Officers) were analyzed.
Straight and level The five-minute straight and level hand-flying sessions were analyzed to detect the possibility of
actual flight performance changes across the ULR flight. The parameters analyzed were heading, pressure altitude, and indicated airspeed. Eight sessions were performed at the median times listed in table 3. As previously discussed in the methods section, Captains always flew the aircraft first, with the autopilot, autothrottles, and flight director turned off. After the flight management system was re-engaged and the
0
10
20
30
40
50
60
70
80
90
100
Baseline Flight Recovery
Phase
Subj
ectiv
e ra
tings
(not
at a
ll---e
xtre
mel
y)
AM departurePM departure

26
simulator flight path was in a steady state, the First Officer flew the hand-flying segments (again with the automation turned off). 3
TABLE 3. MEDIAN TIME OF DAY THE EIGHT HAND-FLYING SESSIONS
WERE SCHEDULED TO OCCUR FOR THE DEPARTURE GROUPS. Hand-flying times Trial AM Departure PM Departure 1 12:55 00:55 2 15:55 03:55 3 18:55 06:55 4 20:25 08:25 5 21:55 09:55 6 23:25 11:25 7 00:55 12:55 8 02:25 14:25
The trial start and end times were determined based on the times at which the autopilot was turned
on and off. Once the actual start times were determined, the times were increased by 50 seconds to allow the pilot to stabilize the simulator on the nearest five or 10 degree heading. The end times were decreased by 10 seconds to account for the time it took for the pilot to re-engage the flight director, autothrottles, and autopilot. The root mean square (RMS) variation was analyzed with the assumed mean (or target value) being the altitude (rounded to the nearest 10 feet), airspeed, and heading being flown at the start of the trial.
TABLE 4. RESULTS FOR THE MIXED-EFFECTS ANOVA FOR THE STRAIGHT-AND-LEVEL
FLIGHT Mixed-effects ANOVA Trial Depart. Trial*Depart.
Altitude F(3.30, 49.56) = 0.76 F(1, 15) = 0.05 F(3.30, 49.56) = 0.37
Heading F(2.52, 37.85) = 1.98 F(1, 15) = 2.55 F(2.52, 37.85) = 1.18
Airspeed F(3.66, 54.82) = 1.080 F(1, 15) = 0.86 F(3.66, 54.82) = 0.612
Note: all results non-significant. Mixed-effects ANOVA for departure (AM vs. PM) and segment (1–8) were performed on the RMS
data to compare performance changes across trials and across the different departure groups (AM vs. PM). There were no significant main effects of trial or departure and no interaction effects. Table 4 shows the results for the mixed-effects ANOVA for all hand-flying parameters, and as can be seen, there were no consistent patterns. Figure 32 shows all performance variables plotted. Possible reasons for the failure to detect actual flight performance changes during trials in which PVT and subjective measures of attention and alertness demonstrated decrements are discussed in the next section.
3 The instructions prior to each hand-flying segment were as follows: “It is now time for a hand-flying segment. Please maintain a sterile cockpit. [Captain’s or First Officer’s name], please press your event marker [on the EEG recorder] then disengage the auto-pilot, flight director and auto-throttles, note the magnetic heading, move the heading bug out of view, turn to the nearest 5 or 10 degree compass rose tic and fly that magnetic heading until further notice.”

0
0.4
0.8
1.2
1.6
2
2.4
2.8
1 2 3 4 5 6 7 8Trial
Airs
peed
- R
MS
varia
tion
AM
PM
0
0.4
0.8
1.2
1.6
2
2.4
2.8
1 2 3 4 5 6 7 8Trial
Hea
ding
- R
MS
varia
tion
Figure 32. Altitude, heading, and airspeed RMS variation for the AM and PM departure groups during the eight straight and level hand-flying sessions performed during the cruise portion of the ULR flight.
720º turn A 720º turn was performed by the Captain during the landing phase of the flight. Upon initiating the
turn, the aircraft was at 7,000 feet and 220 knots, and the flight director was engaged while the autopilot and autothrottles were disengaged. The Captain initiated the turns upon request from ATC. 4 One flight for the PM departure group completed only one turn; therefore it was removed due to non-compliance, leaving n = 3 flights for the PM group and n = 5 flights for the AM group. The Captains also performed a 720º turn during the training flight, which was used as baseline data for comparison to the ULR flight performance.
RMS variation of altitude, airspeed, and roll rate was used to estimate the pilots’ ability to control the aircraft during the turns. To calculate the RMS, the assumed mean altitude was 7,000 ft, the assumed roll rate was zero (since the roll rate should not have changed once the roll angle was established), and the assumed mean airspeed was estimated individually for each participant by taking the average speed for the first 10 seconds of the analysis segment. Performance during the turns was analyzed from the time at which all pilots became stable on a bank angle to the time at which 240 seconds had elapsed. Data were analyzed for the two different times: 1) baseline and 2) end of the ULR flight.
A mixed-effects ANOVA with departure time (AM vs. PM) as the between-subjects factor and time (baseline flight vs. ULR flight) as the within-subjects factor found no significant main effects nor interactions for altitude, airspeed, and roll rate (table 5). The roll rate RMS showed a trend towards significance (p = .066), suggesting overall pilot performance may have improved from baseline (M =
27
4 The ATC command during the ULR flight was “NASA 125 HEAVY make two right orbits, runway change in progress, expect ILS DME approach to runway zero two right. Expect further clearance after completion of the turns.” The ATC commands during the training session were “NASA 123 HEAVY make a left 360. We just had three aircraft make missed approaches and the RVR is now less than 600. Verify your alternate is Oakland.” Followed by “NASA 123 HEAVY, continue making at least one more 360, I’ll be working on your clearance to Oakland.”
10
15
20
25
30
35
40
45
1 2 3 4 5 6 7 8Trial
Alti
tude
- R
MS
varia
tion

0.84, SD = 0.28) to the ULR flight (M = 0.57, SD = 0.17). Given that only minimal training was provided to the pilots at the outset of the study, practice effects could have been a confounding factor in this analysis. Figure 33 shows all performance variables plotted.
TABLE 5. RESULTS FOR THE MIXED-EFFECTS ANOVA FOR THE 720º TURNS
Mixed-Effects ANOVA Time Depart. Time*Depart. Altitude F(1, 6) = 0.13 F(1, 6) = 1.20 F(1, 6) = 0.52 Airspeed F(1, 6) = 1.47 F(1, 6) = 0.15 F(1, 6) = 0.1 Roll rate F(1, 6) = 5.04, p = .066 F(1, 6) = 0.53 F(1, 6) = 2.18
Note: all results non-significant.
28
Figure 33. Altitude, airspeed, and roll-rate RMS variation during the two 360˚ turns performed at baseline and the ULR flight.
ILS approach Hand-flying performance while landing the aircraft was also examined. As a reminder, only the
Captain hand-flew the aircraft below 10,000 feet, and the flight director was engaged while the autopilot and autothrottles were disengaged. Nine experimental runs (five AM departures and four PM departures) were analyzed for baseline performance as well as the ULR flight performance. During the baseline flight, the pilots were cleared to land at the ONT 26R approach. Two baseline runs had missing or bad data; therefore, the training flights at the OAK 11 approach were used as baseline instead to avoid reducing the data set further. For the ULR flight, pilots were cleared for the ILS DME runway 02R approach.
RMS variation of the glideslope (G/S) deviation (deg) and localizer deviation (deg) were analyzed from G/S capture until the middle marker (MM) altitude of the runway was reached. The assumed means for the RMS variation calculations were zero for the G/S and localizer deviations. A mixed-effects
20
30
40
50
60
70
80
Baseline ULR flight
Alti
tude
- R
MS
varia
tion
0
0.2
0.4
0.6
0.8
1
1.2
Baseline ULR flight
Rol
l rat
e - R
MS
varia
tion
AMPM
0
2
4
6
8
10
12
14
16
Baseline ULR flight
Airs
peed
- R
MS
varia
tion

ANOVA with departure group as the between-subjects factor and phase (baseline and ULR flight) as the within-subjects factor found a significant main effect of phase (F(1, 7) = 6.92, p < .05) on G/S deviation; however, this effect was due to a decrease in G/S deviation from baseline (M = 0.074, SD = 0.029) to the ULR flight (M = 0.051, SD = .021). There was no main effect of departure (F(1, 7) = 0.14, n.s.) and no interaction effect (F(1, 7) = 3.04 n.s.) for G/S deviations. Mixed-effects ANOVA on RMS variation of localizer deviation found no significant main effect or interaction (see table 6). Figure 34 shows the G/S and localizer deviations during the landing at baseline and at the ULR flight.
TABLE 6. RESULTS FOR THE MIXED-EFFECTS ANOVA FOR THE LANDING
Mixed-Effects ANOVA Time Depart. Time*Depart. G/S deviation F(1, 7) = 6.92* F(1, 7) = 0.14 F(1, 7) = 3.04 Localizer deviation F(1, 7) = 0.31 F(1, 7) = 3.48 F(1, 7) = 1.57
*p < .05
29
Figure 34. RMS variation of glideslope and localizer deviations (deg) during G/S capture to the runway for the baseline and the ULR flights.
0 0
0.02
0.04
0.06
0.08
0.1
0.12
Baseline ULR flight
Loca
lizer
dev
iatio
n
AM
PM
Summary of flight performance In general, the flight performance data did not show the fatigue-related decrements as observed in the
subjective measures and PVT. Reasons for the insensitivity of these performance measures to fatigue are reviewed in the Discussion section.
DISCUSSION The present investigation assessed the impact of ultra-long-duration simulator flights, departing at
two different times of day, on the alertness and performance of 17 commercial aviators. Each of the flights was 20 hrs long. For the AM departure group, flights began at approximately 11:00 on the first day, persisted throughout the night, and ended at approximately 06:20 the following morning. For the PM departure group, flights started at approximately 23:00 on the night of the first day, persisted throughout the night and most of the following day, and ended at approximately 18:20 in the evening. Prior to the flight-testing periods, all volunteers obtained baseline sleep in a controlled environment, and they were awakened according to a prescribed schedule to prepare for their flight on the next day. Ingestion of caffeine was prohibited throughout the study. Immediately prior to and throughout each flight, alertness and performance were assessed at frequent and standardized intervals. The primary assessment metrics included a computerized test of sustained attention; several subjective questionnaires inquiring about various aspects of pilot status (i.e., alertness, sleepiness, effort, energy, etc.); and “hand-flying” tasks from which actual simulator flight-performance parameters were acquired. In general, the observed effects were quite consistent across the first two categories of tasks (vigilance and self-reports), but not for the operational “hand-flying” segments.
0.02
04
06
08
0.1
12
Baseline ULR flight
G/S
dev
iatio
n
0.
0.
0.
0.

30
Psychomotor Vigilance
With regard to the vigilance assessments, the nighttime departure group experienced more overall attentional lapses and responded more slowly to incoming stimuli than the daytime departure group. The nighttime group, which departed after having already been awake for at least 13.5 hrs, was especially impaired during the first half of the flight, from approximately 02:00 until 11:00—the times at which homeostatic and circadian factors combined to produce particularly low levels of alertness (Åkerstedt, 1995a, 1995b). The daytime group, which departed after having been awake only for about 3.5 hrs, evidenced much less impairment throughout the flight, although it was clear that towards the latter portions, their performance was suffering as well. Due to the experimental schedule (which was designed to mimic real-world operations), it was not surprising that the nighttime departure group experienced more difficulties due to the fact that even at the outset of the flight, their homeostatic sleep drive was greater than what was experienced by the daytime departure group. Note that the pilots who departed at 23:00 remained awake for 34 continuous hours, whereas those who departed at 11:00 endured only 24 continuous hours without sleep. Thus, when this high homeostatic drive for sleep in the PM group was combined with the influence of the circadian trough (which for this group also occurred early in the flight), the nighttime departure group was more physiologically prone to on-the-job sleepiness at the outset.
Such early alertness difficulties in the night group may have been further complicated by motivational factors. The pilots departing at 23:00 were, no doubt, mindful of the fact that their flight had only just begun when they first began experiencing significant sleepiness, and that many hours remained before they would be able to land (and obtain recovery sleep). Conversely, the pilots departing at 11:00 may have fared better because they were relatively uncompromised by continuous wakefulness until much later in the 20-hr flight, and by this time, they at least were able to look forward to the fact that their testing period was almost at an end. Although it is clear that motivational factors alone cannot indefinitely overcome the effects of increased physiological sleepiness, it is a fact that “having the end in sight” can help stave off the impact of fatigue and, at least temporarily, boost performance (Catalano, 1973).
Self-Rated Well-being
The self-ratings of sleepiness/alertness clearly supported the results obtained from the vigilance task in that the nighttime departure group rated themselves as sleepier and less energetic overall in comparison to the daytime departure group. In addition, there were interactive departure-group-by-trial differences in self-ratings of the effort to stay awake and self-reports of sleepiness, alertness, energy, confidence, and talkativeness. The first four of these self ratings again highlighted the fact that the nighttime group was suffering from a more problematic convergence of homeostatic and circadian factors than the daytime group, particularly from as early as 01:00 until as late as noon. This is consistent with what is generally known about the characteristics of nighttime fatigue effects in long-haul pilots (Caldwell, 2005).
The group-by-trial differences in the last two self ratings, confidence and talkativeness, appeared to be a function more of circadian rather than homeostatic influences (although there likely were motivational contributions as well). In terms of these ratings, towards the end of the flight the nighttime departure group, who had previously been rating themselves as less confident and talkative than the daytime departure group, began indicating that they were experiencing more confidence and talkativeness than the daytime group around the time of landing. This potentially was because they were at a “better” part of the circadian cycle at this point since the end of the flight coincided with early evening hours for the nighttime-departure group, whereas the end of the flight occurred in the early morning hours for the daytime-departure group. Also, there may have been a motivational contribution (the “end-spurt” phenomenon) which was more evident in the members of the PM group since they were experiencing less circadian-related, physiologically-based fatigue at the end of the flight, whereas members of the AM group were in their circadian trough at this point, and this could have been “canceling out” the end-spurt motivational lift. It should be noted that there was a non-significant tendency toward a similar effect in the ratings of sleepiness and fatigue (mentioned earlier), and while this effect was not pronounced, it does

31
suggest that although the daytime departure group may have been more alert than the nighttime departure group throughout the flight, they tended to be more impaired during preparations for landing. Clearly, across the majority of the measures collected, there was evidence that the daytime departure group suffered increasingly from the effects of fatigue as the flight progressed whereas the nighttime departure group tended to partially recover from their initial decrements. Although it is true that in the real world, some pilots who are scheduled for a nighttime departure would fare better than the subjects in this investigation as a function of attempting to sleep during the prior day, it is equally true that many long-haul pilots typically use the pre-duty period as a time to travel from their homes to the departure airport. Such extended trips can provide an opportunity for a short nap (which would be helpful from a counter-fatigue standpoint), but it is undoubtedly often the case that the lengthy trip to work simply contributes to the upcoming period of extended wakefulness while on duty. Thus, there are obviously different types of safety ramifications associated with the different departure schedules in ULR operations. On the one hand, the nighttime departure entailed more fatigue overall (in this study, and potentially in actual flight operations), but the most serious decrements in the PM group were during the first half of the cruise portion, which is perhaps a less-safety-critical phase of flight. On the other hand, while the daytime departure group was better off throughout the cruise section of the flight, their most serious decrements often occurred around the time of landing—a more safety-critical time.
Operational Performance
The hand-flying straight-and-level segments that were inserted at eight different points throughout the 20-hr flights did not produce results consistent with what was observed on the other measures collected in this investigation. One interpretation of the lack of statistical significance on the “operational measures” could be that the pilots simply were not impaired by the lengthy flight simulation periods; however, this would be inconsistent with the observed decrements in vigilance and the increases in self-reported fatigue and sleepiness. An alternative explanation would be that the flight-performance assessment strategy simply was not sensitive to the impact of pilot fatigue. It is this latter interpretation that at this point seems most likely correct for the following reason. Although previous investigations have shown substantial fatigue-related decrements on short straight-and-level flight segments flown by sleep-deprived pilots (Caldwell, Caldwell, Brown, and Smith, 2004; Caldwell and Roberts, 2000), it should be noted that these straight-and-level segments were typically a part of a lengthy series of other hand-flown maneuvers such as climbs, descents, and turns, which when combined, required the pilots to remain focused and engaged for a rather extended period of time (i.e., 50–60 continuous minutes). This is quite different from the procedures used in the current investigation, in which the straight-and-level segments essentially punctuated an otherwise boring operational task in which the aircraft was on autopilot and the cockpit crew was simply monitoring the progression of the flight.
Since it is well known that sustained testing (such as that used in previous investigations) is more sensitive to the effects of sleep loss than short, intermittent testing bouts (which were more characteristic of the hand-flying segments used in this study), it is likely that task duration in and of itself may have been responsible for the lack of test sensitivity (Wilkinson, 1964). Furthermore, since the short hand-flying maneuver segments were inserted into an extended flight that was otherwise being managed by automated flight-control systems, it is possible that the novelty of these segments may have actually produced an alerting effect since they temporarily relieved the boredom associated with passive systems monitoring. In the future, our investigations of ULR flights will include modified hand-flying segments that are longer and more demanding in terms of both workload and sustained attention. This undoubtedly will enhance the sensitivity of the operational performance metrics.
In addition to the performance of the straight-and-levels (flown by all pilots) during each flight, a subset of the pilots (Captains only) completed a 720º turn and then an ILS approach prior to landing. Baseline vs. end-of-flight performance on these two maneuvers was assessed. As was the case with the straight-and-level segments, neither of these latter maneuvers was adversely affected by fatigue, and in fact, there was evidence of some improvements from baseline to end-of-flight on both. This may have

32
been due to insufficient training to attain asymptotic levels of performance at the outset of the study. To eliminate this potential confound in future investigations, pilots will be more thoroughly trained prior to the experimental intervention.
SUMMARY AND CONCLUSIONS Simulator-based studies such as this one are important for precisely addressing a variety of fatigue-related issues that are difficult to explore in actual operational flights where performance and alertness testing must be scheduled around the pilots’ primary duties of flying the aircraft. The present study was intended to form well-controlled “baseline” knowledge about the effects of fatigue in ULR flight operations against which the efficacy of proposed fatigue countermeasures could be judged. These data will complement soon-to-be-published data from new ULR in-flight studies. Together, information from both contexts will vastly improve our knowledge of operational fatigue—especially the fatigue associated with duty periods longer than the 14–16 hour ranges already prevalent in standard long-haul flight operations.
The results of this study indicate that the fatigue from prolonged wakefulness interacts significantly with the specific flight schedules being flown due to a combination of circadian and homeostatic influences. Specifically, pilots departing at night after having been awake since the previous morning are at a greater initial disadvantage than pilots who depart earlier in the day; however, pilots departing in the morning shortly after having awakened show progressive deteriorations that may place them at greater risk towards the end of the flight, immediately prior to landing the aircraft. The exact extent to which these effects can be mitigated by fatigue countermeasures such as on-board bunk rest, cockpit napping, pre-planned rest breaks, and other interventions remains to be seen. However, it is presently clear that such strategies need to be applied in conjunction with scheduling practices that take into account what is currently known about the human sleep/wake cycle and the physiological underpinnings of alertness regulation.
Recommendations for Future Research
This research has determined that 1) the fatigue associated with long-duration flights will impact mood and cognition and 2) departure time, circadian factors, and the extent of prior wakefulness will contribute to duty-time-related decrements. Given these results, future research should investigate optimal strategies for preventing cognitive degradations that could adversely impact flight safety. The effects of various counter-fatigue techniques can then be compared to a known baseline in which fatigue was allowed to occur without interventions. In future research, the following alternatives deserve examination: • The effects of augmented flight crews in an effort to provide more frequent breaks, better rotation of
in-flight duties, and frequent and/or longer-duration bunk-rest or nap periods • The optimal placement and duration of cockpit naps, out-of-cockpit bunk sleep, and in-flight breaks
based on flight schedules and human physiological factors • The potential utility of pharmacological fatigue countermeasures to augment the restorative value of
pre-duty sleep or longer-duration in-flight bunk sleep with the aim of improving post-sleep performance
• The impact of cognitive/alertness status monitoring in which physiological indicators of drowsiness trigger some type of alertness-enhancing pilot warnings

33
REFERENCES
Åkerstedt, T.: Work hours, sleepiness and the underlying mechanisms. Journal of Sleep Research, Volume 4 (Suppl. 2). 1995a, pp. 15–22. Åkerstedt, T.: Work hours and sleepiness. Journal of Clinical Neurophysiology, vol. 25, 1995b, pp. 367–375. Åkerstedt, T.: Consensus statement: Fatigue and accidents in transport operations. Journal of Sleep Research, vol. 9, 2000, p. 395. Åkerstedt, T.; and Folkard, S.: The three-process model of alertness and its extension to performance, sleep latency, and sleep length. Chronobiology International, vol. 14, 1997, pp. 115–123. American Psychological Association: Ethical Principles of Psychologists and Code of Conduct. Washington, D.C., 2002. Ancoli-Israel, S. Actigraphy. In Mier Kryger, Thomas Roth, and William Dement, Principles and Practice of Sleep Medicine, W.B. Saunders Company: Philadelphia, 2000, pp. 1295–1301. Battelle: An overview of the scientific literature concerning fatigue, sleep, and the circadian cycle. A report prepared for the Office of the Chief Scientific and Technical Advisor for Human Factors, Federal Aviation Administration, 1998. Available at http://www.alliedpilots.org/pub/presskit/safety/battellereport. html Belyavin, A.; and Wright, N. A.: Changes in electrical activity of the brain with vigilance. Electroencephalography and Clinical Neurophysiology, vol. 66, 1987, pp. 137–144. Boeing: Boeing longer range 777s: Flying farther and increasing the value of the 777 family. Available 10/27/2005 at http://www.boeing.com/commercial/777family/longer_range/index.html Cabon, P. H.; Coblentz, A.; Mollard, R.; and Fouillot, J. P.: Human vigilance in railway and long-haul flight operations. Ergonomics, vol. 36, no. 9, 1993, pp. 1019–1033. Caldwell, J. A.: Fatigue in aviation. Journal of Travel Medicine and Infectious Disease, vol. 3, no. 2, 2005, pp. 85–96. Caldwell, J. A.; Caldwell, J. L.; Brown, D. L.; and Smith, J. K.: The effects of 37 hours without sleep on the performance of F-117 pilots. Military Psychology, vol. 16, no. 3, 2004, pp. 163–181. Caldwell, J. A.; Caldwell, J. L.; Smythe, N. K.; and Hall, K. K.: A double-blind, placebo-controlled investigation of the efficacy of modafinil for sustaining the alertness and performance of aviators: A helicopter simulator study. Psychopharmacology, vol. 150, 2000, pp. 272–282. Caldwell, J. A.; and Gilreath, S. R.: A survey of aircrew fatigue in a sample of Army aviation personnel. Aviation, Space, and Environmental Medicine, vol. 73, 2002, pp. 472–480. Caldwell, J. A.; and Roberts, K. A.: Differential sensitivity of simulator versus in-flight testing of a stimulant medication. Military Psychology, vol. 12, no. 4, 2000, pp. 277–291.

34
Caldwell, J. A.; Smythe, N. K.; LeDuc, P. A.; and Caldwell, J. L.: Efficacy of Dexedrine for maintaining aviator performance during 64 hours of sustained wakefulness: A simulator study. Aviation, Space, and Environmental Medicine, vol. 71, no. 1, 2000, p. 718. Catalano, J. F.: Effect of perceived proximity to end of task upon end-spurt. Perceptual and Motor Skills, vol. 36, no. 2, 1973, pp. 363–372. Cummings, L.; Dane, A.; Rhodes, J.; Lynch, P.; and Hughes, A. M.: Diurnal variation in the quantitative EEG in healthy adult volunteers. British Journal of Clinical Pharmacology, vol. 50, no.1, 2000, pp. 21–26. Dawson, D.; and Reid, K.: Fatigue, alcohol and performance impairment. Nature, vol. 388, 1997, p. 235. Dinges, D. F.: The nature of subtle fatigue effects in long-haul crews. Proceedings of the Flight Safety Foundation 43rd International Air Safety Seminar; Rome, Italy. Flight Safety Foundation: Arlington, VA, 1990. Dinges, D. F.; Orne, M. T.; Whitehouse, W. G.; and Orne, E. C.: Temporal placement of a nap for alertness: Contributions of circadian phase and prior wakefulness. Sleep, vol. 10, 1987, pp. 313–329. Dinges, D. F.; and Kribbs, N. B.: Performing while sleepy: Effects of experimentally induced sleepiness. In S. Folkard and T. H. Monk, Sleep, sleepiness and performance. John Wiley & Sons: Chichester, London, 1991, pp. 97–128. Dinges, D. F.; and Powell J. W.: Microcomputer analysis of performance on a portable, simple visual RT task during sustained operations. Behavioral Research Methods Instruments and Computers, vol. 17, no. 6, 1985, pp. 652–655. Dinges, D. F.; Kribbs, N. B.; Steinberg, K. N.; and Powell, J. W.: Do We Lose the Willingness to Perform During Sleep Deprivation? Sleep Research, vol. 21, 1992, p. 318. Gander, P. H.; Gregory, K. B.; Graeber, R. C.; Connell, L. J.; Miller, D. L.; and Rosekind, M. R.: Flight crew fatigue II: Short-haul fixed-wing air transport operations. Aviation, Space, and Environmental Medicine, vol. 69, no. 9, section II, 1998, pp. B8–B15. Gander, P. H.; Gregory, K. B.; Miller, D. L.; Graeber, R. C.; Connell, L. J.; and Rosekind, M. R.: Flight crew fatigue V: Long-haul air transport operations. Aviation, Space, and Environmental Medicine, vol. 69, no. 9, section II, 1998, pp. B37–B48. Goode, J. H.: Are pilots at risk of accidents due to fatigue? Journal of Safety Research, vol. 34., 2003, pp. 309–313. Hamelin, P.: Lorry driver’s time habits in work and their involvement in traffic accidents. Ergonomics, vol. 30, no. 9, 1987, pp. 1323–1333. Horne, J. A.; and Ostberg, O.: A self-assessment questionnaire to determine Morningness-Eveningness in human circadian rhythms. International Journal of Chronobiology, vol. 4, no. 2, 1976, pp. 97–110. Kirk, R. E.: Experimental design: Procedures for the behavioral sciences. Brooks/Cole Publishing Company: Belmont, CA, 1968.
35
Kirsch, A. D.: Report on the statistical methods employed by the U.S. FAA in its cost benefit analysis of the proposed “Flight Crewmember Duty Period Limitations, Flight Time Limitations and Rest Requirements.” Comments of the Air Transport Association of America to FAA notice 95-18, FAA Docket No. 28081, Appendix D, 1996, pp. 1–36. Maislin, G.; Pack, A. I.; Kribbs, N. B.; Smith, P. L.; Schwartz, A. R.; Kline, L. R.; et al.: A survey for prediction of apnea. Sleep, vol. 18, no. 3, 1995, pp. 158–165. Mitler, M. M.; Carskadon, M. A.; Czeisler, C. A.; Dement, W. C.; Dinges, D. F.; and Graeber, R. C.: Catastrophes, sleep, and public policy: Consensus report. Sleep, vol. 11, no. 1, 1988, pp. 100–109. Monk, T. H.; and Folkard, S.: Shiftwork and performance. In Hours of Work: Temporal Factors in Work Scheduling. John Wiley & Sons: New York, 1985, pp. 239–252. Moore-Ede, M.: Aviation safety and pilot error, in Twenty-four hour society. Addison-Wesley Publishing Co: Reading, MA, 1993, pp. 81–95. Morisseau, D. S.: and Persensky, J. J.: A human factors focus on work hours, sleepiness and accident risk. In T. Akerstedt and G. Kecklund, Work hours, sleepiness and accidents. IPM and Karolinska Institute: Stockholm, 1994, pp. 94–97. National Transportation Safety Board: Marine Accident Report-Grounding of the US. Tankship Exxon Valdez on Bligh Reef, Prince William Sound, Near Valdez, Alaska, 24 Mar 1989 (NTSB/Mar-90/04). Washington, D.C., 1990. National Transportation Safety Board: A review of flightcrew-involved, major accidents of U.S. air carriers, 1978 through 1990 (NTSB Safety Study No. SS-94-01). Washington D.C., 1994. National Transportation Safety Board: Aircraft accident report: Controlled flight into terrain, Korean Air flight 801, Boeing 747-300, HL7468, Nimitz Hill, Guan, August 6, 1997 (NTSB/AAR-99-02). Washington D.C., 1999. Neri, D. F.: Scientific and operational issues associated with ultra long range flight. Aviation, Space, and Environmental Medicine, vol. 76, no. 3, 2005, pp. 247–248. Ogilvie, R. D.; Simons, I. A.; Kuderian, R. H.; MacDonald, T.; and Rustenburg, J.: Behavioral, event-related potential and EEG/FFT changes at sleep onset. Psychophysiology, vol. 28, 1991, pp. 54–64. Ogilvie, R. D.; Wilkinson, R. T.; and Allison, S.: The detection of sleep onset: Behavioral, physiological and subjective convergence. Sleep, vol. 12, 1989, pp. 458–474. Penetar, D.; McCann, U.; Thorne, D.; Kamimori, G.; Galinski, C.; Sing, H.; et al.: Caffeine reversal of sleep deprivation effects on alertness and mood. Pharmacology, vol. 112, 1993, pp. 359–365. Perry, I. C.: Helicopter aircrew fatigue (AGARD Advisory Report No. 69). Advisory Group for Aerospace Research and Development: Neuilly sur Seine, France, 1974. Ramsey, C. S.; and McGlohn, S. E.: Zolpidem as a fatigue countermeasure. Aviation, Space, and Environmental Medicine, vol. 68, no. 10, 1997, pp. 926–931.

36
Rosekind, M. R.; Co, E. L.; Gregory, K. B.; and Miller, D. L.: Crew Factors in Flight Operations XIII: A Survey of Fatigue Factors in Corporate/Executive Aviation Operations. NASA/TM 2000-209610, 2000. Rosa, R. R.: Extended workshifts and excessive fatigue. Journal of Sleep Research, vol. 4, suppl. no. 2, 1995, pp. 51–56. Rosa, R. R.; and Bonnett, M. H.: Performance and alertness on 8-hour and 12-hour rotating shifts at a natural gas utility. Ergonomics, vol. 36, 1993, pp. 1177–1193. Samel, A.; Wegmann, H.-M.; and Vejvoda, M.: Aircrew fatigue in long-haul operations. Accident Analysis and Prevention, vol. 29, no. 4, 1997, pp. 439–452. Samel, A.; Wegmann, H.-M.; Vejvoda, M.; Drescher, J.; Gundel, A.; Manzey, D.; et al.: Two-crew operations: Stress and fatigue during long-haul night flights. Aviation, Space, and Environmental Medicine, vol. 68, no. 8, 1997, pp. 679–687. Signal, L.: Factors affecting physiological alertness during long-range flights. Aviation, Space, and Environmental Medicine, vol. 76, no. 3, 2005, p. 248. U.S. Department of Transportation: FAA Aerospace Forecasts FY 2005-2016. Federal Aviation Administration: Washington, D.C., 2005. Wikipedia: Airbus A340. Available October, 27, 2005 at http://en.wikipedia.org/wiki/Airbus_A340. Wilkinson, R. T.: Effects of up to 60 hours’ sleep deprivation on different types of work. Ergonomics, vol. 17, 1964, pp. 175–186. Wright, N.; and McGown, A.: Vigilance on the civil flight deck: Incidence of sleepiness and sleep during long-haul flights and associated changes in physiological parameters. Ergonomics, vol. 44, no. 1, 2001, pp. 82–106.

37

REPORT DOCUMENTATION PAGE Form ApprovedOMB No. 0704-0188
1. REPORT DATE (DD-MM-YYYY)01-04-2006
2. REPORT TYPE Technical Memorandum
4. TITLE AND SUBTITLEThe Effects Of Ultra-Long-Range Flights On The Alertness And Performance In Aviators.
5a. CONTRACT NUMBER
6. AUTHOR(S)Caldwell, John A.¹, Mallis, Melissa M.¹, Colletti, Laura M.², Oyung, Raymond L.³, Brandt, Summer L.³, Arsintescu, Lucia³, DeRoshia, Charlie W.¹, Reduta-Rojas, Dinah D.³, & Chapman, Patrick M.³
7. PERFORMING ORGANIZATION NAME(S) AND ADDRESS(ES)¹NASA Ames Research Center, Moffett Field, CA 94305-0001 ²QSS Inc./NASA Ames Research Center³San Jose State University Foundation/NASA Ames Research Center
9. SPONSORING/MONITORING AGENCY NAME(S) AND ADDRESS(ES)National Aeronautics and Space Administration, Washington DC 20546-0001
8. PERFORMING ORGANIZATION REPORT NUMBER
TH-066A-060009
10. SPONSORING/MONITOR'S ACRONYM(S)
NASA
13. SUPPLEMENTARY NOTESPoint of Contact: John Caldwell, Ames Research Center, MS 262-4, Moffett Field, CA 94035-1000(650) 604-3167
12. DISTRIBUTION/AVAILABILITY STATEMENTUnclassified-Unlimited Distribution: Nonstandard Subject category: 03; 53 Availability: NASA CASI (301)621-0390
19b. NAME OF RESPONSIBLE PERSON
John Caldwell
14. ABSTRACTThis investigation assessed the impact of ultra-long-range (ULR) simulator flights, departing either in the morning or late evening, on the alertness and performance of 17 commercial aviators. Immediately prior to and throughout each flight, alertness and performance were assessed via a computerized test of sustained attention, subjective questionnaires, and "hand-flying" tasks. There were fatigue-related effects on the majority of assessments, and the nature of these effects was consistent across the vigilance and self-report measures. However, the operational "hand-flying" manuevers proved insensitive to the impact of fatigue probably due to procedural factors. Regardless, the results of the present study suggest that fatigue associated with prolonged wakefulness in ULR flight operations will interact with flight schedules due to circadian and homeostatic influences. In this study, the pilots departing at night were at a greater initial disadvantage (during cruise) than pilots who departed earlier in the day; whereas those who departed earlier tended to be most impaired towards the end of the flight prior to landing. In real-world operations, airlines should consider the ramifications of flight schedules and what is known about human sleep and circadian rhythms to optimize safety. 15. SUBJECT TERMSultra-long-range; long-haul, departure times; circadian, ULR, flight schedule; fatigue
18. NUMBER OF PAGES
4119b. TELEPHONE NUMBER (Include area code)
(650) 604-3167
a. REPORT
Unclassified
c. THIS PAGE
Unclassified
b. ABSTRACT
Unclassified
17. LIMITATION OF ABSTRACT
Unlimited
Prescribed by ANSI Std. Z39-18Standard Form 298 (Rev. 8-98)
3. DATES COVERED (From - To)
5b. GRANT NUMBER
5c. PROGRAM ELEMENT NUMBER
5d. PROJECT NUMBER
5e. TASK NUMBER
5f. WORK UNIT NUMBER
711-70-02
11. SPONSORING/MONITORING REPORT NUMBER
NASA/TM-2006-213484
16. SECURITY CLASSIFICATION OF:
The public reporting burden for this collection of information is estimated to average 1 hour per response, including the time for reviewing instructions, searching existing data sources, gathering and maintaining the data needed, and completing and reviewing the collection of information. Send comments regarding this burden estimate or any other aspect of this collection of information, including suggestions for reducing this burden, to Department of Defense, Washington Headquarters Services, Directorate for Information Operations and Reports (0704-0188), 1215 Jefferson Davis Highway, Suite 1204, Arlington, VA 22202-4302. Respondents should be aware that notwithstanding any other provision of law, no person shall be subject to any penalty for failing to comply with a collection of information if it does not display a currently valid OMB control number.PLEASE DO NOT RETURN YOUR FORM TO THE ABOVE ADDRESS.