the effects of uncertainties in fire emissions estimates
TRANSCRIPT
The Effects of Uncertainties in Fire Emissions Estimates on Predictions of Texas Air Quality
Elena McDonald-Buller (PI) and Yosuke Kimura Center for Energy and Environmental Resources
The University of Texas at Austin
Christine Wiedinmyer (Co-PI) National Center for Atmospheric Research
Chris Emery (Co-PI) and Ed Tai ENVIRON International Corp.

Influence of Fires on Air Quality • Wildland fires and open burning
can be substantial sources of ozone precursors and particulate matter.
• The influence of fire events on Texas air quality has been well documented by observational studies.
• Fire emissions are often transported over multiple spatial scales.
MODIS Image May 9, 2003
Source: http://www.nasa.gov/vision/earth/environment/central_am_fires.html

Accurate characterization of fire events needed for: • Exceptional event
exclusions • Air quality modeling for
planning and attainment demonstrations
• Estimating NAB ozone concentrations
Climate models suggest increased frequency of drought in southwestern U.S. In Texas, 2011 was record year for drought and wildfires.
Study Motivation
Bastrop County Complex Fire Source: The Atlantic (9/6/2011)
Projected future changes in precipitation as simulated by 15 climate models. Source: U.S. Global Change Research Report, 2009.

Study Motivation • Fire emissions estimates are used as inputs to chemical
transport models.
• Required spatial and temporal resolution vary with application , e.g. global-scale studies (100 km and monthly time periods) versus regional-scale studies (< 10 km and daily time periods)*
• Many studies suggest substantial variability between models.
• Variability associated with fire detection and estimation of burned area and fuel composition, loading, vertical structure, and consumption, and characterization of conditions from preceding drought and heat.
Source: Urbanski et al., 2011; Al-Saadi et al., 2008.

Objectives • This project evaluates the sensitivity of emissions estimates
from the Fire INventory from NCAR (FINN) version 1 (referred to as the FINN default configuration in this work) to variability in input parameters and the effects on modeled ozone and particulate matter concentrations using CAMx.
• Major Tasks: 1. Climatology of fires in Texas, Louisiana, Central and
Western U.S., Mexico/Central America, western Canada between 2002-2012.
2. FINN default vs. BlueSky/SmartFire comparison 3. FINN sensitivity studies focusing on emission factors, land
cover classification, fuel loading data, and fire detection and area burned estimation.
4. Effects of FINN sensitivities on air quality using CAMx

FINN Default Configuration (Wiedinmyer et al., 2011) • Ei = A (x,t) * B(x) * FB * efi where Ei = mass emission of species i A(x,t) = area burned at time t and location x B(x) = biomass loading at location x FB = fraction of biomass burned efi = mass of i emitted per mass of biomass burned. • Fire Detection: MODIS Rapid Response (MRR) product; double
counting of fires from Terra and Aqua observations addressed.
• Land Use/Land Cover Classification: MODIS Land Cover Type (LCT) product lumped into six categories: savanna/grasslands, woody savannas/shrublands, tropical forest, temperate forest, boreal forest, and croplands. MODIS Vegetation Continuous Fields (VCF) product used to identify vegetation density.

FINN Default Configuration (Wiedinmyer et al., 2011) • Area Burned: Upper limit of 1 km2; 0.75 km2 for grassland and
savannas. Scaled by percent bare cover in VCF product.
• Fuel Loading: Assigned to world regions according to 5 of 6 LULC classes. Croplands assigned same loading as grasslands of each world region, (e.g. North America, 976 g/m2).
• Fraction of Biomass Burned: Assigned according to fraction of
tree cover by MODIS VCF product and fuel loading.
• Emission Factors: Literature – Akagi et al. (2011).
• Chemical Speciation: Available for GEOS-Chem, MOZART-4, SAPRC99 chemical mechanisms. ENVIRON developed processing algorithm to obtain a profile for CB05 mechanism from MOZART-4 speciation.
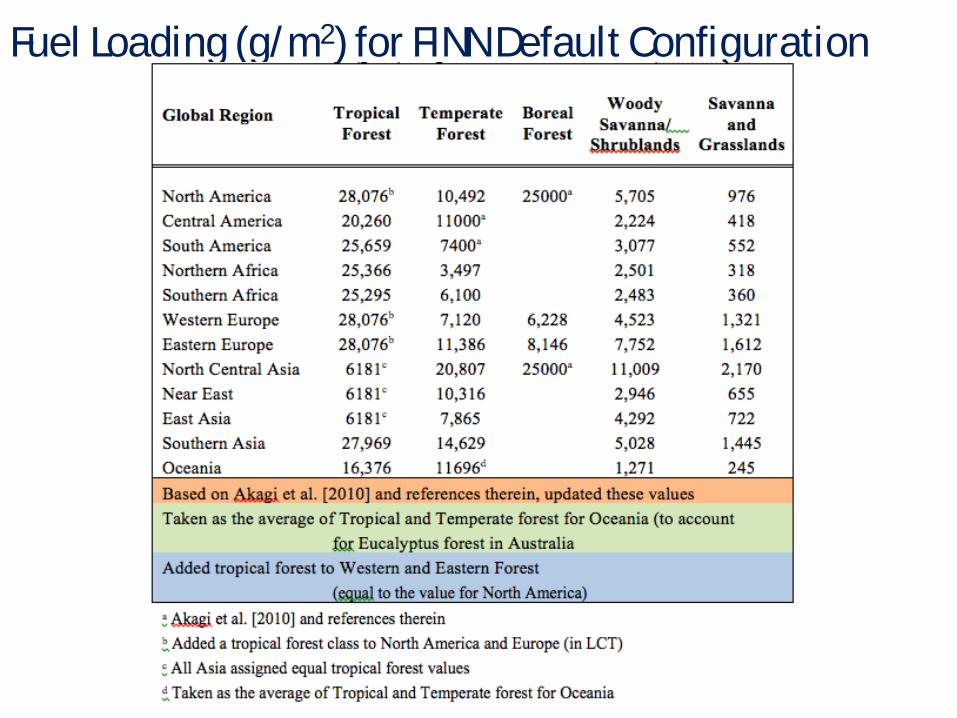
Fuel Loading (g/m2) for FINN Default Configuration
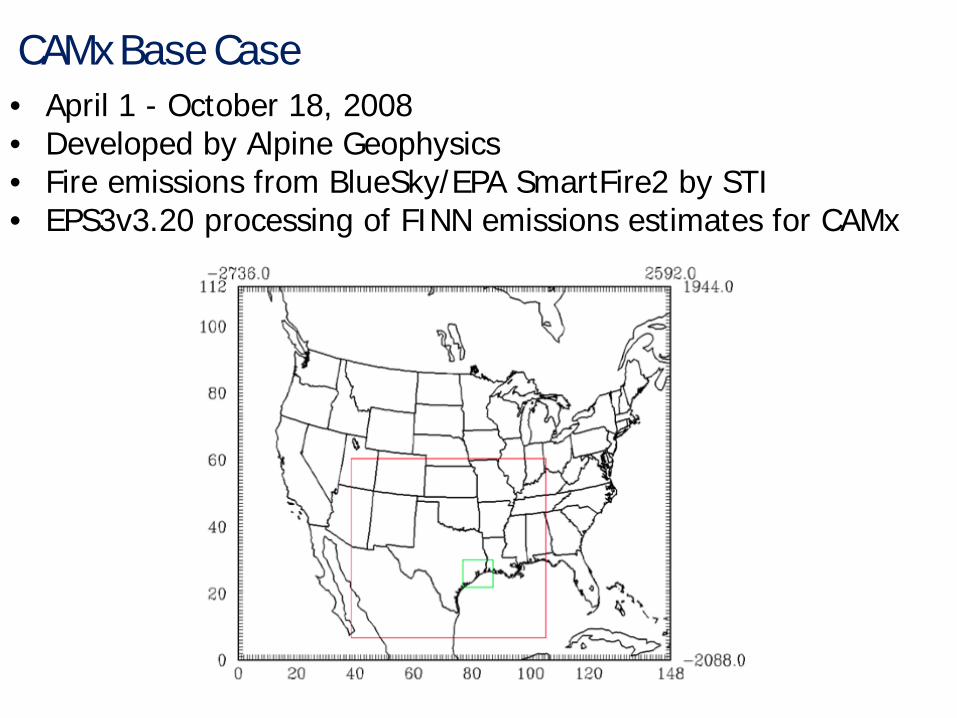
CAMx Base Case • April 1 - October 18, 2008 • Developed by Alpine Geophysics • Fire emissions from BlueSky/EPA SmartFire2 by STI • EPS3v3.20 processing of FINN emissions estimates for CAMx

Comparison of CO Emissions (kg/month) in 2008 with 11-Year (2002-2012) Mean
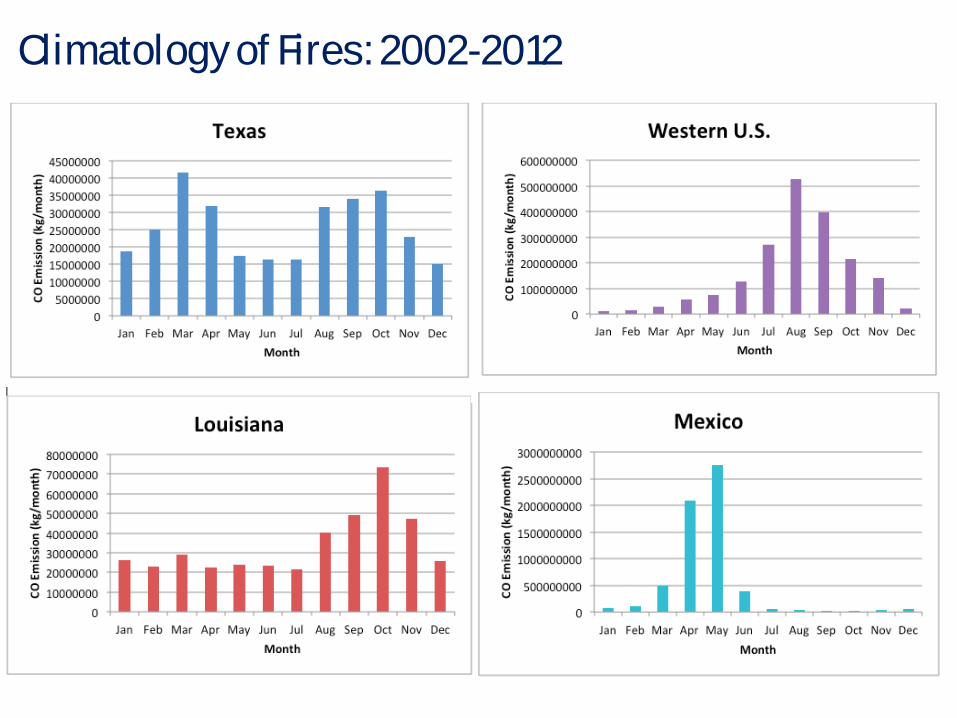
Climatology of Fires: 2002-2012

Monthly Average Interannual Variability in CO Emissions Estimates from FINN during 2002-2012

Comparison of FINN Default and BlueSky/SmartFire BlueSky/SmartFire estimates were greater than FINN, except for NOx. Burned Area: SmartFire uses reported area burned and multiple satellite detections. FINN relies on MODIS MRR. Emission Factors: FINN estimates greater for NOx, especially for ag burning. Higher emission factors in FINN may compensate for lower estimates of acreage burned in the central US.

Episode Total CO Emissions (short tons) from BlueSky/SmartFire (left) and FINN [right)
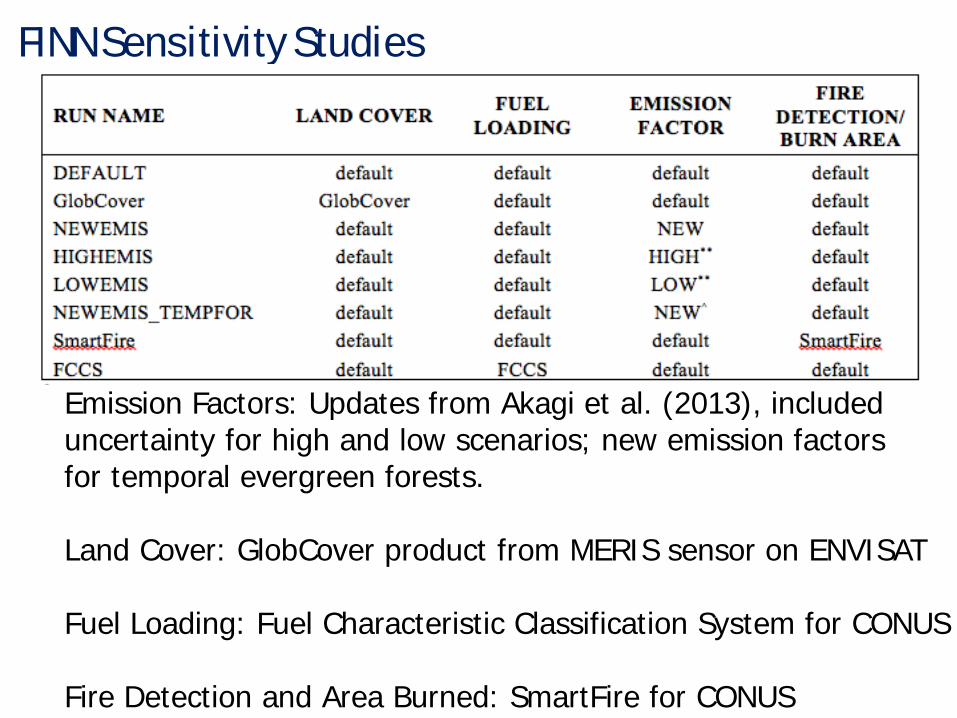
FINN Sensitivity Studies
Emission Factors: Updates from Akagi et al. (2013), included uncertainty for high and low scenarios; new emission factors for temporal evergreen forests. Land Cover: GlobCover product from MERIS sensor on ENVISAT Fuel Loading: Fuel Characteristic Classification System for CONUS Fire Detection and Area Burned: SmartFire for CONUS

Comparison of MODIS LCT and GlobCover
MODIS LCT
GlobCover
• Land cover classification influences fuel loading and emission factors.
• MODIS LCT has more area assigned as shrublands or grasslands in central and western U.S.
• GlobCover assigns more
area as forest and shrublands.

Episode Total Emissions (short tons) from the FINN Default and Sensitivity Scenarios
• Variability in emissions estimates can exceed a factor of two. • Interactions between input parameters can be complex. • Differences in geographic responses.
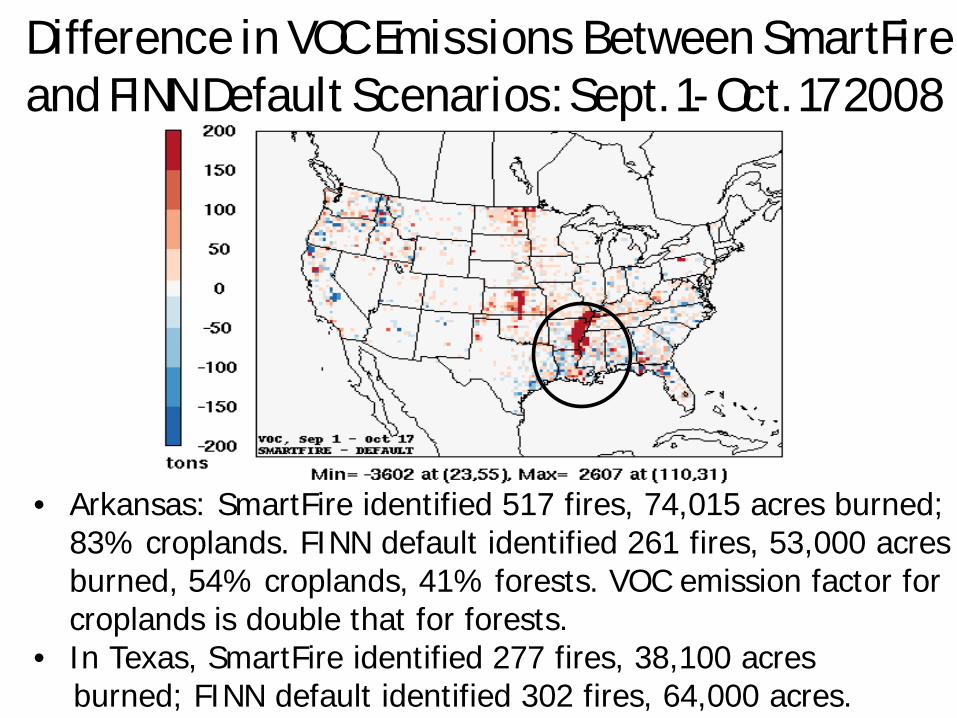
Difference in VOC Emissions Between SmartFire and FINN Default Scenarios: Sept. 1- Oct. 17 2008
• Arkansas: SmartFire identified 517 fires, 74,015 acres burned; 83% croplands. FINN default identified 261 fires, 53,000 acres burned, 54% croplands, 41% forests. VOC emission factor for croplands is double that for forests.
• In Texas, SmartFire identified 277 fires, 38,100 acres burned; FINN default identified 302 fires, 64,000 acres.

Difference in VOC Emissions Between GlobCover and FINN Default Scenarios: Sept. 1- Oct. 17 2008
• GlobCover land cover identified more forest than MODIS land cover product used in FINN default, which had more area identified as croplands, particularly in Arkansas.
• In most other areas, forests assigned by GlobCover produce higher emissions when they replace savanna/grasslands and shrublands.

Predicted Effects on Air Quality • Minimal impacts on percentile
concentrations over extended time.
• Maximum predicted differences
in 8-hr ozone from modifications in FINN inputs
ranged from 5 to >70 ppb.
• Particularly for FCCS and SmartFire scenarios in central and southeastern U.S. during spring and western and southern U.S. during late summer/early fall seasons and Globcover scenario in Mexico during spring.
Maximum absolute differences in 8-hour ozone (ppb) during September 1st – October 17th between the SmartFire and FINN default scenarios.

Recommendations • Sensitivity simulations with FINN highlight potential variability
in predicted fire emissions.
• Variability of region and season dependent.
• Key needs for improvement: • Fire detection • Croplands: Characterization and mapping; constrain
estimates of burned area and fuel loading; reduce uncertainty in emission factors
• Measurements and model validation • Land use/land cover mapping • Representation of U.S. forest types: classifications, specific
fuel loadings and emission factors.