the effects promotional incentives have on college
TRANSCRIPT
University of Mississippi University of Mississippi
eGrove eGrove
Electronic Theses and Dissertations Graduate School
2016
The Effects Promotional Incentives Have On College Basketball The Effects Promotional Incentives Have On College Basketball
Attendance In Power Five Conferences Attendance In Power Five Conferences
Alexander Ryan Cramer University of Mississippi
Follow this and additional works at: https://egrove.olemiss.edu/etd
Part of the Sports Management Commons
Recommended Citation Recommended Citation Cramer, Alexander Ryan, "The Effects Promotional Incentives Have On College Basketball Attendance In Power Five Conferences" (2016). Electronic Theses and Dissertations. 719. https://egrove.olemiss.edu/etd/719
This Thesis is brought to you for free and open access by the Graduate School at eGrove. It has been accepted for inclusion in Electronic Theses and Dissertations by an authorized administrator of eGrove. For more information, please contact [email protected].
THE EFFECTS PROMOTIONAL INCENTIVES HAVE ON COLLEGE BASKETBALL
ATTENDANCE IN POWER FIVE CONFERENCES
A Thesis
presented in partial fulfillment of requirements
for the degree of Master of Arts in Recreation Administration
in the Department of Health, Exercise Science, and Recreation Management
The University of Mississippi
By
ALEXANDER R. CRAMER
August 2016

Copyright Alexander R. Cramer 2016
ALL RIGHTS RESERVED

ii
ABSTRACT
The purpose of this study was to explore promotional incentives effects on attendance at
men and women college basketball games in Power Five conferences during the 2015-16 season.
The sub-objective was to explore the data to determine if distinct market segments emerged
based on the promotional strategies measured as part of the study. The study variables are based
on recommendations and suggestions from completed research exploring similar phenomenon
among MLB teams (Boyd & Krehbiel, 2003, Boyd & Krehbiel 2006, Browning & Debolt, 2007,
Howell, Klenosky, McEvoy, 2015).
There were 20 men and 20 women teams from Power Five conference with a total of 641
games played by these 40 teams; 335 men games and 306 women games, respectfully. A
multiple linear regression was applied using attendance as the dependent variable. Attendance
was defined as the percentage of venue capacity filled for each game.
Results revealed that several promotional strategies at women games significantly (p <
.05) increased attendance. Significant women strategies included: giveaways under $5, t-shirt
giveaways, and group discount. There were no significant promotional strategies that increased
attendance for men games. There were two strategies that predicted lower attendance;
giveaways under $5, and ticket discounts. Women results found significant predictors that
increased attendance in covariate predictors; conference games, and home team winning
percentage. Several covariate factors increased attendance at men games; conference games and
weekend games. One covariate for women and one covariate for men had a negative effect on
attendance. A Hierarchal Cluster Analysis revealed a three group cluster and four group cluster
iii
for women and men, respectively.
Results suggest that collegiate marketing directors develop non-conference and weekday
game promotions at men games, and spend more money on inexpensive promotions at women
games. Promotions at women games should focus on identifying giveaways under $5 during
conference games to maximize these findings. Conversely, men games should not spend money
on promotions if the intent is to increase attendance. Future studies should focus on delineating
promotion categories, exploring college basketball outside the Power Five conferences, and
applying this study’s methodology to explore other collegiate sports.

iv
DEDICATION
My thesis is dedicated to my parents, Michael and Christina Cramer. I would not be
where I am today without their constant guidance and support.

v
ABBREVIATIONS AND SYMBOLS
ACC Atlantic Coast Conference
AD Athletic Director
MLB Major League Baseball
NCAA National Collegiate Athletics Association
PS Promotional Strategies
SEC Southeastern Conference
vi
ACKNOWLEDGEMENTS
I express my deepest appreciation to my advisor, Dr. Kim Beason and my committee
members, Dr. Kofan Lee, Dr. Martha Bass, and Dr. Josie Nicholson. I would also like to thank
my colleagues in the Ole Miss Athletic Department for continuingly pushing me to be better than
I was yesterday.
Lastly, I acknowledge the collegial support from my fellow graduate school students in
Recreation Administration at the University of Mississippi. You made my life enjoyable and
enriching.
vii
TABLE OF CONTENTS
ABSTRACT .................................................................................................................................. ii
DEDICATION ............................................................................................................................. iv
ABBREVIATIONS AND SYMBOLS ......................................................................................... v
ACKNOWLEDGEMENTS ......................................................................................................... vi
LIST OF TABLES ..................................................................................................................... viii
LIST OF FIGURES ..................................................................................................................... ix
INTRODUCTION ........................................................................................................................ 1
REVIEW OF RELATED LITERATURE .................................................................................... 9
METHODOLOGY ..................................................................................................................... 15
RESULTS ................................................................................................................................... 20
CONCLUSIONS, DISCUSSIONS, RECOMMENDATIONS .................................................. 32
REFERENCES ........................................................................................................................... 40
APPENDICES ............................................................................................................................ 44
VITA ........................................................................................................................................... 53
viii
LIST OF TABLES
Table 1 – Descriptive analyses of external covariate factors and dependent variable ................ 21
Table 2 – Covariate game timing and frequency variables......................................................... 21
Table 3 – Promotional strategies frequencies ............................................................................. 22
Table 4 – ANOVA results for promotional strategies at women games .................................... 23
Table 5 – Coefficient results for promotional strategies at women games ................................. 24
Table 6 – ANOVA results for promotional strategies at men games.......................................... 25
Table 7 – Coefficient results for promotional strategies at men games ...................................... 25
Table 8 – ANOVA results for promotional strategies/covariates at women games ................... 26
Table 9 – Coefficient results for promotional strategies/covariates at women games ............... 27
Table 10 – ANOVA results for promotional strategies/covariates at men games ...................... 28
Table 11 – Coefficient results for promotional strategies/covariates at men games .................. 29

ix
LIST OF FIGURES
APPENDIX A
-Figure 1 – Average Linkage (Between Groups) – Women Cluster .......................................... 45
APPENDIX B
-Figure 2 – 3 Group Cluster Graph ............................................................................................. 47
APPENDIX C
-Figure 3 – Average Linkage (Between Groups) – Men Cluster ................................................ 49
APPENDIX D
-Figure 4 – 4 Group Cluster Graph ............................................................................................. 51
1
CHAPTER I
INTRODUCTION
The roar of a sold-out crowd and the revenue that comes with it would not be possible
without some first-rate marketing. Marketing directors in collegiate athletics have been tasked
with making sure fans have a reason to attend games, even when the teams they work for aren’t
winning. This chapter examines the research topic at hand, it’s importance, definitions of key
terms, limitations, assumptions, and some expected outcomes.
Background
College sport is a big business and has been steadily growing for the last 25 years.
Today, there is a large amount of money on the line when it comes to determining the right mix
of promotions.
The worldwide sports industry as a whole reached an estimated worth of $213 billion
dollars during the 1990’s (Mahony & Howard, 2001) and has since then soared even higher.
Updated figures provided by Plunkett Research (2015) suggests that the global sport industry had
an estimated worth of $1.5 trillion dollars in 2015 with $989 million of those dollars coming
from National Collegiate Athletic Association (NCAA) sports revenue across Divisions I, II, and
III. Every school in the NCAA has a different budget to work with, but they all have one thing
in common – every budget is limited.
Athletic departments across the country spend hundreds of thousands of dollars on
marketing (Hansen & Gauthier, 1992). Providing a clear picture of what methods of marketing
2
work best will save marketing departments money and, in turn, save athletic departments money
that can be spent elsewhere. As the financial landscape of college athletics grows, the
responsibilities and expectations of its administrators grow too. Athletic Directors of Marketing
are often tasked with developing strategies and efforts to increase attendance at collegiate
sporting events, which in turn increases direct (tickets sold) and indirect revenues (concession
and merchandise). One popular strategy for growing attendance is through promotions, such as
giveaways or group discounts. These game promotions make attending games more attractive
and fun for fans to attend which is shown to increase attendance (Boyd & Krehbiel, 2003),
purchase of sport-related merchandise (Cebula, Coombs, Lawson, & Foley, 2013), and fan
motivation and satisfaction (Armstrong, 2008).
According to Trail & Yu (2011) motivation to attend sporting events varies from fan to
fan, necessitating more diverse marketing promotions. Moreover, NCAA administrators are
challenged with determining the most effective marketing strategies that will increase attendance
(Cooper, 2015). Collegiate sport marketing professionals are responsible for developing this
challenge into operational plans. Marketing professionals have no control over the product on
the field, but they can manipulate marketing strategies and promotions to positively affect
attendance (Browning & DeBolt, 2007), and more spectators can impact the outcomes on the
field by their fan noise alone (Ballard, 2013)
Although little research has explored promotion success in collegiate sports, professional
sports have tracked the successes of promotions in increasing fan attendance and satisfaction,
both related to increased ticket and merchandise sales. There are large amounts of money at
stake when it comes to determining the right mix of promotions. For example, professional
baseball has more regular season home games in its schedule than any other sport, and as a by-

3
product, requires the most effort to attract fans to its events. Several studies have been done in
professional baseball to look at promotions and their role in increasing attendance. These results
have shown success, and the methods used in their research have served as a guide for analyzing
promotions and their effect on attendance (Boyd & Krehbiel, 2006, Browning & Debolt, 2007,
McDonald & Raseker, 2000).
While much has been written about the effect promotions have on attendance at
professional baseball games, nothing has been written about the direct effect promotions have at
college basketball games. The majority of college athletics research has focused on qualitative
research that examines marketing strategies in areas that administrators think are important to
increase attendance, but little has been done on a large scale to quantitatively see what the actual
end of season results reveal (Martin, Miller, Elsisi, Bowers, & Hall, 2011). While the general
consensus is that promotions increase attendance, some marketers fear that an overload of
promotions can dilute the effectiveness that promotions ultimately have on attendance (Hixson,
2005). Therefore, determining the best marketing mix is vital for year-to-year improvement.
One reason promotions are so important to sports marketing professionals is the fact that they
can be controlled (Boyd & Krehbiel, 2006). Day of the game, time of the game, weather,
commuting distance, and other factors are completely out of administrators’ control. With so
few elements that can be controlled, promotions are worth manipulating.
The purpose of this study was to determine the mix of promotions that best increase
spectator attendance at Power Five college basketball games. By comparing data from the
Power Five schools, the goal is that college athletic administrators will have a better
understanding of what can be done to impact attendance at their school’s sporting events. A
main premise of this study is that non-price promotions will generate the most fans at a sporting
4
event, non-price meaning something that is added to the sporting event as an add-on. The
premise is based on a similar study conducted in professional baseball which found that adding
value to a sporting event rather than reducing the price of admission yielded better results in
increasing attendance (Browning & DeBolt, 2007).
Statement of Purpose
The purpose of this study is to determine the effect promotional strategies have on
basketball game day attendance in the Power Five conferences. Presently, 20 schools in the
Power Five conferences conduct promotions at both their men and women basketball games.
The secondary objective of this study is to identify the promotional mix most likely to
increase basketball attendance based on sport venue, day of the week, time of the game,
opponent winning percentage, conference opponents, and weather.
Importance of the Study
Athletic department budgets are not unlimited. Being able to make effective, informed
decisions based on data could allow collegiate marketers to perform their job more effectively.
With the average college basketball home schedule consisting of 16 games, there are many
different dates to fill with promotional content.
The right promotion, on the right day, against the right opponent, could yield benefits in
the stands via increased attendance. Increased spectators at home games provide a home court
advantage that cannot be understated. The home team wins more than 50% of the time across all
different levels and sports, and research suggests the home crowd has an impact on outcome.
(Watkins, 2012). Common sense says that the larger the crowd the greater that effect.
Hypotheses
The following are the null hypotheses posited for the study.
5
Hypothesis One (Ho1): Promotional strategies will not significantly (p > .05) predict
attendance at Power Five conference basketball games for women.
Hypothesis Two (Ho2): Promotional strategies will not significantly (p > .05) predict
attendance at Power Five conference basketball games for men.
Hypothesis Three (Ho3): Covariate predictors will not significantly (p > .05) predict
attendance at Power Five conference basketball games for women.
Hypothesis Four (Ho4): Covariate predictors will not significantly (p > .05) predict
attendance at Power Five conference basketball games for men.
Sub-objective: Determine if distinct market segments emerge based on the promotional
efforts measured for men and women.
Definition of Terms
For the purpose of the study the following definitions of terms were used:
1. Atlantic Coast Conference (ACC): A conference that covers states along the Atlantic Ocean
portion of the United States. It is comprised of Boston College, Clemson, Duke, Florida
State, Georgia Tech, Louisville, Miami, North Carolina, NC State, Notre Dame, Pitt, and
Syracuse.
2. Attendance: The number of fans who attend a given sporting event. For the purpose of this
study the attendance figure will be determined by dividing the raw attendance number by the
venue capacity to determine a percentage.
3. Attendance raw number: The reported number of people who attended a sporting event.
Found in the final box score.
4. Big Ten Conference (Big Ten): A conference that covers states in the mid-west part of the
United States. It is comprised of Indiana, Illinois, Iowa, Maryland, Michigan, Michigan

6
State, Minnesota, Nebraska, Northwestern, Penn State, Purdue, Rutgers, and Wisconsin.
5. Big XII Conference (Big XII): A conference that covers states in the middle of the United
States. It is comprised of Baylor, Iowa State, Kansas, Kansas State, Oklahoma, Oklahoma
State, Texas, TCU, Texas Tech, and West Virginia.
6. Football Bowl Subdivision (FBS): The schools that compete in football post-season bowl
games.
7. Group discount: A discounted ticket price given to specific groups such as the Boy Scouts,
military personnel, or a youth basketball league.
8. Inclement weather: Any day where rain or snow is present the day of the game.
9. Marketing Mix: Price, product, place, and promotion make up the marketing mix. These
factors can be manipulated to increase the attractiveness of a product or an event.
10. National Collegiate Athletic Association (NCAA): The governing body of college athletics
that all FBS schools play under.
11. Pac-12 Conference (Pac-12): A conference that covers states near the Pacific Ocean part of
the United States. It is comprised of Arizona, Arizona State, California, Colorado, Oregon,
Oregon State, Stanford, UCLA, USC, Utah, Washington, and Washington State.
12. Power Five: A group of conferences that possess the biggest budgets in college athletics. It
consists of the SEC, ACC, Big Ten, Big XII and Pac-12.
13. Promotion: An event, give away, or special deal performed by the marketing department at a
given school with the desired end result being more fans at the game; e.g., high-value
giveaway, low-value giveaway, group discount, t-shirt giveaway
14. Southeastern Conference (SEC): A conference that spans 11 states in the southeast part of
the United States. It is comprised of Alabama, Arkansas, Auburn, Florida, Georgia,

7
Kentucky, LSU, Mississippi State, Missouri, Ole Miss, South Carolina, Tennessee, Texas
A&M, and Vanderbilt.
15. Sports Marketing professional/director: An individual whose job consists of growing the
brand of the team and devising ways to attract new and old fans to attend sporting events.
16. Time of day: The time of day that a game is played.
17. T-shirt giveaway: An item given away at the door
18. Venue: The stadium or arena where a basketball game is played.
19. Winning percentage: winning percentage is computed by dividing the number of wins by the
total number of games. The formula is: Winning Percentage = Wins/Games.
Delimitations
The following delimitations were placed on this study:
1. The study is delimited to regular season games only.
2. The study is delimited to what attendance data is available online.
3. The study is delimited to what promotion data is available online.
4. The study is delimited to what weather data is available online.
5. The study is delimited to men and women college basketball
Limitations
The following were limitations of the study:
1. The study is limited to the 2015-2016 season.
2. The study is limited to college basketball.
Assumptions
In the research design for the study the following assumptions were necessary:
1. All promotional schedules provided online by the schools being studied are accurate and

8
were performed on the dates provided.
2. All attendance numbers reported in the game box scores are accurate and truthful.

9
CHAPTER II
REVIEW OF RELATED LITERATURE
While studies on the effect promotions have on college basketball attendance have never
been done before, such studies have been performed in professional and minor league baseball.
Researchers have studied effects on baseball game attendance including spectator motivations
and fireworks. The long seasons that accompany baseball, as many as 81 home games in a
single season, make it an ideal sport for research on promotion effects. The different marketing
studies explored in this literature review provide a historical background and findings of the most
pertinent studies compatible with the purpose and goals of this study.
Introduction
Sports are a popular subject for research, but studies focused on promotions and their
effect on attendance to sporting events has resulted in only a few research studies. Notably, none
of these studies explored promotions and/or their effect on attendance in men and women
basketball games at the collegiate level.
Martin, et al. (2011) studied sports marketing strategies of college athletic marketing
directors (Martin, Miller, Elsisi, Bowers, & Hall, 2011). The study utilized a survey of all active
NCAA Division 1 marketing directors. Only 63% percent felt their marketing strategies were
effective. While the results showed that halftime promotions and game giveaways were used by
more than 90% of those who responded to the questionnaire, the findings provided no evidence
that marketing directors had methods to determine if promotions and giveaways were effective in
10
increasing attendance. Universally accepted, detailed accounts of past marketing data can show
trends which can help marketing professionals spend their promotional budgets effectively. The
researchers also point out how this kind of academic research is important because there is a
niche for concise methods to conduct marketing evaluations within the field of sports (DeGaris,
2008). Martin, Miller, Elsisi, Bowers, & Hall (2011) put it best when they said “In short, more
attention can be given to effective strategies while ineffective strategies can be eliminated—both
of which will contribute to a more resourceful sport organization” (p. 44). The focus of this
study was to develop a research methodology based on past marketing efforts to provide
empirical evidence to guide future efforts effective at increasing attendance.
Sports Reviewed
Of the studies reviewed, none studied men and women college basketball and the effects
promotions had on game attendance. Trail & Yu (2011) studied NCAA women’s college
basketball, but they only researched the motivators and constraints that impacted attendance
from an emotional angle—the fan experience. Another study researched the concept of the
“Home Court Advantage” at college basketball games (Watkins, 2012). Ballard’s (2013) study
researched promotional factors that may increase attendance at NFL games (Ballard, 2013). One
study focused on NBA marketing techniques (Dick & Turner, 2007), and the remainder of the
studies all concentrated on professional baseball—both major and minor league teams. Baseball
seasons lend themselves to research that explores factors that might increase attendance because
there are approximately 81 home games each season to measure the phenomenon.
Other Factors Reviewed
Of the studies reviewed that were sports related, some researched factors that had nothing
to do with promotions. The NFL study looked at the impact of game noise on the home field and

11
its advantages to a team’s winning percentage (Ballard, 2013). The “Home Court Advantage”
was researched to determine its impact on a team’s winning percentage (Watkins, 2012). The
weather and the timing of games (e.g., afternoon, weekend, evening, or holiday break) were
researched to determine their impact on attendance at games (Howell, Klenosky, McEvoy,
2015). Motivators and constraints that looked at emotional elements that influenced a spectator’s
attendance at games was researched as well (Trail & Yu Kyoum, 2011). Another study
considered the color and “culture” of game spectators and the impact those factors have on game
attendance (Armstrong, 2008). Even though these factors are interesting aspects to consider,
they will not be the focus of this study. Although the impact of weather and timing will be taken
into consideration over the various promotions that are offered at the individual games.
Promotions Reviewed
The studies that focused on the impact of promotions on increasing attendance used to
form the hypotheses and methodology for this study were based on professional baseball games.
Browning and Debolt (2007) tracked attendance and promotions for every game over the course
of a season for four different teams and combined the different types of promotions into
categories: price, non-price, no promotion and a combination of promotions. A unique aspect of
this study was it explored four different professional baseball teams in the same geographic
region—Ohio. Half the teams found an increase in attendance when non-price promotions were
present, as well as with a combination of promotions. The research from this study supports the
notion that non-price promotions draw bigger crowds (Browning & Debolt, 2007).
Another Major League Baseball study (McDonald & Raseker, 2000) didn’t look at the
effect of specific types of promotions on attendance, but focused on aspects that were
controllable by marketing professionals. The study covered over 1,500 MLB games during the
12
1996 season and examined whether promotions work and whether there is a “watering down”
effect from fans being exposed to too many promotions. The question regarding whether
promotions work or not was answered with an emphatic yes. Games that used a promotion
versus games that did not use a promotion experienced a 14% increase in attendance. The
answer to the “watering down” effect is more complicated. While more promotions over the
course of the season showed less of an individual game impact, they ultimately found a large net
total. So while on a game-by-game basis it did not make sense to have more promotions, it made
the most sense over the course of a long season.
A study done by Boyd and Krehbiel in 2006 is one of the most detailed and well thought-
out studies done regarding specific types of promotions and the impact on attendance. The
model the researchers used to measure attendance was adopted and revised for use in this study.
The following items were tracked: 1) team; 2) winning percentage; 3) opponent winning
percentage; 4) weekend game; 5) day game; 6) interleague game; 7) divisional game; 8)
temperature; 9) inclement weather; 10) promotion; 11) bobble head giveaway; 12) giveaway <
$5; 13) giveaway > $5; 14) special events; 15) two or more special events; 16) giveaway and
special event; 17) price discount (Boyd & Krehbiel, 2006). Not only was this study thorough, it
was also very comprehensive, covering all 30 Major League Baseball teams across the country.
One theory supported in the study is the idea of stacking promotions. Rather than just having an
item giveaway or just having a special event, it argues that combing the two is a very effective
strategy. The results of the study also suggest that there is no “best time” to offer a promotion; a
factor explored further in this study on men and women college basketball.
Finally, a study conducted at the minor league baseball level was conducted during the
2010 season. Triple-A teams in the International league had their promotional schedules
13
examined along with weather and timing to determine the most effective promotions in relations
to generating more attendance (Howell, Klenosky, McEvoy, 2015). Similar to Boyd and
Krehbiel in 2006, this study looked at low and high value giveaways as well. The independent
variables were broken up into internal and external categories with internal being factors that are
under the marketing directors control while external factors are not. Internal factors were: low
value giveaway, high value giveaways, fireworks, special events, and ticket price. External
factors were: temperature, precipitation, timing of game, and whether the game was played on a
weekend or not. Results showed that local temperature at the game’s first pitch, precipitation,
opening day/final home game, and weekend games were found to be statistically significant for
attendance among others. Low and high valued promotional giveaways were associated with a
10.8% and 10.5% increase in attendance respectively, while fireworks moved the attendance
needle the most with a 20.1% increase in attendance. These variables were used in this study.
The Future
While there are many different conferences of NCAA Division I college basketball
whose promotional strategies could be evaluated, the Power Five conferences were chosen for
the purpose of this study because of their perceived elite status. A recent study argued that the
NCAA could no longer properly govern the over 1,000 colleges and universities that make up the
NCAA athletic conferences. The results of an article contend that the Power Five should
separate from the NCAA and form its own independent athletic association. If these conferences
were ever to leave the NCAA and join an independent athletic conference the disparity between
the Power Five schools and the rest of the remaining schools would grow even larger, leaving
Power Five schools as the only highly competitive college athletic institutions in the country
(Bush, 2014).
14
If marketing professionals are not diligent in evaluating their methods, then history is
doomed to repeat itself. Tracking data allows marketers to repeat successes and avoid failures.
Ultimately, marketing directors must understand the consumer to develop cost-effective
marketing strategies using promotions. A study done in the National Basketball Association
looked at what marketing directors valued versus what ticket holders valued (Dick & Turner,
2007).
Although NBA teams are spending more than $1 million a year in marketing their
product to potential fans and…until recently, NBA marketing directors have continued to
value and use techniques similar to those used almost 30 years ago…These techniques
may now be obsolete, and although some marketers have tried new techniques, no one
has thoroughly assessed whether they work. (Dick & Turner, 2007)
Interestingly, ticket holders ranked ‘promotional premium’ or ‘giveaway items at the
door’ as the number one most effective marketing technique, while marketing directors ranked it
as the 13th most effective. Marketing Directors ranked ‘mini packs’ (partial season ticket plans)
as the most effective while ticket holders ranked it fifth. This study on college basketball hopes
to bridge the gap between the expectations of Marketing Directors and the expectations of the
ticket holders that they are trying to get in the seats. This study illuminates the effect that
promotions had on attendance at men and women basketball games and useful market segments
that should be considered in planning promotions.

15
CHAPTER III
METHODOLOGY
This study utilized a cross-sectional design and was exploratory in nature. Men and
women basketball teams among National Collegiate Athletic Association (NCAA) schools were
examined in this study to determine the effect promotions had on reported attendance for the
2015-16 season. The methodology section is comprised of participants, procedure, variables,
analysis, and anticipated problems.
Participants’ Data
The school attendance and promotion records in this research came from the schools
among the NCAA Division I Power Five conferences. This population included schools from
the SEC, Big XII, Big Ten, and Pac-12. These conferences were selected above others because
they have similar athletic department budgets and compete at the highest collegiate athletic level.
From these conferences, only schools that performed promotions for both their men and women
teams were included. Due to no schools meeting the inclusion criteria, no schools from the ACC
were included in the study. The final list ended up including: Alabama, Auburn, Baylor,
California, Georgia, Iowa, Kansas State, LSU, Northwestern, Oklahoma, Oklahoma State, Ole
Miss, Purdue, Rutgers, Texas A&M, UCLA, USC, Utah, West Virginia, and Wisconsin. Having
both men and women basketball teams examined provided insight into any predictors between
promotions at men and women sporting events. These 20 schools created a sample size of 40
teams: 20 men and 20 women basketball teams.
16
Each school’s official athletic website was examined for a copy of their promotional
schedule for men and women basketball. These schools provided this information to the general
public via their school’s athletic website. Winning percentage, attendance, game time, and day
of week, were taken from the box scores also available on the school’s official athletic website.
Historical weather data was pulled from the website Weather Underground based on arena zip
code.
Procedure
School athletic websites provided promotional schedules for both men and women
basketball. The information from those promotional schedules was coded into respective
promotional categories was entered into the Statistical Package for the Social Sciences software
(SPSS). Promotionally, each game that each team played was categorized into one of 11
categories: giveaway under $5, giveaway between $5–$10, giveaway over $10, t-shirt giveaway,
group discount, ticket discount, one special event, two special events, three or more special
events, no promotion, and combination games. Giveaways were categorized into various
giveaway categories based on their perceived value. The perceived value price point was
determined by utilizing a study done by PPAI (Promotional Products Association International)
research (Kuruvilla, & Ebel, 2011). Group discount games were any games where a specific
group of people received a discounted ticket price to attend, such as boy scout night, youth
basketball player night, etc. Ticket discounts were any games where discounted tickets were
available to the general public regardless of affiliation with a group or organization. Special
events were anytime a game had something done to try and attract fans that didn’t involve a
giveaway or a discount. Some examples were: a concert, family centered activities, clinic,
special halftime show, autograph session, etc. These special event games were then broken into
17
three separate categories based on the number of special events happening in one game: one
special event, two special events, or more than three special events. Finally, the raw number of
promotions happening in any one game were tracked and any games with two or more
promotions were identified as combination games. Games that featured no promotions were
categorized as no promotion games.
Attendance was reported in the box score after every team’s home game, and these box
scores were found on each team’s official website. Those attendance numbers were then
uploaded into SPSS. Other information, as follows, was put into SPSS from the box score: home
team winning percentage, opposing team winning percentage, time of game, conference or non-
conference game, and day of week. Additional variables were also gathered from each game to
include: average temperature the day of the game, precipitation for that arena’s zip code, and
whether the game was played over holiday break between traditional academic semesters.
Teams who do not provide a promotion schedule online for public use were not included in the
study.
Independent Variables
Promotions were key to exploring the research questions of the study. The independent
variable, promotions, were divided into eight categories: giveaway under $5, giveaway between
$5–$10, giveaway over $10, t-shirt giveaway, group discount, ticket discount, no promotion, and
special event. covariate variables consisted of the following: home team winning percentage,
away team winning percentage, time of game, conference or non-conference game, day of week,
average temperature the day of the game, precipitation for that arena’s zip code, and whether the
game was played over holiday break between traditional academic semesters.
Dependent Variable
18
The dependent variable in this study was the percentage of venue capacity filled at the
college basketball games during the 2015-16 season. Attendance was collected from the home
team box score from each team’s official website. The attendance raw number was then
operationalized as a percentage of the stadium capacity where each game was played and this
value served as the dependent variable for the study. Promotion types and other covariates were
tested to determine their effect on attendance at the basketball games. For the purpose of this
study, anytime attendance is referred to, it will be referring to the percentage of venue capacity
filled.
Data Analysis
Once the data was entered, quantitative statistics and a Multiple Linear regression were
used to discover if there were significant predictors of attendance by promotional strategy. A
multivariable linear regression analysis was employed to examine the relationships among the
following promotional categories of attendance: giveaway under $5, giveaway between $5–$10,
giveaway over $10, t-shirt giveaway, group discount, ticket discount, and special event. For both
models the following covariates were included: home team winning percentage, away team
winning percentage, time of game, conference or non-conference game, day of week, average
temperature the day of the game, precipitation for that arena’s zip code, and whether the game
was played over holiday break between traditional academic semesters. Appropriate statistical
analyses were calculated to either fail to reject or reject the null hypotheses of the study. After
the data was collected and categorized, data was analyzed to determine if and which independent
variables, or groupings of individual variables, predict significantly greater (p < .05) attendance.
Analyses included cluster analysis and linear regression. The results were used to identify
homogenous segments of promotions that have similar effects on attendance but are distinctively

19
different from other promotions. All calculations were computed using SPSS.
20
CHAPTER IV
RESULTS
The primary purpose of the study was to explore how promotional incentives effect
college basketball attendance. The sub-objective was to explore the data to determine if distinct
market segments emerged based on the promotional efforts measured as part of the study.
Findings of the research include a descriptive profile of the participants and results of the linear
regression analyses calculated to test the hypothesis. Finally, the results of hierarchal cluster
analysis are presented to address the sub-objective of the research. Data was gleaned from 40
Power Five men and women 2015-16 collegiate promotional schedules on each team’s official
athletic website. To be included in the study, both men and women teams must have posted their
seasonal promotional schedules.
Profile of the teams
There were 20 men and 20 women teams included in the study. These teams included six
teams from the Southeastern Conference, five teams from the Big XII Conference, five teams
from the Big Ten Conference, and four teams from the Pac-12 Conference. The study consisted
of a total of 40 teams.
There were 641 games played by the 40 teams examined in this study with 335 men
games and 306 women games included in the data analyses. Table 1 presents the attendance
average to men and women games were 9,641 and 3,209 respectively. The mean attendance for
men and women were 78% and 29% respectively. Winning percentage, temperature, and

21
precipitation produced similar averages for both men and women games.
Table 1
Descriptive analyses of external covariate factors and dependent variable
Group
Women’s Games Men’s Games
Mean Standard
Deviation
Mean Standard
Deviation
Home team Winning % 69.9% 24.1% 66.9% 24.4%
Away team Winning % 59.4% 28.3% 56.3% 27.9%
Game Attendance 3209.3 2014.8 9641.2 3762.7
Actual Capacity 11693.4 3032.9 12227.6 2535.1
Venue % capacity filled 28.9% 19.02% 77.6% 21.5%
Temperature (Fahrenheit) 45.8 13.6 45.5 13.5
Precipitation (inches) .11 .37 .08 .30
Table 2 presents the count and frequencies of when games were played for men and
women games. These measures included whether the game was placed on a weekend, including
Friday games, whether the games were played before or after 5pm, whether they were played
during conference play, and whether they were played over the college’s holiday break between
fall and spring semester.
Table 2
Covariate game timing and frequency variables
Gender
Women Male
N % N %
Game Day Weekday 139 45.4% 169 50.4%
Fri-Sun 167 54.6% 166 49.6%
Game time earlier 5pm 132 43.1% 92 27.5%
5pm or later 174 56.9% 243 72.5%
Conference game non-conference 131 42.8% 154 46.0%
Conference 175 57.2% 181 54.0%
Holiday Schedule not holiday break 227 74.2% 258 77.0%
holiday break 79 25.8% 77 23.0%
Table 3 presents the count and frequencies of the occurrence of various promotions
strategies during each game played (men = 335, women = 306). These strategies included

22
whether a promotion occurred or not, whether a giveaway under $5, between $5–$9.99, or over
$10 occurred, whether a t-shirt giveaway occurred, whether a group or ticket discount was
offered, whether a special event occurred, how many special events (1,2,3 or more), and how
many promotions occurred in the same game (zero, one, two or three promotions).
Table 3
Promotional strategies frequencies
Gender
Women Male
N % N %
No Promotion Promo 246 80.4% 231 69.0%
No Promo 60 19.6% 104 31.0%
Giveaway under $5 No 226 73.9% 294 87.8%
Yes 80 26.1% 41 12.2%
Giveaway $5–$9.99 No 294 96.1% 313 93.4%
Yes 12 3.9% 22 6.6%
Giveaway over $10 No 298 97.4% 325 97.0%
Yes 8 2.6% 10 3.0%
T-Shirt Giveaway No 285 93.1% 310 92.5%
Yes 21 6.9% 25 7.5%
Group Discount No 273 89.2% 311 92.8%
Yes 33 10.8% 24 7.2%
Ticket discount No 234 76.5% 300 89.6%
Yes 72 23.5% 35 10.4%
Special Events No 140 45.8% 187 55.8%
Yes 166 54.2% 148 44.2%
# Special Events
1 event 77 46.4% 93 62.8%
2 events 45 27.1% 33 22.3%
3 or more 44 26.5% 22 14.9%
# Promotions
None 60 19.6% 104 31.0%
1 promotion 137 44.8% 171 51.0%
2 promotions 77 25.2% 47 14.0%
3 promotions 32 10.5% 13 3.9%
Hypotheses Testing
Four hypotheses were tested to address the purpose of the study; to explore how
promotional incentives effect college basketball attendance. Half of those hypotheses tested
women games and half tested men games. The hypotheses were tested using multiple linear

23
regressions.
Hypothesis One
The first hypothesis stated that promotional strategies would not significantly (p > .05)
predict attendance at Power Five conference basketball games for women. The null hypothesis
was tested by calculating a multiple linear regression to determine if there were promotional
strategies that significantly predicted attendance based on the promotions: no promotion,
giveaway under $5, giveaway between $5–$10, giveaway over $10, t-shirt giveaway, group
discount, ticket discount, and special event. The results of the linear regression equation
calculations for women are presented in Table 4 and Table 5.
For women games, a multiple linear regression was calculated to predict attendance
based on the eight promotional strategies. A significant regression equation was found (F
(8,297) = 5.511, p < .000, R2 = .129, R2Adjusted = .106). Attendance based on promotions offered
predicted weight is equal to 22.122 + 8.811, 8.073, 8.510 (giveaway under $5, t-shirt giveaway,
and group discount) when promotions effect attendance. The analysis shows attendance would
increase 8.81% for each giveaway under $5, 8.07% for each t-shirt giveaway, and 8.51% for
each group discount.
Table 4
ANOVA results for promotional strategies at women games
Model Sum of Squares df Mean Square F Sig.
Regression 14257.824 8 1782.228 5.511 .000c
Residual 96052.816 297 323.410
Total 110310.640 305
a. Dependent Variable: % capacity
b. Selecting only cases for which Gender = Women
c. Predictors: (Constant), Special Event, T-Shirt Giveaway, Ticket discount,
Giveaway under $5, Giveaway over $10, Giveaway $5–$9.99, Group Discount, No
Promotion

24
The ANOVA table for women games indicates there was a significant difference (p <
.05) in attendance among promotional categories. Therefore, one or more promotional strategies
significantly affected attendance.
Table 5
Coefficient results for promotional strategies at women games
Model
Unstandardized Coefficients
Standardized
Coefficients
Sig. B Std. Error Beta t
(Constant)
No Promotion
Giveaway
under $5
Giveaway
$5–$9.99
Giveaway over $10
T-Shirt Giveaway
Group Discount
Ticket discount
Special Event
22.122 2.803 7.894 .000
-1.790 3.639 -.037 -.492 .623
8.811 2.567 .204 3.433 .001
3.658 5.371 .037 .681 .496
-2.736 6.618 -.023 -.413 .680
8.073 4.151 .108 1.945 .053
8.510 3.468 .139 2.454 .015
3.246 2.649 .073 1.225 .221
4.702 2.621 .123 1.794 .074
a. Dependent Variable: % capacity
b. Selecting only cases for which Gender = Women
Hypothesis Two
The second hypothesis stated that promotional strategies would not significantly (p > .05)
predict attendance at Power Five conference basketball games for men. The null hypothesis was
tested by calculating a multiple linear regression to determine if there were promotional
strategies that significantly predicted attendance based on the promotions: no promotion,
giveaway under $5, giveaway between $5–$10, giveaway over $10, t-shirt giveaway, group
discount, ticket discount, and special event. The results of the linear regression equation
calculations for men are presented in Table 6 and Table 7.
For men games a multiple linear regression was calculated to predict attendance based on
the eight promotional strategies. A significant regression equation was found (F (8,326) = 2.976,

25
p < .003, R2 = .068, R2Adjusted = .045). Attendance based on promotions offered predicted weight
is equal to 81.938-8.247, -11.882 (giveaway under $5, and ticket discount) when promotions
effect attendance. The analysis shows attendance would decrease 8.25% for each giveaway
under $5, and 11.88% for each ticket discount.
Table 6
ANOVA results for promotional strategies at men games
Model Sum of Squares df Mean Square F Sig.
Regression 10506.136 8 1313.267 2.976 .003c
Residual 143848.402 326 441.253
Total 154354.538 334
a. Dependent Variable: % capacity
b. Selecting only cases for which Gender = Male
c. Predictors: (Constant), Special Event, Giveaway under $5, Giveaway $5–$9.99, Group
Discount, Giveaway over $10, T-Shirt Giveaway, Ticket discount, No Promotion
The ANOVA table for men games indicates there was a significant difference (p < .05) in
attendance among promotional categories. Therefore, one or more promotional strategies
significantly affected attendance.
Table 7
Coefficient results for promotional strategies at men games
Model
Unstandardized Coefficients Standardized
Coefficients
t Sig. B Std. Error Beta
(Constant) 81.938 3.576 22.913 .000
No Promotion -6.994 4.127 -.151 -1.695 .091
Giveaway
under $5 -8.247 3.808 -.126 -2.165 .031
Giveaway
$5–$9.99 -5.619 4.793 -.065 -1.172 .242
Giveaway over $10 3.778 6.891 .030 .548 .584
T-Shirt Giveaway -.066 4.720 -.001 -.014 .989
Group Discount -7.986 4.767 -.096 -1.675 .095
Ticket discount -11.882 4.302 -.169 -2.762 .006
Special Event 2.176 3.387 .050 .642 .521
a. Dependent Variable: % capacity
b. Selecting only cases for which Gender = Male

26
Hypothesis Three
The third hypothesis stated that several covariate predictors would not significantly (p >
.05) predict attendance at Power Five conference basketball games for women. The null
hypothesis was tested by calculating a multiple linear regression to determine if there were
covariate predictors that significantly predicted attendance based on the covariates: weekend or
weekday game, before or after 5pm game, conference game, holiday break game, home team
winning percentage, away team winning percentage, outside temperature, and day of game
precipitation. The following promotional categories were included as well: no promotion,
giveaway under $5, giveaway between $5–$10, giveaway over $10, t-shirt giveaway, group
discount, ticket discount, and special event. The results of the linear regression equation
calculations for women are presented in Table 8 and Table 9.
For women games a multiple linear regression was calculated to predict attendance based
on the eight covariate predictors. A significant regression equation was found (F (16,289) =
3.930, p < .000, R2 = .179, R2Adjusted = .133). Attendance based on covariates present predicted
weight is equal to 14.735 + 5.652, 0.135, and -5.684 (conference game, home team winning
percentage, and night game) when covariates effect attendance. The analysis shows attendance
would increase 5.65% for conference games, 0.14% for each percentage point increase in home
team winning percentage, and decrease 5.68% for night games.
Table 8
ANOVA results for promotional strategies/covariates at women games
Model Sum of Squares df Mean Square F Sig.
Regression 19710.719 16 1231.920 3.930 .000c
Residual 90599.921 289 313.495
Total 110310.640 305
a. Dependent Variable: % capacity
b. Selecting only cases for which Gender = Women

27
c. Predictors: (Constant), Precipitation, Giveaway $5–$9.99, Giveaway under $5, T Shirt
Giveaway, Ticket discount, Giveaway over $10, holiday Break, Away team Winning %, Night
Game, Group Discount, Home team Winning %, Special Event, Temperature, Conference Game,
Weekend game, No Promotion
The ANOVA table for women games indicates there was a significant difference (p <
.05) in attendance among covariate predictors. Therefore, one or more covariate predictors
significantly affected attendance.
Table 9
Coefficient results for promotional strategies/covariates at women games
Model Unstandardized Coefficients Standardized
Coefficients
t Sig. B Std. Error Beta
(Constant) 14.735 6.510 2.264 .024
No Promotion -1.705 3.660 -.036 -.466 .642
Giveaway
under $5 9.429 2.616 .218 3.605 .000
Giveaway
$5–$9.99 4.858 5.327 .050 .912 .363
Giveaway over $10 -1.113 6.605 -.009 -.169 .866
T-Shirt Giveaway 7.627 4.170 .102 1.829 .068
Group Discount 7.372 3.469 .120 2.125 .034
Ticket discount 3.784 2.635 .085 1.436 .152
Special event 4.339 2.664 .114 1.629 .104
Weekend game -4.947 2.611 -.130 -1.895 .059
Night Game -5.684 2.596 -.148 -2.189 .029
Conference Game 5.652 2.485 .147 2.274 .024
Holiday Break -1.864 2.453 -.043 -.760 .448
Home team
Winning % .135 .046 .171 2.924 .004
Away team
Winning % -.039 .041 -.058 -.941 .347
Temperature .074 .083 .053 .901 .368
Precipitation -.117 2.927 -.002 -.040 .968
a. Dependent Variable: % capacity
b. Selecting only cases for which Gender = Women
Hypothesis Four
The fourth hypothesis stated that covariate predictors would not significantly (p > .05)

28
predict attendance at Power Five conference basketball games for men. The null hypothesis was
tested by calculating a multiple linear regression to determine if there were covariate predictors
that significantly predicted attendance based on the covariates: weekend game, night game,
conference game, holiday break game, home team winning percentage, away team winning
percentage, temperature, and precipitation. The following promotional categories were included
as well: no promotion, giveaway under $5, giveaway between $5–$10, giveaway over $10, t-
shirt giveaway, group discount, ticket discount, and special event. The results of the linear
regression equation calculations for men are presented in Table 10 and Table 11.
For men games a multiple linear regression was calculated to predict attendance based on
the eight covariate predictors. A significant regression equation was found (F (16,318) = 7.091,
p < .000, R2 = .263, R2Adjusted = .226). Attendance based on the covariates present predicted
weight is equal to 86.530 + 8.578, 8.215 and -0.447 (conference game, weekend game, and
temperature) when covariates effect attendance. The analysis shows attendance would increase
8.56% for conference games, 8.22% for weekend games, and decrease 0.45% for each degree the
temperature decreases.
Table 10
ANOVA results for promotional strategies/covariates at men games
Model Sum of Squares df Mean Square F Sig.
Regression 40587.994 16 2536.750 7.091 .000c
Residual 113766.544 318 357.756
Total 154354.538 334
a. Dependent Variable: % capacity
b. Selecting only cases for which Gender = Male
c. Predictors: (Constant), Precipitation, T-Shirt Giveaway, Special Event, Night Game,
Giveaway $5–$9.99, Giveaway under $5, Giveaway over $10, Ticket discount, Away team
Winning %, Holiday Break, Temperature, Group Discount, Home team Winning %, Conference
Game, Weekend game, No Promotion
The ANOVA table for men games indicates there was a significant difference (p < .05) in
attendance among covariate predictors. Therefore, one or more covariate predictor significantly

29
affected attendance.
Table 11
Coefficient results for promotional strategies/covariates at men games
Model Unstandardized
Coefficients Standardized Coefficients
t Sig. B Std. Error Beta
(Constant) 86.530 7.609 11.373 .000
No Promotion -3.314 3.777 -.071 -.877 .381
Giveaway
under $5 -3.094 3.624 -.047 -.854 .394
Giveaway
$5–$9.99 -6.092 4.400 -.070 -1.384 .167
Giveaway over $10 6.846 6.259 .054 1.094 .275
T-Shirt Giveaway 2.222 4.320 .027 .514 .607
Group Discount -9.100 4.492 -.109 -2.026 .044
Ticket discount -6.231 4.020 -.089 -1.550 .122
Special Event 1.552 3.080 .036 .504 .615
Weekend game 8.215 2.631 .191 3.122 .002
Night Game -1.935 2.915 -.040 -.664 .507
Conference Game 8.578 2.499 .199 3.433 .001
Holiday Break .536 2.617 .011 .205 .838
Home team
Winning % .065 .048 .074 1.360 .175
Away team
Winning % .029 .043 .038 .688 .492
Temperature -.447 .084 -.281 -5.318 .000
Precipitation .786 3.664 .011 .215 .830
a. Dependent Variable: % capacity
b. Selecting only cases for which Gender = Male
Sub-Objective
The first part sub-objective of the study was to determine if there were any significant
segments emerge based on the groupings of various promotions that can be implemented by
collegiate sport marketing personnel to increase attendance at basketball contests at women
games. A Hierarchal Cluster Analysis was calculated to illuminate possible groupings occurring
within the promotional strategies using the attendance dependent variable of the study, results are
found in Figure 2, Appendix B.
30
For women games a three group cluster emerged indicating special events as the main
characteristic separating clusters. Group one, the “rivalry weekend extravaganza” group,
accounted for 39% of the total women games, and had a special event 81% of the time. This
group also typically occurred during the day on a weekend throughout the conference schedule.
T-shirt giveaways and giveaways under $5 were common in this group. Group four, the “after
work special” group, accounted for 34% of the total women games, and had a special event 55%
of the time. Games in this group were primarily played at night Monday through Thursday, and
consistently offered ticket discounts. The sixth group, the “lost causes” group, accounted for
56% of the total women games, and had a special event 0% of the time. Games in this group
were primarily played during the non-conference schedule over Holiday break and many times
did not even offer a promotion. The Hierarchal Cluster Analysis is presented in Figure 2,
Appendix B.
The second part of the sub-objective of the study was to determine if there are any
significant groupings of promotions that can be implemented by collegiate sport marketing
personnel to increase attendance at men’s basketball games. A Hierarchal Cluster Analysis was
calculated to illuminate possible groupings occurring within the promotional strategies using the
attendance dependent variable of the study.
For men games a four group cluster emerged indicating conference games as the main
characteristic separating clusters. Group one, the “weekday t-shirt” group, accounted for 22% of
the total men games, and had a special event 43% of the time. Games in this group relied on t-
shirt giveaways during weekday conference games to and gather a crowd. Group two, the
“November cheap giveaway night” group, accounted for 6% of the total men games, and had a
special event 33% of the time. Games in this group occurred primarily during the non-

31
conference schedule at night, and utilized giveaways under $5. The third group, the “special
conference games” group, accounted for 56% of the total men games, and had a special event
49% of the time. Games in this group more often than not put on a special event that coincided
with a conference game. The fourth group, the “group games” group, accounted for 12% of the
total men games, and had a special event 41% of the time. Games in this group focused on
group discounts and non-conference games to drive attendance. The Hierarchal Cluster Analysis
is presented in Figure 2, Appendix D.

32
CHAPTER V
CONCLUSIONS, DISCUSSIONS AND RECOMMENDATIONS
The purpose of this study was to explore the effects of promotional incentives on
attendance at college basketball games. The sub-objectives of the study were to identify what
promotional strategies best predict increased attendance at college basketball games, and see if
there are any significant groupings of promotions that can be implemented by collegiate sport
marketing personnel to increase attendance at college basketball contests. Data was collected
and analyzed by ANOVA and multiple linear regressions to determine whether to reject or fail to
reject the null hypotheses and to discover significant predictors and relationships between
dependent and independent variables. A cluster analysis was built to give greater insight into the
promotional effects. The intent of this chapter is to present conclusions and discussions of this
data with respect to the profile of the sample, hypotheses, and sub-objectives of the study.
Recommendations for future research will conclude this chapter.
Conclusions
Hypothesis One
The first null hypothesis stated that promotional strategies will not significantly (p > .05)
predict attendance at Power Five conference basketball games for women. A multiple linear
regression was calculated to determine if there were promotional strategies that significantly
predicted attendance based on the promotional categories: no promotion, giveaway under $5,
giveaway between $5–$10, giveaway over $10, t-shirt giveaway, group discount, ticket discount,
33
and special events. For women games, significant (p > .05) predictors of attendance were found
in promotional strategies: giveaway under $5 (p = .001), t-shirt giveaway (p = .053), and group
discount (p = .015). For women games, hypothesis one results support rejecting the null
hypothesis. The results showed that attendance increased 8.81% for each giveaway under $5,
8.07% for each t-shirt giveaway, and 8.51% for each group discount.
Hypothesis Two
The second null hypothesis stated that promotional strategies will not significantly (p >
.05) predict attendance at men games from the Power Five conference basketball leagues. A
multiple linear regression was calculated to determine if there were promotional strategies that
significantly predicted attendance based on the promotional categories: no promotion, giveaway
under $5, giveaway between $5–$10, giveaway over $10, t-shirt giveaway, group discount, ticket
discount, and special event. For men games, significant predictors of attendance were found in
promotional strategies: ticket discount (p = .006), and giveaway under $5 (p = .031). For men
games, hypothesis two results support rejecting the null hypothesis. The results showed that
attendance decreased 8.25% for each giveaway under $5, and 11.88% for each ticket discount.
Hypothesis Three
The third null hypothesis stated that covariate predictors will not significantly (p > .05)
predict attendance at Power Five conference basketball games for women. A multiple linear
regression was calculated to determine if there were covariate predictors that significantly
predicted an increase in attendance based on covariates: weekend game, night game, conference
game, holiday break game, home team winning percentage, away team winning percentage,
temperature, and precipitation. The following promotional categories were included as well: no
promotion, giveaway under $5, giveaway between $5–$10, giveaway over $10, t-shirt giveaway,

34
group discount, ticket discount, and special event. For women games, significant predictors of
attendance were found in multiple covariate factors: conference game (p = .024), night game (p =
.029), and home team winning percentage (p = .004). For women games, hypothesis three
results support rejecting the null hypothesis. The results showed attendance increased 5.65% for
conference games, 0.14% for each percentage point increase in home team winning percentage,
and decreased 5.68% for night games.
Hypothesis Four
The second null hypothesis stated that covariate factors will not significantly (p > .05)
predict attendance at Power Five conference basketball games for men. A multiple linear
regression was calculated to determine if there were covariate predictors that significantly
predicted an increase in attendance based on covariates: weekend game, night game, conference
game, holiday break game, home team winning percentage, away team winning percentage,
temperature, and precipitation. The following promotional categories were included as well: no
promotion, giveaway under $5, giveaway between $5–$10, giveaway over $10, t-shirt giveaway,
group discount, ticket discount, and special event. For men games, significant predictors of
attendance were found in multiple covariate factors: conference game (p = .001), weekend game
(p = .002), and temperature (p = .000). For men games, hypothesis four results support rejecting
the null hypothesis. The results showed attendance increased 8.56% for conference games,
8.22% for weekend games, and decreased 0.45% for each degree the temperature decreases.
Sub-Objective
The sub-objective of the study was to determine if distinct market segments
emerge based on the promotional efforts measured for men and women.
For women games a three group cluster emerged indicating special events as the main
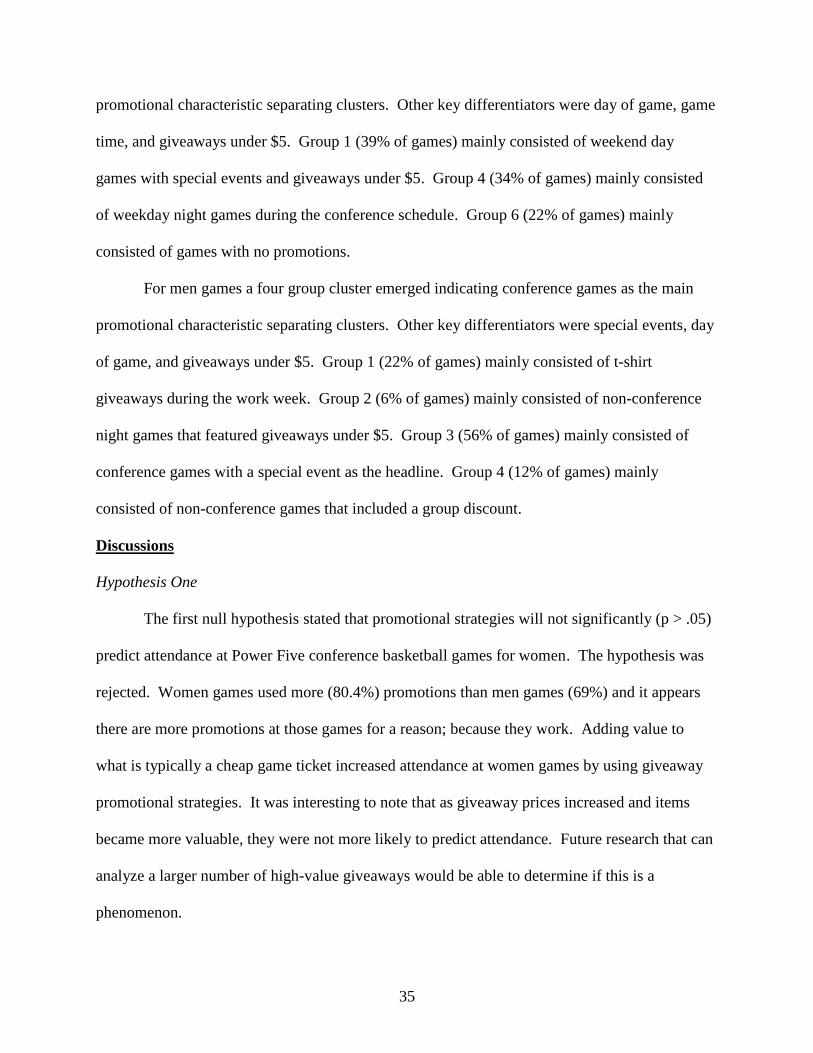
35
promotional characteristic separating clusters. Other key differentiators were day of game, game
time, and giveaways under $5. Group 1 (39% of games) mainly consisted of weekend day
games with special events and giveaways under $5. Group 4 (34% of games) mainly consisted
of weekday night games during the conference schedule. Group 6 (22% of games) mainly
consisted of games with no promotions.
For men games a four group cluster emerged indicating conference games as the main
promotional characteristic separating clusters. Other key differentiators were special events, day
of game, and giveaways under $5. Group 1 (22% of games) mainly consisted of t-shirt
giveaways during the work week. Group 2 (6% of games) mainly consisted of non-conference
night games that featured giveaways under $5. Group 3 (56% of games) mainly consisted of
conference games with a special event as the headline. Group 4 (12% of games) mainly
consisted of non-conference games that included a group discount.
Discussions
Hypothesis One
The first null hypothesis stated that promotional strategies will not significantly (p > .05)
predict attendance at Power Five conference basketball games for women. The hypothesis was
rejected. Women games used more (80.4%) promotions than men games (69%) and it appears
there are more promotions at those games for a reason; because they work. Adding value to
what is typically a cheap game ticket increased attendance at women games by using giveaway
promotional strategies. It was interesting to note that as giveaway prices increased and items
became more valuable, they were not more likely to predict attendance. Future research that can
analyze a larger number of high-value giveaways would be able to determine if this is a
phenomenon.

36
Hypothesis Two
The second null hypothesis stated that promotional strategies will not significantly (p >
.05) predict attendance at Power Five conference basketball games for men. The hypothesis was
rejected. For men games the only predictors were negative. While ticket discount and
giveaways under $5 were significant promotional strategies, they had a negative impact on
attendance. One reason ticket discounts might be associated with a negative attendance figure is
because teams typically slash ticket prices and offer discounts for games that are less desirable.
The same can be said for giving away cheap inanimate objects at the door. Whether these less
desirable games see effects from year to year is a different matter and would be worth looking
into in future research.
Hypothesis Three
The third null hypothesis stated that covariate predictors will not significantly (p > .05)
predict attendance at Power Five conference basketball games for women. The hypothesis was
rejected. Statistical analysis of women’s games found conference games as a predictor for
increased attendance. This result was not surprising due to the familiarity fans have with teams
on the conference schedule. These conference teams can also contain in-state and geographical
rivals. Women night games were a negative predictor. This could be because of the tendency
for night games to be played during the work week where people tend to have less leisure time.
Home team winning percentage was determined to be a predictor for increased home attendance.
Hypothesis Four
The fourth null hypothesis stated that covariate predictors will not significantly (p > .05)
predict attendance at Power Five conference basketball games for men. The hypothesis was
rejected. Men games found conference games as a predictor for increased attendance. This
37
result was not surprising due to the familiarity fans have with teams on the conference schedule.
These conference teams can also contain in-state and geographical rivals. Analysis of men’s
games found weekend game as a predictor for increased attendance. This result was not
surprising due to the extra free time weekends provide people to attend sporting events.
Sub-Objective
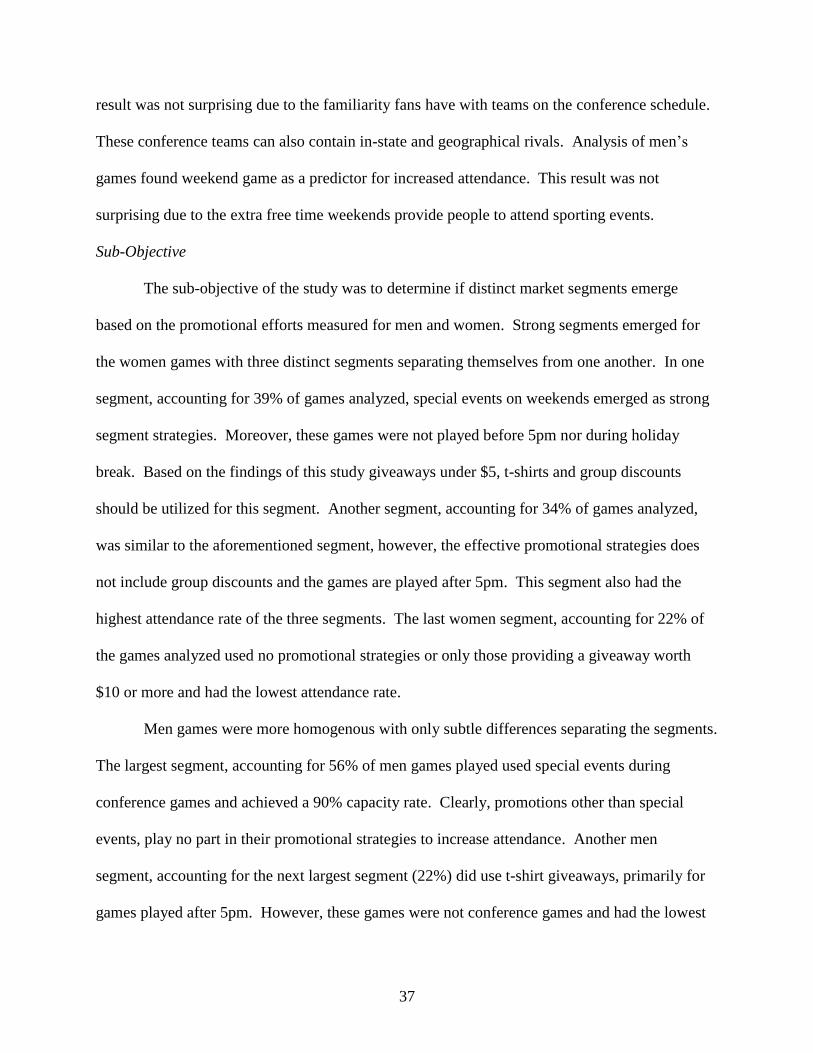
The sub-objective of the study was to determine if distinct market segments emerge
based on the promotional efforts measured for men and women. Strong segments emerged for
the women games with three distinct segments separating themselves from one another. In one
segment, accounting for 39% of games analyzed, special events on weekends emerged as strong
segment strategies. Moreover, these games were not played before 5pm nor during holiday
break. Based on the findings of this study giveaways under $5, t-shirts and group discounts
should be utilized for this segment. Another segment, accounting for 34% of games analyzed,
was similar to the aforementioned segment, however, the effective promotional strategies does
not include group discounts and the games are played after 5pm. This segment also had the
highest attendance rate of the three segments. The last women segment, accounting for 22% of
the games analyzed used no promotional strategies or only those providing a giveaway worth
$10 or more and had the lowest attendance rate.
Men games were more homogenous with only subtle differences separating the segments.
The largest segment, accounting for 56% of men games played used special events during
conference games and achieved a 90% capacity rate. Clearly, promotions other than special
events, play no part in their promotional strategies to increase attendance. Another men
segment, accounting for the next largest segment (22%) did use t-shirt giveaways, primarily for
games played after 5pm. However, these games were not conference games and had the lowest

38
attendance rate of any segment (51%). Being a conference game appears to be the most
significant factor effecting attendance and promotional strategies used for games with lower
attendance rates. In fact, the results support not providing promotions, other than special events,
as there is an inverse relationship between promotions offered and increased attendance.
Limitations
There were several limitations placed on this research. This section will discuss these
limitations and how they affected the study and results.
This study was limited to Power Five college basketball games played during the 2015-
16 regular season. Due to the timing of this study this was the only year where data was
available. This study was also limited to the promotional information that was available online
via team’s official promotional calendars. Whether or not teams adhered to the advertised
promotional calendar is unknown. Of the 65 schools affiliated with Power Five conferences only
31% were analyzed, making it difficult to generalize the results. The valuation of promotional
giveaway items was based on a previous study (Kuruvilla, & Ebel, 2011) that determined
perceived value. This method of valuation was imperfect. During the data collection process,
the special events promotional strategy was further delineated by the number of special events
during a game. This delineation technique proved to be ineffective and was not useful in
predicting attendance.
Recommendations
The following recommendations are based on the results of the study. All
recommendations illuminate how the measure of attendance and the effects of the independent
variables add to increasing attendance at Power Five college basketball games.
The purpose of this study was to determine the effect promotional strategies have on

39
basketball game day attendance in Power Five conferences. This study was also done to aid
athletic marketing directors in their decision making process regarding promotional scheduling.
The results of this study could be used to help athletic marketing directors increase attendance at
college basketball games more effectively. In turn, increased attendance will lead to more
revenue, fuller looking stadiums to recruits, and a more impactful home court advantage.
Future research in the field of athletic promotion strategies should examine how
promotional incentives affect fan experience. It was impossible to test in this research whether
or not promotions had a positive impact outside of an increased attendance figure. Whether or
not giveaways or special events resonate with fans on a deeper level after leaving the arena could
justify the money spent on promotions and lead to different motivations besides increasing the
attendance. A better method of valuation for giveaway items could also be looked at to improve
future research. Devising a survey to administer to selected schools marketing directors would
provide a more accurate valuation of giveaway items. Finally, a more effective means to
delineate the special event promotional strategy would be useful in future studies. Rather than
using the number of special events in defining each sub-category, specific groupings such as
halftime show, team/fan interaction, or student focused event, could serve as new promotional
strategies.
The ability to look at more schools to compile a larger pool of data would also be
interesting to look at in future research. These results focused on the Power Five conferences
may not be indicative to other conferences, and in fact, the results suggest there would be
differences in smaller conferences or collegiate conferences at different levels.

40
REFERENCES

41
Armstrong, K. L. (2008). Consumers of Color and the "Culture" of Sport Attendance:
Exploratory Insights. Sport Marketing Quarterly, 17(4), 218-231.
Ballard, C. (2013). Into The Belly Of Beast Mode. Sports Illustrated, 119(19), 60
Boyd, T. C., & Krehbiel, T. C. (2006). An Analysis of the Effects of Specific Promotion Types
on Attendance at Major League Baseball Games. Mid-American Journal of
Business, 21(2), 21-32.
Boyd, T.C. & Krehbiel, T.C. (2003). Promotion timing in Major League Baseball and the
stacking effects of factors that increase game attractiveness. Sports Marketing Quarterly,
12, 173-183.
Browning, R. A., & DeBolt, L. S. (2007). The Effects of Promotions on Attendance in
Professional Baseball. The Sport Journal, 10(3).
Bush, C. J. (2014). The Legal Shift Of The NCAA's "Big 5" Member Conferences To
Independent Athletic Associations: Combining NFL And Conference Governance
Principles To Maintain The Unique Product Of College Athletics. University Of Denver
Sports & Entertainment Law Journal, 165-49.
Cebula, R., Coombs, C., Lawson, L., & Foley, M. (2013). The Impacts of Promotions/Marketing,
Scheduling, and Economic Factors on Total Gross Revenues for Minor League Baseball
Teams. International Advances In Economic Research, 19(3), 249-257.
doi:10.1007/s11294-013-9417-0
Cooper, C. G. (2015). Ventures in Visionary Marketing. Journal of Applied Sport Management.
7(1), 68-82.
DeGaris, L. (2008). Sport marketing consulting strategies and tactics: bridging the academy and
the practice. Sport Management International Journal, 4(2), 11-20.
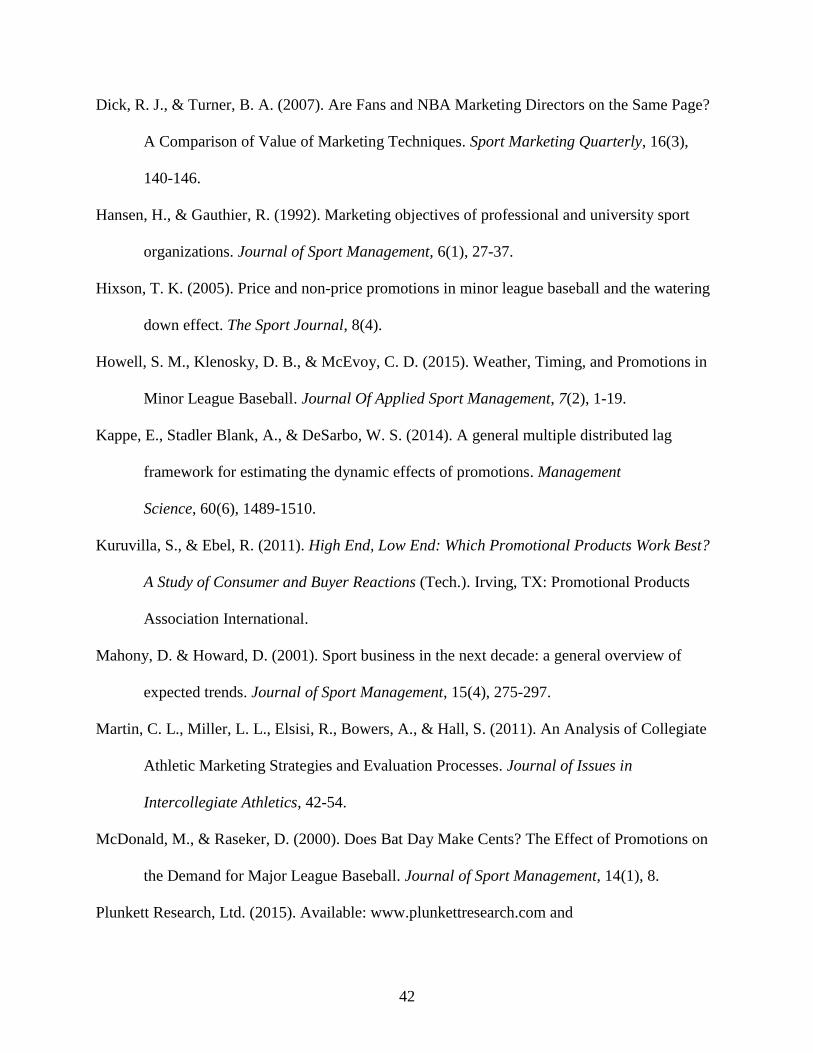
42
Dick, R. J., & Turner, B. A. (2007). Are Fans and NBA Marketing Directors on the Same Page?
A Comparison of Value of Marketing Techniques. Sport Marketing Quarterly, 16(3),
140-146.
Hansen, H., & Gauthier, R. (1992). Marketing objectives of professional and university sport
organizations. Journal of Sport Management, 6(1), 27-37.
Hixson, T. K. (2005). Price and non-price promotions in minor league baseball and the watering
down effect. The Sport Journal, 8(4).
Howell, S. M., Klenosky, D. B., & McEvoy, C. D. (2015). Weather, Timing, and Promotions in
Minor League Baseball. Journal Of Applied Sport Management, 7(2), 1-19.
Kappe, E., Stadler Blank, A., & DeSarbo, W. S. (2014). A general multiple distributed lag
framework for estimating the dynamic effects of promotions. Management
Science, 60(6), 1489-1510.
Kuruvilla, S., & Ebel, R. (2011). High End, Low End: Which Promotional Products Work Best?
A Study of Consumer and Buyer Reactions (Tech.). Irving, TX: Promotional Products
Association International.
Mahony, D. & Howard, D. (2001). Sport business in the next decade: a general overview of
expected trends. Journal of Sport Management, 15(4), 275-297.
Martin, C. L., Miller, L. L., Elsisi, R., Bowers, A., & Hall, S. (2011). An Analysis of Collegiate
Athletic Marketing Strategies and Evaluation Processes. Journal of Issues in
Intercollegiate Athletics, 42-54.
McDonald, M., & Raseker, D. (2000). Does Bat Day Make Cents? The Effect of Promotions on
the Demand for Major League Baseball. Journal of Sport Management, 14(1), 8.
Plunkett Research, Ltd. (2015). Available: www.plunkettresearch.com and

43
https://www.plunkettresearch.com/statistics/sports-industry/
Rosner, D. (1989). The world plays catch-up. Sports, Inc., 6-13.
Trail, G. T., & Yu, K. K. (2011). Factors influencing spectator sports consumption: NCAA
women's college basketball. International Journal of Sports Marketing &
Sponsorship, 13(1), 60-82.
Watkins, P. (2012). Revisiting the Home Court Advantage in College Basketball. International
Journal of Sport & Society, 3(1), 33-42.

44
APPENDICES

45
APPENDIX A

46
Average Linkage (Between Segments) – Women Cluster
Frequency Percent Valid Percent Cumulative
Percent
Valid
1 120 18.7 39.2 39.2
2 2 .3 .7 39.9
3 11 1.7 3.6 43.5
4 105 16.4 34.3 77.8
5 2 .3 .7 78.4
6 66 10.3 21.6 100.0
Total 306 47.7 100.0
Missing System 335 52.3
Total 641 100.0

47
APPENDIX B

48

49
APPENDIX C

50
Average Linkage (Between Segments) – Men Cluster
Frequency Percent Valid Percent Cumulative
Percent
Valid
1 75 11.7 22.4 22.4
2 21 3.3 6.3 28.7
3 187 29.2 55.8 84.5
4 39 6.1 11.6 96.1
5 12 1.9 3.6 99.7
6 1 .2 .3 100.0
Total 335 52.3 100.0
Missing System 306 47.7
Total 641 100.0

51
APPENDIX D

52

53
VITA
ALEXANDER R. CRAMER
Oxford, MS Department of Health, Exercise Science, and Recreation Management
EDUCATION
M.A., Recreation Administration, University of Mississippi, August 2016
Thesis: The Effects Promotional Incentives have on College Basketball
Attendance in Power Five Conferences
B.S., Business, University of Colorado-Colorado Springs, May 2014
Emphasis: Sport Management
Minor: Military Science
TEACHING EXPERIENCE
Graduate Instructor, 2016
University of Mississippi
Courses: Racquetball, Tennis
PROFESSIONAL EXPERIENCE
Assistant Manager of Game Presentation, 2016 – Present
Arizona State Athletics
Human Resources Officer, 2012 – Present
United States Army Reserve
Marketing & Fan Experience Graduate Assistant, 2014 – 2016
Ole Miss Athletics
Sports Information Assistant, 2011 – 2014
UCCS Athletics
Marketing & Development Intern, 2010 – 2011
Air Force Athletics
HONORS
NACMA Convention Mike Cleary Stipend Recipient, 2016
IMG Intercollegiate Athletics Forum Scholarship, 2015