the eflex project - antropologerne€¦ · distribution company under dong energy a/s, carried out...
TRANSCRIPT

DEMAND RESPONSE
The eFlex Project


eFle
xTABLE OF CONTENTS
0 Executive Summary 5
01 Background 9
02 The eFlex Project 112.1 Targeting the Problem 112.2 Electricity Price and Flexibility 112.3 The Customers 132.4 Technical set-up 142.5 Support 152.6 PODIO; A Social Platform 152.7 Implementation 152.8 Regulatory Permission 15
03 Customer and Technology 173.1 Organisation 173.2 eFlex and the internal communication 183.3 Support 183.4 Technology handling from the Project perspective 20
04 Customer Behaviour Study 214.1 Method 214.2 Domestication of Technology 214.3 Moral Economy 224.4 Price as Control Signal 234.5 Feedback and Control 244.6 User Pro!les 254.7 A Model for the Study of Flexibility 314.8 Communication 324.9 Conclusion on Behavioural Change 34
05 Measurements and analysis 355.1 Customer preferences 35
5.1.1 Method of calculation 355.1.2 Results 355.1.3 Conclusion – customer preferences 36
5.2 Flexibility, interruptibility and duty cycle for heat pumps 375.2.1 Data and data quality 375.2.2 Flexibility 385.2.3 Flexibility results 405.2.4 Conclusion – Flexibility 415.2.5 Interruptibility 415.2.6 Interruptibility results 415.2.7 Conclusion - Interruptibility 43

5.2.8 Duty Cycle 445.2.9 Duty cycle results 44
5.3 Grid impact based on load studies for three 10 kV feeders 455.3.1 Calculation set-up 465.3.2 Grid load shedding impact on NYM13 475.3.3 Grid load shedding impact on GLN16 475.3.4 Grid load shedding impact on HOL02 495.3.5 Load shedding through portfolio management control of heat pumps 495.3.6 Conclusion 51
5.4 Peaks having of residential customers load pro!le 525.4.1 Conclusion 54
5.5 Financial Bene!ts for the Customer 545.6 Conclusion 57
06 Lessons Learned and conclusion 596.1 Perspectives 61
07 Appendix A 637.1 Correlation Studies 637.2 Elspot price and grid tariff 64
7.2.1 Load and grid tariff 657.2.2 Load and overall price 667.2.3 Wind energy and overall price 677.2.4 Load and wind energy 687.2.5 Summary 70
eFle
x
Published by:DONG Energy Eldistribution A/SDepartment of Grid Strategy
Teknikerbyen 252830 VirumPhone +45 99 55 57 77www.dongenergy.com
November 2012

5Executive Summary
EXECUTIVE SUMMARY
Flexible consumers are a corner stone in a smart energy system where resources are utilized more efficiently – from the production assets, through the grid and to the customer. Realiz-ing a smart energy system where flexible consumers adjust their energy consumption ac-cording to the grid load, could improve the economics of introducing electric vehicles and heat pumps. Through incentives (of some type) could a postponement of investments in new grid capacity be achieve.
Understanding the dynamics of customers’ flexibility is essential for realising such a smart energy system in which distribution companies can rely on flexibility.
To advance the understanding of consumer flexibility, DONG Energy Eldistribution A/S, the distribution company under DONG Energy A/S, carried out the eFlex project during the period from the summer of 2011 to the summer of 2012. The purpose of the project was to investigating, what incentives could be applied to make private households participate in load shedding in the distribution grid. The project included 119 households located in the DONG Energy supply area in North Zealand and Copenhagen, Denmark. The majority of the participating customers have heat pumps. Over time, the grid load that appears from the many heat pumps is expected to increase the load toward the grid’s capacity limit. However, heat pumps also bear a flexibility potential and could thus contribute to load shedding.
Technical setupThe customers volunteered for the project and were found partly through an advertising campaign and partly through expression of interest in a public subsidy scheme for switching from oil-fired burners to heat pumps.
The customers were provided with a home automation system with an integrated control unit to interrupt the heat pump from operating during peak periods. The home automation system in parallel offered the customers the opportunity to closely monitor the energy con-sumption of various appliances in the house and in addition to control them by means of an ordinary time scheme control. Furthermore, the customers were invited to share experiences and get support on a social media, Podio. The aim with the latter two features was to raise interest in energy consumption.
The heat pumps were interrupted according to a price control scheme. The price was a com-bination of a spot market price, settled on North Pool day-a-head electricity market, a 3-step grid tariff and the regular public service obligation and tax fees. The price control scheme interrupted the heat pumps during price peak periods and released them to ordinary opera-tion when prices decreased again. The control was made possible by a home automation system with an integrated control unit. The system also gave the customers an opportunity to monitor the consumption on other appliances and program these to switch on and off according to a timer.
Drivers of flexible consumptionDuring the project period an anthropological study of user behaviour was carried out. The project developed five different user profiles, each characterised by a set of (partly overlap-ping) motivation drivers or incentives. These profiles showed, that although customers par-ticipated in the project on equal terms, they did so with different motives.
The opportunity for achieving financial savings through being flexible was one incentive that was investigated in the project. The project also showed that some customers engaged in the project first and foremost due to their interest in new technology (e.g. the home automa-

6 Executive Summary
eFle
x tion system) and the opportunities this would provide. A simple personal drive for optimis-ing resource consumption vis-a-vis avoiding a loss (irrespective of the lack of reasonable balance between effort and savings) also showed to be an important incentive for many participants along with the opportunities for learning. One of the most important incentives showed out to be a concern for the climate change or environmental effects of energy con-sumption. In such cases, customers perceived the price control scheme as a required feature in the future energy system, in order to enable large amount of wind energy.
The report describes the five different user profiles in further details under the following headlines:
The TechnicianThe Economist The CuriousThe SympatheticThe Comfortable
The user profiles show that even though the economy of a household attracts significant interest, customers can not just be seen as homo economicus, i.e. narrowly self-interested, rationally economic behaving individuals., The project has established a model for under-standing the very complex social conditions determining flexibility potential in different households.
From the project we have learned that whether talking about flexibility, user practice or cus-tomers’ incentives for behavioural changes, the social conditions as well as the internal culture in families have to be taken into account as an important part of the equation.
Still, the price signal may be the best single incentive to offer for automatic control of heat pumps. Although we cannot consider the customers to be pure homo economicus, the price signal is still easy to ascribe meaning to and most of the user profiles include financial sav-ings as a partial driver for participating, albeit not necessarily as the most significant driver.
Developing other incentives could further encourage flexibility, but it is very difficult to de-sign incentives useful for load shedding that address the concern for climate and environ-mental impact of energy consumption or other more intricate interests that a customer may have for participating in load shedding.
Technical project results The project demonstrated that flexibility can be achieved in the private households without perceptible loss of comfort. We cannot generalise the conclusion in quantitative terms as the flexibility depends on a lot of factors e.g. the insulation of the house, outdoor temperature, user behaviour, social conditions etc.
The heat pumps included in the project could be interrupted for up to 3 hours. Due to the technical setup in the project, the majority of the heat pumps only remained interrupted for about 1 hour in connection with very cold outdoor temperature. But the analysis leaves room to believe that heat pumps could in many cases be interrupted for longer periods of time, even under harsh weather conditions and thus can respond to more aggressive control schemes without instigating household members to overrule the control by commanding the release of the heat pump into normal operation.
The project revealed that the use of the so-called ‘party button’ (a function enabling users to force start the heat pump) was limited to once every 3rd month, indicating that the custom-ers comfort was not seriously challenged during the project. Simulating the impact on the grid from a larger number of heat pumps on one feeder (i.e. a local stretch of the power grid), revealed a clear peak shaving effect. But compared to the

7Executive Summary
remaining load on the grid (generated by all other appliances), the question remains how significant this achievement is?
We also discovered that the period during which the heat pumps could be interrupted in general was too short compared to the average period of peak loads. Cascade control of the heat pumps, whereby a portfolio of pumps are interrupted gradually, showed that the task of shaving the entire load peak that arrive from private households can be solved by the flexible use of heat pumps. This calls for careful consideration in relation to how distribution compa-nies can instigate advanced interruption patterns, i.e. in cascades. As we will argue in this report, a general variable grid tariffs may not be sufficient.
An important observation was made in relation to the expected thermal pattern when inter-rupting and the later releasing the heat pumps into normal operation. When heat pumps are released to normal operation after an interruption period, a so-called kick-back load (or cold load pick-up) was expected to occur as the heat pump recovers the missing energy supply to the house. However, the kick-back load was in many cases missing completely. The reason is believed to be that of customer practice in the form of cooking or running other heating generating appliances (especially wood stove furnaces) etc. Also solar radiation is likely to have had a significant influence on the thermal performance of the home but the project did not record such details.
Economic effect on the customerThe annual savings that the customers achieved by participating in the project range from approximately DKK 250 (~35 ") to DKK 600 (~80 ") depending on whether the house is well-insulated and the degree of interest of the household to participate in such programme. This was obtained using price jump in the 3-step grid tariff of DKK 0.60 from peak price to the next level. Another design of the grid tariff, e.g. including Saturdays and Sundays, could increase savings but it would probably not be significantly higher than indicated above.
In addition to this, energy management practice provided by the home automation system enabled 10% savings on average as regards the electricity consumption. It must be empha-sized that this result was generated under such conditions and on the basis of a group of customers with special interest in energy savings, that the result cannot be generalized. On the basis of the eFlex project, it is not possible to conclude that energy savings at this level can be achieved or maintained through the use of a home automation system or the like.
Future perspectivesOn the basis of the eFlex project it can be concluded that heat pumps in private households have a technical potential for delivering a significant reduction in the peak load that house-holds incur on the distribution grid. To a large extent, customers are also willing to let their heat pumps be controlled given that the appropriate incentives are applied.
This means that distribution companies could potentially base grid planning and operations on this notion. But flexibility of heat pumps and similar appliances must be harnessed sys-tematically by commercial actors in the energy market and the control scheme must be executed using sophisticated algorithms that cut off and release a portfolio of heat pumps in cascades. Using such methods, the value of heat pump flexibility will increase and can be translated into reductions in the peak load of the distribution grid.
The project has uncovered various costumer motives for participating in a flexibility pro-gram. Commercial actors may use this insight to design value propositions for flexible cus-tomers. However for this to occur, variable tariffing of private household customers must be enabled at a larger scale. In addition, as we will argue in this report, it may be necessary to further develop the tariff concept and additional incentives offered by distribution compa-nies. Only with such a development, will commercial actors have the required incentives for controlling heat pumps through advanced algorithms. The possibility for applying variable

8 Executive Summary
eFle
x tariffs and other incentives on a larger national scale will also be critical for providing the necessary potential for value creation through harnessing flexibility, i.e. a critical volume of electricity consumption that might generate value through shifting load from peak price to lower price periods.
Enabling variable tariffing of all flexible consumption, would spur all market actors – commercial and regulated – to work towards establishing the basis for creating value through harnessing flexibility. In connection to this, it is important to note that as the eFlex project progressed, a new regulatory framework governing the electricity retail market and relations to end-consumers, was passed by Danish legislators. As of Octo-ber 2014 Danish distribution companies must address their grid tariffs to the retailer rather than to the end-customer. The retailer will then present a single bill to the cus-tomers they service. In the new regulatory setup, it will be the role of the retailer to offer additional services and products such as home automation solutions directly to the end-consumer. It will also be the role of the retailer and other commercial actors to develop incentives that go beyond pure price. Fortunately, the results of the eFlex project are applicable to the new regulatory context.

9Background
01 BACKGROUND
At the beginning of 2010, DONG Energy Distribution decided to launch the eFlex project. A project that was designed to investigate private households’ participation in demand re-sponse.
The major task of a distribution company is to secure electricity supply and distribution companies in Denmark are concessionaire of the distribution grid in specific areas. They enjoy monopoly. They also own the meters and handle meter data. Customers can freely choose their energy supply from a range of electricity retailers, which is another business and completely separated from the distribution company.
The background of the project is the decline in production of oil and gas in the North Sea combined with the political intention of reducing CO2 emissions. This has inspired to look around for alternative energy sources and preferably sources of Danish origin. As regards the electricity sector, this is primarily wind energy as direct feed to the grid, while biomass sup-ports the coal- and natural gas-fired power plants still in operation.
Wind turbines produce electricity according to the energy in the wind regime and this is of course a production independent of the consumption pattern. The overseas connections to Norway, Sweden and Germany together with adaptation at the power plants and some larger local industrial facilities ensure balancing on the grid at transmission level.
However, research has revealed that domestic consumption of produced energy from wind turbines is more profitable for Danish economy than to sell the power abroad. Therefore, the Danish government has launched subsidy schemes for switching from worn-out natural gas and oil furnace systems to heat pumps and for promoting electrical vehicles. The purpose is to introduce more electrical appliances, i.e. a switch from the petrochemical (fossil) sector to the electricity sector that can be supplied by renewable energy and at the same time, force out fossil fuel from the transport and heating sector, eg. reduce CO2 emission.
For a distribution company the new appliances represent a specific problem. The grid is designed to carry the maximum load, i.e. the cable dimensions depend on the maximum load and not the amount of energy that it is supposed to transmit. If for instance, a large number of electrical vehicles are used throughout the day and owners recharge the batteries by the end of the day at the same time as the evening load peak (the so-called cooking peak), the grid will require reinforcement in several places.
This is expensive and a postponement of the investment in grid reinforcement will bear a considerable benefit. A postponement is made possible, if the maximum load can be dimin-ished, i.e. load shedding. For example, charging the electrical vehicles at another time than the most obvious and disrupting heat pump operation during normal load peak.
The purpose of the eFlex project was to investigate private households’ willingness to be flexible in this respect.
To encourage customers to show such flexibility, the distributions companies’ contribution is to enable wind energy in the energy system in a modern and cost-effective way.


11The eFlex Project
02 THE EFLEX PROJECT
Below is find a brief introduction to the idea behind and implementation of the eFlex project. The chapter describes the equipment used and the interaction with the customers.
2.1 Targeting the ProblemIn order to encourage load shedding in the consumer segment, price incentives become a natural choice. However, studies have revealed that a relatively large segment of customers is not sensitive to variations in electricity pricing, and other incentives may play a more influential role in customers’ procurement behaviour. In general, customers’ procurement behaviour is a reflection of their personal values, cultural ballast, experiences, and is usually a mix of the above.
In addition, the potential range of variation in the electricity prices is relatively limited seen from a distribution company’s point of view. In Denmark, tax and VAT of the electricity sup-ply constitutes the largest part of the invoice to the customer (about 60%). The electricity price and the transport price (contribution to the distribution company) are by and large of similar size; 20% of the invoice each. Hence, achieving a behavioural change among cus-tomers based on changes of the part of the price that the distribution company is responsi-ble for is very limited.
Therefore, the basic philosophy of the eFlex project was to investigate what other incentives could entail a behavioural change in the use of energy towards load shedding. In addition to this, the project was to analyse the potential effect of load shedding by private customers on the distribution grid.
To this end, two major tools were implemented.
Each customer was given a home automation system of the brand: Greenwave Reality. The home automation system is essentially able to control electrical appliances’ on/off time and measure each appliances’ energy consumption. Control of heat pump operation in terms of interruption of the ordinary operation and time scheme for charging batteries of electrical vehicles was integrated in the home automation system by means of sophisticated algo-rithms.
On/off control of ordinary household appliances is not very interesting as regards load shed-ding because the energy consumption of most ordinary household appliances is insignifi-cant. Electrical under-floor heating would have been of interest to the project, as the poten-tial for long time interruption is high, but only very few heating systems exist in Denmark and the software for control was consequently not developed in the project.
The second tool consists of a social media platform that was established on basis of the PODIO platform concept. The idea was to increase interest in energy consumption through dialogue and inspiration. However, the content turned out to be different as described later in this document.
The outcome of the project was analysed by two teams. An agreement was concluded with the consultants Antropologerne.com to investigate customer behaviour in general, and a technical team at DONG Energy Distribution was established to assess the effect of the control of heat pumps and electrical vehicles on the distribution grid.
2.2 Electricity Price and FlexibilityDespite what has been said about customers’ insensitivity as regards price changes, the customers were exposed to varying price signals. Even though some customers emphasise

12 The eFlex Project
eFle
x climate, environment or have a more sophisticated approach to prices than expected from homo economicus, one or more signals will have to control interruptions of heat pumps and charging of electrical vehicles, and here the price signal is useful, as it is easy to ascribe meaning to the signal (no matter for what reason). This is not the same as concluding that the price signal is the most reasonable signal and customers are only interested in savings. As we will show later on, price is a very complicated concept and even though segments of customers participate for a number of other (main) reasons than saving money, they still may consider savings as attractive.
The customers of the project were charged an electricity price that consisted of two compo-nents besides tax and VAT: an elspot1 market electricity price added to a 3-step grid tariff.
The 3-step grid tariff is shown in Figure 2.1. The aim was to expose the customers to two versions of the varied grid tariff in order to detect a potential change in behaviour.
The elspot market is a day-ahead market; hence the price of every hour was predicable one day-ahead. Customers had new meters installed that enabled hourly account statements.
Customers could choose between price signal for control of heat pump and charging of elec-trical vehicle, a signal monitoring the amount of wind energy in the total energy mix in the grid, and a balanced combination of the two.
Furthermore, customers could choose the balance between e.g. best price optimisation and comfort, ie. the more a customer wishes to make financial savings, the longer time the heat pump would be interrupted and the more negative effect on the level of comfort is to be expected.
1 Elspot is the name of a day ahead market based spot price in the North Pool market (Nord Pool market)
6
0.576
DKK/kWh
Moderate variable grid tariff implementedfrom october 1th 2011 to February 1th 2012
Standard flat tariff DKK 0.2720.2760.176
8 12 17 19 21 24
6
0.876
DKK/kWh
High variable grid tariff implemented from February 1th 2012 to July 1th 2012
Standard flat tariff DKK 0.2720.276
0.076
8 12 17 19 21 24
Figure 2.1 Variable grid tariff including the DKK 0.076 contribution to transmission company. The 3-step grid tariff is only valid during weekdays. During weekends, the grid tariff is equal to the lowest step during the whole day.

13The eFlex Project
Finally, customers could set a minimum room temperature, so that the heat pump would return to normal operation, in case the temperature in the room reached the minimum tem-perature.
Based on the daily price pattern and the customers’ choices, control profiles were down-loaded to each house for in-house control of the heat pump. If for any reason, a customer wanted to override the daily control profiles, the home automation system was equipped with a manual override; the so-called party bottom, that disregarded the control profile set-tings for the remaining time of the 24-hour price forecast.
No matter what choices the customers made, they were invoiced the combined elspot mar-ket price and the grid tariff. No safety net was provided for the customers to avoid even large variations of the elspot market price which could result in unexpected high invoices, as this could affect the behaviour and choices of the customers.
2.3 The Customers119 customers participated in the eFlex project. 82 of these were heat pump owners and 28 customers fell in the category ‘ordinary’ households with no heat pump or electrical vehicle. The 9 customers who owned electrical vehicles were too few and did not constitute a basis for statistical analysis or safe assessment of general behavioural change.
The reason for the very few customers with electrical vehicles, who participated in this pro-ject, was simply that no such customers were to be found in the DONG Energy supply area, who also wanted to participate in the project.
All customers had to live in the DONG Energy supply area (customers of the Distribution Company) but they could choose any electricity supplier (retailer) as long as they were billed on the basis of a North Pool spot market price.
Customers were recruited through an advertising campaign in the DONG Energy newsletter, through procurement of leads from a vendor of heat pumps and through a co-operation with Energinet.dk’s project ‘From Windmills to Heat Pumps’. The latter recruited customers through the public scrap schemes that supported the switch from worn out oil-fired burners to heat pumps. DONG Energy co-operated with Energinet.dk as regards heat pump custom-ers in the DONG Energy supply area.
Customers volunteered for the project and were, of course, interested in using the new technology and the programme. Consequently, the customers were not representative of all the customers living in the DONG Energy supply area but were positively bias toward the project.
Almost all the customers lived in houses and only very few in apartments. The income level was at the high end; almost 1/3 earned above DKK 900.000 and approximately 1/3 of the customers had a high-level education.
25-39 years
40-59 years
21
54
19
2
60-69 years
70+ years
Figure 2.2 Age composition of the customers

14 The eFlex Project
eFle
x 2.4 Technical set-upAfter screening a large number of suppliers of home automation system, we chose Greenwave Reality. We screened the companies for their ability to deliver according to Danish standards and manage open data handling protocol like z-wave and Zigbee. At the same time, we wanted the suppliers to show what other demonstration projects they have participated in. Furthermore, we assessed their ability to co-operate, as we discovered that not all suppliers wanted to partici-pate in a demonstration project and the brand as such, and the ‘history’ of the supplier could affect the risk assessment of the project. Finally, we demanded to see a live demonstration of the technology to ensure that the supplier in fact had a technology sufficiently developed to solve the problems that we would encounter.
Greenwave Reality delivered standard two six-plugs power nodes and two single-plugs power nodes to each household. In addition, the owners of heat pumps and electrical vehi-cles were equipped with technology for measurement and control of these devices. A Gate-way connected the home areas network by z-wave communication.
Besides measuring energy consumption of the heat pump and charging of the electrical vehicle, the main electricity consumption of the household was measured. Measurement of the electricity consumption used for invoicing purposes was however separated from meas-urement of electricity consumption used in the eFlex for presentation to the customers in order to avoid breakdown in or malfunctioning of the equipment resulting in faulty invoices.
Furthermore, customers were equipped with an iPod Touch for control of the devices or could choose to do so in a more extended version installed in their home computer; a portal. The GWR standard portal for home automation systems was further developed in co-operation with DONG Energy’s IT department in order to incorporate control of heat pumps and elec-trical vehicles. Many of portal screens were also developed based on a survey of the custom-ers’ preferred manoeuvring and reporting screens, made by anthropologists of the Alexandra Institute for DONG Energy.
Greenwave Reality supplied the communication from the gateway via the internet to the server system including monitoring and execution signals and user portal. DONG Energy supplied the back-end server system including database and algorithm for control of heat pumps and electrical vehicles. The server system also collected elspot market prices, metro-logical data etc.
Figure 2.3 A simplified illustration of the integration of IT and the Greenwave Reality supply.
DONG ENERGY IT
GWR serverCollect dataRead / write commandsEnable interface to backend
Backend serverDatabaseHP & EV algorithmsCollect external data: SpotprizeTemperature
Secure access
Interface backend / GWR
USER UI BACKEND UI
GREENWAVE REALITY

15The eFlex Project
2.5 SupportDONG Energy provided first line support, and it was originally decided to offer this through the Technical Hotline at DONG Energy which is open 24 hours a day.
2.6 PODIO; A Social PlatformIn order to maintain communication with the customers, a Facebook-like platform was estab-lished based on the PODIO concept. PODIO is developed for the purpose of co-operation and can be shaped into many forms due to a flexible apps program.
All the customers were invited to join PODIO and 114 of the 119 customers did register as users.
Besides being used for detailed explanations of various functions of heat pump control, electricity prices etc., PODIO was used to extract perceptions and user practise from the on-going debates and include these in the anthropological study of behaviour and change.
However, over time the main issues discussed in the PODIO universe were support ques-tions rather than questions with a more future-oriented perspective.
2.7 ImplementationGreenwave Reality’s portal and control software were developed at the same time as the development of server software in back-end. This process was initiated by an anthropologi-cal study of user preferences via mock-ups of possible screen layouts.
The development of the software took almost a year. On 15 March 2011, the project was launched but included only a few customers in order to remove the last software bugs. In June 2011, owners of electrical vehicles were included in the system, and on 1 September the remaining customers went online.
The project was closed on 1 July 2012.
2.8 Regulatory PermissionIn Denmark, a project like eFlex cannot be launched without obtaining permission from the energy authorities.
The project was subject to the following conditions:The customers should volunteer in the project and should be fully informed about the conditions for participating and the date of terminationThe number of participants should be limitedThe project should contain a deadline for terminationThe participating customers should receive a meter for automatic remote reading.The variable grid tariff should be designed in such a way that DSO would receive no ad-ditional revenueThe results should be published
The eFlex project has met all these obligations - and this report meets the last condition.
Initially, the authorities were concerned that the project favoured only some customers (the participating customers) which is against the regulation regarding discrimination. In order to implement the eFlex project, a change in the law was required to enable implementation of demonstration projects that included customers.

16 The eFlex Project
eFle
x

17Customer and Technology
03 CUSTOMER AND TECHNOLOGY
In this chapter is described the actions and organisation of DONG Energy’s resources for running the eFlex project. The project organisation embraced a number of departments to covers all operations and especially the organisation of customer support is considered.
3.1 OrganisationBesides the project manager, the project organisation consisted of three teams during the implementation; Technology, IT and Customer Handling. When the project entered the op-erational phase, the organisation was changed to other three teams; Technology & IT, Cus-tomer Handling and Analysis. The team leader of the customer handling was the same per-son throughout the project.
Below, the three teams the project were divided into several taskforces and required exten-sive co-operation across DONG Energy. At DONG Energy, the tasks were divided into the following departments:
* The process of changing subscription is complicated and contains a long notice period. The process depends on whether the customer had a subscrip-
tion with another supplier and wanted to change the subscription to DONG Energy, and whether they were DONG Energy supply obligated customers2.
It was a prerequisite that all customers had a supply contract based on hourly readings and based on Nord Pool Sport market price.
** A contract governing the customers’ and DONG Energy’s responsibilities and obligations during the project.
*** During dismantling of the equipment after termination of the project, the Meter Department did not have the resources for such a special project at the
time and the task was assigned to the Customer Centre.
**** The customers were actually invoiced according to the spot market price and the variable grid tariffs, even though at the beginning, we did not know
whether the customer would save energy and money. We did not provide the customers with a safety net as this would exempt the customers from
‘real’ behavioural change. However, we rewarded the customer after end of the project.
2 Elspot is the name of a day ahead market based spot price in the North Pool market (Nord Pool market)
DEPARTMENT TASKS
Customer Centre Recruiting processQuestions related to invoicesRegistration of change in power supply subscription*Support related to questions regarding the contract**Support related to customer’s social events
Billing Integration of the hourly measurement of energy in databases etc.Registration of variable grid tariff for invoicing of customersSubmission of invoices
Meters Booking of electrician visit for installation***Installation of eFlex equipmentDismantling of eFlex equipment
Marketing Support to the content in information material etc.Design of brochuresSubmission of brochures etc.Submission of contracts etc. and reminders Registration of signed contracts
Digital Marketing Design and development of eFlex web siteDesign of questionnaires and compiling of replies
Economy Submission of customer rewards after termination of project****
Legal Preparation of contract and conditions for participation in the projectContinued support regarding extension of contracts, letters etc.Support for obtaining permission to execute eFlex (regulated by energy authorities)
Technical Hotline Technical support to customers.
Figure 3.1. Departments at DONG Energy in order to implement eFlex, and their tasks

18 Customer and Technology
eFle
x At first glance, the eFlex project may not be considered complicated in terms of the work required by DONG Energy. However, especially the customer handling entailed a consider-able amount of communication points in order to handle project enrolment, customers’ power supply subscriptions, installation of equipment, billing, legal issues, marketing, press etc. and not least support.
3.2 eFlex and the internal communicationThe internal communication and coordination to enrol customers and integrate them in the project, as well as provide the technical support during operation, may be different for each distribution company (or anybody who could consider making such a project). An important overall learning experience with eFlex was that the resources required for these tasks can easily be underestimated and may turn out to be a big surprise later in the process.
It is a prerequisite to have a team leader assigned to coordinate the communication and document flow, and it should be considered which tools to implement in order to ensure that nothing is left out.
3.3 SupporteFlex broke new ground with regards to the strategic direction towards demand response. By taking customers in as partners in a project and offer them new technology in the form of intel-ligent house equipment, required a lot of support.
The support comprised technical issues, billing, the project in itself etc. and had to be planned and organised to avoid customers contacting random persons of the project team.
Initially, Technical Hotline was the first line of support. They could provide support round the clock every day of the week. Technical Hotline’s normal task is to act as customers’ contact point in connection with power failure in the distribution grid. We trained a taskforce con-sisting of 14 persons in the use of eFlex equipment. Any questions and problems that they could not handle were submitted to the Customer Centre (essentially questions to billing and electricity prices) or specific persons of the Project Team. The latter could subsequently submit questions to IT, Greenwave Reality etc.
A system was established to keep track of questions and problem solving. More general answers and general information were announced on Podio.
Two significant observations were made. First, there were not enough questions and prob-lems to maintain competences as regards all the technical details for all the staff members. The frequency of questions that target each of the 14-person group was simply not high enough for all to remain competent at the expected level. In addition, some staff members were more motivated than others to accept this extraordinary and new work load which the eFlex project entailed, and questions were soon directed to key persons and consequently the remaining people in the group became less and less qualified in delivering support to the eFlex project. Because the key staff was not always at hand, the amount of problems that were transferred to the project team (second line support) increased.
Second, we also had to realise that customers prefer to communicate using different means, and as regards the most active persons Podio soon became the preferred communication
2011 2012
MONTH MAR APR MAY JUN JUL AUG SEP OCT NOV DEC JAN FEB MAR
Phone calls
158 64 31 41 71 91 91 63 41 30 32 19 27
E-mails 16 10 10 5 2 1 13 22 9 4 8 3 0
Figure 3.2 Number of contacts to Technical Hotline during the project period. The eFlex project involved 119 customers.

19Customer and Technology
channel for support. In PODIO, they could have a dialogue with highly qualified staff of the project team and have their problems solved at the same time.
The use of Podio for support had the positive effect that if one person had a question to or problems with the equipment, another customer could respond before the project team members. Podio certainly had certainly a community building effect.
To some extent, the technology chosen was still in progress of development and rather new. Therefore, we encountered some technical problems. The amount of inquiries to eFlex’s general telephone number and common e-mail box appears from Figure 3.2. In addition, quite a number of inquiries took place through Podio. The amount of inquiries could be considered high but there was still insufficient basis for maintaining the necessary compe-tences within the Technical Hotline.
Therefore, it was decided to direct the majority of support questions through Podio and abandon the 24/7 support offered by Technical Hotline. Three persons within Technical Hot-line were trained again and were closely involved in the project in order to maintain compe-tences and interest. The fact that we no longer offered round-the-clock support caused no problems.
By using a social platform like Podio as support, we strengthened the communication build-ing effect. More persons would benefit from the solutions we provided and the increased traffic on Podio offered a better basis for understanding the customers and their way of thinking and increased the potential participants in discussions on Podio that we strived at.
An important observation was that even though the project team experienced a heavy traffic on Podio regarding support, it was not all the customers that were familiar with the media.
As it appears from Figure 3.3, many customers still prefer phone calls to the use of Podio. In this respect, the average age of the customers may influence the result (see Figure 2.3). Only very few customers contributed active to Podio. The majority of customers limited them-selves to reading the contribution of others.
Figure 3.3 Customers’ reply as regards use of and opinions on Podio
Social medias will be the future for support
I have read others contribution on Podio
I have made many contributions on Podio
Podio is a good tool for dialog
Good that Podio is a closed community
Respons time on Podio was satisfactory
Posio is a good tool for support
Max 100 0 10 20 30 40 50 60 70 80 90

20 Customer and Technology
eFle
x 3.4 Technology handling from the Project perspectiveeFlex was an innovation project. The technology was new and to a certain degree im-mature and only limited experience from other projects indicated what to expect.
We conducted intensive surveys on potential suppliers, and DONG Energy IT depart-ment developed software for control of heat pumps and charging of electrical vehicles, which we initially tested in the laboratory and subsequently launched to a few custom-ers. Customers were connected to the project step-by-step in order to allow us to learn how to handle problems and learn down the route. We worked intensive on designing the optimum support strategy and treated the customers with special events in order to maintain their interest while at the same time, they experienced the problems of an innovation project.
We faced a number of problems and the overall experience to avoid such problems in future projects referred to improved communication and organisational cooperation.
Treating suppliers the same way as in a traditional role under a delivery contract causes problems in relation to maintenance of hardware and software in innovation projects, where major uncertainties and risks are handled. Too many issues are unknown and what is more important; the learning curve during the project cycle is steep and many changes have to be made during the process.
This can probably be handled by usual contract management, and so it was, but seen in retrospect maintaining a tight project group with everybody participating would have resulted in larger commitment and easier communication.

21Customer Behaviour Study
04 CUSTOMER BEHAVIOUR STUDY
Major achievement of the eFlex project arrived from a comprehensive anthropological survey of customers behaviour and preferences. In the chapter below is described the methods used, some theoretical reflections and the major results. In a separate report (in Danish) is the survey results described more comprehensively.
4.1 MethodThe difference between what a persons is thinking and what he does is a well-known dichot-omy in social studies as well as in marketing studies. Several examples can be found to illustrate that people are occasionally acting in opposition to what they believe to be their values and priorities3. Therefore, questionnaires are not always a fruitful method for social research, no matter whether they are orally or in writing unless the questionnaire concerns quantitative questions. In addition to this, questionnaires tend to reflect the questionnaire designer’s mental model of the world and will not always match the model of the informant.
In the eFlex project, we concluded an agreement with the consultancy company Antropolo-gerne.com to conduct a study of customer behaviour and what changes the home automa-tion system entailed. The study was essentially conducted by home visits and cultural probes (home exercises). In total, 48 home visits were included in the survey and each visit lasted approximately 4-5 hours.
The study was conducted in three steps where observations and conclusions were gradually elaborated through workshops with a larger analysis team that included DONG Energy key staff.
4.2 Domestication of TechnologyCustomers are different in all aspects and not two customers can be said to have equal con-ditions, wishes or values. Therefore, it is very difficult to generalise observations and conclu-sions.
The Home Automation System from Greenwave Reality (GWR) was adopted in the houses at different speed, difficulty and utility.
Initially, delivery of the equipment to a house may be considered from a more ‘mechanical point of view’; simply equipment to be installed and used as intended. As Lucy Suchman4 showed in her study of use and troubleshooting in the handling of copy machines, the use of technology is embedded in a conception of user practice in the head of the designer. Machines’ interaction with the world and with people in particular, will be limited to the intentions of designers and their ability to anticipate and limit the users’ actions.
However, the users can be very creative in the use of technology; from time to time in par-ticular their misunderstood use of the technology represents the breach in the borders of concept anticipated by the designers. ‘Creative’ use of technology is more a clash between mental models than a clash between humans and the technology.
Akrich5 calls such inscription of the designers’ visions as scripts; the idea of the way users were supposed to apply the design, but the idea is more or less the same as Suchman’s.
What this project clearly showed was that human actions were diversified and apparently unpredictable, both in the use of the home automation equipment and in the practise within consumption of energy.
3 The most distinctive advocates for this theory is Argyris and Schön but similar ideas of this dichotomy can be found with numerous other social scientists.
4 Suchman, Lucy A. Human-Machine Reconfigurations. Cambridge University Press 2007
5 Akrich, M. ’The Description of technical objects’ in W. Bijker and J. Law, Shaping Technology/Building society. Studies in Sociotechnical Change. 1992

22 Customer Behaviour Study
eFle
x The use of the equipment and the extent of its use depended very much on a negotiation in the homes between the man, the wife and the children. Different interests and life priorities became evident and the final instalment and use of the equipment were often a give-and-take situation. It is a valuable experience and maybe the most important that we obtained from the project that design and domestication of technology cannot ignore the internal culture and identities made up by the family, and that there is no linear and straight forward way to understand the domestication process. We cannot in any way limit our understanding of domestication of technology to the functionality of the technology. There are human fac-tors behind this and that makes all the difference.
As regards the domestication theories that rely on the Script approach and other actor-network theories, it has the underlying assumption that supplying the customer with tech-nology is a question of how he will use and incorporate the technology over time in his daily life and practice. Knut H. Sørensen and Silverstone6 suggest that people and their socio-technical relations may change as well.
This could be very well seen in the eFlex project and this was of course the very point. The home automation system provided with great success an insight into the households’ en-ergy consumption and habits. The general interest and probably also the complexity of the energy prices resulted in customer knowledge of energy systems beyond what could be ex-pected by the ordinary consumer.
This insight resulted in a change of habits that many other projects believed to have proven impossible: change of habits based on information only. The difference to other project of information based behaviour modification is probably that in eFlex it was not just informa-tion but the system provided a learning of energy use. The insight and knowledge created an interest and boosted internal competition (or play) as regards what was possible in terms of saving energy. Use of dish washer and washing machines was for some made dependent on the price forecast. Some customers also tried their best to change their habits in connection with cooking and taking showers. However, we will never know whether the changed pattern will last.
So people change too and therefore, domestication of technology has a wider implication than just socialisation of technology (or as it is understood in the script approach): it is a co-product of the social and the technical aspects - to use Knut H. Sørensen’s word. It is not only obtaining of new technology in the homes via new practise, but people who have the practise change too.
4.3 Moral EconomyMoney as a mean for exchanging services and products is in all societies related to some symbolic value. Parry and Block7 have proven the diversity in the perception of money for exchange in several societies and households are no exemption. In Silverstone’s studies, he found
6 Berker, Thomas (eds). Domestication of Media and Technology. Open University Press 2006.
7 Parry, J. and M. Bloch. Money and the Morality of Exchange. Cambridge University Press 1989
…it was also clear that in many families and households the abstract value associated with money in the formal economy would not need to be, and were not, upheld: the private economy of help, reciprocity and nominal payments for services rendered, did not depend on any models of rational value and fixed rates of exchange.

23Customer Behaviour Study
Money and price are very complicated concepts when integrated in human practice. In the project, there were many situations where customers’ perception of money was based on an understanding deriving from internal cultures and identities within the borders of the family. The concept of moral economy, which divides the conception of money into Household and Home, appeared to be an immediate way to understand our observations and a promising approach to discuss how technology makes sense to the customers.
Household and Home are two distinct set of mental models in use at the same time. The household is the material and tangible life that has to do with exchange of values related to the infrastructure framing the practice of the family. In many ways, it could be said that household economy has to do with the basic needs of the household. It concerns the money flow in and out of the house and energy savings etc. are usually discussed within this refer-ence system.
Home refers to the construction of identity and the meaning ascribing to actions in view of the family culture. It is a phenomenological term and reference system where money is used for exchange in a way that does not appear rational in the formal economy.
The two reference systems coexisted side by side and were in the eFlex project expressed in examples where customers on the one hand invested in energy savings and on the other hand invested in energy consuming technology that supported their understanding of who they were or referred to their interest sphere. Likewise, cases were found where energy sav-ings spend on more energy consuming technology and investments in obvious non-benefi-cial technologies although it was understood to be energy savings.
4.4 Price as Control SignalWhen talking about load shedding, the most obvious solution appears to be to offer custom-ers a variable price; a high price when the load is high and vice versa. Numerous projects have tried this and eFlex too. It can be argued, considering the above observations about moral economy and irrational economic behaviour, that price signal will not work as sole incentive for flexible behaviour.
First and foremost, it is important to recognise the conclusion at which eFlex arrived: all customers act based on a wide diversity of reasons and values. Some people will react eco-nomical rational to a price change but it is probably not the majority.
Second, even though eFlex made some customers react based on information only, it is far from sure that it would continue this way, if no further technical development took place that could sustain the interest. In addition, this behaviour change would probably not include all types of customers either. Anyway, it is widely recognised that information based behav-ioural modification is an unreliable approach that is likely not to work in the long run. The safe way to achieve a change in behaviour with regard to required load shedding is by pro-viding some sort of technology that can apply the change according to a signal, ie. auto-matically. It simply cannot be expected that customers continue monitoring a price signal manually (or any other signal) and react accordingly; we need technology to do it for them.
It is an important observation that when the customers have accepted the technology that automatically reacts correctly to a signal, it is like removing a ‘response practice’ from the customers. A larger part of the customers will no longer pay attention to the control signal as this is managed by the technology. Furthermore, whether the price signal is higher or lower the reaction from heat pump interruptions and schedules for charging electrical vehi-cles are the same. They are already scheduling demand response in the optimal way as they simply react to achieve the maximum gain; e.g the price difference. Therefore, a distribution company cannot expect to achieve more flexibility with higher price signal; the ‘behaviour’ will remain the same as this is ‘only’ control input to a technology and it is already acting optimal according to the price.

24 Customer Behaviour Study
eFle
x The customers are becoming insensitive to the price by using the technology.
When discussing prices and economy in relation to demand response, the discussion should therefore be less focused on the design of the price signal than on the price of the technol-ogy that will automatically offer load shedding. As soon as the customers have accepted to purchase the technology, any signal would work, but for some, the promised financial benefit of purchasing and installing the technology may be a decisive factor and in this respect is a discussion of price signal design relevant.
Initially, we explained that the project assumed that the customers to be insensitive to price variations. Nevertheless we did provide the customers with such a signal (and also an alter-native ‘green’ signal), which appears to a contradiction in terms. As it will be shown later customers act based on quite a number of reasons. However, the price signal is probably the best to signify required load shedding as it is easy to ascribe meaning to for the customers (whatever economic rationality can be buried in it) but as soon as they have accepted the technology that actually provides load shedding, it could be any signal.
To put it bluntly, the consequence of this is that a distribution company cannot vary flexibil-ity up and down by adjusting the price.
4.5 Feedback and ControlBefore we return to more detailed findings, a few behavioural patterns more or less common should be mentioned.
It is hardly something new that introducing consequences of actions in a visible in tangible way will create a new response with whom who has taken the action. This is widely used in energy management systems. Also in the eFlex project, the visualisation of the energy con-sumption resulted in immediate changes.
What is more important as regards demand response is that the visualisation of energy use also created a consciousness of electricity as an important commodity of life that unfolds in the household. Most customers were expected to have a more or less superficial relation to electricity use but the eFlex project, or rather the home automation equipment, no matter that most of the equipment’s functionalities had no importance to load shedding, raised the consciousness of energy use. This was considered as a prerequisite to promote interest in the future intelligent energy system and load shedding.
Feedback on the consequences of action was the eminent functionality, and several sugges-tions were discussed on PODIO as regards how to improve and expand the portal’s feedback features. The importance of the feedback function in any system which intends to change habits cannot be stressed enough.
Feedback also has another common feature. The home automation system including meas-urement of consumption and control of heat pumps and electrical vehicle charging is a probe into the private house, which most household naturally will react against. ‘My house is my castle’ is not an all wrong way to put it for most customers, not least taken the preceding discussion into account: the internal culture that families create for themselves.
Customers will inevitably see it as an intervention that ‘someone’ has taken control of various appliances. Naturally, they are in favour of this taking place as they have agreed to participate in the project but discussions on PODIO as well as observations in the homes indicate that the feeling of safety and being in control of the events are important. This becomes clear from the many suggestions of what should be available and visible on the portal and the more tangible action of directly overruling the eFlex control system. Feedback from the system concerning control actions and information in general as to what control is intended and why, makes up for the lack of losing authority in own home and reinforces the feeling of safety.

25Customer Behaviour Study
In a number of cases, feedback has been experienced by customers in eFlex as insufficient to offer the required feeling of safety – the safety that derives from knowing exactly what is going on; and that raise requirements to the portal of being able to offer more understand-ing and explanations.
The eFlex project identified a tendency towards a common interest in saving and optimising the resources used by the family, although this is more or less outspoken depending on the consumer segment that we are considering. Seen in a broader cultural context, the same general tendency to preserve the status quo, that is well-known community/group charac-teristics in anthropological research, can be found in the family culture: protection against external threats, i.e. threats to the household economy, may result in a latent tacit reaction to seek optimisation of the internal resources in the family.
Like any other cultural group, the family culture seeks to optimise the conditions and frame-work that can provide as safe and comfortable life as possible. This may even be the case for families who are inspired to give up part of the comfort zone in exchange for a larger course8; i.e. environmental issues.
Also for that reason, feedback is a key parameter. It offers the feeling that the probing into the family culture and control of their appliances is not really an intervention (even though it is) but that they do have control of the events and are supervising what is going on.
There can be no doubt that if we intend to modify habits within the safe walls of the family home, feedback on the consequences of action and information about intentions, are the single most important parameters to consider.
4.6 User Pro!lesThe eFlex project identified five different user profiles. Although the customers displayed an impressive difference in behaviour and attitudes, it is possible to group them. However, the groups will not represent strong distinctions in behaviour and attitudes. There is some over-lapping and many customers will only point to belonging to only one specific group when asked to choose only one.
In the following, we present the user profiles with short descriptions and in a ‘wheel’ with nine characteristic drivers for participation in load shedding (and in the project in general). Many more drivers could be found and many customers will probably think that it is not an entirely correct description of their motivation drivers. However, the wheel is an attempt to transfer the findings into a more sociological type of comparison and for further analysis. For each profile, we have accentuated the most dominating motivation drivers and rated them with stars.
The motivation drivers relate to the key customer in the family, who is the person that the project usually communicated with and the person who has enrolled the household into the project. There will be other motivation drivers present by the other family members and to some extent the previously mentioned internal negotiation in the family culture on technol-ogy domestication could be ‘mapped’ on the wheel.
Customers have been divided into the categories according to the findings from the anthro-pological survey, and afterwards customers were asked which category described their moti-vation drivers the best. The result was a very good match and the remaining customers were subsequently asked also to choose a category that they felt suited their motivation the best.
‘The wheel’ is subdivided into three levels. The motivation drivers in the centre represent focus on the household/home situations and how to improve the families’ immediate condi-tions. The second level refers to drivers that have a dominating focus directed towards oth-ers or the immediate surroundings. The third level refers to drivers that are directed towards
8 In a recent study undertaken by DONG Energy Distribution concerning the reason why customers invest in solar panels, the same behaviour patterns were
found. Some insisted on strictly financial reasons and others on strictly environmental/climatic reasons. However, for the latter group they would only give up
‘so much’ for the greater course and only to the extent, that it would not really threaten their household, and therefor only to the extent, that solar panel
investment made some financial sense. Not necessarily in a financially beneficial sense but the financial calculation could not be entirely out in the woods.

eFle
x
Customer Behaviour Study26
Characteristics and interests
Work and think in projects. A profound personality based on research. Interested in mechanics/electronics and new technologies. Usually a front runner and willing to test new ideas and technology.
Public spirit Examine the society development critically. Positive attitude to environmental pro-tection.
Their relation to electricity
Committed to questions about the energy sector
Motive for participat-ing
Consider themselves to have a useful resource towards technology development
Practice in the eFlex project
Focus on new technology and spend relatively much time and effort on examining and controlling their energy consumption.
Typical educational background
Typically an engineer or another technical education. Usually high-level education. Typically employed in the industry sector.
Avoid waste and save money
Learn new things and personal developmentPlay and competitionDo something for others
Experiment with new technology
The feeling of doing the 'right' thingSupport environmental priorityParticipate in technological developmentContribute to development in the society
MOTIVATION FOR PARTICIPATION AND FLEXIBILITY
Individual level
Social level
Society level
THE TECHNICIAN

27Customer Behaviour Study
Characteristics and interests
System thinking and control focus. Motivated by optimising and saving energy, money and time.
Public spirit The most sensible action appeals to them.
Their relation to electricity
Motivated by optimising and avoiding losses.
Motive for participat-ing
Typically they have just acquired a new heat pump and consequently, the power consumption has increased, and they want to be in control.
Practice in the eFlex project
Typically use relatively more time at the beginning of the project to install and adjust the technology in order to control appliance consumption and modify the house-hold's behaviour in an optimum way.
Typical educational background
Educational background within economics and vocational sector. Employed within the information and communication sector.
Avoid waste and save money
Learn new things and personal developmentPlay and competitionDo something for others
Experiment with new technology
The feeling of doing the 'right' thingSupport environmental priorityParticipate in technological developmentContribute to development in the society
MOTIVATION FOR PARTICIPATION AND FLEXIBILITY
Individual level
Social level
Society level
THE ECONOMIST
eFle
x the discussion of the society development in general.
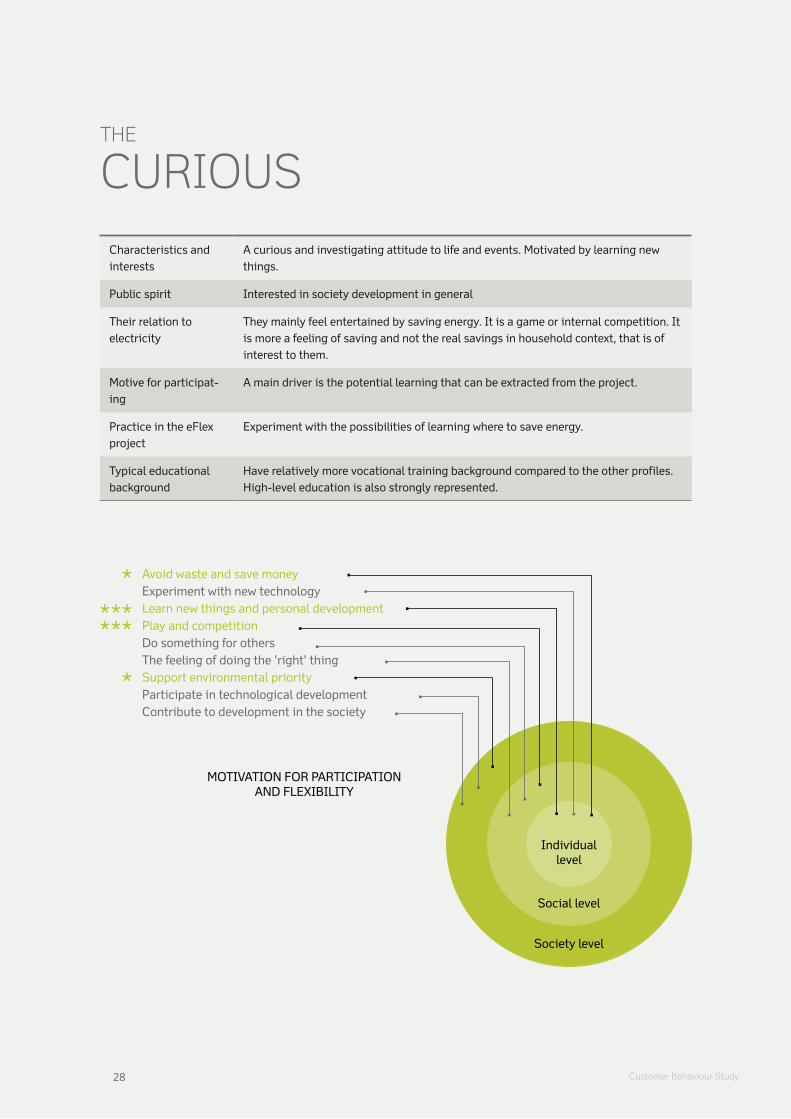
Characteristics and interests
A curious and investigating attitude to life and events. Motivated by learning new things.
Public spirit Interested in society development in general
Their relation to electricity
They mainly feel entertained by saving energy. It is a game or internal competition. It is more a feeling of saving and not the real savings in household context, that is of interest to them.
Motive for participat-ing
A main driver is the potential learning that can be extracted from the project.
Practice in the eFlex project
Experiment with the possibilities of learning where to save energy.
Typical educational background
Have relatively more vocational training background compared to the other profiles. High-level education is also strongly represented.
Avoid waste and save money
Learn new things and personal developmentPlay and competitionDo something for others
Experiment with new technology
The feeling of doing the 'right' thingSupport environmental priorityParticipate in technological developmentContribute to development in the society
MOTIVATION FOR PARTICIPATION AND FLEXIBILITY
Individual level
Social level
Society level
THE CURIOUS
28 Customer Behaviour Study
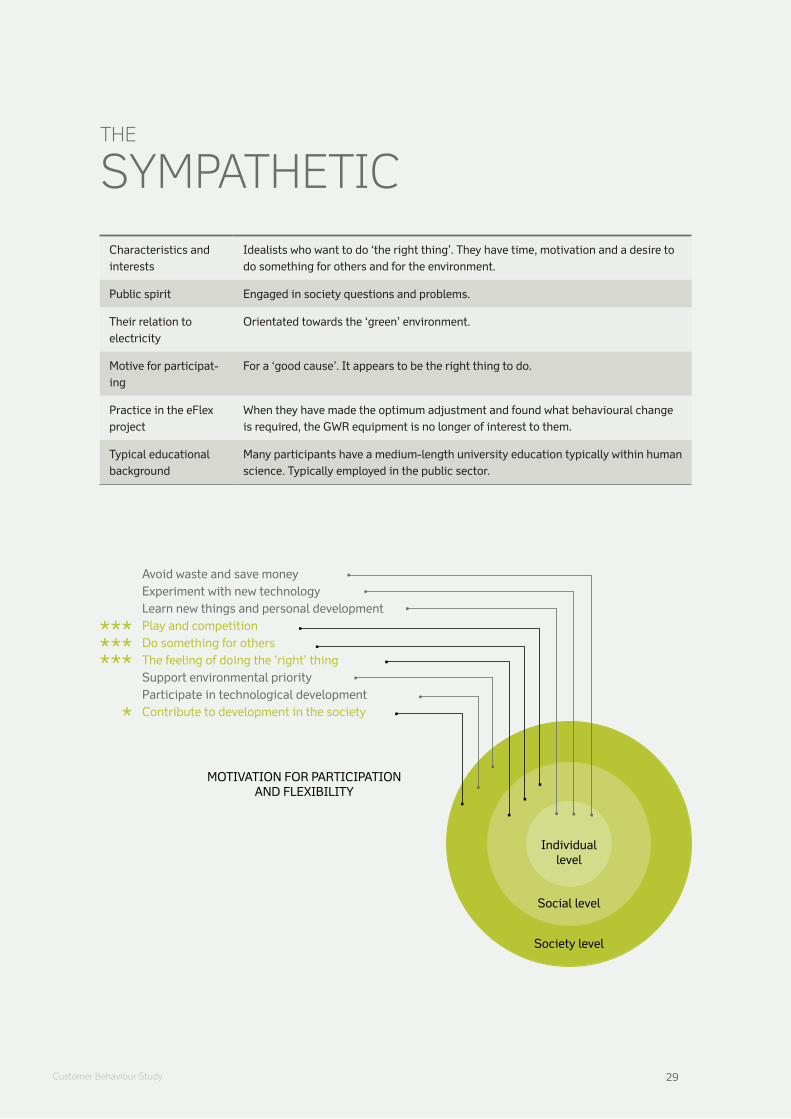
Characteristics and interests
Idealists who want to do ‘the right thing’. They have time, motivation and a desire to do something for others and for the environment.
Public spirit Engaged in society questions and problems.
Their relation to electricity
Orientated towards the ‘green’ environment.
Motive for participat-ing
For a ‘good cause’. It appears to be the right thing to do.
Practice in the eFlex project
When they have made the optimum adjustment and found what behavioural change is required, the GWR equipment is no longer of interest to them.
Typical educational background
Many participants have a medium-length university education typically within human science. Typically employed in the public sector.
Avoid waste and save money
Learn new things and personal developmentPlay and competitionDo something for others
Experiment with new technology
The feeling of doing the 'right' thingSupport environmental priorityParticipate in technological developmentContribute to development in the society
MOTIVATION FOR PARTICIPATION AND FLEXIBILITY
Individual level
Social level
Society level
THE SYMPATHETIC
29Customer Behaviour Study
eFle
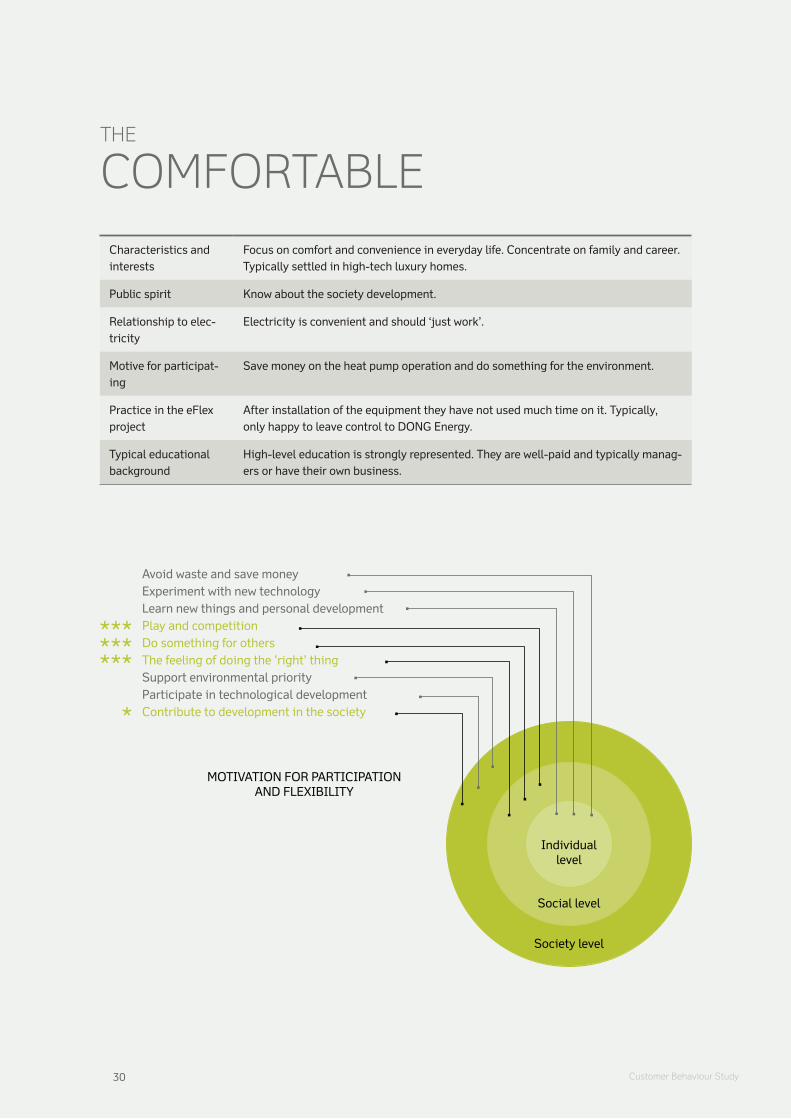
xCharacteristics and interests
Focus on comfort and convenience in everyday life. Concentrate on family and career. Typically settled in high-tech luxury homes.
Public spirit Know about the society development.
Relationship to elec-tricity
Electricity is convenient and should ‘just work’.
Motive for participat-ing
Save money on the heat pump operation and do something for the environment.
Practice in the eFlex project
After installation of the equipment they have not used much time on it. Typically, only happy to leave control to DONG Energy.
Typical educational background
High-level education is strongly represented. They are well-paid and typically manag-ers or have their own business.
Avoid waste and save money
Learn new things and personal developmentPlay and competitionDo something for others
Experiment with new technology
The feeling of doing the 'right' thingSupport environmental priorityParticipate in technological developmentContribute to development in the society
MOTIVATION FOR PARTICIPATION AND FLEXIBILITY
Individual level
Social level
Society level
THE COMFORTABLE
30 Customer Behaviour Study

31Customer Behaviour Study
4.7 A Model for the Study of FlexibilityAs mentioned earlier, an important finding in eFlex is the wide diversity of habits and mental construct in the families. Technology is socialised into the internal family culture and the identi-ties that unfold there, but it has wider implications than the considerations such as user genre or script, as it affects the socio-technical relations too and creates new norms and habits.The behaviour is very far from financially rational and the term moral economy has been used to emphasise the importance of non-financial features in actions.
One of the major achievements of the behavioural studies in eFlex was the creation of mod-els enabling us to understand the complexity and categorise the features in the jungle of diversified habits. The models help us to design communication strategies in future actions towards smart grid and design value proposition tailor-made to specific segments.
It is important to stress that the model represents some limitations. In the smart grid sense, the Distribution company’s interest is represented by flexibility, interruptions, load shedding, investment planning, while the customers’ sphere evolve around change of energy use, sav-ings, avoiding losses, financial benefit, environmental concern and responsibility. To link such differences into one model is not easy.
The model somehow transfers the findings of the project from the social and cultural discus-sion to enable a sociological survey. During the eFlex project, it has unfortunately not been possible to take it all the way to quantification of the group characteristics.
Of the four groups in Figure 3.1 that represent the way we have categorised some character-istics, Willingness is the group that is the easiest to affect through offers and communica-tion. The group consists of
Willingness:Interests, attitudes and valuesRelation and attitude towards technology, economy, climate and environmentIndoor climate and comfort habits.
Change of willingness to participate in load shedding depends very much on how the family ascribe meaning to their flexibility. It has to make sense on the set of values they priorities according to customer segments.
Family compositionMen, women – ageChildrenPets
Single persons or couples living alone are more inclined to be flexible than families with
Figure 4.1 A model as starting point. We consider the customers to have various potentials for flexibility and the question is what kind of technical and financial propositions can be offered together with communication strategies and relations to the customers that can transform such potential to real flexibility.
Willingness
Family composition
Life Situation
Thermal characteristics of the house
POTENTIAL FLEXIBILITY
Communicationand relations
Technical and !nancialconcepts, products and services

32 Customer Behaviour Study
eFle
x children and pets (as a matter of fact, the observations indicate that pets have an effect on the willingness to be flexible).
Life SituationHigh energy consumption and billChange of larger appliances in the familyRenovation, expansion and/or moving to new residencesLife phase – i.e. soon to be retired
Certain conditions can be a motivation for flexibility. This is typically if changes are already taking place and tacit habits become visible or due to known burning platform in form of high energy bills etc. Changing life phase may change the attitude towards flexibility too. People to be retired soon may be motivated to reduce living expenses or seniors for whom career is less interesting and children have moved out of house have more time to be focus on new technologies and society problems.
Thermal Characteristics of the houseInsulationHeating technologyControl devices
The house in itself is of course a basic condition for flexibility. Light houses with poor insula-tion can only have its heating system disrupted for a short while and vice versa. Similarly, a heating system suitable for interruption should of course be available.
4.8 CommunicationTraditionally, the distribution company communicates with the customers primarily via the invoice that the customers normally receive each quarter. For an ordinary Danish customer the invoice is difficult to understand due to the detailed breakdown of the bill. It is expected that only few customers study the invoice critically.
The only other time that an ordinary household customer meets the distribution company is when power supply is down or when the customers have questions to the bill. It is no sur-prise that the ordinary household customer’s relation to the use of electricity is superficial.
eFlex opened and experimented with several alternative communications. The Home Auto-mation portal (and parallel facilities on the provided iPod Touch) offered a direct insight into the online consumption of energy and divided the consumption into details on the con-sumption of the appliances that was connected. Compared to normal household customers, the eFlex customers’ motivation to visit and use the portal was animated by the fact that they had more opportunities to examine the use of energy and the consequences of their actions.
Besides the portal, the customers were supplied with a social platform based on Podio, and of course also the opportunity to use e-mail and the phone.
In Figure 4.2 the different user segments requirements and attitude towards the various opportunities for communication is described.

33Customer Behaviour Study
CO
MM
UN
ICAT
ION
AN
D T
HE
US
ER P
RO
FILE
STH
E TE
CH
NIC
IAN
THE
ECO
NO
MIS
TTH
E C
UR
IOU
STH
E S
YMPA
THET
ICTH
E C
OM
FOR
TAB
LE
GW
R P
orta
lEm
phas
is o
n th
e po
ssib
iliti
es o
f th
e po
rtal
. Dai
ly u
se.
Emph
asis
on
the
poss
ibili
ties
of
the
port
al. D
aily
use
. Mai
nly
use
the
port
al a
nd to
a s
mal
ler e
xten
t al
l the
oth
er G
WR
equ
ipm
ent.
Emph
asis
on
lear
ning
, pla
y an
d co
mpe
titi
ve o
ptio
ns.
Not
use
s in
eve
ryda
y lif
e. F
rom
ti
me
to ti
me
it is
revi
ewed
but
ne
ver g
o in
to d
etai
ls
Not
use
d in
eve
ryda
y lif
e. A
ppre
ci-
ate
grap
hic
repr
esen
tati
ons
and
the
apps
to iP
od T
ouch
/iPh
one.
Podi
oEx
chan
ge o
f exp
erim
ents
and
pr
ofes
sion
al q
uest
ions
. Par
tici
pat-
ing.
Cal
cula
tion
of a
fina
ncia
l nat
ure
is
shar
ed w
ith
othe
r use
rs.
Mai
nly
read
but
don
’t co
ntri
bute
as
Podi
o is
con
side
red
a ve
ry te
chni
-ca
l for
um.
See
Pod
io a
s in
supe
rabl
e an
d do
no
t use
it. R
ead
the
new
s e-
mai
ls
that
sum
up
acti
viti
es o
n Po
dio.
Use
as
littl
e ti
me
as p
ossi
ble
on
the
proj
ect a
nd c
onsi
der
Podi
o as
ti
me-
cons
umin
g.
Invo
ice
Invo
ice
is u
sed
as a
con
trol
tool
an
d is
impo
rtan
t.Im
port
ant t
ool t
o co
ntro
l dev
elop
-m
ent
App
reci
ate
the
grap
hic
pres
enta
-ti
ons
and
com
pari
sons
.Pr
ior t
o th
e eF
lex
part
icip
atio
n th
ey n
ever
pai
d m
uch
atte
ntio
n to
th
e in
voic
e.
Just
pay
the
bill.
The
var
ying
pri
ces
have
how
ever
gen
erat
ed s
ome
inte
rest
in th
e ap
plia
nces
’ con
-su
mpt
ion.
Tele
phon
e an
d e-
mai
l sup
port
Dem
andi
ng c
usto
mer
for t
he
supp
ort t
eam
. Req
uire
that
sup
port
te
am h
ave
prof
ound
exp
erti
se.
Prim
arily
futu
re-o
rien
ted.
Mak
e pr
opos
als
for p
oten
tial
cha
nges
. C
ross
-che
ck o
wn
unde
rsta
ndin
g.
Onl
y su
ppor
t on
erro
rs.
Hav
ing
diff
icul
ty w
ith
tech
nica
l is
sues
and
requ
est a
ssis
tanc
e by
ph
one.
Expe
ct s
ervi
ces.
Exp
ect D
ON
G
Ener
gy to
con
tact
them
if th
ere
are
prob
lem
s or
err
ors.
Futu
re w
ishe
sS
impl
y ca
nnot
rece
ive
enou
gh
feed
back
and
exp
ect t
he d
istr
ibu-
tion
com
pany
to b
e an
adv
ance
d di
alog
ue p
artn
er
Req
uest
feed
back
in D
KK
and
es
peci
ally
the
poss
ibili
ty fo
r com
-pa
riso
n. A
ppre
ciat
e ‘th
e liv
ing
invo
ice’
.
Feed
back
wit
h co
mpe
titi
on. P
rob-
ably
inte
rest
ed in
mor
e ge
nera
l in
form
atio
n to
lear
n fr
om.
Inst
ruct
ions
by
vide
o. S
um u
p ne
ws
e-m
ails
wit
h lin
k to
requ
ired
ac
tion
or i
nfor
mat
ion.
Sum
mar
ies
on c
onsu
mpt
ion.
Faci
litie
s th
at c
ould
gat
her
the
fam
ily w
ould
incr
ease
inte
rest
. Ex
pect
cle
ar a
nd s
impl
e in
form
a-ti
on o
n co
nsum
ptio
n.
Figu
re 4
.2 C
omm
unic
atio
n an
d th
e us
er p
rofil
es.

34 Customer Behaviour Study
eFle
x 4.9 Conclusion on Behavioural ChangeThe problem in drawing conclusion is that more experiments were conducted at the same time and a possible change in behaviour can only with difficulty be ascribed to single interventions.However, the following can be concluded with some certainty:
A very serious mistake can be made if customers are considered one uniform mass. The eFlex project very clearly demonstrated that customers can be divided into segments and these segments are motivated by different combinations of value propositions, and commu-nication has to be made on different media and concern different issues. The studies have shown that households build internal family cultures themselves depending on culturally inherited habits of the individuals and the multi-faceted social situation. A simple and eas-ily understandable model cannot be presented but to some extent, customers can be subdi-vided into the segments with more or less the same values, perception and priorities.Price signal (varying electricity prices) is an extremely complex concept to use as behav-ioural moderator. Customers who we have asked directly will answer that price is impor-tant and they expect ‘something’ in return for flexibility. However, they are motivated by more issues to actually change behaviour and show flexibility. First, customers do not make purely rational financial decisions. Second, the value of electricity may have differ-ent meaning and priority depending on the social reference system in which it is dis-cussed. Third, an automatic control system to provide the flexibility is required, as it can-not be expected that a customer continuously change consumption patterns ( by manu-ally adjustment of electrical appliances) depending on a price signal (or whatever signal is used). The consequence being that higher or lower price will not result in more or less flexibility. The savings which a varying price signal entails is only interesting when dis-cussing the cost for the automatic control system.Not surprisingly, the home automation system and/or the close feedback on energy con-sumption and the consequences on the electricity bill, increased interest in energy ques-tions and fuelled flexibility. The customers in eFlex volunteered for the project and were positively biased towards providing the flexibility. However, the conclusion of the impact of the home automation system is drawn from the interest apparently emerging from ‘play-ing’ with the opportunities that the system provided.
There is hardly any doubt that participation in the project and/or focus on energy consump-tion that the equipment provided, have a positive influence on the customers’ attitude. What we found a bit surprising was that the majority of customers had a very clear prior under-standing of the fact that flexible consumption would be required in future.
In this regard, the learning from eFlex is hardly surprising: when you manage to direct cus-tomers’ attention to an issue, the interest in what lies ‘behind’ this issue will increase.
All customers should be invoiced on basis of variable tariff
I beliveve that all in the future need to have a flexible consump.
eFlex have change my attitude to flexibility positively
I will in the future use home auto. to control and monitoring
eFlex gave me a good understanding of variable tariffs
I prefer monthly bills to quarterly
Monthly bills contributed to my focus on consumption
0 10 20 30 40 50 60 70 80 90 100
Figure 4.3. Customers’ attitude to flexible energy consumption after participation in the eFlex project. A maximum of 100 possible points.

35Customer Behaviour Study
05 MEASUREMENTS AND ANALYSIS
This chapter presents the measurement data and results.
The heat pump customers can choose their preferred heat pump control strategy: Wind : Optimisation9 based on wind power generationPrice: Optimisation by price signals (sum of elspot market price and grid tariff used in eFlex)Price + Wind : Optimisation by combination of the two mentioned above
In general, two thirds of the customers chose a control strategy according to price, and nearly the rest of the customers chose price+wind. The detailed analysis is presented in the following section.
Since the customers have chosen both price+wind and in particular price control strategies, a correlation study of wind generation and price forecasts with respect to consumption fore-casts has been performed and is presented in Appendix A. In general, the study conclude that there is a correlation between price and grid load, hence a price signal can in the general picture be used for controlling heat pump interruption. In order to determine a link between wind production and grid load there is a need to develop a more sophisticated signal than wind generation forecasts.
In the following sections are presented customer preferences concerning their control strate-gies, data and analyses of optimisation measurements and flexibility, and impact on grid load. The final section presents a study of the financial gain for the customers for participa-tion in the heat pump optimisation.
5.1 Customer preferences This analysis aims to illustrate customer preferences and the behavior related to a range of adjustment options:
The choice of optimization control ie: a) price signal, b) signal reflecting the wind energy mix of the total energy in the grid or c) a balanced combination of the two. Adjusted minimum room temperature. Customers could adjust a minimum room tempera-ture prompting the heat pump to re-start (overriding the chosen optimization control period). ‘Party button’. In case customers want exception from the optimisation, they can activate the so-called party button, which ignores the control profile for 24 hours.
5.1.1 Method of calculation
Whenever a change was made in the configuration at the customer, a new line was entered in the database – this meant that the same configuration could occur more than once a day. Theoretically this could cause the same configuration to be counted more than once. It was decided to interpolate available data so that only one optimisation was obtained per day per customer.
Subsequently, the number of customers who selected a specified type of optimisation and used the party button was counted.
5.1.2 ResultsIt is complicated to present a continuous monitoring of the parameters as the customers actually adjust the parameters. Instead, we hereby present three snapshots to demonstrate the preferences.
9 Interruption of a heat pump is not a simple process. In order to achieve financial gain (a maximum wind energy content for that matter) cautions have to be
taken to avoid the heat pump starts up again during the price peak. The question is then: when to start interruption? The time of starting the interruption
depends on the house thermal isolation and the outdoor temperature (of which the later changes over time). We have tried to develop an algorithm that
produce the maximum financial benefit (or wind energy utilisation) and therefor from time to time use the term optimisation for interruption.

36 Executive Summary
eFle
x Figures 5.1 below illustrate observed customer preferences recorded specific days in Decem-ber 2011, January 2012 and February 2012. The customers’ choice of configuration has been examined around year-end where the heat demands are usually high. It has also been de-cided to include February 2012 because on 1 February 2012, the grid tariff was increased from 0.60 DKK/kWh to 0.80 DKK/kWh during peak hours.
Explanation of glossary terms:Wind Optimisation based on wind power generationPrice Optimisation by price signals (sum of elspot market price and grid tariff)Wind + Price Optimisation by combination of the two mentioned aboveNo opt. Optimisation not selectedOverride Party button used
From figure 5.1 it is seen that some of the customers change the settings of type of optimi-sation over time. The reason could be the change in outdoor temperature, which decreased significantly during January. Another reason could be that the wind+price optimisation part resulted in no logical control of the heat pumps depending on the wind regime. The custom-ers may have had a more environmental friendly approach but as we have shown in Appen-dix A, use of wind energy as optimisation parameter is complicated seen from the custom-er’s as well as the distribution utility’s point of view . However, it is still interesting that about one third of the customers emphasise the importance of the environment, which rein-force the results of the behavioural analyses that customers cannot be seen in the light only of homo economicus.
The manual override (also called the party bottom) was in use by approximately 1% of the 119 customers at all time (or at least during the three days used in this example). This cor-responds to each customer using the party bottom once every 3 months on average.
The minimum room temperature remained for the majority of customers at the default tem-perature set upon delivery of the equipment, 170 C. In addition to the rare use of the ‘party button’, we can conclude that the customers’ comfort zone has not been seriously chal-lenged.
5.1.3 Conclusion – customer preferencesAll heat pump customers that participated in the project enabled the heat pump optimisation control. Approximately two thirds of the heat pump customers chose to control their heat pumps with respect to price signals, the rest of the customers chose a signal with a mix of wind produc-tion and price. From December to February approximately 20% of the customers changed their preference control scheme from wind+price to price.
Figure 5.1 Costumer preferences recorded as snapshots in the period December 2011 to February 2012.
DECEMBER 2011
JANUARY 2012
FEBRUARY 2012
TYPE OF CONTROL
Wind 3% 4% 2%
Price 53% 68% 74%
Wind + price 44% 27% 25%
No opt. 0 0 0
OPTIMIZATION ENABLED
Yes 100% 100% 100%
No 0 0 0
OVERRIDEYes 1% 1% 1%
No 99% 99% 99%
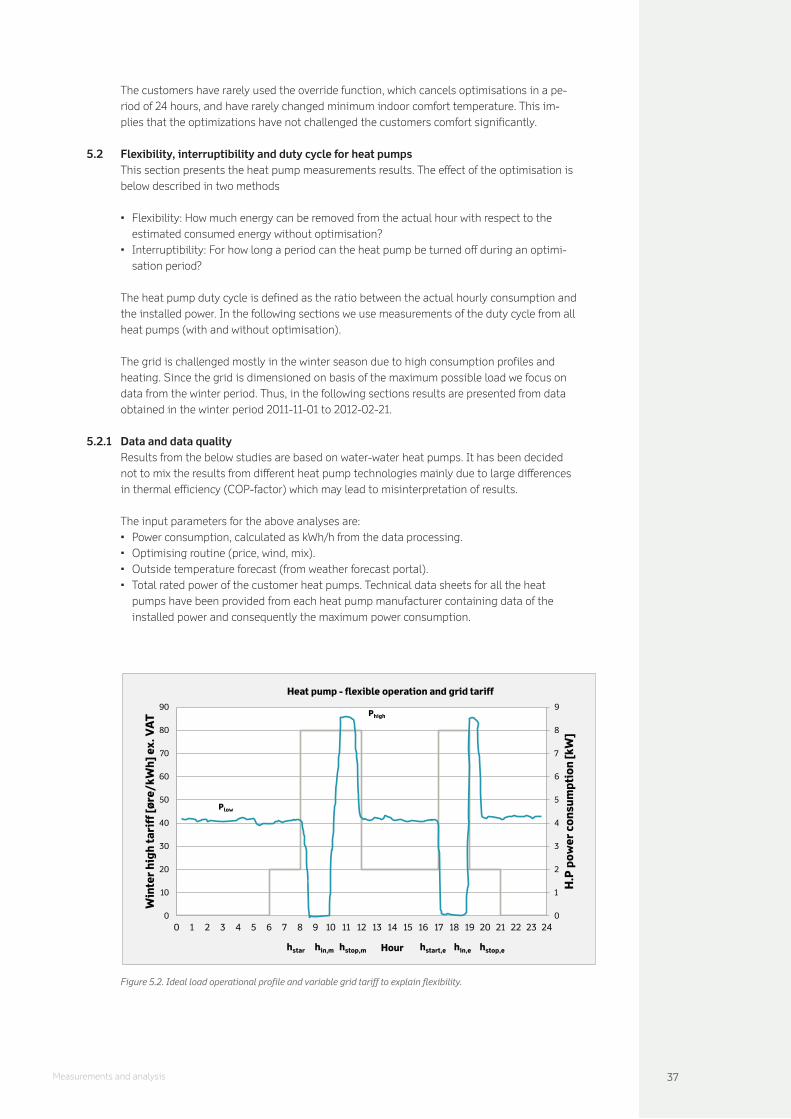
37Measurements and analysis
The customers have rarely used the override function, which cancels optimisations in a pe-riod of 24 hours, and have rarely changed minimum indoor comfort temperature. This im-plies that the optimizations have not challenged the customers comfort significantly.
5.2 Flexibility, interruptibility and duty cycle for heat pumpsThis section presents the heat pump measurements results. The effect of the optimisation is below described in two methods
Flexibility: How much energy can be removed from the actual hour with respect to the estimated consumed energy without optimisation?Interruptibility: For how long a period can the heat pump be turned off during an optimi-sation period?
The heat pump duty cycle is defined as the ratio between the actual hourly consumption and the installed power. In the following sections we use measurements of the duty cycle from all heat pumps (with and without optimisation).
The grid is challenged mostly in the winter season due to high consumption profiles and heating. Since the grid is dimensioned on basis of the maximum possible load we focus on data from the winter period. Thus, in the following sections results are presented from data obtained in the winter period 2011-11-01 to 2012-02-21.
5.2.1 Data and data qualityResults from the below studies are based on water-water heat pumps. It has been decided not to mix the results from different heat pump technologies mainly due to large differences in thermal efficiency (COP-factor) which may lead to misinterpretation of results.
The input parameters for the above analyses are:Power consumption, calculated as kWh/h from the data processing.Optimising routine (price, wind, mix).Outside temperature forecast (from weather forecast portal).Total rated power of the customer heat pumps. Technical data sheets for all the heat pumps have been provided from each heat pump manufacturer containing data of the installed power and consequently the maximum power consumption.
Figure 5.2. Ideal load operational profile and variable grid tariff to explain flexibility.
0
1
2
3
4
5
6
7
8
9
0
10
20
30
40
50
60
70
80
90
0 1 2 3 4 5 6 7 8 9 10 11 12 13 14 15 16 17 18 19 20 21 22 23 24
H.P
pow
er c
onsu
mpt
ion
[kW
]
Win
ter
high
tari
ff [ø
re/k
Wh]
ex.
VA
T
Hour
Heat pump - flexible operation and grid tariff
starh hin,m hstop,m hstart,e hin,e hstop,e
Plow
Phigh

38 Measurements and analysis
eFle
x Some data has been neglected due to data errors and poor network coverage in the custom-ers’ homes which caused periods where data could not be collected.
5.2.2 FlexibilityIn general, the term ‘Flexibility’ is the result of moving the electricity consumption of a cus-tomer from periods with high demands to periods with less demands.
Figure 5.2 above shows an example of an operational profile of a heat pump in the period with variable network tariff. (The red curve illustrates a winter period with high tariff during peak period).
The high tariff starts at 8:00. However, the heat pump does not necessarily stop immediately when reaching the high tariff. This is due to the fact that the optimising routine seeks to avoid that the immersion heater needs to be switched on during the optimising period in case sufficient heat has not been accumulated inside the house. Switching on the immer-sion heater causes the power consumption to increase significantly to Phigh until the electri-cal immersion heater is switched off when reaching hstop,m and the pump is running at normal load, Plow determined by the compressor unit and circulation pumps. The phenomena of excess power consumption is denoted “Kick-back” in the figure10. This is not an ideal situa-tion and furthermore, the kick-back situation may coincide with a period where the grid tariff is high and the utility grid is heavily loaded. In a worst case scenario where the “Kick-back” phenomena occurs on many heat pumps, this may cause critical situations with risk of over-loading the power grid. It must be mentioned that due to variation in outside temperature and tolerances on optimising parameters, there is no guarantee that “Kick-back” will always appear outside periods of high grid tariffs. In figure 5.2, examples are shown with “Kick-back” appearing before the end of a high tariff period during the morning and “Kick-back” appearing after the end of a high tariff period during the evening.
For calculation of the flexibility the challenge is to estimate how much energy the heat pump would consume in case it was not optimised. During the hours where the heat pumps are optimised (turned off), the average electricity consumption (kWh) is calculated based on an estimate of the average electricity consumption during the last three hours prior to initiating the optimising routine. This is a reasonable estimate according to the duty cycle measure-ments we present in Sec. 5.2.9.
Comparing the estimated and actual consumption, it is possible to quantify the customer’s flexibility and thus the amount of peak shaving (moving of electricity consumption outside the intervals of peak load).
Flexibility is defined during the morning (8.00-12.00) and evening (17.00-19.00) according to the below formulas. These time intervals are chosen because of the time intervals defined in the 3-step grid tariffs.
This definition of flexibility is only in the view of the distribution company’s interest, ie. re-garding the peak loads in the grid. Other types of flexibility could be interesting, eg. trading on the balance market.
10 In other literature also known as cold load pick-up
Flex, morning (%) =Estimated kWh, morning - actual kWh, morning
Estimated kWh, morning100
Flex, evening(%) =Estimated kWh, evening- actual kWh, evening
Estimated kWh, evening100

39Measurements and analysis
In figure 5.2, the term Flex (%) is determined by the size of the ‘area’ which can be moved outside the optimising periods compared with the actual area remaining inside the optimis-ing periods. Defining the term “peak shaved energy” as the difference between estimated and actual consumption, the flexibility can be calculated as the ratio of shaved energy com-pared to estimated energy. In other words, the mathematical definition of flexibility used here is the relative amount of energy we can remove from the period where load shedding is wanted. Using this definition, flexibility not only depends on the specific set of conditions for a house but also of the time. It is evident, that a household’s flexibility is not the same dur-ing morning and evening and may vary during a year.
For instance, if estimated heat consumption is 16 kWh during the morning and the con-sumption was only 4 kWh during the optimising period, 12 kWh has been removed from the optimising period and Flex,morning = 75%.
It should be noticed that flexibility is defined according to the grid tariff’s high price signal (see Figure 2.1). Only energy removed from inside the time period of the grid tariff’s high price period is considered in the flexibility calculation. That is, if the maximum price occurs at 22 o’clock due to the interfering of the spot price and heat pumps are interrupted with the purpose to avoid energy use at that time, it is not considered in the flexibility calculation. Similarly if “Kick-back” occurs outside the optimizing window, this will not contribute nega-tively to the estimated flexibility. In the optimizing calculation routine, the above has been taken into account.
FLEXIBILITY RESULTS DURING 17.00-20.00
Temperature range 15 5 -5
5 -5 -15
No. of optimisations 561 1300 200
Estimated 17.00-18.00 298.29 1060.18 157.76 kWh
Estimated 18.00-19.00 351.40 1483.68 259.87 kWh
Estimated 19.00-20.00 72.57 78.82 0.00 kWh
Estimated sum 722.26 2622.69 417.63 kWh
Actual 17.00-18.00 142.87 421.37 82.89 kWh
Actual 18.00-19.00 151.35 612.50 125.28 kWh
Actual 19.00-20.00 38.35 31.10 0.00 kWh
Actual sum 332.57 1064.97 208.17 kWh
Shaved 17.00-18.00 155.42 638.82 74.87 kWh
Shaved 18.00-19.00 200.05 871.18 134.59 kWh
Shaved 19.00-20.00 34.22 47.72 0.00 kWh
Shaved sum 389.69 1557.72 209.46 kWh
Flex 17.00-18.00 52% 60% 47%
Flex 18.00-19.00 57% 59% 52%
Flex 19.00-20.00 47% 61% N/A
Figure 5.3. Flexibility results during 17.00-20.00. The estimated energy consumption during the optimization period is calculated on basis of the energy consumption 3 hours before interruption. The flexibility is calculated as the rela-tive amount of energy that can be removed from the period we intent to interrupt.

40 Measurements and analysis
eFle
x 5.2.3 Flexibility results Figure 5.3 shows the results of the flexibility study between 17.00 and 20.00. The results are shown for 3 various ranges of outdoor temperatures, ie range 5 - 15°C, -5 - 5°C and -15 - -5°C. All energy estimates and measurements are calculated in kWh.
The table in Figure 5.3 lists the no. of optimisations for each temperature range. It is seen that the lowest temperature range has a significant smaller number of optimisations com-pared to the other temperature intervals. However, since the lowest temperature range rep-resents a worst-case for both flexibility values and household consumption profiles, we focus on these results.
It appears that the relative flexibility in the period 17:00 to 18:00 and 18:00 to 19:00 is more or less the same. Thus, if the heat pumps are optimized in a period of 1 hour the exact hour of optimisation is not important, since we obtain the approximate same flexibility whether we optimise between 17:00-18:00 or 18:00-19:00. The flexibility of these heat pumps is approximately 50% for one hour. This means that we can reduce the consumption from the heat pumps by 50% when performing a one hour opti-misation.
Figure 5.4. Flexibility results during 8.00-12.00.The flexibility is calculated as the relative amount of energy that can be removed from the period we intent to interrupt. The estimated energy consumption during that period is calculated on basis of the energy consumption 3 hours before interruption.
FLEXIBILITY RESULTS DURING 8.00-12.00
Temperature range 15 5 -5
5 -5 -15
No. of optimisations 227 779 100
Estimated 8.00-9.00 73.19 79.23 198.73 kWh
Estimated 9.00-10.00 66.24 786.10 83.62 kWh
Estimated 10.00-11.00 52.28 960.31 4.09 kWh
Estimated 11.00-12.00 73.34 827.52 6.32 kWh
Estimated sum 265.05 2653.16 292.76
Actual 8.00-9.00 21.28 29.39 94.57 kWh
Actual 9.00-10.00 26.11 297.84 35.46 kWh
Actual 10.00-11.00 20.39 357.76 2.82 kWh
Actual 11.00-12.00 27.31 310.31 6.07 kWh
Actual sum 95.08 995.30 138.91 kWh
Shaved 8.00-9.00 51.92 49.84 104.16 kWh
Shaved 9.00-10.00 40.13 488.26 48.16 kWh
Shaved 10.00-11.00 31.89 602.55 1.27 kWh
Shaved 11.00-12.00 46.03 517.21 0.26 kWh
Shaved sum 169.97 1657.86 153.85 kWh
Flex 8.00-9.00 71% 63% 52%
Flex 9.00-10.00 61% 62% 58%
Flex 10.00-11.00 61% 63% 31%
Flex 11.00-12.00 63% 63% 4%

41Measurements and analysis
Approximately 12% of the optimisations have a duration of 2 hours in the lowest tempera-ture range, which is not seen in the result of the relative flexibility (the same percentage in the two periods).
The largest peak (usually the load arriving from the afternoon/evening consumption) deter-mines the the maximum capacity of the grid. Thus, the focus in this section is on results that regard reduction of the afternoon peak. The morning peak is naturally also interesting to reduce, however this is mainly interesting if the afternoon peak is reduced such that the morning peak becomes the determining factor. Grid load in a particular radial that arrives from other sectors (industry, service etc.) could also results in the determining peak load at another time that afternoon/evening.
Figure 5.4 shows the results of the flexibility study between 8.00 and 12.00. Results are shown for 3 various ranges of outdoor temperatures, ie range 5 - 15°C, -5 - 5°C and -15 - -5°C.
It is seen that for the lowest temperature range, the flexibility changes significantly between the hours 8:00-12:00, where the hours 8:00-9:00 (both inclusive) have the highest flexibility, and 10:00-11:00 (both inclusive) have a very small flexibility. This is mainly a result of the number of optimizations within these intervals and we cannot directly conclude that the customers are more flexible in the hour 8:00-9:00 than in the hour 11:00-12:00 (notice that the estimated energy consumption is very low in the hours 10:00-11:00 meaning that it is a very low number of optimizations we have registered).
5.2.4 Conclusion – FlexibilityThe flexibility analysis shows a possible afternoon peak reduction of approx. 50% for 1 hour optimisation periods in the coldest temperature range. The results from the hour 17:00-18:00 and 18:00-19:00 are similar which implies that the flexibility is not depending on time within the peak hours. Furthermore, we estimate that the 2 hour optimisation periods do not change the flexibility values significantly, concluding that a more aggressive control algo-rithm is possible.
5.2.5 Interruptibility Interruptibility patterns for heat pumps are used to visualize the actual state (on/off) of the heat pumps. Despite a signal has been passed to switch off the heat pump for instance for 3 hours due to the optimisation routine, the temperature may have dropped to a level forcing the heat pump to restart and consume energy (eg after 2 hours). In this case the actual in-terruptibility of the heat pump will not be 3 hours as expected but only 2 hours.
During data processing we have sorted interruptibility patterns in the three outdoor tem-perature ranges as above, ie 5 - 15°C, -5 - 5°C and -15 - -5°C. The results are expressed in terms of curves showing the average time duration, during which the individual heat pump is stopped.
For the optimizations in the afternoon the interruptibility curves all start at 0 hour (meaning that no matter if the optimisation starts at 17:00 or 18:00 it is plotted to start at 0 hour in the figure). After some time a number of heat pumps restart due to a decrease in indoor temperature or internal algorithms in the heat pump. The restart is detected by monitoring the energy consumption of the heat pump. The results are presented in the below section.
5.2.6 Interruptibility resultsFigure 5.5 shows the interruptibility results from 17.00-19.00. The curves illustrated in figure 5.5 confirm that the possibilities for interruption are highly dependent on the outdoor temperature. Especially when the outdoor temperature is well below 0°C, the amount of successful optimisations decreases significantly.

42 Measurements and analysis
eFle
x Since the lowest temperature range is of highest interest, as argued in the previous section, we focus on these results.
The curve in figure 5.5 is a result of two mechanismsThe number of planned 1 hour, 2 hour, and 3 hour optimizations; which again is depending on the measured outdoor temperature.The realised optimisation period.
In section 5.2.3 we stated that approx. 88% of all optimizations in the lowest temperature range have a duration of one hour. If all of these optimizations had caused the heat pump to be turned off in the full period of one hour, the interruptibility curve would have passed 88% at 1 hour in figure 5.5. However, there is a significant number of optimizing heat pumps that are released from the “off state” and starts consuming energy. These heat pumps reduce the number of heat pumps that are optimizing after one hour to 64%. Similarly, the interruptibil-ity curve would have passed 12% at 2 hours in figure 5.5 if all heat pumps that were sched-uled to optimize in 2 hours were turned off in the full period. However, we see that the curve passes in 7.5%. Thus, approximately one third of the heat pumps that were scheduled to optimize for two hours started to consume energy within the two hour period, and two thirds of the heat pumps were successfully optimized in the full 2 hour period.
Records show that it is usually the internal control system of the heat pump that releases the heat pump back to normal operation during eFlex interruptions rather than the mini-mum room temperature sensor. Many heat pumps are equipped with night setback or simi-lar devices, which is usually adjusted to allow the water temperature to drop a few degrees.
DATA POINTS
Interruption duration [Hours]
Optimising (%)
0 100
1 64
2 7.5
3 0Figure 5.6. Data points from figure 5.5 in the lowest tempera-ture range.
0%
10%
20%
30%
40%
50%
60%
70%
80%
90%
100%
0 1 2 3 4
% o
f opt
imis
atio
ns
Hours
Interruptibility during 17 to 19
15°C til 5°C 5°C til -5°C -5°C til -15°C
Figure 5.5. Interruptibility results during 17.00-19.00.
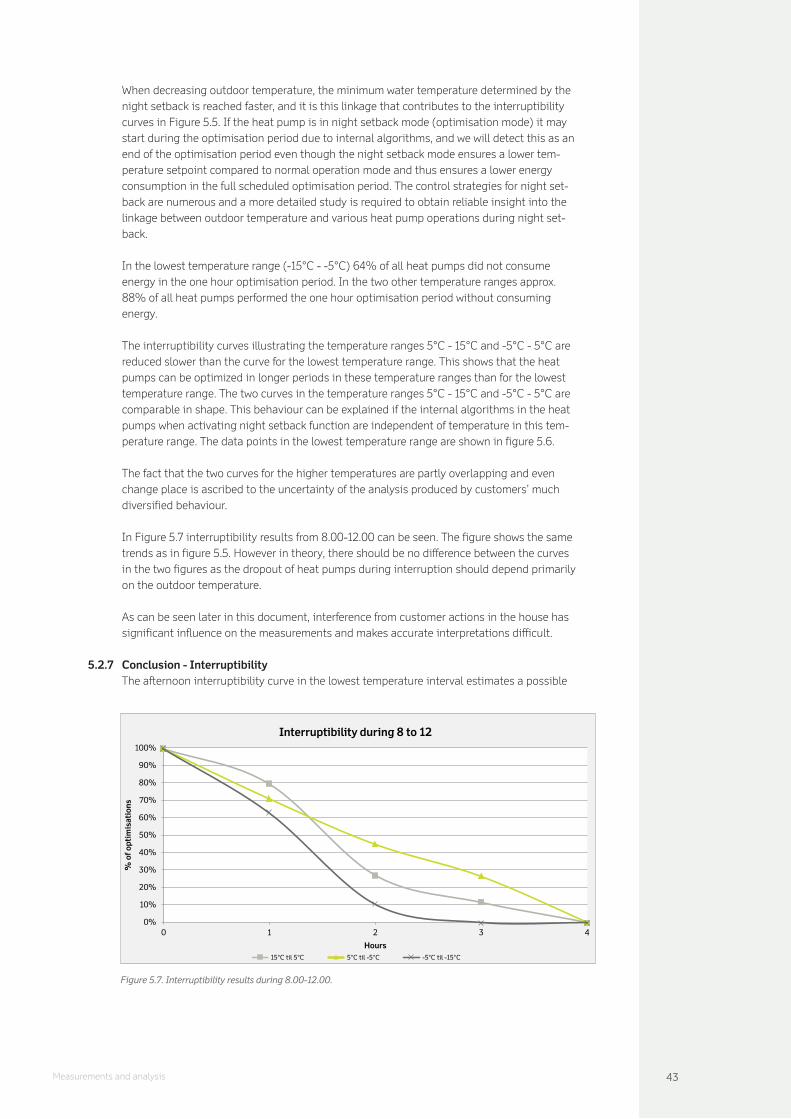
43Measurements and analysis
When decreasing outdoor temperature, the minimum water temperature determined by the night setback is reached faster, and it is this linkage that contributes to the interruptibility curves in Figure 5.5. If the heat pump is in night setback mode (optimisation mode) it may start during the optimisation period due to internal algorithms, and we will detect this as an end of the optimisation period even though the night setback mode ensures a lower tem-perature setpoint compared to normal operation mode and thus ensures a lower energy consumption in the full scheduled optimisation period. The control strategies for night set-back are numerous and a more detailed study is required to obtain reliable insight into the linkage between outdoor temperature and various heat pump operations during night set-back.
In the lowest temperature range (-15°C - -5°C) 64% of all heat pumps did not consume energy in the one hour optimisation period. In the two other temperature ranges approx. 88% of all heat pumps performed the one hour optimisation period without consuming energy.
The interruptibility curves illustrating the temperature ranges 5°C - 15°C and -5°C - 5°C are reduced slower than the curve for the lowest temperature range. This shows that the heat pumps can be optimized in longer periods in these temperature ranges than for the lowest temperature range. The two curves in the temperature ranges 5°C - 15°C and -5°C - 5°C are comparable in shape. This behaviour can be explained if the internal algorithms in the heat pumps when activating night setback function are independent of temperature in this tem-perature range. The data points in the lowest temperature range are shown in figure 5.6.
The fact that the two curves for the higher temperatures are partly overlapping and even change place is ascribed to the uncertainty of the analysis produced by customers’ much diversified behaviour.
In Figure 5.7 interruptibility results from 8.00-12.00 can be seen. The figure shows the same trends as in figure 5.5. However in theory, there should be no difference between the curves in the two figures as the dropout of heat pumps during interruption should depend primarily on the outdoor temperature.
As can be seen later in this document, interference from customer actions in the house has significant influence on the measurements and makes accurate interpretations difficult.
5.2.7 Conclusion - InterruptibilityThe afternoon interruptibility curve in the lowest temperature interval estimates a possible
Figure 5.7. Interruptibility results during 8.00-12.00.
0%
10%
20%
30%
40%
50%
60%
70%
80%
90%
100%
0 1 2 3 4
% o
f opt
imis
atio
ns
Hours
Interruptibility during 8 to 12
15°C til 5°C 5°C til -5°C -5°C til -15°C

44 Measurements and analysis
eFle
x optimisation duration curve. The curves are dependent on the duration of the scheduled optimizations and the time at which the heat pump starts to consume energy. In the pre-sented study 64% of the heat pumps have not consumed energy in the first optimisation hour and 7,5% have not consumed energy in a 2 hour optimisation period. As only one third of the heat pumps restarted within the optimisation period, regardless it was 1 or 2 hour opti-mizations, we conclude that a more aggressive control algorithm is possible for most houses.
5.2.8 Duty CycleThe duty cycle is defined as the ratio between the actual hourly consumption and the in-stalled power according to:
For example, if a heat pump has an installed power of 3 kW and the consumption has been 1.5 kWh during 1 hour, the duty cycle will be 50%. If, for example, the immersion heater has been activated during a period of time and the consumption has been 4.5 kWh, the duty cycle is 150% indicating that the immersion heater has been switched on.
It is expected that the power consumption of a heat pump will be smaller than the installed maximum power. Furthermore, it is expected that the consumption depends on the outside temperature. Based on these assumptions, this implies that the actual load on the grid is smaller than the installed power. In order to confirm/deny this the duty cycle of the heat pumps will be examined during days where they have been subject to optimisation. The duty cycle is calculated as hourly average values based on all customers.
5.2.9 Duty cycle resultsFigure 5.8 shows the duty cycle curves excluding and including optimisation for the three temperature ranges. It is seen that the duty cycle is affected by the outside temperature. During the evening and night, the duty cycle increases because the outside temperature drops. The optimisations between 8.00 and 12.00 and 17.00 and 19.00 are also seen to affect the duty cycle during the optimisations.
Duty cycle (%) =Actual hourly consumtion
kWh( )
hInstalled power (kW) excl. electrical heater
100
Figure 5.8. Comparison of duty cycle curves including and excluding optimisations for three intervals of forecasted outside temperature.
0%
10%
20%
30%
40%
50%
60%
70%
80%
90%
100%
0 1 2 3 4 5 6 7 8 9 10 11 12 13 14 15 16 17 18 19 20 21 22 23
Dut
y C
ycle
Time
Duty Cycle
15°C to 5°C (without opt.) 5°C to -5°C (without opt.) -5°C to -15°C (without opt.)
15°C to 5°C (with opt.) 5°C to -5°C (with opt.) -5°C to -15°C (with opt.)

45Measurements and analysis
Furthermore, it is seen that the difference between the curve with and without optimisation is larger the lower the outdoor temperature is. This is hardly surprising as the lower duty cycle during higher outdoor temperature presents a smaller potential to interrupt. Secondly, we observe that the duty cycle outside the optimisation period is also different (within the same temperature interval), which probably is due to the influence of difference in outdoor temperature (within each interval), solar radiation and human behaviour.
From the figure we define two periods during a 24 hour day which have different duty cycle values. These are listed in figure 5.9 below for the lowest temperature range. From figure 5.8 it is seen that the kick-back effect in the lowest temperature range is very small. Both the curve with and without optimisation shows an increase in duty cycle around 19:00 o’clock and thus it is difficult to draw any conclusions to the size of the kick-back effect caused by the optimisation. It is clear that other parameters play an important role in the curve, such as other heating contributions eg from cooking. Thus, in the further analysis we do not include the kick-back effect and the heat pump’s duty cycles are defined according to figure 5.9.
5.3 Grid impact based on load studies for three 10 kV feedersThe load on the grid is heavily increased when introducing new domestic appliances like heat pumps to the grid. The power grid is historically designed to carry the maximum power determined by the components to handle distributions of energy in the grid which are: ca-bles, switch gear and transformers. The criteria for maximum transmission capacity will always be determined by the component with the smallest rated current (power) capacity in the grid.
Reinforcing the grid to cope with increasing load demands will imply considerable invest-ments. In order to avoid or postpone investments due to increasing demands, analysis will be made to examine the effect of reducing the maximum load, ie load shedding. In this re-spect, the results from the interruptibility study will be utilised in a study of simulated heat pumps in the grid.
Naturally, the impact on the grid will be closely linked to the forecast of future heat pumps which is assumed to be installed by the customers. To account for this, 3 different 10 kV feeders have been selected in the grid in North Zealand, where the potential number of in-stalled heat pumps has been estimated in another scenario project made by DONG Energy. In this project, the number of estimated heat pumps is 80,000 in the DONG Energy electric-ity supply area in 2025. This number has been divided into individual locations within the grid and this determines the estimated number of heat pumps on each 10 kV feeder. The examples have been selected to illustrate different loads impact: Reduced volume, medium volume and high volume of heat pump penetration yielding the 10 kV feeders as follows:
Reduced volume: Nymøllegård feeder 13, NYM13 – 206 pcs. heat pumps. The total number of customers is 2109 corresponding to a penetration ratio of 9.8%Medium volume: Glentegård feeder 16, GLN16 – 525 pcs. heat pumps. The total number of customers is 3117 corresponding to a penetration ratio of 16.8%High volume: Holmegård feeder 02, GLN02 – 806 pcs. heat pumps. The total number of cus-tomers is 917 corresponding to a penetration ratio of 87.9%
DUTY CYCLE
Duty cycle time interval Value (%)
17 – 08 80
08 – 17 70
Figure 5.9. Duty cycle values for the lowest temperature range (-15°C - -5°C) defined by data in figure 5.8.

46 Measurements and analysis
eFle
x Analysis on grid impact is carried out from 17.00-19.00 because the peak load occurs during this time interval in private households.
5.3.1 Calculation set-upAll calculations of grid impact related to penetration of heat pumps have been prepared based on a worst case scenario during the time of the year where the 10 kV feeders have the highest peak load (measured in kW). Measured duty cycle are included in the grid impact analysis in order to reflect the overall power consumption of the heat pumps on a daily basis. The average duty cycle values used are shown in figure 5.9. The estimated power consumption for heat pumps at individual hours is as follows:
where heat pump (HP) consumption (kW) is calculated average kW at each hour during a day.
Duty cycle curves are used in order to estimate the equivalent load when the heat pumps are operated during a specified period of time.
The H.P. rated power in the above equation describes the nominal power of the heat pump. The heat pump is dimensioned according to the customer’s financial point of view. Today in most houses, the heat pump compressor unit is dimensioned to meet the heating demands in a majority of hours during a heating season. However, in case of extreme low outside temperatures the immersion heater needs to be switched on to supply sufficient heat to maintain a specified inside room temperature11. Based on the data of eFlex customers’ wa-ter-water heat pumps, the nominal heat pump power is defined as H.P. rated power = 3 kW for all customers.
In order to evaluate the number of heat pumps which follow the optimising signal, the curve for the lowest temperature range in figure 5.5 (ie data in figure 5.6) is used and averaged to cover periods of hours, see figure 5.10. For estimating the effect on the grid we assume that all heat pumps are reactivated (at the end of the optimisation period). That is to invert the figures in Figure 5.10.
Again, note that interruption duration values are based on measurements recorded in the winter period because the most conservative estimates for possibilities for interruption are related to the temperature interval -15°C - -5°C.
11 Seen from a utility point of view, this is an unfavourable situation and imposes higher load and more stress to the grid, especially in case where the electrical
heater needs to be switched on during the peak load hours. From the customer’s point of view this gives a COP factor close to 1 (when the immersion heater is
turned on), which is not a beneficial utilisation of a heat pump.
In order to avoid the use of the immersion heater the customer needs to invest in expensive solutions such as a larger heat pump or a heat storage capacity,
however today this is not economically beneficial for the customer. From a utility point of view the investment in a larger heat pump or storage capacity is a
favourable situation since the high power immersion heater is not in use and at any time.
H.P. consumption (kW) = Duty cycle average (%) H.P. rated power (kW)
DATA POINTS
Interruption duration [Hours]
Optimising (%)
1 82
2 36
3 4
Figure 5.10. Data points from figure 5.5 in the lowest tempera-ture range. Notice the use of relative time, ie. all optimiza-tions are seen as starting at the same time, 0 o’clock.

47Measurements and analysis
5.3.2 Grid load shedding impact on NYM13NYM13 has a 10 kV outgoing feeder cable specified as 240 mm2 ALAPB12. Rated current car-rying capacity is 341 A for the cable. The maximum cable current permitted is 239 A when applying the 70% load limit defined by DONG Energy’s grid dimensioning criteria. In prac-tice, 70% limit is used at 10 kV level, since two 10 kV neighbour feeders must always be able to supply the power in case of a fault in the main supply output.
Figure 5.11 shows the overall grid impact assuming that there are 206 heat pumps on NYM13. In the figure historical load data are shown by the red columns. These values repre-sent the highest load measured on NYM13 throughout a year. The green plus purple columns show the resulting load on NYM13 in case 206 heat pumps without eFlex control are in-stalled at customers on the feeder. The example in figure 5.11 shows that the load is far from reaching the maximum limit of 239 A. Introduc-tion of eFlex control aids reducing the overall load on the feeder (the reduction is illustrated by purple columns); however flexibility control is not deemed necessary on this feeder with re-duced heat pump penetration.
Use of heat pump optimisation will support the available grid reserve. Figure 5.12 shows a bar chart with available grid reserve on NYM13 feeder cable with and without eFlex optimisa-tion of heat pumps. The bar chart shows that the available grid reserve will increase by ap-prox. 7% if the heat pumps are optimised with the eFlex control.
5.3.3 Grid load shedding impact on GLN16GLN16 has a 10 kV outgoing feeder cable speci-fied as 240 mm2 ALAPB. Rated current carrying capacity is 341 A for the cable. The maximum cable current permitted is 239 A when applying the 70% load limit defined by DONG Energy’s grid dimensioning criteria.
12 ALAPB: Aluminium cable with oil impregnated paper insulation.
Figure 5.12. Impact on available grid reserve on NYM13 with and without eFlex optimisation of heat pumps.
0
50
100
150
200
250
0 1 2 3 4 5 6 7 8 9 10 11 12 13 14 15 16 17 18 19 20 21 22 23
W.C. load [Ah/h] on Nymøllegård 13 feeder - NYM13. Winterday
Peak reduction
HP current with eFlex control
Current today
Imax = 239 Ah/h
Figure 5.11. Grid impact on NYM13 assuming that there are 206 installed heat pumps on the feeder.
37.4%
44.2%
Without HP control
With HP control
6.8%

48 Measurements and analysis
eFle
x
Figure 5.13 shows the overall grid impact assuming a total of 525 heat pumps on GLN16. In the figure the historical recorded data is shown by the red columns. These columns repre-sent the highest load measured on GLN16 throughout a year. The green plus purple columns show the resulting load on GLN16 in case 525 heat pumps without optimisation are in-stalled. In this situation, the cable is loaded above the permissible limit of 239 A, meaning that the feeder is not capable of providing reserve capacity to a neighbour feeder in case of a fault. Adapting eFlex control as previously explained, the grid load is decreased as shown by the purple columns. A significant reduction can be seen during the start of the optimising period, however the desired effect is only obtained until approximately 18.00 and the limit is exceeded again due to the fact that the interruptibility of heat pumps is rapidly reduced after 1 hour (cf figure 5.5).
After 19.00 the optimisation is released and the power consumption is described by green and red columns. The figure shows that the eFlex optimisation scheme where all heat pumps are optimised in the same time is not optimal with respect to this particular feeder. The eFlex rou-tine reduces the power too much in the hour 17:00-18:00, and too little in the following three hours. Thus, this implies that a portfolio man-agement routine is needed in order to reduce the peak in a longer time interval. This issue will be discussed further in Sec. 5.3.5.
Figure 5.14 shows a bar chart illustrating the available grid reserve on GLN16 feeder cable when installing heat pumps with and without eFlex control. The grid reserve is increased from -19% (overloaded) to -11% (overloaded) of max cable current, ie 239 A. Thus, as also seen in figure 5.13 eFlex optimisation alone cannot reduce the consumption such that the maxi-mum current criteria is met, even though the eFlex optimisation reduces the maximum cur-rent by approx. 8%.
Figure 5.13. Grid impact on GLN16 assuming that 525 heat pumps are installed on the feeder.
0
50
100
150
200
250
300
350
0 1 2 3 4 5 6 7 8 9 10 11 12 13 14 15 16 17 18 19 20 21 22 23
W.C. load [A] on Glentegård 16 feeder - GLN16. Winterday
Peak reduction
HP current with eFlex control
Current today
Imax = 239 Ah/h
Figure 5.14. Impact on available grid reserves on GLN16 with and without eFlex optimisation of heat pumps.
-19.4%
-11.1%
Without HP control
With HP control
6.8%

49Measurements and analysis
5.3.4 Grid load shedding impact on HOL02HOL02 has a 10 kV outgoing feeder cable specified as 95 mm2 CUAPB13. Rated current carry-ing capacity is 260 A for the cable. The maximum cable current permitted is 181 A when applying the 70% load limit defined by DONG Energy’s grid dimensioning criteria.
Figure 5.15 shows the overall grid impact assuming that there are 806 heat pumps on HOL02.
The impact on HOL02 from a high volume of heat pumps appears clearly from figure 5.15. Using no intelligent control of heat pumps (red plus green plus purple columns) the maxi-mum allowable cable current will be exceeded during the evening peak from 17:00 to 20:00. The eFlex control is nearly enough to keep the total power consumption below dimensioning criteria. In this case a portfolio management of the heat pumps can enable a consumption reduction in a longer period of time and reduce the peak such that the consumption is kept within the dimensioning criteria. Figure 5.16 shows a bar chart of the available grid reserve on the HOL02 feeder cable when installing 806 heat pumps with and without eFlex control. From the figure it can be seen that the estimated grid reserve increases by approximately 5-6% when using eFlex control (though there is still need for a small peak re-duction, approx. 4%, in order to stay below the dimensioning criteria).
5.3.5 Load shedding through portfolio manage-ment control of heat pumpsBased on the results presented for the three 10 kV feeders, it can be concluded that the eFlex optimising routine is able to provide load shed-ding in the grid and thus providing increased grid reserves. The grid impact study provides an estimate of the improved grid reserve capacity between 4% and 9%.
13 CUAPB: Copper cable with oil impregnated paper insulation.
Figure 5.16. Impact on available grid reserves on HOL02 with and without eFlex optimisation of heat pumps.
-9.6%
-4.1%
Without HP control
With HP control
5.5%
0
50
100
150
200
250
300
0 1 2 3 4 5 6 7 8 9 10 11 12 13 14 15 16 17 18 19 20 21 22 23
W.C. load [A] on Holmegård 02 feeder - HOL02. Winterday
Peak reduction
HP current with eFlex control
Current today
Imax = 182 Ah/h
Figure 5.15. Grid impact on HOL02 assuming that there are 806 heat pumps installed on the feeder.

50 Measurements and analysis
eFle
x The study displays the effect of heat pump flexibility on the grid with three examples. Grid reinforcement will be required in parts of the grid even when flexibility of heat pumps is taken into account. The study only provides an impression of the range of flexibility that can be expected compared to the normal grid load, and points to new issues for discussion.Regarding the latter, two issues are of interest. First, it appears that the period of interrup-tion is an issue that has to be considered and with the algorithm used for optimisation, the period has not been sufficiently long. Figure 5.15 is a good example of poor utilization of the flexibility potential. The peak saving is removing more energy than necessary. A better utili-zation of the flexibility potential will be achieved if it could be prolonged in time and kept on the average grid load level.
Second, the kick-back effect is significantly smaller than expected as regards the synchro-nous release of heat pumps. As discussed elsewhere in this report, this is due to user prac-tice and other activities in the homes.
An instrument for solving the problem regarding the length of the period of peak shaving could be to introduce portfolio management control of heat pumps; ie to interrupt heat pumps in groups. The basic idea is that the number of heat pumps which can be switched off is arranged according to a schedule. The previous examples showed that the evening peak has a duration of many hours and one heat pump cannot alone be turned off for the full pe-riod, thus portfolio management is a tool that can enable a longer shut down period seen from an overall perspective.
The example from previous section with GLN16 is shown below, however this time a portfolio management scheme is controlling the start time of the optimisation. The 525 heat pumps that are simulated in the example are split into 4 groups with the aim to prolong the load shedding and thereby decrease the maximum load on the feeder as much as possible. Figure 5.17 shows the example of a portfolio management curve for 4 groups of heat pumps with scheduled switching off patterns.
Figure 5.17 shows that as regards group 1, 4% of all heat pumps are switched off between 17.00 and 18:00. Between 18:00 and 19:00 a total of 63% of the heat pumps are optimising, consisting of 2% from group 1 and 61% from group 2.
0%
10%
20%
30%
40%
50%
60%
70%
17:00-18:00 18:00-19:00 19:00-20:00 20:00-21:00 21:00-22:00 22:00-23:00
Group 1 Group 2 Group 3 Group 4
Figure 5.17. Portfolio management curve adapted for 4 groups of heat pumps optimised for GLN16.

51Measurements and analysis
It must be emphasised that the portfolio management scheme in figure 5.17 is designed to follow the shape of the consumption values in figure 5.13. Maximum flexibility is required around 18 with peak load demand and thus the portfolio management curve is planned with highest interruptibility during peak hours.
The impact on the power load for GLN16 is seen in figure 5.18. In this particular example, the portfolio management scheme reduces the peak load to reach 250 A instead of 262 A (which was the peak load in figure 5.13).
As it appears from the above figure portfolio control assists in the reduction of the additional load caused by heat pumps. Despite that portfolio control in this case does not reduce the load to meet the dimensioning criteria it is illustrated that portfolio control is an important mechanism in order to reduce peak load on a feeder.
5.3.6 ConclusionThe impact of interruption of heat pumps depends on the heat pump load in the grid and the configuration of the particular feeder in question. However, it clearly appears from the three very different examples that noteworthy load shedding is taking place. The question is whether the load shedding is sufficient to significantly avoid a load peak and consequently postpone investment in grid reinforcement, compared to the investment required to initiate load shedding.
The grid impact study provides an estimate of the improved grid reserve capacity between 4% and 9% in the three examples. However, the future development in consumption patterns have not been taken into account and the examples are not suitable for extrapolation to the full grid. The general development in grid load (quantitative as well as the characteristics of the load) has to be carefully monitored and included in the overall assessment whether in-vestment in the technology with the customers counterbalances the avoided investment.
The small impact on load grid reserve mentioned above bounds from the rather small opti-misation period (approx. 2 hours) that has been used in eFlex. The consumption patterns and analysis above shows that 2 hours period are not sufficient to reduce peak significantly. The control algorithms need to have a much longer duration, eg five to six hours. Such long duration optimisations are not possible on single heat pumps, however in areas with large penetration of heat pumps we can apply portfolio management control schemes. In the above example of GLN 16, portfolio management improves the grid reserve with 15% (where
Figure 5.18. Grid impact on GLN16 assuming that there are 525 heat pumps installed on the feeder and using portfolio control.
= 239 Ah/h
0
50
100
150
200
250
300
350
0 1 2 3 4 5 6 7 8 9 10 11 12 13 14 15 16 17 18 19 20 21 22 23
W.C. load [A] on Glentegård 16 feeder - GLN16. Winterday
Peak reduction
HP current with eFlex portfolio mgt
Current today
Imax

52 Measurements and analysis
eFle
x eFlex control alone improves with 10%). If the penetration of heat pumps was even higher, then the portfolio scheme could contribute even further to reduce peak load.
The optimum portfolio management scheme is individual for each feeder. The individual control scheme for the feeder is determined by the load profile and the number of controlla-ble heat pumps on the specific feeder.
5.4 Peaks having of residential customers load pro!leIn this section we use the results from the previous chapters to determine the maximum possible peak reduction of a residential customer with heat pump optimisation compared to a residential customer without heat pump optimisation.
The residential load curve that we use contains measured and averaged data from a substa-tion with residential customers without electric heating14 in winter weekdays, see figure 5.19.We use the duty cycle results in figure 5.9 and can then add the energy consumption from a heat pump (with a nominal power of 3 kW). The heat pump consumption is added to the household consumption, see figure 5.19.
If we shave the peak from 17-22 (both hours inclusive) we will obtain the load curve shown in figure 5.20 (assuming there is no significant kick-back effect). The energy that is reduced from this total consumption curve is 2.7 kWh. Thus a heat pump needs to be able to reduce the energy by 2.7 kWh in the period from 17-22 in order to reduce the afternoon/evening peak from a residential customer. This reduction will decrease the peak from approx. 4 kWh/h in the hour 18:00-19:00 to 3.3 kWh/h in the hour between 23:00 and 24:00 (which equals approx. 18% peak reduction).
As seen in the figure the customer also contributes to a peak in the morning (between 07:00 and 09:00). However, since the peak in the afternoon is larger we focus on this and assume that if we can reduce the large evening peak we can definitely reduce the smaller morning peak.
Now we assume an area with a large number of residential customers and a large number of heat pumps. The average consumption from each household with heat pump will then be illustrated by the load curve in figure 5.20.
14 NST 987, data from 11/1-15/1 2010. This substation includes approx. 120 residential customers without electric heating.
0
0,5
1
1,5
2
2,5
3
3,5
4
0 1 2 3 4 5 6 7 8 9 10 11 12 13 14 15 16 17 18 19 20 21 22 23
Residential customer with heat pump
HP without optimization
Power today
Figure 5.19: Load curve (y-axis shows energy [kWh/h]) for a residential customer without electric heating a winter weekday (red) and with a heat pump consumption profile without optimisation (green).The load curve is obtained as an average from 120 customers on a real radial.

53Measurements and analysis
The number of heat pumps that are optimized in each optimisation hour is defined by the obtained duration curves in figure 5.10. The potential energy to be removed by the heat pump optimisation is 2,9 kWh (by using data from figure 5.10, duty cycle from figure 5.9 and a heat pump power of 3 kW). Since the energy reduction is larger than the total energy needed to reduce the peak from the residential customer profile between 17:00-22:00, we can apply a portfolio optimisation which completely reduces the peak between 17:00-22:00.
Note, that without portfolio optimisation we will reduce the peak 18:00-19:00 significantly, however the peak will be moved to 20:00 o’clock which in total gives a small peak reduction from approx. 4 kWh/h (18:00-19:00) to 3.7 kWh/h (20:00-21:00) for each household.
In figure 5.21 the portfolio optimisation scheme that enables full peak reduction is shown. Introducing a portfolio optimisation routine as illustrated in the figure allows shaving the household peak completely in the hours between 17:00 and 22:00.
Figure 5.20: The effect of ideal optimisation of many customers by portfolio management projected to one single customer. The figure shows that it is possible to reduce the peak from the household incl. heat pump with 18%, which equals a reduction of approx. 30% of the heat pumps own contribution to the peak.
0
0,5
1
1,5
2
2,5
3
3,5
4
0 1 2 3 4 5 6 7 8 9 10 11 12 13 14 15 16 17 18 19 20 21 22 23
Residential customer with heat pump
Peak reduction
HP with portfolio management
Power today
30% 18%
0%
5%
10%
15%
20%
25%
30%
35%
17:00-18:00 18:00-19:00
19:00-20:00
20:00-21:00
21:00-22:00
22:00-23:00
23:00-24:00
Group 1 Group 2 Group 3 Group 4 Group 5 Group 6
Figure 5.21: Portfolio optimization scheme of 6 groups of heat pumps in order to remove afternoon peak from normal household consumption.
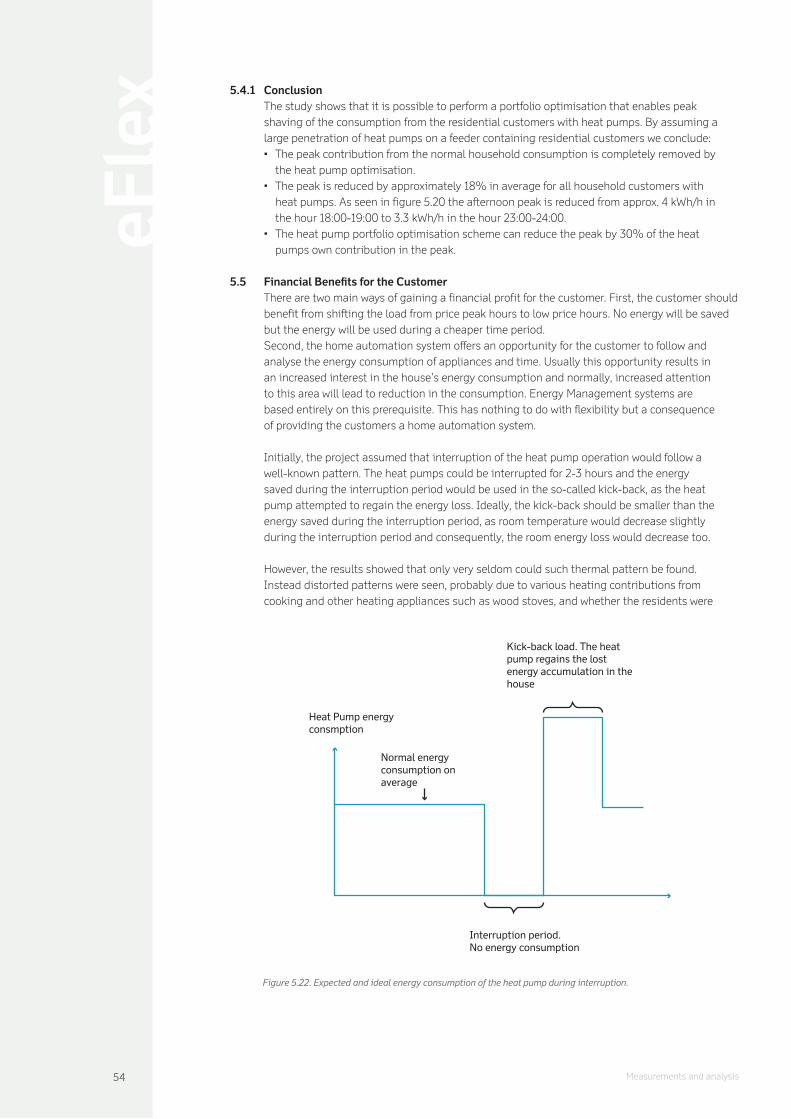
54 Measurements and analysis
eFle
x 5.4.1 ConclusionThe study shows that it is possible to perform a portfolio optimisation that enables peak shaving of the consumption from the residential customers with heat pumps. By assuming a large penetration of heat pumps on a feeder containing residential customers we conclude:
The peak contribution from the normal household consumption is completely removed by the heat pump optimisation. The peak is reduced by approximately 18% in average for all household customers with heat pumps. As seen in figure 5.20 the afternoon peak is reduced from approx. 4 kWh/h in the hour 18:00-19:00 to 3.3 kWh/h in the hour 23:00-24:00. The heat pump portfolio optimisation scheme can reduce the peak by 30% of the heat pumps own contribution in the peak.
5.5 Financial Bene!ts for the CustomerThere are two main ways of gaining a financial profit for the customer. First, the customer should benefit from shifting the load from price peak hours to low price hours. No energy will be saved but the energy will be used during a cheaper time period. Second, the home automation system offers an opportunity for the customer to follow and analyse the energy consumption of appliances and time. Usually this opportunity results in an increased interest in the house’s energy consumption and normally, increased attention to this area will lead to reduction in the consumption. Energy Management systems are based entirely on this prerequisite. This has nothing to do with flexibility but a consequence of providing the customers a home automation system.
Initially, the project assumed that interruption of the heat pump operation would follow a well-known pattern. The heat pumps could be interrupted for 2-3 hours and the energy saved during the interruption period would be used in the so-called kick-back, as the heat pump attempted to regain the energy loss. Ideally, the kick-back should be smaller than the energy saved during the interruption period, as room temperature would decrease slightly during the interruption period and consequently, the room energy loss would decrease too.
However, the results showed that only very seldom could such thermal pattern be found. Instead distorted patterns were seen, probably due to various heating contributions from cooking and other heating appliances such as wood stoves, and whether the residents were
Heat Pump energy consmption
Kick-back load. The heat pump regains the lost energy accumulation in the house
Normal energy consumption on average
Interruption period. No energy consumption
Figure 5.22. Expected and ideal energy consumption of the heat pump during interruption.

55Measurements and analysis
home, entertained guests, overrode the optimisation manually, any additional control equip-ment, sunlight etc.
This made measurement of financial benefit for the customer very complicated, not to say impossible. The calculation of financial benefit requires that one determines the value of the energy not used during the interruption in order to discover the savings but the heat pump is not consuming energy according to the ideal model shown in figure 5.22.
Figure 5.23 shows the duty cycle for all heat pumps of the project during a certain time pe-riod. The periods of optimisation can clearly be seen but the figure also indicates a very varied pattern outside the optimisation period. The relative large variations in outdoor tem-perature appear to have an influence on the duty cycle. When observing the outdoor tem-perature, it appears that the temperature is decreasing during the entire night until sunrise where temperature is rising rapidly. This may lead to the slight increase in the duty cycle during night time and the reason why the duty cycle is lower during day time.
Due to that pattern of the heat pump duty cycle, calculation of energy that could have been used during the period of optimisation is impossible.
We found quite a number of patterns like the ones in figure 5.24 and the patterns seen are unexplainable without detailed knowledge of what happened in the house during these specific days. We do not have that knowledge.
However, based on an ideal pattern we can calculate the expected savings for a customer by shifting the heat pump operation from peak price to the next price level in the three step grid tariff (see Figure 2.1).
Using the measured duty cycles for outdoor temperature in the Design Reference Year15 in Denmark to calculate the energy consumption of a 3 kW heat pump and assuming a price difference between peak price and the second level of DKK 0.60 and a well-insulated house that will allow 3 hours of interruption during the morning peak and 2 hours of interruption during the evening peak (which is the length of the price peak) will result in annual savings of DKK 575 (~ 75 "). For a poorly insulated house that will only allow 1 hour of interruption during morning and evening peak, the annual savings will be DKK 225 (~ 30 ").
15 The Danish Design Reference Year contains 2906 degree days and is based on average outdoor temperature measurements in the years 1941 to 1980.
0%
10%
20%
30%
40%
50%
60%
70%
80%
90%
0 1 2 3 4 5 6 7 8 9 10 11 12 13 14 15 16 17 18 19 20 21 22 23
Dut
y C
ycle
Time
Duty Cycle
15°C to 5°C (with opt.) 5°C to -5°C (with opt.) -5°C to -15°C (with opt.)
Figure 5.23. Duty cycle for heat pumps on average during the period 1 November to 21 February. Duty cycle divided into three outdoor temperature categories. Heat pumps are equipped with on/off control system. The duty cycle shows the frequency of ‘on’ during a time interval, ie 60% means that within a certain hour the heat pump is ‘on’ 60% of the time and ‘off’ 40% of the time.

56 Measurements and analysis
eFle
x
In reality, savings can be larger as the kick-back is not necessarily limited only to the time period just after the interruption but could be spread out over a longer period of time and thereby entering the cheapest price interval.
The 3-step grid tariff used at DONG Energy is only in effect during weekdays and only during the winter season from October to April (6 months). If the 3-step grid tariff is in effect during every day of the week, ie also during weekends, the annual savings will increase to DKK 805 (107 ") and DKK 315 (42 ") respectively.
In figure 5.25 is shown the variation in annual savings depending on the price jump from high price level to the middle price level. If the elspot market tariff is added to the used 3-step market tariff, and we assume that the peaks are correlated, this will typically add approximately DKK 0.20 to the tariff and result in the values found for the DKK 0.8.
The customers of the eFlex project were equipped with a home automation system with the purpose to raise interest in their energy consumption. The home automation system pre-sented detailed and almost online measurement of energy consumption.
As expected the effect of increased awareness of the energy consumption lead to an immedi-ate reduction in energy consumption; the same effect utilised in general energy manage-ment systems. The main reasons are that customers become knowledgeable of appliances that consume more energy than expected; eg stand-by power and malfunctioning refrigera-tors, and the customers’ consciousness or unconsciousness change behaviour towards sav-ing energy.
0
0,2
0,4
0,6
0,8
1
1,2
1,4
1,6
0
500
1000
1500
2000
2500
3000
0 1 2 3 4 5 6 7 8 9 10 11 12 13 14 15 16 17 18 19 20 21 22 23
kWh/
h
Pow
er [
W]
Date
kWh/h
0
0,2
0,4
0,6
0,8
1
1,2
1,4
1,6
0
500
1000
1500
2000
2500
3000
0 1 2 3 4 5 6 7 8 9 10 11 12 13 14 15 16 17 18 19 20 21 22 23
kWh/
h
Pow
er [W
]
Date
kWh/h
Figure 5.24. Some examples of operation patterns for heat pumps that were typical.
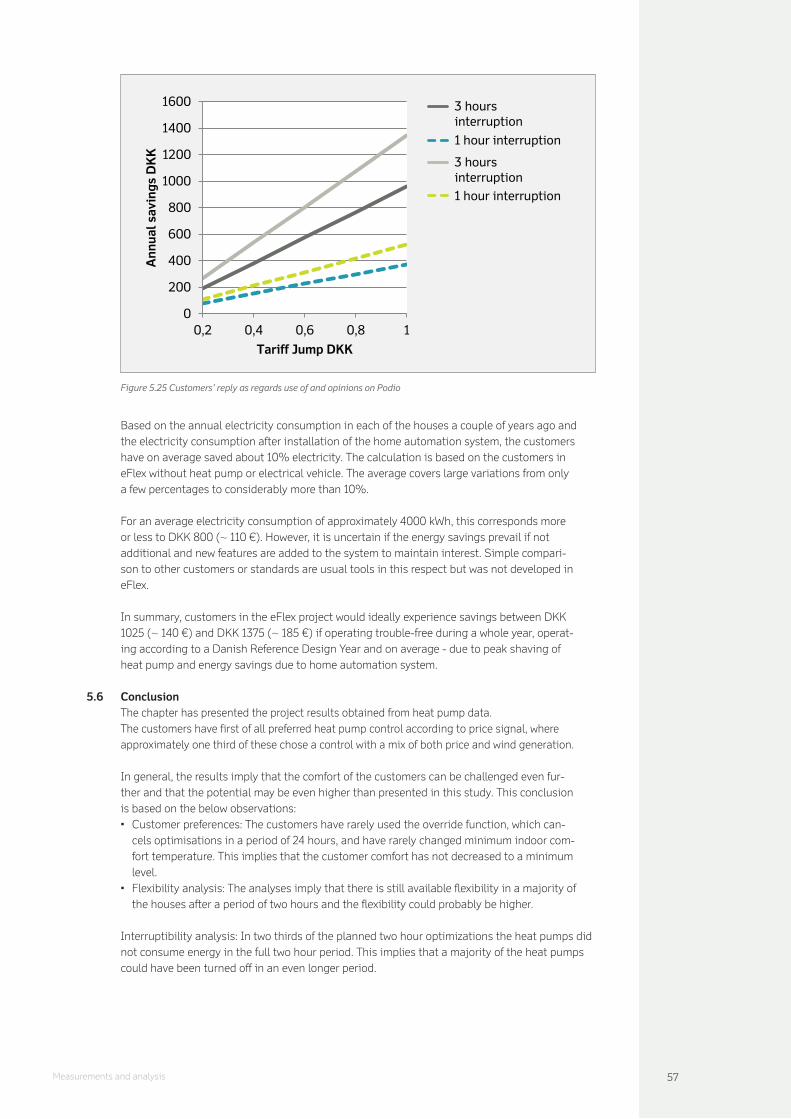
57Measurements and analysis
Based on the annual electricity consumption in each of the houses a couple of years ago and the electricity consumption after installation of the home automation system, the customers have on average saved about 10% electricity. The calculation is based on the customers in eFlex without heat pump or electrical vehicle. The average covers large variations from only a few percentages to considerably more than 10%.
For an average electricity consumption of approximately 4000 kWh, this corresponds more or less to DKK 800 (~ 110 "). However, it is uncertain if the energy savings prevail if not additional and new features are added to the system to maintain interest. Simple compari-son to other customers or standards are usual tools in this respect but was not developed in eFlex.
In summary, customers in the eFlex project would ideally experience savings between DKK 1025 (~ 140 ") and DKK 1375 (~ 185 ") if operating trouble-free during a whole year, operat-ing according to a Danish Reference Design Year and on average - due to peak shaving of heat pump and energy savings due to home automation system.
5.6 ConclusionThe chapter has presented the project results obtained from heat pump data.The customers have first of all preferred heat pump control according to price signal, where approximately one third of these chose a control with a mix of both price and wind generation.
In general, the results imply that the comfort of the customers can be challenged even fur-ther and that the potential may be even higher than presented in this study. This conclusion is based on the below observations:
Customer preferences: The customers have rarely used the override function, which can-cels optimisations in a period of 24 hours, and have rarely changed minimum indoor com-fort temperature. This implies that the customer comfort has not decreased to a minimum level.Flexibility analysis: The analyses imply that there is still available flexibility in a majority of the houses after a period of two hours and the flexibility could probably be higher.
Interruptibility analysis: In two thirds of the planned two hour optimizations the heat pumps did not consume energy in the full two hour period. This implies that a majority of the heat pumps could have been turned off in an even longer period.
0
200
400
600
800
1000
1200
1400
1600
0,2 0,4 0,6 0,8 1
Ann
ual s
avin
gs D
KK
Tariff Jump DKK
3 hoursinterruption1 hour interruption
3 hoursinterruption1 hour interruption
Figure 5.25 Customers’ reply as regards use of and opinions on Podio

58 Measurements and analysis
eFle
x Furthermore, we conclude that in order to obtain full value of the control scheme we need to perform portfolio management schemes. The large outcome from the distribution grids point of view is not seen by just performing a two hour consumption reduction. The reduction needs to be controlled over a larger period of time in order to obtain an optimal benefit. For this purpose we have suggested portfolio management and shown that we can decrease peak significantly by introducing such a scheme. The algorithms of the portfolio optimisation scheme is individual from each feeder, since it is highly dependent on customer consumption, no. of customers, no. of heat pumps, and maximum capacity.
In general, we have shown that a portfolio optimisation scheme (assuming a feeder with residential customers and a large penetration of heat pumps) can
Completely remove the peak contribution from the normal household consumption.Reduce the peak by approximately 18% in average for all household customers with heat pumps. Reduce 30% of the heat pumps own contribution to the peak.
Finally, we have conducted an financial analysis presenting savings between DKK 1025 (~ 140 ") and DKK 1375 (~ 185 ") for customers participating in peak shaving of heat pump, based on the price signals in the eFlex project, and energy savings due to home automation system.

59Lessons Learned and conclusion
06 LESSONS LEARNED AND CONCLUSION
This chapter rounds up the main conclusions from the eFlex project. The learnings from running the project and experiences with flexibility were:
5 different user profiles. The project discovered 5 user profiles describing groups of in-centives. The user profiles have overlapping incentives but still stand out as specific groups of interest and perception. In addition, a model to understand the diversity of drivers clearly displayed the very complex user practice and why practice is almost differ-ent for each user. However complex, the model at least outlines the various social condi-tions that make up the complexity and a basis for starting to understand the customers’ diversity and potential for flexibility. Price not the only incentive. One of the major findings in relation to the incentive study was confirmation that price is not the only or the most dominating incentive but custom-ers have several reasons to participate or be flexible. However, price was an more or less explicit incentive in most user profiles but also a very complex concept. For some custom-ers price is important, but then again it depends on how much can be gained and if that is too little, other incentives may be more dominating. Secondly, household economy should be understood in the context of the individual culture each family makes for themselves. The eFlex project aimed at understanding household economy in two parallel reference systems: everyday life as a rather material relation to money and the tangible money flow in and out of the household, and home as a more phenomenological relation to identity and self-esteem. None of these two reference systems can be ignored when using a price signal as incentive. The customers cannot be understood in the context of homo economi-cus but the price signal may still be the best signal to provide customers no matter the symbolic values that can be attached to it, as meaning ascribing to the price signal is easy to communicate. Paradoxically, effectuating other incentives than prices, eg. environ-mental concern and new technological options, may lead to an increase of customers price sensitivity. If not as a financial benefit but symbolically.Price signal. Customers in eFlex were given both a three step grid tariff and an elspot market price. Correlation studies discovered that on average, the two signals are corre-lated. On average it can be expected that the two price signals will reinforce each other. The studies also show that the correlation between the price signal and the load in the grid is somehow correlated but not 100% accurate. In terms of time, the load is usually placed behind the price signal from the elspot market price and the grid tariff. Used un-critically this could be disastrous as automatically price controlled heat pumps would release the heat pumps in the load peak and multiply the problem they were designed to solve. Customers were also given the option of controlling the heat pumps depending on the wind energy content in the energy mix, in order to pursue an environmental priority. It should be mentioned that about # of the customers chose to control the heat pumps with a balanced signal of price and wind. However, correlation between wind energy and grid load is not apparent, and the wind energy signal cannot be used for load shedding in its simple form.Flexibility. We have defined flexibility as a relative parameter: the amount of energy that can be moved in one hour. As already mentioned, the flexibility depends on a number of social conditions (like willingness, family composition and life situation) but also on the house’s thermal performance. A well-insulated and ‘heavy’ house structure and furniture will be able to provide more flexibility than the opposite. Therefore, we cannot generalise the flexibility result but only conclude that we could archive flexibility without significant or any comfort loss to the households for about 1 to 3 hours, to some probably more. Aggregated kick-back was considerable lower than expected. It was a surprising obser-vation that the expected thermal patterns of the heating system during interruption were

60 Lessons Learned and conclusion
eFle
x not obvious at household level. The expected kick-back when the heat pumps were re-leased from the interruption was likewise considerably lower than expected. We ascribe the phenomenon to the diversified behaviour of the customers. Use of wood stoves, cock-ing, other heating systems, solar radiation etc. makes it extremely complicated to interpret the often peculiar measurements and is probably the reason why a clear and significant kick-back load is not always found. The resulting flexibility of interruptions of heat pumps can certainly not be simulated by a computer for analysis at household level but one has to realise the customer behaviour’s significant influence on the use of energy. However, when adding up the load pattern from many heat pumps, the average thermal patterns were more like expected. The aggregated kick-back load was considerably lower than ex-pected when taking the synchronous release of all heat pumps into account.Portfolio management is needed. In a recent DONG Energy scenario study, we have estimated future the load from heat pumps on 10 kV feeders. Using the results from eFlex on three different feeders equipped with heat pumps as anticipated in 2025, we can study the expected load shedding results. The quantity of load shedding depends on the num-ber of heat pumps that load each feeder, but we can clearly see the effect. The results indicate that the interruption period may be insufficient compared to the timely wideness of the grid load when using the optimisation algorithm and method as in the eFlex sys-tem. The interruption tended not to last in the load peak period, and the kick-back still appears in the load peak period in most cases. Cascade control of the heat pumps con-tributes to the solution. Customers’ financial benefit. There are two different ways in which the customer can save money in the eFlex project: by load shedding (moving the load to a cheaper period) and by reduction of energy consumption via energy management the home automation system provided. The savings obtained from load shedding are difficult to measure as the (already mentioned) thermal patterns were unusual in most cases. The problem is to cal-culate the energy not used during interruption, which could not just be estimated from the energy consumption a few hours before the interruption in all cases. Instead, we have used the general results of the heat pumps’ energy consumption to estimate savings in the Danish Design Reference Year. Depending on whether the house is ‘heavy’ and well-insulated or the opposite, we estimate the annual savings to be in the range of DKK 200 (~ 35 ") to DKK 600 (~80 ") from the 3-step grid tariff and while the step between the peak and middle step is DKK 0.60. The savings could increase by changes in the set-up of the grid tariff. Adding the elspot market price and assuming that this adds another price difference of DKK 0.20, the annual savings will increase to the range of DKK 250 to DKK 800. However, this assumes that the two price signals reinforce each other. The general savings from using the home automation system differed to a large extent but added 10% to the savings on average.Level of support. As indicated above the eFlex project encountered intensive communica-tion and rectification, not least with the support team. Initially, support to customers was offered 24/7 and the team consisting of 14 persons was trained in eFlex. However, even though we experienced many enquiries, there was still too few to maintain the qualifica-tion of the support team for detailed insight into all aspects of the technology. For that reason, we reduced support to just three persons and only for response during normal working hours. When an innovation project is subject to large uncertainties regarding customer interaction and technology, it must be of a size above a critical mass before it makes sense to establish support systems. Otherwise tasks become too dissolved to maintain qualification and commitment. Use of social media. We also offered support via the social media Podio. The interesting observation was that customers began to assist each other and everybody could see and use the solutions. A questionnaire disclosed however, that different customers prefer dif-ferent medias. There is a tendency that the social media was preferred by the persons who were also very interested in new technology, and quite a large fraction of the customers only followed the active participation of others on Podio. Using social media as support provides detailed insight into the customers’ perception, which can be used in future in innovation and design of value proportion. Facilitation of the social media requires some

61Lessons Learned and conclusion
considerations in order to maintain interest via meaningful content and reasonable re-sponse time. If not closely considered especially in innovation projects with heavy involve-ment of customers, the amount of resources required for support may come as a surprise.Innovation project. The eFlex project was an innovation project using relatively new tech-nology and seeking insight into unknown issues. The experiences that new technology is likely to produce, the diversified feedback from the customers and the fact that new learn-ing constantly produced new questions, resulted in a steep learning curve. The need for change of technology and rectifying software and hardware bugs made up a special pro-ject context. Future innovation project would benefit from closer cooperation and commu-nication by all parties, whether project owners or suppliers. Maintaining commitment and enthusiasm in the project organisation are prerequisites for dealing with a project of this nature that never really comes into smooth operation. Although this is a very internal learning it will probably also be the case for many other projects that regard SmartGrid.
6.1 PerspectivesThe eFlex project set out to investigate whether heat pump peak control can contribute to solving the problem that heat pumps may cause for the distribution grid, namely the need for reinforcing the grid heavily in the years ahead.
Three questions have to be considered when answering the overriding question:
First, is it enough? According to the grid load analysis in Chapter 5, load shedding is vis-ible, but in general, the peak is not exceptionally high compared to the general load during the day. The crucial point is whether the released grid reserve of approximately 5-10% is sufficient compared to the investment required to achieve such reductions, and the speed at which the general day load would reach the load limit anyway. To get closer to an answer requires a much more detailed study of the financial conditions for establishing a smart grid. As it appeared from the three examples in the grid load analysis, the financial analysis may very well depend on the feeder in question, i.e. what the alternative investment in a concrete part of the distribution grid would amount to. Some feeders may have a load character where grid reinforcement is the most cost-effective solution.
Second, can a signal be designed that enables load shedding? According to the new reg-ulation adopted for the electricity market in Denmark, the distribution companies will have a supplier centric role (or wholesale role) with no direct relation to the customers. Customers will interact with retailers, aggregators, virtual power plants and other commercial market actors. In order to achieve load shedding in the distribution grid, a distribution company must assume that the variable grid tariff is reflected in the price signals that the retailer addresses to the end customers. The grid tariff will be in competition with other price sig-nals, e.g. from the TSO market and the spot market, where the retailer procures his electric-ity. The different price signals will not always address synchronous peaks, i.e. the spot price will sometimes fall low in periods with high grid tariff. It must consider, what conditions and framework can be implemented to develop a market for flexibility that will work within the realm of the overall electricity market. A flexibility market would allow us to achieve the opti-mum effect and at the same time secure load shedding in the distribution grid?
As we have discussed in Chapter 5, each feeder has different nature of load. Different types of customers such as heavy industry, service sector, cultural institutions etc. have different daily load curves which makes it challenging to design one grid tariff that accurately ad-dresses the load profiles on different feeders. Add to this the discussion of incentives, where we have shown that different incentives are of interest to different customers. As long as the savings are not significant, customers may prioritise other issues and some may in general find other issues more attractive than saving money. This accentuates the relevance of the new Danish market model, as only commercial retailers have the ability to offer intricate value propositions that go beyond pure price.

62 Executive Summary
eFle
x Since load shedding is not saving energy but only moving the load to another period, the general grid tariff may not be a sufficient control mechanism when applying cascade man-agement. As shown in Figure 5.20, a heat pump may for instance be interrupted at one hour only to restart in the next hour where a similar (high) tariff applies. This will eliminate the customer’s financial benefit and calls for further analysis and development of grid tariffs. Also, the agreements and terms of collaboration between distribution companies and the aggregators or retailers, should be explored in further detail. Distribution companies may have to develop additional incentives to spur aggregators to control heat pump interruption in cascades. This is also in line with the above notion, that the price signal offered by grid tariffs will have to play together with other price signals that will at times be in competition.
Finally, will customers’ interest in load shedding last? We have no evidence in the eFlex project to deduct any conclusions as to the sustainability of customers’ interest in interrupt-ing appliances, whatever incentive applied. If customer interest declines, it would certainly not be surprising. From many other projects we know that behaviour modification based on information is deemed to fail in the long run. Customers simply loose interest and will fall back into old patterns after some time. This is true especially if customers are supposed to manually apply changes according to the information, e.g. price information and the like. This may also be the case in relation to heat pumps and as we have discussed in Chapter 4, an automation of heat pump interruption (e.g. through an aggregator service) is necessary if participation in the flexibility scheme is to be sustained. Automation will abate the lack of lasting behaviour modification. On the other hand, automation will also accelerate the loss of interest by the customer (they simply forget it), and if comfort is compromised later on, customers most likely will lack the interest required for staying committed to letting the appliance be available for automated interruption.
Overall, we can conclude that heat pumps can contribute to lowering and postponing invest-ments in grid reinforcements, if interrupted automatically in cascades by a commercial actor such as an aggregator or electricity retailer. Interruption will most likely happen according to price signals, e.g. a grid tariff. But as discussed above, grid tariffs will not bring us all the way. One of the next challenges will therefore be to get commercial actors to develop busi-ness models and value propositions that enable a market for flexibility. Only when automa-tion technology for private heat pumps is available to the customer, this market will see daylight.

63Appendix A
07 APPENDIX A
7.1 Correlation StudiesAs previously mentioned, one the tasks in the eFlex project is to examine the ability and the willingness of the customers to reduce their electricity consumption at critical times in accord-ance with a demand response scheme based on market and grid tariff prices. From the custom-er’s point of view, the incentive could be cost savings. From DSO’s point of view, the incentive is interruptions, load shedding and investment planning towards a Smart Grid electricity supply.
In the eFlex project, a 3-step grid tariff has been selected as one of the instruments to cope with the demand response concept. The design of the step grid tariff has been explained in detail in chapter 2.2.
The design of the step grid tariff raises the fundamental question:Is the step grid tariff positioned optimally in terms of time i.e:
Optimisation in accordance with the load profiles on the distribution grid, eg load shedding Optimisation in accordance with other signals, ie wind energy content in energy mix.
To reach a detailed answer to this question, a number of correlation analyses have been made as regards the parameters for optimisation with special emphasis on the time inter-vals where the optimisation is expected to support a demand response scheme.
Correlation studyA correlation study has been prepared between:
Elspot price and grid tariffLoad and grid tariffLoad & overall price (grid tariff + elspot price)Wind energy and overall priceLoad and wind energy
Two different scenarios are subject to the correlation study i.e: A day in the heating season16 averaged over several years17 and a day in January averaged over several years. It has been decided to focus separately on January since this statistically is considered the coldest month during a year in Denmark and thus the month where heat pumps are in operation.
The results of the correlation study will be a graphical presentation of the examined param-eters mentioned above and a value expressing the correlation. For this purpose the CORREL-function in Excel has been used. This feature gives a value between – 1 and 1, where -1 is perfect negative correlation (eg no correlation at all) and 1 is perfect positive correlation (i.e completely depending signals). The relation between the value and size of correlation is defined in the eFlex project in Figure A.1.
16 November to March
17 Actual years specified in each graph.
EFLEX DEFINITION OF CORRELATION
Correlation Negative Positive
None !0.09 to 0.0 0.0 to 0.09
Small !0.3 to !0.1 0.1 to 0.3
Medium !0.5 to !0.3 0.3 to 0.5
Strong !1.0 to !0.5 0.5 to 1.0
Figure A.1 eFlex definition of cor-relation. Reference: http://en.wikipedia.org/wiki/Pearson_prod-uct-moment_correlation_coefficient

64 Appendix A
eFle
x For the purpose of examining the extent to which a parameter is correlated with the load, five 10 kV feeders have been selected randomly in the DONG Energy North grid area. It is assumed that this supports the overall conclusion related to the load parameter and correla-tion with other parameters.
The name and abbreviations of the 10 kV feeders are as follows:
Name of 10 kV feeder AbbreviationBAL 03 Borupvang Syd Load 03GHO 04 GL.HOLTE SKOLE Load 04HBY 05 Klosterris Hegn Load 05FRS 13 Haldor Topsøe 1 Trf.st.36 Load 13HIL 15 FREDERIKSGADE KBST. Load 15
7.2 Elspot price and grid tariffA graphical representation of the elspot price and grid tariff is shown in figure A.2
0
10
20
30
40
50
60
70
80
90
0
10
20
30
40
50
60
70
80
90
1 3 5 7 9 11 13 15 17 19 21 23
øre/
kWh
øre/
kWh
Time
Average day (2007-2011) - Elspot price and tariff
Tariff Price
Figure A.2 Elspot price and grid tariff. An average during the heating season
0
10
20
30
40
50
60
70
80
90
0
10
20
30
40
50
60
70
80
90
1 3 5 7 9 11 13 15 17 19 21 23
øre/
kWh
øre/
kWh
Time
January Average day (2008-2011) - Elspot price and tariff
Tariff Price
Figure A.3 An average day in January – Elspot price and grid tariff

65Appendix A
From figure A.2 a strong correlation between Elspot price and grid tariff appears. The value of correlation is 0.82 indicating a strong correlation between the parameters, cf. Figure A.1.
By focusing solely on January the graphics in figure A.3 is obtained. From figure A.3 the Els-pot price and grid tariff correlates with a value of 0.81, which again confirms a strong correla-tion between Elspot price and grid tariff also on a daily basis during the heating season.
The strong correlation suggests that interruption of heat pump operations with the purpose of load shedding based on the Elspot market price reinforces the use of a 3-step grid tariff, and expected contradicting interest from trade on the elspot market and load shedding based on the step grid tariff is low. There could however, still be (and sometimes is) contra-dicting interest between the intraday market of balancing the power supply and the DSO’s interest in load shedding. In addition, the elspot price in the figure is an average and there-fore other patterns are likely to appear too with contradicting peaks.
7.2.1 Load and grid tariffA graphical representation of the grid tariff and load on the five 10 kV feeders are shown in figure A.4 during an average day during the heating season.
Figure A.4 shows a representation of the load on the selected 10 kV feeders compared to the fixed grid tariff during an average day. Correlation between the various feeders and the grid tariff is in the range between 0.35 and 0.65. The average value of correlation equals 0.5, which indicates medium to strong level of correlation.
When comparing the load and grid tariff during an average day in January, the picture very much resembles the results from the heating season. Values of correlation are between 0.12 and 0.67 resulting in an average value of 0.47. This indicates a medium level of cor-relation.
Overall the time matching of the grid tariff seems reasonable with a medium to strong cor-relation with the grid load on 10 kV feeders. However, the question is whether correlation is sufficient for controlling overload in the distribution grid, eg if the tariff has to be exactly correlated to the load in order to take effect in connection with load shedding. By prolonging a high grid tariff by 1 hour during the evening, a stronger correlation might be obtained. The load pattern is different from the private sector and the business sector (and it even
75
95
115
135
155
175
195
0
10
20
30
40
50
60
70
80
90
1 3 5 7 9 11 13 15 17 19 21 23
Load
[A]
øre/
kWh
Time
Average day (2008-2011) -Load + tariff
Tarif Load 03 Load 04 Load 05 Load 13 Load 15
Figure A.4 Load on selected 10 kV feeders and grid tariff. An average day during the heating season.

66 Appendix A
eFle
x
depends on whether it is industrial or service enterprises) and public sector. To design a grid tariff that matches the load pattern specifically requires that the design takes into account the combined load from different sectors on each specific feeder. However, the grid tariff should not only be designed to target the peak load but also the part of the load that is flex-ible. This requirement to the tariff design may even change over time.
7.2.2 Load and overall priceFigure A.6 shows the relation between the load and the overall price during an average day during the heating season. The strong influence from the grid tariff pattern appears very clearly from the curve. The reason being that the level of the grid tariff often exceeds the elspot price significantly. The value of correlation between the load and the overall price lies between 0.43 and 0.7 with an average of 0.57. This indicates medium to strong correlation.
In figure A.7, a graphical representation of the load on the 10 kV feeder and price + tariff is shown during January. The value of correlation is between 0.19 and 0.74 with an average of 0.54.
Figure A.6 Load on selected 10 kV feeders and grid tariff. An average day during the heating season.
Figure A.5 An average day in January – Load and grid tariff
75
95
115
135
155
175
195
0
10
20
30
40
50
60
70
80
90
1 3 5 7 9 11 13 15 17 19 21 23
Load
[A]
øre/
kWh
Time
January average day (2008-2011) - Load and tariff
Tarif Load 03 Load 04 Load 05 Load 13 Load 15
75
95
115
135
155
175
195
25
45
65
85
105
125
145
1 3 5 7 9 11 13 15 17 19 21 23
Load
[A]
øre/
kWh
Time
Average day (2008-2011) -Load & Price + tariff
Price + tariff Load 03 Load 04 Load 05 Load 13 Load 15
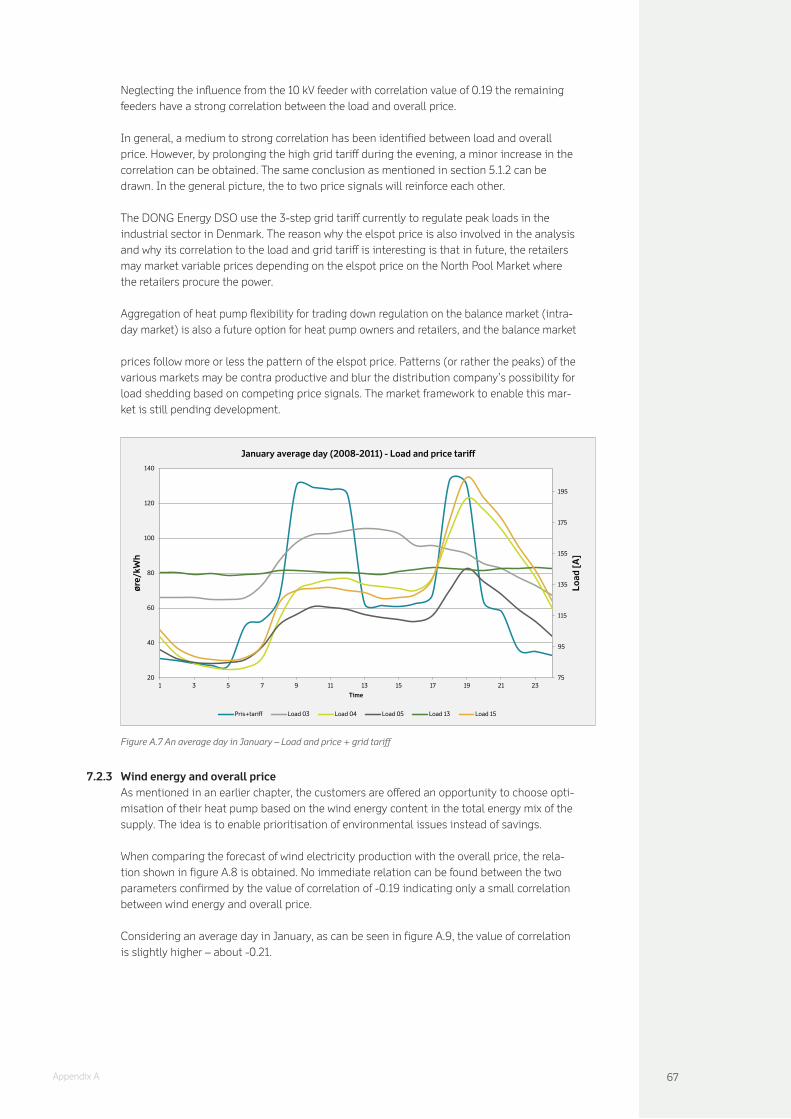
67Appendix A
Neglecting the influence from the 10 kV feeder with correlation value of 0.19 the remaining feeders have a strong correlation between the load and overall price.
In general, a medium to strong correlation has been identified between load and overall price. However, by prolonging the high grid tariff during the evening, a minor increase in the correlation can be obtained. The same conclusion as mentioned in section 5.1.2 can be drawn. In the general picture, the to two price signals will reinforce each other.
The DONG Energy DSO use the 3-step grid tariff currently to regulate peak loads in the industrial sector in Denmark. The reason why the elspot price is also involved in the analysis and why its correlation to the load and grid tariff is interesting is that in future, the retailers may market variable prices depending on the elspot price on the North Pool Market where the retailers procure the power.
Aggregation of heat pump flexibility for trading down regulation on the balance market (intra-day market) is also a future option for heat pump owners and retailers, and the balance market prices follow more or less the pattern of the elspot price. Patterns (or rather the peaks) of the various markets may be contra productive and blur the distribution company’s possibility for load shedding based on competing price signals. The market framework to enable this mar-ket is still pending development.
7.2.3 Wind energy and overall priceAs mentioned in an earlier chapter, the customers are offered an opportunity to choose opti-misation of their heat pump based on the wind energy content in the total energy mix of the supply. The idea is to enable prioritisation of environmental issues instead of savings.
When comparing the forecast of wind electricity production with the overall price, the rela-tion shown in figure A.8 is obtained. No immediate relation can be found between the two parameters confirmed by the value of correlation of -0.19 indicating only a small correlation between wind energy and overall price.
Considering an average day in January, as can be seen in figure A.9, the value of correlation is slightly higher – about -0.21.
Figure A.7 An average day in January – Load and price + grid tariff
75
95
115
135
155
175
195
20
40
60
80
100
120
140
1 3 5 7 9 11 13 15 17 19 21 23
Load
[A]
øre/
kWh
Time
January average day (2008-2011) - Load and price tariff
Pris+tariff Load 03 Load 04 Load 05 Load 13 Load 15

68 Appendix A
eFle
x
Ideally the value of correlation should be -1 meaning that wind and overall price are perfectly negatively correlated – in the way that electricity is cheap during high wind electricity pro-duction. The inability to control the power output from wind turbines is evident here, and there is only a slight tendency for a low overall price when the wind electricity production is high.
This means that customers who prioritise environmental issues rather than price cannot expect to gain a financial benefit in any significant way. The elspot price may be slightly related to the wind energy content of the energy mix but here we have used the added price signal from the elspot price and the grid tariff as this is the price offered to the customers. Naturally, the wind energy and the grid tariff will not have any natural connection but if the wind energy should be a useful signal for automatic load control, the correlation between the two have to be seen. They appear only slightly related.
7.2.4 Load and wind energyIf a correlation between load and wind energy exists, customers could be offered the oppor-
25
45
65
85
105
125
145
435
455
475
495
515
535
555
1 3 5 7 9 11 13 15 17 19 21 23
øre/
kWh
MW
h/h
Time
Average day (2009-2011) - Wind electricity production and price + tariff
Wind electricity production Price + tariff
20
40
60
80
100
120
140
435
455
475
495
515
535
555
1 3 5 7 9 11 13 15 17 19 21 23
øre/
kWh
MW
h/h
Time
January Average day (2010-2011) - Wind electricity production and overall price
Wind electricity production Price+tariff
Figure A.8 Wind electricity production and price + tariff. An average day during the heating season.
Figure A.9 An average day in January – wind electricity production and overall price.

69Appendix A
tunity to priorities environmental issues to financial benefit by providing them with a ‘wind energy signal’ instead of a price signal.
In Figure A.10, it can be seen that the wind power production decreases during the same time the load increases and vice versa. The value of correlation is in the range between -0.53 and -0.37 with an average of -0.47 on the overall picture, but as it appears from the Figure A.10, the correlation during load peak hours in the afternoon is more accurate.
Figure A.11 shows graphics for January. The value of correlation is between -0.44 and -0.15 with an average of -0.30.
Generally speaking, there is a medium correlation between wind electricity production and load. However, due to large variations and unstable supply, it is not clear that optimising heat pump operation based on wind power production will support load shedding in the grid. When taking only January into account, it is tempting to conclude that a ‘wind energy signal’ is probably too unstable for load shedding purpose.
75
95
115
135
155
175
195
215
435
455
475
495
515
535
555
1 3 5 7 9 11 13 15 17 19 21 23
Last
[A]
MW
h/h
Time
Average day (2009-2011) - Wind electricity production and load
Wind electricity production Load 03 Load 04 Load 05 Load 13 Load 15
Figure A.10 Wind electricity production and load. An average day during the heating season.
Figure A.11 An average day in January – wind electricity production and load.
75
95
115
135
155
175
195
215
435
455
475
495
515
535
555
1 3 5 7 9 11 13 15 17 19 21 23
Load
[A]
MW
h/h
Time
January average day (2010-2011) – Wind electricity production and load
Wind electricity production Load 03 Load 04 Load 05 Load 13 Load 15
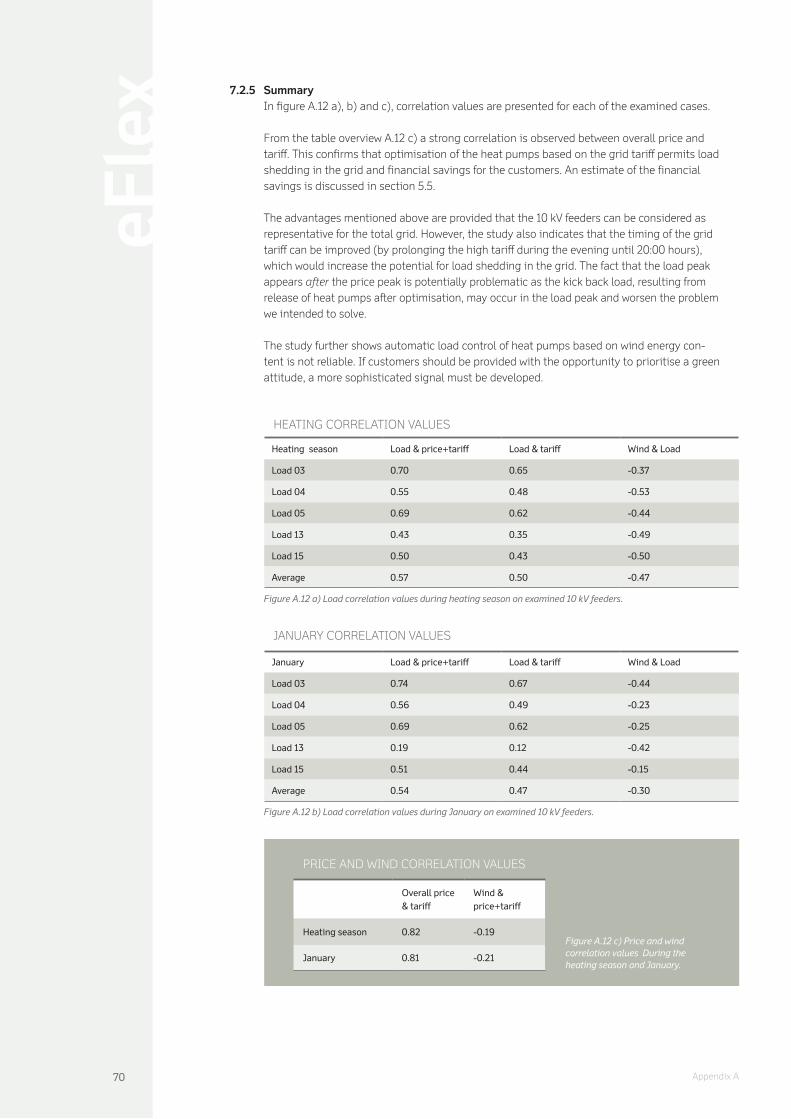
70 Appendix A
eFle
x 7.2.5 SummaryIn figure A.12 a), b) and c), correlation values are presented for each of the examined cases.
From the table overview A.12 c) a strong correlation is observed between overall price and tariff. This confirms that optimisation of the heat pumps based on the grid tariff permits load shedding in the grid and financial savings for the customers. An estimate of the financial savings is discussed in section 5.5.
The advantages mentioned above are provided that the 10 kV feeders can be considered as representative for the total grid. However, the study also indicates that the timing of the grid tariff can be improved (by prolonging the high tariff during the evening until 20:00 hours), which would increase the potential for load shedding in the grid. The fact that the load peak appears after the price peak is potentially problematic as the kick back load, resulting from release of heat pumps after optimisation, may occur in the load peak and worsen the problem we intended to solve.
The study further shows automatic load control of heat pumps based on wind energy con-tent is not reliable. If customers should be provided with the opportunity to prioritise a green attitude, a more sophisticated signal must be developed.
HEATING CORRELATION VALUES
Heating season Load & price+tariff Load & tariff Wind & Load
Load 03 0.70 0.65 -0.37
Load 04 0.55 0.48 -0.53
Load 05 0.69 0.62 -0.44
Load 13 0.43 0.35 -0.49
Load 15 0.50 0.43 -0.50
Average 0.57 0.50 -0.47
JANUARY CORRELATION VALUES
January Load & price+tariff Load & tariff Wind & Load
Load 03 0.74 0.67 -0.44
Load 04 0.56 0.49 -0.23
Load 05 0.69 0.62 -0.25
Load 13 0.19 0.12 -0.42
Load 15 0.51 0.44 -0.15
Average 0.54 0.47 -0.30
Figure A.12 a) Load correlation values during heating season on examined 10 kV feeders.
Figure A.12 b) Load correlation values during January on examined 10 kV feeders.
PRICE AND WIND CORRELATION VALUES
Overall price & tariff
Wind & price+tariff
Heating season 0.82 -0.19
January 0.81 -0.21
Figure A.12 c) Price and wind correlation values During the heating season and January.


11.1
2.49
2
DONG Energy Eldistribution A/SDepartment of Grid Strategy
Teknikerbyen 252830 Virum+45 99 55 57 77
www.dongenergy.dk