the electrical discharge from a pointed conductor …
TRANSCRIPT

THE ELECTRICAL DISCHARGE FROM A POINTED CONDUCTOR
TO A HEMISPHERICAL SURFACE IN GASES
AT DIF1FERENT PRESSURES .
. ..... . .. . ... ... : A T FJ,.·i·.~·.I··S········· ·
:!:!: :~: :~: =· ... : : : ....... I I I I I II I II II I II I 1, I I I I
Submitted to the Faculty orLiH~iai~J~~te School of the
University of .Minnesota
by
Franz A. Anst
in Partial fulfillment of the requirement for the degree
of
Master of Science .
May 1, 1911.

-
THE ELECTRICAL DISCHARGE FROM A POINTED CONDUCTOR
TO A HEMISPHERICAL SURFACE IN GASES
AT DIFFERENT PRESSURES.
The ex.periments to be described in this paper
had for their immediate; iJ:~~la,q~ :·~~e: ~·pv.~st:i'gat ion of the fC f l ( f (II I t 1 t 1 f t t 1 1' I
quantitative relation of til:ti31 !rt ':i.•!rle'n.t :'atitl:".potential when .. , . . .. ... . . ..... . . ( ...... '• ........... . an electrical discharge was ;pat.i~ i!;ng, , :_ :!rf gases at dif'ferent ............
fff) ttl ( I I I I
pressures to a hemispherical surface from~ pointed con
ducto:r· situated at its center of curvature.
Numerous ex:periments have been carried on with
a discharge pass~ng from a point to a plane, investigat
ing the d1stribut ion of the eurrent over dif'ferent areas, 1
as well as the relat ion of the current and potential at
diff erent pressu es . 2 However in such a case the electro-
static field is so complex and the current distribution so
changes with the pre ssure that it is difficult to separat e
the various fact ors and studY their effect.
In the case of a discharge passing to a hemisphere,
1. Warburg, Am. PhYs. Vol. 67, P. 69 (1g9g). 2. J. Zeleny, Phys. Rev. Vol 26, P. 1~5 (19og).
) {., •)-,. _ U.a. - I

however·, it has been founctl that at atmospheric pressure
the current distributes itself quite uniformly over the
entire surface opposite the point, and that the field for
all parts of the surface approximates to that between
two concentric spheres. It seemed probable therefore
that a more simple relation between the quantities in
volved would be obtained.
The various phases of the experiment will be
taken up in -the following order:
1. Description of apparatus.
2. Tests of the apparatus and difficulties en-
countered.
3. Procedure in the experiment.
~. Results of the experiments conducted with air.
5. Experiments with oxygen.
6. Minimum potentials in oxygen and air and how
they are affected by the presence of radtu.m.
7. Luminous appearance of the discharge.
iS • Summary .
l. J. Zeleny, loc. cit.
2

I. DESCRIPTION OF APPARATUS .
The spherical surface to which the current passed
is shown in section in figure 1. This is practically the
same as that used by Prof. J. Zeleny in his work on :
11 The Dischar ge of Electricity from Pointed conductors 111 •
A hemisphere of 1.75 cm. radius was turned in a brass
cylinder and divided into three sections of e~ual areas
(A, B, C). These were separated by air spaces of .2g mm.
and held in place by sealing wax. A fourth cylindrical
section (D) 1 cm. in length and of the same external and
internal diameter as Section c was added to the cylinder
so as to make the field between the point and the hemi
spheres more nearly approximate that between two concent
ric spheres . As the discharge spreads back from the point
with decrease of pressure this surface D receives most of
the extra flow of current.
The discharge point (I) consisted of a platinum
wire .1g mm. in diameter whose end was ground as nearly
spherical as possible. This wire, 1.0 cm . long, was
1. Loe. cit.
3

soldered into one end of' a brass cylinder 3 mm. in
diameter and 2.5 cm. long. At the other end of this
cylinder was a lock-nut which permitted the position of
the point to be adjusted. The point when in position
rested upon an ebonite block which was fastened to the
hemispnere and carefully notched and adjusted so that when
the point was Placed in position its direction coincided
with the axis of the hemisphere . The distance from the
center of curvature to the extremity of the block was
then carefully measured. After that the only adjustment
of the point necessary was to make it coaxial with the
cylinder , to set the lock-nut at the required distance
from the point, and to put it in place on the ebonite
block. This arrangement made it easy to remove the point
whenev~r necessary.
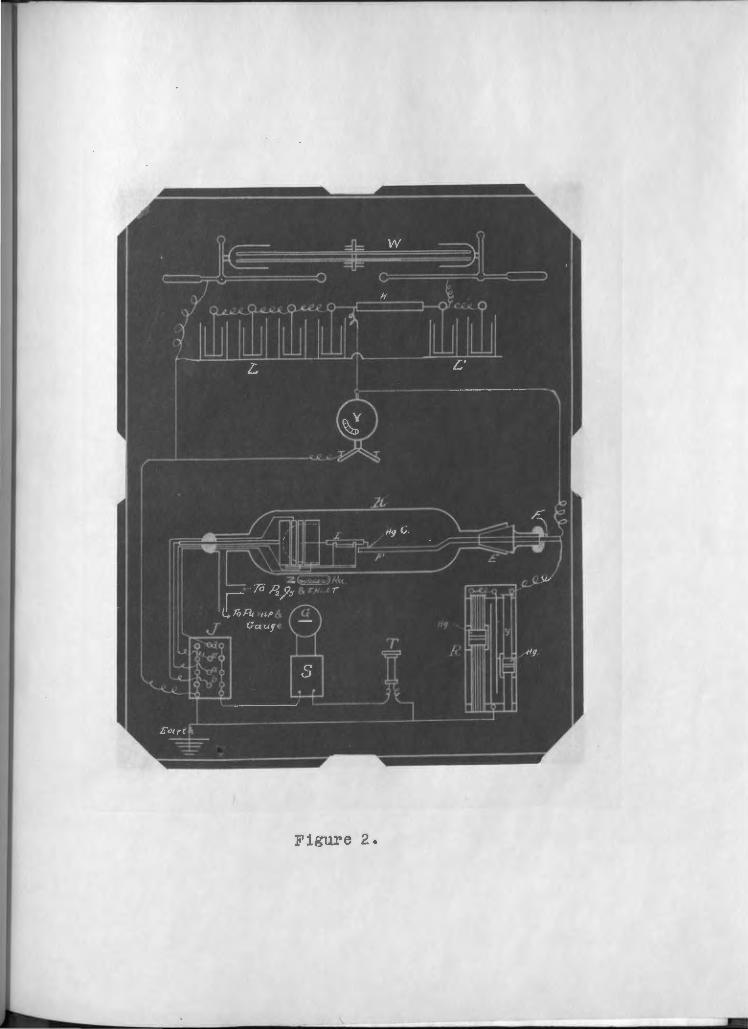
The apparatus as finally connected up is shown
in figure 2. The hemisphere was sealed into one end of
a glass cylinder 5 cm. in diameter and 20 era . long while
the other end was closed by means of a ground glass stop
per (E) into which was sealed the connecting rod (F).
This rod was made of brass and had at its extremity a

sleeve which just fitted over the cylinder carrying the
point and served as a means for removing the same. Elec
trical connection was made with the point by means of a
fine wire arm ( F) solde1•ed to the cylinder (I). This arm
dipped into a small mercury cup bored into the top of the
bras s rod (F).
connection could be made to the different sec
tions of the hemisphere , A, B, o and D by means of well
insulated wires leading to the switching device J. The
current passing to the different sections of the spher
ical surface was measured by means of a Leeds and Nor
throp 11 P11 type galvanometer ( G), where one scale division
represented 2.46 x 10⁻⁸ amperes.
Potentials above 2500 volts were measured by means
of a Braun Voltmeter (E) and those lower than 2500 volts
with a Kelvin vertical Voltmeter.
A Wimshur•st Machine ( w) run by a small motor was
used as a source of electricity . In order to obtain a
constant potential from this machine, two batteries of
Leyden Jars (Land L') were connected in parallel with
the poles of the machine. These two batteries were sep-
5
arated by a high resistance of about 100 megohms, such
as will be described later. This served to steady the
potential .of the point and also to increase the total
amount of current generated by having the machine work
at a higher potential.
The regulation of the potential of the point, es
pecially for the lower pressures, caused considerable
trouble. An auxiliary point and plane arrangement was
at first used for this purpose and proved very satis
factory until the lower pressures and voltages were reached.
Here however it was found that often a clicking of the
telephone receiver (T), which was taken as an indication
of an intermittent current, was really caused by a sudden
dropping of the current in the whole circuit by a small
spark passing from the auxiliary point to the earthed
Plane. Liquid resistances such as alcohol and the Cad
mium Iodide resistance described by starke1 and Hittof2
were tried in place of the auxiliary point but found unsat
isfactory because of their comparatively low resistance.
1 Starke: Elect. in Gases, p. 9.
2 W. Hittof: Wied. Ann. v. 7, p. 553 (1g79).
6

•
The resistance shown in figure 3 was then devised
and proved itself serviceable. It consists mainly of
two strips of paper, of very high resistance, the one
3 x 45 cm. (A), the other 1.5 x 45 cm. (B). In order
to obtain the required range of resistance , fine lines
wer e ruled upon these strips with Higgins' India Ink.
By selecting the proper width of paper and adjusting the
density of the rulings one can easily get a range of re
sistance from 1 to 500 megohr!l.S per centimeter of length.
Ttte two strips in series were here used in order to ob
tain a finer adj ustment, for the one - had a range of 1
to 5 megohms per centimeter·, and the otlrnr had pract icallY
a constc.rnt resistance throughout of 50 negohms per
centimeter .
111he construction of the resistance racl~ is shown
by figur·es 3 and 4. The frame is built of welJ seasoned
wood thoroughly shellacked. The end of the paper strip
wherelt is connected to the binding posts o and D by
means of a mercury cup E is thoroughly blackened with the
India Ink so as to make it as good a conductor as pos
sible. Each strip passes through a sliding mercury cup
7

and is then fastened to the other extremity of the . rack.
The sliding mercury cup (F) is fn continuous electrical
contact with the mercury trough (H) by means of the
point (i). The mercury trough completes the electrical
circuit ·between the strips of paper and the binding posts.
The resistance is varied by means of the sliding mercury
contacts F and F'.
various kinds of paper were tried. The hot and
cold pressed drawing paper were found to have too low a
resistance, and the lines ruled on them seemed to break
in plac.es and tlms give an erratic resistance. A special
linen bond paper was finally adopted.l Its resistance
is much higher than that of the other papers tried and
the surface is highly glazed, thus holding the ink well
and still not absorbing the particles of mercury into which
1t is dipped. This resistance seemed fairly constant when
kept well cleaned and proved very satisfactory.
The pressure within the tube (K) vras measured
by means of an ordinary mercury gauge. In order to
1 BYron Weston Company's "Linen Record".

prevent any leakage over the surface of the tube {K)
it was partly covered with tinfoil connected to earth.
During all the experiments here described a
glass vial (Z), figure 2, containing 1 gram of 1 percent
radium bromide was placed beneath the tube (K). The
ef~ect of the radium upon the electrical discharge will
be taken up later.
9

II. TESTS OF THE APPARATUS AND DIFFICULTIES ENCOUNTERED.
Before proceeding with the experiment it seemed
important to ascertain the effect of the continuous dis-
charge on the enclosed gas.
In order to do this a set of readings was taken
for the minimum potential of each section and the cur-
rent passing to the same at different pressures, the
air being renewed for each change of pressure. Tnen a
continuous set of readings was taken with a given mass
of gas, wit t out renewing the same. A third set was now
taken the same as the first set but having the discharge
first pass through the gas for a period of ten or fifteen
minutes before any readings were taken. With the point
charged positively 1~ was found that the second and third
set of readings were nearly identical but differed from
the first set considerably; the current values being
about 1.5 percent lower in case of the latter. This
test was repeated after the point had been used for
some time, on the supposition that the change might
be due to cha~ges in the condition of the point itself .1
1 Precht: Wied. Ann. 49:150 (1S93); J. Zeleny, Phys. Rev. 24:137 (190S).
10

But the readings were found to be practically the same
as before. With the negative discharge these effects
if present were masked by irregularities 1n the current.
When oxygen was used this deterioration of the
gas with use was very marked, especiallY with the starting
potentials. Sometimes the starting potential would drop
5 or 10 percent of the average value obtained when a new
gas was used. This deteriorated gas when left to stand
for a few hours would however usuallY recover. on the
whole, the results obtained with the prolonged use of a
gas were found unsatisfactory both for the starting po-
tentials and the lower current values, and so all of the
readings in this investigation were taken in as short an
interval of time as possible and in each case after the
cur1·ent had been passing for a short time only.
With the po1nt charged negatively the usual dif
ficulties encountered in this line of investigationwere
met ,1 in0that all of the smaller currents were very ---- - -- - -------------- -----
11
1 Groton and Wartburg, Ann. d. Phys. ig:1~9 (1905). J. Zeleny, loc. cit.
12
irregular. The presence of rad1urn1 had very little
ef1·ect upon the nega t 1 ve discharge but in the case of the
positive discharge the presence of radium had a marked
effect in steadying the starting potential and also the
currents for the low voltages. The starting and stop
ping potentials were also the same when the radium was 2
present.
It also seemed important to ascertain what effect,
if any , a slight displacement of the point from the
determined center of curvature had upon the current
values and minimwn potentials of the diff'erent sections.
First a slight displacement to one side of the center
was tried, but no appreciable change in the minimum po
tential or lower current values could be detected when
the displacement did not exceed one millimeter . Read
ings for the same potent ial were then .taken with the
point at different pos itions along the axis of section D.
1 Gorton and wa~ \~:ll'g , loc. cit.
2 J. Zeleny, loc . c it.

The results of which are given in table I.
It is seen that a small displacement produces
but a slight effect so that no appreciable error can
arise from lack of perfect centering of the point . An
unexpected effect is noticed however in that the mini
mum potential increases with diminution of the distance
from the surface of the hemisphere.
1.3
llt
III. PROCEDURE IN THE INVESTIGATION.
When starting, the point was carefully adjusted ' and the apparatus thoroughly freed from moisture by exhaust-
ing it several times and in each case allowing the dried
air to remain in the apparatus for some time. The cur-
rent was now allowed to pass to the hemisphere for sever-
al minutes and then the starting potential was carefUllY
determined. In taking the current readings each of the
sections, A, B, c and D was connected in turn to the
galvanometer while the rest were joined to earth. The
currents were carefUllY determined for regularly in-
creasing voltages , the readings of the voltmeter being
adjusted so as to come exactly on one of its subdivisions,
as this permitted a more exact determination. Then a
few points were usually taken on decreasing the voltage
as a check upon the results. These observations were re-
peated for different pressures varying from atmospheric
to that of roout 2 mm. of mercury. For the lower pressures
the maximufil voltage used was limited by the nature of the
discharge, a spark finally passing from the point to the

sphere; but for the higher pressures the voltage was
limited by the maximum capacity of the machine.
Numerous sets of observations were taken both for
the negative and positive discharges in air and oxygen.
15

IV. RESULTS OF THE EXPERIMENTS CONDUCTED WITH AIR.
The manner in which the current distributes
itself over the spherical surface is best shown by a
typical set of observations given in Table II, and
the potential-current curves obtained from these read
ings. see Fig. ~and 5.
These readings were ta1.en with the point placed
at the determined center of curvature. The gas used
was air and the temperature remained constant at 220 o.
for a complete set of positive and negative currents.
The negative currents were always more or less irregular
and therefore the positive currents only are shown in
the plots.
The curves indicate how the current flowing to
each section, A, B and a, at a definite pressure, varies
with the voltage, while the curve A + B + c indicates
how the total current flowing to the hemisphere at a given
pressure varies with the voltage. The various groups of
curves show the distribution of the current at the differ
ent pressures indicated.
16

From the results we see that the current density
is quite uniform over the sections A and B at all of the
pressures used and that even for section o the current
doe~ not deviate greatly from that over A and B, although
the effect of a higher starting potential and the prox
imity of the current flowing from the side of the point
at the higher voltage is quite marked.
The total current passing to the hemisphere at
any pressure can be expressed bY the equation
a= av(V-M)
where M is the minimum potential and a a constant for
the particular pressure. The values of these constants
are given on each curve shown . The currents passing
to sections A and B can also be expressed by an equation
of this form but any error in the value of M would be
much more marked in the case of the smaller current
values, therefore· the value of a in this case would hold
only for the higher voltages.
The results for the relation between the voltage
and current to the central section of the hemisphere (A)
for the positive discharge in air are shown by the
17

curves in figure 6 for the various pressures used.
From these curves those of figure 7 are directly
obtained. These shovr the relation between the pressure
and the potential required to produce a given current.
From these "potential-pressure curves" we see
that the voltage required to maintain a certain current
changes quite slowly for pressures between 40 and 75 cm.
and varies nearly directly as the pressure. But as we
approach the lower values this does not hold and the
voltage changes rapidly for small changes in pressure.
The dotted curve is obtained by subtracting the
potentials for the curve c = o from one of those above,
e.g., c = r.o. This also shows that the values of (V-M)
are linear for the higher pressures and then also di~in
ish more rapidly as we approach zero.
l~

V. EXPERIMENTS WITH OXYGEN.
Since air is a composite of several gases it
se emed advisable to investigate the discharge in a
simple gas. O.xygen was chosen because its minimum po
tential for the positive discharge does not differ great
ly f'rom that for air, 1 and the two might thus be more
readily compared.
In figure g are given the "potential-current"
curves for oxygen. These correspond to those of figure
6 for air and also show the relative voltage and current
to section A only.
19
In figure 9 are given the corresponding 11 potentia1-
pressure" curves. From these it is seen that the gen
eral behavior in o.xygen is quite similar to that in air.
1 Precht, loc. cit.

VI. MINIMUM POTENTIALS IN OXYGEN AND AD~ AND HOW THEY ARE
AFFECTED BY THE PRESENCE OF BADIUM.
The minimum potentials in o.xygen and air can best
be compared by referring to the zero current curve in
figures 7 and 9. Here we see that the minimum potential
for the positive discharge in oxygen is somewhat higher
than that in air.
In the investigation of the minimum potential it
was found that the radium had a very marked tendency to
decrease the minimum potential in oxygen while in air the
only effect noticed was that it steadied the starting of
the current and rendered the starting and stopping volt
ages the same. In figure 9 the dotted line gives the
zero current curve for oxygen without radium near the
discharge while the heavy zero current curve represents
the minimum potential when radium is present to ionize
the gas. The current values above .5 x 10-7 ampere are
not appreciably affected by the presence of radium either
in the case of OxYgen or of air.
20

VII. THE LUMINOUS APPEARANCE OF THE DISCHARGE IN AIR
AND OXYGEN.
When the electrical discharge was passing in air,
there appeared at the point, simultaneously with the rush
of current to the "A 0 section, a very small speck of white
light, and as the voltage was increased the light spot
became larger. When the pressure was decreased the lumin
osity spread back over the entire surface of the point,
sometimes covering the entire wire as far back as the
brass cylinder (I) (see fig. 1). At the lower pressures,
when a sufficiently h1gh potential was reached, for a
spark to pass to the hemisphere, the light became very
intense at the point and a spark passed to the different
sections of the hemisphere.
But with o.xygen the lumi nosity was somewhat dif-
ferent. The light was more of a reddish color and at
the lower pressures, when the spark passed, there seemed
to be a marked tendency for the spark to pass only to the
"B" section. sometimes there would be only a spot of
light on the surface to which the spark passed and then

again there would be a continuous band from the point
to the section 11 B11 • Sometimes the current was observed
to flow when no spot of light was visible at the point
but this may r1ave been due to the fact that the spot was
so small it could not be seen because of the curvature
ot' the surface.
22

VIII • StOOlARY.
1. A high resistance (1-100 megohms) was devised
by which the potentials of a static machine may be regu
lated without encountering any of the difficulties usual-
lY met in regulating such a machine by means of an aux-
11 iary point and plane or an e1ectr.olyt ic resistance.
2. It has been found that an electrical discharge
passing from a pointed conductor to a hemispherical
surface distributes itself quite uniformly over the
surface for all pressures between 2 and 750 mm .
.3· The negative discharge from a point to a
hemispherical surface is quite irregular, especially for potential
2.3
all vo1tages between the startir:g/and the minimum potential
for the positive discharge.
4. The relation existing between the current
and potent 1al at the various pressures for o.xygen does
not differ greatly from that for air.
5. In comparing the potential-pressure curves

obtained under the above conditions with those similarly
obtainedl with the discharge passi~g to a plane we see
that in the case of the former·, especially for the higher
currents and voltages, they more nearly approach the
linear form.
1 compare J. Zeleny, 1oc. cit.
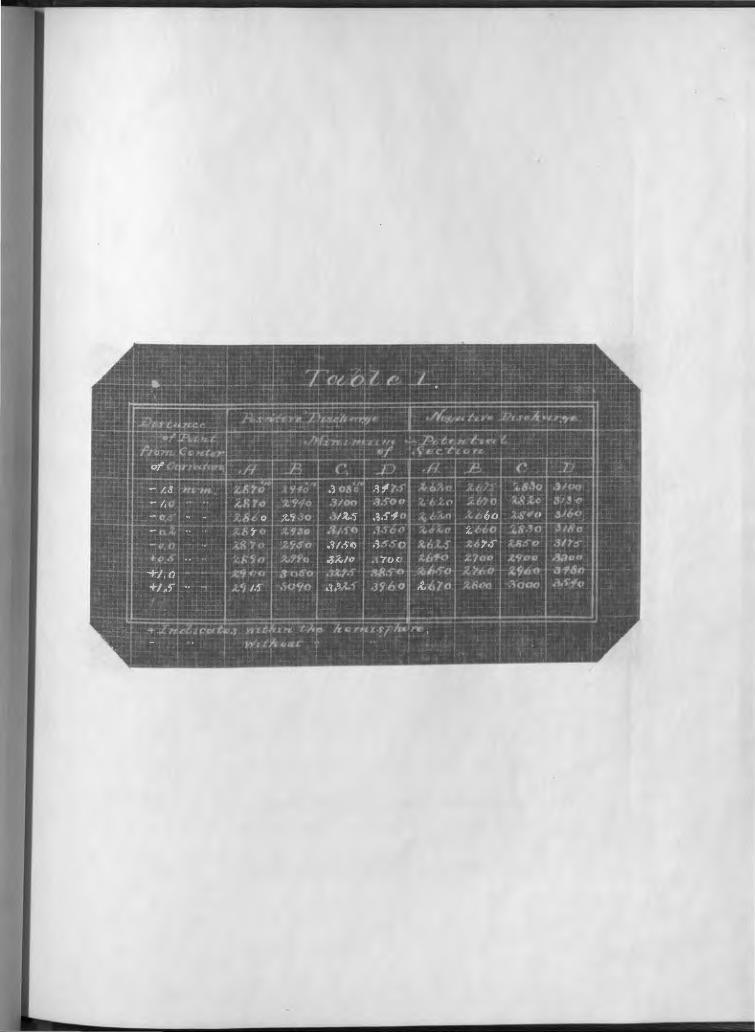


Figure 1 •.