the elementary school performance and adjustment of ...nces.ed.gov/pubs98/98097.pdf · the...
TRANSCRIPT

NATIONAL CENTER FOR EDUCATION STATISTICS
Statistical Analysis Report November 1997
National Household Education Survey
The Elementary School Performanceand Adjustment of Children WhoEnter Kindergarten Late or RepeatKindergarten: Findings from
NationalSurveys
U.S. Department of EducationOffice of Educational Research and Improvement NCES 98-097

NATIONAL CENTER FOR EDUCATION STATISTICS
Statistical Analysis Report November 1997
National Household Education Survey
The Elementary School Performanceand Adjustment of Children WhoEnter Kindergarten Late or RepeatKindergarten: Findings from
NationalSurveys
Nicholas ZillLaura Spencer LoomisWestat, Inc.
Jerry WestNational Center for Education Statistics
U.S. Department of EducationOffice of Educational Research and Improvement NCES 98-097

U.S. Department of EducationRichard W. RileySecretary
Office of Educational Research and ImprovementRicky T. TakaiActing Assistant Secretary
National Center for Education StatisticsPascal D. Forgione, Jr.Commissioner
The National Center for Education Statistics (NCES) is the primary federal entity for collecting,analyzing, and reporting data related to education in the United States and other nations. It fulfills acongressional mandate to collect, collate, analyze, and report full and complete statistics on the conditionof education in the United States; conduct and publish reports and specialized analyses of the meaningand significance of such statistics; assist state and local education agencies in improving their statisticalsystems; and review and report on education activities in foreign countries.
NCES activities are designed to address high priority education data needs; provide consistent, reliable,complete, and accurate indicators of education status and trends; and report timely, useful, and highquality data to the U.S. Department of Education, the Congress, the states, other educationpolicymakers, practitioners, data users, and the general public.
We strive to make our products available in a variety of formats and in language that is appropriate to avariety of audiences. You, as our customer, are the best judge of our success in communicatinginformation effectively. If you have any comments or suggestions about this or any other NCES productor report, we would like to hear from you. Please direct your comments to:
National Center for Education StatisticsOffice of Educational Research and ImprovementU.S. Department of Education555 New Jersey Avenue NWWashington, DC 20208–5574
November 1997
The NCES World Wide Web Home Page address is: http://www.ed.gov./NCES/
Suggested Citation
U.S. Department of Education. National Center for Education Statistics. The Elementary School Performance andAdjustment of Children Who Enter Kindergarten Late or Repeat Kindergarten: Findings from National Surveys,NCES 98–097, by Nicholas Zill, Laura Spencer Loomis, and Jerry West. Washington, DC: 1997.
Contact For Content:Jerry West202–219–1574(e-mail) [email protected]:/www.ed.gov/NCES/NHES
For free single copies of this publication, call the National Library of Education at 1–800–424–1616 or

iii
Acknowledgments
The authors wish to thank the National Center for Education Statistics staff members for
their comments and suggestions on earlier drafts of this report, including Mike Cohen and Edith
McArthur. The report was also reviewed by Suzanne Bianchi, University of Maryland; Jim
Griffin and Naomi Karp, National Institute on Early Childhood Development and Education in the
Office of Educational Research and Improvement at the U.S. Department of Education; Nancy
Karweit, Center for Research on the Education of Students Placed at Risk, Johns Hopkins
University; and Arnie Goldstein and Tim Madigan, Bureau of the Census. The comments and
suggestions of each of these reviewers are greatly appreciated, and the final report reflects many
of their suggestions.

v
Highlights
Data from the 1993 and 1995 National Household Education Surveys show that about onechild in seven in the U.S. either entered kindergarten late or was required to repeat kindergarten. Children usually enter kindergarten late because their parents hold them out until they are moremature. Children usually repeat kindergarten because they are required to do so by the schoolsystem.
• In both surveys, 9 percent of first– and second–graders had experienced delayed entry intokindergarten, as reported by parents. The percentage of first– and second–graders whowere reported to have been retained in kindergarten was 6 percent in 1993 and 5 percentin 1995.
The surveys found that there were similarities between the kinds of children who experienced
delayed entry or kindergarten repetition, but also some notable differences.
• Delayed kindergarten entry was more common among first– and second–graders who hadbirthdays late in the year (July through December), and who were thus relatively young atthe time they were eligible to enter kindergarten, than among children born in the earliestmonths of the year (January through March).
• Boys were reported to have been held out of kindergarten more often than girls have. Boys were also more likely to have been retained in kindergarten.
• Black, non-Hispanic children were less likely than white, non-Hispanic children to havebeen held out of kindergarten until they were older.
• First– and second–graders who had developmental delays were more likely than thosewithout developmental difficulties to have repeated kindergarten were.
The surveys found striking differences in the later school performance of children whowere held out of kindergarten in contrast to those who had to repeat kindergarten. The schoolperformance of first– and second–graders who had been held out of kindergarten was found to bebetter than that of first– and second–graders who entered kindergarten at the prescribed age. Incontrast, children who were required to repeat kindergarten were doing worse than other first–
• In 1993, first– and second–graders who had been held out of kindergarten until they wereolder were less likely than other children to receive negative feedback from their teachersconcerning their academic performance or conduct in class. In 1995, the delayed entrystudents were less likely than students who entered kindergarten on time to have repeatedfirst or second grade.
• First– and second–graders in 1993 who had repeated kindergarten were more likely thanchildren who had not repeated to receive negative feedback from their teachers. Also,

vi
first– and second–graders in 1995 who repeated kindergarten had more schoolperformance problems than children who did not repeat.
When demographic, socioeconomic, and developmental factors were taken into account,the differences in school performance were reduced, but remained significant in the 1993 survey.In the 1995 survey, however, controlling for these background factors essentially eliminated thedifferences between students who were held out and other first– and second–graders. The samewas true of the performance differences between the students who had been retained and otherstudents.
The surveys did not find evidence that children who may have been at increased risk ofexperiencing difficulties in school benefited from (or were harmed by) delayed kindergarten entryto a greater degree than other children. The same was true of kindergarten retention. Specifically,for young male children and children who had developmental delays, neither delayed kindergartenentry nor kindergarten retention were found to have significant relationships with first and secondgrade school performance or adjustment.

vii
Table of Contents
Acknowledgments.................................................................................................................... iii
Highlights................................................................................................................................. v
Introduction ............................................................................................................................. 1
Findings ................................................................................................................................... 17
Summary and Discussion.......................................................................................................... 35
Survey Methodology and Data Reliability................................................................................. 43
References ............................................................................................................................... 49
Appendix A: NHES:93 and NHES:95 Interview Items ............................................................. 53
Appendix B: Analyses of Delayed Kindergarten Entry and KindergartenRetention for Children At-Risk of School Problems ............................................ 59
Appendix C: Logistic Regression Model Coefficients ............................................................... 65

viii
List of Tables
Table 1.— Percentage of first– and second–graders who were delayed entry intokindergarten and who repeated kindergarten, by child and familycharacteristics: 1993 and 1995.............................................................................. 18
Table 2.— Adjusted odds ratios of delayed entry into kindergarten andkindergarten retention for first– and second–graders, by child andfamily characteristics: 1993 and 1995.................................................................... 22
Table 3.— Percentage of first– and second–graders with school performanceproblems, by experience with delayed kindergarten entry andkindergarten retention: 1993 and 1995.................................................................. 28
Table 4.— Adjusted odds ratios of school performance problems for first– andsecond–graders, by delayed entry into kindergarten, kindergartenretention, and child and family characteristics: 1993 and 1995............................... 31
Table B1.— Adjusted odds ratios for negative teacher feedback for children atrisk for delayed kindergarten entry and kindergarten retention: 1993first– and second–graders ..................................................................................... 62
Table B2.— Adjusted odds ratios for experience with at least one schoolperformance problem for children at risk for delayed kindergartenentry and kindergarten retention: 1995 first– and second–graders ......................... 63
Table C1.— Logistic regression models relating delayed entry into kindergartenand kindergarten retention to child and family characteristics forfirst– and second–graders: 1993 and 1995 ............................................................ 68
Table C2.— Logistic regression models relating school performance problems todelayed entry into kindergarten and kindergarten retention for first–and second–graders: 1993 and 1995 ..................................................................... 69
Table C3.— Logistic regression models relating negative teacher feedback forchildren at risk to delayed kindergarten entry and kindergartenretention: 1993 first– and second–graders............................................................. 70
Table C4.— Logistic regression models relating experience with at least oneschool performance problem for children at risk to delayedkindergarten entry and kindergarten retention: 1995 first– and
..................................................................................................... 71

ix
List of Figures
Figure 1.— First– and second–grade students who experienced delayed entry intokindergarten, or kindergarten retention, compared with all first– and
........................................................................................... 26

1
Introduction
The age at which children start formal schooling varies across countries and has changed
over time in this country. Starting school with first grade at age six used to be the norm, whereas
now most children go to kindergarten at age five (West et al. 1992). However, the five-year-olds
in today's kindergarten classes are older than the kindergarten pupils of the past. Whereas it used
to be standard practice to require kindergartners entering in September to have turned five by the
following December or January, it has become increasingly common for schools to require
children to have turned five by September or October, or even earlier (Meisels 1992; Walsh 1989;
and Shepard and Smith 1986). Another difference is that most of the children entering
kindergarten nowadays have had prior experience with preschool programs or center-based
childcare (West, Hausken, and Collins 1993). This was not the case in the past.
The findings of developmental psychology do not demonstrate that one age of school
entry is inherently preferable to another. No matter where the age of entry is set, educational
systems have to deal with the fact that children vary in their rates and patterns of development.
Because rates of development are so rapid in the preschool and early elementary years, disparities
between different children of the same chronological age can be striking. One 5–year–old may be
reading fluently, while another can identify only a few letters of the alphabet. There can also be
marked differences within the same child across different domains of development; such as when a
kindergartner is able to count objects and solve simple math problems, but cries or hits other
children when frustrated in group situations.
For the most part, schools have handled children's differences in developmental levels from
a "maturational readiness" approach (Kagan 1990). From this perspective, schools expect
children to have reached a certain standard of physical, intellectual, and social development before
starting kindergarten. Thus, whether or not children are deemed "ready for school" in the fall of
the year in which they turn five is determined to a great extent by the social demands of the
kindergarten classroom and the cognitive demands of the kindergarten curriculum. All young
children are "ready to learn," but not all children are prepared to concentrate on a task for
extended periods of time, hold a pencil properly, identify most of the letters of the alphabet, or
take turns and share things with other children (Zill et al. 1995). If kindergarten programs
demand these capabilities, some 5–year–olds will not be able to cope with them. If demands are
less stringent, and the school is prepared to deal with considerable variation in children's social
and cognitive development, the proportion of "five's" that will have a fruitful kindergarten
experience may be greater. However, not all early elementary programs may have the resources,
2
or the philosophical inclination, to provide the individual attention that may be required for a child
who is well behind�or well ahead of–most other children in social maturity or intellectual
accomplishment.
The use of delayed school entry and kindergarten retention to deal with individual
differences in children's early development
Given the individual differences in the pace and pattern of children's development, some
parents have chosen to delay their children's enrollment in kindergarten by a year (Meisels 1992;
Bredekamp and Shepard 1989; and Shepard and Smith 1986). The rationale is that the additional
year will give children who have late birthdays or are somewhat behind their age-mates in social,
motor, or academic skills extra time to mature. Hence, they will be better prepared to perform as
expected in the classroom. Other times, parents' motivation for delaying school entry is frankly
competitive—even though the child may be capable of handling the demands of kindergarten, they
want to give him or her an edge over other pupils, both during the kindergarten year and in later
grades (Kagan 1990; and Smith and Shepard 1987). There are also situations in which schools
make recommendations to parents about delaying children's entry into kindergarten, based on
"readiness" testing done before school entry (Kagan 1990; Bredekamp and Shepard 1989;
Charlesworth 1989; and Meisels, Steele, and Quinn 1989). Results from a 1988 survey of state
education officials across the country suggest that from 10 to 50 percent of children who are age-
eligible to start kindergarten are held out or placed in developmental kindergarten classes at least
in part because of poor performance on readiness tests (Gnezda, Garduque, and Shultz 1991).1
One way schools have dealt with kindergartners who are considerably less advanced than
other children of the same age is to require these children to attend kindergarten for a second
year, or go into a "developmental" class (Bredekamp and Shepard 1989; and Charlesworth 1989).
The theory behind this practice is that it permits the child more time to develop capabilities that
he or she will need to function effectively in first grade, when both the social and academic
demands will be tougher than those in kindergarten (Byrnes 1989; and Smith and Shepard 1987).
Another hope is that by changing the reference group to one composed of younger children or
others who are relatively slow in their development, the child's comparative position will shift
from the bottom of the heap to the middle of the pack (Smith and Shepard 1987). There is also
1 Unfortunately, the report that cites these results gives no indication as to where most states fall in this relatively wide rangeof 10 to 50 percent. However, the report also indicates that the survey found wide variation in the types of readiness testsused by states and the cutoff scores used to determine passing and failing.
3
the expectation that young children will be less likely to feel stigmatized by being held back than
would older children who may have a better understanding of the social connotations of retention
and stronger ties to their age–mates (Bredekamp and Shepard 1989; and Smith and Shepard
1987). Of course, part of the rationale for having children repeat grades is that it will be of
benefit to the other children in the class, the ones who do not have to repeat (Smith and Shepard
1987). It is argued that these children will be able to get more attention from the first–grade
teacher and advance more rapidly, because the teacher will not have to spend a lot of time trying
to control the behavior of socially immature pupils, or providing remedial instruction to pupils
who are far behind the rest of the class academically.
All of these arguments in favor of delayed kindergarten entry and kindergarten retention
are predicated on the notion that children must be capable of successfully completing the
established kindergarten curricula, rather than the idea that schools should be flexible in their
efforts to teach children with varying abilities at each grade level (Kagan 1990; Bredekamp and
Shepard 1989; and Charlesworth 1989). This ideology is reflected in school districts' institution
of minimum competency standards at each grade level, which in turn, encourage the use of
delayed entry and retention practices for children who do not measure up to the standards
(Meisels, Steele, and Quinn 1989; and Rose et al. 1983). However, a growing body of research
suggesting that these practices are ineffective, or even harmful, has rekindled the debate about
their use.
Criticisms of these practices
Both the practice of delaying entry into kindergarten and that of retaining children in
kindergarten have been criticized, though on somewhat different grounds. A point made by critics
of both practices is that development is very fluid in the preschool and early elementary years, and
obtaining reliable assessments of children's progress is more difficult than in the later elementary
grades. A child's standing relative to others of the same age is only weakly prognostic of later
achievement (Cardon, Fulker, and DeFries 1992; and McCall 1987). A child who is somewhat
behind may experience a developmental spurt during kindergarten or first grade, and be up with
or even ahead of most age–mates by third or fourth grade. Thus, delayed entry or kindergarten
retention may not really be necessary.
Critics of delayed entry note that this practice augments educational differences between
children of higher and lower socioeconomic levels (Meisels 1992; Kagan 1990; Bredekamp and
Shepard 1989; Smith and Shepard 1987; and Shepard and Smith 1986). For instance, parents

4
who are socioeconomically advantaged have more leeway to voluntarily postpone their children's
kindergarten enrollment because they have more job flexibility and the financial resources to make
alternative childcare or early education arrangements for their children. Parents who have less
education and lower incomes may have little choice but to put their children into kindergarten at
the earliest possible age, if only because of the low-cost childcare that full-day, publicly supported
kindergarten provides. Thus, when an affluent family voluntarily delays the entry of their son or
daughter into kindergarten, it means that the educational and economic advantages that the child
already enjoys are compounded by the child being older and more mature than his or her
counterpart from a lower-socioeconomic status (SES) family. Alternatively, when children from
lower-SES families are denied entry into kindergarten based on readiness testing, these children
who may benefit the most from structured learning environments are instead being turned away.
Furthermore, holding children out of kindergarten, whether as a result of readiness testing or
parental decisions, overlooks research findings indicating that being overage for one’s grade is
one of the most powerful predictors of dropping out of high school (Meisels 1992). However, it
is not clear from existing research whether affluent children held out of kindergarten until they are
older are at risk of dropping out of school in the same way that other overage students (e.g., as a
result of readiness placement, or retention) may be (Meisels 1992).
Opponents of delayed kindergarten entry also argue that this practice leads to an upward
shift in teachers' expectations, which may be unrealistic and unfair for younger pupils who enter
school at the prescribed time (Meisels 1992; Bredekamp and Shepard 1989; Meisels, Steele, and
Quinn 1989; Walsh 1989; and Shepard and Smith 1988a). By removing younger children and
poor performers from the regular grade progression, older and more academically able students
set the standards in kindergarten and first– and second–grade classrooms. When some children
who are entering kindergarten on time are still four-years-old, while other children are entering
kindergarten at age six, the age disparity in the classroom could be as much as a year and a half.
Inasmuch as every month of age brings noticeable gains in children's accomplishments during the
preschool and early elementary years, the older children will tend to set the pace and establish the
norms, whereas those who entered when eligible may appear to be "behind." These opponents to
delayed kindergarten entry also argue that having a highly structured, academic curriculum to
accommodate older students is developmentally inappropriate for young children and contrary to
the original conception of what kindergarten ought to be.
Those who argue against the practice of kindergarten retention note that pupils who are
required to spend a second year in kindergarten rarely receive special instruction in the areas in
which they are experiencing difficulty. Instead, they usually get the same curriculum over again,
5
though perhaps with a different teacher. Critics point out that the efficacy of retention has not
been demonstrated in controlled studies; indeed, the preponderance of available evidence suggests
that it is not effective (Meisels 1992; Holmes 1989; Shepard 1989; Gredler 1984; and Rose et al.
1983). Some also argue that early grade retention, like delayed kindergarten entry, may even
have negative repercussions into the high school years, in so far as being older than one’s
classmates is associated with a higher likelihood of dropping out of school (Meisels 1992; Nason
1991; Bredekamp and Shepard 1989; and Shepard and Smith 1988b).
Opponents of kindergarten retention contend that being required to repeat a grade is
stigmatizing, for young as well as older children (Nason 1991; Shepard 1989; and Shepard and
Smith 1988b). Even if other children do not treat such pupils with disdain, they are often
categorized as "slow learners" by the school system, and this can work to their detriment in later
grades. A final criticism is that retention falls disproportionately on children from low-income and
minority family backgrounds (Meisels 1992; and Shepard and Smith 1988b).
The need for better data about delayed entry and retention
There has been lively debate about the wisdom of delayed entry into kindergarten and
kindergarten retention, and some school systems have modified their practices as a result.
However, the debate has occurred in the absence of a solid body of evidence about delay and
retention, especially evidence based on large and representative samples of schoolchildren. Key
questions, such as how widespread these practices are, and which children are most affected by
them, remain unanswered. Also not determined is what the implications of these practices are for
the early elementary school performance and adjustment of the children involved. This report is
intended to remedy this lack, at least in part.
Data source
This report is based on data from the National Household Education Survey (NHES).
The NHES is a nationwide telephone survey of probability samples of households; the survey is
conducted by Westat for the National Center for Education Statistics in the U.S. Department of
Education. Different modules and rounds of the survey have focused on different educational
issues, from early childhood program participation to adult education. The data used in the
present report are from the 1995 and 1993 rounds of the survey, and are based on reports by
parents of first– and second–grade pupils. More information on the NHES data is provided in
later sections of this report.

6
Research questions
This report uses data from the NHES to address the following research questions:
n How many U.S. children now in first and second grade have experienced delayed entryinto kindergarten? How many were required to repeat kindergarten?
n What child and family characteristics are associated with delayed entry and kindergartenretention? Are pupils born later in the year more likely to be delayed or retained? Areboys more frequently delayed or retained than girls? Is there evidence that repetitionoccurs more frequently to children from minority or lower socioeconomic familybackgrounds?
n Are certain child and family characteristics more important than others are as far as theirrelationships to delayed kindergarten entry and kindergarten retention? Which factorsemerge as significant in analyses that examine several characteristics simultaneously?
n What are school performance and adjustment like for first– and second–graders whohave been held out of kindergarten until they were older? What are they like for thosewho have repeated kindergarten? Do children who are behind grade for age appear todo about as well as other children, or do they experience more than their share ofdifficulties? What do the findings imply for arguments against or in favor of delayedentry and retention?
It is important to point out that this report is not an evaluation of the efficacy of the
practices of delaying entry into kindergarten or retaining children in kindergarten. That would
require the random assignment of pupils in the survey to experimental and control conditions, or
matching pupils on characteristics potentially associated with retention (e.g., sex, race–ethnicity,
age, and preschool experience) and then comparing the subsequent school performance of those
who had been retained and those who had not been. Instead, in this report multiple logistic
regression analyses were used to examine the characteristics of children that are related to delayed
entry and retention after other, associated factors were controlled. However, it is likely that there
were important differences between retained pupils and other pupils that were not fully
represented by the demographic, socioeconomic, and school experience variables that were
entered into the multiple regression equations.
This report also examines whether delayed kindergarten entry and kindergarten retention
is related to subsequent school performance in the first and second grades. Note that this analysis
focuses on the school performance of children who were delayed or retained in kindergarten; it

7
does not look at the possible significance of delayed entry and retention for the achievement of
pupils in first and second grade who were not held back. That is, it does not examine whether the
experience of those not delayed or retained is influenced in any way by having older children
present in their classrooms as a result of delayed kindergarten entry or retention.
Before describing the specific measures used in the 1993 and 1995 NHES surveys and the
survey findings, we summarize the results of earlier research on the correlates of delayed entry
into kindergarten and kindergarten retention.
Summary of Findings of Previous Research
Existing research on child and family factors associated with delayed kindergarten entry
and kindergarten retention is relatively meager, especially studies based upon nationally
representative samples of children. Nevertheless, the findings of available research are relatively
consistent as far as they go. Research on the consequences of delayed entry and retention is more
plentiful, and some of this research makes use of study designs that follow the same group of
students beyond kindergarten to evaluate whether there are any longitudinal effects of delayed
entry or retention. Other studies make use of matched control groups of students (such as those
who were considered for retention but not held back) in order to better identify any effects of
delayed kindergarten entry or repeating kindergarten. But while these studies have design
strengths, they also suffer from methodological weaknesses. Sample sizes are often scanty, so
there is insufficient statistical power to detect small but substantively important differences
between groups. The samples are rarely representative of the general population of young
elementary school students. One can also question whether matching procedures really succeeded
in equating pupils who were or were not held back on their prior achievement, or on personality
or behavioral factors that may be significant for later performance.
Factors associated with delayed kindergarten entry
Previous research indicates that children who are relatively young when eligible to enter
kindergarten and boys are more likely to experience delayed kindergarten entry than are older
children and girls. Children from families that are socioeconomically advantaged are also more
likely than those from less advantaged families to be held out of kindergarten. Using data from a
national sample of children in the 1991 National Household Education Survey, McArthur and

8
Bianchi (1993) found that children who were not black, were relatively young, had a low birth
weight, and lived with parents who were at least high school graduates were more likely to have
been delayed from starting kindergarten. In a study on a small sample of children from southern
California, younger children, boys, and non–Hispanic children tended to be held out of
kindergarten more often (Cosden, Zimmer, and Tuss 1993).
In contrast to the research suggesting that children from more socioeconomically
advantaged families are voluntarily delayed from entering kindergarten more often than other
children, the trend of schools using standardized tests to screen out "unready" children from
kindergarten entry suggests a different pattern. Because children who are from ethnic and
language minorities and who come from less educated families tend to score lower on these types
of tests, these children may also be more apt to be kept from entering kindergarten when age-
eligible (Kagan 1990; Bredekamp and Shepard 1989; Meisels, Steele, and Quinn 1989; and
Shepard and Smith 1988a).
Factors associated with kindergarten retention
Similar to the findings regarding delayed entry, previous research indicates that relatively
young children and boys tend to repeat kindergarten more often than older children and girls. On
the other hand, the children found to be required to spend an extra year in kindergarten are more
often those from relatively disadvantaged families. Data from the 1991 National Household
Education Survey showed that kindergarten retention was more common among children who
were male, were black or Hispanic, were born in the later half of the year, who had not attended
preschool, who had a physical or learning disability, or who lived with parents with no college
education (Collins and Brick 1993; and McArthur and Bianchi 1993).
Using national data from 7– to 17–year–olds in the National Health Interview Survey,
Byrd and Weitzman (1994) found that several social and health factors increased the risk of
having repeated kindergarten or first grade including living in poverty, being male, having a
mother with less than a high school diploma, having less than two biological parents at home, and
having had a low birth weight. A much smaller study also found strong correlations between
being male or relatively young and being retained in kindergarten (Mantzicopoulos et al. 1989).
Morrison, Griffith, and Alberts (1997) found that, among kindergartners and first–graders
in a western Canadian city, paternal occupation status was reliably lower among retained children
than among young first–graders. In other respects, however, these investigators found little
9
evidence that major background differences existed among promoted, held–out, and retained
children.
Delayed kindergarten entry and later school performance
Parents usually decide to delay their children's entry into school based on the belief that if
children are older, they will do better in school than if they were among the youngest in their
class. The research evidence suggests that this may in fact be the case. However, the benefits of
being older are not large and may be transitory (Shepard and Smith 1986). This conclusion has
been reached by researchers using national samples of children, smaller samples of children from
different state and local school districts, cross-sectional approaches that examine students at
various grade levels, and longitudinal designs that track the performance of a group of students as
they progress through school.
Some studies that have examined the effects of children's ages at kindergarten or first
grade entry on their later performance in elementary or secondary school have found tangible but
relatively modest effects. For example, Langer and colleagues (1984) studied the effect of
delayed entry in a broad grade range of students. In national samples of fourth– and eighth–
graders, relative age at first grade entry was found to account for less than 1 percent of the
variance in a combined measure of math, science, and reading achievement. Among eleventh–
graders, no effect of age at school entry was apparent. However, there was an indication that
students who were younger when entering school were more likely to have been retained in a
grade.
In a study of students in Kentucky, slightly higher scores on standardized reading,
language, and math tests were observed among first– and fourth–graders who were age six
instead of five when they entered first grade (Davis, Trimble, and Vincent 1980).2 All differences
disappeared among eighth–graders, however. In a study of children in Pittsburgh, older age at
first grade entry had a small positive effect on math achievement in the first grade. On the other
hand, it had no significant effects on first–grade reading achievement, first–grade conduct, reading
or math achievement four years later, or the probability of being placed in remedial programs or
retained in grade (Bickel, Zigmond, and Strayhorn 1991).
2 The authors indicate in this study that children in Kentucky could enter first grade at age 5 if they reached age 6 by December31. These regulations may have changed since this study was published in 1980.

10
Other studies have found no effects of older age at school entry. For example, in a recent
panel study of growth in reading and math test scores among Canadian kindergartners and first–
graders, it was found that in itself, entrance age was not a good predictor of growth in reading or
math skills during the first grade (Morrison, Griffith, and Alberts 1997). In a study of children in
a Delaware school district, Dietz and Wilson (1985) found that age at kindergarten entrance had
no significant relationship with kindergarten readiness test scores, or with second– or fourth–
grade reading and math achievement test scores. Cameron and Wilson (1990) also found that
children who were held out of kindergarten until they were one year older than the minimum
eligible age showed no advantages as far as standardized reading and math test performance in the
second and fourth grades. One study was able to control for a measure of children's cognitive
ability before entering kindergarten while examining the effect of age at entry (Kinard and
Reinherz 1986). With this control in place, academic achievement (i.e., reading, math, language,
and overall) and school adjustment (e.g., anxiety, hyperactivity, attention, and peer relations) of
children at the end of kindergarten, and in third or fourth grades, did not differ by age at
kindergarten entry.
As mentioned above, in some of these studies, sample sizes may have been insufficient to
detect small but substantively important differences between groups.
Kindergarten retention and later school performance
When children are required to repeat kindergarten or attend a transitional grade before
first grade, the intention is to help them bolster their academic or social skills early in order to
avoid experiencing problems in later grades. Reviews of the research on the effects of retention
and the use of transitional grades (i.e., 2 year kindergarten programs) on later school performance
indicate that neither of these interventions gives children a lasting academic advantage over other
children who had experienced problems but were not retained (Meisels 1992; Nason 1991;
Holmes 1989; Shepard 1989; Shepard and Smith 1988a; Shepard and Smith 1986; Gredler 1984;
and Rose et al. 1983). There is also some evidence that children who were having problems in
kindergarten but were "socially promoted" do not experience substantially more difficulties later
in school than other children who were promoted without question based on academic merit
(Dennebaum and Kulberg 1994). There is virtually no research, however, that looks at the effects
on other pupils of having a pupil in the class who is socially immature or substantially behind in
academic skills.

11
Mantzicopoulos and Morrison (1992) matched two groups of students on
sociodemographic characteristics, their risk of experiencing reading problems, and reading and
math achievement test scores in kindergarten. They found that reading and math achievement
levels in first and second grade were no different between retained children and promoted
children. There were also no differences found with respect to behavior problems. Similar results
were found in a study of Colorado first–graders that used comparable matching procedures
(Smith and Shepard 1987). When the students who had and who had not been retained in
kindergarten were compared, no significant differences were observed with respect to teacher
ratings on reading, math, social maturity, self-concept, and attention to schoolwork.
Dennebaum and Kulberg (1994) examined school achievement in the first through third
grades for four groups of children in a Rhode Island school district. One group was retained in
kindergarten, one was placed in a transitional program before first grade, one was recommended
for retention or transitional programs but instead went on to first grade, and one went straight
from kindergarten to first grade without question as to their promotion. The results showed that
the retained children performed the poorest of the four groups on reading, math, and language
tests. They also indicated that those who ignored the recommendation for kindergarten retention
performed just as well on the first through third grade tests as did those promoted to first grade
without question. Another study of second– through sixth–graders in a New York school made
similar comparisons based upon kindergarten retention experiences and found that there were no
significant differences in second through sixth grade standardized test scores between retained
children and those who disregarded recommendations for retention (May and Welch 1984).
A question that may be raised about all of these studies is whether the matching
procedures really produced equivalent groups, given that random assignment was not employed.
Another issue in some of the studies is whether the sample sizes were large enough to detect
relatively small but substantively important differences in later achievement or adjustment. On the
other hand, Alexander and colleagues (Alexander, Entwisle, and Dauber 1994) argue that findings
in previous research indicating no differences between retained students and other students may
be reflective of positive outcomes for retainees. Their longitudinal study of students in Baltimore
focuses on retention in first grade and beyond. Their results suggest that retainees' academic
performance is improved during and after the retained year, not reaching the performance levels
of promoted students, but narrowing the gap nevertheless. They thus conclude that retention
often helps students in the early primary grades.

12
There is some research that seems to support the notion that children may have lower self-
esteem as a consequence of being retained, though not all the research specifically looks at the
consequences of being retained in kindergarten (Byrnes 1989; and Shepard and Smith 1988b). In
contrast, Alexander, Entwisle, and Dauber (1994) found no negative effects of retention in first
grade on students' self-esteem. In fact, they found that academic self-esteem improved during the
retained year and held steady during the rest of elementary school, and attribute this to retained
students' improved academic performance. The frequent findings cited above of no differences in
test scores or behavior suggest that if there are negative effects on self-confidence, they are
generally not severe enough to impair academic performance.
Strengths and Limitations of the Present Study
In summary, the results of previous research would not lead us to expect substantial
differences in academic performance or adjustment between first– and second–graders who had
experienced delayed kindergarten entry or kindergarten retention and those who had not,
especially after demographic and socioeconomic factors are statistically controlled. It is important
to note, however, that the comparisons made in this report are between pupils who experienced
delayed kindergarten entry or retention and other first– and second–grade students in general. It
was not possible with the NHES data to compare pupils who had been delayed or retained with
other children who were potential candidates for these practices (e.g., they had problems in
preschool or kindergarten) but did not experience them. In other words, it was not possible to
take into account, or control for, such factors as children’s cognitive abilities or social
development before school entry or during kindergarten. This would have been desirable, since
children who have relatively low ability levels and who exhibit behavioral problems before and
during kindergarten would be expected to be rather heavily represented in the delayed and
retained groups and to have problems later in school, more so than would other children. Thus,
controlling for children’s preschool and kindergarten ability levels would have better enabled the
analyses to isolate any effect of delayed entry or retention on later school performance, apart from
ability problems that children may have had to begin with.
In addition, the measures of school performance and adjustment available in the NHES are
somewhat different than those used in the studies discussed above. This should not be considered
a limitation of this study; however, it is important to point out that for the most part, the
performance measures used in earlier research are students' scores on standardized achievement

13
tests or teacher ratings of pupil behavior and adjustment. In contrast, the 1993 and 1995 NHES
measures of school performance and adjustment are derived from parents' reports on their
children's standing in class and on various problems their children may be having in school.3
These measures are described in more detail below.
Given the design of the survey and differences in measurement methods, the NHES data
represent a significant expansion of the knowledge base about delayed kindergarten entry and
kindergarten retention. They provide a multifaceted statistical profile of the children who have
experienced delayed entry and retention, and permit comparisons with a large and nationally
representative sample of early elementary schoolchildren. Sample numbers are large enough to
provide relatively sensitive detection of possible differences between groups. The measures
available in the NHES reflect both academic performance and behavior and adjustment in school,
and furnish an important perspective that is often missing from existing research, namely, the
parent's.4
Data Source: The National Household Education Survey
This report is based on data from the 1995 and 1993 National Household Education
Surveys (NHES:95 and NHES:93). The NHES is a national telephone survey of households that
collects descriptive data on the educational activities of the noninstitutionalized civilian U.S.
population. The primary purpose of the NHES is to study issues of high priority to the U.S.
Department of Education on a rotating basis, focusing on topics that cannot be addressed
adequately through institution-based studies. Households are selected for the survey using
random digit dialing (RDD) methods and data are collected using computer-assisted telephone
interviewing (CATI) technology.
The data used in this report were collected from parents or guardians of first– and
second–graders. The number of first– and second–graders included in the analyses is 3,071 from
the NHES:95 and 4,260 from the NHES:93. The data were weighted to make them
3 The NHES data do not include any teacher reports of student performance; however, other studies such as the National Surveyof Children have found moderate positive correlations between parent and teacher reports of children’s academic standing
(Zill and Coiro 1992).4 The NHES data were derived from parent interviews. A description of the NHES and the key indicators reported by parentsis provided below in the “Data Source” section of the report.
14
representative of the entire population of first– and second–graders in the nation, including those
living in households without telephones. Each of the samples represents an estimated population
of over 7 million first– and second–graders.
Operational definitions of delayed entry and retention
As defined in the NHES, children who experienced delayed entry into kindergarten are
those whose parents enrolled them in kindergarten after the eligible age to start school according
to guidelines of their school district.5 Children who were retained in kindergarten are those who
attended two or more years of kindergarten before entering first grade. Parents were asked a
general question as to whether their children attended "one or two years of kindergarten," instead
of specific questions about kindergarten retention and transitional grade placement. The specific
NHES questions used to determine children's delayed entry and retention statuses are shown in
appendix B.
First and second grade performance measures
Of primary interest in this report is whether the experiences of delayed entry into
kindergarten and retention in kindergarten have repercussions for children's academic
performance and adjustment in first and second grades. The measures of performance and
adjustment available in the NHES:95 and NHES:93 differ, primarily because these two studies
focused on different topical areas: school readiness in 1993 and childcare and early childhood
program participation in 1995. While similar performance measures are not available across study
years, it was considered advantageous in some respects to have a diverse set of measures so that
delayed entry and retention effects could potentially be detected across a variety of student
outcomes in the first and second grades.
In the NHES:95 data, school performance and adjustment was tapped by parent responses
to four questions: (1) whether the child's school work is ranked at or below the middle of the
class; (2) whether teachers or other school personnel have reported that the child is having
behavior problems in class; (3) whether teachers or other school personnel have reported that the
child is having schoolwork problems; and (4) whether the child has repeated first or second
5 It is worth noting that this measure of delayed kindergarten entry likely reflects circumstances other than simply parentalchoice, including state or school district regulations on kindergarten entry or attendance, school readiness testing policies,child care and preschool program availability, and parents’ economic or financial situations.
15
grade.6 A summary measure was derived by coding whether or not the child had exhibited any of
these school–related problems.
For the NHES:93 data analyses, a subset of five items from a series measuring teacher
feedback on children's school performance and behavior was used. The five items asked whether
the child was reported by teachers to be: (1) not learning up to capabilities; (2) not concentrating
or paying attention; (3) acting up in school or disrupting class; (4) restless, fidgeting, or not sitting
still; and (5) having trouble taking turns, sharing, or cooperating with others. The 1993 measures
were chosen because they have been found in psychometric analyses to form a reliable scale
(alpha=0.70) indicating underachievement and inattention or social problems (Vaden-Kiernan et
al. 1994). The summary measure of school performance and adjustment used in this report for the
1993 data identified whether or not the child was reported to have had at least one of the five
problems listed above.
The actual wordings of the questionnaire items from the NHES:95 and NHES:93 used to
create the indicators of children's school performance and adjustment are presented in appendix A.
6 For the school performance measure indicating having repeated first or second grade, first–graders certainly have a lowerprobability than second–graders of having repeated, because they have not yet been exposed to the risk of repeating secondgrade. However, this is not a factor for the other three NHES:95 measures that are also used to evaluate school performance.
17
Findings
In this section we examine the overall prevalence of delayed entry and retention, as well as
child and family characteristics that are related to these experiences, using both the 1995 and 1993
NHES data. This is followed by a presentation of survey findings regarding the questions of
whether delayed kindergarten entry and kindergarten retention have consequences for first and
second grade school performance and adjustment.
Prevalence of delayed kindergarten entry and kindergarten retention
Table 1 presents estimates regarding the prevalence of delayed kindergarten entry and
kindergarten retention among first– and second–graders in 1993 and 1995. In both years, 9
percent of all first– and second–graders were reported to have been held out of kindergarten by
their parents. The overall prevalence of kindergarten retention was also similar in the two
surveys, affecting 5 percent of pupils in 1995 and 6 percent in 1993.
Factors associated with delay and retention: Bivariate analyses
As shown in table 1, some of the child- and family-related factors found to be associated
with delayed kindergarten entry and kindergarten retention in previous research, such as age and
sex, were also related to these events in the NHES data.
Child and family characteristics and delayed entry. Children born in the latter half of
the year, and thus relatively young at the time they were eligible to enter kindergarten, were more
likely to have been held out of kindergarten. In 1993 and 1995, from 11 to 13 percent of children
born in July or subsequent months were delayed from entering kindergarten, compared to only 5
or 6 percent of children born in January through June. Data from both survey years also show
that delayed kindergarten entry was experienced more often among males than females—11
percent versus 6 percent in 1995, and 10 percent versus 7 percent in 1993.
In 1993, but not in 1995, pupils who had a significant delay in their growth or
development were twice as likely as other pupils to have been held out of kindergarten—18
percent of first– and second–graders whose parents reported that they had been diagnosed as

18
Table 1.— Percentage of first– and second–graders who were delayed entry into kindergarten and who repeated kindergarten,by child and family characteristics: 1993 and 1995
1993 1995Characteristics Estimated
number inDelayed entry into
kindergartenRepeated kindergarten Estimated
number inDelayed entry into
kindergartenRepeated kindergarten
thousands Percent s.e. Percent s.e. thousands Percent s.e. Percent s.e.
Total 7,387 9 0.5 6 0.4 7,652 9 0.5 5 0.5
Child's sex Male 3,674 10 0.8 7 0.6 3,902 11 0.9 6 0.7 Female 3,713 7 0.7 5 0.5 3,750 6 0.6 4 0.5
Time of year child born 1st quarter (Jan-Mar) 1,952 6 1.0 4 0.8 1,872 5 0.7 4 0.7 2nd quarter (Apr-Jun) 1,821 5 0.7 7 1.1 1,885 6 0.9 4 1.0 3rd quarter (Jul-Sep) 1,970 11 1.0 6 0.8 2,062 11 1.3 5 0.9 4th quarter (Oct-Dec) 1,644 13 1.4 6 0.8 1,832 13 1.4 6 1.0
Child's race–ethnicity White, non-Hispanic 5,075 9 0.7 5 0.4 5,123 10 0.7 4 0.5 Black, non-Hispanic 1,152 6 1.2 8 1.4 1,193 5 1.0 7 1.5 Hispanic 854 10 1.4 5 1.1 961 9 1.4 5 1.0 Other races 306 5 2.2 7 2.5 375 9 2.2 6 2.0
Doctor has said childdevelopmentally delayed Yes 297 18 4.0 18 3.3 400 11 2.7 16 3.4 No 7,090 8 0.5 5 0.4 7,251 9 0.5 4 0.5
Child less than 5 1/2 lbs at birth Yes 523 8 2.1 10 1.8 555 6 1.8 8 1.7 No 6,863 9 0.6 5 0.4 7,097 9 0.6 4 0.5
Child attended center-basedprogram before entering school Yes 5,255 9 0.6 6 0.4 4,924 9 0.7 4 0.4 No 2,131 8 1.0 6 0.9 2,728 8 0.9 6 0.8
Parents in household Birth mother & birth father 4,410 9 0.6 5 0.4 4,684 10 0.8 4 0.5 Birth mother & other father1 560 8 2.2 7 2.0 559 6 1.8 6 1.7 Birth mother only 1,766 8 1.2 6 0.9 1,745 8 1.1 5 0.7 Birth father2 323 7 1.9 6 1.8 316 4 1.5 8 3.0 Adoptive parent3 114 22 6.8 14 5.4 101 9 4.1 3 2.3 Other parents 214 7 2.8 14 4.7 247 6 1.9 9 3.4
Parents' highest education Less than high school 652 8 1.8 9 2.1 799 8 1.6 6 1.6 High school diploma or equivalent 2,512 8 0.9 7 0.8 2,317 8 0.8 4 0.6 Some college4 2,352 8 0.9 4 0.6 2,256 10 1.2 5 0.8 Bachelor's degree or higher 1,870 10 1.1 5 0.6 2,280 9 0.9 5 1.0
Language parents speak most at home Both/only parent(s) speak(s)English 6,779 9 0.6 6 0.4 6,984 9 0.6 4 0.5 Parent(s) speak(s) other language 608 8 1.3 7 1.5 668 8 1.5 7 1.6
Household poverty status Poor 1,954 9 1.2 8 1.1 1,839 7 1.0 4 0.8 Non-poor 5,433 8 0.6 5 0.3 5,813 9 0.7 5 0.6
1 Other fathers include step, adoptive, and foster fathers.2 This category includes children with birth fathers only and with birth fathers and step, adoptive, or foster mothers.3 This category includes children with adoptive mothers or adoptive fathers and no birth parents.4 This category includes children with parents who had vocational–technical education after high school.
NOTE: s.e. is standard error.SOURCE: U.S. Department of Education, National Center for Education Statistics, National Household Education Survey, spring 1993 and 1995.

19
being developmentally delayed1 were held out, compared to 8 percent of those who had never
received such a diagnosis. On the other hand, children who had been born at low birth weights
were no more likely to have had delayed entry than those born at normal birth weights. This was
the case in both 1993 and 1995.
For the other child and family characteristics, there were few significant differences in the
percentages of children who experienced delayed kindergarten entry, and any observed differences
were inconsistent across the survey years. For instance, unlike some earlier studies (e.g.,
McArthur and Bianchi 1993, based on the 1991 NHES data), a significant association between
delayed kindergarten entry and parents' education level or household poverty status was not found
in either 1993 or 1995. Also, differences by race-ethnicity were inconsistent. In 1995, white,
non-Hispanic children were twice as likely as black, non-Hispanic children to have entered
kindergarten late—10 percent versus 5 percent. In 1993, the percentage of white, non-Hispanic
children who were delayed from starting kindergarten (9 percent) was also larger than that for
black, non-Hispanic children (6 percent); however, the difference was not statistically significant.
The data from 1993 and 1995 also indicate few differences in delayed entry according to
the types of parents in the child's household. The 1993 data suggest that adoptive parents may be
more likely to wait until their children are older before entering them in kindergarten; 22 percent
of the adoptive children in the survey had delayed kindergarten entries. However, because of the
large variance surrounding this estimate, it is not different from the lower estimates observed for
children living with one or both of their birth parents.2 The 1995 data give no indication of an
adoptive parent effect on delayed kindergarten entry.
Child and family characteristics and kindergarten retention. Comparable to the
findings above for delayed kindergarten entry, the child's sex was found to be correlated with
kindergarten retention. Although the difference was not large, boys were retained in kindergarten
more often than girls (6 percent versus 4 percent in 1995 and 7 percent versus 5 percent in 1993).
Children who had a diagnosed delay in growth or development were also several times more
likely to be retained in kindergarten. This was true in both survey years. In 1995, for example, 16
percent of the developmentally delayed children were retained, as opposed to 4 percent of other 1 Developmental delay is a condition in which children have fallen behind in physical, cognitive, motor, or speech developmentas compared to what is typical for their age. The measure is based on a question to parents asking, “Has a doctor or otherhealth professional ever told you that (CHILD) was developmentally delayed?”
2 The number of children with adoptive parents was relatively small (the unweighted number in the sample was 63).

20
children. Another difference found in both surveys was that having been born at low birth weights
doubled the risk of kindergarten retention. For instance, in 1995, 8 percent of low-birth-weight
pupils had spent an extra year in kindergarten, whereas the same was true of 4 percent pupils who
had been born at normal birth weights.
With respect to the other child and family variables examined in table 1, the differences in
kindergarten retention rates that were found were few and inconsistent across survey years. For
instance, a few socioeconomic differences in rates of retention were found in the 1993 data, but
not the 1995 data. In 1993, children from households below the official poverty level were more
likely to have been retained; 8 percent versus 5 percent. Likewise, children whose parents had
only a high school degree were more likely to be retained than those whose parents had some
college training, but not more likely than those whose parents had bachelor’s degrees or higher
education levels.
A difference found in the 1995 data, but not the 1993 data, was that first– and second–
graders who had attended Head Start or another center-based preschool program were less likely
to have been retained in kindergarten than those who had not attended such programs. In 1995, 4
percent of the former group had been retained, versus 6 percent of the latter. However, in 1993,
the two groups had similar rates of retention.
Summary. This preliminary examination of the correlates of delayed kindergarten entry
and kindergarten retention indicates that the characteristics most consistently related to children's
progression into and out of kindergarten are the child's birth date, sex, and developmental status.
In contrast, race-ethnicity, family socioeconomic status, family structure, and preschool program
participation showed some association with delayed entry or retention, but not consistently.
Given these preliminary results, the analysis presented next uses logistic regression models
to examine the effects of these child– and family–related variables simultaneously. Conducting
such a multivariate analysis is important, since many of the child and family factors analyzed here
may be interrelated. In logistic regression models, the effect of any single child– or family–related
variable on the likelihood of having been delayed from starting kindergarten or having been
retained in kindergarten can be examined while at the same time controlling for children’s statuses
on all the other child and family variables in the model. The results of these analyses are discussed
next.

21
Factors associated with delay and retention: Multivariate analyses
Table 2 presents the results of logistic regression models relating the child and family
characteristics to delayed entry into kindergarten and to kindergarten retention among first– and
second–graders in 1993 and 1995. The results are presented in the form of adjusted odds ratios,
which were derived from the coefficients generated by the logistic regression models.3 Each odds
ratio presented may be interpreted as the effect of the corresponding characteristic on the
likelihood of experiencing delayed kindergarten entry or kindergarten retention, while taking into
consideration the other child and family characteristics included in the model.4 In general, the
results shown in this table parallel those found for the bivariate analyses discussed above.
Factors related to delayed entry into kindergarten. After controlling for the influence
of other variables, the following factors were associated with delayed entry in both 1993 and
1995: the child having a birthday late in the year, so that he or she would be relatively young if
school entry was on schedule; the sex of the child; and the child's race-ethnicity. The odds of
having been held out of kindergarten were from 2.4 to 2.8 times higher for children whose
birthdays were in the last quarter of the year (October to December) than for those whose
birthdays were in the first quarter (January to March). And the odds were from 1.8 to 2.3 times
higher for children with birthdays in the third quarter (July to September) than for those with
birthdays in the first quarter. The odds of having been delayed from entering kindergarten were
also 1.3 to 1.8 times higher for boys than for girls. The odds for black children experiencing
delayed entry were only about half as great as those for white children.
For the other variables examined in the models, there were only a few significant
relationships with delayed kindergarten entry. Again, the patterns of association were inconsistent
between 1993 and 1995. For example, in 1993 the odds of being held out of kindergarten were
2.3 times higher for children who were developmentally delayed than for other
3 See the section entitled “Conversion of Odds Ratios” at the end of this report if interested in obtaining the originalcoefficients generated by the logistic regression models. Also see Alba (1987) for more information about conversionsbetween logistic regression model coefficients and odds ratios.
4 For each variable, one category was necessarily omitted from the model so that the odds ratios represent “relative” effects,that is, the effect of each category relative to the omitted category. For example, the omitted category for the race-ethnicityvariable is white, non-Hispanic children. Thus, the odds ratio for black, non-Hispanic children represents how much lower(or higher) the likelihood of having been delayed from entering kindergarten (or of having been retained in kindergarten) isfor black, non-Hispanic children than for white, non-Hispanic children. Similarly, the odds ratio for Hispanic children isinterpreted as the relative likelihood of delayed kindergarten entry or kindergarten retention for Hispanic children ascompared to white, non-Hispanic children.

22
Table 2.— Adjusted odds ratios of delayed entry into kindergarten and kindergarten retention for first– and second–graders, by child and family characteristics: 1993 and 1995
1993 1995Independent Variables Delayed entry into
kindergartenRepeated
kindergartenDelayed entry into
kindergartenRepeated
kindergarten
Child's sex Male v. Female 1.34 * 1.42 * 1.77 ** 1.65 *
Time of year child born 2nd quarter (Apr-Jun) v. 1st quarter (Jan-March) 0.71 1.62 † 1.08 1.11 3rd quarter (Jul-Sep) v. 1st quarter (Jan-March) 1.84 ** 1.42 2.25 ** 1.19 4th quarter (Oct-Dec) v. 1st quarter (Jan-March) 2.41 ** 1.28 2.80 ** 1.40
Child's race–ethnicity Black, non-Hispanic v. White, non-Hispanic 0.63 * 1.32 0.61 * 2.25 ** Hispanic v. White, non-Hispanic 1.36 0.65 1.02 1.08 Other races v. White, non-Hispanic 0.52 1.32 0.88 1.15
Doctor has said child developmentally delayed Yes v. No 2.32 ** 3.35 ** 1.31 4.81 **
Child less than 5 1/2 lbs at birth Yes v. No 0.93 1.48 † 0.71 1.43
Child attended center-based program before entering school Yes v. No 0.97 0.94 1.19 0.54 **
Parents in household Birth mother & other father1 v. Birth mother & birth father 0.91 1.31 0.49 † 1.34 Birth mother only v. Birth mother & birth father 0.93 0.88 0.80 1.14 Birth father2 v. Birth mother & birth father 0.77 1.20 0.33 * 1.80 Adoptive parent3 v. Birth mother & birth father 2.89 ** 2.72 * 0.91 0.66 Other parents v. Birth mother & birth father 0.92 1.95 0.57 2.08
Parents' highest education Less than high school v. High school diploma/equivalent 1.01 1.13 1.23 0.97 Some college4 v. High school diploma/equivalent 1.09 0.64 * 1.17 1.13 Bachelor's degree or higher v. High school diploma/equivalent 1.39 * 0.76 0.87 1.21
Parent(s) speak(s) non-English language most at home Yes v. No 0.68 † 1.32 0.89 1.99 †
Household in poverty Yes v. No 1.34 1.57 * 0.81 0.45 **
1 Other fathers include step, adoptive, and foster fathers.2 This category includes children with birth fathers only and with birth fathers and step, adoptive, or foster mothers.3 This category includes children with adoptive mothers or adoptive fathers and no birth parents.4 This category includes children with parents who had vocational–technical education after high school.
** p<.01* p<.05† p<.10
NOTE: Odds ratios after controlling for other variables in the table. Tables showing the logistic regression model coefficients are found in appendix C.
SOURCE: U.S. Department of Education, National Center for Education Statistics, National Household Education Survey, spring 1993 and 1995.

23
children. In 1995, the effect of having developmental delays also suggested a higher likelihood of
delayed entry, but the effect was not statistically significant. Also, 1993 pupils whose parents had
college degrees were more likely to have experienced delayed entry into kindergarten than pupils
whose parents had less education. Compared to children whose parents had high school
educations, the odds of having been held out were about 1.4 times greater among children whose
parents were college educated. However, a similar relationship was not found in 1995. A few
specific family types also showed associations with delayed entry in 1993 and 1995, but the types
were different across these years.5
Factors related to kindergarten retention. After controlling for the influence of other
variables, only the factors of sex of child and developmental delay were consistently associated
with kindergarten retention in both survey years. The odds of boys being retained in kindergarten
were 1.4 to 1.7 times higher than those for girls. The odds for children who had a diagnosed
developmental delay being retained were 3.4 to 4.8 times higher than the odds for other children.
Low birth weight was also marginally significant in 1993, suggesting a higher risk of retention,
but the effect was considerably weaker than that for developmental delay. In 1995, the effect of
having a low birth weight also suggested a higher risk of retention, but was not statistically
significant. The timing of the child’s birthday was not related to retention in either survey year.
A few other differences were found, but not consistently across survey years. For
instance, in 1995, the odds of black, non-Hispanic children having been retained in kindergarten
were more than twice as great as those for white, non-Hispanic children. The pattern was similar
in 1993, although the difference was not statistically significant. Also, participation in Head Start
or other center-based preschool programs seemed to offer an advantage in 1995, but not in 1993.
The odds of repeating kindergarten for children who had taken part in such programs were only
about half as great as the odds for children who had not gone to preschool.
In 1993, the odds of repeating kindergarten were only about two-thirds as great for
children whose parents had some college as for those whose parents had a high school diploma
only. Also in 1993, children in poverty-level households were more likely to have repeated
kindergarten; the odds of their having repeated were about 1.6 times as great as the odds among
5As indicated earlier, the finding regarding adoptive parents in 1993 should be interpreted with caution due to the relativelysmall number of children with adoptive parents (the unweighted number in the sample was 63).

24
children in higher-income households. By contrast, in 1995, parent education was not associated
with kindergarten repetition, and poverty status was negatively related to retention.
In 1993, children who lived with adoptive parents also had a greater risk of having
repeated kindergarten. The odds of this having occurred were 2.7 times greater for adopted
children than for those living with both biological parents.6 A comparable difference was not
observed in 1995 and other family types did not significantly increase (or decrease) the risk of
kindergarten retention in either survey year.
Summary. The conclusions to be drawn from these models predicting delayed
kindergarten entry and kindergarten retention are generally consistent with those made from
previous research that did not have the benefit of using a large nationally representative sample of
children. However, some of the inferences to be made are stronger than others. After
simultaneously controlling for several child and family characteristics, the effects of the child's sex,
race-ethnicity, birth date, and pace of development were relatively strong and consistent. Figure 1
provides a graphical illustration of these relationships from another perspective. This figure
shows the prevalence of these characteristics among three groups of children in 1995: those who
were delayed from entering kindergarten, those who were retained in kindergarten, and the total
sample of first– and second–graders. This figure clearly shows that children who are male, who
have late birthdays, and who are white are overrepresented among children who experienced
delayed entry, as compared to the total sample of children. For example, among children who
were held out of kindergarten until they were older, almost two-thirds (64 percent) were male,
but in the total sample of children only half (51 percent) were male. Similarly, those who are
male, and who were reported to have been developmentally delayed, are overrepresented among
children who experienced kindergarten retention. For example, among children who had been
retained in kindergarten, 18 percent were developmentally delayed, compared to only 5 percent in
the total sample of children.
Weaker inferences can be drawn regarding the effects of family-related variables.
Relatively few significant differences were found regarding these variables and the individual
effects of these variables were not consistent across survey years.
6 Again, the difference should be interpreted with caution due to the relatively small number of children with adoptive parents(the unweighted number in the sample was 63).

25
Implications of delayed entry and kindergarten retention for children's school performance
We now examine how children who experienced delayed entry into kindergarten or who
were required to spend an extra year in kindergarten were performing and behaving once they got
to first and second grade. In the 1993 data, indicators were available concerning parents’ reports
of receiving negative teacher feedback about the child not learning up to his or her capabilities,
inattention and restlessness in class, disruptive behavior in the classroom, and difficulties adjusting
to the social requirements of school (taking turns and sharing with others). In the 1995 data,
indicators were available from parent reports about the child's ranking in the lower half of the
class, schoolwork problems, behavior problems, and being required to repeat first or second
grade. The data in table 3 show the bivariate relationships between children’s kindergarten entry
and retention experiences and these individual indicators of academic performance and adjustment
in the early elementary grades. Also shown are associations with summary indicators for each
survey year: the proportion of children in each group who received negative feedback on at least
one of the five learning or behavior items in 1993, and the proportion who experienced at least
one of the four performance or behavior problems asked about in 1995.

Figure 1.—First– and second–grade students who experienced delayed entry into kindergarten , or kindergarten retention, compared with all first– and second–graders,1995
26
Born in 3rd
Quarter
34%
Born in 2nd
Quarter
16%
Born in 1st
Quarter
14%Born in 4th
Quarter
36%
Born in 1st
Quarter
20%
Born in 2nd
Quarter
23%
Born in 3rd
Quarter
27%
Born in 4th
Quarter
30%
Born in 1st
Quarter
24%
Born in 2nd
Quarter
25%
Born in 3rd
Quarter
27%
Born in 4th
Quarter
24%
Delayed Entry
Male
64%
Female
36%
Repeated Kindergarten
Male
63%
Female
37%
Overall
Male
51%
Female
49%

Figure 1.—First– and second–grade students who experienced delayed entry into kindergarten , or kindergarten retention, compared with all first–
SOURCE: U.S. Department of Education, National Center for Education Statistics, National Household Education Survey, spring 1995.
Overall
Developmentally
Delayed
5 %
Not
Developmentally
Delayed
95%
Delayed Entry
Developmentally
Delayed
6 %
Not
Developmentally
Delayed
94%
Repeated Kindergarten
Not
Developmentally
Delayed
82%
Developmentally
Delayed
18%
Hispanic
13%
Other
5 %
White
66%
Black
16%
Hispanic
14%
Other
6 %
White
56%Black
24%
Hispanic
13%
Other
5 %
White
73%
Black
9 %
27

28
Table 3.— Percentage of first– and second–graders with school performance problems, by experience with delayedkindergarten entry and kindergarten retention: 1993 and 1995
Delayed entry into kindergarten Repeated kindergartenSchool performance problems Yes No Yes No
Percent s.e. Percent s.e. Percent s.e. Percent s.e.
1993
Since the beginning of this school year, a teacher has said orwritten that child...
Has not been learning up to capabilities 17 1.9 24 0.9 34 4.2 23 0.8 Doesn't concentrate or pay attention for long 25 2.3 30 0.9 40 4.1 29 0.9 Has been acting up or disrupting class 21 2.4 21 1.0 29 3.7 20 1.0 Has been very restless, fidgets 17 2.2 19 0.8 27 3.5 18 0.7 Has been having trouble taking turns or sharing with others 10 1.7 9 0.5 18 3.2 9 0.5
Child received negative feedback on at least one item above 42 2.8 49 0.9 65 3.8 48 0.8
1995
Compared to others in class, child's schoolwork is aroundthe middle or below 34 3.1 33 0.9 45 4.5 32 0.9
Teacher/school said child having behavior problems 18 2.9 19 0.8 26 4.0 19 0.8
Teacher/school said child having schoolwork problems 21 2.8 21 1.0 29 3.5 20 1.0
Repeated 1st or 2nd grade 2 0.8 4 0.4 5 1.5 4 0.4
Any of 4 problems above 45 3.6 47 1.1 60 4.6 47 1.0
NOTE: s.e. is standard error.SOURCE: U.S. Department of Education, National Center for Education Statistics, National Household Education Survey, spring 1993 and 1995.

29
Delayed entry, kindergarten retention, and school performance: Group differences
Children whose parents held them out of kindergarten for a year were found to be
performing as well as or better than first– and second–graders who entered kindergarten at the
prescribed age. By contrast, children who were required to repeat kindergarten were doing
worse than other first– and second–graders on nearly all the school performance indicators.
Delayed versus on-time kindergarten entry. In 1993, children who were delayed from
entering kindergarten tended to receive less negative feedback from teachers. Among children
who entered kindergarten at the prescribed time, 24 percent were reported to be not learning up
to their capabilities. By comparison, only 17 percent of children who were held out of
kindergarten until they were older were so described. Among children who entered kindergarten
as soon as they were age-eligible, 30 percent were said to have problems concentrating in class;
such problems were reported for a smaller proportion�25 percent–of children who had entered
kindergarten later. On the other hand, the timing of kindergarten entry did not have a significant
relationship to teacher reports of children acting up in class, being restless or fidgeting, or having
trouble taking turns. On the summary indicator for 1993, nearly half of the pupils who entered
when age-eligible–49 percent–were reported to have received one or more of the five types of
negative teacher feedback. Fewer of the delayed entry pupils–42 percent–received at least one
type of negative feedback.
In 1995, children whose entry into kindergarten had been delayed were only half as likely
as those entering when age-eligible to have repeated first or second grade—2 percent versus 4
percent. On the other indicators, and on the summary measure, those who were held out of
kindergarten performed as well as those who started kindergarten when eligible.
Retained versus non-retained pupils. Children who had been required to spend two
years in kindergarten performed significantly worse than their first– and second–grade classmates
on all five of the 1993 indicators, and on two of the four 1995 indicators. In 1993, two-thirds of
the children who were retained in kindergarten elicited some negative feedback from teachers,
compared to half of children who had not been retained. Forty percent of the retained pupils were
said to have problems concentrating, more than a third, to be not learning up to their capabilities,
and 29 percent, to be acting up or disrupting the class. All of these proportions were 40 to 50
percent higher than those for children who had not been retained in kindergarten. While less than
a fifth of the retained pupils were said to have trouble taking turns or sharing with others, this
proportion was twice as high as that for non-retained pupils.

30
In 1995, 60 percent of children who were retained in kindergarten were reported to have
at least one school performance problem, whereas 47 percent of children not retained in
kindergarten had at least one problem. More of the retained pupils had schoolwork that ranked in
the lower half of the class. Nearly 30 percent had their parents contacted by the teacher or school
in the last year because of a schoolwork problem, and this percentage was about 40 percent
higher than that for non-retained pupils. A quarter of children who had been retained had their
parents contacted because of a behavior problem; however, this proportion is not significantly
different from that among those not retained. One other positive note was that the proportion
who had to repeat first or second grade was comparable among kindergarten retainees and other
children.
Summary. The question that remains is the extent to which the observed associations
between delayed entry into kindergarten and performance in first and second grades, as well as
those between kindergarten retention and elementary school performance, are attributable to the
demographic and socioeconomic factors with which delayed entry and retention are correlated.
This question can be addressed by using multiple logistic regression analyses. Using such analyses
enables one to examine the effects of delayed kindergarten entry and kindergarten retention on
early elementary school performance, while at the same time controlling for the child– and family–
related factors that have already been found to be associated with children's experiences with
kindergarten entry and retention. The next section discusses the results of such analyses.
Delayed entry, kindergarten retention, and school performance: Multivariate analyses
Table 4 shows the results of logistic regression models estimating the effects of delayed
kindergarten entry and kindergarten retention on the likelihood of receiving negative teacher
feedback among children in 1993 and on the likelihood of experiencing at least one school
performance problem among children in 1995. For both the 1993 and 1995 outcome measures,
separate regression models were used to examine the effect of delayed entry into kindergarten and
the effect of kindergarten retention. For all models, the same child- and family-related
characteristics that have been used in the previous analyses are included as control variables. By
controlling for these variables, the child and family factors that have been found to be related to
the likelihood of delayed kindergarten entry or kindergarten retention are being held constant.
Because these child and family variables could also be correlated with the school performance

31
Table 4.—Adjusted odds ratios of school performance problems for first– and second–graders, by delayed entry intokindergarten, kindergarten retention, and child and family characteristics: 1993 and 1995
1993 1995Independent Variables Received negative feedback
from teacher1Experienced at least one school
performance problem2
Delayed K entry Repeated K Delayed K entry Repeated K
Delayed kindergarten entry 0.69 ** -- 0.85 -- Yes v. No
Repeated kindergarten -- 1.63 * -- 1.31 Yes v. No
Child's sex 2.34 ** 2.29 ** 1.90 ** 1.88 ** Male v. Female
Time of year child born 2nd quarter (Apr-Jun) v. 1st quarter (Jan-March) 1.21 † 1.21 † 1.01 1.01 3rd quarter (Jul-Sep) v. 1st quarter (Jan-March) 1.30 * 1.27 * 1.23 1.22 4th quarter (Oct-Dec) v. 1st quarter (Jan-March) 1.11 1.07 1.05 1.04
Child's race–ethnicity Black, non-Hispanic v. White, non-Hispanic 1.65 ** 1.65 ** 1.68 ** 1.68 ** Hispanic v. White, non-Hispanic 1.19 1.20 1.17 1.17 Other races v. White, non-Hispanic 1.13 1.14 0.79 0.79
Doctor has said child developmentally delayed Yes v. No 2.18 ** 2.01 * 4.71 ** 4.53 **
Child less than 5 1/2 lbs at birth Yes v. No 1.23 1.22 1.20 1.20
Child attended center-based program before entering school Yes v. No 1.38 ** 1.38 ** 1.01 1.02
Parents in household Birth mother & other father3 v. Birth mother & birth father 1.58 ** 1.58 ** 1.40 † 1.42 † Birth mother only v. Birth mother & birth father 1.80 ** 1.82 ** 1.30 * 1.30 * Birth father4 v. Birth mother & birth father 2.61 ** 2.61 ** 1.39 1.39 Adoptive parent5 v. Birth mother & birth father 2.69 ** 2.51 ** 1.88 † 1.90 † Other parents v. Birth mother & birth father 3.06 ** 2.97 ** 2.64 ** 2.64 **
Parents' highest education Less than high school v. High school diploma/equivalent 0.99 0.99 1.31 1.30 Some college6 v. High school diploma/equivalent 0.83 * 0.84 † 0.87 0.87 Bachelor's degree or higher v. High school diploma/equivalent 0.66 ** 0.65 ** 0.49 ** 0.49 **
Parent(s) speak(s) non-English language most at home Yes v. No 1.06 1.06 1.11 1.09
Household in poverty Yes v. No 1.12 1.09 1.28 † 1.30 †
1 This is a composite measure indicating whether the child has elicited feedback on at least one of the following negative aspects of school performance—not learning up tocapabilities, doesn’t concentrate, acts up or disrupts class, restless and fidgets, has trouble taking turns or sharing.
2 This is a composite measure indicating whether the child has had one of the following school performance problems—child’s schoolwork ranked among the middle orbelow classmates, teacher has reported behavior problems, teacher has reported schoolwork problems, child has repeated first or second grade.
3 Other fathers include step, adoptive, and foster fathers.4 This category includes children with birth fathers only and with birth fathers and step, adoptive, or foster mothers.5 This category includes children with adoptive mothers or adoptive fathers and no birth parents.6 This category includes children with parents who had vocational–technical education after high school.
** p<.01; * p<.05; † p<.10; -- not applicable
NOTE: Odds ratios after controlling for other variables in the table. Tables showing the logistic regression model coefficients are found in appendix C.
SOURCE: U.S. Department of Education, National Center for Education Statistics, National Household Education Survey, spring 1993 and 1995.

32
measures, controlling for them allows for a better examination of whether the experiences of
delayed entry or retention have any association with children’s later school performance, above
and beyond any effects that child and family factors may have on school performance. As before,
the results are presented in the form of adjusted odds ratios.
Delayed kindergarten entry and later school performance. The results from 1993
indicate that having been delayed from entering kindergarten has significant effects on the
likelihood of receiving negative feedback from teachers, even after controlling for the child’s age,
the child's sex, the child's race-ethnicity, the presence of a developmental delay, the child's birth
weight, the parents' education level, household poverty status, the number and type of parents
with whom the child was living, the language spoken in the home, and whether the child attended
a center-based preschool program. In 1993, first– and second–graders who had been held out of
kindergarten until they were older were significantly less likely than other children to elicit
negative feedback from teachers. The odds of getting negative feedback were about two-thirds
(0.69 times) as high among children who were held out of kindergarten as those among children
who had not been.
In contrast, the logistic regression analyses with the 1995 data indicated that delayed entry
into kindergarten was not significantly related to school performance problems in the first and
second grades. Although the direction of the delayed entry effect was negative, suggesting that
delayed entry was reducing the likelihood of achievement problems, the effect was not statistically
significant.
Kindergarten retention and later school performance. In 1993, kindergarten retention
also showed a significant relationship with teacher feedback. Children who had repeated
kindergarten were significantly more likely than children who had not repeated to receive negative
feedback from teachers. First– and second–graders who were retained in kindergarten were 1.63
times more likely to get negative feedback from teachers. In contrast, the effect of kindergarten
repetition was not significant in the 1995 model. Again, the direction of the effect was consistent
with the 1993 analysis—having repeated kindergarten seemed to be associated with an increased
risk of achievement problems in first– and second–grade. But the magnitude of the effect was not
substantial enough to be statistically significant.
Summary. In 1993, while both the children who were delayed from starting kindergarten
and the children who repeated kindergarten were older than their classmates when entering first
grade, the former group of children appear to have been faring better as far as school performance

33
and adjustment were concerned. The children who were older when entering kindergarten were
not only doing as well as their younger first– and second–grade classmates, they were doing
better, as measured by a scale of negative teacher feedback. In contrast, those who repeated
kindergarten were still not doing as well as many of their classmates in the first– and second–
grades.
As for children in 1995, we can only infer that those who had experienced delayed entry
were doing no worse (but also no better) than their first– and second–grade classmates on the set
of school performance indicators examined. This result, though different from the 1993 findings,
is not surprising. As noted above, the bivariate comparisons on most of these indicators also
showed no difference between those delayed from entering kindergarten and other pupils.
As far as kindergarten retention, the 1995 children who had spent two years in
kindergarten appeared to be doing no worse (but also no better) than other first– and second–
graders, once the demographic, developmental, and socioeconomic characteristics of the
respective groups were taken into account. The bivariate comparisons did show the kindergarten
repeaters to be doing worse than their classmates as far as their performance on schoolwork, but
the multivariate results suggest that the inferior performance is attributable to other characteristics
of the children who have repeated, rather than to the fact of having repeated as such. Among
these characteristics are a higher incidence of developmental delay, and an overrepresentation of
black children in the repeater group. Both of these characteristics were significantly related to
achievement problems in the 1995 logistic regression analysis.
Effects of delayed kindergarten entry and kindergarten retention among children at-risk
Apart from the overall association (or lack of association) of delayed entry and
kindergarten retention with later school performance, there is the issue of whether these practices
have different effects with children who are especially at risk of experiencing difficulties in
elementary school. It may be that the children who are most at risk of having problems in school
have the most to gain by being a year older when starting kindergarten or by attending
kindergarten for an additional year. To explore this possibility, two groups of "at-risk" children
were defined with the survey data. One of the risk groups consisted of boys with late birthdays
(i.e., who were born between July and December). The other group was comprised of children
who have been diagnosed as developmentally delayed. As shown in the previous analyses, these
two groups were found to be more likely to have been held out of kindergarten and to have been
retained in kindergarten. They were also more likely than other children to exhibit school

34
performance problems in the early elementary grades. Thus, an additional logistic regression
analysis was conducted to examine whether there were any effects of delayed kindergarten entry
or kindergarten retention on first– and second–grade performance that were particular to these
two specific groups of children. Details on the procedures used in this analyses and the resulting
adjusted odds ratios are provided in appendix B, while the general results are described below.
Implications of delayed entry for at-risk children.. The 1993 results suggested that
having been held out of kindergarten had no particular greater (or lesser) effect on the likelihood
of receiving negative feedback for the at-risk children than for other children. This suggests that
relatively young boys and children with histories of developmental delay do not benefit any more
from entering kindergarten at an older age than do other children, at least as far as teacher
perceptions of their learning and behavior (as reported by parents) are concerned.
The 1995 results were similar; however, there was some indication that for males with late
birth dates, entering kindergarten at an older age may be beneficial. More specifically, among
young boys, the effect of having been held out of kindergarten largely offset the increased risk of
poor performance associated with being a male with a late birth date. However, the delayed entry
effect for young males was not statistically significant. Thus, we cannot conclude from the 1995
data that delayed entry is particularly helpful, as far as school performance is concerned, for
relatively young boys or for children who have had developmental problems.
Implications of kindergarten retention for at-risk children. In 1993 and 1995, the
results also suggested that kindergarten retention did not have a different effect on first– and
second–grade performance for the at-risk groups as compared to other children. Thus, it can be
said that there was no reliable evidence that having repeated kindergarten had especially beneficial
or detrimental implications for the first– and second–grade school performance of young males or
children with histories of developmental problems.

35
Summary and Discussion
There has been a good deal of debate among early childhood educators about the wisdom
of delaying the entrance of their children into kindergarten, and about the appropriateness of
having children who experience difficulties in kindergarten repeat the grade or attend a
transitional class before first grade. Although there have been a number of smaller-scale studies
relevant to these issues, estimates have been lacking based on large-scale, nationally
representative samples on the overall prevalence of these practices, the characteristics of young
people who experience delayed entry into kindergarten or kindergarten retention, and the
implications of these practices for school performance and adjustment in the early elementary
grades. This report provides such estimates.
The report is based on national probability samples of first– and second–graders whose
parents were interviewed concerning their children's preschool and kindergarten enrollment,
progress through the grades, and performance and adjustment during the current school year.
The data were collected in January through April 1995 and during the same months of 1993, as
part of the National Household Education Survey. Parents of 3,071 such pupils were surveyed in
1995 and 4,260 in 1993.
By using data provided by parents, this report provides a unique contribution to the
research on the effects of delayed kindergarten entry and kindergarten retention on students’
academic performance. Most of the extant research on these issues has used performance
measures derived from students’ standardized test results or from teachers’ evaluations. Since
performance outcomes from a variety of perspectives are valuable, whenever possible, it may be
useful if future studies on these issues conduct a broader examination of effects on student
performance by using data provided by multiple sources, including teachers, students, and parents.
It would also be valuable for future research to have longitudinal data available on these
issues. Having such data that reflect children’s experiences and abilities through the early
elementary grades would allow for stronger inferences to be made about any beneficial or harmful
effects that delayed kindergarten entry or kindergarten retention may have on student
performance. Data from a forthcoming NCES study, the Early Childhood Longitudinal Study
(ECLS), will provide the opportunity for such analyses with a nationally representative sample of
children.

36
Below, the results of this study are summarized and their implications for both proponents
and opponents of delayed kindergarten entry and kindergarten retention are discussed.
Overall prevalence of delayed entry and kindergarten repetition
The study found that in 1995 nearly one child in ten (9 percent) had experienced a delayed
entry into kindergarten, and one in twenty (5 percent) had had to repeat kindergarten or attend a
transitional class before first grade. These proportions projected to nearly 689,000 first– and
second–graders nationwide who had experienced delayed entry, and almost 383,000 who had
repeated kindergarten. The proportions found in the 1993 survey were very similar to those in
1995.
Characteristics of children who start kindergarten late
Characteristics that were overrepresented among children who had experienced delayed
entry into kindergarten were being male, having a late birthday (in the latter half of the year), and
being non-black. For example, in 1995, 64 percent of delayed enterers were boys, and 70 percent
had birthdays in the second half of the year, and 73 percent were non-Hispanic whites. Only 9
percent were African-American, whereas 16 percent of all first– and second–graders were black.
Unlike previous research, the 1995 survey did not find children of college-educated
parents to be especially plentiful among delayed enterers. There was, however, a relatively weak
but significant association between having college-educated parents and delayed kindergarten
entry in 1993. There was a tendency for children who had had a diagnosed delay in their growth
or development to start kindergarten later, but this association was only found in 1993. There
was no association between the child being born at a low birth weight and delayed entry in either
survey year.
Characteristics of children who repeat kindergarten
Characteristics that were consistently overrepresented among children who had been
required to repeat kindergarten were being male and having had a delay in growth or
development. For instance, in 1995, 63 percent of kindergarten repeaters were boys and
compared to 51 percent of the general population of first– and second–graders. Also, 18 percent
of the repeaters had had developmental delays, compared with 5 percent of all first– and second–
graders.

37
Survey results were inconsistent with respect to the other child characteristics and
socioeconomic characteristics of the families from which kindergarten repeaters came. For
example, the 1993 survey found that repeaters were less likely to come from families in which
parents had some college education than from families in which parents had only a high school
education or less, and were more likely to come from families with poverty-level incomes than
from higher-income families. The 1995 survey did not find a significant association between
parent education level and kindergarten repetition, and found that children from poverty-level
families were significantly less likely to have repeated kindergarten, when other, related factors
were taken into account.
Overall patterns of association
Despite the inconsistencies from survey to survey, the overall pattern of results gives some
indication that children whose parents delay their entry into kindergarten are a relatively
advantaged group in ethnic, developmental, and socioeconomic terms, whereas children who are
required to repeat kindergarten are comparatively disadvantaged. At the same time, it is clear that
the socioeconomic differences are not as pronounced as has been sometimes suggested in earlier
research and commentary on these issues. Both groups contain children drawn from nearly all
segments of U.S. society.
It is not clear whether the disparities between the survey findings are simply a product of
sampling fluctuation, measurement error, or reflect actual changes in the practices of schools with
respect to the kinds of pupils who are being delayed from entering kindergarten or retained in
kindergarten.1 For example, it is possible that school policy changes restricting the use of
retention among relatively disadvantaged children may have been a factor in the modest
socioeconomic differences found between retained children and other children. Another factor
that this report was not able to examine was whether state regulations regarding kindergarten
entry age play any part in the relationships observed between the chances of being held out of
1 There is evidence from the methodological research done for the NHES that the bias due to nonresponse might be somewhatmore problematic for the 1995 than the 1993 estimates. The response rates were higher for the 1993 survey and analysissuggested that the bias in the estimates for low income populations might have been affected by this more in the 1995estimates. While the sampling weights used in analyses for both samples underwent statistical adjustments for suchnonresponse and undercoverage, the adjustments made in 1995 were necessarily more extensive and may have played somerole in attenuating relationships between socioeconomic variables and delayed kindergarten entry or retention. This could bethe case even though overall estimates of delayed entry and retention were consistent across survey years.

38
kindergarten and certain child characteristics, especially children’s age. These are issues that may
be worth examination in future research.
Implications of delayed kindergarten entry for student performance in elementary school
Children whose parents had held them out of kindergarten for a year were found to be
doing at least as well in first and second grade as their younger classmates who had entered
school at the prescribed age. On several of the school performance and adjustment measures
available in the surveys, they were doing better. Specifically, parents reported that fewer of the
delayed enterers were described by teachers as not learning up to their capabilities or as having
problems paying attention in class. They were also only half as likely to have had to repeat first or
second grade.
Given that most parents who delay their children's kindergarten entry do so because of the
child's perceived lack of maturity at the time (McArthur and Bianchi 1993), the survey results
suggest that their strategy for bolstering the child's school performance usually has the desired
result. During the “held out” year, children will tend to show some improvements in their abilities
and development, simply because they will be getting older. However, it is also important to note
that children’s educational experiences during this extra year will likely not be of equal quality.
During the extra year, some parents are able to provide their children with stimulating educational
environments at home or to send their children to center-based preschool programs to improve
their skills before school entry. But other, less advantaged children who are held out, possibly
because of failing school readiness testing, may not have as many opportunities to benefit from
preschool program participation or home teaching by parents.
At the least, our findings suggest that the extra year before starting kindergarten is not
harmful to the children who are held out. Parents reported that children who are older when they
start school seem to perform better than younger students. The multivariate analysis of the 1995
data suggest more modest effects for delayed school entry, but even these findings indicate that
the delayed children were doing just as well as their classmates. Nowhere in the survey results is
there an indication that the delayed students were doing less well.
While the results suggest that the short run effects of delayed kindergarten entry are
potentially beneficial or at least benign for the school performance of the children who enter
kindergarten at older ages, the findings also lend support to critics of the practice. These critics
contend that delayed entry may put other children who enter school when age-eligible at a

39
disadvantage, because teachers may expect them to do as well in class as the delayed children who
are a full year or more older. Although it was not possible to directly study that issue in this
report, the teacher feedback data from the 1993 survey suggest that such unfair comparisons may
indeed be taking place in many first– and second–grade classrooms.
Implications of kindergarten retention for student performance in elementary school
The picture was very different for children who had been required to stay in kindergarten
for a second year. These children were reported by their parents to be doing worse than their
younger classmates on most of the school performance indicators that were available in the two
surveys. In 1993, two-thirds of the retained pupils elicited some negative feedback from teachers,
whereas the same was true of less than half of the non-retained pupils. The proportions of
retained pupils who were described as having problems concentrating, as not learning up to their
capabilities, or as acting up and disrupting the class were 40 to 50 percent higher than the
comparable proportions for non-retained pupils. Twice as many of the retained pupils were said
to have trouble taking turns and sharing with others.
In 1995, 60 percent of children who were retained in kindergarten were reported to have
at least one significant school performance problem, whereas the same was true of 47 percent of
children not retained in kindergarten. When the comparisons between retained and non-retained
students were controlled by multiple logistic regression for the differing characteristics of the two
groups, the two surveys produced somewhat disparate results. In the 1993 analysis, children who
had been retained in kindergarten still received more negative feedback from teachers than their
classmates, even when other characteristics of the retained and non-retained pupils were taken
into account. In the 1995 models, retained children did not have significantly more school
performance problems than their classmates, once their demographic, developmental, and
socioeconomic characteristics were controlled.
Despite these somewhat disparate results, the best that can be said about the school
performance of retained pupils is that they are doing less well than most other first– and second–
graders, but no worse than would be expected, given their other developmental and background
characteristics. There is no indication in the findings of either survey that requiring the children to
repeat kindergarten or attend a transitional class has had a beneficial effect on their school
performance. Indeed, one might argue from the 1993 findings that repeating kindergarten may
have made matters worse. However, another interpretation of the 1993 results is that, in
requiring some pupils to repeat kindergarten, the schools have merely identified pupils who are

40
slated to have further achievement and adjustment problems. According to this argument, the fact
of kindergarten repetition does not create the later problems, it is only an indicator of other,
underlying disorders in the child's constitution or home environment.
It is also important to reiterate that this study was not able to compare children who had
repeated kindergarten with a control group of children who had been recommended for retention
but were promoted anyway. As mentioned in the literature review, prior studies that have done
this have not found much evidence of either a beneficial or a detrimental effect of kindergarten
retention.
Why is the school performance of children whose entry into kindergarten was delayed and
of children who were retained in kindergarten so different?
One might ask why there is such an apparent difference between the school performance
of children whose entry into kindergarten was delayed and that of children who were required to
repeat kindergarten. After all, both groups are older and presumably more mature than most of
their classmates. Why does the older age and greater maturity seem to have a beneficial effect for
delayed enterers, but not for retained pupils? There are several possible answers to this question,
and further research is obviously needed to determine which is correct.
One potential explanation of the disparate outcomes is that the underlying developmental
problems of the two groups may be different. Diagnosed developmental delay was a relatively
strong and consistent predictor of having been retained in kindergarten, so it may be that
kindergarten retainees are more likely to have had more serious and long-lasting birth
complications or developmental delays. Another explanation would point to possible differences
in social circumstances of the two groups. However, in the 1993 and 1995 NHES data, these
differences were not found to be as great as is sometimes claimed. Another factor may be that the
choice to delay the school entry of children may testify to a level of parent involvement in the
educational process that may be propitious for the child's later achievement.
Still another explanation for the difference in outcomes grows out of the dissimilarity in
how and where retention occurs. In order to have a beneficial effect, it may be necessary to
intervene before children begin formal schooling and start to have negative classroom experiences.
Similarly, others would point to the possible stigmatizing effect of being required to repeat a
grade, even in the kindergarten year. Active parent support for the intervention may also be a
critical ingredient.

41
More than one of the above explanations may be valid, at least in part. It is important for
education researchers to carry out additional studies of delayed entry and retention that will
provide a better understanding of the processes by which these disparate student performance
levels evolve. Such understanding may help educators to come up with more effective early
interventions that help to make elementary school a "success experience" for all pupils.
43
Survey Methodology and Data Reliability
The National Household Education Survey (NHES) is a telephone survey conducted by
Westat for the U.S. Department of Education's National Center for Education Statistics (NCES).
Data collections have taken place in 1991, 1993, 1995, and 1996 during the months of January
through April of each year. When appropriately weighted, each sample is nationally
representative of all civilian, noninstitutionalized persons in the 50 States and the District of
Columbia. The samples were selected using random digit dialing (RDD) methods, and the data
were collected using computer-assisted telephone interviewing (CATI) technology.
Data from two separate components of the NHES were used in this report—the 1993
School Readiness (SR) component and the 1995 Early Childhood Program Participation (ECPP)
component. The ages of children sampled for these two components are somewhat different.
Children aged 3 to 7 years old and children 8 or 9 years old and enrolled in second grade or below
were sampled for the SR component of the NHES:93. The ECPP component of the NHES:95
sampled 0- to 10-year-olds in third grade or below. In all, there were 10,888 NHES:93 SR
interviews completed and 14,064 NHES:95 ECPP interviews completed. This report is based on
subsets of the total sample included in each component, specifically first– and second–graders.
The unweighted number of first– and second–graders included in the analyses is 4,260 from the
NHES:93 and 3,071 from the NHES:95.
For each of these NHES components, two survey instruments were used to collect the
data. The first instrument, a Screener administered to an adult member of the household, was
used to determine whether any children of the appropriate ages lived in the household, to collect
information on each household member, and to identify the appropriate parent/guardian to
respond for the sampled child. If one or two eligible children resided in the household, interviews
were conducted about each child. If more then two eligible children resided in the household, two
were sampled as interview subjects. Each SR and ECPP interview was conducted with the
parent/guardian most knowledgeable about the care and education of each sampled child, usually
the child's mother.
Response Rates
Screening interviews were completed with 63,844 households in 1993 and with 45,465
households in 1995. The response rate for the Screener varied somewhat between these two
44
survey years: 82 percent in 1993 and 73 percent in 1995. However, the completion rate, or the
percentage of eligible sampled children for whom interviews were completed, was 90 percent in
1993 and in 1995. The overall response rate (the product of the Screener response rate and
interview completion rate) was 74 percent for the 1993 SR component and 66 percent for the
1995 ECPP component.
For both the SR and ECPP components, item nonresponse (the failure to complete some
items in an otherwise completed interview) was very low. The item nonresponse rates for most
variables in this report were less than two percent. Exceptions to this include nonresponse rates
for NHES:93 items measuring parents' language (4 to 5 percent), receipt of a high school diploma
among fathers (4 percent), and household income (7 percent); and for the NHES:95 item
measuring household income (14 percent). All items from the NHES:95 ECPP and NHES:93 SR
components with missing responses (i.e., don't know, refused, or not ascertained) were imputed
using an imputation method called a hot-deck procedure (Kalton and Kasprzyk 1986). As a
result, no missing values remain.1
Data Reliability
Estimates produced using data from the NHES are subject to two types of error, sampling
and nonsampling errors. Nonsampling errors are errors made in the collection and processing of
data. Sampling errors occur because the data are collected from a sample rather than a census of
the population.
Nonsampling Errors
Nonsampling error is the term used to describe variations in the estimates that may be
caused by population coverage limitations and data collection, processing, and reporting
procedures. The sources of nonsampling errors are typically problems like unit and item
nonresponse, the differences in respondents' interpretations of the meaning of the questions,
response differences related to the particular time the survey was conducted, and mistakes in data
preparation.
1 For more information on the imputation procedures used in the NHES:93 and NHES:95, see the following NCES WorkingPapers: Unit Response, Weighting, Item Response and Imputation in the 1993 National Household Education Survey (Bricket al. forthcoming) and Unit and Item Response Rates, Weighting, and Imputation Procedures in the 1995 NationalHousehold Education Survey (Brick and Broene forthcoming).
45
In general, it is difficult to identify and estimate either the amount of nonsampling error or
the bias caused by this error. For each NHES survey, efforts were made to prevent such errors
from occurring and to compensate for them where possible. For instance, during the survey
design phase, focus groups and cognitive laboratory interviews were conducted for the purpose of
assessing respondent knowledge of the topics, comprehension of questions and terms, and the
sensitivity of items. The design phase for each study also entailed several hundred staff hours of
CATI instrument testing and pretesting in which several hundred interviews were conducted.
An important nonsampling error for a telephone survey is the failure to include persons
who do not live in households with telephones. About 90 percent of all children in the eligible age
ranges for the NHES surveys live in households with telephones. Estimation procedures were
used to help reduce the bias in the estimates associated with children who do not live in telephone
households.2
Sampling Errors and Weighting
The sample of telephone households selected for each NHES survey is just one of many
possible samples that could have been selected. Therefore, estimates produced from each NHES
sample may differ from estimates that would have been produced from other samples. This type
of variability is called sampling error because it arises from using a sample of households with
telephones, rather than all households with telephones.
The standard error is a measure of the variability due to sampling when estimating a
statistic. Standard errors for estimates presented in this report were computed using a jackknife
replication method. Standard errors can be used as a measure of the precision expected from a
particular sample. The probability that a complete census count would differ from the sample
estimate by less than 1 standard error is about 68 percent. The chance that the difference would
be less than 1.65 standard errors is about 90 percent, and that the difference would be less than
1.96 standard errors, about 95 percent.
Standard errors for all of the estimates are presented in the tables. These standard errors
can be used to produce confidence intervals. For example, an estimated 10 percent of first– and
2 For additional information on telephone coverage issues and estimation procedures to correct for coverage biases, see thefollowing NCES Working Papers: Telephone Coverage Bias and Recorded Interviews in the 1993 National HouseholdEducation Survey (Brick and Tubbs forthcoming) and Undercoverage Bias in Estimates of Characteristics of Adults and 0- to2-Year-Olds in the 1995 National Household Education Survey (Brick forthcoming).

46
second–grade boys in 1993 were delayed from entering kindergarten. This percentage has an
estimated standard error of 0.8 percent. Therefore, the estimated 95 percent confidence interval
for this statistic is approximately 8 (i.e., 10 - (1.96 x 0.8)) to 12 (i.e., 10 + (1.96 x 0.8)) percent.
All of the estimates in the report are based on weighting the observations using the
probabilities of selection for the sample and other adjustments to partially account for
nonresponse and coverage bias. These weights were developed to make the estimates unbiased
and consistent estimates of the national totals.
In addition to properly weighting the responses, special procedures for estimating the
statistical significance of the estimates were employed because the data were collected using a
complex sample design. Complex sample designs, like that used in the NHES, result in data that
violate some of the assumptions that are normally required to assess the statistical significance of
the results. Frequently, the sampling errors of the estimates from the survey are larger than would
be expected if the sample were a simple random sample and the observations were independent
and identically distributed random variables.
Replication methods of variance estimation were used to reflect the actual sample design
used in each NHES survey. A form of the jackknife replication method was used to compute
approximately unbiased estimates of the sampling errors of the estimates in the report. The
jackknife methods were used to estimate the precision of the estimates of the reported national
totals, percentages, and regression parameters. In addition, chi-squared tests of independence
were used to evaluate the statistical significance of the overall association between a child or
family characteristic (e.g., race-ethnicity) and having been delayed from entering kindergarten or
retained in kindergarten. These chi-squared tests of independence were adjusted for the complex
sample design using the procedures described by Rao and Thomas (1989). In essence, these
adjustments account for the lack of independent, identically distributed random variables that are
usually assumed when chi-squared tests of independence are computed. To test the differences
between two categories (e.g., white, non-Hispanic versus black, non-Hispanic), student's t statistic
was employed, using unbiased estimates of sampling errors derived by the replication methods
mentioned above.
As the number of comparisons at the same significance level increases, it becomes more
likely that at least one of the estimated differences will be significant merely by chance, that is, it
will be erroneously identified as different from zero. Even when there is no statistical difference
between the means or percentages being compared, there is a 5 percent chance of getting a

47
significant F or t value from sampling error alone. As the number of comparisons increases, the
chance of making this type of error also increases.
A Bonferroni adjustment procedure was used to correct significance tests for multiple
comparisons. This method adjusts the significance level for the total number of comparisons
made with a particular classification variable. All the differences cited in this report are significant
at the 0.05 level of significance after a Bonferroni adjustment. For example, the total number of
comparisons for the race-ethnicity variable is six (i.e., white, non-Hispanic v. black, non-Hispanic;
white non-Hispanic v. Hispanic; white, non-Hispanic v. other race; black, non-Hispanic v.
Hispanic; black, non-Hispanic v. other race; and Hispanic v. other race). Thus, the significance
criteria for each race-ethnicity comparison is adjusted to p=0.0083 (i.e., 0.05 / 6).
Poverty measure
The poverty measure presented in this report was developed by combining information
about household composition and household income. In the NHES:93, household income was
collected in increments of $5,000 instead of in exact amounts, and therefore the poverty measure
is an approximation. The household is considered poor in the 1993 analyses if
n the number of household members is 3 or less and household income is $10,000 orless;
n the number of household members is 4 or 5 and household income is $15,000 orless;
n the number of household members is 6 or 7 and household income is $20,000 orless;
n the number of household members is 8 and household income is $25,000 or less; and
n the number of household members is 9 or more and household income is $30,000 orless.
In the NHES:95, household income was also collected in increments of $5,000; however,
exact income to the nearest $1,000 was also collected if the household’s poverty status was
ambiguous based on the increment reported. In the 1995 analyses, a household is considered
poor if
n the number of household members is 2 and household income is less than $10,000;

48
n the number of household members is 3 and household income is less than $12,000;
n the number of household members is 4 and household income is $15,000 or less;
n the number of household members is 5 and household income is less than $18,000;
n the number of household members is 6 and household income is $20,000 or less;
n the number of household members is 7 and household income is less than $23,000;
n the number of household members is 8 and household income is $25,000 or less;and
n the number of household members is 9 or more and household income is $30,000 orless.
These poverty measures result in 26 percent of first– and second–graders being classified
as in poverty in the NHES:93 and 24 percent in the NHES:95. These percentages are similar to
the traditional measure of poverty status (Bureau of the Census 1996).
Conversion of Odds Ratios
The odds ratios presented in tables 2 and 4 in the report text, and tables B1 and B2 in
appendix B, were derived from the results of logistic regression models. Thus, if one is interested
in knowing the coefficients for each variable in these models, they can be derived from the odds
ratios that are presented in the tables. To do this, take the natural logarithm of the odds ratio:
ln (odds ratio).
For example, in table 2, the odds of male children having repeated kindergarten compared
to female children were 1.42 in 1993. The logistic regression model coefficient from which this
odds ratio was obtained was ln(1.42) = 0.35. For more information about conversions between
logistic regression model coefficients and odds ratios, see Alba (1987). Tables containing the
regression model coefficients are found in appendix C.

49
References
Alba, Richard D. (1987). “Interpreting the Parameters of Log-Linear Models.” SociologicalMethods and Research 16 (1): 45–77.
Alexander, K.L., Entwisle, D.R., & Dauber, S.L. (1994). On the success of failure: Areassessment of the effects of retention in the primary grades. Cambridge UniversityPress.
Bickel, D.D., Zigmond, N., & Strayhorn, J. (1991). “Chronological age and entrance to firstgrade: Effects on Elementary School Success. Early Childhood Research Quarterly 6(2): 105–117.
Bredekamp, S. & Shepard, L. (1989). “How best to protect children from inappropriate schoolexpectations, practices, and policies.” Young Children 44(3): 14–24.
Bureau of the Census. (1996). Income, Poverty, and Valuation of Noncash Benefits: 1994.Current Population Reports (P60–189). Washington, DC: Author.
Byrd, R.S. & Weitzman, M.L. (1994). “Predictors of early grade retention among children in thePediatrics 93(3): 481–487.
Byrnes, D.A. (1989). “Attitudes of Students, Parents, and Educators toward Repeating a Grade.”In L.A. Shepard & M.L. Smith (Eds.). Flunking Grades: Research and Policies onRetention. London: Falmer Press. 108–131.
Cameron, M.B. & Wilson, B.J. (1990). “The effects of chronological age, gender, and delay ofentry on academic achievement and retention: Implications for academic red-shirting.” Psychology in the Schools 27: 260–263.
Cardon, L.R., Fulker, D.W., & DeFries, J.C. (1992). “Continuity and change in general cognitiveability from 1 to 7 years of age.” Developmental Psychology 28(1): 64–73.
Charlesworth, R. (1989). “‘Behind’ before they start?: Deciding how to deal with the risk ofYoung Children 44(3): 5–13.
Collins, M.A. & Brick, J.M. (1993). “Parent reports on children’s academic progress and schooladjustment in the National Household Education Survey.” Alexandria, VA: AmericanStatistical Association, 1993 Proceedings of the Social Statistics Section.
Cosden, M., Zimmer, J., & Tuss, P. (1993). “The impact of age, sex, and ethnicity onkindergarten entry and retention decisions.” Educational Evaluation and Policy Analysis 15(2): 209–222.

50
Davis, B.G., Trimble, C.S., & Vincent, D.R. (1980). “Does age of entrance affect schoolElementary School Journal 80(3): 133–143.
Dennebaum, J.M. & Kulberg, J.M. (1994). “Kindergarten retention and transition classrooms:Their relationship to achievement.” Psychology in the Schools 31(1): 5–12.
Dietz, C. & Wilson, B.J. (1985). “Beginning school age and academic achievement.” Psychologyin the Schools 22(1): 93–94.
Gnezda, M.T., Garduque, L., & Schultz, T. (Eds.) (1991). Improving Instruction andAssessment in Early Childhood Education: Summary of a Workshop Series. Washington, DC: National Academy Press.
Gredler, G.R. (1984). “Transition classes: A viable alternative for the at-risk child?” Psychologyin the Schools 21: 463–470.
Holmes, C.T. (1989). “Grade level retention effects: A meta-analysis of research studies.” In L.A.Shepard and M.L. Smith (Eds.) Flunking Grades: Research and Policies on Retention. London: Falmer Press.
Kagan, S.L. (1990). “Readiness 2000: Rethinking rhetoric and responsibility.” Phi Delta KappanDecember 1990: 272–279.
Kalton, G. & Kasprzyk, D. (1986). “The Treatment of Missing Survey Data.” SurveyMethodology 12(1): 1–16.
Kinard, E.M. & Reinherz, H. (1986). “Birthdate effects on school performance and adjustment: A Journal of Educational Research 79(6): 366–372.
Langer, P., Kalk, J.M., & Searls, D.T. (1984). “Age of admission and trends in achievement: Acomparison of blacks and caucasians.” American Educational Research Journal 21(1):61–78.
Mantzicopoulos, P. & Morrison, D. (1992). “Kindergarten retention: Academic and behavioraloutcomes through the end of second grade.” American Educational Research Journal 29(1): 182–198.
Mantzicopoulos, P., Morrison, D.C., Hinshow, S.P., & Carte, E.T. (1989). “Nonpromotion inkindergarten: The role of cognitive, perceptual, visual–motor, behavioral, achievement,socioeconomic, and demographic characteristics.” American Educational Research Journal 26(1): 107–121.
May, D.C. & Welch, E.L. (1984). “The effects of developmental placement and early retentionon children’s later scores on standardized tests.” Psychology in the Schools 21: 381–385.

51
McArthur, E.K. & Bianchi, S.M. (1993). “Characteristics of children who are ‘behind’ in school.” Alexandria, VA: American Statistical Association, 1993 Proceedings of the SocialStatistics Section.
McCall, R. B. (1987). Intercorrelations of Stanford–Binet IQs at various ages in a group of eightychildren. As cited in A.J. Jensen, Bias in mental testing, Table 7.6, p.279. New York: TheFree Press.
Meisels, S.J. (1992). “Doing harm by doing good: Iatrogenic effects of early childhood enrollmentEarly Childhood Research Quarterly 7: 155–174.
Meisels, S.J., Steele, D., & Quinn, K. (1989). “Testing, tracking, and retaining young children: Ananalysis of research and social policy.” A commissioned paper prepared for the NationalCenter for Education Statistics.
Morrison, F.J., Griffith, E.M., & Alberts, D.M. (1997). “Nature-Nurture in the Classroom:Entrance Age, School Readiness, and Learning in Children” Developmental Psychology 33(2): 254–262.
Nason, R.B. (1991). “Retaining children: Is it the right decision?” Childhood Education 67(5):300–304.
Rao, J.N.K. & Thomas, R. (1989). Chi-squared tests for contingency tables. In C.J. Skinner, D.Holt, and T.M.F. Smith (Eds.), Analysis of complex surveys (chapter 4, p. 98). Chichester, England: John Wiley and Sons.
Rose, J.S., Medway, F.J., Cantrell, V.L., & Marus, S.H. (1983). “A fresh look at the retention–Journal of School Psychology 21(3): 201–211.
Shepard, L.A. (1989). “A Review of Research on Kindergarten Retention.” In L.A. Shepard &M.L. Smith (Eds.). Flunking Grades: Research and Policies on Retention. London:Falmer Press. 64–77.
Shepard, L.A. & Smith, M.L. (1988a). “Escalating academic demand in kindergarten: Elementary School Journal 89(2): 135–145.
Shepard, L.A. & Smith, M.L. (1988b). “Flunking kindergarten: Escalating curriculum leavesAmerican Educator Summer 1988: 34–38.
Shepard, L.A. & Smith, M.L. (1986). “Synthesis of research on school readiness and kindergartenEducational Leadership 44(3): 78–86.
Smith, M.L. & Shepard, L.A. (1987). “What doesn’t work: Explaining policies of retention in thePhi Delta Kappan 69(2): 129–134.

52
Vaden-Kiernan, N., Zill, N., Collins, M., & Chandler, K. (1994). Scalability and reliability of itemsfrom the 1991 and 1993 National Household Education Surveys. Unpublished paperprepared for the National Center for Education Statistics.
Walsh, D.J. (1989). “Changes in Kindergarten. Why here? Why now?” Early ChildhoodResearch Quarterly 4: 377–391.
West, J., Hausken, E.G., & Collins, M. (1993). Profile of preschool children’s childcare andearly program participation. Statistical Analysis Report, NCES 93–133. Washington,DC: U.S. Department of Education, Office of Educational Research and Improvement,National Center for Education Statistics.
West, J., Hausken, E.G., Chandler, K., & Collins, M. (1992). Experiences in childcare and earlychildhood programs of first– and second–graders. Statistics in Brief, NCES 92–005. Washington, DC: U.S. Department Education, Office of Educational Research andImprovement, National Center for Education Statistics.
Zill, N., & Coiro, M.J. (1992). “Assessing the condition of children in order to evaluate theimpact of child welfare reforms.” Children and Youth Services Review (Special Edition).
Zill, N., Collins, M., West, J., & Hausken, E.G. (1995). Approaching kindergarten: A look atpreschoolers in the United States. Statistical Analysis Report, NCES 95–280. Washington, DC: U.S. Department of Education, Office of Educational Research andImprovement, National Center for Education Statistics.

53
Appendix A
NHES:93 and NHES:95 Interview Items

55
Interview items to determine delayed kindergarten entry and retention status
NHES:93
R56. Most school districts have guidelines about when a child can start school based on his orher date of birth. Did you enroll (CHILD) in (kindergarten/prefirst grade) when (he/she)was old enough based on (his/her) birthdate, or did you wait until (he/she) was older?
WHEN OLD ENOUGH......................................................................... 1WAITED .............................................................................................. 2ENTERED EARLY............................................................................... 3
R66. Did (CHILD) attend one or two years of kindergarten?
ONE...................................................................................................... 1TWO..................................................................................................... 2THREE OR MORE ............................................................................... 3
NHES:95
B2. Most school districts have guidelines about when a child can start school based upon hisor her birth date. Did you enroll (CHILD) in kindergarten when (he/she) was old enoughbased on (his/her) birth date, or did you wait until (he/she) was older?
WHEN OLD ENOUGH......................................................................... 1WAITED .............................................................................................. 2ENTERED EARLY............................................................................... 3
B4. Did (CHILD) attend one or two years of kindergarten?
ONE...................................................................................................... 1TWO..................................................................................................... 2THREE OR MORE ............................................................................... 3

56
NHES:93 items measuring teacher feedback on children’s school performance andbehavior
TEACHINT. Here are some things teachers tell parents about how their children are doing inschool. For each one, please tell me if a teacher said something like this about(CHILD), or wrote it in a note or on a report card during the school year, even ifyou didn’t agree.
R52. Since the beginning of this school year, has a teacher said or written that...YES NO
a. (CHILD) has been doing really well in school?............................................... 1 2
b. (CHILD) has not been learning up to (his/her) capabilities? ............................ 1 2
c. (CHILD) doesn’t concentrate, doesn’t pay attention for long?....................... 1 2
d. (CHILD) has been acting up in school or disrupting the class? ..................... 1 2
e. (CHILD) has often seemed sad or unhappy in class? ...................................... 1 2
f. (CHILD) has been very restless, fidgets all the time, or doesn’t sit still?........ 1 2
g. (CHILD) has been having trouble taking turns, sharing, orcooperating with other children? .................................................................. 1 2
h. (CHILD) gets along with other children or works well in a group?................. 1 2
i. (CHILD) is very enthusiastic and interested in a lot of different things? .......... 1 2
j. (CHILD) lacks confidence in learning new things or taking partin new activities?........................................................................................... 1 2
k. It’s hard to understand what (CHILD) is saying?............................................ 1 2
l. (CHILD) is often sleepy or tired in class?....................................................... 1 2
m. (CHILD) likes to speak out in class and express (his/her) ideas?..................... 1 2

57
NHES:95 items measuring children’s school performance
C8. Compared to other children in (his/her) class, how would you say (CHILD) is doing in(his/her) schoolwork this year? Would you say (CHILD) is...
Near the top of the class, ...................................................... 1
Above the middle of the class,............................................... 2
Around the middle of the class, ............................................. 3
Below the middle of the class, or .......................................... 4
Near the bottom of the class?................................................ 5
C9. Has (CHILD’S) teacher or school contacted you [or (CHILD’S) (OTHERPARENT/GUARDIAN)] about any behavior problems (he/she) is having in school thisyear?
YES ...................................................................................................... 1NO........................................................................................................ 2
C10. Has (CHILD’S) teacher or school contacted you [or (CHILD’S) (OTHERPARENT/GUARDIAN)] about any problems (he/she) is having with schoolwork this year?
YES ...................................................................................................... 1NO........................................................................................................ 2
C11. Since starting first grade, has (CHILD) repeated any grades?
YES ...................................................................................................... 1NO........................................................................................................ 2
C12. What grade or grades did (CHILD) repeat? [CODE ALL THAT APPLY.][DISPLAY UP TO CURRENT GRADE ONLY.]
FIRST GRADE ..................................................................................... 1SECOND GRADE ................................................................................ 2THIRD GRADE.................................................................................... 3

59
Appendix B
Analyses of Delayed Kindergarten Entry and KindergartenRetention for Children At-Risk of School Problems

61
Analyses of Delayed Kindergarten Entry and KindergartenRetention for Children At-Risk of School Problems
This appendix provides information on the logistic regression analyses done to examine
whether the effects of delayed kindergarten entry and kindergarten retention on children’s later
school performance differ between those who are especially at risk of experiencing difficulties in
elementary school and other children. In this analysis, two groups of "at-risk" children were
defined with the survey data. One of the risk groups consisted of boys with late birthdays (i.e.,
who were born between July and December). The other group was comprised of children who
were reported to have been diagnosed as developmentally delayed.
For each of the risk groups, two new variables were created: one representing being at-
risk and also having entered kindergarten at a later age; the other representing being at-risk and
also having repeated kindergarten. When entered into logistic regression models these new
variables, or “interaction terms,” indicate whether or not having been delayed from starting
kindergarten or having repeated kindergarten differentially affects the likelihood of poor school
performance in the first and second grades, according to whether or not the child is at risk for
poor school performance to begin with. For example, the interaction term representing whether
the child was male and had a late birthdate and also whether the child was delayed from entering
kindergarten indicates whether or not delayed entry has a different effect on school performance
for male children with late birthdays than for other children.
Each interaction term (and its component main effect terms) was tested in a separate
regression model; thus, there were four logistic models for the 1993 summary school performance
indicator, and four models for the 1995 school performance indicator. These models included
controls for the demographic, developmental, and socioeconomic variables that were used in
other analyses presented in this report. However, the models involving males with late birthdays
did not include the separate variables of child's sex and birth date.
Tables B1 and B2 in this appendix present the results of the logistic regression analyses
that incorporated the interaction terms. Table B1 presents the results for the 1993 data, in which
the dependent variable is receipt of negative feedback from teachers. Table B2 presents the
results for the 1995 data, in which the dependent variable is the occurrence of one of the four
school performance problems asked about in that survey year. The results are discussed in the
“Findings” section of the report.
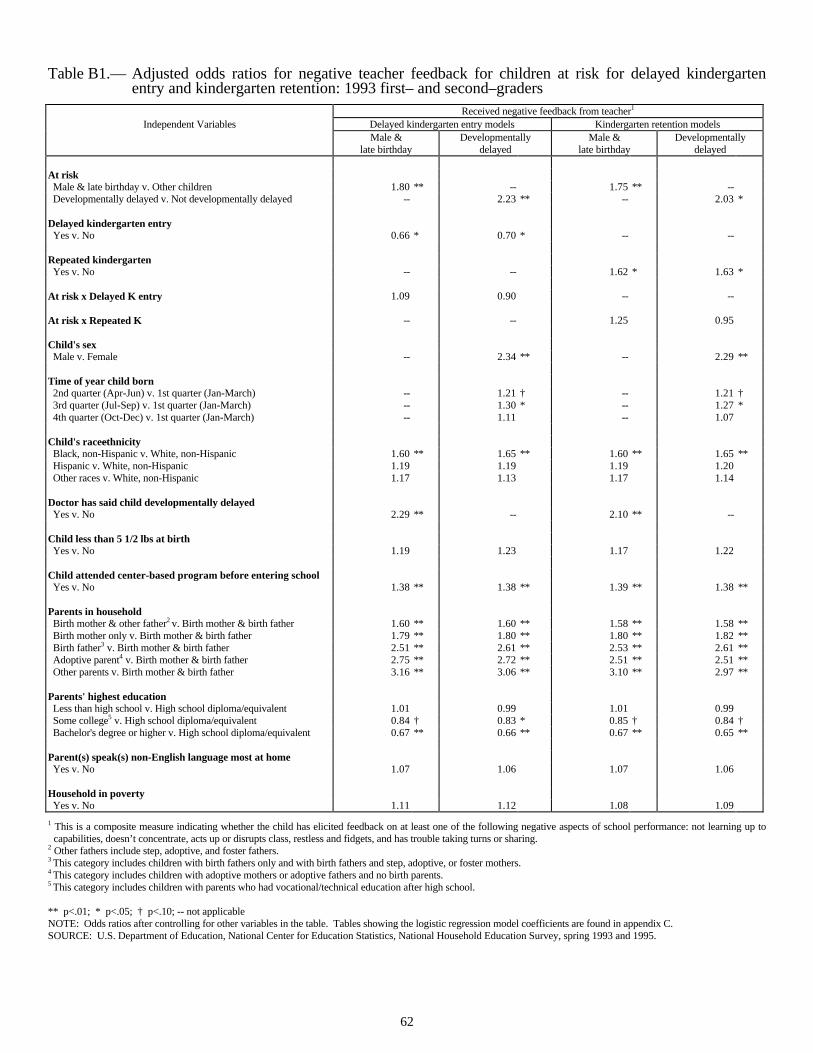
62
Table B1.— Adjusted odds ratios for negative teacher feedback for children at risk for delayed kindergartenentry and kindergarten retention: 1993 first– and second–graders
Received negative feedback from teacher1
Independent Variables Delayed kindergarten entry models Kindergarten retention modelsMale &
late birthdayDevelopmentally
delayedMale &
late birthdayDevelopmentally
delayed
At risk Male & late birthday v. Other children 1.80 ** -- 1.75 ** -- Developmentally delayed v. Not developmentally delayed -- 2.23 ** -- 2.03 *
Delayed kindergarten entry Yes v. No 0.66 * 0.70 * -- --
Repeated kindergarten Yes v. No -- -- 1.62 * 1.63 *
At risk x Delayed K entry 1.09 0.90 -- --
At risk x Repeated K -- -- 1.25 0.95
Child's sex Male v. Female -- 2.34 ** -- 2.29 **
Time of year child born 2nd quarter (Apr-Jun) v. 1st quarter (Jan-March) -- 1.21 † -- 1.21 † 3rd quarter (Jul-Sep) v. 1st quarter (Jan-March) -- 1.30 * -- 1.27 * 4th quarter (Oct-Dec) v. 1st quarter (Jan-March) -- 1.11 -- 1.07
Child's race–ethnicity Black, non-Hispanic v. White, non-Hispanic 1.60 ** 1.65 ** 1.60 ** 1.65 ** Hispanic v. White, non-Hispanic 1.19 1.19 1.19 1.20 Other races v. White, non-Hispanic 1.17 1.13 1.17 1.14
Doctor has said child developmentally delayed Yes v. No 2.29 ** -- 2.10 ** --
Child less than 5 1/2 lbs at birth Yes v. No 1.19 1.23 1.17 1.22
Child attended center-based program before entering school Yes v. No 1.38 ** 1.38 ** 1.39 ** 1.38 **
Parents in household Birth mother & other father2 v. Birth mother & birth father 1.60 ** 1.60 ** 1.58 ** 1.58 ** Birth mother only v. Birth mother & birth father 1.79 ** 1.80 ** 1.80 ** 1.82 ** Birth father3 v. Birth mother & birth father 2.51 ** 2.61 ** 2.53 ** 2.61 ** Adoptive parent4 v. Birth mother & birth father 2.75 ** 2.72 ** 2.51 ** 2.51 ** Other parents v. Birth mother & birth father 3.16 ** 3.06 ** 3.10 ** 2.97 **
Parents' highest education Less than high school v. High school diploma/equivalent 1.01 0.99 1.01 0.99 Some college5 v. High school diploma/equivalent 0.84 † 0.83 * 0.85 † 0.84 † Bachelor's degree or higher v. High school diploma/equivalent 0.67 ** 0.66 ** 0.67 ** 0.65 **
Parent(s) speak(s) non-English language most at home Yes v. No 1.07 1.06 1.07 1.06
Household in poverty Yes v. No 1.11 1.12 1.08 1.09
1 This is a composite measure indicating whether the child has elicited feedback on at least one of the following negative aspects of school performance: not learning up tocapabilities, doesn’t concentrate, acts up or disrupts class, restless and fidgets, and has trouble taking turns or sharing.
2 Other fathers include step, adoptive, and foster fathers.3 This category includes children with birth fathers only and with birth fathers and step, adoptive, or foster mothers.4 This category includes children with adoptive mothers or adoptive fathers and no birth parents.5 This category includes children with parents who had vocational/technical education after high school.
** p<.01; * p<.05; † p<.10; -- not applicableNOTE: Odds ratios after controlling for other variables in the table. Tables showing the logistic regression model coefficients are found in appendix C.SOURCE: U.S. Department of Education, National Center for Education Statistics, National Household Education Survey, spring 1993 and 1995.

63
Table B2.— Adjusted odds ratios for experience with at least one school performance problem for children atrisk for delayed kindergarten entry and kindergarten retention: 1995 first– and second–graders
Experienced at least one school performance problem1
Independent Variables Delayed kindergarten entry models Kindergarten retention modelsMale &
late birthdayDevelopmentally
delayedMale &
late birthdayDevelopmentally
delayed
At risk Male & late birthdate v. Other children 1.70 ** -- 1.63 ** -- Developmentally delayed v. Not developmentally delayed -- 5.05 ** -- 4.26 **
Delayed kindergarten entry Yes v. No 1.05 0.88 -- --
Repeated kindergarten Yes v. No -- -- 1.68 * 1.26
At risk x Delayed K entry 0.64 † 0.59 -- --
At risk x Repeated K -- -- 0.57 1.80
Child's sex Male v. Female -- 1.90 ** -- 1.88 **
Time of year child born 2nd quarter (Apr-Jun) v. 1st quarter (Jan-March) -- 1.01 -- 1.01 3rd quarter (Jul-Sep) v. 1st quarter (Jan-March) -- 1.23 -- 1.22 4th quarter (Oct-Dec) v. 1st quarter (Jan-March) -- 1.05 -- 1.04
Child's race–ethnicity Black, non-Hispanic v. White, non-Hispanic 1.65 ** 1.68 ** 1.63 ** 1.68 ** Hispanic v. White, non-Hispanic 1.20 1.17 1.21 1.17 Other races v. White, non-Hispanic 0.82 0.80 0.82 0.79
Doctor has said child developmentally delayed Yes v. No 4.90 ** -- 4.66 ** --
Child less than 5 1/2 lbs at birth Yes v. No 1.14 1.19 1.14 1.19
Child attended center-based program before entering school Yes v. No 1.04 1.01 1.05 1.02
Parents in household Birth mother & other father2 v. Birth mother & birth father 1.39 † 1.40 † 1.40 † 1.40 † Birth mother only v. Birth mother & birth father 1.31 * 1.30 * 1.30 * 1.30 * Birth father3 v. Birth mother & birth father 1.42 1.39 1.42 1.39 Adoptive parent4 v. Birth mother & birth father 1.90 † 1.90 † 1.90 † 1.90 † Other parents v. Birth mother & birth father 2.56 ** 2.64 ** 2.53 ** 2.64 **
Parents' highest education Less than high school v. High school diploma/equivalent 1.27 1.31 1.27 1.31 Some college5 v. High school diploma/equivalent 0.86 0.88 0.85 0.87 Bachelor's degree or higher v. High school diploma/equivalent 0.49 ** 0.49 ** 0.49 ** 0.49 **
Parent(s) speak(s) non-English language most at home Yes v. No 1.09 1.11 1.07 1.09
Household in poverty Yes v. No 1.25 1.28 † 1.26 1.31 †
1 This is a composite measure indicating whether the child has elicited feedback on at least one of the following negative aspects of school performance: not learning up tocapabilities, doesn’t concentrate, acts up or disrupts class, restless and fidgets, and has trouble taking turns or sharing.
2 Other fathers include step, adoptive, and foster fathers.3 This category includes children with birth fathers only and with birth fathers and step, adoptive, or foster mothers.4 This category includes children with adoptive mothers or adoptive fathers and no birth parents.5 This category includes children with parents who had vocational/technical education after high school.
** p<.01; * p<.05; † p<.10; -- not applicable.
NOTE: Odds ratios after controlling for other variables in the table. Tables showing the logistic regression model coefficients are found in appendix C.SOURCE: U.S. Department of Education, National Center for Education Statistics, National Household Education Survey, spring 1993 and 1995.
65
Appendix C
Logistic Regression Model Coefficients

67
Logistic Regression Model Coefficients
Tables 2 and 4 in the report text and tables B1 and B2 in appendix B contain the results of
logistic regression models in the form of odds ratios. Included in this appendix are tables
containing the regression model coefficients from which these odds ratios were derived. Table C1
corresponds to text table 2; table C2 corresponds to text table 4; table C3 corresponds to
appendix table B1; and table C4 corresponds to appendix table B2.
The odds ratios were derived from the coefficients by using the following formula:
eβ
where β is the regression model coefficient. For more information about conversions between
logistic regression model coefficients and odds ratios, see Alba (1987).1
1 Alba, Richard D. (1987). “Interpreting the Parameters of Log-Linear Models.” Sociological Methods andResearch vol. 16, no. 1, pp.45-77.

68
Table C1.— Logistic regression models relating delayed entry into kindergarten and kindergarten retentionto child and family characteristics for first– and second–graders: 1993 and 1995
1993 1995
Independent Variables Delayed entry into kindergarten Repeated kindergarten
Delayed entry into kindergarten Repeated kindergarten
β s.e. β s.e. β s.e. β s.e.
Intercept -3.02 ** 0.24 -3.41 ** 0.26 -3.10 ** 0.23 -3.56 ** 0.25
Child's sex (male) 0.29 * 0.14 0.35 * 0.16 0.57 ** 0.15 0.50 * 0.19
Time of year child born 1st quarter (Jan-Mar) -- -- -- -- -- -- -- -- 2nd quarter (Apr-Jun) -0.34 0.25 0.48 † 0.25 0.08 0.24 0.10 0.31 3rd quarter (Jul-Sep) 0.61 ** 0.20 0.35 0.22 0.81 ** 0.18 0.17 0.31 4th quarter (Oct-Dec) 0.88 ** 0.21 0.25 0.26 1.03 ** 0.20 0.34 0.26
Child's race–ethnicity White, non-Hispanic -- -- -- -- -- -- -- -- Black, non-Hispanic -0.46 * 0.23 0.28 0.24 -0.50 * 0.22 0.81 ** 0.26 Hispanic 0.31 0.23 -0.43 0.37 0.02 0.26 0.08 0.32 Other races -0.65 0.49 0.28 0.39 -0.13 0.29 0.14 0.40
Doctor has said child developmentally delayed 0.84 ** 0.26 1.21 ** 0.25 0.27 0.32 1.57 ** 0.32
Child less than 5 1/2 lbs at birth -0.07 0.32 0.39 † 0.23 -0.34 0.37 0.36 0.31
Child attended center-based program before entering school -0.03 0.15 -0.06 0.17 0.17 0.17 -0.62 ** 0.21
Parents in household Birth mother & birth father -- -- -- -- -- -- -- -- Birth mother & other father1 -0.09 0.35 0.27 0.36 -0.71 † 0.39 0.29 0.36 Birth mother only -0.07 0.20 -0.13 0.19 -0.22 0.19 0.13 0.20 Birth father2 -0.26 0.32 0.18 0.34 -1.11 * 0.48 0.59 0.51 Adoptive parent3 1.06 ** 0.37 1.00 * 0.45 -0.09 0.60 -0.41 1.10 Other parents -0.08 0.43 0.67 0.41 -0.56 0.49 0.73 0.49
Parents' highest education Less than high school 0.01 0.28 0.12 0.29 0.21 0.32 -0.03 0.42 High school diploma or equivalent -- -- -- -- -- -- -- -- Some college4 0.09 0.18 -0.44 * 0.21 0.16 0.18 0.12 0.25 Bachelor's degree or higher 0.33 * 0.16 -0.28 0.18 -0.14 0.17 0.19 0.27
Parent(s) speak(s) non-English language most at home -0.38 † 0.23 0.28 0.37 -0.12 0.30 0.69 † 0.37
Household in poverty 0.29 0.18 0.45 * 0.19 -0.21 0.22 -0.79 ** 0.29
F (20,41) 5.24 ** 3.42 ** -- --
F (20,31) -- -- 3.52 ** 5.84 **
1 Other fathers include step, adoptive, and foster fathers.2 This category includes children with birth fathers only and with birth fathers and step, adoptive, or foster mothers.3 This category includes children with adoptive mothers or adoptive fathers and no birth parents.4 This category includes children with parents who had vocational–technical education after high school.
NOTE: b = unstandardized regression coefficient
s.e. is standard error.
SOURCE: U.S. Department of Education, National Center for Education Statistics, National Household Education Survey, spring 1993 and 1995.

69
Table C2.—Logistic regression models relating school performance problems to delayed entry intokindergarten and kindergarten retention for first– and second–graders: 1993 and 1995
1993 1995
Independent Variables Received negative feedback from teacher1 Experienced at least one school performance problem2
β s.e. β s.e. β s.e. β s.e.
Intercept -1.10 ** 0.14 -1.12 ** 0.13 -0.66 ** 0.14 -0.68 ** 0.14
Delayed kindergarten entry -0.37 ** 0.13 -- -- -0.16 0.17 -- --
Repeated kindergarten -- -- 0.49 * 0.19 -- -- 0.27 0.22
Child's sex (male) 0.85 ** 0.07 0.83 ** 0.07 0.64 ** 0.07 0.63 ** 0.08
Time of year child born 1st quarter (Jan-Mar) -- -- -- -- -- -- -- -- 2nd quarter (Apr-Jun) 0.19 † 0.10 0.19 † 0.11 0.01 0.14 0.01 0.14 3rd quarter (Jul-Sep) 0.26 * 0.11 0.24 * 0.12 0.21 0.13 0.20 0.13 4th quarter (Oct-Dec) 0.10 0.11 0.07 0.11 0.05 0.15 0.04 0.15
Child's race–ethnicity White, non-Hispanic -- -- -- -- -- -- -- -- Black, non-Hispanic 0.50 ** 0.12 0.50 ** 0.12 0.52 ** 0.13 0.52 ** 0.13 Hispanic 0.17 0.13 0.18 0.13 0.16 0.16 0.16 0.16 Other races 0.12 0.20 0.13 0.20 -0.23 0.21 -0.23 0.22
Doctor has said child developmentally delayed 0.78 ** 0.26 0.70 * 0.27 1.55 ** 0.28 1.51 ** 0.28
Child less than 5 1/2 lbs at birth 0.21 0.13 0.20 0.13 0.18 0.20 0.18 0.20
Child attended center-based program before entering school 0.32 ** 0.07 0.32 ** 0.07 0.01 0.10 0.02 0.10
Parents in household Birth mother & birth father -- -- -- -- -- -- -- -- Birth mother & other father3 0.46 ** 0.16 0.46 ** 0.16 0.34 † 0.19 0.35 † 0.19 Birth mother only 0.59 ** 0.12 0.60 ** 0.12 0.26 * 0.12 0.26 * 0.12 Birth father4
0.96 ** 0.19 0.96 ** 0.19 0.33 0.26 0.33 0.25 Adoptive parent5 0.99 ** 0.32 0.92 ** 0.33 0.63 † 0.36 0.64 † 0.36 Other parents 1.12 ** 0.29 1.09 ** 0.29 0.97 ** 0.34 0.97 ** 0.34
Parents' highest education Less than high school -0.01 0.15 -0.01 0.15 0.27 0.19 0.26 0.19 High school diploma or equivalent -- -- -- -- -- -- -- -- Some college6 -0.19 * 0.09 -0.18 † 0.09 -0.14 0.10 -0.14 0.10 Bachelor's degree or higher -0.42 ** 0.11 -0.43 ** 0.10 -0.71 ** 0.10 -0.71 ** 0.10
Parent(s) speak(s) non-English language most at home 0.06 0.14 0.06 0.14 0.10 0.22 0.09 0.22
Household in poverty 0.11 0.11 0.09 0.11 0.25 † 0.15 0.26 † 0.14
F (21,40) 15.11 ** 16.58 ** -- --
F (21,30) -- -- 17.46 ** 16.18 **
1This is a composite measure indicating whether the child has elicited feedback on at least one of the following negative aspects of school performance: notlearning up to capabilities, doesn’t concentrate, acts up or disrupts class, restless and fidgets, and has trouble taking turns or sharing.
2This is a composite measure indicating whether the child has had one of the following school performance problems: child’s schoolwork rankedamong the middle or below classmates, teacher has reported behavior problems, teacher has reported schoolwork problems, and child has repeatedfirst or second grade.
3Other fathers include step, adoptive, and foster fathers.4This category includes children with birth fathers only and with birth fathers and step, adoptive, or foster mothers.5This category includes children with adoptive mothers or adoptive fathers and no birth parents.6This category includes children with parents who had vocational–technical education after high school.
NOTE: b = unstandardized regression coefficients.e. is standard error.
SOURCE: U.S. Department of Education, National Center for Education Statistics, National Household Education Survey, spring 1993 and 1995.

70
Table C3.— Logistic regression models relating negative teacher feedback for children at risk to delayedkindergarten entry and kindergarten retention: 1993 first– and second–graders
Received negative feedback from teacher1
Independent Variables Delayed kindergarten entry models Kindergarten retention modelsβ s.e. β s.e. β s.e. β s.e.
Intercept -0.69 ** 0.10 -1.10 ** 0.14 -0.73 ** 0.10 -1.13 ** 0.14
At risk (male & late birthdate) 0.59 ** 0.09 -- -- 0.56 ** 0.09 -- --
At risk (developmentallydelayed) -- -- 0.80 ** 0.27 -- -- 0.71 * 0.28
Delayed kindergarten entry -0.41 * 0.16 -0.36 * 0.14 -- -- -- --
Repeated kindergarten -- -- -- -- 0.48 * 0.20 0.49 * 0.20
At risk x Delayed K entry 0.09 0.28 -0.11 0.55 -- -- -- --
At risk x Repeated K -- -- -- -- 0.22 0.33 -0.05 0.69
Child's sex (male) -- -- 0.85 ** 0.07 -- -- 0.83 ** 0.07
Time of year child born 1st quarter (Jan-Mar) -- -- -- -- -- -- -- -- 2nd quarter (Apr-Jun) -- -- 0.19 † 0.10 -- -- 0.19 † 0.11 3rd quarter (Jul-Sep) -- -- 0.26 * 0.12 -- -- 0.24 * 0.12 4th quarter (Oct-Dec) -- -- 0.10 0.10 -- -- 0.07 0.11
Child's race–ethnicity White, non-Hispanic -- -- -- -- -- -- -- -- Black, non-Hispanic 0.47 ** 0.12 0.50 ** 0.12 0.47 ** 0.12 0.50 ** 0.12 Hispanic 0.17 0.12 0.17 0.13 0.17 0.12 0.18 0.13 Other races 0.16 0.20 0.12 0.20 0.16 0.20 0.13 0.20
Doctor has said child developmentally delayed 0.83 ** 0.25 -- -- 0.74 ** 0.26 -- --
Child less than 5 1/2 lbs at birth 0.17 0.13 0.21 0.13 0.16 0.13 0.20 0.13
Child attended center-based program before entering school 0.32 ** 0.07 0.32 ** 0.07 0.33 ** 0.08 0.32 ** 0.07
Parents in household Birth mother & birth father -- -- -- -- -- -- -- -- Birth mother & other father2 0.47 ** 0.16 0.47 ** 0.16 0.46 ** 0.16 0.46 ** 0.16 Birth mother only 0.58 ** 0.12 0.59 ** 0.12 0.59 ** 0.12 0.60 ** 0.12 Birth father3 0.92 ** 0.20 0.96 ** 0.19 0.93 ** 0.20 0.96 ** 0.19 Adoptive parent4 1.01 ** 0.29 1.00 ** 0.30 0.92 ** 0.31 0.92 ** 0.33 Other parents 1.15 ** 0.28 1.12 ** 0.29 1.13 ** 0.28 1.09 ** 0.29
Parents' highest education Less than high school 0.01 0.15 -0.01 0.15 0.01 0.15 -0.01 0.15 High school diploma or equivalent -- -- -- -- -- -- -- -- Some college5 -0.17 † 0.09 -0.19 * 0.09 -0.16 † 0.09 -0.18 † 0.09 Bachelor's degree or higher -0.40 ** 0.10 -0.42 ** 0.11 -0.40 ** 0.10 -0.43 ** 0.10
Parent(s) speak(s) non-English language most at home 0.07 0.13 0.06 0.14 0.07 0.13 0.06 0.14
Household in poverty 0.10 0.10 0.11 0.11 0.08 0.10 0.09 0.11
F (19,42) 14.52 ** -- 16.47 ** --
F (22,39) -- 14.31 ** -- 15.67 **
1This is a composite measure indicating whether the child has elicited feedback on at least one of the following negative aspects of school performance: notlearning up to capabilities, doesn’t concentrate, acts up or disrupts class, restless and fidgets, and has trouble taking turns or sharing.2Other fathers include step, adoptive, and foster fathers.3This category includes children with birth fathers only and with birth fathers and step, adoptive, or foster mothers.4This category includes children with adoptive mothers or adoptive fathers and no birth parents.5This category includes children with parents who had vocational–technical education after high school.
NOTE: b = unstandardized regression coefficients.e. is standard error.
SOURCE: U.S. Department of Education, National Center for Education Statistics, National Household Education Survey, spring 1993 and 1995.
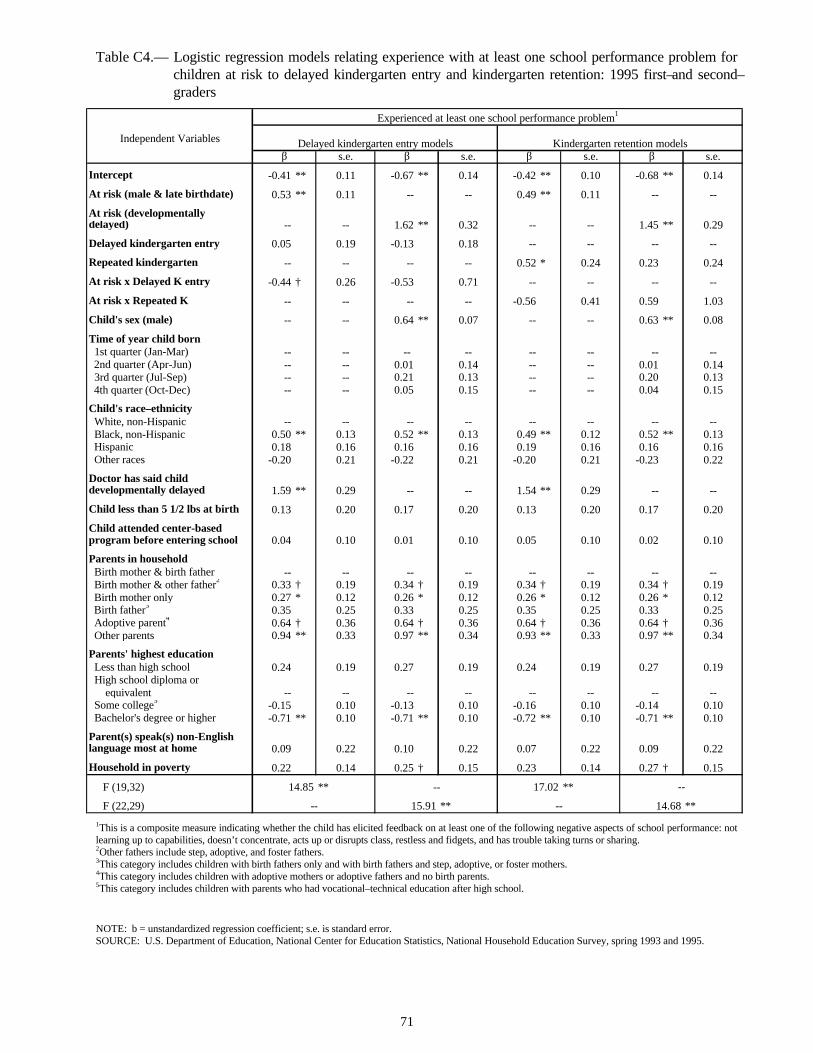
71
Table C4.— Logistic regression models relating experience with at least one school performance problem forchildren at risk to delayed kindergarten entry and kindergarten retention: 1995 first– and second–graders
Experienced at least one school performance problem1
Independent Variables Delayed kindergarten entry models Kindergarten retention modelsβ s.e. β s.e. β s.e. β s.e.
Intercept -0.41 ** 0.11 -0.67 ** 0.14 -0.42 ** 0.10 -0.68 ** 0.14
At risk (male & late birthdate) 0.53 ** 0.11 -- -- 0.49 ** 0.11 -- --
At risk (developmentallydelayed) -- -- 1.62 ** 0.32 -- -- 1.45 ** 0.29
Delayed kindergarten entry 0.05 0.19 -0.13 0.18 -- -- -- --
Repeated kindergarten -- -- -- -- 0.52 * 0.24 0.23 0.24
At risk x Delayed K entry -0.44 † 0.26 -0.53 0.71 -- -- -- --
At risk x Repeated K -- -- -- -- -0.56 0.41 0.59 1.03
Child's sex (male) -- -- 0.64 ** 0.07 -- -- 0.63 ** 0.08
Time of year child born 1st quarter (Jan-Mar) -- -- -- -- -- -- -- -- 2nd quarter (Apr-Jun) -- -- 0.01 0.14 -- -- 0.01 0.14 3rd quarter (Jul-Sep) -- -- 0.21 0.13 -- -- 0.20 0.13 4th quarter (Oct-Dec) -- -- 0.05 0.15 -- -- 0.04 0.15
Child's race–ethnicity White, non-Hispanic -- -- -- -- -- -- -- -- Black, non-Hispanic 0.50 ** 0.13 0.52 ** 0.13 0.49 ** 0.12 0.52 ** 0.13 Hispanic 0.18 0.16 0.16 0.16 0.19 0.16 0.16 0.16 Other races -0.20 0.21 -0.22 0.21 -0.20 0.21 -0.23 0.22
Doctor has said child developmentally delayed 1.59 ** 0.29 -- -- 1.54 ** 0.29 -- --
Child less than 5 1/2 lbs at birth 0.13 0.20 0.17 0.20 0.13 0.20 0.17 0.20
Child attended center-based program before entering school 0.04 0.10 0.01 0.10 0.05 0.10 0.02 0.10
Parents in household Birth mother & birth father -- -- -- -- -- -- -- -- Birth mother & other father2 0.33 † 0.19 0.34 † 0.19 0.34 † 0.19 0.34 † 0.19 Birth mother only 0.27 * 0.12 0.26 * 0.12 0.26 * 0.12 0.26 * 0.12 Birth father3 0.35 0.25 0.33 0.25 0.35 0.25 0.33 0.25 Adoptive parent4 0.64 † 0.36 0.64 † 0.36 0.64 † 0.36 0.64 † 0.36 Other parents 0.94 ** 0.33 0.97 ** 0.34 0.93 ** 0.33 0.97 ** 0.34
Parents' highest education Less than high school 0.24 0.19 0.27 0.19 0.24 0.19 0.27 0.19 High school diploma or equivalent -- -- -- -- -- -- -- -- Some college5 -0.15 0.10 -0.13 0.10 -0.16 0.10 -0.14 0.10 Bachelor's degree or higher -0.71 ** 0.10 -0.71 ** 0.10 -0.72 ** 0.10 -0.71 ** 0.10
Parent(s) speak(s) non-English language most at home 0.09 0.22 0.10 0.22 0.07 0.22 0.09 0.22
Household in poverty 0.22 0.14 0.25 † 0.15 0.23 0.14 0.27 † 0.15
F (19,32) 14.85 ** -- 17.02 ** --
F (22,29) -- 15.91 ** -- 14.68 **
1This is a composite measure indicating whether the child has elicited feedback on at least one of the following negative aspects of school performance: notlearning up to capabilities, doesn’t concentrate, acts up or disrupts class, restless and fidgets, and has trouble taking turns or sharing.2Other fathers include step, adoptive, and foster fathers.3This category includes children with birth fathers only and with birth fathers and step, adoptive, or foster mothers.4This category includes children with adoptive mothers or adoptive fathers and no birth parents.5This category includes children with parents who had vocational–technical education after high school.
NOTE: b = unstandardized regression coefficient; s.e. is standard error.SOURCE: U.S. Department of Education, National Center for Education Statistics, National Household Education Survey, spring 1993 and 1995.