the emerging pattern of global investment - world...
TRANSCRIPT

Global Development Horizons 17
1The Emerging Pattern of Global Investment
A snapshot in 2030 will reveal a world in which more than two-thirds of all global investment and half of the
global accumulated capital stock will be in devel-oping economies. This is in sharp contrast with recent history. Currently, almost 70 percent of the world’s capital stock resides in the developed world, and in 2000 developing countries’ share in global investments was only about 20 percent. projections presented in this chapter indicate that, by 2030, global aggregate investment activ-ity will far and away reside in China—with 30 percent—while india and Brazil (7 percent and 3 percent, respectively) will account for shares com-parable to the United states and Japan (11 per-cent and 5 percent, respectively). Developing asia will collectively hold capital stocks exceeding 55 percent of the entire developed world’s.
This shift in investment activity toward the Global south coincides with rapid catch-up growth that began during the 1990s as devel-oping countries integrated into global markets, underwent structural transformations, and improved their institutions. assuming a continu-ation of needed reforms, this catch-up process is expected to carry on over the course of the next two decades. in fact, the shift in allocation of the global capital stock corresponds closely to a similar rise in developing countries’ share of global gross domestic product (GDp). Currently, roughly 70 percent of global GDp is produced in high-income countries, and that share will decline to around 50 percent by 2030. indeed, the capital-to-GDp ratios of developing coun-tries as a group and high-income countries as a group differ very little, even as the ratio can vary substantially across individual countries: in both groups, the size of the capital stock is about 2.5 times the size of annual GDp, and this ratio is
expected to increase gradually over time. as labor productivity in developing countries catches up with the higher levels that exist in high-income countries, the global distribution of capital per capita will become more equal.
with much higher productivity growth in developing countries, their investment rate has to be substantially higher than in high-income countries for the capital stock to keep pace with potential output. today, developing countries collectively invest slightly above 30 percent of GDp, a rate almost twice that of high-income countries, which currently stands at about 17 per-cent. The high investment rates—together with the rising share of developing countries in global GDp—will increase developing countries’ share in global investment to two-thirds before 2030. however, this outcome will not mechanically materialize, but will require two conditions to be fulfilled: First, productivity growth and sectoral shifts must create enough investment opportu-nities. second, both domestic and international investors must be willing to finance these invest-ments, allocating two-thirds of every dollar of global savings to developing countries. these two conditions are analyzed in this chapter. The analysis of the first one relies heavily on standard factor demand equations in a global general equi-librium model. The analysis of the second con-dition brings in econometric analysis regarding the historical behavior of investors, who react not only to growth opportunities and yields, but also to institutions and other factors, often encapsu-lated by the term “investment climate.”
That the discussion has shifted to how much developing countries will contribute to, and reshape, global investment trends is a testimony to the great strides that the developing world has made over the past half century. estimates by a
1

18 The Emerging Pattern of Global Investment Global Development Horizons
group of experts convened by the United nations placed the total capital requirements of develop-ing countries in 1950–60 at $19 billion, of which they believed only a fraction would be met by domestic savings, leaving an “investment gap” of $14 billion (Un 1951). pioneers in development economics argued over whether structural rigidi-ties in developing countries could ever be over-come such that investment could be productively translated into output, engendering an industrial takeoff (Meier and seers 1984).
the main messages of this chapter are the following:
• Since2000,therehavebeenthreenotablechanges in the pattern of global invest-mentactivity: ashiftinglobalinvestmenttowardthedevelopingworld,ashifttowardgreatermanufacturing investment glob-ally,andaslow,butdefinitive,redistribu-tionof capital stocks toward thedevelop-ingworld. although a nontrivial share of these phenomena can be attributed to large economies such as China and india, significant increases in investment rates have occurred elsewhere in the developing world as well.
• Thefuturestructureofproductionwillimplyalsoaglobalshifttowardinvestmentinser-vices. This shift is the natural consequence of (a) increased shares of services in econo-mies with higher per capita incomes, (b) demographic changes that will increase demand for educational and health services, and (c) a larger share of services embedded in tradable goods. Between 2010 and 2030, services investment will rise from 57 per-cent to 61 percent of the total investment profile in developing countries, and from 75 percent to 78 percent in high-income economies. This rise is expected to occur despite ongoing rapid growth in manu-facturing investment, especially in several lower-middle-income countries and regions (such as india and the lower-income econo-mies of southeast asia).
• Theoverallrelationshipbetweeneconomicgrowthandinvestmentisstrongandsignifi-cant,anddevelopingcountries’growingshare
ofglobalinvestmentsince2000hasbeendueinlargeparttorobustgrowthinthosecoun-tries. this observation is consistent with optimal factor demand calculations in a computable general equilibrium (CGe) model. it is also confirmed by econometric analysis of how investors allocate resources over countries. however, the historical cor-relation between growth and investment ratios found in the latter analysis indicates that growth alone will be insufficient to fully satisfy optimal factor demand. That means improvements in other driving forces are needed to attract sufficient capi-tal. one of those forces is financial devel-opment, or the maturity of the financial sector. a 10 percent increase in a standard measure of financial intermediation—the ratio of private credit to GDp—is associ-ated with a 1–5 percent increase in invest-ment. if such improvements are insuffi-cient, yields relative to those abroad will have to rise in fast-growing economies to attract sufficient capital.
• Onemajor area of concern indevelopingcountriesregardsinfrastructureneeds. even exempting maintenance costs and replace-ment investments, fully meeting antici-pated population coverage targets will result in a global infrastructure investment bill for developing countries that amounts to about $866 billion annually in 2030 (measured in 2010 dollars). although this amounts to only around 3 percent of all developing-world investment in 2030, its financing is particularly challenging given the long-term nature (and associated risks) of these investments.
• Despitemanycommonchangesininvestmentpatterns,thepatternsthemselvescansignifi-cantlydifferacrosscountries.There are pre-dictable patterns; for example, low-income countries invest primarily in agriculture, and middle-income countries invest heavily in manufacturing and increasingly in ser-vices. But there are notable exceptions. For example, vietnam (which until recently was a low-income country) invested a dis-proportionately large share of all f ixed

Global Development Horizons The Emerging Pattern of Global Investment 19
investment in manufacturing. Countries have also varied in their overall capital-to-GDp ratio, with the natural resource-rich economies of Brazil and the russian Federation requiring less capital per unit of output than China and india. Finally, although the private sector has tended to account for a larger proportion of invest-ment than the public sector in most upper-middle-income economies, the economies of China and the Middle east have been notable exceptions.
• Despitetherisingshareofdevelopingcoun-tries,theglobalinvestmentrateisexpectedto remainrelatively stable. if investment rates in individual countries would remain constant, the global investment rate would rise because of the growing share of the developing world. however, investment rates in virtually all individual countries are expected to fall. that drop is largely associated with slowing growth in produc-tion potential, reflecting demographics and the shift toward services (where productiv-ity growth is lower). the slowdown will not be uniform across the world. China’s investment will fall more sharply than else-where in the developing world, while sub-saharan africa will actually experience a rise relative to its recent historical average. This fall of the investment rate in individ-ual countries compensates for the composi-tion effect of a larger share of developing countries in the world, leading to a stable global investment rate.
• In a scenariowhere convergence betweendevelopingandhigh-incomeeconomiesoccursmorerapidly,totalinvestmentatthegloballevelwillbe7percenthigherthaninasce-nariowhereconvergencefollowsrecenthis-torical trendsandis farmoregradual. in this rapid convergence scenario, aggregate investment in developing countries will also rise by $2.7 trillion (in 2010 dollars) compared with the gradual convergence scenario, while investment in high-income countries will fall by about $1 trillion rela-tive to the gradual convergence outcome. whether investment rates rise or fall in
any given country will depend, however, on the increase in its investment relative to its output; in China and india, for exam-ple, investment rates will rise on the order of about 1 percent, while economies such as Brazil, Mexico, and indonesia will see small declines in their investment rates, of 0.4–1.1 percent.
• Policymakersseekingtosupportinvestmentactivityintheireconomiesshouldconcentratetheireffortsonestablishingafavorableinvest-ment climate that supports private sectorinvestmentactivity, including policies aimed at improving financial sector development and policies to raise the overall quality of governance, especially concerning the rule of law. to the extent that direct interven-tion is warranted, it should be in areas where market or government failures are clear and where social returns are especially large. if policy makers do decide to pursue the interventionist route with regard to investment policy, their efforts may be best placed supporting the upcoming expansion in service sector investment, especially in areas such as education, health care, and infrastructure, where spillovers from posi-tive externalities can be especially high. insofar as infrastructure is concerned, the trend toward public-private partnerships can offer both additional sources of capi-tal and a disciplinary mechanism to limit potential public sector inefficiencies.
Changing patterns of investment worldwide
There has been a global shift toward greater investment in the developing world
since the turn of the 20th century, the pat-tern of global investment—measured as gross capital formation1—has changed significantly. Between 1965 and 1999, investment in devel-oping countries held a relatively constant global share—averaging 18.5 percent—but this share increased dramatically in the first decade of the

20 The Emerging Pattern of Global Investment Global Development Horizons
Further, although the investment share of output in developing countries has remained strong after the crisis, it contracted sharply in the developed world. Consequently, there is reason to believe that future saving and investment f lows—and the associated costs of capital—may in fact sta-bilize at levels demonstrably different from those observed today.
By virtue of sheer size, much of the sharp rise in developing countries’ share of global invest-ment can be attributed to China and, to a lesser extent, india. Moreover, with so much of the change in developing-country investment occur-ring in China and india, neglecting to examine their experiences risks obscuring the important dynamics that are taking place there. But even in the absence of these two developing-country giants, the share of global investment accounted for by developing countries has risen steadily since 2000, and currently stands at the high-est level since the mid-1960s (figure 1.3). across developing countries, investment rates have risen significantly from lows in the 1990s—including countries as diverse as Ghana (20 percent in the 1990s to 24 percent in the 2000s), Guatemala (16 percent to 19 percent), and Mongolia (31 percent to 35 percent). looking at the world as a whole, an unmistakable message emerges: the conver-gence of investment performance between the
21st century, reaching about 40 percent by 2009 (figure 1.1, panel b); the change is even starker when one adjusts for differences in purchasing power (as further discussed in box 1.1). Moreover, this convergence in global investment shares has been hastened by the global financial crisis. since 2007, investment has fallen more sharply in high-income countries than in the developing world (figure 1.1, panel a). the growing inf lu-ence of developing countries in the global invest-ment picture has clearly paralleled the emergence of developing countries on the world economic stage.
this convergence in investment shares between developing and high-income countries owes as much to increases in the developing world’s investment rates (figure 1.2, panel a) as it does to their larger size in the global economy (figure 1.2, panel b). although these trends are unlikely to persist indefinitely—the process of deleveraging in europe and the United states fol-lowing the 2007–09 crisis will eventually end, and saving and investment rates will ultimately reach upper limits in the developing world—investment in developing countries appears likely to play a greater global role in the future. indeed, the gap between developing and high-income countries’ investment shares of output has never been greater for any period since the mid-1960s.
High income
High income
DevelopingDeveloping
a. Total gross investment
$ tr
illio
ns
0
6
2
4
8
10b. Share of global investment
Sh
are
of
glo
bal
inve
stm
ent,
%
0
60
20
40
80
100
1965 1970 1975 1980 1985 1990 1995 2000 2005 2010 1965 1970 1975 1980 1985 1990 1995 2000 2005 2010
FIGurE 1.1 Gross investment in developing countries has increased in absolute terms (panel a) and as a share of global investment (panel b)
Source: World Bank calculations, using data in the World Bank World Development Indicators database.Note: Shaded area corresponds to the period from 2000 onward, where a break in the series occurred (a simple linear regression on time in the 1965–99 period for devel-oping countries is I = –0.011t + 21.360, where I is total gross investment and t is the year, while that for the 2000–10 period is I = 0.024t – 49.312; the Chow test F = 52.06 is significant at the 1 percent level).
Global Development Horizons The Emerging Pattern of Global Investment 21
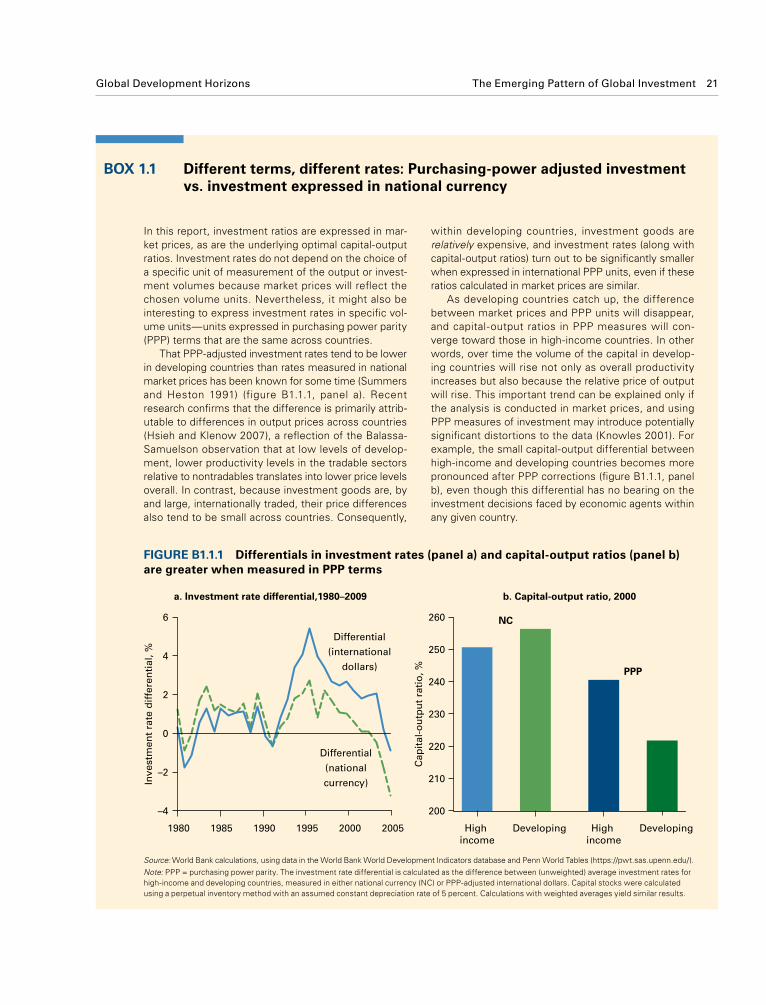
In this report, investment ratios are expressed in mar-ket prices, as are the underlying optimal capital-output ratios. Investment rates do not depend on the choice of a specific unit of measurement of the output or invest-ment volumes because market prices will reflect the chosen volume units. Nevertheless, it might also be interesting to express investment rates in specific vol-ume units—units expressed in purchasing power parity (PPP) terms that are the same across countries.
That PPP-adjusted investment rates tend to be lower in developing countries than rates measured in national market prices has been known for some time (Summers and Heston 1991) (figure B1.1.1, panel a). Recent research confirms that the difference is primarily attrib-utable to differences in output prices across countries (Hsieh and Klenow 2007), a reflection of the Balassa-Samuelson observation that at low levels of develop-ment, lower productivity levels in the tradable sectors relative to nontradables translates into lower price levels overall. In contrast, because investment goods are, by and large, internationally traded, their price differences also tend to be small across countries. Consequently,
within developing countries, investment goods are relatively expensive, and investment rates (along with capital-output ratios) turn out to be significantly smaller when expressed in international PPP units, even if these ratios calculated in market prices are similar.
As developing countries catch up, the difference between market prices and PPP units will disappear, and capital-output ratios in PPP measures will con-verge toward those in high-income countries. In other words, over time the volume of the capital in develop-ing countries will rise not only as overall productivity increases but also because the relative price of output will rise. This important trend can be explained only if the analysis is conducted in market prices, and using PPP measures of investment may introduce potentially significant distortions to the data (Knowles 2001). For example, the small capital-output differential between high-income and developing countries becomes more pronounced after PPP corrections (figure B1.1.1, panel b), even though this differential has no bearing on the investment decisions faced by economic agents within any given country.
Box 1.1 Different terms, different rates: Purchasing-power adjusted investment vs. investment expressed in national currency
FIGurE B1.1.1 Differentials in investment rates (panel a) and capital-output ratios (panel b) are greater when measured in PPP terms
Source: World Bank calculations, using data in the World Bank World Development Indicators database and Penn World Tables (https://pwt.sas.upenn.edu/).Note: PPP = purchasing power parity. The investment rate differential is calculated as the difference between (unweighted) average investment rates for high-income and developing countries, measured in either national currency (NC) or PPP-adjusted international dollars. Capital stocks were calculated using a perpetual inventory method with an assumed constant depreciation rate of 5 percent. Calculations with weighted averages yield similar results.
1980 1985 1990 1995 2000 2005
Differential(international
dollars)
Differential(nationalcurrency)
High income
Developing High income
Developing
a. Investment rate differential,1980–2009
Inve
stm
ent
rate
dif
fere
nti
al, %
–4
2
4
6
–2
0
Cap
ital
-ou
tpu
t ra
tio
, %
200
230
210
220
260
240
250
b. Capital-output ratio, 2000
NC
PPP

22 The Emerging Pattern of Global Investment Global Development Horizons
developing countries continue to struggle with sustaining high levels of investment over time. the upper-middle-income economies of sub-saharan africa, for example, saw an investment takeoff between 1965 and 1980—peaking at 30 percent of GDp in 1978—before falling to annual averages of 15–20 percent (figure 1.4). similarly, investment growth in major emerging economies such as Brazil, Mexico, and turkey has been more modest and gradual.
Globally, investment booms—character-ized by a fairly sharp increase in an economy’s investment rate over just several years—have been somewhat rare phenomena, although some historical episodes did persist over an extended period. an examination of countries that have experienced such booms suggests that such spurts of investment have not, in general, been associ-ated with sustained subsequent economic growth (box 1.2).
some have questioned China’s heavy reliance on investment as an engine of growth, espe-cially when examined in terms of the relatively low-value-added nature of Chinese manufactur-ing (Bardhan 2010). Consequently, if China—along with other high-investment economies—is to sustain a “soft landing” for its current high investment rate, observers have argued that its
FIGurE 1.2 Developing countries’ rising investment rates (panel a) and growing share of global output (panel b) have contributed to their increased share of investment in global output
Source: World Bank calculations, using data in the World Bank World Development Indicators database.Note: The gap between developing and high-income investment is computed as the difference between the two groups’ investment shares of gross domestic product.
High incomeDeveloping
Gap between high-incomeand developing countries(right axis)
High income Developing
a. Investment rate
Inve
stm
ent
rate
, %
Gap
in in
vest
men
t ra
tes,
%15
30
20
25
15
30
35
20
25
–5
10
15
0
5
b. Relative output share
Sh
are
of
glo
bal
ou
tpu
t, %
0
60
20
40
80
10
70
30
50
90
100
1965 1970 1975 1980 1985 1990 1995 2000 2005 20101965 1970 1975 1980 1985 1990 1995 2000 2005 2010
FIGurE 1.3 The rising share of developing countries’ investment in global output is due to more than just changes in China and India
Source: World Bank calculations, using data in the World Bank World Development Indicators database.Note: Shaded area corresponds to the period from 2000 onward, where a break in the series occurred (a simple linear regression on time in the 1965–99 period for the full developing country subsample is I = –0.011t + 21.360, where I is total gross investment and t is the year, while that for the 2000–10 period is I = 0.024 – 49.312; the Chow test F = 52.06 is significant at the 1 percent level.
Developing withoutChina and India
Developing Developingwithout China
1965 1970 1975 1980 1985 1990 1995 2000 2005 2010
Sh
are
of
inve
stm
ent
in g
lob
al o
utp
ut,
%
6
2
4
8
7
3
5
9
developed and developing worlds has definitively begun and is likely to consolidate in the future.
The clear upswing in investment in develop-ing countries as a whole is not to deny that many

Global Development Horizons The Emerging Pattern of Global Investment 23
investment-centric economic growth model must be ultimately accompanied by structural changes to the economy (world Bank 2012a). such struc-tural changes include not only sectoral shifts in investment and production but also more fun-damental changes in terms of financial market development, its economic and sociopolitical institutions, and its financial integration into the global economy.
in sum, it is clear that, since 2000, there has been an unmistakable shift in the pattern of gross capital formation at the worldwide level, with developing countries becoming increasingly important in the global investment picture. This shift appears to have been led by robust economic growth in the developing world relative to the developed world and by greater convergence in investment rates between the two.
FIGurE 1.4 Investment rates among Sub-Saharan African countries of different income levels have followed distinct paths
Source: World Bank calculations, using data in the World Bank World Development Indicators database.Note: Investment rates are the unweighted shares for each income group. GDP-weighted results are qualitatively similar.
Africa average
Upper-middle income, Africa
Lower-middle income, Africa
Low income,Africa
1969 1974 1979 1984 1989 1994 1999 2004 2009
Inve
stm
ent
rate
, % 25
5
15
30
10
20
Investment booms have historically occurred in a broad range of developing and high-income coun-tries (table B1.2.1). However, such booms have not necessarily been accompanied by sustained eco-nomic growth in the aftermath of the boom. Indeed, many economies that have experienced investment booms—defined as any period of steady growth in investment rates lasting for at least three consecutive years—have experienced subsequent weak growth even after the initial postboom period (figure B1.2.1).
Investment-boom economies also include many economies that have remained low- or lower-middle-income. Interestingly, China—which has maintained very high levels of investment since reforms in the 1980s—has not sustained the sorts of investment surges that would justify the label “boom”: rather, the Chinese experience has been one of steady and con-sistent ratcheting up of investment, with occasional pauses. Altogether, there have been at least 38 invest-ment booms over the past half century.
Box 1.2 Investment booms are not always associated with sustained growth
TABlE B1.2.1 Investment booms have occurred in a broad range of developing and high-income countries
Number of booms Economies
1 Albania; Algeria; Azerbaijan; Bahamas, The; Belarus; Botswana; Chad; Côte d’Ivoire; Cameroon; Eritrea; Iceland; Iran, Islamic Rep.; Kazakhstan; Lebanon; Macao SAR, China; Madagascar; Malawi; Malta; Morocco; Pakistan; Papua New Guinea; Philippines; Saudi Arabia; Serbia; Sri Lanka; Thailand; Trinidad and Tobago; Zambia
2 Jordan; Malaysia; Venezuela, RB4 Lesotho
Source: World Bank calculations, using data in the World Bank World Development Indicators database.Note: Investment booms are defined as any three-year episode where the investment share of gross domestic product increased by at least a total of two percentage points, conditional on an initial investment share of at least 10 percent.
(continued)

24 The Emerging Pattern of Global Investment Global Development Horizons
shift can be expected to occur in investment pat-terns. indeed, since 2000, capital formation has gradually moved away from agriculture, and man-ufacturing investment—as a share of global fixed investment—has doubled, rising from 11 percent in 2000 to 22 percent in 2007, even as global investment in agriculture has remained relatively stagnant (of about 9 percent of global fixed invest-ment, roughly half its share in the 1980s).
A shift in sectoral distribution toward manufacturing and services is under way
as an economy’s income level rises, its production structure tends to move away from the predomi-nance of agriculture, toward a larger manufactur-ing base, and eventually to a service-oriented econ-omy. as average income levels rise, an analogous
Some of these investment booms have lasted for fairly long periods. The longest episode was the recent Belarussian boom of 2003–10. As is to be expected, several fast-growing economies have also experienced investment booms: these include República Bolivariana de Venezuela in the 1970s and Malaysia and Thailand in the 1990s. Nevertheless, the conditions underlying investment booms differ across economies: Kazakhstan and Saudi Arabia, for example, experienced booms in
large part due to natural resources, while some booms coincided with significant appreciation in real estate (Belarus and Lebanon) or financial asset markets (Macao SAR, China). Other economies have had booms led by the public sector, such as that of Côte d’Ivoire in the mid-1970s. Finally, some booms were driven by foreign capital inflows, which may give rise to the boom-bust cycles commonly observed in middle-income countries (Tornell and Westermann 2002).
Box 1.2 (continued)
FIGurE B1.2.1 Many countries experience weak growth following an investment boom
Source: World Bank calculations, using data in the World Bank World Development Indicators database.Note: Data are for 1960–2010 preboom (postboom) periods, defined as the GDP growth rate in the four-year period just prior to the boom (the four-year period after the end of the boom). For countries experiencing more than one boom, the reported numbers average the rates across all booms. Investment booms are defined as any three-year episode of at least two percentage points’ growth in investment share of GDP, conditional on an initial investment share of at least 10 percent
Preboom Postboom
BHS MWI VEN LSO MAR LKA ALB CMR JOR PHL THA MYS DZA CIV MLT BWA IRN ERI
Ave
rag
e G
DP
gro
wth
, %
4
0
–1
–2
2
5
1
3
7
8
9
10
6
Global Development Horizons The Emerging Pattern of Global Investment 25
These changes in the sectoral distribution of investment activity will likely be accompanied by gradual improvements in the efficiency of invest-ment. aggregate and sectoral investment figures often obscure the extent to which investment is actually translated into productive capital, and as economies develop, such allocative efficiency will probably rise. estimates of the efficiency of capital use indicate wide variations, both between and within countries (table 1.1).2 in China, the economywide ratio of changes in output for each additional unit of capital deployed (the marginal product of capital, or MpK) averaged 22 percent annually. this is comparable to the MpKs in india, indonesia, and Mexico but is significantly lower than turkey’s MpK (and higher than russia’s)—suggesting that, at the economywide level, investment is more efficiently deployed in turkey (and less efficiently in russia).
taking these estimates at face value, the fairly low MpK of around 10 percent observed for China’s and indonesia’s manufacturing sec-tors (both relative to other economies and within these respective economies) indicates that invest-ment is less efficiently deployed in manufactur-ing than in the agriculture and services sec-tors in these countries. For China, one possible
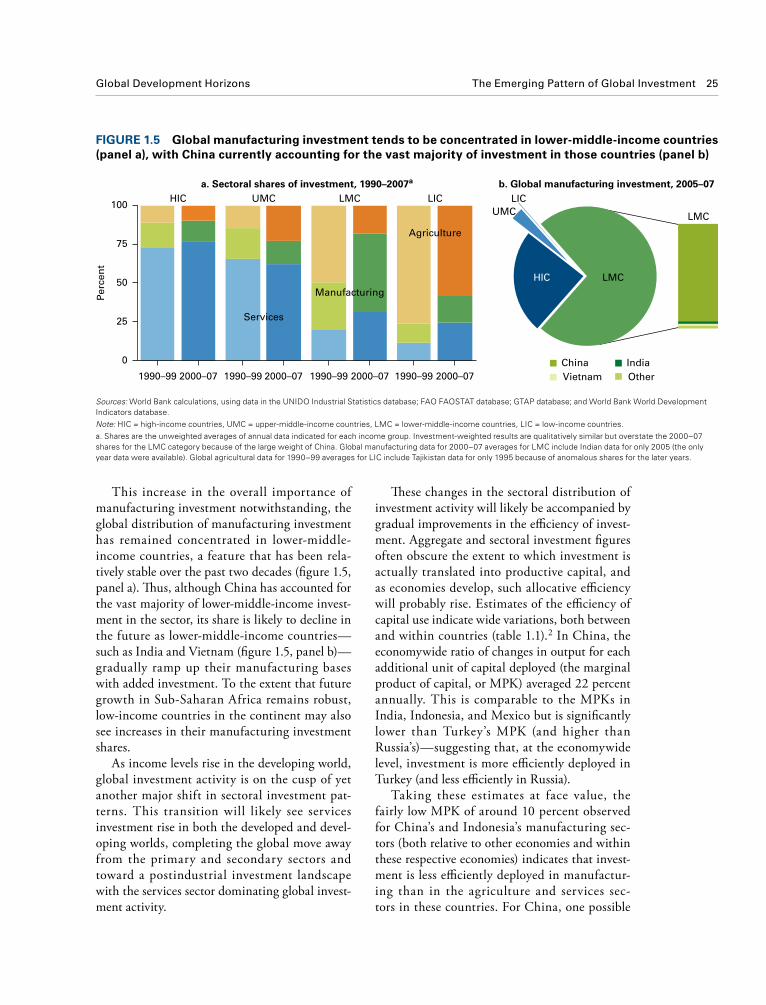
this increase in the overall importance of manufacturing investment notwithstanding, the global distribution of manufacturing investment has remained concentrated in lower-middle-income countries, a feature that has been rela-tively stable over the past two decades (figure 1.5, panel a). Thus, although China has accounted for the vast majority of lower-middle-income invest-ment in the sector, its share is likely to decline in the future as lower-middle-income countries—such as india and vietnam (figure 1.5, panel b)—gradually ramp up their manufacturing bases with added investment. to the extent that future growth in sub-saharan africa remains robust, low-income countries in the continent may also see increases in their manufacturing investment shares.
as income levels rise in the developing world, global investment activity is on the cusp of yet another major shift in sectoral investment pat-terns. this transition will likely see services investment rise in both the developed and devel-oping worlds, completing the global move away from the primary and secondary sectors and toward a postindustrial investment landscape with the services sector dominating global invest-ment activity.
FIGurE 1.5 Global manufacturing investment tends to be concentrated in lower-middle-income countries (panel a), with China currently accounting for the vast majority of investment in those countries (panel b)
Sources: World Bank calculations, using data in the UNIDO Industrial Statistics database; FAO FAOSTAT database; GTAP database; and World Bank World Development Indicators database.Note: HIC = high-income countries, UMC = upper-middle-income countries, LMC = lower-middle-income countries, LIC = low-income countries. a. Shares are the unweighted averages of annual data indicated for each income group. Investment-weighted results are qualitatively similar but overstate the 2000–07 shares for the LMC category because of the large weight of China. Global manufacturing data for 2000–07 averages for LMC include Indian data for only 2005 (the only year data were available). Global agricultural data for 1990–99 averages for LIC include Tajikistan data for only 1995 because of anomalous shares for the later years.
China IndiaVietnam Other
HIC
HIC
UMC LMCUMC
LMC
LMC
LIC LICa. Sectoral shares of investment, 1990–2007a b. Global manufacturing investment, 2005–07
Per
cen
t
0
75
25
50
100
Services
Manufacturing
Agriculture
1990–99 2000–07 1990–99 2000–07 1990–99 2000–07 1990–99 2000–07

26 The Emerging Pattern of Global Investment Global Development Horizons
among developing-country firms. the upshot of this finding is that many potential efficiency gains remain for developing countries to exploit as they grow.
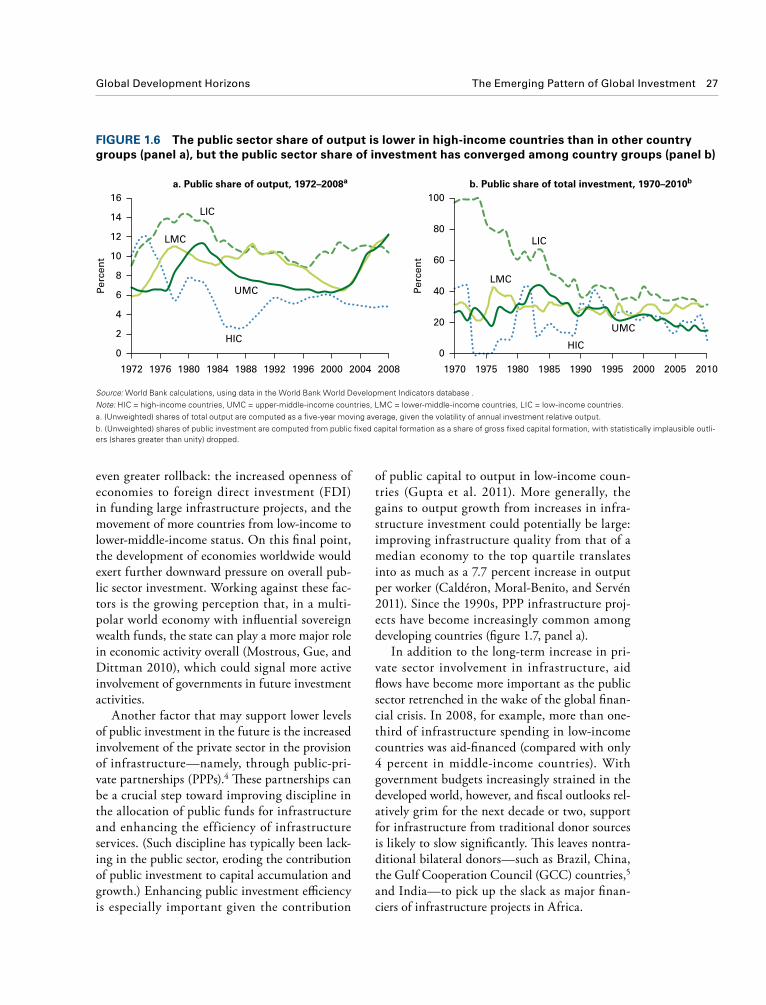
one potential reason for the historical ineffi-ciency of investment in many developing coun-tries may be the preponderance of public sources as the origin of investment activity. public sector investment rates—averaging about 9 percent of total output—are often significantly higher in developing economies relative to high-income countries (figure 1.6, panel a). in low-income countries, in part because of greater infrastruc-ture needs, this share may be even larger; public investment rates in low-income countries aver-age about 2 percentage points higher than in middle-income ones. Moreover, for low-income economies that are commodity exporters, the government often invests directly in the extrac-tive resource industry.
Yet public investment often fails to produce economically valuable capital, and even in cases where public capital can be economically benefi-cial, public investment spending often suffers from severe misallocation problems (pritchett 2000). however, the role of the state in investment has diminished in most developing countries since the 1970s (especially among low-income african countries exiting a “Big push” model)3 (figure 1.6, panel b). Moreover, future trends may support
explanation for this finding is that the high levels of capital formation required for the construction of its world-class assembly plants are ultimately rewarded with relatively less by way of value-added output (Koopman, wang, and wei 2012). in indonesia, governance problems have under-mined the efficiency of investment, especially in projects tied to the public sector (Fisman 2001; olken 2007). india—in spite of its reputation in globally tradable services (Kapur and ramamurti 2001)—possesses an overall service-sector MpK that is not higher than that of its other sectors. in contrast, Brazil’s high MpK in agriculture appears consistent with the overall evidence in favor of the sector’s global competitiveness (rada and Buccola 2012).
to the extent that cross-country variations in MpKs are indicative of the efficiency of capi-tal deployment—with the resulting resource misallocation ref lected in aggregate total fac-tor productivity (tFp) differentials—the mes-sage of low overall efficiency of investment in developing countries is a theme that has found resonance in recent academic research (Caselli and Feyrer 2007). additional estimates for africa (Kalemi-ozcan and sørensen 2012), eastern europe (Bartelsman, haltiwanger, and scarpetta 2009), and China and india (hsieh and Klenow 2009) all point to the presence of significant inefficiencies in capital allocation
TABlE 1.1 There is significant heterogeneity in marginal products of capital, at both economywide and sectoral levels, across developing countries
Brazil China India Indonesia MexicoRussian
Federation Turkey
Economywide 0.17 0.22 0.24 0.26 0.27 0.03 0.48 Agriculture 0.28 0.29 0.19 0.14 0.10 0.03 0.34 Manufacturing — 0.08 0.35 0.11 0.27 — 1.17 Services — 8.78a 0.19 — 0.24 — 0.19
Sources: World Bank calculations, using data in the UNIDO Industrial Statistics dabatase; FAO FAOSTAT database; GTAP database; and World Bank World Development Indicators database.Note: MPK = marginal product of capital, — = not available. Unless otherwise indicated, data are for 1991–2007. MPKs are computed as the capital output elasticity-weighted ratio of output to capital stock, computed for a sector j (or economywide) in year t from the formula MPKjt = ajYjt /Kjt , where Y and K are gross domestic product (GDP) and the capital stock formation, respectively, and a is computed from the share of compensation to physical capital in that sector (or economywide), excluding natural capital. Sectoral GDPs are computed from sectoral value-added shares of total GDP. Capital stocks are calculated from sectoral investment using a perpetual inventory method with an assumed constant depreciation rate of 5 percent. In most cases, annual data for manufacturing and services are not available for the full period, and reported MPKs are computed from available data. The computation excludes the years 1998–99 (financial crisis) for Brazil; years prior to 1996 (transition) and 1999–2000 (financial crisis) for Russia; 1997–98 (financial crisis) for Indonesia; 1994 (financial crisis) for Mexico; and 1999–2000 (financial crisis) for Turkey. a. Because no data are directly available for investment in services, the figures for service sector investment were recovered as the residual of total investment and investment in the other two sectors. Consequently, very large service MPKs (as for China) may be the result of underestimating service sector investment rather than actual high levels of efficiency in the sector.
Global Development Horizons The Emerging Pattern of Global Investment 27
of public capital to output in low-income coun-tries (Gupta et al. 2011). More generally, the gains to output growth from increases in infra-structure investment could potentially be large: improving infrastructure quality from that of a median economy to the top quartile translates into as much as a 7.7 percent increase in output per worker (Caldéron, Moral-Benito, and servén 2011). since the 1990s, ppp infrastructure proj-ects have become increasingly common among developing countries (figure 1.7, panel a).
in addition to the long-term increase in pri-vate sector involvement in infrastructure, aid flows have become more important as the public sector retrenched in the wake of the global finan-cial crisis. in 2008, for example, more than one-third of infrastructure spending in low-income countries was aid-financed (compared with only 4 percent in middle-income countries). with government budgets increasingly strained in the developed world, however, and fiscal outlooks rel-atively grim for the next decade or two, support for infrastructure from traditional donor sources is likely to slow significantly. This leaves nontra-ditional bilateral donors—such as Brazil, China, the Gulf Cooperation Council (GCC) countries,5 and india—to pick up the slack as major finan-ciers of infrastructure projects in africa.
even greater rollback: the increased openness of economies to foreign direct investment (FDi) in funding large infrastructure projects, and the movement of more countries from low-income to lower-middle-income status. on this final point, the development of economies worldwide would exert further downward pressure on overall pub-lic sector investment. working against these fac-tors is the growing perception that, in a multi-polar world economy with influential sovereign wealth funds, the state can play a more major role in economic activity overall (Mostrous, Gue, and Dittman 2010), which could signal more active involvement of governments in future investment activities.
another factor that may support lower levels of public investment in the future is the increased involvement of the private sector in the provision of infrastructure—namely, through public-pri-vate partnerships (ppps).4 These partnerships can be a crucial step toward improving discipline in the allocation of public funds for infrastructure and enhancing the efficiency of infrastructure services. (such discipline has typically been lack-ing in the public sector, eroding the contribution of public investment to capital accumulation and growth.) enhancing public investment efficiency is especially important given the contribution
FIGurE 1.6 The public sector share of output is lower in high-income countries than in other country groups (panel a), but the public sector share of investment has converged among country groups (panel b)
Source: World Bank calculations, using data in the World Bank World Development Indicators database .Note: HIC = high-income countries, UMC = upper-middle-income countries, LMC = lower-middle-income countries, LIC = low-income countries. a. (Unweighted) shares of total output are computed as a five-year moving average, given the volatility of annual investment relative output. b. (Unweighted) shares of public investment are computed from public fixed capital formation as a share of gross fixed capital formation, with statistically implausible outli-ers (shares greater than unity) dropped.
HICHIC
UMC
UMC
LMC
LMC LIC
LIC
a. Public share of output, 1972–2008a
Per
cen
t
0
6
2
4
8
10
12
14
16b. Public share of total investment, 1970–2010b
Per
cen
t
0
60
20
40
80
100
1972 1976 1980 1984 1988 1992 1996 2000 2004 2008 1970 1975 1980 1985 1990 1995 2000 2005 2010

28 The Emerging Pattern of Global Investment Global Development Horizons
american economies, infrastructure investment as a share of GDp collapsed in the late 1980s and early 1990s and has remained subdued in the years since, the exception being Chile (figure 1.8).
this could suggest that private and public investments in infrastructure are complements rather than substitutes (Calderón and servén 2010). The limited global success of private pro-vision of important public goods is a cautionary tale against a rush into ppps in other areas where the state has historically played a central investing role, such as human capital (box 1.3).
perhaps the biggest challenge facing ppp-based infrastructure financing is how, historically, such financing has been an enormously complex process. Financing large-scale infrastructure proj-ects typically involves multiple financing sources, numerous public and private contracting parties, intricate legal documentation governed by both national and international laws, and difficult con-tracting and institutional design problems.
The complexity of the multiparty, multimodal approach to infrastructure f inancing is evi-dent, for example, in the largest energy projects recently undertaken in the Middle east (box 1.4). the contours of infrastructure financing have
For all their benefits, ppp projects remain, at this time, limited in their ability to meet com-prehensive infrastructure needs, with most projects limited to the telecommunications and energy sectors. one reason for this is that private investment commitments have been heavily con-centrated; the energy and telecommunications sectors have clearly benefited the most from the increase in private investment (figure 1.7, panel b). in low-income countries, three-quarters of ppp commitments have been in telecommuni-cations, as opposed to a shade less than half for middle-income countries. This concentration can also be seen geographically, with the major devel-oping countries often accounting for more than half of all ppp projects in a typical year. india has been the top recipient of private sector flows in infrastructure since 2006, followed by Brazil, China, russia, and turkey.6
Moreover, on net, private investment in infra-structure often has not offset declines in public sector investment, leading to cases, such as in pakistan and south africa, where infrastructure investment in terms of GDp plummeted as pub-lic sector investment declined (Commission on Growth and Development 2008). in major latin
FIGurE 1.7 Private sector commitments to infrastructure have risen over time, both in major developing countries (panel a) and across most infrastructure subsectors (panel b)
Source: World Bank calculations, using data in the World Bank Private Participation in Infrastructure database.Note: PPP = public-private partnership.a. Data for total global distribution for 2000–10 (panel b) have been adjusted for U.S. Consumer Price Index inflation and are given in real 2005 dollars.
Water Transport
Telecommunications EnergyCountries with new projects (right axis)
Other developingBrazilChinaIndiaRussian FederationTurkey
a. PPP infrastructure investment, selecteddeveloping countries, 2000–10
b. Global PPP infrastructure projects,by sector, 1984–2010a
2005
$ b
illio
ns
Co
un
trie
s, n
o.
0
80
120
40
160
180
0
30
10
20
40
70
50
60
$ b
illio
ns
–10
30
70
130
10
110
50
90
150
170
2000 2002 2004 2006 2008 2010 1984 1987 1990 1993 1996 1999 2002 2005 2008

Global Development Horizons The Emerging Pattern of Global Investment 29
capital (measured using the perpetual inventory method),8 was largely concentrated in the devel-oped world, especially in the United states and western europe (map 1.1). By 1995, this situation had begun to change, with several large develop-ing economies, such as Brazil and China, accumu-lating stocks comparable to those of high-income countries. The latest data suggest that this shift has further consolidated. today, Brazil, China, india, and russia together account for about 18 percent of the global share of capital, more than twice the share of Germany and near that of the United states.
The process is far from complete: a normalized herfindahl index of capital stocks has fallen only modestly—from a high of 0.08 in the late 1980s to a low of 0.07 of 2010—compared with a larger fall in the analogous normalized herfindahl of production (a decline from 0.13 to 0.10). this slow evolution of the herfindahl points to the high concentration of capital and wealth that continues to reside in the industrialized high-income countries, a ref lection of the legacy of capital accumulation that occurred over the 19th and 20th centuries. nevertheless, the process of a gradually less unequal global distribution of capi-tal should continue in the future as developing economies grow in size and absolute investment flows into their domestic capital stocks rise.
also changed gradually over the past decade, with bond issuance replacing traditional bank loans, and banks based in emerging economies now becoming major intermediaries in the infrastruc-ture sector. The challenges facing infrastructure financing in the future will be revisited later in this chapter.
in sum, sectoral investment patterns also imply changing patterns since 2000, with a shift in global investment away from agriculture toward manufacturing, and a gradual reduction of the role of public sector investment in devel-oping countries. The world appears to be on the cusp of yet another shift in investment patterns, this time toward an increased emphasis on the services sector. The expanded role of the services sector will likely be manifested in a host of invest-ment activities, ranging from services related to greater human capital production to an expan-sion of infrastructure in the developing world.
A gradual redistribution of global capital stocks has occurred in recent decades
the ongoing shift in the distribution of global investment shares has meant that the exist-ing stock of productive physical capital has also been changing over time.7 in 1980, global
FIGurE 1.8 Infrastructure investment shares of GDP declined rapidly in major latin American economies in the late 1980s and have remained subdued in subsequent years
Source: World Bank calculations, using data from Calderón and Servén 2010.Note: The six Latin American economies covered in the figure are Argentina, Brazil, Chile, Colombia, Mexico, and Peru.
Private share Infrastructure investment (right axis)Public share
0
40
20
60
80
100
0
1
2
3
4
5
1980 1983 1986 1989 1992 1995 1998 2001 2004
Sh
are
of
infr
astr
uct
ure
inve
stm
ent,
%
Infr
astr
uct
ure
inve
stm
ent
as s
har
e o
f G
DP
, %
30 The Emerging Pattern of Global Investment Global Development Horizons
diminished, the greater abundance of capital in high-income countries need not signify that capi-tal has been inefficiently distributed. Capital must, ultimately, be paired with labor (and other inputs)
although the distribution of stocks of capital provides an important sense of the cumulative investment that would be required before the global inequality in the distribution of capital is
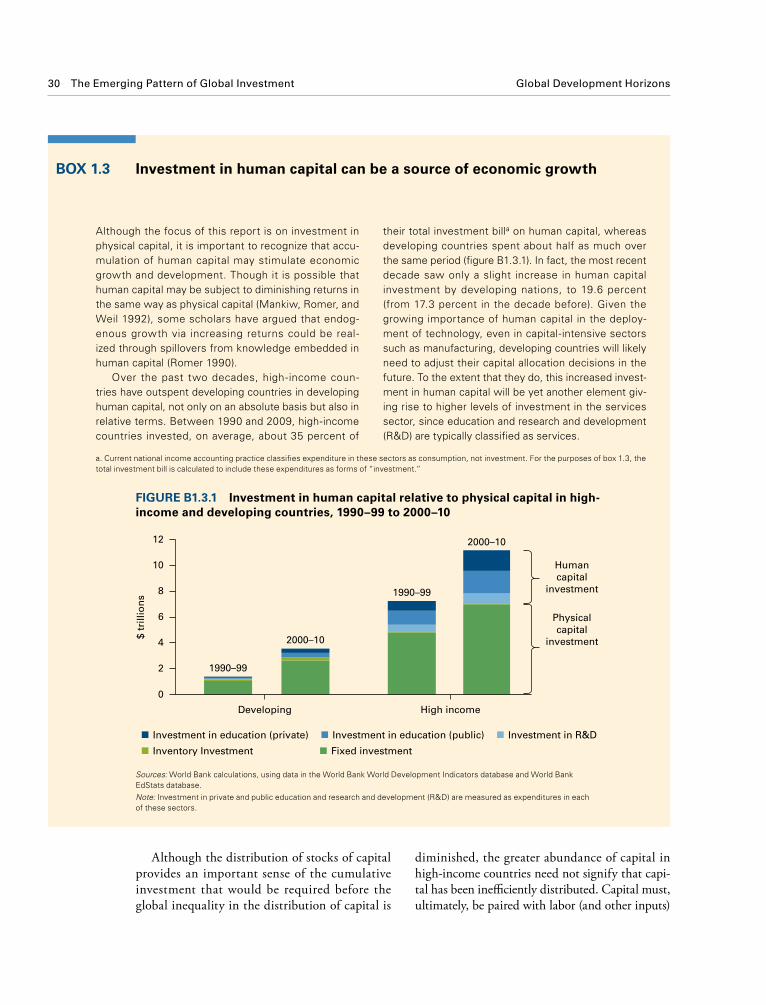
Although the focus of this report is on investment in physical capital, it is important to recognize that accu-mulation of human capital may stimulate economic growth and development. Though it is possible that human capital may be subject to diminishing returns in the same way as physical capital (Mankiw, Romer, and Weil 1992), some scholars have argued that endog-enous growth via increasing returns could be real-ized through spillovers from knowledge embedded in human capital (Romer 1990).
Over the past two decades, high-income coun-tries have outspent developing countries in developing human capital, not only on an absolute basis but also in relative terms. Between 1990 and 2009, high-income countries invested, on average, about 35 percent of
their total investment billa on human capital, whereas developing countries spent about half as much over the same period (figure B1.3.1). In fact, the most recent decade saw only a slight increase in human capital investment by developing nations, to 19.6 percent (from 17.3 percent in the decade before). Given the growing importance of human capital in the deploy-ment of technology, even in capital-intensive sectors such as manufacturing, developing countries will likely need to adjust their capital allocation decisions in the future. To the extent that they do, this increased invest-ment in human capital will be yet another element giv-ing rise to higher levels of investment in the services sector, since education and research and development (R&D) are typically classified as services.
Box 1.3 Investment in human capital can be a source of economic growth
FIGurE B1.3.1 Investment in human capital relative to physical capital in high-income and developing countries, 1990–99 to 2000–10
Sources: World Bank calculations, using data in the World Bank World Development Indicators database and World Bank EdStats database.Note: Investment in private and public education and research and development (R&D) are measured as expenditures in each of these sectors.
Investment in education (private) Investment in education (public) Investment in R&D
Inventory Investment Fixed investment
0
2
4
6
8
Humancapital
investment
Physicalcapital
investment
10
12
1990–99
2000–10
1990–99
2000–10
Developing High income
$ tr
illio
ns
a. Current national income accounting practice classifies expenditure in these sectors as consumption, not investment. For the purposes of box 1.3, the total investment bill is calculated to include these expenditures as forms of “investment.”
Global Development Horizons The Emerging Pattern of Global Investment 31
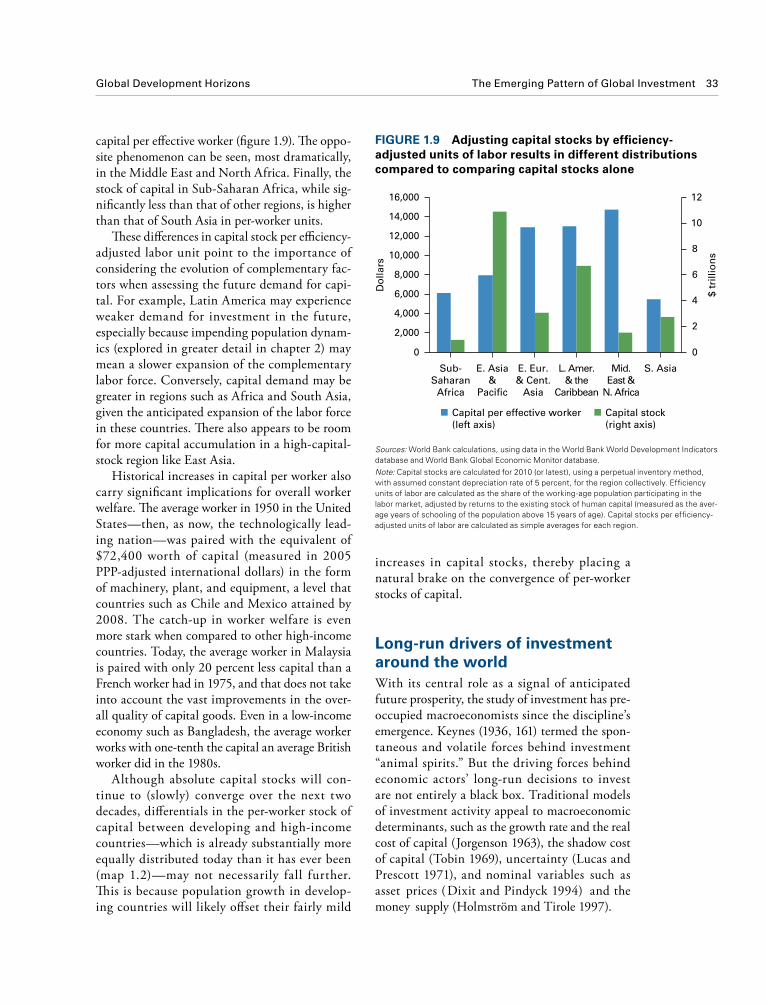
message than a focus on stocks alone. The east asia and pacific region, for instance, has the largest stock of capital, mainly due to the size of China. once the capital stock is adjusted for efficient units of labor, however, the region falls into the lower half of the distribution in terms of
for the purposes of production; a given country would only be “capital-starved” if there existed a significant imbalance between available capital and labor (adjusted for human capital differentials).
thus, the distribution of such efficiency-adjusted capital stocks may offer a different
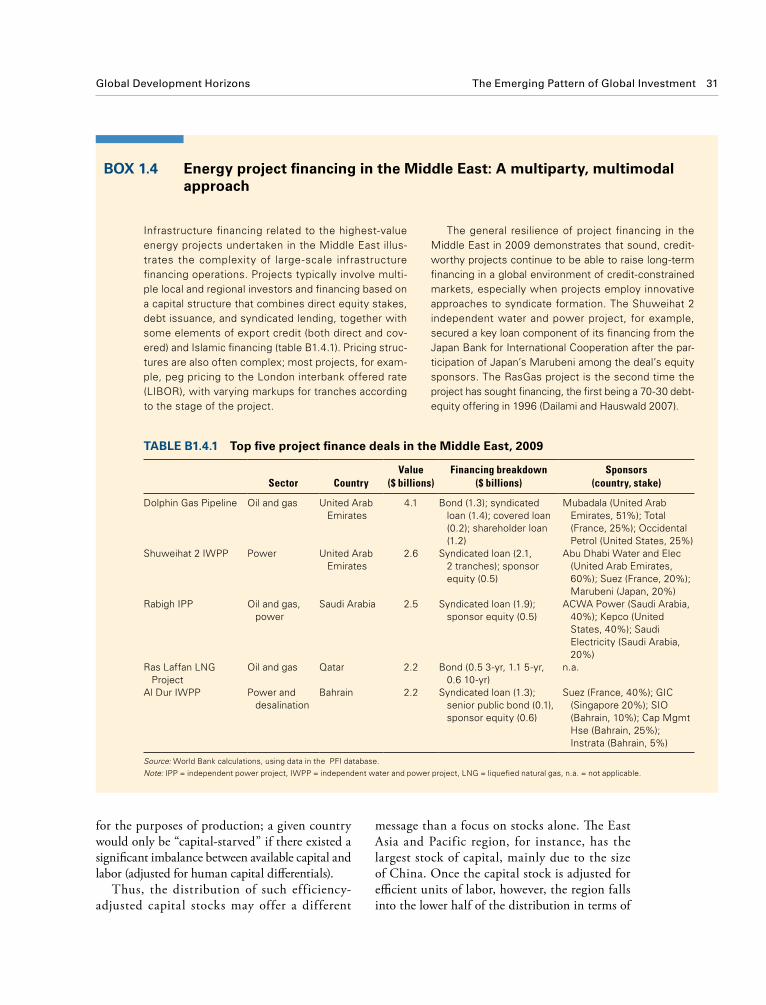
Infrastructure financing related to the highest-value energy projects undertaken in the Middle East illus-trates the complexity of large-scale infrastructure financing operations. Projects typically involve multi-ple local and regional investors and financing based on a capital structure that combines direct equity stakes, debt issuance, and syndicated lending, together with some elements of export credit (both direct and cov-ered) and Islamic financing (table B1.4.1). Pricing struc-tures are also often complex; most projects, for exam-ple, peg pricing to the London interbank offered rate (LIBOR), with varying markups for tranches according to the stage of the project.
The general resilience of project financing in the Middle East in 2009 demonstrates that sound, credit-worthy projects continue to be able to raise long-term financing in a global environment of credit-constrained markets, especially when projects employ innovative approaches to syndicate formation. The Shuweihat 2 independent water and power project, for example, secured a key loan component of its financing from the Japan Bank for International Cooperation after the par-ticipation of Japan’s Marubeni among the deal’s equity sponsors. The RasGas project is the second time the project has sought financing, the first being a 70-30 debt-equity offering in 1996 (Dailami and Hauswald 2007).
Box 1.4 Energy project financing in the Middle East: A multiparty, multimodal approach
TABlE B1.4.1 Top five project finance deals in the Middle East, 2009
Sector CountryValue
($ billions)Financing breakdown
($ billions)Sponsors
(country, stake)
Dolphin Gas Pipeline Oil and gas United Arab Emirates
4.1 Bond (1.3); syndicated loan (1.4); covered loan (0.2); shareholder loan (1.2)
Mubadala (United Arab Emirates, 51%); Total (France, 25%); Occidental Petrol (United States, 25%)
Shuweihat 2 IWPP Power United Arab Emirates
2.6 Syndicated loan (2.1, 2 tranches); sponsor equity (0.5)
Abu Dhabi Water and Elec (United Arab Emirates, 60%); Suez (France, 20%); Marubeni (Japan, 20%)
Rabigh IPP Oil and gas, power
Saudi Arabia 2.5 Syndicated loan (1.9); sponsor equity (0.5)
ACWA Power (Saudi Arabia, 40%); Kepco (United States, 40%); Saudi Electricity (Saudi Arabia, 20%)
Ras Laffan LNG Project
Oil and gas Qatar 2.2 Bond (0.5 3-yr, 1.1 5-yr, 0.6 10-yr)
n.a.
Al Dur IWPP Power and desalination
Bahrain 2.2 Syndicated loan (1.3); senior public bond (0.1), sponsor equity (0.6)
Suez (France, 40%); GIC (Singapore 20%); SIO (Bahrain, 10%); Cap Mgmt Hse (Bahrain, 25%); Instrata (Bahrain, 5%)
Source: World Bank calculations, using data in the PFI database. Note: IPP = independent power project, IWPP = independent water and power project, LNG = liquefied natural gas, n.a. = not applicable.

32 The Emerging Pattern of Global Investment Global Development Horizons
MAP 1.1 The geographical distribution of capital stocks has gradually shifted to developing countries over the past three decades
Sources: World Bank calculations, using data in the World Bank World Development Indicators database and World Bank Global Economic Monitor database.Note: Capital stocks are calculated using a perpetual inventory method with assumed constant depreciation rate of 5 percent. Countries with insuf-ficient data in the constant investment series are backcasted using a regression of the investment deflator on the GDP deflator and available invest-ment data. Data for the 2010 chart are either for 2010 or the latest year since 2006.
ibrd 40012april 2013
Capital stock (constant 2000 $ billions)
1980
> $2,500$1,000–$2,500$500–$1,000$100–$500$50–$100$20–$50$10–$20< $10
no data
1995
2010
Global Development Horizons The Emerging Pattern of Global Investment 33
increases in capital stocks, thereby placing a natural brake on the convergence of per-worker stocks of capital.
long-run drivers of investment around the worldwith its central role as a signal of anticipated future prosperity, the study of investment has pre-occupied macroeconomists since the discipline’s emergence. Keynes (1936, 161) termed the spon-taneous and volatile forces behind investment “animal spirits.” But the driving forces behind economic actors’ long-run decisions to invest are not entirely a black box. traditional models of investment activity appeal to macroeconomic determinants, such as the growth rate and the real cost of capital (Jorgenson 1963), the shadow cost of capital (tobin 1969), uncertainty (lucas and prescott 1971), and nominal variables such as asset prices ( Dixit and pindyck 1994) and the money supply (holmström and tirole 1997).
capital per effective worker (figure 1.9). The oppo-site phenomenon can be seen, most dramatically, in the Middle east and north africa. Finally, the stock of capital in sub-saharan africa, while sig-nificantly less than that of other regions, is higher than that of south asia in per-worker units.
These differences in capital stock per efficiency- adjusted labor unit point to the importance of considering the evolution of complementary fac-tors when assessing the future demand for capi-tal. For example, latin america may experience weaker demand for investment in the future, especially because impending population dynam-ics (explored in greater detail in chapter 2) may mean a slower expansion of the complementary labor force. Conversely, capital demand may be greater in regions such as africa and south asia, given the anticipated expansion of the labor force in these countries. There also appears to be room for more capital accumulation in a high-capital-stock region like east asia.
historical increases in capital per worker also carry significant implications for overall worker welfare. The average worker in 1950 in the United states—then, as now, the technologically lead-ing nation—was paired with the equivalent of $72,400 worth of capital (measured in 2005 ppp-adjusted international dollars) in the form of machinery, plant, and equipment, a level that countries such as Chile and Mexico attained by 2008. the catch-up in worker welfare is even more stark when compared to other high-income countries. today, the average worker in Malaysia is paired with only 20 percent less capital than a French worker had in 1975, and that does not take into account the vast improvements in the over-all quality of capital goods. even in a low-income economy such as Bangladesh, the average worker works with one-tenth the capital an average British worker did in the 1980s.
although absolute capital stocks will con-tinue to (slowly) converge over the next two decades, differentials in the per-worker stock of capital between developing and high-income countries—which is already substantially more equally distributed today than it has ever been (map 1.2)—may not necessarily fall further. This is because population growth in develop-ing countries will likely offset their fairly mild
FIGurE 1.9 Adjusting capital stocks by efficiency-adjusted units of labor results in different distributions compared to comparing capital stocks alone
Sources: World Bank calculations, using data in the World Bank World Development Indicators database and World Bank Global Economic Monitor database.Note: Capital stocks are calculated for 2010 (or latest), using a perpetual inventory method, with assumed constant depreciation rate of 5 percent, for the region collectively. Efficiency units of labor are calculated as the share of the working-age population participating in the labor market, adjusted by returns to the existing stock of human capital (measured as the aver-age years of schooling of the population above 15 years of age). Capital stocks per efficiency-adjusted units of labor are calculated as simple averages for each region.
Capital stock(right axis)
Capital per effective worker(left axis)
0
4,000
2,000
6,000
8,000
10,000
12,000
14,000
16,000
0
2
4
6
8
10
12
Sub-Saharan
Africa
E. Asia&
Pacific
E. Eur.& Cent.
Asia
L. Amer.& the
Caribbean
Mid.East &
N. Africa
S. AsiaD
olla
rs
$ tr
illio
ns

34 The Emerging Pattern of Global Investment Global Development Horizons
more investment from abroad. although increases in investment need not automatically trans-late into economic growth (easterly and levine 2001),9 greater investment is naturally associated with heightened economic activity because firms respond to anticipated future profit opportunities by raising investment today. productivity gains drive heightened growth and investment activ-ity, inciting lasting structural transformations in the broader economy. The relationship between growth and investment can be substantial: econo-metric estimates suggest that, all else equal, each additional percentage point of growth is associ-ated with a 0.2 percentage point increase in the investment rate.
Structural factors are important drivers of changes in the allocation of investment financing
however, given the heterogeneity of developing countries’ experience with investment, even for economies growing at similar rates, it is clear that economicgrowth alone does not fully explain all aggregate investment activity. The opportu-nity cost of undertaking any given investment
at the global level, investment is ultimately constrained by saving. this accounting fact implies that independent changes in global saving patterns will directly affect the extent of global investment activity. were there to be reductions in global saving in the years ahead, for instance, this would imply reductions in world investment as well. nevertheless, a single-minded focus on the global saving supply would leave open the cru-cial question of how, given this supply of saving, global investment is subsequently allocated across countries. This allocation into global portfolios of investments is subject to two countervailing forces that may suppress investment activity in any given economy: disincentives for additional domestic investment, arising from diminishing returns (Kraay et al. 2006); and frictions imped-ing mobility of capital across national borders, both of which give rise to differences in expected returns across countries. Understanding what drives such cross-country differences in expected returns is key to predicting the ability of econo-mies to attract investment financing.
Differences in macroeconomic growth, in par-ticular, are a central part of the story. economies that grow faster tend to invest more and attract
MAP 1.2 Capital stocks per worker are now more equally distributed than ever before
Source: World Bank calculations, using data in the Penn World Tables (https://pwt.sas.upenn.edu/).Note: Data are for 2009. Capital stocks are calculated using a perpetual inventory method with assumed constant depreciation rate of 5 percent, and presented in thousands of 2005 (Geary-Khamis) international dollars.
ibrd 40013april 2013
Capital per worker(constant 2005 international $ ‘000)
> $200$100–$200$60–$100$40–$60$25–$40$10–$25$5–$10< $5
no data

Global Development Horizons The Emerging Pattern of Global Investment 35
percent increase in financial development, invest-ment can rise as much as 3.3 percent.
investment is also positively associated with the overall quality of the institutional environ-ment (figure 1.11). on this account, developing countries have made significant strides over the past decade: between 1996 and 2010, developing countries’ control of corruption and rule of law advanced by about 4 percent, while that in the developed world slid by about 1 percent, accord-ing to the world Bank’s worldwide Governance indicators.12 although governance challenges remain an issue for developing countries, these improvements could well make a difference to their likely investment paths in the future. econometric analyses indicate that real invest-ment activity, even after controlling for a host of other intervening factors, remains statistically significant (figure 1.11) and can rise by as much as 1.6 percent for each 10 percent increase in institutional quality.
Finally, the openness of a country’s borders to foreign capital inflows can also increase domes-tic investment. as individual economies become more integrated into the global economy, future investment—especia lly in the smaller and poorer economies—may be increasingly led by such FDi. Cross-border capital movements (still) remain a small fraction of what would be implied in a world with more frictionless global capital markets (lucas 1990), but if financial globalization were to proceed at the pace of the past two decades, patterns of capital flows could be dramatically affected, as discussed in chapter 3.
Investor sentiment is a key driver shaping future investment dynamics
one way of interpreting Keynes’s “animal spir-its” behind investment is that such spirits may also embody expectations surrounding future investment dynamics. such investor sentiment is ultimately based on expectations formed with regard to both future growth prospects and uncertainty surrounding those prospects. These expectations are not easily captured in econo-metric analyses of observable variables, but the
activity lies, ultimately, in the attractiveness of other available investment opportunities world-wide, and this attractiveness is embodied in these alternative investments’ expected returns to capi-tal. such expected return differentials are attrib-utable not just to differences in countries’ eco-nomic growth. of central importance is also the yield on capital an economy offers relative to oth-ers.10 Finally, cross-country differences in struc-tural factors—in particular their levels of finan-cial development and the overall quality of their institutional environments—can also affect the expected returns from investing in a given coun-try because such structural factors can also dis-tinguish the developmental fortunes of nations.11
two structural factors are especially important in negatively influencing investment financing: low levels of financial development and inadequa-cies in institutional quality. together, these fac-tors give rise to (real or perceived) shortages of safe, investible assets (Caballero 2008). This is a chronic problem in emerging economies and can engender instabilities that go beyond the country’s borders: the pursuit of safe investment opportu-nities can suppress long-term real interest rates, decrease the efficiency of global saving allocation, ignite speculative bubbles in safe asset-generating countries, and contribute to unsustainable global imbalances (Caballero, Farhi, and Gourinchas 2008). overall, the empirical evidence supports the notion that structural factors are central to determining the amount of investment financ-ing a country can attract, and it offers a poten-tial explanation of why cross-country patterns of investment differ as much as they do (box 1.5).
The importance of these two factors on actual investment activity is evident from the cross-country data. as countries grow, they also tend to yield more mature and sophisticated finan-cial systems; this increased level of financial development, in turn, appears to move together with changes in investment rates. This relation-ship is especially striking for developing coun-tries, although changes in credit provision have historically followed investment rates closely for high-income countries as well, with the excep-tion of the period after 2000, when credit provi-sion grew sharply in the developed world (figure 1.10). econometric analyses suggest that, for a 10

36 The Emerging Pattern of Global Investment Global Development Horizons
investment.14 values of Q significantly above unity are suggestive of optimism regarding future investment opportunities, and vice versafor values significantly below one. Computations of tobin’s Q for developing countries suggest that investors anticipate continued positive growth prospects for many developing economies (box 1.6).
another alternative way of attempting to cap-ture the importance of investor sentiment is to examine the effect that even temporary shocks to uncertainty can have on future investment.
role of investor sentiment can be teased out in other ways. Consequently, although the linkage model used in this report for scenario analyses does not explicitly model the effect of investor sentiment, several other approaches offer hints about the role that sentiment can play in shaping future investment in developing countries.
one such approach is to examine the implicit (or shadow) cost of capital, as measured by tobin’s Q.13 estimates of tobin’s Q point to financial market participants’ conditional forecasts of
Traditional models of investment typically rely on stan-dard macroeconomic determinants—such as output, economic growth, and the real cost of capital—to explain investment activity. However, macroeconomic variables are subject to cyclical shocks of a short-term nature, and such models may end up capturing fac-tors whose effects may dissipate over the longer run. Just as important, these older models do not capture the potential effects of informational asymmetries and incomplete markets, a shortcoming that has been remedied by more recent models of investment.
The important role of uncertainty and market imper-fections highlighted by these more recent studies hint at the need to consider how structural variables can affect aggregate investment at the cross-country level. After all, such frictions often find root in struc-tural changes such as differences in the ability of the financial sector to intermediate saving (Dailami 1992), the legal frameworks that govern contract enforcement (Cooley, Marimon, and Quadrini 2004), and property rights more generally (Besley 1995), along with the broader business climate and political-institutional envi-ronment (Acemoglu, Johnson, and Robinson 2005). Economic openness, so crucial to the medium-term current account, may also affect long-run investment activity (Chinn and Prasad 2003).
Differences in such structural factors can potentially alter the flow of investment financing received by any given country. Three major considerations must be taken into account in any successful model that seeks to explain such cross-country investment patterns. First, the approach should incorporate, at its core, cross- country differentials in interest rates. Second, to account
for additional factors affecting expected returns (but not fully reflected in interest rates), the model should be supplemented by economic and structural variables that may differ systematically between countries. Third, the approach should account for the significant heterogene-ity that may occur in unobservable variables, along with the potential endogeneity in the explanatory variables. Although no single model can simultaneously address these distinct considerations, this report relies on sev-eral econometric approaches to specify a range of plau-sible coefficients for the main variables of interest.
The formal analyses (reported in the online Global Development Horizons [GDH ] annex 1.3) suggest that although not all structural variables exert a systematic impact on the cross-country allocation of investment financing, some clearly do. One important factor is the role of financial development: as the level of financial development increases, investment tends to rise as well. This is consistent with the literature (Benhabib and Spiegel 2000; Levine 2005; World Bank 2012b), which finds that financial development has a causal influence on, among other things, capital formation. The overall institutional environment appears to be important for driving investment as well. For example, Mauro (1995) has demonstrated that widespread corruption causes lower levels of investment at the cross-country level, while Besley (1995), using the case of Ghana, has shown that the same applies to the strength of the property rights regime. More generally, strong, posi-tive relationships tend to exist between institutions and investment growth (Acemoglu, Johnson, and Robinson 2005), especially those that are supportive of economic freedom (Dawson 1998).
Box 1.5 Structural factors can affect the cross-country allocation of investment financing

Global Development Horizons The Emerging Pattern of Global Investment 37
This is especially pertinent given how the global financial crisis of 2007–09 is often associated with decreased investor confidence. the logic behind this mechanism is well understood: capi-tal investment is essentially a decision on when to exercise an option on an irreversible project, contingent on uncertainty about its future prof-itability (Dixit and pindyck 1994; McDonald and siegel 1986).15 Therefore, increased uncer-tainty about future economic prospects may dampen aggregate investment as firms retain their option value by postponing capital forma-tion decisions.16 large variations in uncertainty alone may be sufficient to freeze investment activity and generate sharp recessions, indepen-dent of productivity shocks (Bloom 2009), and may have an effect even when realized real inter-est rates themselves remain constant (Fernández-villaverde et al. 2011). By and large, empiri-cal studies have found that uncertainty does have a corrosive effect on investment (Carruth, Dickerson, and henley 2000). For developing countries, the effect of uncertainty is likely to be especially pronounced for macroeconomic vola-tility (aizenman and Marion 1999), uncertainty regarding the real exchange rate (servén 2003), and commodity price f luctuations (Claessens and Duncan 1993).
FIGurE 1.10 Investment rates and financial sector development in developed and developing countries have evolved similarly
Sources: World Bank calculations, using data in the World Bank World Development Indicators database and Financial Development and Structure database.Note: Investment rate is defined as the fixed investment share of GDP, while change in financial development is defined as the three-year moving average of the annual change in the ratio of domestic credit provision to the private sector as a share of GDP; both ratios are unweighted averages for the two country groups.
Financial development(developing, right axis)
Investment rate(high income)
Investment rate(developing)
Financial development(high income,right axis)
0
5
10
15
20
25
30
1963 1968 1973 1978 1983 1988 1993 1998 2003 2008
–2
–1
0
1
2
3
4
5
6
7
8
Fixe
d in
vest
men
t sh
are
of
GD
P, %
.
Cre
dit
sh
are
of
GD
P, %
the deleterious effects of uncertainty are not limited to the short run. simulations of the response of investment to a transient shock arising from economic uncertainty show that
FIGurE 1.11 A positive relationship exists between investment and institutional quality
Sources: World Bank calculations, using data in the World Bank World Development Indicators database and Financial Development and Structure database.Note: Data are pooled for all countries over the period 1980–2010. The figure is a bivariate plot of real fixed investment and institutional quality, with linear regression line. Investment rate is defined as fixed investment in 2000 dollars, and institutional quality is the simple average of (subjective) measures of corruption and rule of law. Both variables are in logarithm form, are unweighted, and are significant in both bivariate and multivariate regressions at standard levels.
15
20
25
30
Rea
l fixe
d in
vest
men
t
0 0.5 1.0 1.5 2.0 2.5
Institutional quality
38 The Emerging Pattern of Global Investment Global Development Horizons
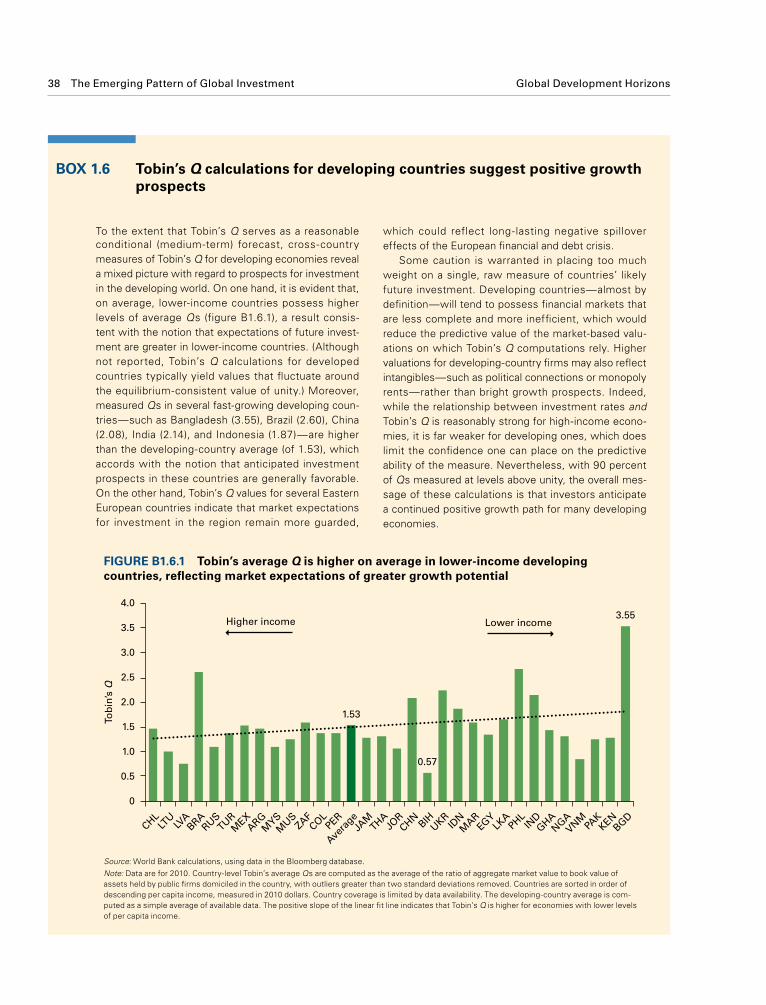
To the extent that Tobin’s Q serves as a reasonable conditional (medium-term) forecast, cross-country measures of Tobin’s Q for developing economies reveal a mixed picture with regard to prospects for investment in the developing world. On one hand, it is evident that, on average, lower-income countries possess higher levels of average Qs (figure B1.6.1), a result consis-tent with the notion that expectations of future invest-ment are greater in lower-income countries. (Although not reported, Tobin’s Q calculations for developed countries typically yield values that fluctuate around the equilibrium-consistent value of unity.) Moreover, measured Qs in several fast-growing developing coun-tries—such as Bangladesh (3.55), Brazil (2.60), China (2.08), India (2.14), and Indonesia (1.87)—are higher than the developing-country average (of 1.53), which accords with the notion that anticipated investment prospects in these countries are generally favorable. On the other hand, Tobin’s Q values for several Eastern European countries indicate that market expectations for investment in the region remain more guarded,
which could reflect long-lasting negative spillover effects of the European financial and debt crisis.
Some caution is warranted in placing too much weight on a single, raw measure of countries’ likely future investment. Developing countries—almost by definition—will tend to possess financial markets that are less complete and more inefficient, which would reduce the predictive value of the market-based valu-ations on which Tobin’s Q computations rely. Higher valuations for developing-country firms may also reflect intangibles—such as political connections or monopoly rents—rather than bright growth prospects. Indeed, while the relationship between investment rates and Tobin’s Q is reasonably strong for high-income econo-mies, it is far weaker for developing ones, which does limit the confidence one can place on the predictive ability of the measure. Nevertheless, with 90 percent of Qs measured at levels above unity, the overall mes-sage of these calculations is that investors anticipate a continued positive growth path for many developing economies.
Box 1.6 Tobin’s Q calculations for developing countries suggest positive growth prospects
FIGurE B1.6.1 Tobin’s average Q is higher on average in lower-income developing countries, reflecting market expectations of greater growth potential
Source: World Bank calculations, using data in the Bloomberg database. Note: Data are for 2010. Country-level Tobin’s average Qs are computed as the average of the ratio of aggregate market value to book value of assets held by public firms domiciled in the country, with outliers greater than two standard deviations removed. Countries are sorted in order of descending per capita income, measured in 2010 dollars. Country coverage is limited by data availability. The developing-country average is com-puted as a simple average of available data. The positive slope of the linear fit line indicates that Tobin’s Q is higher for economies with lower levels of per capita income.
Tob
in’s
Q
1.53
0.57
3.55
CHLLT
ULV
ABRA
RUSTUR
MEX
ARGM
YSM
USZAF
COLPER
JAM
THAJO
RCHN
BIHUKR
IDNM
AREG
YLK
APHL
INDGHA
NGAVNM
PAKKEN
BGD
Avera
ge
Higher income Lower income
0
0.5
1.0
1.5
2.0
2.5
3.0
3.5
4.0
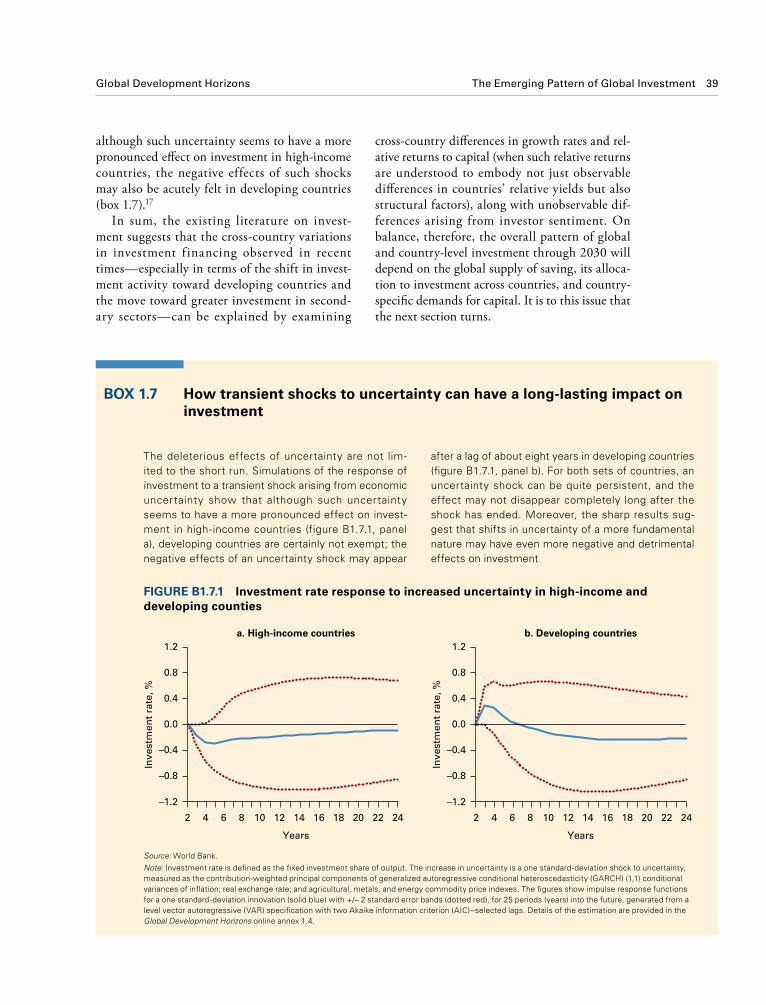
Global Development Horizons The Emerging Pattern of Global Investment 39
cross-country differences in growth rates and rel-ative returns to capital (when such relative returns are understood to embody not just observable differences in countries’ relative yields but also structural factors), along with unobservable dif-ferences arising from investor sentiment. on balance, therefore, the overall pattern of global and country-level investment through 2030 will depend on the global supply of saving, its alloca-tion to investment across countries, and country-specific demands for capital. it is to this issue that the next section turns.
although such uncertainty seems to have a more pronounced effect on investment in high-income countries, the negative effects of such shocks may also be acutely felt in developing countries (box 1.7).17
in sum, the existing literature on invest-ment suggests that the cross-country variations in investment f inancing observed in recent times—especially in terms of the shift in invest-ment activity toward developing countries and the move toward greater investment in second-ary sectors—can be explained by examining
The deleterious effects of uncertainty are not lim-ited to the short run. Simulations of the response of investment to a transient shock arising from economic uncertainty show that although such uncertainty seems to have a more pronounced effect on invest-ment in high-income countries (figure B1.7.1, panel a), developing countries are certainly not exempt; the negative effects of an uncertainty shock may appear
after a lag of about eight years in developing countries (figure B1.7.1, panel b). For both sets of countries, an uncertainty shock can be quite persistent, and the effect may not disappear completely long after the shock has ended. Moreover, the sharp results sug-gest that shifts in uncertainty of a more fundamental nature may have even more negative and detrimental effects on investment
Box 1.7 How transient shocks to uncertainty can have a long-lasting impact on investment
FIGurE B1.7.1 Investment rate response to increased uncertainty in high-income and developing counties
Source: World Bank.Note: Investment rate is defined as the fixed investment share of output. The increase in uncertainty is a one standard-deviation shock to uncertainty, measured as the contribution-weighted principal components of generalized autoregressive conditional heteroscedasticity (GARCH) (1,1) conditional variances of inflation; real exchange rate; and agricultural, metals, and energy commodity price indexes. The figures show impulse response functions for a one standard-deviation innovation (solid blue) with +/– 2 standard error bands (dotted red), for 25 periods (years) into the future, generated from a level vector autoregressive (VAR) specification with two Akaike information criterion (AIC)–selected lags. Details of the estimation are provided in the Global Development Horizons online annex 1.4.
–1.2
–0.4
–0.8
0.0
0.4
0.8
1.2
2 4 6 8 10 12 14 16 18 20 22 24 2 4 6 8 10 12 14 16 18 20 22 24
Years
a. High-income countries b. Developing countries
Inve
stm
ent
rate
, %
–1.2
–0.4
–0.8
0.0
0.4
0.8
1.2
Years
Inve
stm
ent
rate
, %

40 The Emerging Pattern of Global Investment Global Development Horizons
The shift in distribution of investment as a share of global output between developing and high-income countries can be understood by considering the two components underlying this change: changes in each respective group’s investment rates and changes in their sizes rela-tive to each other. The bulk of the increase in the share held by developing countries will actu-ally be due to increases in their relative size. Collectively, investment in high-income coun-tries as a proportion of their own output will decline slightly, by 0.7 percentage point (from 17.5 percent to 16.8 percent), with an even larger corresponding decline in the developing world (a fall from 32.2 percent to 30.1 percent). Thus, developing countries’ increasing share of invest-ment as a percentage of global output will be due to their catch-up economic growth, which results in their relative size rising from about one-third of the global economy in 2010 to almost half by 2030.
Just as China’s contribution led the surge in developing-world investment, the future decline in investment rates within developing countries will also be led by China, which will see its very high investment rate of 48 percent (as of 2010) edge down to about 45 percent in 2016 (as its shorter-term postcrisis stimulus fades) before
The changing face of future investment opportunities
The gradual convergence scenario: A fairly stable path for the global investment rate, with heterogeneity at the country level
after the dip due to the global crisis of 2007–09, the scenario analyses performed for this chapter indicate that global investment will recover and trend steadily upward, growing at a rate in line with overall output (figure 1.12, panel a). By 2030, global investment will amount to $25 tril-lion, measured in 2010 dollars, with developing countries accounting for about two-thirds ($15 trillion) of the total. in absolute terms, invest-ment in developing countries will overtake that in high-income countries by the middle of the 2010s. the global investment rate will remain more or less stable, consistent with the global sav-ing rate of about 22 percent (figure 1.12, panel b, and chapter 2). The share of global investment as a percentage of world output accounted for by high-income countries is expected to fall sig-nificantly—from 12.0 percent to 9.1 percent of world output—with the rise in the investment share by developing countries more than making up the difference.
High income High income
World GDP (right axis)
Developing Developing
World investment
World investment
0
10
5
15
20
30
25
0
40
20
60
80
120
100
2005 2010 2015 2020 2025 2030
a. Total investment
$ tr
illio
ns
0
10
5
15
20
30
25
2005 2010 2015 2020 2025 2030
b. Investment share of world output
Inve
stm
ent
shar
e o
f w
orl
d o
utp
ut,
%
Wo
rld
GD
P, $
tri
llio
ns
FIGurE 1.12 Total investment (panel a) and investment share of global output (panel b) will increase in developing relative to high-income economies in the gradual convergence scenario
Sources: World Bank projections, supplemented with calculations using data in the World Bank Global Economic Monitor database and World Bank World Development Indicators database.Note: Figure projections assume a gradual convergence scenario of annual world economic growth of 2.6 percent over the next two decades, of which developing (high-income) growth will average 5.0 (1.0) percent annually.

Global Development Horizons The Emerging Pattern of Global Investment 41
(figure 1.13, panel b). at the same time, not all developing countries will see continuous declines in investment rates: sub-saharan africa, for instance, will see its investment rate rise to aver-age 24 percent between 2010 and 2030—a rate higher than its 2005–09 average of 21 percent—and russia’s investment rate will remain above 27 percent over most of the projection period, signif-icantly higher than its historical 2005–09 aver-age. By way of contrast, the investment rate in the largest high-income countries will remain more or less stable, a testament to the fact that mild (but nevertheless positive) rates of productivity growth will mean that demand for investment in these capital-intensive economies will not dip precipitously. in the United states, for example, investment rates will close 2030 at around 13 per-cent, which is its average rate over the course of the two decades.
in the gradual convergence scenario, future declines in investment rates will be largely driven by a slowing of either productivity growth or the labor supply because these factors determine the demand for investment. however, investment rates can also fall because of insufficient financial resources available for any given country (the sup-ply of investment financing). Changes in yields, relative to average yields in the world, would
declining gradually to 37 percent by 2030 (fig-ure 1.13, panel a). already, there are signals in China—for example, underuse of office build-ings in major cities and suspension or partial suspension of many high-speed rail projects—that investment opportunities are being gradu-ally exhausted. This declining investment trend in China will occur alongside a slowdown in the country’s rate of economic growth resulting from a rising old-age dependency ratio, which will reduce both capital supply (as saving falls) and labor supply (from a shrinking working-age population). of course, the decline of China’s investment rate to a still-very-high 37 percent is not entirely surprising, given the general consen-sus by academic, market, and policy economists that investment rates consistently exceeding 40 percent are unlikely, even taking into account China’s relatively high rate of expected growth (Bardhan 2010; Dobbs et al. 2010; world Bank 2012a).
although the sharp drop in the investment rate in China will not be matched by any other developing country, several countries will expe-rience significant declines relative to anticipated peaks in the medium term. These include Brazil (from 23 percent in 2014 to 19 percent in 2030) and indonesia (from 41 percent to 33 percent)
FIGurE 1.13 Investment rates in many developing countries will trend downward in the gradual convergence scenario, but remain fairly stable in high-income countries
Source: World Bank projections, supplemented with calculations using data in the World Bank Global Economic Monitor database.Note: Investment rates for the short run (2011–13) follow estimates and projections from the World Bank’s Global Economic Prospects, while medium- and long-run pro-jections (2014–30) are from the Bank’s global Linkage model. Actual realizations for post-2014 are likely to be noisier. Figure projections assume a gradual convergence scenario of annual world economic growth of 2.6 percent over the next two decades, of which developing (high-income) growth will average 5.0 (1.0) percent annually.
United States
EuropeJapan
China
Brazil
Sub-SaharanAfrica
Russian Federation
IndonesiaIndia
a. Large economies
Inve
stm
ent
rate
, %
0
30
10
20
40
50
b. Other major developing economies
Inve
stm
ent
rate
, %
0
15
5
10
20
25
40
30
35
45
2005 2010 2015 2020 2025 2030 2005 2010 2015 2020 2025 2030
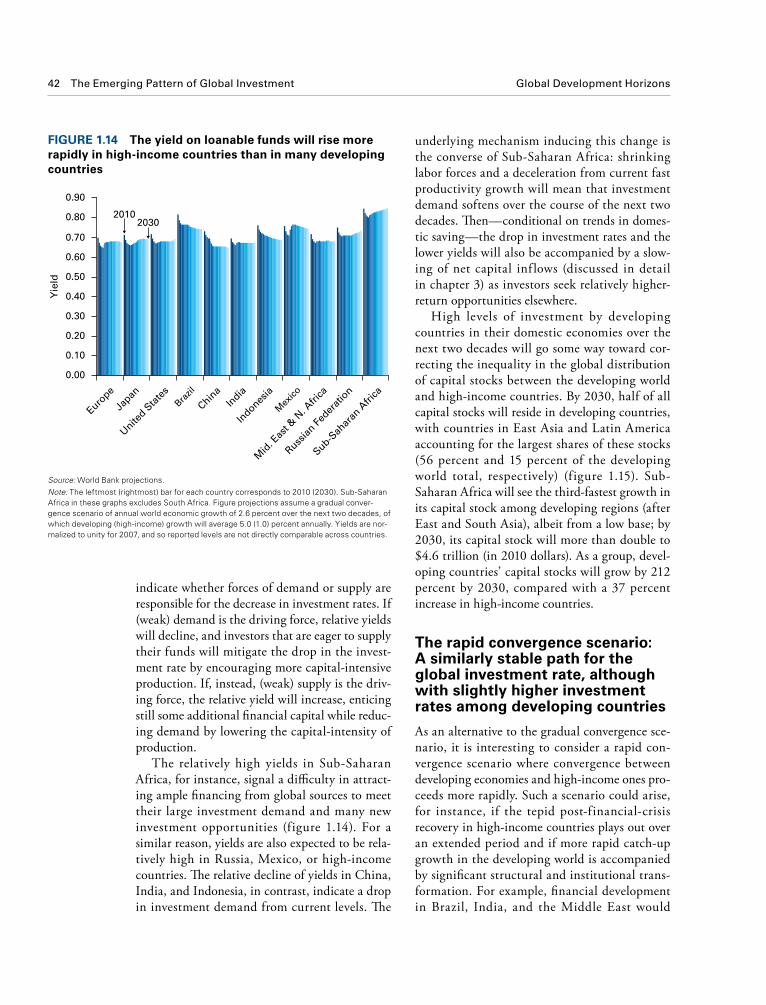
42 The Emerging Pattern of Global Investment Global Development Horizons
underlying mechanism inducing this change is the converse of sub-saharan africa: shrinking labor forces and a deceleration from current fast productivity growth will mean that investment demand softens over the course of the next two decades. Then—conditional on trends in domes-tic saving—the drop in investment rates and the lower yields will also be accompanied by a slow-ing of net capital inf lows (discussed in detail in chapter 3) as investors seek relatively higher-return opportunities elsewhere.
high levels of investment by developing countries in their domestic economies over the next two decades will go some way toward cor-recting the inequality in the global distribution of capital stocks between the developing world and high-income countries. By 2030, half of all capital stocks will reside in developing countries, with countries in east asia and latin america accounting for the largest shares of these stocks (56 percent and 15 percent of the developing world total, respectively) (f igure 1.15). sub-saharan africa will see the third-fastest growth in its capital stock among developing regions (after east and south asia), albeit from a low base; by 2030, its capital stock will more than double to $4.6 trillion (in 2010 dollars). as a group, devel-oping countries’ capital stocks will grow by 212 percent by 2030, compared with a 37 percent increase in high-income countries.
The rapid convergence scenario: A similarly stable path for the global investment rate, although with slightly higher investment rates among developing countries
as an alternative to the gradual convergence sce-nario, it is interesting to consider a rapid con-vergence scenario where convergence between developing economies and high-income ones pro-ceeds more rapidly. such a scenario could arise, for instance, if the tepid post-financial-crisis recovery in high-income countries plays out over an extended period and if more rapid catch-up growth in the developing world is accompanied by significant structural and institutional trans-formation. For example, financial development in Brazil, india, and the Middle east would
indicate whether forces of demand or supply are responsible for the decrease in investment rates. if (weak) demand is the driving force, relative yields will decline, and investors that are eager to supply their funds will mitigate the drop in the invest-ment rate by encouraging more capital-intensive production. if, instead, (weak) supply is the driv-ing force, the relative yield will increase, enticing still some additional financial capital while reduc-ing demand by lowering the capital-intensity of production.
the relatively high yields in sub-saharan africa, for instance, signal a difficulty in attract-ing ample financing from global sources to meet their large investment demand and many new investment opportunities (figure 1.14). For a similar reason, yields are also expected to be rela-tively high in russia, Mexico, or high-income countries. The relative decline of yields in China, india, and indonesia, in contrast, indicate a drop in investment demand from current levels. The
FIGurE 1.14 The yield on loanable funds will rise more rapidly in high-income countries than in many developing countries
Source: World Bank projections.Note: The leftmost (rightmost) bar for each country corresponds to 2010 (2030). Sub-Saharan Africa in these graphs excludes South Africa. Figure projections assume a gradual conver-gence scenario of annual world economic growth of 2.6 percent over the next two decades, of which developing (high-income) growth will average 5.0 (1.0) percent annually. Yields are nor-malized to unity for 2007, and so reported levels are not directly comparable across countries.
Yie
ld
0.00
United S
tate
sBra
zil
Mex
ico
Japan
Europe
China
Indones
iaIn
dia
Russian
Feder
atio
n
Mid
. Eas
t & N
. Afri
ca
Sub-Sah
aran
Afri
ca
0.10
0.20
0.30
0.40
0.50
0.60
0.70
0.80 20102030
0.90

Global Development Horizons The Emerging Pattern of Global Investment 43
Thus, as a group, the developing world will see its investment rate exceed that projected under the gradual convergence scenario by an average of about one percentage point throughout the 20-year projection horizon.
For high-income countries, however, the investment rate under this rapid convergence scenario will be marginally lower—by about one percentage point—with a widening disparity between the two scenarios as 2030 approaches. overall, the global investment rate rises slightly (because of the relatively larger size of develop-ing economies), although it remains around 23 percent. This uptick, nevertheless, will be smaller than the decline in global saving rates under this rapid convergence scenario (to be discussed in chapter 2), which results in some upward pressure on yields worldwide (discussed in chapter 3).
even though the investment rate for develop-ing countries collectively will rise slightly, there will be significant heterogeneity in their invest-ment rates in the rapid convergence scenario rela-tive to the gradual convergence scenario (figure
advance to attain, by 2030, a level of financial development comparable to the United states in the early 1980s. similarly, the quality of insti-tutions in China, indonesia, and russia would reach, by 2030, a level of the rule of law that is approximately two-thirds that of scandinavian economies such as norway or sweden today. importantly, the rate of progress in these variables is assumed to differ between countries: for econo-mies starting further away from the frontier, the rate of growth will be relatively faster (the specific assumptions for this scenario are documented in detail in the GDH online annex 1.6).
The results of this rapid convergence scenario indicate that global investment will be higher by 2030—led by substantially higher levels of investment in the developing world than under the gradual convergence scenario—to a total of $26.7 trillion (figure 1.16, panel a). The increases in investment in developing countries are under-pinned by higher productivity, with some rein-forcing effect from changes in the structural vari-ables, especially from financial development.18
FIGurE 1.15 Developing countries will account for more than half of global capital stocks by 2030 in the gradual convergence scenario (panel b), compared with about a third today (panel a)
Source: World Bank projections.Note: Capital stocks are calculated using a perpetual inventory method with a constant depreciation rate of 5 percent.a. Panel b projections assume a gradual convergence scenario of annual world economic growth of 2.6 percent over the next two decades, of which developing (high-income) growth will average 5.0 (1.0) percent annually.
High-incomecountries
L. Amer. & theCaribbean
Mid. East& N. Africa
S. Asia Sub-SaharanAfrica
E. Asia &Pacific
E. Eur. &Cent. Asia
$115.8t
$158.2t
$23.3t$21.5t $14.5t
$89.1t$17.5t
$8.0t
$11.0t
$3.8t
$8.8t
$4.6t
$4.6t
$1.7t
a. Capital stocks, 2010 b. Capital stocks, 2030a
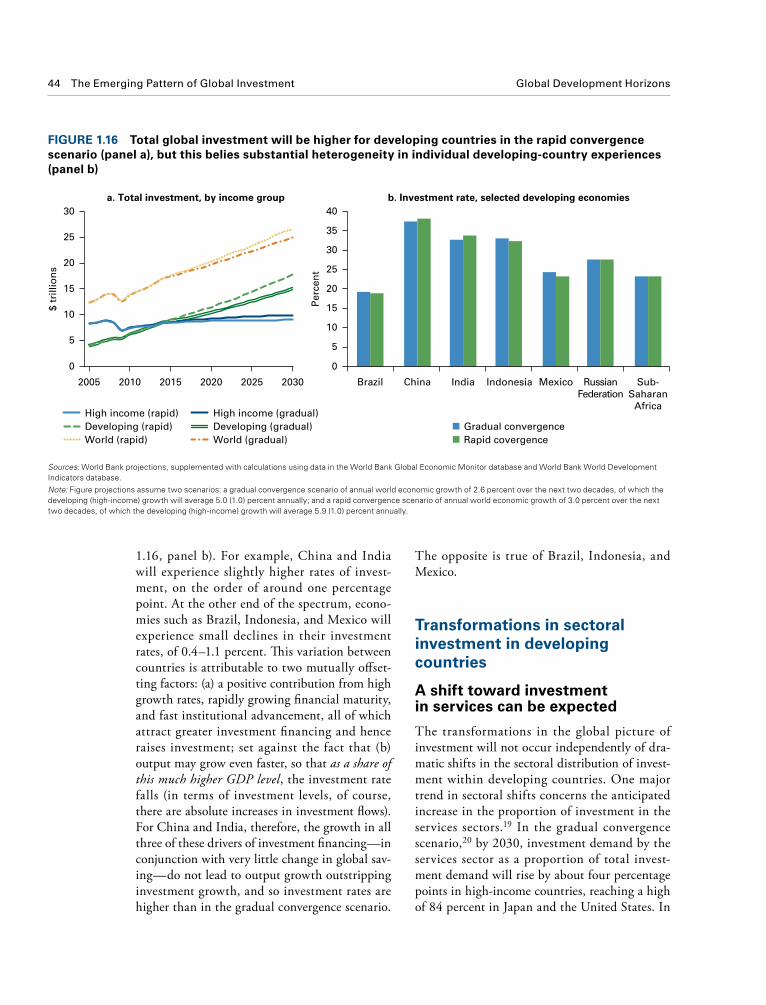
44 The Emerging Pattern of Global Investment Global Development Horizons
the opposite is true of Brazil, indonesia, and Mexico.
Transformations in sectoral investment in developing countries
A shift toward investment in services can be expected
the transformations in the global picture of investment will not occur independently of dra-matic shifts in the sectoral distribution of invest-ment within developing countries. one major trend in sectoral shifts concerns the anticipated increase in the proportion of investment in the services sectors.19 in the gradual convergence scenario,20 by 2030, investment demand by the services sector as a proportion of total invest-ment demand will rise by about four percentage points in high-income countries, reaching a high of 84 percent in Japan and the United states. in
1.16, panel b). For example, China and india will experience slightly higher rates of invest-ment, on the order of around one percentage point. at the other end of the spectrum, econo-mies such as Brazil, indonesia, and Mexico will experience small declines in their investment rates, of 0.4–1.1 percent. This variation between countries is attributable to two mutually offset-ting factors: (a) a positive contribution from high growth rates, rapidly growing financial maturity, and fast institutional advancement, all of which attract greater investment financing and hence raises investment; set against the fact that (b) output may grow even faster, so that asashareofthismuchhigherGDPlevel, the investment rate falls (in terms of investment levels, of course, there are absolute increases in investment flows). For China and india, therefore, the growth in all three of these drivers of investment financing—in conjunction with very little change in global sav-ing—do not lead to output growth outstripping investment growth, and so investment rates are higher than in the gradual convergence scenario.
FIGurE 1.16 Total global investment will be higher for developing countries in the rapid convergence scenario (panel a), but this belies substantial heterogeneity in individual developing-country experiences (panel b)
Sources: World Bank projections, supplemented with calculations using data in the World Bank Global Economic Monitor database and World Bank World Development Indicators database.Note: Figure projections assume two scenarios: a gradual convergence scenario of annual world economic growth of 2.6 percent over the next two decades, of which the developing (high-income) growth will average 5.0 (1.0) percent annually; and a rapid convergence scenario of annual world economic growth of 3.0 percent over the next two decades, of which the developing (high-income) growth will average 5.9 (1.0) percent annually.
High income (rapid) High income (gradual)Developing (rapid) Developing (gradual)World (rapid) World (gradual)
Gradual convergenceRapid covergence
0
10
5
15
20
30
25
2005 2010 2015 2020 2025 2030
a. Total investment, by income group b. Investment rate, selected developing economies
$ tr
illio
ns
0
10
5
15
20
30
25
35
40
Brazil China India Indonesia Mexico RussianFederation
Sub-Saharan
Africa
Per
cen
t
Global Development Horizons The Emerging Pattern of Global Investment 45
developing countries, the increase will be even larger: the services sector proportion of invest-ment demand will increase by close to five per-centage points (to 60 percent) overall, with the largest increases in india (from 60 percent to 70 percent) and russia (66 percent to 73 percent).21 There will also be significant upticks in certain countries that currently hold relatively small ser-vices shares, such as indonesia, where the share can be expected to rise by around six percentage points (table 1.2). The developing economies of east asia (excluding China and indonesia) and sub-saharan africa (excluding south africa) will also experience significant increases in their ser-vice sector shares of roughly 6 percentage points.
The increase in the representation of services in total investment will be supported by four dis-tinct trends:
• Increasingpercapitaincomesinthelargestdeveloping countries
• Demographicchange• Arisingshareofservicescomponentsalong
the supply chain • Infrastructure investmentneeds (infra-
structure being defined in this report, as it is conventionally, as a service)
the first effect is well known: economies tend to experience higher services value-added shares as their per capita incomes rise. india, for instance, had a services share of 38 percent of output in 1960, but as of 2010 this had risen to 55 percent. similar trends have occurred in devel-oping economies as diverse as south africa (from 51 percent to 67 percent over the same period) and argentina (from 39 percent to 59 percent between 1965 and 2010).
The second effect will stem from rising health-care needs faced by aging populations in many regions (this is discussed more thoroughly in chapter 2), alongside smaller youth populations in search of higher-quality educational services. these demographic pressures will result in a greater demand for investment in services.
Third, with perhaps the notable exception of infrastructure—which is classified as a service in any case—agricultural and manufactured goods will embed a far greater services component in
the future, and services in general will be more tradable. this increasing tradability is already evident in the information and communication technology (iCt) portion of the services export sector in some developing countries, such as vir-tual medical diagnostics in india and pakistan, human resource processing in the Gulf coun-tries, and call centers in african countries such as Kenya and south africa (anand, Gable, and Mishra 2011).
the final trend pertains to increased infra-structure needs as economies develop (in emerg-ing economies), coupled with the need to upgrade aging infrastructure (in advanced economies), both of which will channel more investment into the services sector.
Developing countries will continue to be the world’s manufacturing workshop. Collectively, developing countries will invest almost twice the amount that their high-income counterparts will in manufacturing by 2030 (compared with four-fifths of that of high-income countries in 2010). in the currently lower-middle-income economies, manufacturing investment will grow steadily over the next two decades: indonesia and india, for instance, will have average annual manufactur-ing investment growth of around 7 percent and 5 percent, respectively, and in sub-saharan africa as a whole investment will grow at an annual rate of somewhat less than 5 percent (table 1.2). other smaller economies in east asia, such as the philippines and vietnam, could also contribute to the global manufacturing picture, especially given their physical proximity to the east asian production network. Manufacturing in the rest of developing asia will grow by an average of about 4 percent per year.
in some high-income countries, there will be a significant falloff in manufacturing investment: Japan, for example, will see its manufacturing investment steadily shrink each year, to reach 15 percent of its total investment in 2030. perhaps somewhat surprisingly, europe and the United states will experience small, but nevertheless positive, annual growth rates in manufacturing investment, although the share of manufacturing in their investment bills will decline (by two per-centage points each; it will decline by twice that in Japan).

46 The Emerging Pattern of Global Investment Global Development Horizons
to lower the price of certain product lines, such as single-use medical devices, that would otherwise be unaffordable or inaccessible, especially in low-income countries when they are produced by the traditional manufacturing industry. 3D-printing techniques could also defeat component obsoles-cence (supporting poorer farmers and craftsmen who cannot afford equipment and regular prod-uct upgrade cycles) and potentially encourage the development of products for which the end users are predominantly located in low-income countries.
For most countries, a larger share of investment activity within the services sector will be mirrored by a shrinking share held by the agriculture sec-tor. in developing countries as a whole, the share of investment in agriculture will shrink from 16 percent to 13 percent, although the variance across countries will be fairly large. Brazil and sub-saharan africa will emerge as the (relative) leaders in this regard: their shares of agricultural
in addition to the growing share of global man-ufacturing investment represented by developing countries in the coming decades, the nature of manufactured goods will change. Manufactured goods are likely to embed greater services com-ponents in the future and will be more techno-logically sophisticated in ways beyond quality improvements, while also becoming increasingly transportable and transferable. technological sophistication could be realized as enhanced interdevice interconnectivity (such as home appli-ances that seamlessly interact with either a central computer or a mobile phone application) and as cost-competitive, environmentally friendly prod-ucts (such as high-efficiency vehicles and air con-ditioners operating on solid-oxide fuel cells, bio-fuels, or electrofuels). other advances in additive manufacturing, such as three-dimensional (3D) printing, will allow more on-demand, physically complex, and highly customizable production. such manufacturing processes have the potential
TABlE 1.2 Both developing and high-income countries will see a rise in the share of investment devoted to the services sector in the future
Agriculture Manufacturing Services
Share (%) Growth (%) Share (%) Growth (%) Share (%) Growth (%)
Developing countriesEast Asia and Pacific 11 6.4 34 7.1 56 8.0 China 10 7.4 35 7.7 56 8.6 Indonesia 22 4.5 24 5.1 54 6.2Eastern Europe and Central Asia 12 1.8 18 2.8 70 3.8 Russian Federation 17 1.7 11 3.1 73 3.9Latin America and the Caribbean 10 3.0 19 3.0 71 4.1 Brazil 11 3.4 16 2.9 74 4.3 Mexico 4 2.8 20 2.1 76 3.4Middle East and North Africa 39 3.1 16 3.9 46 5.0South Asia 14 5.1 17 6.5 69 8.1 India 13 5.4 17 7.0 70 8.6Sub-Saharan Africa 26 5.4 17 4.6 57 5.8 South Africa 4 1.6 21 2.1 75 3.3High-income countries Europe 3 −0.9 16 0.9 82 1.8 Japan 1 −1.2 15 −0.1 84 1.1 United States 3 −0.8 13 1.1 84 2.3
Source: World Bank projections.Note: Investment share is computed as the sectoral share of total investment for each respective sector in 2030. Investment growth is computed as the compound annual percentage growth in sectoral investment for each respective sector between 2010 and 2030, measured in constant prices. Agriculture is defined to include natural resources, manufacturing is defined to include capital goods, and services are defined to include infrastructure and construction. Table projections assume a gradual conver-gence scenario of annual world economic growth of 2.6 percent over the next two decades, of which developing (high-income) growth will average 5.0 (1.0) percent annually.
Global Development Horizons The Emerging Pattern of Global Investment 47
of the most pressing challenges for developing countries, especially when considered alongside rapid advances in per capita income and popula-tion growth pressures in the poorest parts of the world.
to better understand what such infrastructure investment needs are, it is necessary to go beyond likely investment paths and toward anticipating the investment expenditures that would result ifdesiredtargets for infrastructure were fully satis-fied. indeed, even excluding maintenance costs, such needs will substantially exceed likely levels of actual infrastructure investment.22 Furthermore, given the central role that the public sector typi-cally plays in infrastructural services, meeting such anticipated infrastructure needs is a first-order concern for developing-country policy makers.23
Moreover, increased investment in sound infrastructure can serve a broader catalytic role in enabling sectoral shifts in investment as econo-mies develop. low-income countries seeking to break into global manufacturing markets will need reliable electricity generation, improved road and rail networks, and expanded port facili-ties. lower-middle-income economies will need higher-quality roads, more sophisticated water and drainage systems, and improved internet and cellular phone coverage as their middle classes develop and as demand rises for these infrastruc-tural services. and upper-middle-income nations will need modern, high-speed iCt networks and high-capacity power generation to effectively compete in high-tech manufacturing and glob-ally tradable services while upgrading the overall quality of their service sectors.
a central question that developing-country policy makers will need to confront as they seek to scale up their infrastructure investments is how technological progress has changed, and will con-tinue to change, the mechanisms and possibilities surrounding infrastructure service delivery and operation. The meaning of the term “infrastruc-ture” is no longer self-evident: four decades ago, fixed-line telecommunications cables appeared to be a natural monopoly benefiting from pub-lic sector provision; starting in the 1990s, a wave of privatizations around the world took hold, expanding penetration and coverage and
investment, as a share of their total gross invest-ment, will be mostly maintained through 2030, growing at annual rates of 3 percent and 5 per-cent, respectively. this growth would ref lect Brazil’s comparative advantage in agricultural innovation, along with the adaptation of agricul-tural technologies for the next frontier of mass agricultural cultivation in africa, and is likely to be realized in the form of locally adapted tech-nologies for tropical-weather farming and yield enhancement. almost everywhere else in the world, however, agricultural investment will con-tract more sharply: in high-income countries—excluding investment in natural resources by the high-income countries of the GCC—agricultural investment will shrink, on average, to just 2 per-cent of the investment bill, and even in the devel-oping world, agriculture will amount to only 13 percent of investment expenditures. in general, declines in pure agriculture (excluding natural resources) around the world will be somewhat offset by increases in natural resource investment; such developments are likely to reflect the resur-gence of shale gas extraction through horizontal drilling and hydraulic fracturing.
The bottom line is that there will always be new technologies that absorb investment, and reallocations of investment between sectors ulti-mately are led by changes in the relative returns to investment in each sector (which in turn is a function of relative output and factor prices between sectors). in short, the world is not about to “run out” of investible opportunities.
Developing-country infrastructure investment needs will be substantially higher in 2030
one investment priority consistent with the forthcoming shift toward services investment is the pressure in most developing countries for expanded infrastructural services. as discussed in the previous subsection, services investment in developing countries will rise substantially from current levels, amounting to almost $10 trillion by 2030. of this amount, $626 billion (slightly more than 6 percent) will be spent on infrastructure. Yet in spite of major advances over the past decade, infrastructural needs remain one

48 The Emerging Pattern of Global Investment Global Development Horizons
infrastructure investment needs are likely to be most concentrated in east asian and south asian countries: the amount in just those two regions will total $501 billion in 2030, reflecting contin-ued strong demand for infrastructure by the very large Chinese and indian populations (figure 1.17, panel b). in China, power needs will dominate, but this will be coupled with fixed-line telecom-munications demand as more and more Chinese consumers and businesses seek high-speed connec-tivity. in india, investment will need to be directed toward improving the country’s very poor road system, although mobile connectivity will draw infrastructure investment as well.
Yet even the substantial sum of $501 billion may underestimate the tremendous infrastruc-ture needs of asian countries when considering international infrastructure links (those involv-ing improving access between two or more countries). Using this more expansive definition bumps up infrastructure needs for asia to an estimated $750 billion per year for the decade between 2010 and 2020 (aDB 2010)—about 26 percent more than estimated expenditures when only intracountry needs are considered.
as for sub-saharan africa, the region’s infra-structure investment needs do not appear sig-nificantly greater than that of other developing regions in absolute terms. were they to be met in full, however, the amount would constitute a significant share of total investment in the region: $97 billion, or 15 percent of the total $662 bil-lion. Moreover, this estimate excludes investment needs arising from the need to rehabilitate the estimated 30 percent of existing infrastructure that has been poorly managed (afDB 2010) or the additional investment required to enhance regional interconnectivity (piDa 2011).
importantly, infrastructure investment needs at the regional level will not evolve monotoni-cally. Given the easy availability of cellular mobile phones and their widespread adoption, demand for cellular telecommunications infrastructure, in particular, is likely to be greatest over the next five years. This front-loaded demand is likely to reach saturation in a significant number of developing countries by 2017 or 2018.26 as these needs taper off, fixed-line infrastructure will increase in impor-tance. power and transportation needs are likely to
enhancing efficiency (li and Xu 2004). today, fixed telephone lines are almost anachronistic, with many developing countries leapfrogging fixed lines and installing cellular transmitter tow-ers instead. Finally, improved efficiencies due to technological improvements in grid storage and digital power conversion could mean that future infrastructure spending in power will shift from investment in production toward storage.
although the specific composition and nature of infrastructural capital will adapt according to changes in the world economy, the nature of eco-nomic services that characterize infrastructure nevertheless remain the same: high capital inten-sity, elements of natural monopoly, and location-specific investment.24 accordingly, the discussion in this report will retain the traditional categories of power, transportation, telecommunications, and water and sanitation, while acknowledging that the specific technologies implied by these cat-egories require some flexibility in interpretation.
Though estimates are not consistent, analysis of demand for infrastructure services generally reveals that although demand increases with per capita income, the pace of growth in demand is faster at lower per capita income levels. Currently, per capita electricity consumption in developing countries ranges from an average of 452 kilowatt-hours (kwh) for low-income countries to 3,073 kwh in upper-middle-income countries; by com-parison, the average in developed countries is 10,408 kwh. The sheer number of people who lack access to other forms of infrastructure pro-vides another hint of how much investment will be required: 1.1 billion people in the world cur-rently lack access to safe drinking water, and 2.4 billion face inadequate sanitation services.
in 2030, infrastructure investment needs in developing countries will amount to an estimated $864 billion, as measured in 2010 dollars (figure 1.17, panel a).25 These needs will be concentrated in the power ($243 billion) and transportation ($254 billion) subsectors, which will together account for more than half of all infrastructure needs. Fixed-line telecommunications infrastruc-ture—presumably in the form of digital and opti-cal cables—will also be a major area of invest-ment, amounting to $172 billion (or 20 percent of total infrastructure investment needs).

Global Development Horizons The Emerging Pattern of Global Investment 49
sheer size of infrastructure investment needs (which does not distinguish between public or private investment) suggests that adequately meeting these needs will call for a rethinking of existing institutional arrangements of service delivery, increased internationalization of fund-ing sources, and innovative financing strategies that are better designed to meet the high levels of capital intensity. Concurrent with meeting these purely financial goals is the necessity of being keenly aware of the broader public policy issues of efficiency, access by the poor, and quality of services.
More than other sectors, infrastructure financing has witnessed a distinct shift in terms of government policy, public attitude, and intel-lectual treatment. since the mid-20th century, these trends first encouraged a model of pub-lic ownership and control, vertically integrated industrial organization, and public financing of
grow more gradually, a reflection of more gradual changes in population demands for these services.
Enormous resource mobilization will be required to meet infrastructure financing needs in developing countries
successfully meeting developing countries’ cumu-lative infrastructure financing needs of $14.6 tril-lion between 2012 and 2030 will require an enor-mous mobilization of financing—one akin to frontier expansion by european countries in the new world in the 19th century, which generated massive investment needs in the form of railways, real estate, and large-scale agricultural projects. although infrastructure investment has tradi-tionally been the purview of the public sector, as discussed earlier, this trend is changing, toward greater public-private partnership. indeed, the
FIGurE 1.17 Annual infrastructure investment needs in developing countries will be substantial for the next two decades (panel a), with the greatest needs arising in East and South Asia (panel b)
Source: World Bank projections.Note: Details of the methodology underlying the projections are given in the Global Development Horizons online annex 1.5.
Water/sanitation TelecomsTransportation Power
$ b
illio
ns
$ b
illio
ns
800
600
400
200
02011 2014 2017 2020 2023 2026 2029
0
Sub-Saharan
Africa
E. Asia& Pacific
E. Eur.& Cent.
Asia
L. Amer.& the
Caribbean
Mid.East &
N. Africa
S. Asia
50
100
150
200
250
300
350
Sanitation
Water
a. Total infrastructure needs, 2010–30 b. Regional infrastructure needs, 2030
Fixed
Mobile
Transport
Power

50 The Emerging Pattern of Global Investment Global Development Horizons
international banks) to provide the necessary capital for large-scale infrastructure projects is questionable, given weaknesses in their postcrisis balance sheets (an issue also discussed in chapter 3). Considered together, these factors will limit the options available to policy makers seeking to finance infrastructure.
one respite offered by the long-term dura-tion of infrastructure assets is that, in spite of global rollbacks in overall syndicated lending, the nature of the investment allows for more inno-vative financing options through, for instance, increased securitization of future cash flows. in fact, there is evidence that this shift toward bond financing has already occurred (figure 1.18) and will continue to expand in the future, perhaps accounting for as much as half of all infrastruc-ture investment financing.
the current trend toward globalization of corporate finance is also likely to intensify in the future, and this will further support infrastructure financing sourced from global capital markets. such bond market maturation will ultimately lead to lower credit spreads and hence the cost of capi-tal. There is evidence that this is already under way: emerging market corporate bonds carried spreads over comparable U.s. treasury securities of about 450 basis points in the early 1990s, but the average spread narrowed to 392 basis points in 2011. of course, such financing structures are feasible only when the underlying financial, regulatory, legal, and institutional frameworks are sound, which in turn is premised on the developing world’s prog-ress in developing their financial institutions. in situations where such frameworks are not properly in place or are in a state of transition, investors are likely to increase their hurdle rates. This is typically passed on as higher tariffs for infrastructure ser-vices, which, as experience indicates, leads to such services being prohibitively expensive, especially for the poor. But innovative financing need not be limited to securitization. innovations can also occur in the manner by which funding is raised, especially when aided by modern iCt (box 1.8).
Conclusion and policy directionsthe future face of global investment activ-ity will see developing countries in far greater
investment. since the 1990s, the common model has shifted toward market liberalization, unbun-dling of power and telecom utilities, privatization of public assets, and financing through private markets. More recently, the model has evolved toward public-private partnerships in financing, especially in middle-income countries.
the evolution toward greater private sector involvement in infrastructure financing could not have come at a more opportune time. The financ-ing of future infrastructure investment needs will occur in a global environment where the public sector will almost certainly face funding difficul-ties. as will be further discussed in chapter 2, fiscal balances worldwide were compromised as a result of the financial crisis. This was especially the case in advanced economies but also in the developing world. Furthermore, questions about the sustainability of sovereign debt, as detailed in chapter 3, are likely to negatively affect the global outlook for public sector access to global capital markets. even the ability of traditional private sector financial intermediaries (such as
FIGurE 1.18 Infrastructure investment financing modes have changed over time and will likely favor greater bond financing in the future
Source: World Bank projections, supplemented with calculations using data from Dealogic Bondware and Loanware.Note: Infrastructure financing is calculated as a share of cumulative investment financing needs during the respective time periods. Total values, in billions of current dollars, are given in parentheses. Projections for 2012–22 are based on the assumption of similar growth rates between the second two periods as between the first two periods and zero inflation. The cumulative infrastructure investment bill for 2012–22 is $8.8 trillion.
Loans ($246.2b)
Bonds ($54.5b)
1990–2000
2001–11
Loans ($884.2b)
Bonds($434.3b)
Loans(projected)($3,807b)
2012–22(projected) Bonds
(projected)($5,033b)
Global Development Horizons The Emerging Pattern of Global Investment 51
that when large economies engage in profligate public policies or unrestrained private borrowing, there could be material contractions in the global supply of saving (to the extent that such actions are not fully offset by ricardian equivalence). This can choke off investment in small, vulnerable develop-ing countries, which typically have less fiscal space to offset negative shocks from abroad.
the anticipated fundamental forces that will shape the global economy in the years to come—asynchronous demographic transforma-tion, asymmetric productivity growth, structural change, and financial globalization—will there-fore alter not just investment needs and opportu-nities but also saving decisions and choices along with the cross-border flow of financial capital and international investment positions. accordingly, the following chapters will address the issue of global patterns in saving (chapter 2), along with the saving-investment imbalance that constitutes international capital flows (chapter 3), tying the notion of investment needs with opportunities together at the global level.
prominence, investing more than high-income countries in absolute value and as a share of global investment. since 2000, developing countries’ investment as a proportion of their own output has been substantially higher than that of high-income countries. These trends are not expected to continue indefinitely into the future, but their effects are already palpable, and their full ramifi-cations will be realized over the next two decades.
although this chapter focuses on real invest-ment activity—in particular, gross capital forma-tion—across countries, the current account iden-tity implies that investment should be understood alongside saving and capital f lows.27 For many small developing economies, shocks to saving in major economies, such as the United states, will inevitably affect their domestic patterns of invest-ment (Feyrer and shambaugh 2012). This result is a double-edged sword. on one hand, it suggests that developing countries can leverage increases in national saving in large, high-income countries to relax domestic saving constraints and boost invest-ment at home. on the other hand, it also means
The idea behind crowdsourced capital has a relatively long, and reasonably venerable, history in developing-world finance. Distilled to its essence, crowd financ-ing seeks to minimize the role of intermediaries in matching savers with investors. On the saving front, rotating savings and credit associations as well as the more recent innovation, community finance asso-ciations, can be regarded as forms of crowd financ-ing (Besley, Coate, and Loury 1993). As for investing, some microfinancing organizations, such as Kiva, have been known to employ crowd funding as their pri-mary financing mechanism (Cull, Demirgüç-Kunt, and Morduch 2009).
Information technology, as well, has expanded the potential to draw on diverse sources to finance infra-structure in developing countries. One such initiative, Sokoni, has established a digital marketplace that con-nects donors and investors directly to project develop-ers and governments. Innovative financing mechanisms
of this kind are possible pathways into a future where infrastructure financing breaks free from traditional modalities and embraces the power and connectivity made available by modern information and communica-tions technologies.
Another alternative mechanism that has begun to take hold in infrastructure financing is Islamic finance, particularly for large-scale projects in the Middle East. Although the broader applicability of Islamic finance may continue to face economic, legal, and systemic challenges (Hesse, Jobst, and Solé 2008), there is reason to believe that Islamic finance could be cred-ibly scaled up as an alternative medium for cross-border infrastructure financing. The tenets of Islamic finance—which focus on direct participation in asset performance—are well suited for the long-term nature of infrastructure finance, where the rate of return could be difficult to predetermine and may be realized years after an initial investment.
Box 1.8 Alternative financing mechanisms have begun to be adopted in financing infrastructure

52 The Emerging Pattern of Global Investment Global Development Horizons
desirable projects and activities. Moreover, attracting investment from abroad often requires the presence of a professional, knowledgeable, and investor-focused investment facilitation agency, equipped with the capacity to ease cross-border informational asymmetries (world Bank 2012c).
For policy makers interested in boosting investment, a central element of the invest-ment climate is the level of development of the financial sector. as discussed in this chap-ter, an increasingly mature financial system is associated with rising levels of investment. More important, well-functioning financial systems ensure a superior mobilization and corresponding allocation of saving toward the most productive investment opportunities (levine 2005) while providing investors diversification and risk man-agement benefits. a lengthy discussion of policies that can stimulate financial sector development is beyond the scope of this report, but recent work by the world Bank offers a menu of ideas for jump-starting such development, especially as it pertains to the role of the state, and for guard-ing against circumstances of state capture and government failure (world Bank 2012b). For the purposes of relaxing credit-related constraints, especially for small and medium-size enter-prises, the establishment of a credit information agency can be especially helpful. it is important to point out, however, that any policies designed to encourage financial sector development—a long-run goal—should not be interpreted simply as the pure expansion of credit; such a narrow view may give rise to the pursuit of unsustainable short-term policies that are ultimately detrimen-tal to economic and financial stability.
Major developing economies have not stood idly by in seeking to foster enhanced financing facilities for south-south investment. The BriCs countries (Brazil, russia, india, China, and south africa) touted a south-south development bank in early 2012, for example, as a mechanism to help recycle surplus saving for their developing countries’ investment needs, while regional mul-tilateral development banks have also expanded their operations dramatically in recent years (a topic that will be revisited in chapter 3).
Policy makers have an important role to play in supporting a favorable investment climate
Because investment is primarily a private sector-led activity, government policy action in most countries exerts only an indirect effect on chang-ing the level of investment in a country. rather, government’s role is often to establish an envi-ronment—the investment climate—that is sup-portive of robust and sustainable investment activity. This is not to say that public investment is irrelevant, since there may be a role for inter-vention where market failures are clear and where social returns are especially large. For instance, governments in developing countries often have a well-defined role in the provision of infrastruc-ture, which serves as an important foundation for private investment activity. But the policy framework for investment is ultimately an indi-rect one.
with this overriding framework in mind, the importance of changes to structural factors in attracting investment from the global pool of sav-ing—amply demonstrated by the difference in investment patterns in the rapid versus gradual convergence scenarios discussed earlier—suggests that countries seeking to compete in the future world economy will need to pay attention to fos-tering a favorable investment climate. in general, a favorable investment climate is characterized not only by traditional policy areas that can foster private sector investment, such as a stable macro-economic and regulatory regime, but also by (a) the broader institutional environment in which firms operate (which includes secure property rights and stable rule of law); (b) the governance framework, such as adequate control of corrup-tion and a limited burden from—and simplified administration of—direct and indirect taxation (which includes the risk of outright appropria-tion); and (c) the level of maturity of the financial sector. in this sense, getting the investment cli-mate right shifts the policy dialogue away from a laundry list of specific actions and policies for reform, and toward a discussion of what consti-tutes the appropriate set of rules, governance, and incentives that would stimulate the private sec-tor to invest in economically efficient and socially

Global Development Horizons The Emerging Pattern of Global Investment 53
maintained; and when interventions have a clear sunset clause.
If policy makers do ultimately decide to pursue the targeted intervention route, their efforts may be best placed in supporting the upcom-ing expansion in service sector investment (as discussed earlier), especially in areas (such as education and health care) where spillovers from positive externalities could be especially high. even in manufacturing and agriculture, there are certainly subindustries (like “green” technology components or tropically adapted seeds) where social returns appear to be sufficiently large to justify the risks of direct intervention.
although the institutional design that best supports such successful interventions is likely to be idiosyncratic, a wholesale rejection of a public role in investment is probably unwarranted. Just as important, governments that currently engage in policies that, either directly or indirectly, favor investment in agriculture and manufacturing (for example, many governments explicitly prohibit FDi in certain “sensitive” or “strategic” services) will place a burden on their economies’ efficiency in a world where services account for a larger share of output.
Indeed, the area where government policy is likely to offer some of the greatest social returns is in the provision of infrastructure. as discussed earlier, this is also a sector of the econ-omy that will likely face increased demand for future investment. Yet even in this area, which has been the traditional bulwark of public sec-tor investment, government roles are evolving. ppps have helped move along projects that cash-constrained public sectors sometimes have had trouble completing on their own. For example, by offering guarantees on minimum concession charges for toll-road operations, private investors in Chile, india, and Mexico have funded trans-portation infrastructure in many remote areas that were previously underserved. in Jordan and russia, new airports have been built and operated by foreign investors, which in turn contribute to positive network externalities for future busi-ness opportunities. even in areas where citizen-state conflicts have arisen in the past—such as
Improvements in the overall quality of gover-nance in developing countries, especially with regard to the rule of law, can also have a major impact on the investment climate and serve to attract financing for investment from global sources. This is not surprising given that respect for the rule of law is essential to ensuring that investors can realize returns from their invest-ment activities. however, successfully address-ing governance challenges as they pertain to the investment climate calls for going beyond de jure corrections to the letter of the law or salutary actions such as the establishment of independent investment and regulatory commissions. actions will need to ensure that the elements of rule of law are maintained de facto by bureaucrats and politicians and that formal institutional bodies can enforce violations of rule of law in an uncom-promised fashion.
such fundamental reform, of course, is likely to encounter resistance by entrenched interests, and so reform efforts must be undertaken with a mind toward building coalitions for change through expanding the scope of stakeholders and encouraging partnership models of stakeholder interactions (world Bank 2008). even seemingly innocuous reform efforts, such as routine, unbi-ased implementation of investment-related com-petition law, can face staunch political opposition if they would weaken existing monopolistic or oligopolistic positions of incumbent businesses.
Successful investment policy, of course, seeks to not only correct areas of government failure as described above but also to suggest direct intervention in cases where market failures are sufficiently evident (and remain uncorrected) or where social returns are sufficiently high. recent research (aghion et al. 2012; Bloom and van reenen 2007; rodrik 2009) has revived the idea that targeted interventions can better align private sector incentives and foster private sector competition (rather than rent seeking)—espe-cially when such policies are not so much targeted at a specific sector (where the risk of subsequent capture can be high) but at particular constraints (such as inadequate knowledge of good man-agement practices or difficulties in obtaining credit); when high levels of accountability are
54 The Emerging Pattern of Global Investment Global Development Horizons
in terms of both economic payoffs and political institutions, that would ensure that large invest-ment expenditures are not misallocated.
4. ppps are typically formed through the establish-ment of a single long-term contract between a government and a private investor that bundles infrastructure investment and service provision.
5. The Gulf Cooperation Council (GCC) was estab-lished in 1981 through an agreement between Bahrain, Kuwait, oman, Qatar, saudi arabia, and the United arab emirates.
6. indeed, in recent years there has been a major shift as investors from advanced economies have retreated and developing-country investors have emerged as a major source of investment finance for infrastructure projects with private participa-tion (ettinger et al.2005).
7. as discussed in online annex 1.1 (on the GlobalDevelopmentHorizons [GDH ] website), the defini-tion of “productive physical capital” intentionally excludes broader measures of capital, including that of human and natural capital. such correc-tions may be appropriate for the study of certain phenomena—such as the optimal rate of natural resource extraction (world Bank 2006, 2011)—but a considered treatment is beyond the scope of this report. Moreover, as discussed elsewhere in this report, there are potential problems in regard-ing all forms of investment (private, public, or investment in nonreproducible capital) as equiva-lent to productive capital formation. with these caveats in mind, the goal of this subsection is to provide a better sense of the distribution of global fixed capital stocks, and caution is warranted in relying on the capital stock computations pro-vided here in secondary analyses.
8. although the capital stock calculations are based on constant 2000 dollars and the perpetual inven-tory method assuming a constant depreciation rate, alternative calculations, using either ppp-adjusted investment or hyperbolic discounting of the capital stock, deliver a similar qualitative message.
9. The relationship between economic growth and investment is clearly endogenous. nevertheless, there is a strong correlation between the two because sustained economic growth is the result of improvements in total factor productivity (tFp) and not factor accumulation alone. tFp, in turn, derives from a far richer set of factors over and above high levels of investment.
10. This relative yield r~ is defined in the context of the investment financing equation in online annex 1.6 (on the GDH website).
water utilities—a willingness to employ profes-sional management in state-owned facilities has helped improve efficiency and service quality in Colombia, Gabon, and the philippines.
international f inancial institutions such as the world Bank, international Financial Corporation, and the Multilateral investment Guarantee agency can have an especially impor-tant role to play in this regard. The world Bank has traditionally been active in infrastructure financing, and it can play an important interme-diary function in offering low-cost infrastructure financing through its participation in ppp lend-ing syndicates or by designing structured financ-ing options (such as infrastructure bonds). But the institution’s role goes beyond financing. The world Bank is now a repository for knowledge on ppps in infrastructure, and as such can pro-vide technical assistance and other advisory ser-vices that draw on the diversity of cross-country experiences in infrastructure investment projects (world Bank 2012d).
Notes1. The definition of “investment” used in this chap-
ter is, in most cases, gross capital formation, including purchases of physical structures, plants, machinery, and equipment, together with inven-tory accumulation, but gross of depreciation. Further information on this and other definitions of investment may be found in online annex 1.1 (available, with the rest of the annexes for this and the other chapters, at http://www.worldbank.org/CapitalForTheFuture).
2. it is important to be aware that measurement dif-ficulties mean that the reported sectoral marginal products of capital (MpKs) should be regarded as indicative, rather than definitive. it is also impor-tant to keep in mind that calculated MpKs cap-ture the mean of a distribution of firm efficiencies, and so the most productive firms in a country or sector may still be highly efficient. analogous computations using a more familiar metric, the incremental capital-output ratio, are reported in online annex 1.2, with similar qualitative results.
3. although there is still considerable debate over the veracity of such models in stimulating growth, it is well recognized today that any such approach can-not occur in the absence of absorptive capacity,

Global Development Horizons The Emerging Pattern of Global Investment 55
investment projects, the importance of timing, and, crucially, the inherent uncertainty involved in assessing investment opportunities.
16. The theoretical prediction of the negative effect of uncertainty on investment is more ambiguous. Caballero (1991), for instance, has noted that the response of investment to uncertainty depends on assumptions regarding decreasing marginal returns to capital, while lee and shin (2001) show that the share of labor in the production function can affect the balance between the positive and negative effects of uncertainty.
17. as can be seen from box 1.7, figure B1.7.1, there is significant uncertainty about the true impact of the shock; the error bands for both impulse responses include zero. nevertheless, as Jordà (2009) has argued, the inclusion of zero within the confidence bands for the impulse response need not disqual-ify the variable from having an effect, especially if the function appears to trend smoothly in one direction or another during the propagation of the shock, rather than vacillate unstably around zero. it should also be noted that other studies (for example, Carrière-swallow and Céspedes, forth-coming) have found that the effect of uncertainty shocks on investment is actually greater for emerg-ing economies.
18. Because labor supply remains unchanged in this scenario, higher levels of financial development attract greater amounts of investment financ-ing, which increases efficiency-adjusted capital stocks and serves as an additional boost to growth over and above the productivity increase. when decomposed into the contribution of growth ver-sus structural change (by separately running the scenario with only changes in either), the effect of growth is generally twice as large as that of structural changes. although not reported, these results are available on request.
19. although one may reasonably expect that service sector investment would rise as countries become richer (given the trend that output in the service sector does rise with per capita incomes), this is not immediately obvious because the capital intensity of the service sector differs from that of the manufacturing sector. in the model used in this report, the capital intensity of the service sec-tor is indeed, on average, significantly lower than that of the manufacturing sector across develop-ing countries.
20. For space reasons, this section will rely on esti-mates consistent with the gradual convergence scenario. although the numbers differ, the main
11. Undoubtedly, interest rates should reflect some of the differences that arise from these structural factors. however, interest rates may not fully capture the impact of structural differences due to financial market imperfections. For example, financial repression—common in many develop-ing countries—may result in a distortion so that a disconnect arises between reported interest rates and expected returns.
12. The changes are measured by the simple average of the control of corruption and rule of law measures in the worldwide Governance indicators for the two years (1996 and 2010). For more information about the worldwide Governance indicators proj-ect, see http://info.worldbank.org/governance/wgi /index.asp.
13. Theory posits that the investment rate is equal to the ratio of firms’ shadow value of capital per unit price of investment goods, a relationship known as marginal Q. however, because such shadow prices are not observable, economists have operational-ized the concept by taking the ratio of the firms’ (observable) market valuations to their replace-ment costs of capital, or average Q. Under certain additional assumptions—which include perfect competition and perfect capital markets—these two ratios are in fact equivalent (hayashi 1982). recent research has even suggested that future investment opportunities are better captured by average, rather than marginal, Q. empirical tobin’s Q studies seeking to explain investment by Q alone, however, have had a disappointing track record, which may be attributable to the diver-gence between these two measures as a result of financial frictions (lorenzoni and walentin 2007).
14. a common alternative interpretation of tobin’s Q is that it is a proxy for adjustment costs for chang-ing capital stocks. absent such costs, the coef-ficient on Q would be unity. a small coefficient estimate for Q is thus interpreted as an indica-tion of large (convex) adjustment costs (although recent research by abel and eberly [2011] dispute this traditional interpretation). in the reported sample, the coefficient for Q in the full sample is 0.01, which is remarkably close to estimates typically obtained in the literature, using far more sophisticated estimation techniques and alterna-tive specifications.
15. treating investment decisions as real options simultaneously accounts for three features of investment that are not well captured by the tra-ditional approach of equating user cost to mar-ginal product: the irreversible nature of many

56 The Emerging Pattern of Global Investment Global Development Horizons
estimate of $626 billion in the gradual conver-gence scenario. These estimates also suggest that infrastructure investment grows at an annual rate of only 0.6 percent for 2011–30, a rate one order of magnitude slower than the annual growth rate of services in developing countries (of 6.2 per-cent). as can be seen in figure 1.17, however, this slow rate is due mainly to a significant drop-off in mobile infrastructure spending. annual growth in infrastructure investment excluding this category grows by 2.5 percent, which remains slower than the overall rate of services growth, but not sub-stantially so.
26. This saturation point is assumed to be at two cellphones per user. as of 2010, only hong Kong sar, China, has coverage (slightly) in excess of this level.
27. The current account identity states that the dif-ference between national saving and investment is equivalent to a country’s net capital flows. The surprisingly high correlation between saving and investment was first observed by Feldstein and horioka (1980), who regarded the finding as evidence of home bias in saving and investment. subsequent work has punctured this notion that high saving-investment correlations necessarily imply poor capital mobility (Kraay and ventura 2000), although the more general point that the three variables are closely linked should not be understated.
referencesabel, andrew B., and Janice C. eberly. 2011. “how
Q and Cash Flow affect investment without Fric-tions: an analytic explanation.” Review of Eco-nomicStudies 78 (4): 1179–1200.
acemoglu, K. Daron, simon Johnson, and James a. robinson. 2005. “institutions as a Fundamen-tal Cause of long-run economic Growth.” in HandbookofEconomicGrowth, vol.1, ed. philippe aghion and steven n. Durlauf, 385–472. amster-dam: elsevier.
aDB (asian Development Bank). 2010. Infrastructurefor a Seamless Asia. tokyo: asian Development Bank institute.
afDB (african Development Bank). 2010. AfricanDevelopmentReport2010:Ports,Logistics,andTradeinAfrica. oxford: oxford University press.
aghion, philippe, Mathias F. Dewatripont, luosha Du, ann e. harrison, and patrick legros. 2012. “indus-trial policy and Competition.” working paper
messages that emerge using numbers from the rapid convergence scenario are similar.
21. Globally, the services investment share will actu-ally remain stable, at 69 percent. This apparent anomaly can be understood by the fact that any change in global investment can be decomposed into two effects: change in respective investment rates and change in relative sizes. Between 2010 and 2030, the investment rate in services will increase in both developing and high-income regions. however, as developing countries increase their weight in the global economy, the fact that services investment was, on average, much lower in 2010 in these economies means that the total global increase was much more modest.
22. accordingly, in contrast to the general equilib-rium model adopted for the earlier sections of this chapter, this subsection supplements the earlier analysis with a partial equilibrium approach. This methodology provides better estimates of invest-ment needs because it abstracts from likely substi-tution effects that may arise because of changes in relative prices, technological advances that may improve energy efficiency units, and chang-ing preferences for infrastructure services. Con-sequently, the estimates provided may be higher than actual infrastructure investment. however, because estimates of investment needs provided here do not account for maintenance, includ-ing such maintenance needs into infrastructure investment may result in estimates higher than even the figures presented here.
23. although not the focus of this report, anticipated infrastructure needs are also a priority for many high-income economies, which are experiencing the gradual erosion of their domestic infrastruc-ture and the need to upgrade legacy systems. indeed, the anticipated high relative rental rates in high-income countries could be a major factor supporting future foreign investment in infra-structure in high-income economies.
24. such a definition will, for instance, exclude fixed capital for education, health, and sports and rec-reation because these facilities typically do not reflect the continuously diminishing marginal costs that are characteristic of natural monopolies. likewise, cellular transmitter towers, which are generally well provided by private sector, would not constitute infrastructure, while fiber-optic and digital cable deployment would be considered infrastructure.
25. For reasons documented in endnote 24, this estimate is around 18 percent higher than the
Global Development Horizons The Emerging Pattern of Global Investment 57
Calderón, César a., and luis servén. 2010. “infra-structure in latin america.” policy research work-ing paper 5317, world Bank, washington, DC.
Carrière-swallow, Yan, and luis Felipe Céspedes. Forthcoming. “The impact of Uncertainty shocks in emerging economies.” JournalofInternationalEconomics.
Carruth, alan a., andrew p. Dickerson, and andrew G. henley. 2000. “what Do we Know about investment Under Uncertainty?” Journal of Eco-nomicSurveys 14 (2): 119–53.
Caselli, Francesco, and James D. Feyrer. 2007. “The Marginal product of Capital.” QuarterlyJournalofEconomics 122 (2): 535–68.
Chinn, Menzie D., and eswar s. prasad. 2003. “Medium-term Determinants of Current accounts in industrial and Developing Countries: an empir-ical exploration.” JournalofInternationalEconomics 59 (1): 47–76.
Claessens, stijn, and ronald C. Duncan, eds. 1993. ManagingCommodityPriceRiskinDevelopingCoun-tries. Baltimore: Johns hopkins University press.
Commission on Growth and Development. 2008. TheGrowthReport:StrategiesforSustainedGrowthandInclusiveDevelopment. washington, DC: The world Bank.
Cooley, Thomas F., ramon Marimon, and vicenzo Quadrini. 2004. “aggregate Consequences of lim-ited Contract enforceability.” Journal of PoliticalEconomy 112 (4): 817–47.
Cull, robert J., asli Demirgüç-Kunt, and Jonathan J. Morduch. 2009. “Microfinance Meets the Market.” JournalofEconomicPerspectives 23 (1): 167–92.
Dailami, Mansoor. 1992. “optimal Corporate Debt Financing and real investment Decisions under Controlled Banking systems.” in BusinessFinancein Less Developed Capital Markets, ed. Klaus p. Fischer and George J. papaioannou, 229–49. west-port, Ct: Greenwood press.
Dailami, Mansoor, and robert hauswald. 2007. “Credit-spread Determinants and interlocking Contracts: a study of the ras Gas project.” JournalofFinancialEconomics 86 (1): 248–78.
Dawson, John w. 1998. “institutions, investment, and Growth: new Cross-Country and panel Data evi-dence.” EconomicInquiry 36 (4): 603–19.
Dixit, avinash K., and robert s. pindyck. 1994. Invest-mentUnderUncertainty. princeton, nJ: princeton University press.
Dobbs, richard, susan lund, Charles roxburgh, James Manyika, alex Kim, andreas schreiner, ric-cardo Boin, rohit Chopra, sebastian Jauch, hyun Kim, Megan McDonald, and John piotrowski.
18048, national Bureau of economic research, Cambridge, Ma.
aizenman, Joshua, and nancy p. Marion. 1999. “volatility and investment: interpreting evidence from Developing Countries.” Economica 66 (262): 157–79.
anand, rahul, susanna lundstrom Gable, and sau-rabh Mishra. 2011. “service export sophistication and economic Growth.” policy research working paper 5606, world Bank, washington, DC.
Bardhan, pranab K. 2010. AwakeningGiants,FeetofClay:AssessingtheEconomicRiseofChinaandIndia. princeton, nJ: princeton University press.
Bartelsman, eric J., John C. haltiwanger, and ste-fano scarpetta. 2009. “Measuring and analyzing Cross-Country Differences in Firm Dynamics.” in ProducerDynamics:NewEvidencefromMicroData, ed. timothy Dunne, J. Bradford Jensen, and Mark J. roberts, 15–76. Chicago: University of Chicago press.
Benhabib, Jess, and Mark M. spiegel. 2000. “The role of Financial Development in Growth and invest-ment.” JournalofEconomicGrowth 5 (4): 341–60.
Besley, timothy J. 1995. “property rights and invest-ment incentives: Theory and evidence from Ghana.” JournalofPoliticalEconomy 103 (5): 903–37.
Besley, timothy J., stephen Coate, and Glenn C. loury. 1993. “The economics of rotating sav-ings and Credit associations.” AmericanEconomicReview 83 (4): 792–810.
Bloom, nicholas. 2009. “The impact of Uncertainty shocks.” Econometrica 77 (3): 623–85.
Bloom, nicholas, and John M. van reenen. 2007. “Measuring and explaining Management practices across Firms and Countries.” QuarterlyJournalofEconomics 122 (4): 1351–1408.
Caballero, ricardo J. 1991. “on the sign of the invest-ment-Uncertainty relationship.” American Eco-nomicReview 81 (1): 279–88.
———. 2008. “on the Macroeconomics of asset shortages.” in TheRoleofMoney:MoneyandMon-etaryPolicyintheTwenty-FirstCentury, ed. andreas Beyer and lucrezia reichlin, 272–83. Frankfurt: european Central Bank.
Caballero, ricardo J., emmanuel Farhi, and pierre-olivier Gourinchas. 2008. “an equilibrium Model of ‘Global imbalances’ and low interest rates.” AmericanEconomicReview 98 (1): 358–93.
Calderón, César a., enrique Moral-Benito, and luis servén. 2011. “is infrastructure Capital produc-tive? a Dynamic heterogeneous approach.” policy research working paper 5682, world Bank, wash-ington, DC.

58 The Emerging Pattern of Global Investment Global Development Horizons
———. 2009. “Misallocation and Manufacturing tFp in China and india.” QuarterlyJournalofEconomics 124 (4): 1403–48.
Jordà, Òscar. 2009. “simultaneous Confidence regions for impulse responses.” ReviewofEconom-icsandStatistics 91 (3): 629–47.
Jorgenson, Dale w. 1963. “Capital Theory and invest-ment Behavior.” AmericanEconomicReview 53 (2): 47–56.
Kalemi-ozcan, sebnem, and Bent e. sørensen. 2012. “Misallocation, property rights, and access to Finance: evidence from within and across africa.” working paper 18030, national Bureau of eco-nomic research, Cambridge, Ma.
Kapur, Devesh, and ravi ramamurti. 2001. “india’s emerging Competitive advantage in services.” AcademyofManagementExecutive 15 (2): 20–33.
Keynes, John Maynard. 1936. TheGeneralTheoryofEmployment,InterestandMoney. new York: har-court, Brace & world.
Knowles, stephen. 2001. “are the penn world tables Data on Government Consumption and investment Being Misused?” EconomicsLetters 71 (2): 293–98.
Koopman, robert B., Zhi wang, and shang-Jin wei. 2012. “estimating Domestic Content in exports when processing trade is pervasive.” Journal ofDevelopmentEconomics 99 (1): 178–189.
Kraay, aart C., norman v. loayza, luis servén, and Jaume ventura. 2006. “Country portfolios.” JournaloftheEuropeanEconomicAssociation 3 (4): 914–45.
Kraay, aart C., and Jaume ventura. 2000. “Current accounts in Debtor and Creditor Countries.” QuarterlyJournalofEconomics 115 (4): 1137–66.
lee, Jaewoo, and Kwanho shin. 2001. “The role of a variable input in the relationship Between invest-ment and Uncertainty.” AmericanEconomicReview 90 (3): 667–80.
levine, ross. 2005. “Finance and Growth: Theory and evidence.” in HandbookofEconomicGrowth, vol.1, ed. philippe aghion and steven n. Durlauf, 866–934. amsterdam: elsevier.
li, wei, and lixin Colin Xu. 2004. “The impact of privatization and Competition in the telecommu-nications sector around the world.” JournalofLawandEconomics 47 (2): 395–430.
lorenzoni, Guido, and Karl walentin. 2007. “Finan-cial Frictions, investment and tobin’s q.” work-ing paper 13092, national Bureau of economic research, Cambridge, Ma.
lucas, robert e., Jr. 1990. “why Doesn’t Capital Flow from rich to poor Countries?” AmericanEconomicReview 80 (2): 92–6.
2010. FarewelltoCheapCapital?TheImplicationsofLong-TermShiftsinGlobalInvestmentandSaving. washington, DC: McKinsey Global institute.
easterly, william r., and ross levine. 2001. “it’s not Factor accumulation: stylized Facts and Growth Models.” World Bank Economic Review 15 (2): 177–219.
ettinger, stephen, Michael schur, stephan von Klaudy, Georgina Dellacha, and shelly hahn. 2005. “Developing Country investors and operators in infrastructure.” Trends and Policy Options Series 3, public-private infrastructure advisory Facility, washington, DC.
Fao (Food and agriculture organization of the United nations). Faostat database. Fao, rome. http://faostat.fao.org.
Feldstein, Martin s., and Charles Y. horioka. 1980. “Domestic saving and international Capital Flows.” EconomicJournal 90 (358): 314–29.
Fernández-villaverde, Jesús, pablo Guerrón- Quintana, Juan F. rubio-ramírez, and Matin Uribe. 2011. “risk Matters: The real effects of volatility shocks.” AmericanEconomicReview 101 (4): 2530–61.
Feyrer, James D., and Jay C. shambaugh. 2012. “Global savings and Global investment: The transmission of identified Fiscal shocks.” American EconomicJournal:EconomicPolicy 4 (2): 95–144.
Fisman, raymond J. 2001. “estimating the value of political Connections.” AmericanEconomicReview 91 (4): 1095–102.
Gtap (Global trade analysis project) database. Center for Global trade analysis, Department of agricultural economics, purdue University, west lafayette, in. https://www.gtap.agecon.purdue .edu/#2.
Gupta, sanjeev, alvar Kangur, Chris papageorgiou, and abdoul wane. 2011. “efficiency-adjusted public Capital and Growth.” working paper wp/11/217, international Monetary Fund, washington, DC.
hayashi, Fumio. 1982. “tobin’s Marginal q and aver-age q: a neoclassical interpretation.” Econometrica 50 (1): 213–24.
hesse, heiko, andreas a. Jobst, and Juan solé. 2008. “trends and Challenges in islamic Finance.” WorldEconomics 9 (2): 175–93.
holmström, Bengt r., and Jean tirole. 1997. “Finan-cial intermediation, loanable Funds, and the real sector.” Quarterly Journal of Economics 112 (3): 663–91.
hsieh, Chang-tai, and peter J. Klenow. 2007. “relative prices and relative prosperity.” AmericanEconomicReview 97 (3): 562–85.

Global Development Horizons The Emerging Pattern of Global Investment 59
lucas, robert e., Jr., and edward C. prescott. 1971. “investment Under Uncertainty.” Econometrica 39 (5): 659–81.
Mankiw, n. Gregory, David h. romer, and David n. weil. 1992. “a Contribution to the empirics of economic Growth.” QuarterlyJournalofEconomics 107 (2): 407–37.
Mauro, paolo. 1995. “Corruption and Growth.” Quar-terlyJournalofEconomics 110 (3): 681–712.
McDonald, robert l., and Daniel siegel. 1986. “The value of waiting to invest.” Quarterly Journal ofEconomics 101 (4): 707–27.
Meier, Gerald M., and Dudley seers, eds. 1984. PioneersinDevelopment. new York: oxford University press.
Mostrous, Yiannis G., elliott h. Gue, and David F. Dittman. 2010. The Rise of the State: ProfitableInvestingandGeopoliticsinthe21stCentury. Upper saddle river, nJ: Ft press.
olken, Benjamin a. 2007. “Monitoring Corruption: evidence from a Field experiment in indonesia.” JournalofPoliticalEconomy 115 (2): 200–49.
pFi (project Finance international). newsletter data-base and website, Thomson reuters, london. http://www.pfie.com.
pritchett, lant. 2000. “The tyranny of Concepts: CUDie (Cumulated, Depreciated, investment effort) is not Capital.” JournalofEconomicGrowth 5 (4): 361–84.
piDa (programme for infrastructure Development in africa). 2011. Interconnecting, Integrating, andTransformingaContinent. tunis, tunisia: african Development Bank.
rada, nicholas e., and steven t. Buccola. 2012. “agri-cultural policy and productivity: evidence from Brazilian Censuses.” AgriculturalEconomics 43 (4): 355–67.
rodrik, Dani. 2009. “industrial policy: Don’t ask why, ask how.” MiddleEastDevelopmentJournal 1 (1): 1–29.
romer, paul M. 1990. “endogenous technological Change.” Journal of Political Economy 98 (5/2): s71–s102.
servén, luis. 2003. “real-exchange-rate Uncertainty and private investment in lDCs.” ReviewofEco-nomicsandStatistics 85 (1): 212–18.
summers, robert, and alan w. heston. 1991. “penn world table (Mark 5): an expanded set of interna-tional Comparisons, 1950–1988.” QuarterlyJour-nalofEconomics 106 (2): 327–68.
tobin, James. 1969. “a General equilibrium approach to Monetary Theory.” JournalofMoney,CreditandBanking 1 (1): 15–29.
tornell, aaron, and Frank westermann. 2002. “Boom-Bust Cycles in Middle income Countries: Facts and explanation.” International Monetary Fund StaffPapers 49 (special issue): 111–55.
Un (United nations). 1951. “Measures for the eco-nomic Development of Underdeveloped Coun-tries.” report by a Group of experts appointed by the secretary-General of the United nations, Un Department of economic affairs, new York.
UniDo (United nations industrial Development orga-nization) industrial statistics database. UniDo, vienna, austria. http://www.unido.org/statistics .html.
world Bank. 2006. Where Is theWealth ofNations?MeasuringCapitalforthe21stCentury. washington, DC: world Bank.
———. 2008. ThePoliticalEconomyofPolicyReform:IssuesandImplicationsforPolicyDialogandDevel-opmentOperations. washington, DC: world Bank.
———. 2011. TheChangingWealthofNations:Measur-ingSustainableDevelopmentintheNewMillennium. washington, DC: world Bank.
———. 2012a. China 2030: Building a Modern,Harmonious, and Creative High-Income Society. washington, DC: world Bank and Development research Center of the state Council, the people’s republic of China.
———. 2012b. GlobalFinancialDevelopmentReport2013:Rethinking theRole of the State inFinance. washington, DC: world Bank.
———. 2012c. GlobalInvestmentPromotionBestPrac-tices2012. washington, DC: world Bank.
———. 2012d. WorldBankGroupInfrastructureStrat-egyUpdateFY2012–2015:TransformationThroughInfrastructure. washington, DC: The world Bank.
world Bank edstats database. education statistics website, world Bank, washington, DC. http://www.world bank.org/education/edstats.
world Bank Global economic Monitor database. world Bank, washington, DC. http://data.worldbank.org/ data-catalog/global-economic-monitor
world Bank private participation in infrastructure database. world Bank, washington, DC. http://ppi.worldbank.org/.
world Bank world Development indicators database. world Bank, washington, DC. http://data.world bank.org/data-cata log/world-development- indicators.
