the empirical relationship between the value of rupee and
TRANSCRIPT

The empirical relationship between the value of rupee andperformance of information technology firms: evidence fromIndia
Author
Paramati, SR, Gupta, R, Maheshwari, S, Nagar, V
Published
2016
Journal Title
International Journal of Business and Globalisation
Version
Accepted Manuscript (AM)
Copyright Statement
© 2016 Inderscience Publishers. This is the author-manuscript version of this paper.Reproduced in accordance with the copyright policy of the publisher. Please refer to the journalwebsite for access to the definitive, published version.
Downloaded from
http://hdl.handle.net/10072/142924
Link to published version
https://www.inderscienceonline.com/doi/abs/10.1504/IJBG.2016.076819
Griffith Research Online
https://research-repository.griffith.edu.au
1
The empirical relationship between the value of rupee and performance of information
technology firms: Evidence from India
Sudharshan Reddy Paramati
Department of Accounting, Finance and Economics,
Griffith Business School, Griffith University,
Brisbane, Queensland-4111, Australia;
Email: [email protected]
(Corresponding author)
Rakesh Gupta
Department of Accounting, Finance and Economics,
Griffith Business School, Griffith University,
Brisbane, Queensland-4111, Australia;
Email: [email protected]
Suneel Maheshwari
Department of Accounting,
Eberly College of Business and Information Technology,
Indiana University of Pennsylvania, Indiana, PA 15705, USA
Vinu Nagar
Swinburne University of Technology,
PO Box 218, Mail 25, Cnr John and Wakefield Streets,
Hawthorn VIC 3122 Australia
This paper can be cited as: Paramati, S.R., Gupta, R., Maheshwari, S. and Nagar, V. (2016)
“The empirical relationship between the value of rupee and performance of information
technology firms: Evidence from India” International Journal of Business and Globalization
(forthcoming).

2
The empirical relationship between the value of rupee and performance of information
technology firms: Evidence from India
Abstract
This study aims to investigate the dynamic linkage between exchange rates of Indian Rupee-US
Dollar and stock prices of four Indian information technology (IT) companies. The study utilizes
daily data of closing stock prices of IT companies and exchange rates for the period of August
2004 to September 2013. Empirical results of AGDCC GARCH model suggest that correlations
are time-varying and are largely negatively associated over time. This indicates that there is an
inverse relationship between the movements of exchange rates and the performance of IT
companies. Further, cointegration test results show no significant long-run equilibrium
relationship between exchange rates and stock prices of IT companies. Finally, Granger non-
causality test results reveal that the null hypothesis of IT companies does not Granger cause
exchange rates is strongly rejected at 5% significance level and no evidence of reverse causality
is found. These findings suggest that exchange rates do not drive the performance of IT
companies in India.
JEL classification: C22; F31; L86
Keywords: Exchange rates; IT companies’ performance; AGDCC-GARCH model

3
1. Introduction
Dynamic linkages between stock prices and exchange rates have received substantial amount of
attention from academic researchers, economists and policy makers since the last decade.
Investigation of this relationship has gained momentum particularly in the aftermath of Asian
financial crisis of 1997-98 (Granger, Huang & Yang 2000; Ramasamy & Yeung 2001). In the
recent years, world markets have become interdependent particularly due to acceptance of
flexible exchange rate system and relaxation of controls on foreign transactions and investments.
These changes have opened doors to investments in international markets, flexibility to readjust
to external shocks and automatic adjustment of balance of payments. It has also increased the
volatility of exchange rates and risks associated with international investments. Therefore, it is
important for all market participants to understand the nature of this relationship between
exchange rates and stock prices in order to make cautious investment decisions.
This paper develops around the relationship between Indian Rupee - US Dollar exchange rate
and performance of information technology (IT) firms of India. India’s exchange rate policy
underwent a shift from fixed exchange rate system to floating exchange rate system in 1993. This
change has increased the volatility of Rupee with respect to Dollar, especially in recent periods.
Generally, a nation with appreciating currency is perceived as a strong nation while that with a
depreciating currency is considered less attractive (see, Gould and Kamin, 2001). After Asian
financial crisis 1997-98 and global financial crisis 2007-08, policy makers in many countries are
not concerned with currency depreciation since it helps to improve market share of exports and
relaxes monetary conditions, see Tsai (2012) for a detailed explanation. Similar is the case of
Indian IT industry which is a major exporter of software and solutions to the US. Thus, most IT
companies’ experience monetary gain when Rupee weakens against US dollar. This is in line

4
with the traditional economic theory which states that movements in exchange rates lead to
movements in stock prices. It proposes a positive correlation between exchange rates and stock
prices. Therefore a weaker Rupee is good for India’s IT sector. But this relationship is beneficial
to India only in short and medium-term. In long term, a depreciating Rupee is a matter of
concern because it increases the cost of imports and utilities thereby increasing the price of
foreign products or services (Yang et al., 2014). It may also affect accumulated foreign exchange
payment obligations of IT companies (Prasad and Panduranga Reddy, 2009).
Although the traditional economic view perceives a causal relationship from exchange rates to
stock prices, empirical evidence provides contradictory results varying from reverse causality,
bidirectional causality to no causality. Our study aims to understand the relationship between
exchange rates and stock prices from the standpoint of India’s IT industry. This is an important
issue to be addressed as the performance of IT firms has significant impact on the Indian
economy. For instance, healthier performance of IT companies provides high-salary job
opportunities which indirectly creates enormous employment opportunities and raises the income
level. Therefore, it is important to understand their relationship. For example, if there is a causal
relationship between the two variables and it runs from exchange rates to stock prices, then
downturn in the Indian IT industry, in form of increasing cost of imports and utilities, can be
averted and controlled by keeping an eye on Dollar-Rupee exchange rates but if there is an
opposite relationship between the two variables, then IT firms can focus on domestic policies
and reforms to stabilize their performance. To the best our knowledge there is no study which
has investigated the relationship between exchange rates and stock prices of Indian IT
companies.

5
This paper aims to examine the dynamic relationship between the value of Rupee and
performance of Indian IT companies. Understanding the nature and direction of causal
relationship between exchange rates and stock prices is important for IT companies as it will
assist them to manage their exposure to foreign contracts. This study also has important
implications for policy makers and the investment community. It is common to include cash as
an asset in the investment portfolio especially in the case of professionally managed portfolios.
Therefore, an understanding of the relationship between exchange rates and stock prices may
equip portfolio managers to handle currency risk in a competent manner. Empirical literature
argues that currency was one of the main sources for the Asian Financial Crisis in 1997. Sharp
depreciation of the Thai Baht is believed to trigger depreciation of other East Asian currencies,
Brazil and Russia which eventually led to demise of Asian stock markets (Khalid and Kawai,
2003). Awareness about relationship between exchange rates and stock prices can prepare Indian
IT firms in taking preventive actions before the spread of a crisis. Further, findings of this study
may also be useful for other IT growing emerging economies to understand the link between
exchange rates and the performance of IT firms.
Growth and development of India’s IT industry has caught the attention of the world markets.
Though India’s domestic IT market is expanding rapidly, the most important factor that has
driven this progress is its export market. The two main components of India’s IT industry are IT
Services and IT-enabled services (IT-ES) such as business process outsourcing (BPO). Together
they have been a phenomenal success when measured against its share in India’s GDP, growth in
exports and employment. The industry’s contribution to India’s GDP has increased from 1.2% in
1998 to 7.5% in 2012 (NASSCOM, 2012). India’s GDP is expected to grow from 4.7% in 2012
to 6.4% in 2014 (World Bank, 2015) in which the IT industry’s contribution is around 40% of

6
the country's GDP growth. The IT industry contributes 14% of total India’s exports. Exports
dominate the industry and account for 77% of the total industry’s revenue. History of India’s IT
exports dates back to 1970’s when TATA Consultancy was established. It was only during this
time when India started exporting its IT services in the foreign market. The subsequent
devaluation of the Indian rupee in 1991, which led to liberalisation of government policies, and
the introduction of Special Economic Zone (SEZ) policy in April 2000 made it possible for
India’s IT industry to grow at an accelerated pace. The main objective of this policy was to boost
economic growth, attract foreign investments into India and to provide an environment for
international exports that was easy and hassle-free (Lateef, 1997). Since then India’s IT service
exports has increased from 31.9% in 2000 to 47.0% in 2010. According to Nasscom, in 2012 the
industry’s total revenue was $100 billion, of which revenues from exports stood around at $69
billion and domestic revenues were about $31 billion. India’s software exports are expected to
increase by 13-15% in the next fiscal year 2015. In Dollar terms, it is expected to rise from $86
billion as of March 2014 to $99 billion. They have also estimated that the overall Indian IT
industry is expected to grow to about $300 billion by 2020 (NASSCOM, 2012). This industry is
considered to be an employment generator, providing employment directly and indirectly to
about 11.5 million people in the country. The above data shows the increasing importance of IT
sector’s role in Indian exports. This sector is also generally perceived to be the sector that has led
economic growth in India.
The leading role of this sector in Indian economy provides primary motivation for this study. We
therefore examine the dynamic linkage between the value of Rupee and performance of four
Indian IT firms (HCL, INFOSYS, TATA and WIPRO) over the period from 2004 to 2013. These
IT companies are the largest IT firms in India and represent more than 50% of market

7
capitalization of IT firms listed in Indian stock markets. In order to determine the time-varying
relationship between exchange rates and stock prices, we use the Asymmetric Generalized
Dynamic Conditional Correlations (AGDCC) model. Our results suggest that movements
between exchange rates and stock prices are negatively associated. Going further, we examine
the long-run relationship between these variables using cointegration methodology.
Cointegration test results show no significant long-run equilibrium relationship among these
variables. In the third and final step, we determine the direction of causality between these
variables using Toda-Yamamoto Granger non-causality test. The results reveal that causality
runs from stock prices of IT companies to exchange rates. We do not find any reverse or bi-
directional causality. Our results are consistent with the portfolio balance approach (Branson et
al., 1977; Hatemi-J and Irandoust, 2002; Tsagkanos and Siriopoulos, 2013; Chkili and Nguyen,
2014) which hypothesis causality from stock prices to exchange rates.
The remaining paper is organized a follows. Section 2 presents brief literature survey that
examines the interaction between stock price and exchange rate movements and vice-versa.
Section 3 provides the details on nature of data and methodology used in the study. Section 4
discusses the empirical results and section 5 provides concluding remarks.
2. Literature review
With the gradual implementation of macroeconomic reforms and liberalization of the Indian
economy since the early 1990s, India’s exchange rate system has evolved over time. Post-
independence, India’s exchange rate system has seen a shift from par value system to basket-peg
system and further to a managed floating exchange rate system. Since independence until 1971,
India had adopted the par value system where Indian rupee’s par value was fixed against 4.15
grains of gold. During this period, in 1966, the Indian rupee began to devalue in terms of gold

8
which led to the reduction of par value to 1.83 grains of gold. Thereafter, it remained constant
until 1971. In 1971, under the Bretton Woods agreement, Indian rupee was linked to pound
sterling, but this highlighted the weakness of being associated with a single currency. To
overcome this weakness and to ensure stability of the exchange rate, the rupee was pegged to a
basket of currencies until the early 1990s (Dua and Ranjan, 2010).
The financial sector reforms in the early 1990s brought dramatic change in the functioning of
India’s financial sector. In 1993, India has adopted a flexible exchange rate system under which
change in exchange rates is determined by market demand and supply for currencies and is more
frequent than that in a fixed exchange rate system. These frequent changes in exchange rates can
be attributed to changes in demand and supply of currencies that would have an impact on stock
prices of both countries. A reverse relationship between the two variables is also anticipated. In
this paper we attempt to determine the nature of relationship between Rupee-Dollar exchange
rates and stock prices of Indian IT industry.
The traditional economic theory suggests that stock prices serve as discounted present value of a
firm’s expected future cash flows and therefore any impact of the firm’s cash flows will affect its
stock price in an efficient market. Thus, when a country’s currency depreciates, it makes their
exports more attractive and competitive which leads to an increase in stock prices. According to
this approach, there is a causal and unidirectional relationship from the exchange rates to the
stock prices (Tsai, 2012). Aggarwal (1981) documents this relationship between exchange rates
and stock prices. He studied the impact of floating exchange rates on stock prices using a
monthly dataset of US stock prices for the period 1974-1978. This period signifies the change in
exchange rate system in the US from fixed to floating. His research found that US Dollar was
positively correlated with US stock prices during this period; a decrease in US Dollar resulted in

9
a decline in stock prices. Similar relationship between exchange rates and stock prices was found
by Abdalla and Murinde (1997) using bivariate vector autoregressive model on monthly
observations from 1985-1994. These empirical studies assert a causal relationship where
exchange rates lead stock prices.
Conversely, stock price movements can also influence the movements in exchange rates. The
second school of thought proposed by Branson et al. (1977), known as the portfolio balance
approach, hypothesizes a causal relationship arising from stock prices leading to exchanges rates.
This approach believes that exchange rates are determined by market mechanisms thus causing
capital account transactions influencing exchange rate dynamics. It argues that a country attracts
foreign capital flows when its stock market is flourishing that is, stock prices increase and
domestic currency will appreciate. It establishes a causal relationship from the stock prices to
exchange rates. Hatemi–J and Irandoust (2002) demonstrate this causal relationship for Sweden
using Toda-Yamamoto Granger non-causality test for the period 1993 to 1998. A recent study by
Tsagkanos and Siriopoulos (2013) uses structural nonparametric cointegrating regression model
to study the relationship between stock prices and exchange rates. They also find a causal
relationship from stock prices to exchange rates for European Union (EU) in the long-run and for
US in the short-run. Chkili and Nguyen (2014) also find that stock prices have a strong effect on
exchange rates in normal as well as in times of high volatility. Similar results are found by Kim
(2003)Kim (2003) and Ibrahim and Aziz (2003) for the US and Malaysia, respectively.
From the above discussion we can see that there is theoretical and empirical support for causality
between exchange rates and stock prices in either direction. Bahmani-Oskooee and Sohrabian
(1992) were the first to find bidirectional causality between the two in the short-run, but they do
not find such evidence in the long-run. Other studies such as, Ajayi and Mougoue (1996);

10
Caporale et al. (2014); Pan et al. (2007) have also found mixed results. Using a sample of eight
advanced economies, Ajayi and Mougoue (1996) find negative causal relationship from stock
prices to currency value in the short-run. But in the long-run, they find positive relationship in
the same direction. Contrastingly, they also find a negative causal relationship from exchange
rates to stock prices in the short- as well as long-run. Caporale et al. (2014) study the
interdependence between stock prices and exchange rates for the US, the UK, Canada, Japan, the
EU and Switzerland. They find unidirectional causal relationship from stock returns to exchange
rates in the US and the UK whereas an opposite causal relationship for the case of Canada. Study
presents evidence of a bidirectional relationship in the EU and Switzerland in the short-run
during the banking crisis period from 2007 to 2010. Variance in linkages between stock prices
and exchange rate is also found by Pan et al. (2007) for seven East Asian countries from 1988 to
1998. They find that a causal relationship exists from exchange rates to stock prices for Hong
Kong, Japan, Malaysia and Thailand prior to the Asian financial crisis of 1997. But during the
crisis period, they find causal relationship in the same direction for all countries except Malaysia.
They also find causality in the opposite direction for Hong Kong, Korea and Singapore prior to
the crisis but no causality during the crisis. Noman et al. (2012) also do not find any causality
between foreign exchange market and stock market of Bangladesh during the stock market crash
of 1996. But on the other hand, Lee-Lee and Hui-Boon (2007), who present detailed account of
exchange rate volatility of Malaysian ringgit, Indonesian rupiah, Thai baht and Singapore dollar
during the pre- and post-Asian crisis in 1997, find that stock markets have significant influence
on exchange rates in all economies. Several other studies (Bartov and Bodnar, 1994; Bodnar and
Gentry, 1993; Griffin and Stulz, 2001; Jorion, 1990, 1991; Ozair, 2006) have failed to find any
significant interdependence between the movements of stock prices and exchange rates of US
11
companies. Griffin and Stulz (2001) also conclude that weekly changes in exchange rates have
negligible impact on industry performance in the short-run.
Based on the review of current literature we conclude that though there is a clear theoretical
explanation to the relationship between exchange rates and stock prices, empirical evidence is
contradictory. Ramasamy and Yeung (2005) argue that the results are diverse due to the nature of
interaction between exchange rates and country’s stock prices, which is sensitive to uncertainties
in market structures within an economy. Pan et al. (2007) suggests that linkages differ across
countries with respect to exchange rate system, size of trade, the extent of control on capital, and
size of the stock market. Research thus far has ignored the perspective of India. This study aims
to test this relationship from the standpoint of Indian market. This paper will add to the body of
existing knowledge by examining the dynamic linkage between Rupee-Dollar exchange rates
and performance of Indian IT industry. Change in India’s exchange rate system accompanied by
the efforts of the Indian government to boost its IT industry by developing Special Economic
Zones (SEZs) has made its IT sector export-dominant. Sizeable workforce, low cost of labour,
fluency in English language and an export based growth industry have also added to industry’s
competitive advantage; see Crookes and McManus (2013). Previous literature focusing on this
subject with respect to Indian IT sector is scant. Agrawal et al. (2010) evaluate the
interdependence and causal relationship between stock market volatility and movements in
Dollar-Rupee rates. Using a correlation model and Granger causality test, they identify that the
two variables are negatively correlated, rising from stock prices leading to exchange rates during
the period 2007-09.
Authors have also looked at the related issue of entrepreneurship in Asian markets and Indian
markets, including expanding the scope of methodologies used in entrepreneurships research,
12
such as; Dana (2000, 2007), and Dana and Dana (2005). Another study by Prasad and
Panduranga Reddy (2009) finds that during the global financial crisis of 2007-08, foreign
institutional investors withdrew their investments fearing economic slowdown which resulted in
sharp depreciation of the Rupee. Due to huge withdrawals, the Indian stock market suffered its
biggest stock market crash, i.e. Sensex, fell below 10,000 points in October 2008 (Bombay Stock
Exchange Ltd., 2008). Therefore to better understand the relationship between exchange rates
and stock prices from an Indian perspective, this study will assess their dynamic relationship
using AGDCC GARCH model, cointegration methodology and Granger non-causality test,
which is discussed in the next section.
3. Methodology, data and preliminary statistics
In this study, we employ various econometric techniques to identify the empirical relationship
between exchange rates of Indian Rupee-US Dollar and stock prices of four major IT companies
of India. To examine dynamic time-varying correlations we use AGDCC GARCH model and to
estimate long-run equilibrium relationship we use Bivariate Cointegration methodology.
Similarly, to identify the direction of causality between these variables we utilize Granger non-
causality test. The following is the brief description of above mentioned empirical models.
Identifying order of integration
To identify the order of integration of Indian Rupee-US Dollar exchange rates and stock prices
of IT companies we employ conventional unit root tests namely; Augmented Dickey-Fuller
(ADF) test (Dickey and Fuller, 1979) and Phillips-Perron (PP) test (Phillips and Perron, 1988).
These unit root tests are employed to examine whether given data series is stationary or non-
stationary at levels. Both ADF and PP tests have similar hypothesis that is; the null hypothesis of
unit root (non-stationary) is tested against the alternative hypothesis of no unit root (stationary).
13
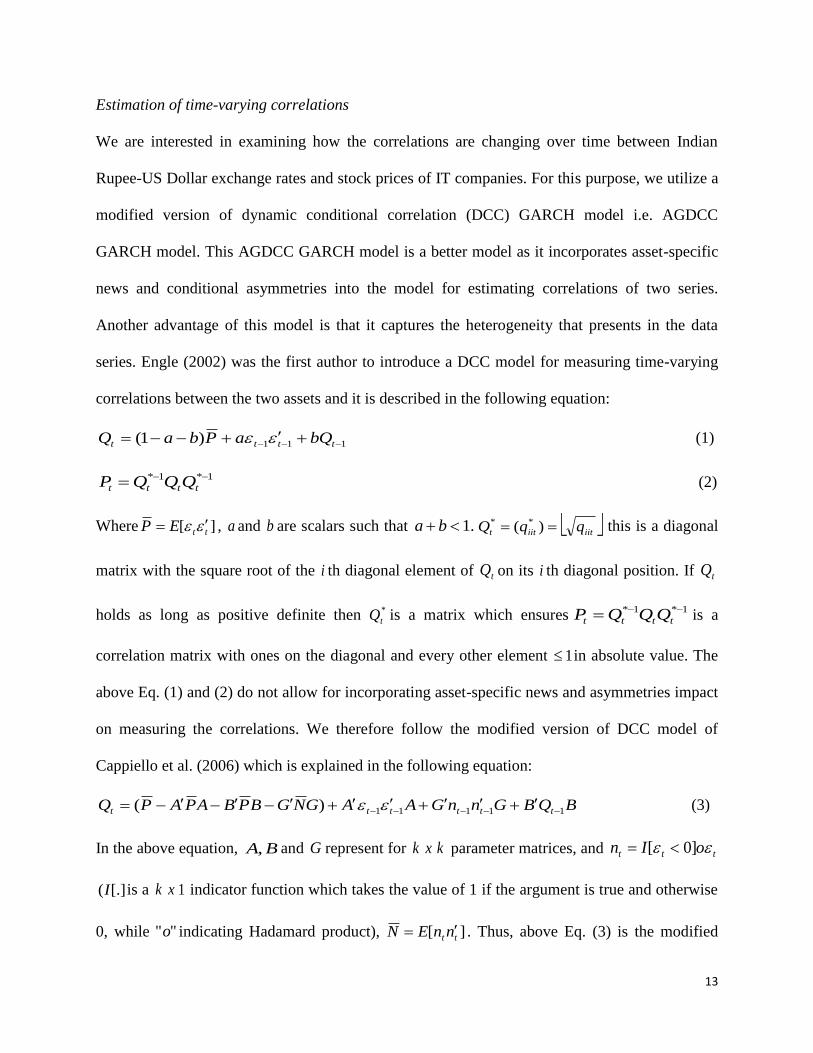
Estimation of time-varying correlations
We are interested in examining how the correlations are changing over time between Indian
Rupee-US Dollar exchange rates and stock prices of IT companies. For this purpose, we utilize a
modified version of dynamic conditional correlation (DCC) GARCH model i.e. AGDCC
GARCH model. This AGDCC GARCH model is a better model as it incorporates asset-specific
news and conditional asymmetries into the model for estimating correlations of two series.
Another advantage of this model is that it captures the heterogeneity that presents in the data
series. Engle (2002) was the first author to introduce a DCC model for measuring time-varying
correlations between the two assets and it is described in the following equation:
111)1( tttt bQaPbaQ (1)
1*1* tttt QQQP (2)
Where ][ ttEP , a and b are scalars such that .1ba iitiitt qqQ )( ** this is a diagonal
matrix with the square root of the i th diagonal element of tQ on its i th diagonal position. If tQ
holds as long as positive definite then *
tQ is a matrix which ensures1*1* tttt QQQP is a
correlation matrix with ones on the diagonal and every other element 1 in absolute value. The
above Eq. (1) and (2) do not allow for incorporating asset-specific news and asymmetries impact
on measuring the correlations. We therefore follow the modified version of DCC model of
Cappiello et al. (2006) which is explained in the following equation:
BQBGnnGAAGNGBPBAPAPQ tttttt 11111)( (3)
In the above equation, BA, and G represent for k x k parameter matrices, and ttt oIn ]0[
[.](I is a k x 1 indicator function which takes the value of 1 if the argument is true and otherwise
0, while ""o indicating Hadamard product), ][ tt nnEN . Thus, above Eq. (3) is the modified

14
version of DCC i.e. AGDCC model. The Eq. (3) can be further interpreted, If the matrices of
BA, and G are replaced by scalars, then asymmetric DCC model can be treated as a special
case of AGDCC. In a similar way, if matrix 0G , then generalized DCC is a special case of
AGDCC. The expectations are infeasible for P and N are replaced with sample analogues,
t
T
t tT
1
1 andt
T
t t nnT
1
1 , respectively.
Investigation of long-run relationship
The above estimated correlations will reveal how the dynamic relationship between the studied
variables is changing over time. However, this will not convey whether these variables have
long-run relationship or not. For this reason, we utilize VAR based cointegration methodology
developed by Johansen (1988, 1991) the VAR model with order p can be written as follows:
tptptt zAzAcz .........11 (4)
Where tz is an n x1 vector of variables that are integrated of order one i.e. I (1), and t is a zero
mean with white noise vector process. This VAR model can be re-written as follows:
tit
p
i
itt zzcz
1
1
1 (5)
Where IAp
i
i 1
and
p
ij
ji A1
. If the coefficient matrix has reduced rank nr , then
there exist n x r matrices and each with rank r such that ' and tz' is stationary. r is
the number of cointegrating relationships, the elements of are known as the adjustment
parameters in the vector error correction model and each column of β is a cointegrating vector.
Johansen proposed two different likelihood ratio tests such as, trace )( trace and maximum
eigenvalue )( max tests. These tests are estimating using the following equations:

15
)1ln()(1
g
ri
itrace Tr (6)
)1ln()1,( 1max
rTrr (7)
Where T is the sample size, i
and 1
r are the estimated values of the characteristic roots
obtained from the matrix. For trace test, the null hypothesis of r cointegrating vectors is
tested against the alternative hypothesis of n cointegrating vectors. Similarly, for maximum
eigenvalue tests, the null hypothesis of r cointegrating vectors is tested against the alternative
hypothesis of 1r cointegrating vectors. We utilize MacKinnon et al. (1999) 5% critical values
for the empirical results interpretation of this test.
Identifying the direction of causality
The above analysis will disclose the time-varying dynamic linkage and long-run equilibrium
relationship between Indian Rupee-US Dollar exchange rates and IT sector performance.
However, these results will not reveal the direction of causality between these variables.
Therefore, to identify which variable causes which one, we employ Toda-Yamamoto version of
Granger non-causality test. Toda and Yamamoto (1995) proposed an alternative procedure for
testing causality in the framework of integrated and cointegrated variables. The advantage of this
model is that it does not require the pre-testing of unit root tests and cointegration. This does not
mean that it replaces the conventional hypothesis testing; rather it is a complementary method.
This model uses a modified Wald (MWALD) test to examine restriction on the parameters of the
VAR )(k model, where k is the optimal lag length. To determine the optimal lag length for
VAR )(k we used Akaike Information Criterion (AIC) and also cross checked for residual serial
correlations by using Autocorrelation Lagrange Multiplier (LM) test to make sure that the
selected lag length does not have the problem of serial correlation. This approach has an

16
asymptotic chi-squared distribution with k degrees of freedom in the limit when a VAR
(max)][ dk is estimated. Since these are standard econometric models so we have omitted
detailed equations and assumptions of individual models for brevity. Broadly there are two steps
involved in estimating this model. The first step is to find out the appropriate lag length in the
VAR framework and determine the order of integration for (max)d . Once the first step is
completed then we can estimate VAR model by using levels data with a total of (max)][ dkp
lags. The second or final step is to apply the standard Wald criterion to the matrix of the first k
VAR coefficients. Where, (max)d is the maximal order of integration for the series in the
system. For instance; there are two variables in the system and one variable is integrated of order
I (1) and other one is order I (2). In such case, we consider (max)d is 2; and if both variables are
integrated with order I (1) then (max)d is 1.
Data
This study utilizes daily closing prices data of four major IT companies that represent India’s IT
industry, namely, HCL, INFOSYS, TATA and WIPRO, and Indian Rupee-US Dollar exchange
rates for the time period of 25 August 2004 to 05 September 2013. Data for closing prices and
exchange rates are collected from Bombay Stock Exchange (BSE) and Reserve Bank of India
(RBI), respectively. This data set has been utilized for achieving the study objectives.
Preliminary statistics
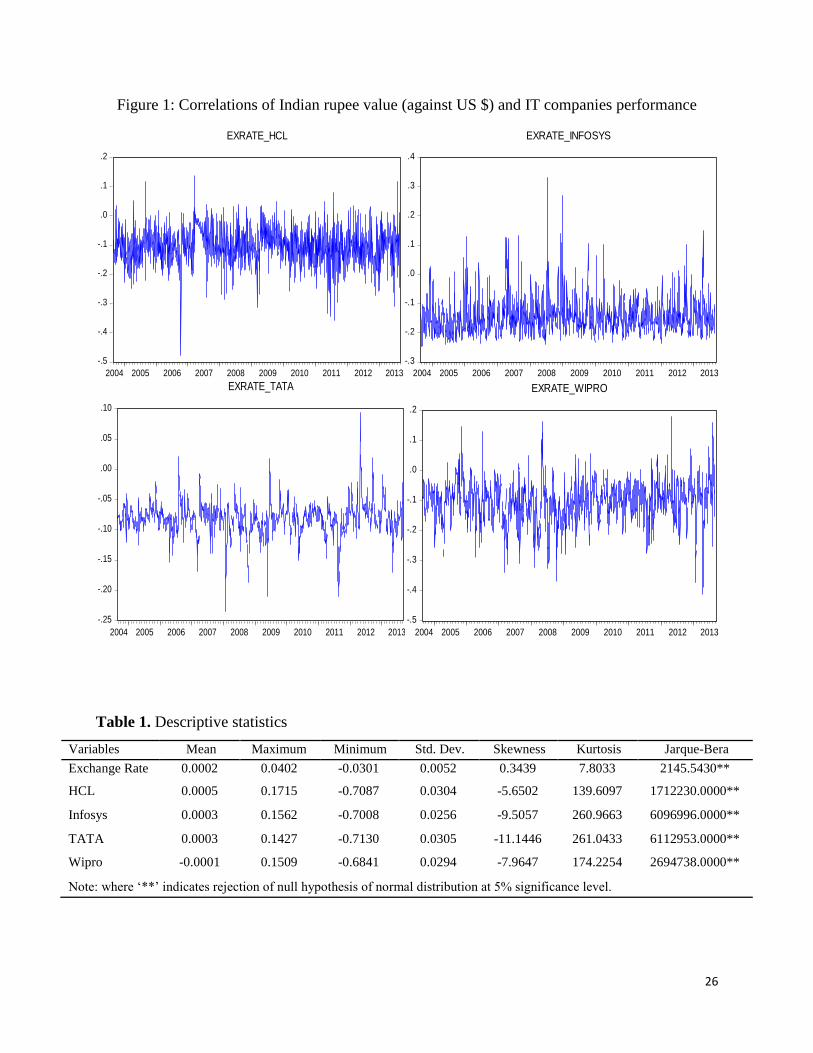
To understand the statistical properties of the data series we have applied descriptive statistics
and results are presented in Table 1. Results show that HCL has the highest mean return (0.0005)
and Wipro has a negative mean return (-0.0001). The maximum mean return is attained by HCL
(0.1715) and followed by Infosys (0.1562), Wipro (0.1509), TATA (0.1427) and exchange rate
(0.0402). The minimum mean return for all four IT companies and exchange rate is negative.

17
The highest standard deviation is found for TATA (0.0305) and HCL (0.0304) and the lowest is
for exchange rate (0.0052). This indicates that TATA and HCL are the most volatile companies
as compared to other companies that are considered in this study. All IT companies have
negative skewness except exchange rate. This suggests that the return distribution of IT
companies have long right tails and return series distribution of exchange rate has long left tail.
The kurtosis values are found to be higher than the normal which suggests that the return
distributions are relatively steeper than the normal distribution. The Jarque-Bera test rejects the
null hypothesis of a normal distribution for four IT companies and exchange rate at 5 %
significance level. This suggests that the return series are not normally distributed.
[Insert Table 1 Here]
Unit root tests results
In this study we use conventional unit root tests for level and first-order difference on stock
prices of four major IT companies representing the Indian IT sector and exchange rate between
US Dollar and Indian Rupee using ADF and PP tests. ADF and PP tests check the stationarity
(no unit root) and non-stationarity (unit root) for the underlying series. In both the tests, the null
hypothesis of unit root is tested against the alternative hypothesis of no unit root. The results of
these tests are presented in Table 2. Results indicate that the null hypothesis of unit root is not
rejected for exchange rates and stock prices at levels. However, when these tests are applied on
the first-order difference then the null hypothesis of unit root is rejected at 5 % significance
levels. Thus, at first-order difference all data series are stationary. This therefore indicates that all
the variables have same order of integration i.e. I (1). It is a precondition of the cointegration test
that the order of integration should be the same.
[Insert Table 2 Here]

18
4. Empirical results
This section aims to provide information on the dynamic linkage between the exchange rates of
Indian Rupee-US Dollar and Indian IT companies’ performance. We have applied AGDCC
GARCH model to estimate time-varying conditional correlations and long-run relationship
between these variables is explored using bivariate cointegration methodology. Further, we
applied Granger non-causality test to identify the direction of causality among the studied
variables. The empirical results of these models are presented below.
Unconditional and conditional correlations
To estimate correlations between exchange rates and stock prices of four IT companies, we
applied both unconditional and conditional models. The results of unconditional correlations are
presented in Table 3. The unconditional correlations are calculated using log return series.
Results display that exchange rates are negatively correlated with stock prices of all the four IT
companies. Results indicate that as the exchange rate increases then stock prices of these IT
companies decrease and vice versa. This implies that there is a negative relationship between the
performance of IT companies and exchange rates in India.
[Insert Table 3 Here]
The time-varying dynamic conditional correlations between the exchange rates and stock prices
of IT companies are presented in Figure 1. Results show that the highest correlation (0.14)
between exchange rate and HCL is found on 16 March 2007 and the lowest correlation (-0.48)
was observed on 12 October 2006. In case of Infosys, the highest correlation (0.33) was
identified on 14 July 2008 and lowest (-0.25) was on 07 September 2004. Similarly, higher
correlation (0.095) between the exchange rate and TATA was observed on 25 April 2012 and
lowest correlation (-0.24) was witnessed on 24 January 2008. The highest correlation (0.18) for
19
exchange rate and Wipro is found on 25 April 2012 and lowest correlation (-0.41) was witnessed
on 10 April 2013. On average, the highest negative correlations between the exchange rates and
Infosys are observed. These time-varying conditional correlations suggest that the Indian Rupee-
US Dollar exchange rates and stock prices of four IT companies are largely negatively correlated
over time. This indicates that as the exchange rate increases (or value of Rupee depreciates)
against the US Dollar, then the performance of IT companies significantly decreases. Thus, we
can conclude that the Indian IT companies perform better when the Indian Rupee appreciates (or
exchange rate falls) against the US Dollar.
[Insert Figure 1 Here]
Johansen cointegration test results
The unit root (ADF and PP) tests results suggest that all the underlying series have the same
order of integration i.e. I (1). This therefore indicates that there may be a cointegration
relationship between exchange rates and stock prices of IT companies. To explore long-run
equilibrium relationship between these variables we apply VAR based cointegration
methodology developed by Johansen (1988, 1991). This methodology requires an estimation of
VAR (p). In order to select an appropriate lag length we use Akaike Information Criterion
(AIC) and Schwarz Criterion (SC). To identify the validity of lag length selected by AIC and SC
we employ residual test of Autocorrelation LM test to check serial correlation among the
residuals of lags. The test results suggest that AIC selects more appropriate lag length than that
of SC, so we have selected a suitable lag length for this study based on AIC. The empirical
results of bivariate cointegration test are presented in Table 4. Results display that there is no
long-run relationship between the exchange rates and three IT companies that is, HCL, Infosys
and TATA. However, we found that there is a long-run equilibrium relationship between

20
exchange rates and stock prices of Wipro. These results therefore suggest that only Wipro and
exchange rates are reaching an equilibrium point and also shares a common trend in the long-run.
[Insert Table 4 Here]
Toda-Yamamoto Granger non-causality test results
The cointegration methodology results reveal only about the long-run relationship among the
observed variables. In order to explore the direction of causality between the exchange rates and
stock prices of four Indian IT companies, we employ Toda and Yamamoto (1995) procedure.
This procedure also requires an optimal lag length which is selected on the basis of AIC criteria
and it is cross checked for serial correlation among the residuals of lags using a standard
autocorrelation LM test. Once we have identified suitable lag length we estimate a system of
VAR models for a level data series.
The Toda-Yamamoto Granger non-causality test is now applied on pairwise variables that is,
exchange rates and stock prices of each IT company. The causality results of modified Wald
test is obtained from a VAR framework. The Granger non-causality test results are displayed in
Table 5. Results show unidirectional causality that runs from stock prices of HCL, Infosys,
TATA and Wipro to exchange rates. This indicates that all four IT companies Granger cause
exchange rates in our study. Results also suggest that there is no evidence of reverse causality
from exchange rates to IT companies. Based on these results, we can infer that the performance
of Indian IT companies drive the value of Indian Rupee against the US Dollar.
[Insert Table 5 Here]
5. Conclusion
This study aims to investigate the dynamic linkage between the Indian Rupee-US Dollar
exchange rates and stock prices of four Indian IT companies, which represents for majority of the
21
IT sector in India namely, HCL, Infosys, TATA and Wipro. Particularly, the study employs
AGDCC GARCH model to estimate time-varying correlations and undertakes a cointegration
methodology to explore a long-run equilibrium relationship among the observed variables. The
study also uses Granger non-causality test to identify the direction of causality between the
studied variables. To achieve these objectives study utilizes daily data of closing stock prices of
IT companies and exchange rates from 25 August 2004 to 05 September 2013. Empirical results
of AGDCC GARCH model show that there is a negative relationship between exchange rates
and stock prices of IT companies and are time-varying over time. This indicates that as the
exchange rate increases (the value of Rupee falls) against the US Dollar, then the IT companies
perform poorly. In other words, Indian IT companies perform better when exchange rate falls
(the value of Rupee appreciates) against the US Dollar.
The cointegration test results reveal that there is a long-run equilibrium relationship only
between exchange rates and stock prices of Wipro. This indicates that there is no significant
long-run equilibrium relationship among these variables. Further, Granger non-causality test
results show that the null hypothesis of IT companies does not Granger cause exchange rates is
strongly rejected at 5% significance level. This suggests that exchange rates do not drive the
performance of four Indian IT companies. We infer that there is a negative association between
exchange rates and the performance of IT companies. In other words, there is a positive
relationship between the value of Rupee and Indian IT companies’ performance. Previous studies
(Branson et al., 1977; Hatemi–J and Irandoust, 2002; Tsagkanos and Siriopoulos, 2013; Chkili
and Nguyen, 2014) also document a causal relationship from stock prices to exchange rates. This
relationship is explained by the portfolio balance approach which gives importance to capital

22
account transactions and suggests that there is an increased flow of foreign capital when stock
prices are increasing thus causing the exchange rates to appreciate.
These results have an important policy and practical implications. Policy makers can foresee the
movements in exchange rates and accordingly adjust their exposure to foreign transactions. The
results of this study also have important implications for the investment society. Since it is
common to include currency as an asset in the investment portfolio, thus understanding the
relationship between exchange rates and stock prices may equip portfolio managers to handle
risk efficiently. Findings of this study may also useful for other IT growing emerging economies
to understand the link between exchange rates and the performance of IT firms. However,
manner of relationship between them may vary from country to country as the performance of
other economic fundamentals can influence. To the best of authors’ knowledge this is the first
study to investigate the dynamic linkages between the Indian Rupee-US Dollar exchange rates
and stock prices of Indian IT companies using various robust econometric methodologies. In this
context, this is also the first study to apply AGDCC GARCH model to measure the time-varying
conditional correlations between these variables. Therefore, our study has significant
contribution to the body of knowledge on the linkage between exchange rates and stock prices.
23
References
Abdalla, I.S.A. and Murinde, V. (1997), “Exchange rate and stock price interactions in emerging financial
markets: evidence on India, Korea, Pakistan and the Philippines”, Applied Financial Economics,
Vol. 7 No. 1, pp. 25–35.
Aggarwal, R. (1981), “Exchange rates and stock prices: A study of the US capital markets under floating
exchange rates”, Akron Business and Economic Review, Vol. 12 No. 4, pp. 7–12.
Agrawal, G., Srivastav, A.K. and Srivastava, A. (2010), “A study of exchange rates movement and stock
market volatility”, International Journal of Business and Management, Vol. 5 No. 12, pp. 62–62.
Ajayi, R.A. and Mougoue, M. (1996), “On the dynamic relation between stock prices and exchange
rates”, Journal of Financial Research, Vol. 19 No. 2, pp. 193–207.
Bahmani-Oskooee, M. and Sohrabian, A. (1992), “Stock prices and the effective exchange rate of the
Dollar”, Applied Economics, Vol. 24 No. 4, pp. 459–64.
Bartov, E. and Bodnar, G.M. (1994), “Firm valuation, earnings expectations, and the exchange-rate
exposure effect”, The Journal of Finance, Vol. 49 No. 5, pp. 1755–1785.
Bodnar, G.M. and Gentry, W.M. (1993), “Exchange rate exposure and industry characteristics: Evidence
from Canada, Japan, and the USA”, Journal of International Money and Finance, Vol. 12 No. 1,
pp. 29–45.
Bombay Stock Exchange Ltd. (2008), “S&P BSE Indices”, available at: http://www.bseindia.com/
(accessed 30 July 2014).
Branson, W., Halttunen, H. and Masson, P. (1977), “Exchange rate in the short run: the dollar Deutsche
mark rate”, European Economic Review, Vol. 10, pp. 303–324.
Caporale, G.M., Hunter, J. and Ali, F.M. (2014), “On the linkages between stock prices and exchange
rates: Evidence from the banking crisis of 2007–2010”, International Review of Financial
Analysis, available at: (accessed 29 January 2014).
Cappiello, L., Engle, R.F. and Sheppard, K. (2006), “Asymmetric dynamics in the correlations of global
equity and bond returns”, Journal of Financial Econometrics, Vol. 4 No. 4, pp. 537–572.
Chkili, W. and Nguyen, D.K. (2014), “Exchange rate movements and stock market returns in a regime-
switching environment: Evidence for BRICS countries”, Research in International Business and
Finance, Vol. 31 No. May, pp. 46–56.
Crookes, P. and McManus, J. (2013), "China and India leading a global insurgency within the software
industry", Global Business and Economics Review, Vol. 15 No. 4, pp. 417-431.
Dana, L.P. (2000), "Creating entrepreneurs in India", Journal of Small Business Management, pp.86-91.
Dana, L.P. (2007), "Asian models of entrepreneurship: From the Indian union and the Kingdom of Nepal
to the Japanese archipelago: Context, policy and practice", World Scientific, pp.1005-107.
Dana, L.P. and Dana, T.E. (2005), "Expanding the scope of methodologies used in entrepreneurship
research", International Journal of Entrepreneurship and Small Business, Vol. 2, pp.-79-88.
Dickey, D.A. and Fuller, W.A. (1979), “Distribution of the estimators for autoregressive time series with
a unit root”, Journal of the American Statistical Association, Vol. 74 No. 366a, pp. 427–431.
Dua, P. and Ranjan, R. (2010), "Exchange rate policy and modelling in India", Reserve Bank of India, No.
33.

24
Engle, R.F. (2002), “Dynamic conditional correlation: A simple class of multivariate generalized
autoregressive conditional heteroskedasticity models”, Journal of Business & Economic
Statistics, Vol. 20 No. 3, pp. 339–350.
Gould, D.M. and Kamin, S.B. (2001), “The impact of monetary policy on exchange rates during financial
crises”, Financial Crises in Emerging Markets, pp. 384–420.
Granger, C.W.J., Huang, B.-N. and Yang, C.-W. (2000), “A bivariate causality between stock prices and
exchange rates: evidence from recent Asianflu”, The Quarterly Review of Economics and
Finance, Vol. 40 No. 3, pp. 337–354.
Griffin, J.M. and Stulz, R.M. (2001), “International competition and exchange rate shocks: A cross-
country industry analysis of stock returns”, Review of Financial Studies, Vol. 14 No. 1, pp. 215–
241.
Hatemi–J, A. and Irandoust, M. (2002), “On the causality between exchange rates and stock prices: A
note”, Bulletin of Economic Research, Vol. 54 No. 2, pp. 197–203.
Ibrahim, M.H. and Aziz, H. (2003), “Macroeconomic variables and the Malaysian equity market: A view
through rolling subsamples”, Journal of Economic Studies, Vol. 30 No. 1, pp. 6–27.
Johansen, S. (1988), “Statistical analysis of cointegration vectors”, Journal of Economic Dynamics and
Control, Vol. 12 No. 2–3, pp. 231–254.
Johansen, S. (1991), “Estimation and hypothesis testing of cointegration vectors in gaussian vector
autoregressive models”, Econometrica, Vol. 59 No. 6, pp. 1551–1580.
Jorion, P. (1990), “The exchange-rate exposure of U.S. multinationals”, The Journal of Business, Vol. 63
No. 3, pp. 331–345.
Jorion, P. (1991), “The pricing of exchange rate risk in the stock market”, The Journal of Financial and
Quantitative Analysis, Vol. 26 No. 3, pp. 363–376.
Kim, K. (2003), “Dollar exchange rate and stock price: evidence from multivariate cointegration and error
correction model”, Review of Financial Economics, Vol. 12 No. 3, pp. 301–313.
Lateef, A. (1997), "Linking up with the global economy: A case study of the bangalore software
industry", No. 96, International Institute for Labour Studies.
Lee-Lee, C. and Hui-Boon, T. (2007), “Macroeconomic factors of exchange rate volatility: Evidence from
four neighbouring ASEAN economies”, Studies in Economics and Finance, Vol. 24 No. 4, pp.
266–285.
MacKinnon, J.G., Haug, A.A. and Michelis, L. (1999), “Numerical distribution functions of likelihood
ratio tests for cointegration”, Journal of Applied Econometrics, Vol. 14 No. 5, pp. 563–77.
NASSCOM. (2012), India IT-BPO industry: Impact on India’s growth.
Noman, A.M., Kabir, S.H. and Bashar, O.K.M.R. (2012), “Causality between stock and foreign exchange
markets in Bangladesh”, Studies in Economics and Finance, Vol. 29 No. 3, pp. 174–186.
Ozair, A. (2006), Causality between stock prices and exchange rates: A case of the United States, Florida
Atlantic University.
Pan, M.-S., Fok, R.C.-W. and Liu, Y.A. (2007), “Dynamic linkages between exchange rates and stock
prices: Evidence from East Asian markets”, International Review of Economics & Finance, Vol.
16 No. 4, pp. 503–520.
Phillips, P.C.B. and Perron, P. (1988), “Testing for a unit root in time series regression”, Biometrika, Vol.
75 No. 2, pp. 335–346.

25
Prasad, A. and Panduranga Reddy, C. (2009), “Global financial crisis and its impact on India”, Journal of
Social Sciences, Vol. 21 No. 1, pp. 1–5.
Ramasamy, B. and Yeung, M.C.H. (2001), “Selective capital controls in Malaysia: Is it time to abandon
them?", Research Paper Series.
Ramasamy, B. and Yeung, M.C.H. (2005), “The causality between stock returns and exchange rates:
revisited”, Australian Economic Papers, Vol. 44 No. 2, pp. 162–169.
Toda, H.Y. and Yamamoto, T. (1995), “Statistical inference in vector autoregressions with possibly
integrated processes”, Journal of Econometrics, Vol. 66 No. 1-2, pp. 225–250.
Tsagkanos, A. and Siriopoulos, C. (2013), “A long-run relationship between stock price index and
exchange rate: A structural nonparametric cointegrating regression approach”, Journal of
International Financial Markets, Institutions and Money, Vol. 25 No. July, pp. 106–118.
Tsai, I.C. (2012), “The relationship between stock price index and exchange rate in Asian markets: A
quantile regression approach”, Journal of International Financial Markets, Institutions and
Money, Vol. 22 No. 3, pp. 609–621.
World Bank (2015), Country and region specific forecasts and data.
Yang, Z., Tu, A.H. and Zeng, Y. (2014), “Dynamic linkages between Asian stock prices and exchange
rates: new evidence from causality in quantiles”, Applied Economics, Vol. 46 No. 11, pp. 1184–
1201.
26
Figure 1: Correlations of Indian rupee value (against US $) and IT companies performance
Table 1. Descriptive statistics
Variables Mean Maximum Minimum Std. Dev. Skewness Kurtosis Jarque-Bera
Exchange Rate 0.0002 0.0402 -0.0301 0.0052 0.3439 7.8033 2145.5430**
HCL 0.0005 0.1715 -0.7087 0.0304 -5.6502 139.6097 1712230.0000**
Infosys 0.0003 0.1562 -0.7008 0.0256 -9.5057 260.9663 6096996.0000**
TATA 0.0003 0.1427 -0.7130 0.0305 -11.1446 261.0433 6112953.0000**
Wipro -0.0001 0.1509 -0.6841 0.0294 -7.9647 174.2254 2694738.0000**
Note: where ‘**’ indicates rejection of null hypothesis of normal distribution at 5% significance level.
-.5
-.4
-.3
-.2
-.1
.0
.1
.2
2004 2005 2006 2007 2008 2009 2010 2011 2012 2013
EXRATE_HCL
-.3
-.2
-.1
.0
.1
.2
.3
.4
2004 2005 2006 2007 2008 2009 2010 2011 2012 2013
EXRATE_INFOSYS
-.25
-.20
-.15
-.10
-.05
.00
.05
.10
2004 2005 2006 2007 2008 2009 2010 2011 2012 2013
EXRATE_TATA
-.5
-.4
-.3
-.2
-.1
.0
.1
.2
2004 2005 2006 2007 2008 2009 2010 2011 2012 2013
EXRATE_WIPRO

27
Table 2. Unit root test results
Variables
ADF Test PP Test
Level First Difference Level First Difference
With Trend With Trend
T-Test Prob. T-Test Prob. Adj. T-Test Prob. Adj. T-Test Prob.
Exchange rate -0.5621 0.9806 -45.7980 0.0000** -0.6827 0.9734 -45.8331 0.0000**
HCL -1.1669 0.9158 -45.6851 0.0000** -1.0616 0.9336 -45.7241 0.0000**
Infosys -2.5975 0.2815 -47.8976 0.0000** -2.5386 0.3092 -47.8981 0.0000**
TATA -1.6318 0.7803 -46.2661 0.0000** -1.4312 0.8518 -46.4999 0.0000**
Wipro -2.8502 0.1794 -48.0236 0.0000** -2.7512 0.2160 -48.0784 0.0000**
Note: Both unit root tests are carried out on with constant and tend variables in the model. Where ‘**’ indicates rejection
of null hypothesis of unit root (non-stationary) at 5% significant level.
Table 3. Unconditional correlations
Variables Exchange rates HCL Infosys TATA Wipro
Exchange rates 1 -0.0832 -0.0946 -0.0592 -0.0938
HCL 1 0.3577 0.3244 0.3625
Infosys 1 0.3961 0.4227
TATA 1 0.3847
Wipro 1
Table 4. Bivariate cointegration test results
Variables Null
Hypothesis
Trace
Statistic
Critical
Value (5%)
Prob. Max-Eigen
Statistic
Critical
Value (5%)
Prob.
Exchange Rate and
HCL 0r 8.5367 15.4947 0.4099 6.9036 14.2646 0.5006
1r 1.6330 3.8415 0.2013 1.6330 3.8415 0.2013
Exchange Rate and
Infosys 0r 9.4460 15.4947 0.3257 8.2055 14.2646 0.3582
1r 1.2406 3.8415 0.2654 1.2406 3.8415 0.2654
Exchange Rate and
TATA 0r 6.9707 15.4947 0.5811 4.7856 14.2646 0.7686
1r 2.1851 3.8415 0.1393 2.1851 3.8415 0.1393
Exchange Rate and
Wipro 0r 15.5105 15.4947 0.0497** 15.4513 14.2646 0.0323**
1r 0.0592 3.8415 0.8077 0.0592 3.8415 0.8077
Note: where ‘**’ indicates rejection of null hypothesis of no cointegrating vector at 5% significance level.

28
Table 5. Toda-Yamamoto Granger non-causality test results
Null Hypothesis Chi-sq Prob. Lag Length
HCL does not Granger cause Exchange rate 36.3453 0.0000** 7
Exchange rate does not Granger cause HCL 10.7984 0.1477 7
Infosys does not Granger cause Exchange rate 12.5678 0.0278** 5
Exchange rate does not Granger cause Infosys 4.5001 0.4799 5
TATA does not Granger cause Exchange rate 16.1213 0.0065** 5
Exchange rate does not Granger cause TATA 2.4407 0.7854 5
Wipro does not Granger cause Exchange rate 9.2843 0.0257** 3
Exchange rate does not Granger cause Wipro 2.0454 0.5630 3
Note: ‘**’ indicates rejection of null of hypothesis of no causality at 5 % significance level.
View publication statsView publication stats