the employability of mathematics education … · this pnu-nl math graduates tracer study that...
TRANSCRIPT
-Journal of Arts, Science & Commerce ■E-ISSN2229-4686■ISSN2231-4172
International Refereed Research Journal ■www.researchersworld.com■Vol.–V, Issue – 4, Oct. 2014 [146]
THE EMPLOYABILITY OF MATHEMATICS EDUCATION
GRADUATES (2008-2013) OF A TEACHER EDUCATION
INSTITUTION (TEI) IN THE PHILIPPINES
Mr. Roldan S. Cardona,
Faculty Member,
Faculty of Teacher Development,
Philippine Normal University, North Luzon
(PNU-NL), Alicia, Isabela, Philippines
Mr. Edilberto M. Andres, Jr.,
Faculty Member,
Faculty of Teacher Development,
Philippine Normal University, North Luzon
(PNU-NL), Alicia, Isabela, Philippines
ABSTRACT
This descriptive study determined the employment status and the retrospective evaluation of Bachelor of Secondary Education (BSEd) mathematics graduates of PNU-North Luzon.
Eighty-one respondents from Batch 2008-2013 participated in the study. Results revealed
that almost all of the respondents are presently employed, had taken the Licensure Examination for Teachers (LET) and passed in their first attempt, acquired a job within six
months after graduation, and are practicing their profession by teaching in all education
levels across almost all subject areas. The graduates also claimed that the competency
skills provided by the University were useful to a certain extent on their current work. They were also satisfied on the facilities, learning environment and services offered. The
hierarchical cluster analysis showed three relative groupings of graduates dominated by
those who are presently employed, two years and above in service, relatively low in all the subject areas but rated the University’s services to be of average.
Keywords: employability, mathematics education graduates.
-Journal of Arts, Science & Commerce ■E-ISSN2229-4686■ISSN2231-4172
International Refereed Research Journal ■www.researchersworld.com■Vol.–V, Issue – 4, Oct. 2014 [147]
INTRODUCTION:
Higher education today cannot justify its existence by providing only academic learning for mental and spiritual development, it has in addition to convey the necessary skills for economic
development in order that natural resources might be explored and exploited, products stored
and distributed, services managed and resources conserved for future generations. This brings us to the role of higher education in meeting employment needs and to the global issue of the
relationship between higher education and employment (p. 3). – Arcelo & Sanyal (1987)
The primary goal of teacher education programs is to produce good teachers who are qualified to teach in the elementary and secondary schools (Colarte, 2010). As such, every Teacher Education Institution
(TEI) including Philippine Normal University holds the primordial duty in responding and catering to
this challenge. Concomitant to this aim is equipping students the essential tools for landing a decent employment after graduation.
Securing employment is however, far lesser than the concept of employability (Pavlin, 2013). Yorke
and Knight (2003) defined employability as a set of achievements, skills, understanding and personal
attributes that make graduates more likely to gain employment and be successful in their chosen occupation which benefits themselves, the work force, the community and the economy. It implies the
possession of qualities and competencies that are required to enable graduates to enter and maintain
employment throughout their lives. According to Boholano (2012), it is through quality education and proper training that one may get a respectable job after graduation. That is, in the words of Pavlin
(2013), a job with a high security, prestige, promotion possibilities, work satisfaction, and the chance to
utilize own knowledge and skills. In the current trend of education, many universities are using the employment of their graduates to
evaluate how their program performs in making their students productive in the labor market. It is used
as a performance indicator for college education institutions (Smith, et al., 2000 as cited by Boholano,
2012; Bruwer, 1998). If a graduate came from a reputable institution, the more likely he or she finds a job faster (Kong, 2011; Manila Bulletin, January 6, 2013). Otherwise, the graduates will end either
unemployed or underemployed.
It is then apparent, as it may seem, that unemployment or underemployment is tantamount to some inefficiency (Bruwer, 1998).Unemployment means poor educational qualification (Peacock, 2007)
implying poor education and training (Hick, 2003; Psacharopoulus, 2004), inefficient delivery of basic
services, unfavorable learning environment, and lack of facilities. In the country, it has been reported
that the unemployment rate is 6.9% in April 2012 from 13.9% in 2002 (Manila Bulletin, 2013 January 6), 7% in July 2012 (De Ocampo, Bagano, Tan, 2012), and 7.5% in April 2013 (National Statistics
Office). The underemployment is way up with 19.2% in April 2013. The Bureau of Labor and
Employment Statistics for 2006, 2007-2008, and 2009-2010 showed almost the same reasons for unemployment, (a) lack of competence, (b) lack of experience and (c) lack of achievements
(“Unemployment of the College-Educated”).
Other than the factors mentioned, skills in leadership, communication, information technology, problem-solving, critical thinking, human-relations, creativity, decision-making, technical, and research
will form part the context of being employable. The opportunities and the experiences from which
these skills will be derived are expected to be laid down and provided to the students. In the study of
Colarte (2010), graduates were satisfied with the Teacher Education program of a certain university and affirmed that the training were extremely useful in the field of work.
Meanwhile, skills will help one acquire an employment but achievements are proof that one can
implement his or her skills in practice (Carr, n.d.). In teacher education, the more significant achievements the graduates have, the more they will have the edge over other equally qualified
experienced candidates. These achievements of graduates include but not limited to degree earned,
board examination rating, work-related trainings or seminars attended, professional awards received, and professional examinations passed, to name a few. Hence, according to Hills, Robertson, Walker,
Adey and Mixonas cited by de Guzman (2008), schools, colleges and universities should be a place
-Journal of Arts, Science & Commerce ■E-ISSN2229-4686■ISSN2231-4172
International Refereed Research Journal ■www.researchersworld.com■Vol.–V, Issue – 4, Oct. 2014 [148]
where students grow intellectually (cognitive competence), morally (character education), socially (interpersonal skills) and personally (self-reliant, self-confidence, resilient and a lifelong leaner).
In the study of Philippine Business Education (PBED) from year 2009-2013, from 3 million
enrolees from SY 2001-2008, only around 16.7% or 504, 000 of them have graduated in the year 2005-2012 (www.pbed.ph). However, a high rate of employment among the graduates of a
certain university was found out by Mercado (2010). Boholano (2012) found out that
mathematics majors’ employment rate in public high school is high on 2008, but decreases for
the next two years. An inverse pattern was seen in the private sector. Interestingly, most respondents engaged in companies and establishments.
The context of teacher employment in the Philippines has to be considered as well in t he concept
of employability. The basic entry level requirement in the public institutions is graduate should be a Licensure Examination for Teachers (LET) passer, whereas, in private schools, such is
encouraged but not necessarily required. Hence, most of the times, new graduates tend to flock
in private schools and they only applied in public institutions at least a year after passing the LET. The economic side and security of job in the public over in the private schools has to say
much of this trend. However, with the implementation of K-12, private and public schools need
to increase their usual number of teachers allowing these graduates greater chances of being
employed in a much shorter time. It is for these reasons that the researchers conceived of this study to trace the status of graduates of
PNU-NL BSEd mathematics majors SY 2008-2013. The campus is one of the five branches nationwide
situated in the northern Luzon area. The undertaking has a noble task of focusing on the employability of PNU mathematics graduates and helps the university attract and retain high quality students and
maintain its competitive advantage in the regional and national market place. Specifically, it aims to
determine the graduates’ profiles, their employment situation, their achievements, the situational
factors that influenced their qualifications and employment situation, their competency skills on different fields, and the graduates’ retrospective evaluation of their satisfaction, adequacy and
relevance of training in the university. The undertaking has also the aim of determining the relative
grouping of graduates based on selected variables.
METHODOLOGY:
This PNU-NL math graduates tracer study that seeks to uncover the employment status made use
of descriptive-survey and descriptive-status. This covers the batch from 2008-2013 and it was
conducted from November 2013-March 2014. Simple random sampling with substitution method was utilized but only 81 out of the 95 originally drawn respondents replied. The sample
comprised the 60% of the total number of graduates within the said timeframe. There were 9
graduates from batch 2008 participated the study, 11 each for 2009 and 2010, 7 for 2011, 18 for 2012, and 25 for 2013.
The researchers made use of the Graduate Tracer Study questionnaires which was developed by
the Philippine Normal University (PNU) and the Commission of Higher Education (CHED). Salient points from each questionnaire was adopted and modified to form a single questionnaire
which was validated accordingly. In-person distribution, documentary analysis, Facebook and
email messaging, and cellphone and face-to-face interview were utilized as data gathering
procedures. The researchers made use of descriptive statistics and hierarchical cluster ana lysis using Wards method.
RESULTS:
PROFILES OF THE RESPONDENTS:
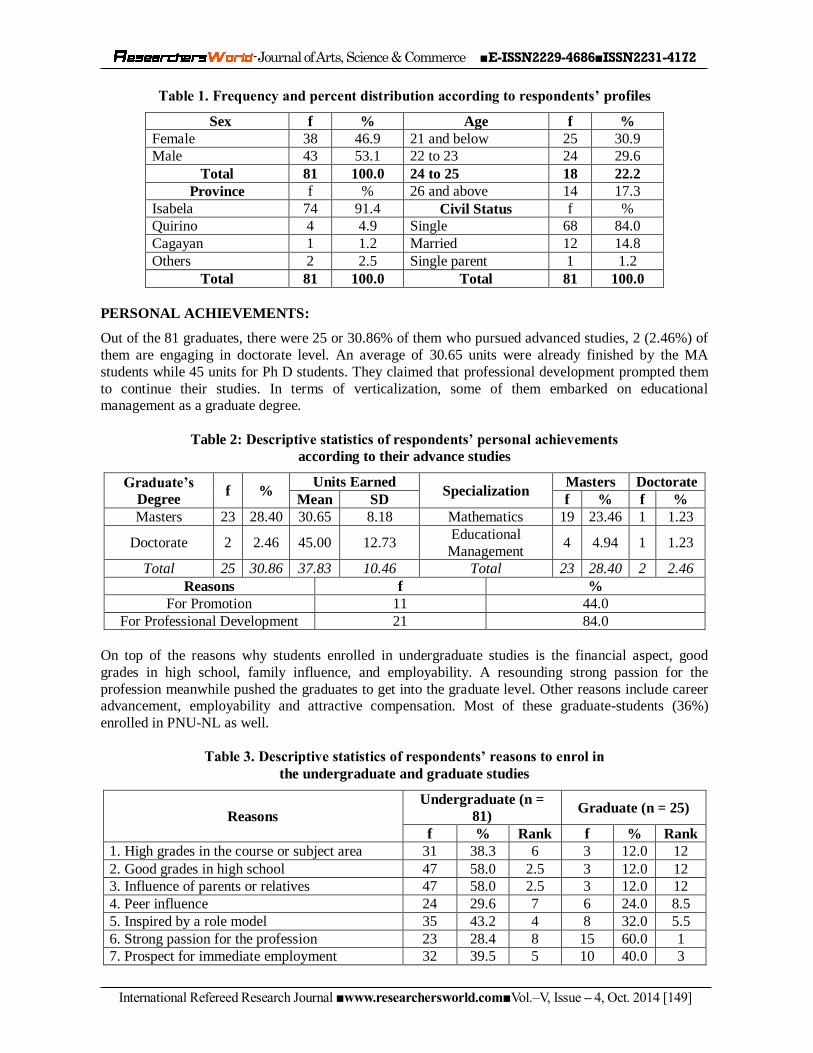
It appears that there are more males than females who participated in the study. Although the
population count revealed that there are more females than males mathematics graduates. Their age
spans from 20 to 26, with highest frequency at 23 and below (60.5%), and one of them is 34 years old.
Majority of them is single, 68 or 84%, and are from Isabela province, 74 or 91.4%.
-Journal of Arts, Science & Commerce ■E-ISSN2229-4686■ISSN2231-4172
International Refereed Research Journal ■www.researchersworld.com■Vol.–V, Issue – 4, Oct. 2014 [149]
Table 1. Frequency and percent distribution according to respondents’ profiles
Sex f % Age f %
Female 38 46.9 21 and below 25 30.9
Male 43 53.1 22 to 23 24 29.6
Total 81 100.0 24 to 25 18 22.2
Province f % 26 and above 14 17.3
Isabela 74 91.4 Civil Status f %
Quirino 4 4.9 Single 68 84.0
Cagayan 1 1.2 Married 12 14.8
Others 2 2.5 Single parent 1 1.2
Total 81 100.0 Total 81 100.0
PERSONAL ACHIEVEMENTS:
Out of the 81 graduates, there were 25 or 30.86% of them who pursued advanced studies, 2 (2.46%) of
them are engaging in doctorate level. An average of 30.65 units were already finished by the MA
students while 45 units for Ph D students. They claimed that professional development prompted them
to continue their studies. In terms of verticalization, some of them embarked on educational management as a graduate degree.
Table 2: Descriptive statistics of respondents’ personal achievements
according to their advance studies
Graduate’s
Degree f %
Units Earned Specialization
Masters Doctorate
Mean SD f % f %
Masters 23 28.40 30.65 8.18 Mathematics 19 23.46 1 1.23
Doctorate 2 2.46 45.00 12.73 Educational
Management 4 4.94 1 1.23
Total 25 30.86 37.83 10.46 Total 23 28.40 2 2.46
Reasons f %
For Promotion 11 44.0
For Professional Development 21 84.0
On top of the reasons why students enrolled in undergraduate studies is the financial aspect, good
grades in high school, family influence, and employability. A resounding strong passion for the
profession meanwhile pushed the graduates to get into the graduate level. Other reasons include career advancement, employability and attractive compensation. Most of these graduate-students (36%)
enrolled in PNU-NL as well.
Table 3. Descriptive statistics of respondents’ reasons to enrol in
the undergraduate and graduate studies
Reasons
Undergraduate (n =
81) Graduate (n = 25)
f % Rank f % Rank
1. High grades in the course or subject area 31 38.3 6 3 12.0 12
2. Good grades in high school 47 58.0 2.5 3 12.0 12
3. Influence of parents or relatives 47 58.0 2.5 3 12.0 12
4. Peer influence 24 29.6 7 6 24.0 8.5
5. Inspired by a role model 35 43.2 4 8 32.0 5.5
6. Strong passion for the profession 23 28.4 8 15 60.0 1
7. Prospect for immediate employment 32 39.5 5 10 40.0 3
-Journal of Arts, Science & Commerce ■E-ISSN2229-4686■ISSN2231-4172
International Refereed Research Journal ■www.researchersworld.com■Vol.–V, Issue – 4, Oct. 2014 [150]
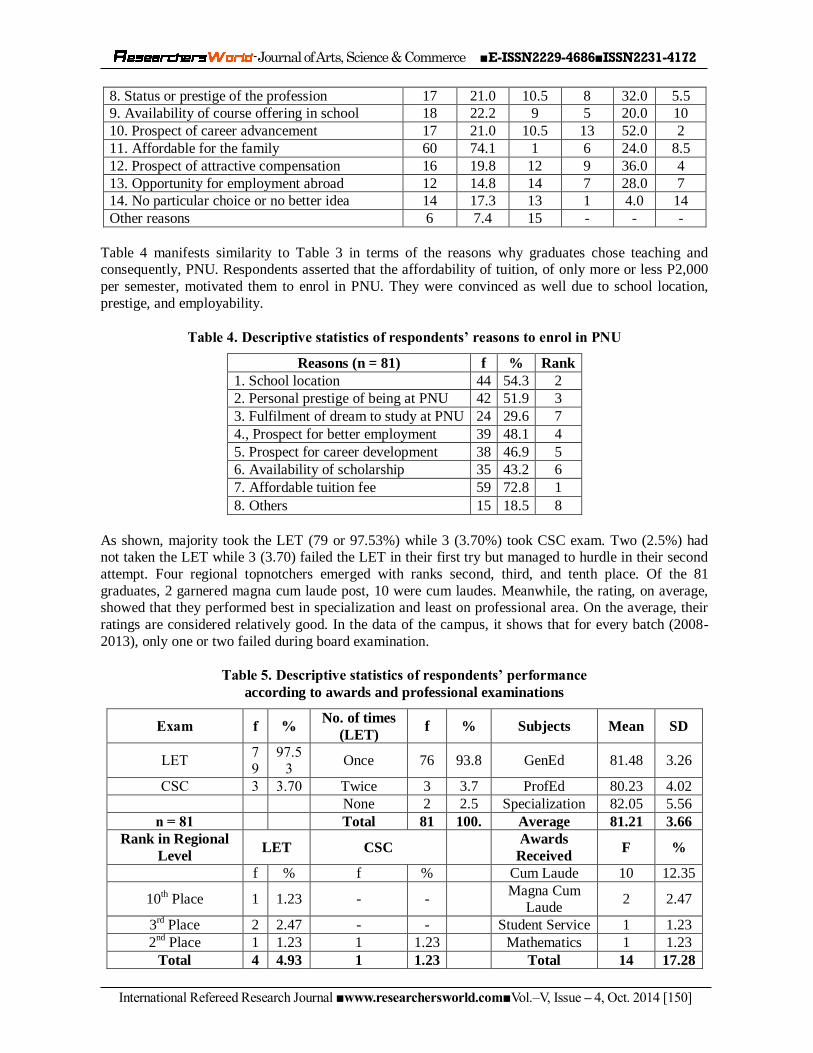
8. Status or prestige of the profession 17 21.0 10.5 8 32.0 5.5
9. Availability of course offering in school 18 22.2 9 5 20.0 10
10. Prospect of career advancement 17 21.0 10.5 13 52.0 2
11. Affordable for the family 60 74.1 1 6 24.0 8.5
12. Prospect of attractive compensation 16 19.8 12 9 36.0 4
13. Opportunity for employment abroad 12 14.8 14 7 28.0 7
14. No particular choice or no better idea 14 17.3 13 1 4.0 14
Other reasons 6 7.4 15 - - -
Table 4 manifests similarity to Table 3 in terms of the reasons why graduates chose teaching and consequently, PNU. Respondents asserted that the affordability of tuition, of only more or less P2,000
per semester, motivated them to enrol in PNU. They were convinced as well due to school location,
prestige, and employability.
Table 4. Descriptive statistics of respondents’ reasons to enrol in PNU
Reasons (n = 81) f % Rank
1. School location 44 54.3 2
2. Personal prestige of being at PNU 42 51.9 3
3. Fulfilment of dream to study at PNU 24 29.6 7
4., Prospect for better employment 39 48.1 4
5. Prospect for career development 38 46.9 5
6. Availability of scholarship 35 43.2 6
7. Affordable tuition fee 59 72.8 1
8. Others 15 18.5 8
As shown, majority took the LET (79 or 97.53%) while 3 (3.70%) took CSC exam. Two (2.5%) had not taken the LET while 3 (3.70) failed the LET in their first try but managed to hurdle in their second
attempt. Four regional topnotchers emerged with ranks second, third, and tenth place. Of the 81
graduates, 2 garnered magna cum laude post, 10 were cum laudes. Meanwhile, the rating, on average, showed that they performed best in specialization and least on professional area. On the average, their
ratings are considered relatively good. In the data of the campus, it shows that for every batch (2008-
2013), only one or two failed during board examination.
Table 5. Descriptive statistics of respondents’ performance
according to awards and professional examinations
Exam f % No. of times
(LET) f % Subjects Mean SD
LET 79
97.53
Once 76 93.8 GenEd 81.48 3.26
CSC 3 3.70 Twice 3 3.7 ProfEd 80.23 4.02
None 2 2.5 Specialization 82.05 5.56
n = 81
Total 81 100. Average 81.21 3.66
Rank in Regional
Level LET CSC
Awards
Received F %
f % f % Cum Laude 10 12.35
10th Place 1 1.23 - -
Magna Cum Laude
2 2.47
3rd
Place 2 2.47 - - Student Service 1 1.23
2nd
Place 1 1.23 1 1.23 Mathematics 1 1.23
Total 4 4.93 1 1.23 Total 14 17.28
-Journal of Arts, Science & Commerce ■E-ISSN2229-4686■ISSN2231-4172
International Refereed Research Journal ■www.researchersworld.com■Vol.–V, Issue – 4, Oct. 2014 [151]
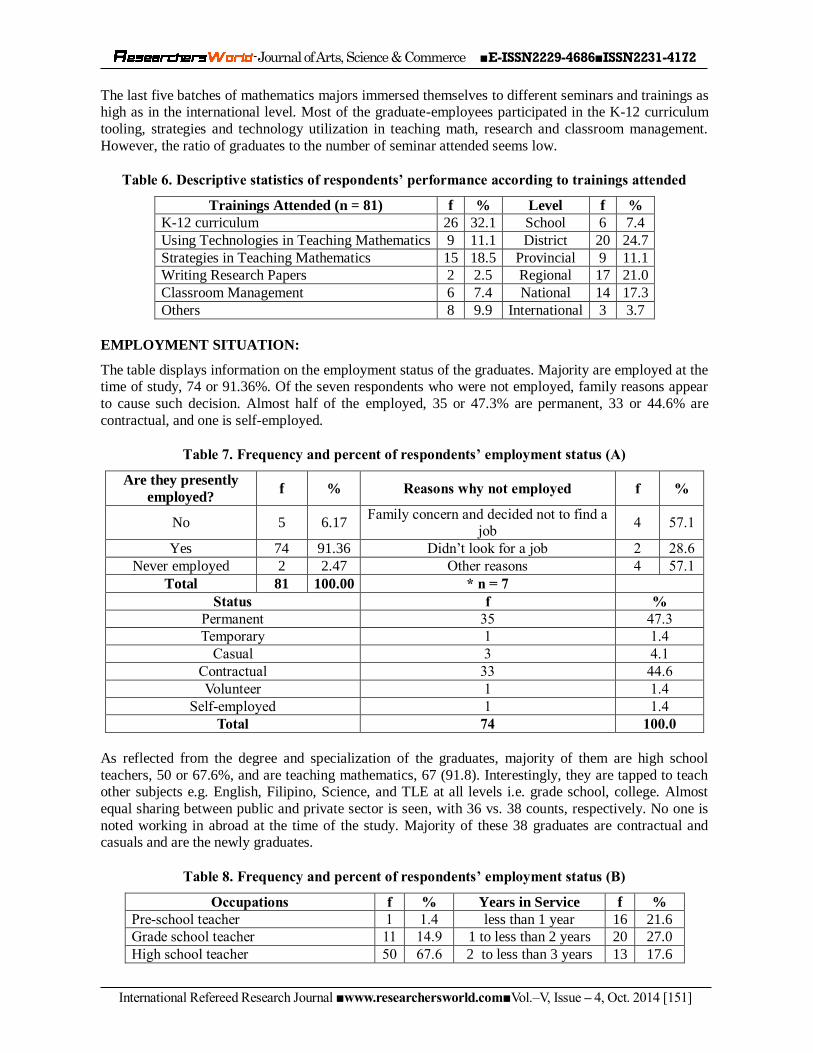
The last five batches of mathematics majors immersed themselves to different seminars and trainings as high as in the international level. Most of the graduate-employees participated in the K-12 curriculum
tooling, strategies and technology utilization in teaching math, research and classroom management.
However, the ratio of graduates to the number of seminar attended seems low.
Table 6. Descriptive statistics of respondents’ performance according to trainings attended
Trainings Attended (n = 81) f % Level f %
K-12 curriculum 26 32.1 School 6 7.4
Using Technologies in Teaching Mathematics 9 11.1 District 20 24.7
Strategies in Teaching Mathematics 15 18.5 Provincial 9 11.1
Writing Research Papers 2 2.5 Regional 17 21.0
Classroom Management 6 7.4 National 14 17.3
Others 8 9.9 International 3 3.7
EMPLOYMENT SITUATION:
The table displays information on the employment status of the graduates. Majority are employed at the time of study, 74 or 91.36%. Of the seven respondents who were not employed, family reasons appear
to cause such decision. Almost half of the employed, 35 or 47.3% are permanent, 33 or 44.6% are
contractual, and one is self-employed.
Table 7. Frequency and percent of respondents’ employment status (A)
Are they presently
employed? f % Reasons why not employed f %
No 5 6.17 Family concern and decided not to find a
job 4 57.1
Yes 74 91.36 Didn’t look for a job 2 28.6
Never employed 2 2.47 Other reasons 4 57.1
Total 81 100.00 * n = 7
Status f %
Permanent 35 47.3
Temporary 1 1.4
Casual 3 4.1
Contractual 33 44.6
Volunteer 1 1.4
Self-employed 1 1.4
Total 74 100.0
As reflected from the degree and specialization of the graduates, majority of them are high school
teachers, 50 or 67.6%, and are teaching mathematics, 67 (91.8). Interestingly, they are tapped to teach other subjects e.g. English, Filipino, Science, and TLE at all levels i.e. grade school, college. Almost
equal sharing between public and private sector is seen, with 36 vs. 38 counts, respectively. No one is
noted working in abroad at the time of the study. Majority of these 38 graduates are contractual and casuals and are the newly graduates.
Table 8. Frequency and percent of respondents’ employment status (B)
Occupations f % Years in Service f %
Pre-school teacher 1 1.4 less than 1 year 16 21.6
Grade school teacher 11 14.9 1 to less than 2 years 20 27.0
High school teacher 50 67.6 2 to less than 3 years 13 17.6
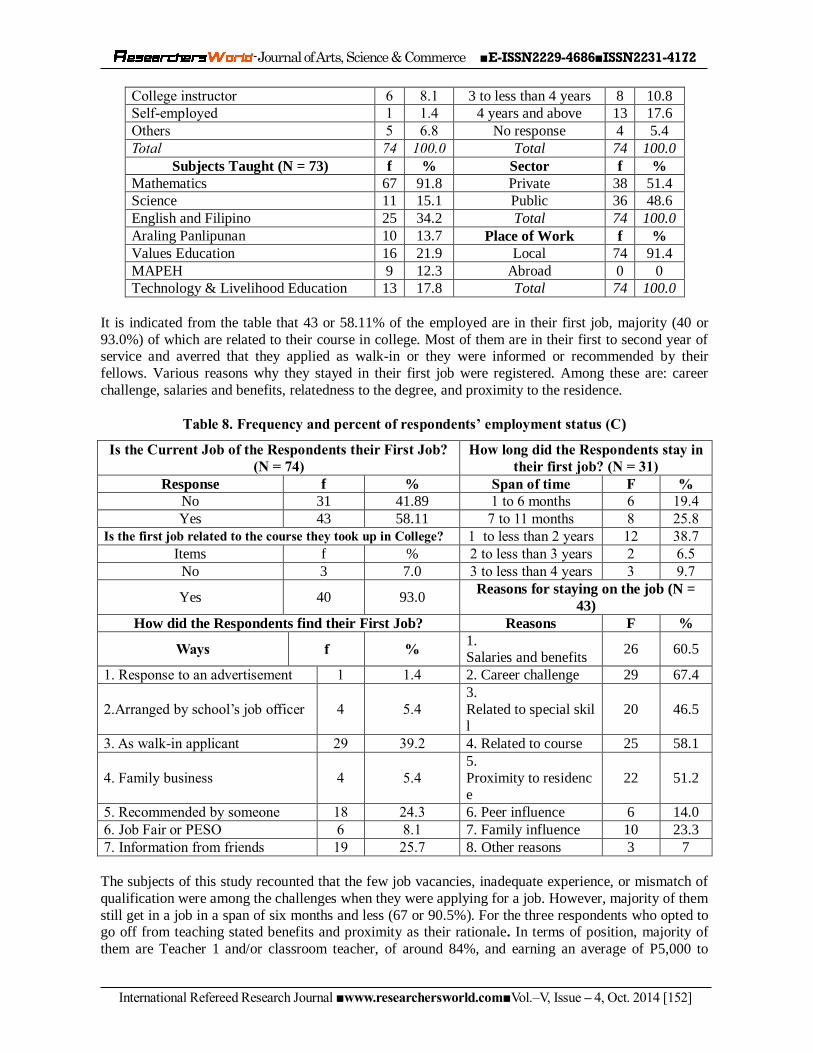
-Journal of Arts, Science & Commerce ■E-ISSN2229-4686■ISSN2231-4172
International Refereed Research Journal ■www.researchersworld.com■Vol.–V, Issue – 4, Oct. 2014 [152]
College instructor 6 8.1 3 to less than 4 years 8 10.8
Self-employed 1 1.4 4 years and above 13 17.6
Others 5 6.8 No response 4 5.4
Total 74 100.0 Total 74 100.0
Subjects Taught (N = 73) f % Sector f %
Mathematics 67 91.8 Private 38 51.4
Science 11 15.1 Public 36 48.6
English and Filipino 25 34.2 Total 74 100.0
Araling Panlipunan 10 13.7 Place of Work f %
Values Education 16 21.9 Local 74 91.4
MAPEH 9 12.3 Abroad 0 0
Technology & Livelihood Education 13 17.8 Total 74 100.0
It is indicated from the table that 43 or 58.11% of the employed are in their first job, majority (40 or
93.0%) of which are related to their course in college. Most of them are in their first to second year of service and averred that they applied as walk-in or they were informed or recommended by their
fellows. Various reasons why they stayed in their first job were registered. Among these are: career
challenge, salaries and benefits, relatedness to the degree, and proximity to the residence.
Table 8. Frequency and percent of respondents’ employment status (C)
Is the Current Job of the Respondents their First Job?
(N = 74)
How long did the Respondents stay in
their first job? (N = 31)
Response f % Span of time F %
No 31 41.89 1 to 6 months 6 19.4
Yes 43 58.11 7 to 11 months 8 25.8
Is the first job related to the course they took up in College? 1 to less than 2 years 12 38.7
Items f % 2 to less than 3 years 2 6.5
No 3 7.0 3 to less than 4 years 3 9.7
Yes 40 93.0 Reasons for staying on the job (N =
43)
How did the Respondents find their First Job? Reasons F %
Ways f % 1. Salaries and benefits
26 60.5
1. Response to an advertisement 1 1.4 2. Career challenge 29 67.4
2.Arranged by school’s job officer 4 5.4
3.
Related to special skill
20 46.5
3. As walk-in applicant 29 39.2 4. Related to course 25 58.1
4. Family business 4 5.4
5.
Proximity to residence
22 51.2
5. Recommended by someone 18 24.3 6. Peer influence 6 14.0
6. Job Fair or PESO 6 8.1 7. Family influence 10 23.3
7. Information from friends 19 25.7 8. Other reasons 3 7
The subjects of this study recounted that the few job vacancies, inadequate experience, or mismatch of
qualification were among the challenges when they were applying for a job. However, majority of them
still get in a job in a span of six months and less (67 or 90.5%). For the three respondents who opted to go off from teaching stated benefits and proximity as their rationale. In terms of position, majority of
them are Teacher 1 and/or classroom teacher, of around 84%, and earning an average of P5,000 to
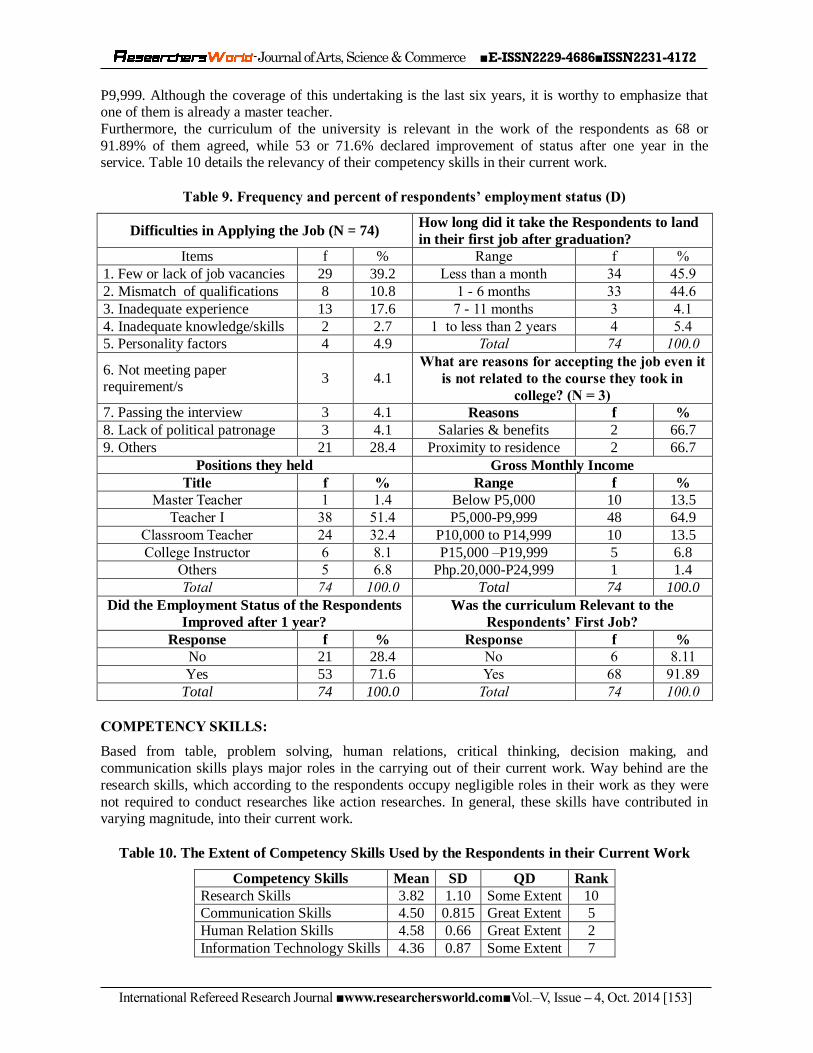
-Journal of Arts, Science & Commerce ■E-ISSN2229-4686■ISSN2231-4172
International Refereed Research Journal ■www.researchersworld.com■Vol.–V, Issue – 4, Oct. 2014 [153]
P9,999. Although the coverage of this undertaking is the last six years, it is worthy to emphasize that one of them is already a master teacher.
Furthermore, the curriculum of the university is relevant in the work of the respondents as 68 or
91.89% of them agreed, while 53 or 71.6% declared improvement of status after one year in the service. Table 10 details the relevancy of their competency skills in their current work.
Table 9. Frequency and percent of respondents’ employment status (D)
Difficulties in Applying the Job (N = 74) How long did it take the Respondents to land
in their first job after graduation?
Items f % Range f %
1. Few or lack of job vacancies 29 39.2 Less than a month 34 45.9
2. Mismatch of qualifications 8 10.8 1 - 6 months 33 44.6
3. Inadequate experience 13 17.6 7 - 11 months 3 4.1
4. Inadequate knowledge/skills 2 2.7 1 to less than 2 years 4 5.4
5. Personality factors 4 4.9 Total 74 100.0
6. Not meeting paper requirement/s
3 4.1 What are reasons for accepting the job even it
is not related to the course they took in
college? (N = 3)
7. Passing the interview 3 4.1 Reasons f %
8. Lack of political patronage 3 4.1 Salaries & benefits 2 66.7
9. Others 21 28.4 Proximity to residence 2 66.7
Positions they held Gross Monthly Income
Title f % Range f %
Master Teacher 1 1.4 Below P5,000 10 13.5
Teacher I 38 51.4 P5,000-P9,999 48 64.9
Classroom Teacher 24 32.4 P10,000 to P14,999 10 13.5
College Instructor 6 8.1 P15,000 –P19,999 5 6.8
Others 5 6.8 Php.20,000-P24,999 1 1.4
Total 74 100.0 Total 74 100.0
Did the Employment Status of the Respondents
Improved after 1 year?
Was the curriculum Relevant to the
Respondents’ First Job?
Response f % Response f %
No 21 28.4 No 6 8.11
Yes 53 71.6 Yes 68 91.89
Total 74 100.0 Total 74 100.0
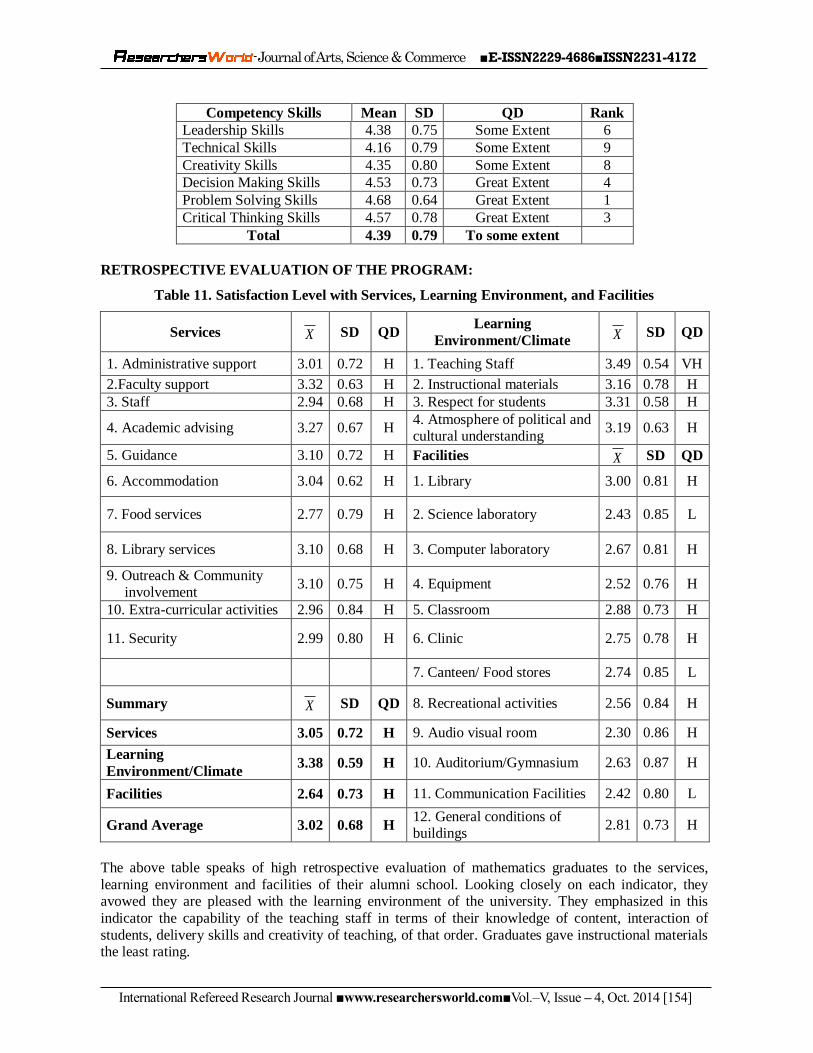
COMPETENCY SKILLS:
Based from table, problem solving, human relations, critical thinking, decision making, and
communication skills plays major roles in the carrying out of their current work. Way behind are the
research skills, which according to the respondents occupy negligible roles in their work as they were
not required to conduct researches like action researches. In general, these skills have contributed in varying magnitude, into their current work.
Table 10. The Extent of Competency Skills Used by the Respondents in their Current Work
Competency Skills Mean SD QD Rank
Research Skills 3.82 1.10 Some Extent 10
Communication Skills 4.50 0.815 Great Extent 5
Human Relation Skills 4.58 0.66 Great Extent 2
Information Technology Skills 4.36 0.87 Some Extent 7
-Journal of Arts, Science & Commerce ■E-ISSN2229-4686■ISSN2231-4172
International Refereed Research Journal ■www.researchersworld.com■Vol.–V, Issue – 4, Oct. 2014 [154]
Competency Skills Mean SD QD Rank
Leadership Skills 4.38 0.75 Some Extent 6
Technical Skills 4.16 0.79 Some Extent 9
Creativity Skills 4.35 0.80 Some Extent 8
Decision Making Skills 4.53 0.73 Great Extent 4
Problem Solving Skills 4.68 0.64 Great Extent 1
Critical Thinking Skills 4.57 0.78 Great Extent 3
Total 4.39 0.79 To some extent
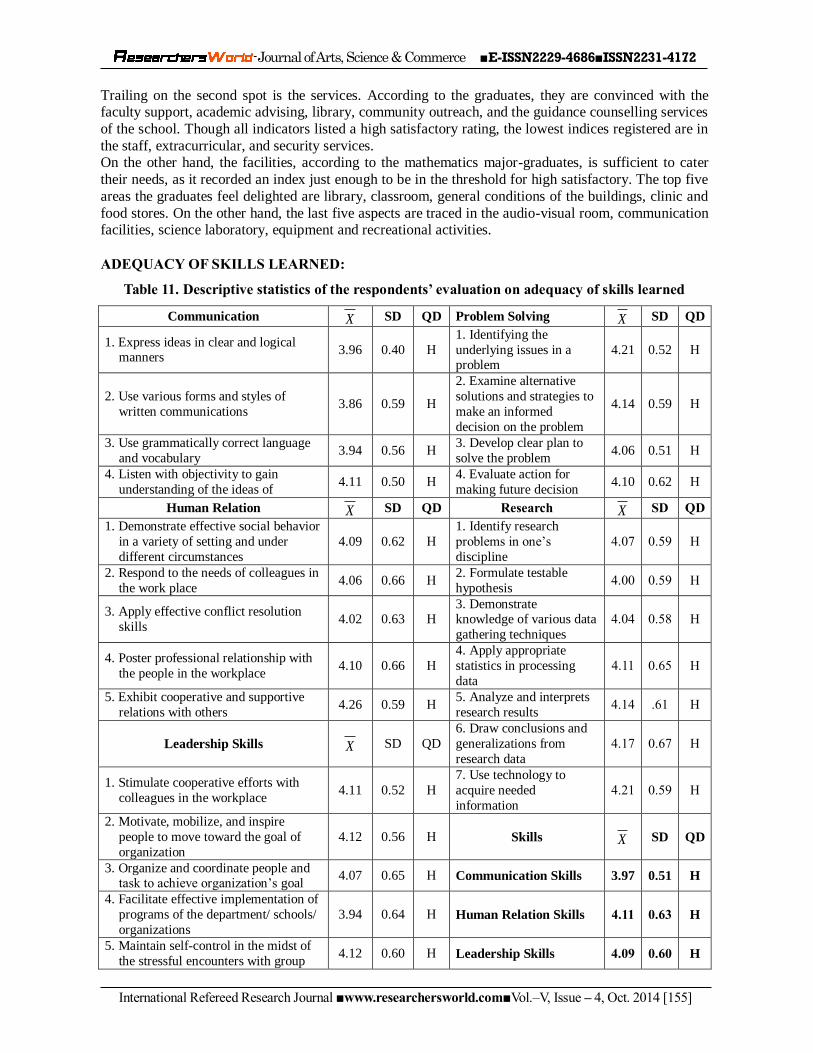
RETROSPECTIVE EVALUATION OF THE PROGRAM:
Table 11. Satisfaction Level with Services, Learning Environment, and Facilities
Services X SD QD Learning
Environment/Climate X SD QD
1. Administrative support 3.01 0.72 H 1. Teaching Staff 3.49 0.54 VH
2.Faculty support 3.32 0.63 H 2. Instructional materials 3.16 0.78 H
3. Staff 2.94 0.68 H 3. Respect for students 3.31 0.58 H
4. Academic advising 3.27 0.67 H 4. Atmosphere of political and cultural understanding
3.19 0.63 H
5. Guidance 3.10 0.72 H Facilities X SD QD
6. Accommodation 3.04 0.62 H 1. Library 3.00 0.81 H
7. Food services 2.77 0.79 H 2. Science laboratory 2.43 0.85 L
8. Library services 3.10 0.68 H 3. Computer laboratory 2.67 0.81 H
9. Outreach & Community involvement
3.10 0.75 H 4. Equipment 2.52 0.76 H
10. Extra-curricular activities 2.96 0.84 H 5. Classroom 2.88 0.73 H
11. Security 2.99 0.80 H 6. Clinic 2.75 0.78 H
7. Canteen/ Food stores 2.74 0.85 L
Summary X SD QD 8. Recreational activities 2.56 0.84 H
Services 3.05 0.72 H 9. Audio visual room 2.30 0.86 H
Learning
Environment/Climate 3.38 0.59 H 10. Auditorium/Gymnasium 2.63 0.87 H
Facilities 2.64 0.73 H 11. Communication Facilities 2.42 0.80 L
Grand Average 3.02 0.68 H 12. General conditions of buildings
2.81 0.73 H
The above table speaks of high retrospective evaluation of mathematics graduates to the services,
learning environment and facilities of their alumni school. Looking closely on each indicator, they avowed they are pleased with the learning environment of the university. They emphasized in this
indicator the capability of the teaching staff in terms of their knowledge of content, interaction of
students, delivery skills and creativity of teaching, of that order. Graduates gave instructional materials the least rating.
-Journal of Arts, Science & Commerce ■E-ISSN2229-4686■ISSN2231-4172
International Refereed Research Journal ■www.researchersworld.com■Vol.–V, Issue – 4, Oct. 2014 [155]
Trailing on the second spot is the services. According to the graduates, they are convinced with the faculty support, academic advising, library, community outreach, and the guidance counselling services
of the school. Though all indicators listed a high satisfactory rating, the lowest indices registered are in
the staff, extracurricular, and security services. On the other hand, the facilities, according to the mathematics major-graduates, is sufficient to cater
their needs, as it recorded an index just enough to be in the threshold for high satisfactory. The top five
areas the graduates feel delighted are library, classroom, general conditions of the buildings, clinic and
food stores. On the other hand, the last five aspects are traced in the audio-visual room, communication facilities, science laboratory, equipment and recreational activities.
ADEQUACY OF SKILLS LEARNED:
Table 11. Descriptive statistics of the respondents’ evaluation on adequacy of skills learned
Communication X SD QD Problem Solving X SD QD
1. Express ideas in clear and logical manners
3.96 0.40 H
1. Identifying the
underlying issues in a problem
4.21 0.52 H
2. Use various forms and styles of
written communications 3.86 0.59 H
2. Examine alternative
solutions and strategies to
make an informed
decision on the problem
4.14 0.59 H
3. Use grammatically correct language
and vocabulary 3.94 0.56 H
3. Develop clear plan to
solve the problem 4.06 0.51 H
4. Listen with objectivity to gain
understanding of the ideas of 4.11 0.50 H
4. Evaluate action for
making future decision 4.10 0.62 H
Human Relation X SD QD Research X SD QD
1. Demonstrate effective social behavior
in a variety of setting and under
different circumstances
4.09 0.62 H
1. Identify research
problems in one’s
discipline
4.07 0.59 H
2. Respond to the needs of colleagues in
the work place 4.06 0.66 H
2. Formulate testable
hypothesis 4.00 0.59 H
3. Apply effective conflict resolution
skills 4.02 0.63 H
3. Demonstrate knowledge of various data
gathering techniques
4.04 0.58 H
4. Poster professional relationship with
the people in the workplace 4.10 0.66 H
4. Apply appropriate
statistics in processing
data
4.11 0.65 H
5. Exhibit cooperative and supportive
relations with others 4.26 0.59 H
5. Analyze and interprets
research results 4.14 .61 H
Leadership Skills X SD QD
6. Draw conclusions and
generalizations from
research data
4.17 0.67 H
1. Stimulate cooperative efforts with
colleagues in the workplace 4.11 0.52 H
7. Use technology to
acquire needed
information
4.21 0.59 H
2. Motivate, mobilize, and inspire
people to move toward the goal of
organization
4.12 0.56 H Skills X SD QD
3. Organize and coordinate people and task to achieve organization’s goal
4.07 0.65 H Communication Skills 3.97 0.51 H
4. Facilitate effective implementation of
programs of the department/ schools/
organizations
3.94 0.64 H Human Relation Skills 4.11 0.63 H
5. Maintain self-control in the midst of
the stressful encounters with group 4.12 0.60 H Leadership Skills 4.09 0.60 H
-Journal of Arts, Science & Commerce ■E-ISSN2229-4686■ISSN2231-4172
International Refereed Research Journal ■www.researchersworld.com■Vol.–V, Issue – 4, Oct. 2014 [156]
members
6. Take responsibility and risks in
making decisions 4.19 0.61 H Problem Solving Skills 4.13 0.56 H
N = 81
Research Skills 4.11 0.59 H
TOTAL 4.28 0.58 H
Based on the data, it appears that graduates give due credit to the university as they found the different
skills being provided adequately to very adequately. Problem solving skills, according to them, had been offered very satisfactorily during their undergraduate years. The other skills, the human relations,
research, leadership, and communication, were as well provided reasonably.
Scrutinizing the means, the top five skills derived by the graduates from the university are: 1) Exhibit
cooperative and supportive relations with others (Human relations); 2) Identifying the underlying issues in a problem (Problem solving); 3. Use technology to acquire needed information (Research); 4. Take
responsibility and risks in making decisions (Leadership); and 5) Draw conclusions and generalizations
from research data (Research).
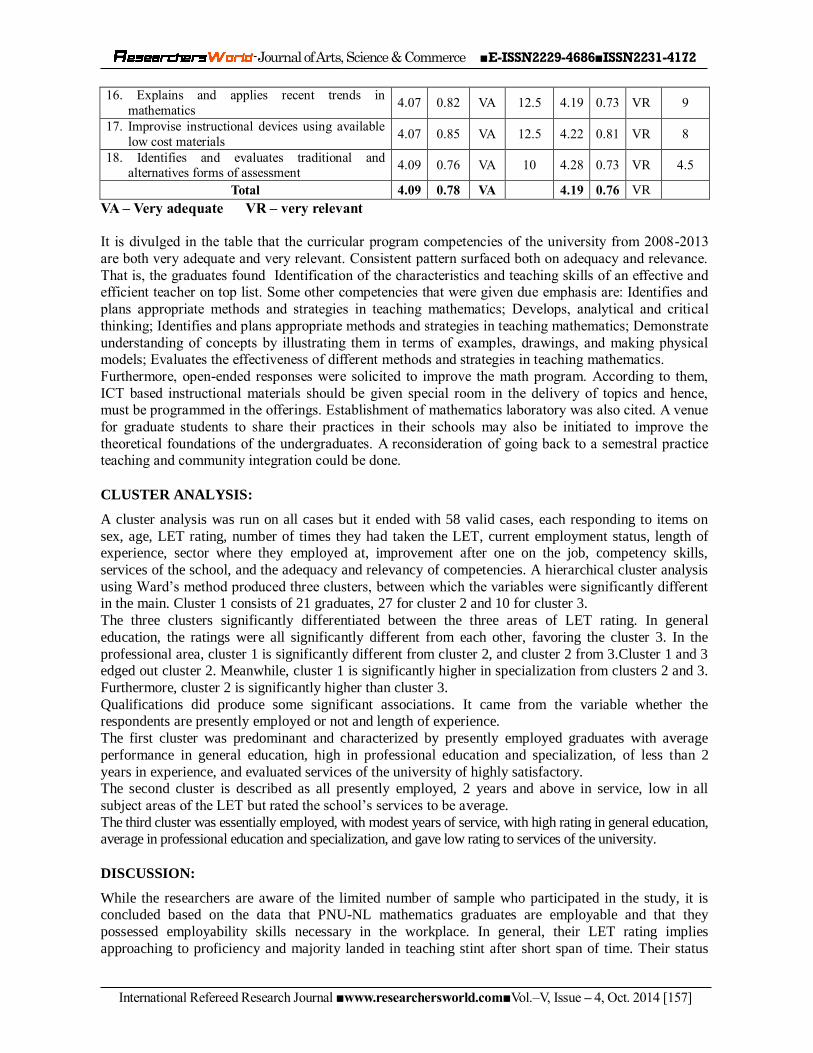
ADEQUACY AND RELEVANCE OF THE CURRICULAR PROGRAM COMPETENCIES:
Table 12. Descriptive statistics of the respondents’ evaluation on
adequacy and relevance of curricular program
Indicators Adequacy Relevance
X SD QD Rank X SD QD Rank
1. Uses critical thinking in analyzing quantitative
problems 4.07 0.70 VA 12.5 4.17 0.74 VR 10
2. Performs basic statistical processes skilfully in
order to involve with meaningful interpretation
of date
3.98 0.76 VA 16 4.05 0.77 VR 16
3. Applies the postulate and the proved theorems in
solving routine and non-routine problems 3.81 0.88 VA 18 4.02 0.76 VR 18
4. Demonstrate understanding of concepts by
illustrating them in terms of examples,
drawings, and making physical models
4.21 0.79 VA 3.5 4.30 0.71 VR 2.5
5. Applies the principles and methods of logic in
distinguishing good(correct) from
bad(incorrect) statements
4.10 0.87 VA 9 4.23 0.76 VR 7
6. Increases proficiency in reasoning 3.94 0.89 VA 17 4.15 0.84 VR 11.5
7. Proves validity and invalidity of arguments 4.01 0.80 VA 15 4.04 0.77 VR 17
8. Determines the appropriate statistical formula to
apply in order to describe qualitative data 4.11 0.77 VA 7 4.11 0.84 VR 13.5
9. Decides whether the characteristics of a sample are also the characteristics of a population it
characterizes
4.07 0.83 VA 12.5 4.11 0.87 VR 13.5
10. Determine the significance of the difference on
a certain trait among two or more groups 4.11 0.74 VA 7 4.10 0.73 VR 15
11. Develops, analytical and critical thinking 4.21 0.80 VA 3.5 4.25 0.77 VR 6
12. Discusses the philosophy of teaching
mathematics 4.11 0.79 VA 7 4.15 0.81 VR 11.5
13. Identifies and plans appropriate methods and
strategies in teaching mathematics 4.23 0.66 VA 2 4.30 0.68 VR 2.5
14. Evaluates the effectiveness of different methods and strategies in teaching mathematics
4.15 0.73 VA 5 4.28 0.69 VR 4.5
15. Identifies the characteristics and teaching skills
of an effective and efficient teacher 4.27 0.67 VA 1 4.38 0.64 VR 1
-Journal of Arts, Science & Commerce ■E-ISSN2229-4686■ISSN2231-4172
International Refereed Research Journal ■www.researchersworld.com■Vol.–V, Issue – 4, Oct. 2014 [157]
16. Explains and applies recent trends in
mathematics 4.07 0.82 VA 12.5 4.19 0.73 VR 9
17. Improvise instructional devices using available
low cost materials 4.07 0.85 VA 12.5 4.22 0.81 VR 8
18. Identifies and evaluates traditional and alternatives forms of assessment
4.09 0.76 VA 10 4.28 0.73 VR 4.5
Total 4.09 0.78 VA 4.19 0.76 VR
VA – Very adequate VR – very relevant
It is divulged in the table that the curricular program competencies of the university from 2008-2013
are both very adequate and very relevant. Consistent pattern surfaced both on adequacy and relevance.
That is, the graduates found Identification of the characteristics and teaching skills of an effective and efficient teacher on top list. Some other competencies that were given due emphasis are: Identifies and
plans appropriate methods and strategies in teaching mathematics; Develops, analytical and critical
thinking; Identifies and plans appropriate methods and strategies in teaching mathematics; Demonstrate
understanding of concepts by illustrating them in terms of examples, drawings, and making physical models; Evaluates the effectiveness of different methods and strategies in teaching mathematics.
Furthermore, open-ended responses were solicited to improve the math program. According to them,
ICT based instructional materials should be given special room in the delivery of topics and hence, must be programmed in the offerings. Establishment of mathematics laboratory was also cited. A venue
for graduate students to share their practices in their schools may also be initiated to improve the
theoretical foundations of the undergraduates. A reconsideration of going back to a semestral practice teaching and community integration could be done.
CLUSTER ANALYSIS:
A cluster analysis was run on all cases but it ended with 58 valid cases, each responding to items on
sex, age, LET rating, number of times they had taken the LET, current employment status, length of experience, sector where they employed at, improvement after one on the job, competency skills,
services of the school, and the adequacy and relevancy of competencies. A hierarchical cluster analysis
using Ward’s method produced three clusters, between which the variables were significantly different in the main. Cluster 1 consists of 21 graduates, 27 for cluster 2 and 10 for cluster 3.
The three clusters significantly differentiated between the three areas of LET rating. In general
education, the ratings were all significantly different from each other, favoring the cluster 3. In the
professional area, cluster 1 is significantly different from cluster 2, and cluster 2 from 3.Cluster 1 and 3 edged out cluster 2. Meanwhile, cluster 1 is significantly higher in specialization from clusters 2 and 3.
Furthermore, cluster 2 is significantly higher than cluster 3.
Qualifications did produce some significant associations. It came from the variable whether the respondents are presently employed or not and length of experience.
The first cluster was predominant and characterized by presently employed graduates with average
performance in general education, high in professional education and specialization, of less than 2
years in experience, and evaluated services of the university of highly satisfactory. The second cluster is described as all presently employed, 2 years and above in service, low in all
subject areas of the LET but rated the school’s services to be average.
The third cluster was essentially employed, with modest years of service, with high rating in general education, average in professional education and specialization, and gave low rating to services of the university.
DISCUSSION:
While the researchers are aware of the limited number of sample who participated in the study, it is concluded based on the data that PNU-NL mathematics graduates are employable and that they
possessed employability skills necessary in the workplace. In general, their LET rating implies
approaching to proficiency and majority landed in teaching stint after short span of time. Their status
-Journal of Arts, Science & Commerce ■E-ISSN2229-4686■ISSN2231-4172
International Refereed Research Journal ■www.researchersworld.com■Vol.–V, Issue – 4, Oct. 2014 [158]
had improved immediately after one year. Moreover, graduates possess relevant characteristics and skills and were clustered into three unique strata. They have shown flexibility as they were teaching
other subject areas at all levels.
Furthermore, based on their retrospective evaluation, the University had provided sufficient services, adequate and relevant curricular program competencies to prepare these graduates in their present
endeavors. The competency skills acquired by the graduates were found useful in their work to some
extent. Thus, the university provides skills and abilities to its students needed in a workplace situations.
Based on the data, few points need to be stressed to improved employability: 1) the University is encouraged to take measures to increase the number of graduates who pursue graduate programs and offer
trainings and seminars relevant to their needs; 2) Improve student recruitment program to broaden and
extend the origin of students while maintaining the admission and selection of students to increase chances of getting the most qualified students; 3) Improve some aspects facilities and services to cater the students’
needs for quality learning; and 4) Establish and strengthen a strong link with alumni to access knowledge
and practices in the field and consequently, build venues of sharing these to students of the university. In spite of the graduates’ status, the key challenge is not only that they are employed or they are
employable but also that their employment best utilises their education. In this country where education
is seen as the greatest remnant parents could give to their offspring, it is of major concern, given this
plethora of change, most notable the K-12 program and the ASEAN 2015, how these teacher-graduates transform, inspire and respond to the way teaching as a profession and a vocation is regarded while
maintaining their passion and commitment in serving the nation.
FUTURE DIRECTIONS:
Conduct the study in a wider scale with larger turn out of respondents to establish generalizability.
Strengthen the foundations of what determines professional success as an integral component of
employability. Researchers may as well dwell on the context of employability between private and
public institutions and determine the factors that affect the duration of employment and unemployment using the parametric survival model of Kong (2011).
REFERENCES:
[1] Arcelo, A. A. & Sanyal, B. K. (1987). Employment and career opportunities after graduation. A study on the transition from college to work in the Philippines.
http://unesdoc.unesco.org/images/0007/000774/077482eo.pdf
[2] Boholano, H.B. (2012).Employability of Teacher Education Graduates of an Asian Public
University. Published Online, http//dx.doi.org/10.77.9/jpair.v9i1.12. [3] Bruwer, J. (1998). First destination graduate employment as key performance indicator:
outcomes assessment perspectives. Unit for Institutional Planning and Research, Cape
Technikon, South Africa, [email protected]. [4] Carr, L. (nd). What are achievements in job applications.
[5] Colarte, C. T. (2010) Tracer study of education graduates employed on Ozamiz City Division.
302 ICC/ ICC- La Salle/ La Salle University Education. Collier’sEncyclopedia, 5, 421. [6] De Ocampo, M. B., Bagano, A. S., & Tan, A. R. Cultural entrepreneurship vs employment. A
paper presented during the 2012 Ta-Philippines Academic Conference: Digital Humanities and
Cultural Studies.
[7] Hick, S. (2003).Factors influencing unemployment.CarletonUniversity. Retrieved from: http://www.son.rochester.edu/prospective-students/why-pursue-advanced-degree.html
[8] Kong, J. (2011). Factors affecting employment, unemployment, and graduate study for university
graduates in Beijing. [9] Mercado, F. M. (2010). A tracer study of MSUEF graduates. Dr. Cesar A. Villarita Research and
Publication Institute, College of Arts and Sciences, Institute of graduate studies and research
Envarga University.
-Journal of Arts, Science & Commerce ■E-ISSN2229-4686■ISSN2231-4172
International Refereed Research Journal ■www.researchersworld.com■Vol.–V, Issue – 4, Oct. 2014 [159]
[10] Pavlin, S. (2013). Employability of higher education graduates: findings and policy implications from the selected EU projects. A paper presented during the EU Higher Conference, Kuala
Lumpur Convention Center, December 16, 2013.
[11] Peacock, L. (2007). Economic, employment, educational, and environmental factors cause seven-year gap on life expectancy of men in London.
[12] Psacharopoutos, G. and Schotter, M. (2004). Skills for employability, economic growth to
innovation: Monitoring the relevance of education and training systems. European Expert
Network on Economics of Education (EENEE).http://www.eenee.de/docs/employability. [13] Schools do matter in employability of graduates (2013, January 13). The Manila Bulletin. Retrieved
from https://ph.news.yahoo.com/schools-matter-employability-graduates-024817278.html.
[14] Yorke, M. & Knight, P. (2003). Assessment learning to employability Glasgow: Society for research into higher education and Open University.
-----