the employee experience index around the globe - … · the employee experience index around the...
TRANSCRIPT
Thought Leadership WhitepaperIBM Collaboration and Talent Management
The Employee Experience Index around the globeHow countries measure up and create human workplaces
The Employee Experience Index around the globe: How countries measure up and create human workplaces
2
What drives a positive employee experience?In order to enhance the employee experience, our research found that organizations need to have effective leaders and managers who can provide a high level of clarity and direction, and focus on the human workplace practices that drive positive employee experiences, including:
• Organizational trust• Supportive coworker relationships• Meaningful work• Recognition, feedback and growth• Empowerment and voice• Work-life balance
Employee experiences around the worldIn this paper, the IBM Smarter Workforce Institute and Globoforce’s WorkHuman Research Institute explore the levels of employee experience in different countries and the relative importance of the drivers of employee experience across countries.
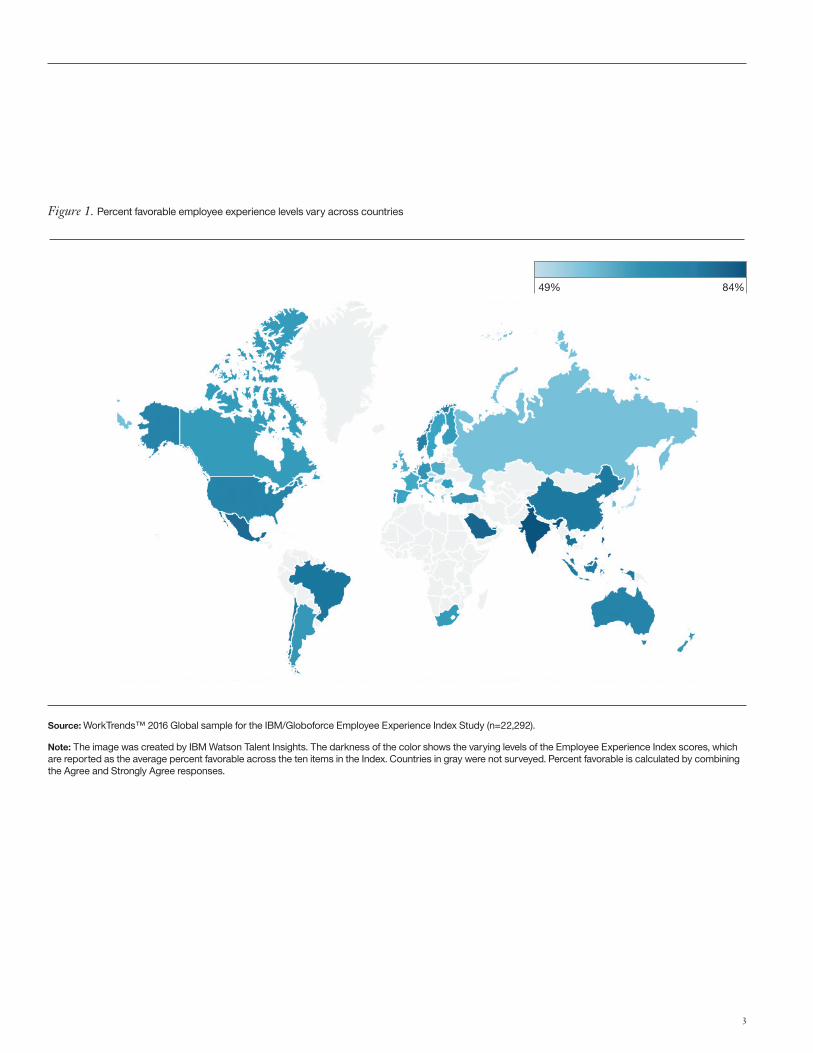
Variations in employee experience around the worldClear differences emerge when comparing employee experience scores across countries, as shown in Figure 1 (where darker colors indicate higher scores). The score is reported as the average percent favorable across the ten items (five dimensions) in the Employee Experience Index.
IntroductionEmployee experience can be a positive, powerful, and ultimately human experience, in which employees are able to invest more of their whole selves into the workplace.1 Recent research (published in The Employee Experience Index: A new global measure of a human workplace and its impact) by the IBM Smarter Workforce Institute and Globoforce’s WorkHuman® Research Institute has resulted in the development of a new Employee Experience Index – measuring its five core dimensions2:
• Belonging – feeling part of a team, group or organization• Purpose – understanding why one’s work matters• Achievement – a sense of accomplishment in the work that
is done• Happiness – the pleasant feeling arising in and around work• Vigor – the presence of energy, enthusiasm, and excitement
at work
Our original research revealed that employees experiencing a sense of belonging, purpose, achievement, happiness and vigor are more likely to report a high level of performance and discretionary effort in their work, and they are more likely to want to stay at their organization.
“Employees [with a positive experience at work] are more likely to report a high level of performance and discretionary effort in their work, and they are more likely to want to stay at their organization.”
3
Figure 1. Percent favorable employee experience levels vary across countries
Source: WorkTrends™ 2016 Global sample for the IBM/Globoforce Employee Experience Index Study (n=22,292).
Note: The image was created by IBM Watson Talent Insights. The darkness of the color shows the varying levels of the Employee Experience Index scores, which are reported as the average percent favorable across the ten items in the Index. Countries in gray were not surveyed. Percent favorable is calculated by combining the Agree and Strongly Agree responses.
84%49%
The Employee Experience Index around the globe: How countries measure up and create human workplaces
4
About the AnalysisAnalyses presented in this white paper are based on a global survey of more than 22,000 workers participating in the IBM WorkTrends™ survey. WorkTrends™ is a research program initiated in 1984, originally designed to track trends in specific workforce themes over time. WorkTrends has evolved to a large global online survey completed by workers from a cross-section of industries around the world, on a variety of contemporary topics of interest to HR and business leaders. The analyses presented in this paper are based on the 2016 WorkTrends survey results from 43 countries and territories, a cross-section of industries, thousands of different organizations and all major job families. Globoforce was a key collaborator on the employee
experience content of the 2016 WorkTrends survey.
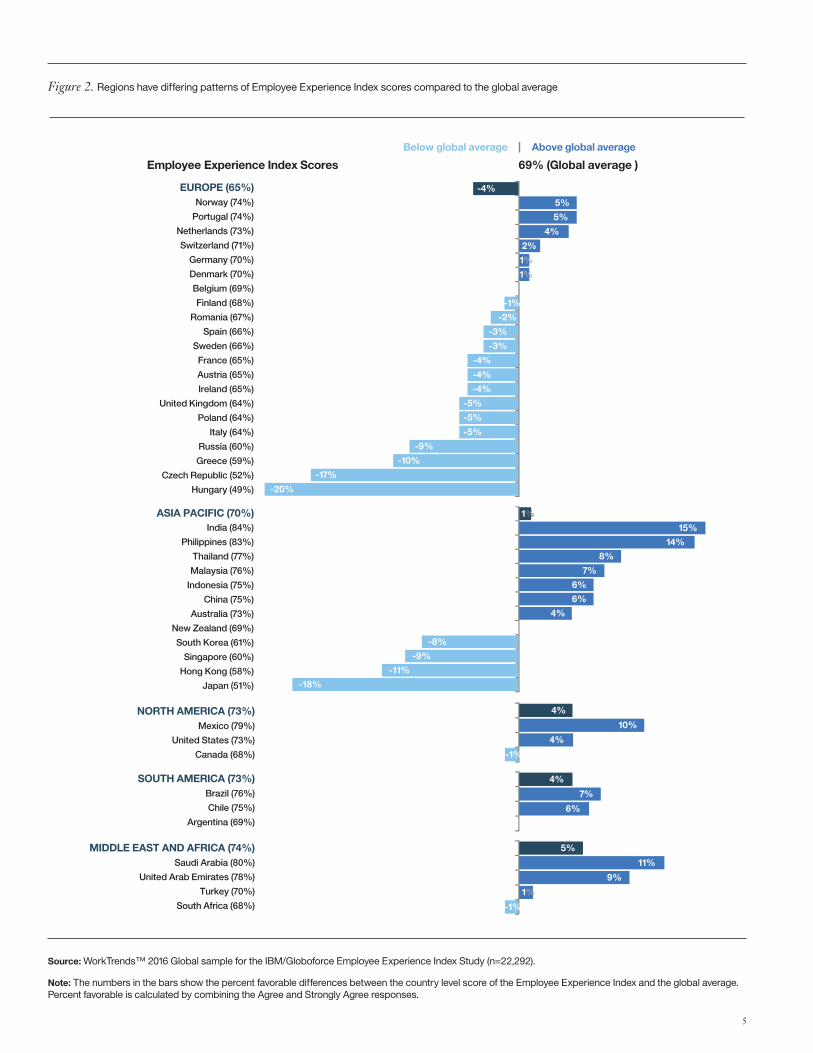
To understand the employee experience levels in different countries, we examined the country ranking of the Employee Experience Index scores, grouped by region (see Figure 2). The average Employee Experience Index score of all the surveyed countries and territories is 69 percent. Employee Experience Index scores are highest in India (84 percent), and lowest in Hungary (49 percent).
Further insights into Employee Experience Index scores by region are summarized below:
• The Employee Experience Index score for Europe is 65 percent, which is the lowest among the regions. Most European countries are close to the global average (+/- five percentage points), however four countries (Russia, Greece, Czech Republic and Hungary) are substantially lower than the global average. In particular, the Czech Republic and Hungary are significantly below the global average at 17 and 20 percentage points lower, respectively. Norway has the highest level of employee experience (74 percent) in Europe, although this is still relatively close to the global average.
• The Employee Experience Index score for the Asia Pacific region (70 percent) is close to the global level. However, this region has some of the largest variations in Employee Experience Index scores, with India (84 percent) at the top of the ranking, closely followed by the Philippines (83 percent), while Japan is at the bottom (51 percent).
• The Employee Experience Index score for North America (73 percent) is higher than the global average. Mexico shows the highest score (79 percent) in the region, while the United States is in the middle (73 percent), and Canada ranks lowest (68 percent).
• All of the surveyed countries in South America show a higher level of employee experience than the global average. Employees in Brazil are most positive about their experience at work (76 percent), closely followed by Chile at 75 percent. The Employee Experience Index score in Argentina matches the global average at 69 percent.
• The score for the Middle East and Africa region is higher, at 74 percent, than the global average score. Saudi Arabia ranks first in the region (80 percent) and South Africa ranks lowest at 68 percent.
5
Figure 2. Regions have differing patterns of Employee Experience Index scores compared to the global average
Source: WorkTrends™ 2016 Global sample for the IBM/Globoforce Employee Experience Index Study (n=22,292).
Note: The numbers in the bars show the percent favorable differences between the country level score of the Employee Experience Index and the global average. Percent favorable is calculated by combining the Agree and Strongly Agree responses.
69% (Global average )Employee Experience Index Scores
Below global average Above global average
Norway (74%)
Portugal (74%)
Netherlands (73%)
Switzerland (71%)
Germany (70%)
Denmark (70%)
Belgium (69%)
Finland (68%)
Romania (67%)
Spain (66%)
Sweden (66%)
France (65%)
Austria (65%)
Ireland (65%)
United Kingdom (64%)
Poland (64%)
Italy (64%)
Russia (60%)
Greece (59%)
Czech Republic (52%)
Hungary (49%)
-4%
5%
5%
4%
2%
1%
1%
-1%
-2%
-3%
-3%
-4%
-4%
-4%
-5%
-5%
-5%
-9%
-10%
-17%
-20%
EUROPE (65%)
India (84%)
Philippines (83%)
Thailand (77%)
Malaysia (76%)
Indonesia (75%)
China (75%)
Australia (73%)
New Zealand (69%)
South Korea (61%)
Singapore (60%)
Hong Kong (58%)
Japan (51%)
1%
15%
14%
8%
7%
6%
6%
4%
-8%
-9%
-11%
-18%
ASIA PACIFIC (70%)
4%
10%
4%
4%
7%
6%
5%
11%
9%
1%
NORTH AMERICA (73%)Mexico (79%)
United States (73%)
Canada (68%)
SOUTH AMERICA (73%)Brazil (76%)
Chile (75%)
Argentina (69%)
MIDDLE EAST AND AFRICA (74%)Saudi Arabia (80%)
United Arab Emirates (78%)
Turkey (70%)
South Africa (68%) -1%
-1%
The Employee Experience Index around the globe: How countries measure up and create human workplaces
6
The relative importance of human workplace practices Employee surveys should be followed by specific, visible actions, and organizations should focus on actions most likely to create positive change. This means understanding the most impactful drivers of a positive employee experience.
Our original research introduced six human workplace practices as a set of qualities that acknowledge the human side of work. These practices contribute to the employee experience by addressing:
• The Environment – combining a strong sense of organizational trust and enabling supportive coworker relationships
• The Work – emphasizing the meaningfulness of the work and providing continuous feedback, recognition, and growth
• The Person – acknowledging the importance of empowerment and voice, as well as opportunities to disconnect and recharge from work
We performed a relative weights analysis (RWA)³ on the relationship between these human workplace practices and the employee experience. The RWA results show the relative impact each driver has on employee experience. The relative importance of human workplace practices on employee experience is shown in Figure 3.
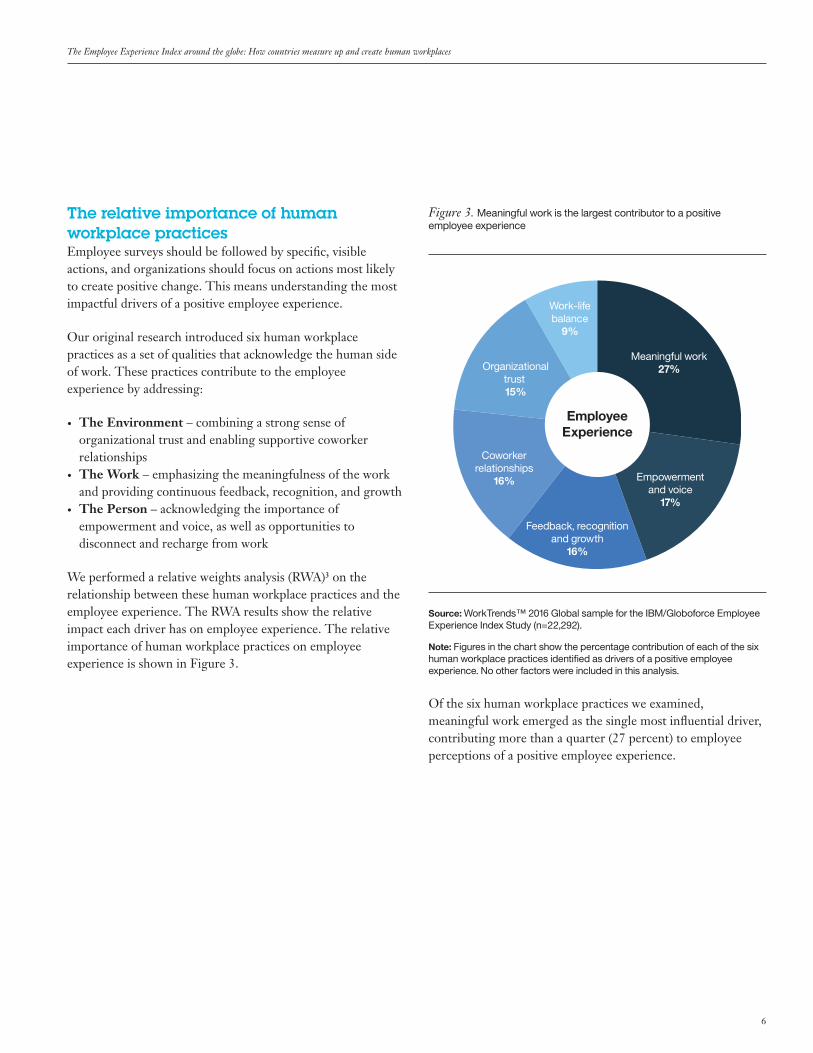
Figure 3. Meaningful work is the largest contributor to a positive employee experience
Source: WorkTrends™ 2016 Global sample for the IBM/Globoforce Employee Experience Index Study (n=22,292).
Note: Figures in the chart show the percentage contribution of each of the six human workplace practices identified as drivers of a positive employee experience. No other factors were included in this analysis.
Of the six human workplace practices we examined, meaningful work emerged as the single most influential driver, contributing more than a quarter (27 percent) to employee perceptions of a positive employee experience.
EmployeeExperience
Work-lifebalance
9%
Organizationaltrust 15%
Coworkerrelationships
16%
Feedback, recognitionand growth
16%
Empowermentand voice
17%
Meaningful work27%
7
Building upon a foundation of meaningful work, our research suggests that a more positive employee experience can be inspired by combining and integrating further human workplace practices: enabling empowerment and voice (contributes 17 percent to employee experience), fostering a culture of recognition, feedback, and growth (contributes 16 percent to employee experience), supporting coworker relationships (contributes 16 percent to employee experience), and building organizational trust (contributes 15 percent to employee experience). The final driver of a more human workplace is work-life balance and opportunities to recharge and disconnect, which contributes 9 percent to employee experience.
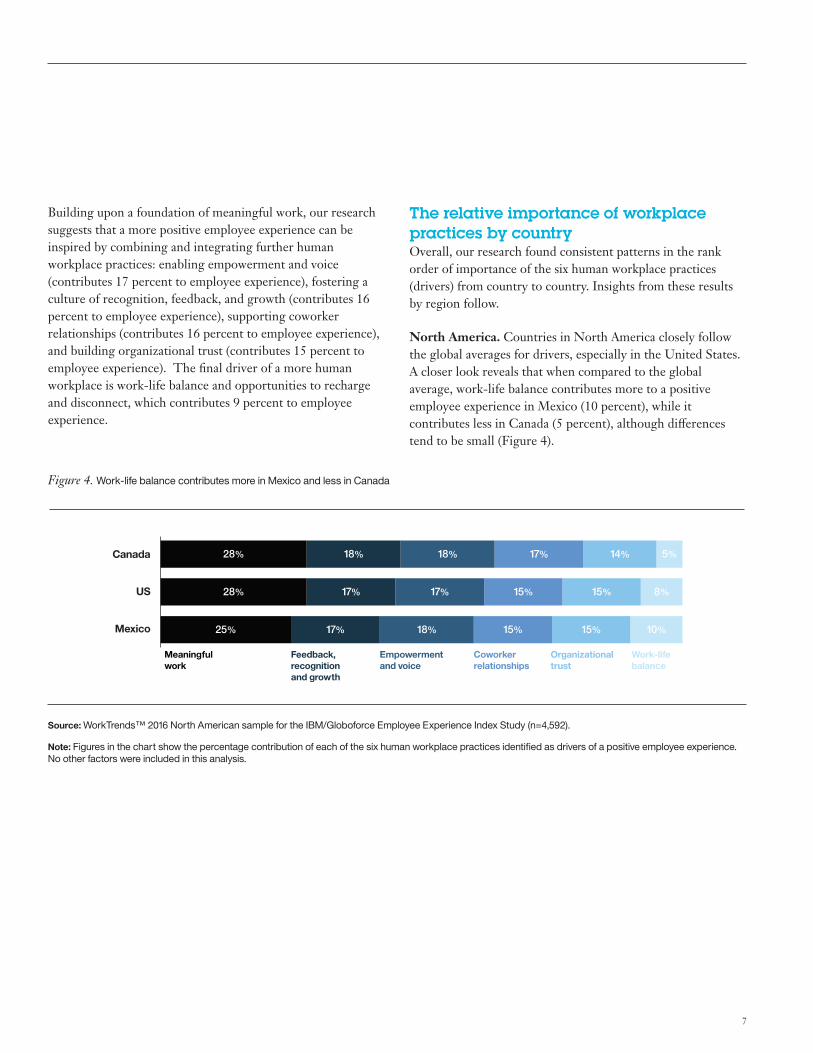
Source: WorkTrends™ 2016 North American sample for the IBM/Globoforce Employee Experience Index Study (n=4,592).
Note: Figures in the chart show the percentage contribution of each of the six human workplace practices identified as drivers of a positive employee experience. No other factors were included in this analysis.
The relative importance of workplace practices by country Overall, our research found consistent patterns in the rank order of importance of the six human workplace practices (drivers) from country to country. Insights from these results by region follow.
North America. Countries in North America closely follow the global averages for drivers, especially in the United States. A closer look reveals that when compared to the global average, work-life balance contributes more to a positive employee experience in Mexico (10 percent), while it contributes less in Canada (5 percent), although differences tend to be small (Figure 4).
Figure 4. Work-life balance contributes more in Mexico and less in Canada
Canada
US
Mexico
28% 18%
28%
25% 17% 18% 15% 15% 10%
17%
18%
17%
17%
15%
14%
15%
5%
8%
Work-life balance
Organizational trust
Coworker relationships
Feedback, recognition and growth
Empowerment and voice
Meaningful work
The Employee Experience Index around the globe: How countries measure up and create human workplaces
8
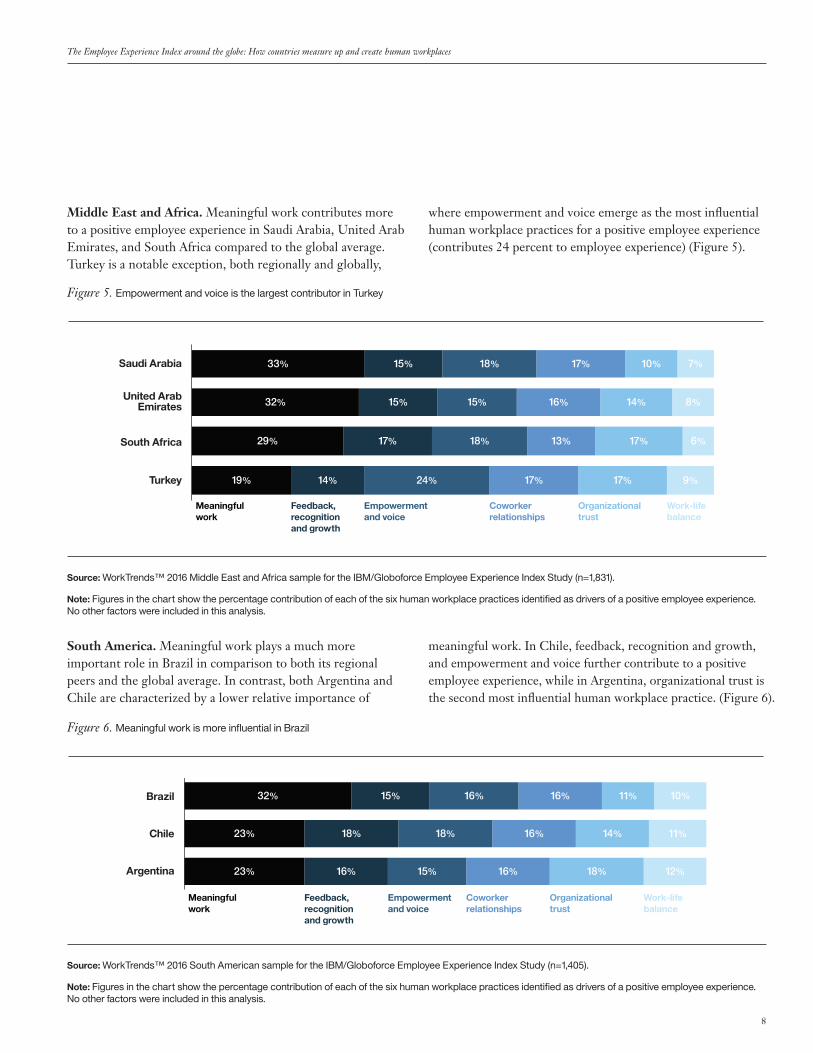
Middle East and Africa. Meaningful work contributes more to a positive employee experience in Saudi Arabia, United Arab Emirates, and South Africa compared to the global average. Turkey is a notable exception, both regionally and globally,
Source: WorkTrends™ 2016 Middle East and Africa sample for the IBM/Globoforce Employee Experience Index Study (n=1,831).
Note: Figures in the chart show the percentage contribution of each of the six human workplace practices identified as drivers of a positive employee experience. No other factors were included in this analysis.
Source: WorkTrends™ 2016 South American sample for the IBM/Globoforce Employee Experience Index Study (n=1,405).
Note: Figures in the chart show the percentage contribution of each of the six human workplace practices identified as drivers of a positive employee experience. No other factors were included in this analysis.
where empowerment and voice emerge as the most influential human workplace practices for a positive employee experience (contributes 24 percent to employee experience) (Figure 5).
Figure 5. Empowerment and voice is the largest contributor in Turkey
South America. Meaningful work plays a much more important role in Brazil in comparison to both its regional peers and the global average. In contrast, both Argentina and Chile are characterized by a lower relative importance of
meaningful work. In Chile, feedback, recognition and growth, and empowerment and voice further contribute to a positive employee experience, while in Argentina, organizational trust is the second most influential human workplace practice. (Figure 6).
Figure 6. Meaningful work is more influential in Brazil
Saudi Arabia
United Arab Emirates
South Africa
Turkey
33% 15%
32%
29% 17% 18% 13% 17% 6%
19% 14% 24% 17% 17% 9%
15%
18%
15%
17%
16%
10%
14%
7%
8%
Work-life balance
Organizational trust
Coworker relationships
Feedback, recognition and growth
Empowerment and voice
Meaningful work
Brazil
Chile
Argentina
32% 15%
23%
23% 16% 15% 16% 18% 12%
18%
16%
18%
16%
16%
11%
14%
10%
11%
Work-life balance
Organizational trust
Coworker relationships
Feedback,recognition and growth
Empowerment and voice
Meaningful work
9
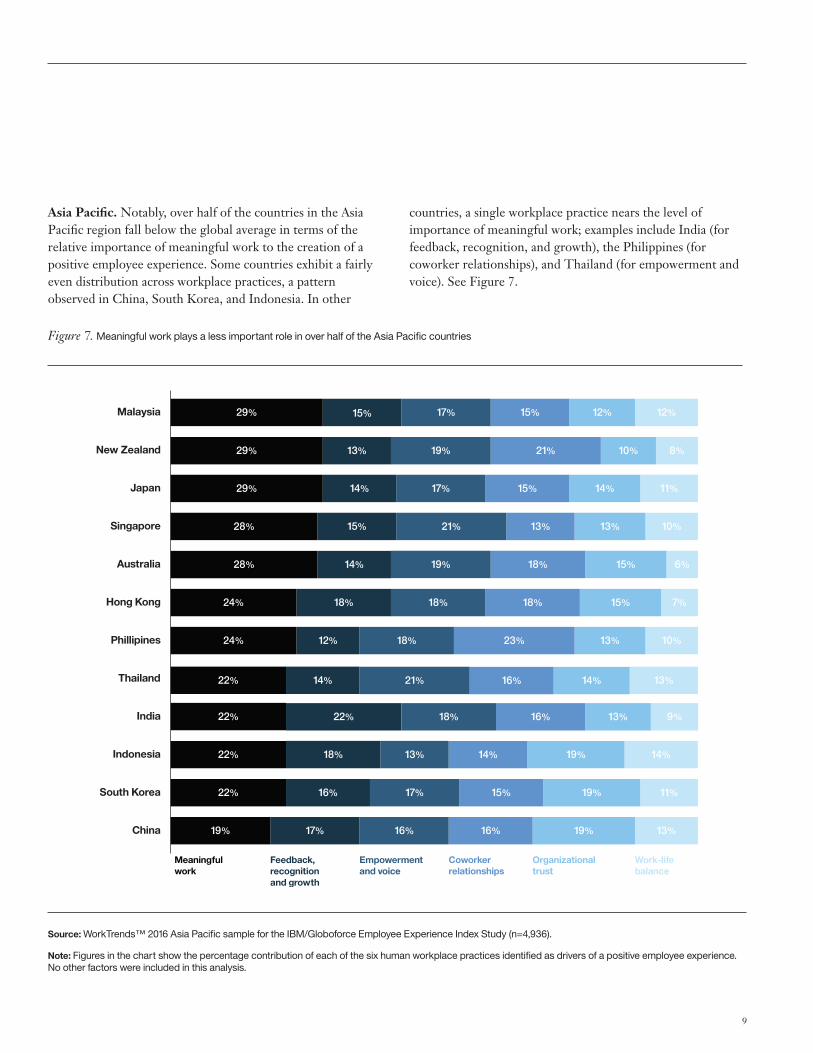
Asia Pacific. Notably, over half of the countries in the Asia Pacific region fall below the global average in terms of the relative importance of meaningful work to the creation of a positive employee experience. Some countries exhibit a fairly even distribution across workplace practices, a pattern observed in China, South Korea, and Indonesia. In other
Source: WorkTrends™ 2016 Asia Pacific sample for the IBM/Globoforce Employee Experience Index Study (n=4,936).
Note: Figures in the chart show the percentage contribution of each of the six human workplace practices identified as drivers of a positive employee experience. No other factors were included in this analysis.
countries, a single workplace practice nears the level of importance of meaningful work; examples include India (for feedback, recognition, and growth), the Philippines (for coworker relationships), and Thailand (for empowerment and voice). See Figure 7.
Figure 7. Meaningful work plays a less important role in over half of the Asia Pacific countries
Malaysia
New Zealand
Japan
Singapore
Australia
Hong Kong
Phillipines
Thailand
India
Indonesia
South Korea
China
29% 15% 17% 15% 12% 12%
29% 13% 19% 21% 10% 8%
29% 14% 17% 15% 14% 11%
28% 15% 21% 13% 13% 10%
28% 14% 19% 18% 15% 6%
24% 18% 18% 18% 15% 7%
24% 12% 18% 23% 13% 10%
22% 14% 21% 16% 14% 13%
22% 22% 18% 16% 13% 9%
22% 18% 13% 14% 19% 14%
22% 16% 17% 15% 19% 11%
17% 16% 16% 19% 13%
Work-life balance
Organizational trust
Feedback, recognition and growth
Empowerment and voice
Meaningful work
19%
Coworker relationships
The Employee Experience Index around the globe: How countries measure up and create human workplaces
10
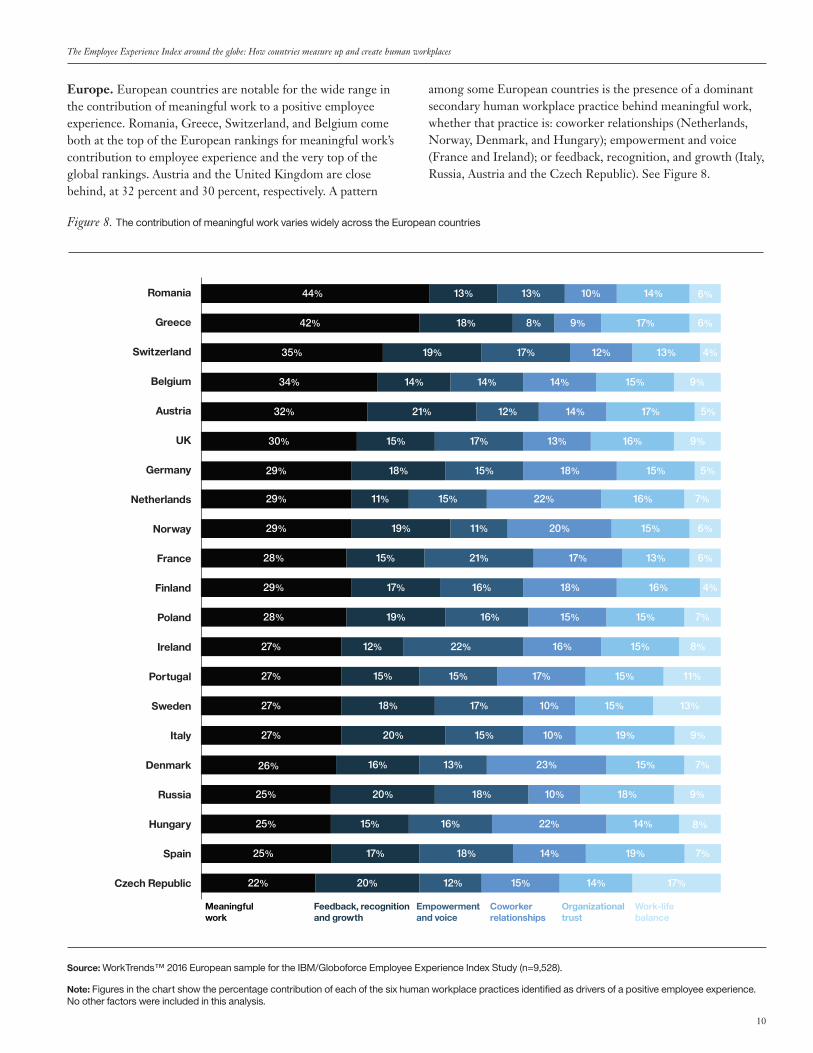
Europe. European countries are notable for the wide range in the contribution of meaningful work to a positive employee experience. Romania, Greece, Switzerland, and Belgium come both at the top of the European rankings for meaningful work’s contribution to employee experience and the very top of the global rankings. Austria and the United Kingdom are close behind, at 32 percent and 30 percent, respectively. A pattern
Source: WorkTrends™ 2016 European sample for the IBM/Globoforce Employee Experience Index Study (n=9,528).
Note: Figures in the chart show the percentage contribution of each of the six human workplace practices identified as drivers of a positive employee experience. No other factors were included in this analysis.
among some European countries is the presence of a dominant secondary human workplace practice behind meaningful work, whether that practice is: coworker relationships (Netherlands, Norway, Denmark, and Hungary); empowerment and voice (France and Ireland); or feedback, recognition, and growth (Italy, Russia, Austria and the Czech Republic). See Figure 8.
Figure 8. The contribution of meaningful work varies widely across the European countries
Romania
Greece
Switzerland
Belgium
Austria
UK
Germany
Netherlands
Norway
France
Finland
Poland
Ireland
Portugal
Sweden
Italy
Denmark
Russia
Hungary
Spain
Czech Republic
44% 13% 13% 10% 14% 6%
42% 18% 8% 9% 17% 6%
35% 19% 17% 12% 13% 4%
34% 14% 14% 14% 15% 9%
32% 21% 12% 14% 17% 5%
30% 15% 17% 13% 16% 9%
29% 18% 15% 18% 15% 5%
29% 11% 15% 22% 16% 7%
29% 19% 11% 20% 15% 6%
28% 15% 21% 17% 13% 6%
29% 17% 16% 18% 16% 4%
28% 19% 16% 15% 15% 7%
27% 12% 22% 16% 15% 8%
27% 15% 15% 17% 15% 11%
27% 18% 17% 10% 15% 13%
27% 20% 15% 10% 19% 9%
26% 16% 13% 23% 15% 7%
25% 20% 18% 10% 18% 9%
25% 15% 16% 22% 14% 8%
25% 17% 18% 14% 19% 7%
22% 20% 12% 15% 14% 17%
Work-life balance
Organizational trust
Coworker relationships
Feedback, recognition and growth
Empowerment and voice
Meaningfulwork
11
Conclusions and recommendationsIt is clear from this research that Employee Experience Index scores vary across countries. The scores in this paper can provide an important contextual comparison point for organizations to interpret the strengths and weaknesses of their employees’ experiences. These findings have important implications for organizations with international operations.4
Our research also reveals the global and regional differences in the relative importance of human workplace practices to a more positive employee experience. Given the country variations in Employee Experience Index scores, we recommend:
• Organizations operating in a single country should compare their Employee Experience Index score to the score of that country, rather than a global average.
• Multi-national organizations should look at the Employee Experience Index scores for the countries in which they operate, rather than the global score. Given the differences in scores around the world, it is important to benchmark within country.
• Organizations should track the trend of employee experiences within their organizations over time. The trend can help them better understand employees’ individual needs and enable them to act on the identified drivers and improve employee experience at work.
• Organizations may want to consider the relative importance of human workplace practices in the countries and regions in which they operate, and take advantage of opportunities to tailor their approaches to the most important in-country factors.
In terms of tactics to address the identified human workplace practices, we recommend:
• Developing strategies to enhance perceptions of the meaningfulness of work, for example creating deeper connections to stakeholders and beneficiaries by communicating how work outcomes contribute to the bigger picture.
• Listening regularly to the voice of your employees (through platforms such as census and pulse surveys, social listening, etc.) to understand the nature of their experiences at work and uncover opportunities for greater empowerment.
• Implementing social technologies that help employees develop a cadence of continuous conversations around performance, receive peer recognition and coaching, and document progress from regular manager check-ins.
• Creating opportunities for social connections within and across teams, through collaboration spaces and office design, communication tools, and via the creation of virtual communities.
• Ensuring transparency and clarity of the organization’s mission and core values, communicating why employees matter and the specific behaviors that exemplify those values throughout the organization.
• Providing opportunities for employees to flexibly manage their work and to disconnect during non-work hours, where possible.
The Employee Experience Index around the globe: How countries measure up and create human workplaces
12
A note about cross-cultural research It is worth noting that survey research with individuals from different cultures needs to consider whether survey respondents interpret questions similarly across cultures (i.e. measurement invariance).5 For example, response tendencies, which refer to the different ways that people in different cultures respond to survey items,6 has been an important issue in cross-culture research. For the analysis in this paper, we tested the measurement invariance of the new Employee Experience Index with multilevel Confirmatory Factor Analysis (CFA), a modern method that can distinguish true differences from differences in interpretation and response styles. We found that a fully constrained multilevel CFA model fits the data well. In the model, parameters held equal across countries. The results give us confidence that the raw scores can be used for meaningful comparison across countries in this study.
About IBM and the IBM Smarter Workforce InstituteToday’s human resources organizations need to attract and grow top-performing talent, create engaging social and collaborative cultures, and connect the right people to get work done. IBM solutions combine market-leading talent management and social collaboration tools with the power of workforce science and advanced analytics. We help organizations build impassioned and engaged workforces, and deepen client relationships that can lead to measurable business outcomes. To learn more about IBM Watson Talent and IBM Kenexa solutions and services, please visit https://www.ibm.com/watson/talent/
The IBM Smarter Workforce Institute produces rigorous, global, innovative research spanning a wide range of workforce topics. The Institute’s team of experienced researchers applies depth and breadth of content and analytical expertise to generate reports, white papers and insights that advance the collective understanding of work and organizations. This white paper is part of IBM’s on-going commitment to provide highly credible, leading-edge research findings that help organizations realize value through their people.
To learn more about IBM Smarter Workforce Institute, please contact us at [email protected]. Follow @IBMSmtWorkforce on Twitter or visit our website: www.ibm.com/software/smarterworkforce/institute
About Globoforce and the WorkHuman Research InstitutePioneer of the WorkHuman movement, Globoforce helps make work more human for millions of people and organizations worldwide. Its cloud-based social recognition software helps build award-winning cultures where employees feel more appreciated and socially connected at work – driving a sense of belonging and inspiring the entire organization to reach their full potential and achieve business success. Founded in 1999, the company is headquartered in Framingham, Massachusetts and Dublin, Ireland.
The WorkHuman Research Institute at Globoforce is dedicated to the understanding and application of global workplace practices that create more engaged, productive, and ultimately more human work cultures. In collaboration with leaders in the hman resource industry and global research experts, the WorkHuman Research Institute publishes original research on current trends that affect and influence the employee experience, culture management, and leadership
To learn more about Globoforce, visit: http://www.globoforce.com or follow us on Twitter @Globoforce or LinkedIn: http://www.linkedin.com/company/globoforce
13
References 1 Globoforce WorkHuman Research Institute. (2016).
The ROI of recognition in building a more human workplace. Retrieved from http://www.globoforce.com/resources/research-reports/roi-recognition-human-workplace/
2 IBM and Globforce (2017). The Employee Experience Index: A new global measure of a human workplace and its impact. Retrieved from https://www-01.ibm.com/common/ssi/cgi-bin/ssialias?subtype=WH&infotype=SA&htmlfid=LOW14335USEN
3 Johnson, J. W. and LeBreton, J. M. (2004). History and Use of Relative Importance Indices in Organizational Research. Organizational Research Methods, 7, 238-257.
4 Weiner, S., Weldon, R. and Raisbeck, L. (2016). Make more of your survey scores: Best practice advice on using norms. Retrieved from https://www-01.ibm.com/common/ssi/cgi-bin/ssialias?htmlfid=LOW14331USEN
5 Guenole, N. and Brown, A. (2014). The consequences of ignoring measurement invariance for path coefficients in structural equation models. Frontiers in Psychology. Retrieved from https://pdfs.semanticscholar.org/78ca/9aff082ff8d4d13386253c967c999f00423e.pdf
6 Smith, Peter B. (2004). Acquiescent response bias as an aspect of cultural communication style. Journal of Cross-Cultural Psychology, 35, 50-61

The Employee Experience Index around the globe: How countries measure up and create human workplaces
14
Notes

15
Notes
Please Recycle
© IBM Corporation (“IBM”) and Globoforce Limited (“Globoforce”) 2017
IBM Corporation
Software Group Route 100 Somers, NY 10589 U.S.A.
Produced in the United States of America July 2017
© Copyright. The trademarks of both IBM and Globoforce are trademarks of the United States, other countries or both. If these and other trademarked terms are marked on their first occurrence in this information with a trademark symbol (® or TM), these symbols indicate U.S. registered or common law trademarks owned at the time this information was published. Such trademarks may also be registered or common law trademarks in other countries. Other product, company or service names may be trademarks or service marks of others. A current list of IBM trademarks is available at “Copyright and trademark information” at: ibm.com/legal/copytrade.shtm and guidelines of Globoforce logo usage can be found at the following: http://www.globoforce.com/logo-usage-guidelines/.
THE INFORMATION IN THIS DOCUMENT IS PROVIDED “AS IS” WITHOUT ANY WARRANTY, EXPRESS OR IMPLIED, INCLUDING WITHOUT ANY WARRANTIES OF MERCHANTABILITY, FITNESS FOR A PARTICULAR PURPOSE AND ANY WARRANTY OR CONDITION OF NONINFRINGEMENT. IBM products are warranted according to the terms and conditions of the agreements under which they are provided.
LOW14355USEN-00