the employment-population ratio: its value in labor … strongly dominated by the economy's...
TRANSCRIPT

The employment-population ratio : its value in labor force analysis This statistic measures the economy's ability to provide jobs for a growing population; its consistent cyclical properties and the relative accuracy of its seasonal adjustment make the ratio especially useful for evaluating demographic employment trends
CAROL BOYD LEON
Many publicized measures of labor market conditions are available to the analyst. The best known of these is the unemployment rate, probably followed by the level of employment . However, another useful-although less widely used-measure of economic performance is the employment-population ratio. It answers the ques-tion, "What proportion of the working-age population is employed?" A great deal more is written about the unemployment
rate than about the employment-population ratio be-cause of public concern over hardships suffered by many of the unemployed. Moreover, the unemployment rate provides a simple yardstick for measuring the over-all state of the economy-large increases signify bad times, declines indicate recovery and expansion. But the employment-population ratio can be similarly used to show how well the economy is performing. This article describes the differences in the move-
ments over time of this ratio, the employment level, the labor force participation rate, and the unemployment rate, and demonstrates the use of the employment-pop-ulation ratio in secular and cyclical analysis and for in-ter-area comparisons. All data presented are derived from the Current Population Survey (cps).'
Why an employment population ratio? The two numbers needed to compute the employment-population ratio-the total noninstitutional working-age population and ci-vilian employment-have been presented in the Bureau of Labor Statistics' monthly release on the Nation's employment situation for many years, but the actual ra-tio was not published until 1977 . Although some labor market analysts had used the employment-population ratio beginning in the 1960's, BLS became interested in its possibilities under the leadership of Commissioners Geoffrey Moore and Julius Shiskin during the 1970's .2 Over the last decade, it became apparent that the ratio had several advantages relative to other labor market indicators-as well as some disadvantages.
Relationship to employment level. The employment-pop-ulation ratio and the employment level are, of course, closely related. Movements in the employment level re-flect net changes in the number of jobholders, while movements in the ratio are net changes in the number of jobholders relative to changes in the size of the popu-lation . Because the population is continually growing, a rise in employment may or may not appear as an in-crease in the employment-population ratio, while a de-crease in employment will always be reflected as a decline in the ratio. The simple count of employment-while generally
exhibiting at least some decline during recessionary Carol Boyd Leon is an economist in the Office of Current Employ-ment Analysis, Bureau of Labor Statistics.
36
periods-is strongly dominated by the economy's long-term growth trend . But changes in the employment-population ratio tell whether the economy is generating jobs fast enough to provide employment for a constant proportion of the population . In other words, by relat-ing employment to population, we can evaluate the magnitude of job growth .
Finally, use of the ratio facilitates comparisons be-tween changes at different points in time . For example, a 0.3-percentage-point drop in the ratio over a month in 1980 can be compared to a monthly decrease of the same magnitude in 1960, whereas it is more difficult to compare an employment-level decline of 300,000 with one of the same size two decades earlier .
The ratio and the participation rate. We have seen how a rate or ratio can be analytically superior to a level . But why would one want to use the employment-population ratio rather than the labor force participation rate, which is perhaps the most widely publicized rate with the exception of that for unemployment? The civilian labor force participation rate-the pro-
portion of the working-age population that is in the labor force, either working or looking for work-functions well as an indicator of secular trends ; it has risen more or less steadily since the mid-1960's, as growing participation among women has more than off-set declines among men. The overall participation rate, however, is difficult to interpret during recessionary pe-
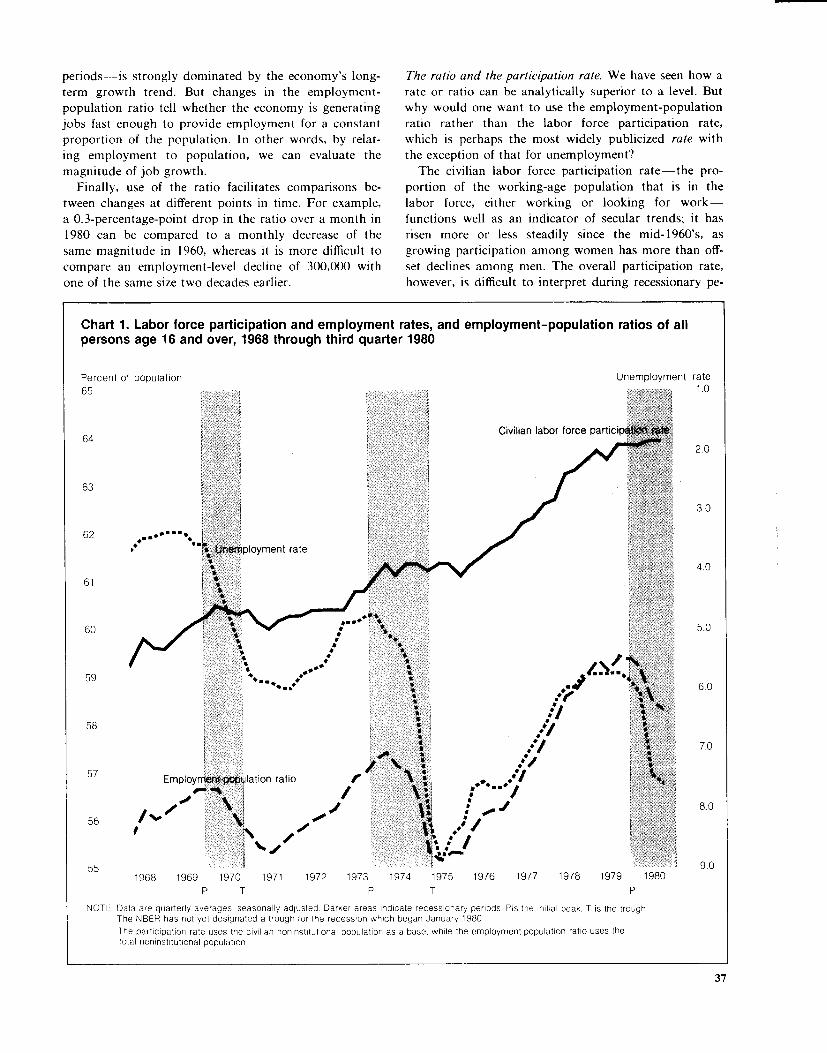
Chart 1 . Labor force participation and employment rates, and employment-population ratios of all persons age 16 and over, 1968 through third quarter 1980
Percent of population 65
64
63
62
61
60
59
58
57
56
55
Unemployment rate 1 .0
. ~ ~ .
w
Employment-population ratio '
1`. 'f t~ : i ~1
1968 1969 1970 1971 1972 1973 1974 1975 1976 1977 1978 1979 1980 P T P T P
NOTE : Data are quarterly averages, seasonally adjusted Darker areas indicate recessionary periods . Pis the initial peak, T is the trough The NBEH has not yet designated a trough for the recession which began January 1980
The participation rate uses the civilian noninstitutional population as a base, while the employment-population ratio uses the total noninstitutional population
2.0
3 .0
4.0
5.0
6 .0
7.0
8.0
9 .0
37
Civilian labor force participation gate

MONTHLY LABOR REVIEW February 1981 . The Employment-Population Ratio
nods, because it demonstrates no established cyclical pattern; the labor force can either expand or contract in response to worsening economic conditions, as the un-employment of one family member may spur another to look for a job or may influence others to refrain from entering an unpromising labor market .
Chart 1 shows, for example, that the labor force par-ticipation rate fluctuated from quarter to quarter during the 1974-75 recession, while remaining around 61 per-cent. Similarly, it exhibited no clear trend during the early stages of the 1980 economic downturn . The em-ployment-population ratio, however, fell substantially in 1974 and again in 1980 . This is because the ratio mea-sures the success of the civilian economy at providing jobs, rather than the proportion of the population who want to work . A technical difference between the bases used in cal-
culating the labor force participation rate and the em-ployment-population ratio may lend more stability to the latter estimate during a period of expanding or con-tracting military forces. Currently, the employment-pop-ulation ratio measures civilian employment as a percent of the total noninstitutional population (including mem-bers of the Armed Forces) age 16 and over, while the most commonly used participation rate measures the ci-vilian labor force as a percent of the civilian non-institutional population 16 and over . Although both the labor force and employment may be affected by growth in the size of the military-many civilian employees be-come members of the Armed Forces, while some per-sons from outside the labor force get civilian jobs-only the civilian population figure used in computing the participation rate experiences much change . As a re-sult, the participation rate may register movements even if the size of the civilian labor force is stable .
Comparisons with the unemployment rate. The unem-ployment rate is often perceived as the most important of the labor force measures . Even movements of a mag-nitude too small to have statistical significance are re-ported by the news media. And, as an excellent measure of economic performance, it deserves to be monitored. Nevertheless, the employment-population ratio provides certain insights into the labor force not afforded by the unemployment rate.3 The concept of unemployment is fuzzier than that of
employment . To be counted as unemployed, a person must be without a job, be available for work, and have actively sought a job sometime during the month, or must be on layoff expecting to be recalled . To be count-ed as employed, a person must have worked at least 1 hour during the week for pay or profit (or at least 15 hours as an unpaid worker in a family business), or have a job but be temporarily absent from it . In other words, being employed is an observable experience,
while being unemployed often lacks that same concrete-ness. According to Geoffrey Moore, "Seeking a job is not as clear-cut a condition as having a job. . . . For a sizable number of the jobless, whether one is unem-ployed or not is to some degree a matter of opinion .114
Hence, the employment-population ratio has the advan-tage of measuring something which is quite observable . The employment-population ratio is calculated using
a much larger numerator and denominator than the job-less rate and is thus subject to less statistical error. And, because it is based on the less volatile employment count, there is greater accuracy in its seasonal adjust-ment . As we shall see, the level of unemployment can change radically due to both seasonal and cyclical phe-nomena, and is thus difficult to seasonally adjust with reliability . But employment changes are relatively small, meaning that the employment level does not change by more than about 2 percent in any given month, making seasonal adjustment distortions less likely . For example, in June of 1976-80, the not-seasonally-
adjusted increase in the number of unemployed aver-aged about 1 million, or nearly 20 percent of the corre-sponding May jobless level . During the same 4-year period, the June level of employment rose an average of 1.5 million, or less than 2 percent over the May number of employed . Another example illustrates how large cyclical swings
in the labor market also make unemployment more vol-atile-and therefore more difficult to seasonally adjust -than employment . Between January and July 1980, when the economy was in a downswing, the number of unemployed shot up by more than 1 .5 million (season-ally adjusted), or 23 percent. Employment faltered dur-ing these months, falling by about 700,000, or less than 1 percent. Again, the swing in unemployment-this time cyclical-was relatively much larger than that in employment .
Trends in the ratio
The employment-population ratio can be used to measure secular changes in employment patterns among working-age Americans. Chart 2, which traces move-ments in the ratio over three decades, shows that the overall ratio fluctuated around the 55-percent mark from the late 1940's until the late 1960's . Since that time, it has generally risen-to nearly 60 percent-al-though declines occurred during recessionary periods. Trends differ for men, women, and teenagers, howev-
er .' The rate for men-close to 85 percent in 1948-decreased fairly steadily to its 1980 level of about 73 percent. The bulk of this drop resulted from declining labor market activity among older men, as early retire-ments became more widespread . In dramatic fashion, the employment-population ratio for men 55 and over fell more than 20 points over the last three decades.
38

Chart 2 . Employment-population ratios by age and sex, 1948 through third quarter 1980
Employment-population ratio 85
V 80 ~ ~
Men 20 years and over
75 ~rr
vV'' f
70
65
60 Both sexes, 16 years and over
i
55
50
Both sexes
j 16-19 years 45
i
40 -~
,.
*men ~N 35 ~ years and over,
30 1948 50 52 54 56 58 60 62 64 66 68 70 72 74 76 78 80
P T P T P T P T P T P T P NOTE Data are quaterly averages, seasonally adjusted . Darker areas indicate recessionary periods . P is the initial peak . T is the trough
The NBER has not yet designated a trough for the recession which began January 1980
In contrast to the downtrend in the employment-pop- about 43 to 60 percent during the 1970's alone! Chang-ulation ratio amo.ig men, the ratio for women advanced es in attitudes towards working mothers, the decline in over the last 30 years . Rising from 30 to about 48 per- fertility, and increases in education are important fac-cent> it has shown almost yearly increases, with barely tors in the especially rapid growth of the ratio for these perceptible recessionary declines . Women in all but the women., oldest age group (65 years and over) played a part in The employment-population ratio of persons age 16 this increase . Interestingly, those between the ages of 45 to 19 has also undergone dramatic changes over time . and 65 experienced the greatest increase in their em- A general downtrend lasted from the late 1940's to the ployment-population ratio during the first two of the mid-1960's, as increasing school enrollment rates were three decades, while women between 25 and 45 posted accompanied by decreasing labor force participation. the largest gains after 1970 . In particular, women 25 to (Analysis of cps data has shown that participation is 34 showed the greatest increase over the entire time lower among teenagers enrolled in school than among span-about 30 points-and their ratio rose from those out of school .) Because participation is closely re-
39

MONTHLY LABOR REVIEW February 1981 * The Employment-Population Ratio
lated to the employment-population ratio, the ratio for mid-1960's and 1970's, creating more competition in the young people had dropped from 46 percent in 1948 to youth job market . And finally, minimum wage restric-36 percent by 1964 . tions often are said to discourage employers from hiring But while school enrollment rates stabilized in the teenagers, who generally lack the working experience of
1970's, the youth ratio grew rapidly. This is partly at- adults . Nonetheless, the proportion of employed teenag-tributable to the greater increase in the participation ers has shown substantial growth over the last decade rate of students compared with that of young people and a half, while the population of 16- to 19-year-olds not enrolled in school . By the end of the decade, the ra- has declined since mid-1977 . do for teenagers was again 46 percent.
This advance is especially noteworthy because it oc- The ratio during business cycles. Because movements in curved during a period when jobless rates for teens were the employment-population ratio generally correspond at historically high levels . Moreover, members of the to changes in aggregate demand,' the ratio is a relatively "baby boom" generation reached their teen years in the good cyclical indicator. Chart 2 shows that the overall
Chart 3 . Unemployment rates and employment-population ratios of men, age 20 and over, 1968 through the third quarter of 1980
Employment-population ratio SO
79
78
77
76
75
74
1 I
Une lovment rate ' I
i
'T . ..
, is r
a+~
'. t irta.~~"
mployrrerr-opulatian ratio
i
2.0
3.0
4.0
5 .0
6.0
73
Unemployment rate 1 .0
72
I s
71 1968 1969 1970 1971 1972 1973 1974 1975 1976 1977 1978 1979 1980
P T P T P NOTE Data are quarterly averages, seasonally adjusted . Darker areas indicate recessionary periods, P is the initial peak T is the trough
The NBER has not yet designated a trough for the recession which began January 1980
7.0
8.0 I
40

ratio has fallen during all seven business downturns since 1948 and has typically risen during periods of re-covery and growth . It has not, however, shown consis-tent timing at business cycle peaks and tends to lag at the troughs. During the most recent complete cycle (November 1973-January 1980), the ratio lagged about 3 to 4 months behind both the initial economic peak and trough . In 1980, the ratio appears to have lagged only slightly ; it began its decline one month after the official business cycle peak (January 1980), and leveled off by mid-year, about the same time that a number of other coincident indicators began to show some im-provement.
Employment-population ratios are also useful in mea-suring the cyclical effects of recession on various demo-graphic groups. According to chart 2, the employment of men is more affected by business declines than that of women. And, secular movements for all three major demographic groups-men, women, and teenagers-overshadow cyclical movements over the long run, al-though cyclical movements may dominate during a sin-gle business cycle. To demonstrate the way in which the ratios for demographic groups react differently to changes in the economic climate, charts 3, 4, and 5 plot the inverse of the jobless rate against the ratio for men, women, and teenagers, respectively .
Despite a long-term secular downtrend in the em-ployment-population ratio for men, the decline through-out the 1970's appears to be largely a function of cyclical developments . As chart 3 indicates, movements in the ratio for men have closely paralleled changes in the (in-verted) jobless rate . Both series substantially declined before or at each business cycle peak ; in fact, neither se-ries fully rebounded after either the 1970 or 1974-75 recession periods. According to chart 2, which also shows the behavior of the employment-population ratio in four earlier recessions, this series consistently dropped sharply-by about 3 to 4 points-during eco-nomic downturns, and generally started to stabilize at the troughs. By mid-1980, for example, the ratio for men had fallen about 21/z points from its highest 1979 value.
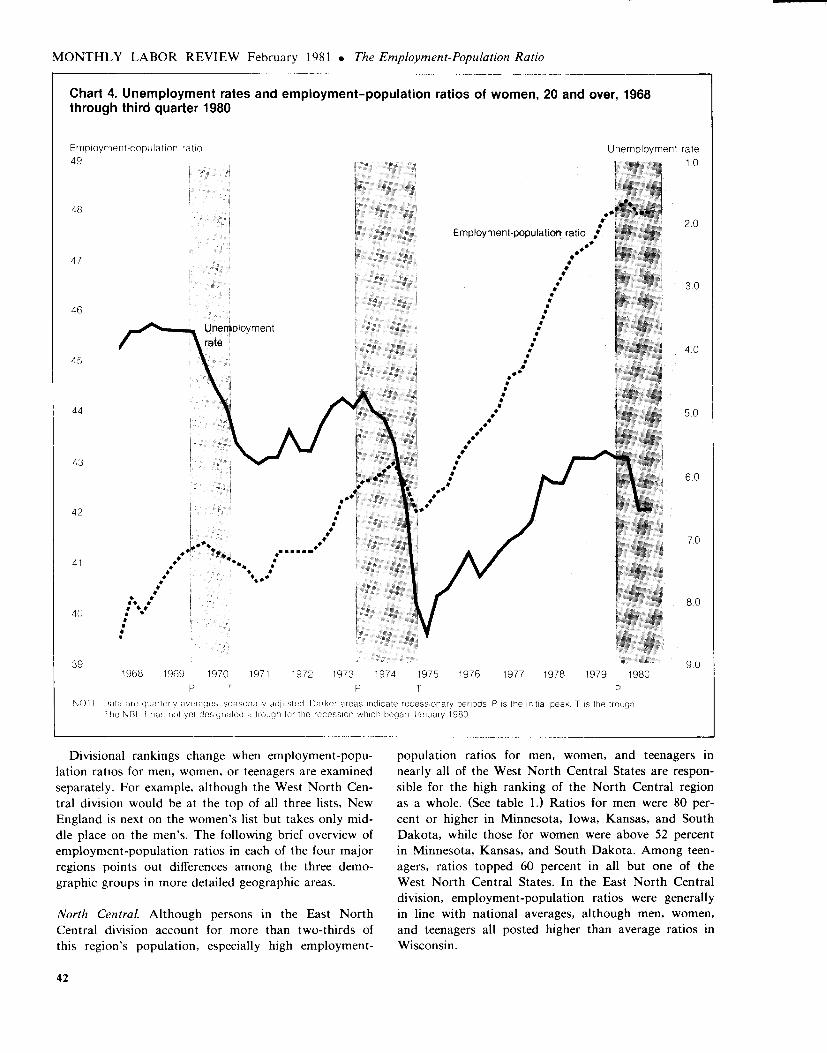
Although movements in the ratio for women bear some relationship to changes in their rate of joblessness, that relationship is camouflaged somewhat by the previously cited strong secular uptrend in their employ-ment . For example, chart 4 indicates that the magni-tude of the drop in their ratio is typically much less than the increase in their jobless rate.
Another major reason for the relative mildness of de-clines in the employment-population ratio for women has been their concentration in industries and occupa-tions least likely to be affected by an economic down-turn . In 1979, for example, 65 percent of all employed women were white-collar workers, compared with just
over 40 percent of men, and only about 20 percent were in the cyclically-sensitive construction, manufacturing,
and transportation and public utilities industries, com-pared with more than 45 percent of men . The timing of employment-population ratio declines
for women has varied with different recessions, although most recently they have lagged behind both the starts of the recessions and the upturns in the unemployment rate . Among teenagers, dramatic changes in the employ-
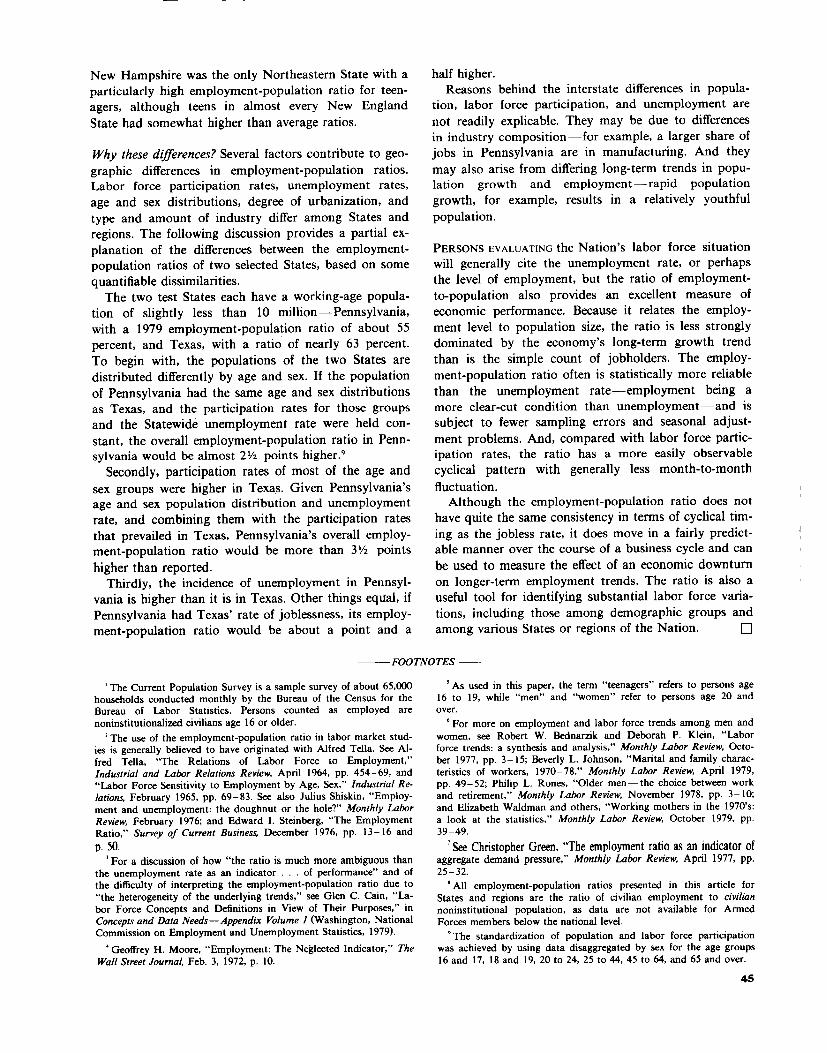
ment-population ratio have taken place during-and before-each recession. As chart 5 indicates, youth un-employment rates also swing widely . Nevertheless, the secular uptrend in the teen employment-population ra-tio since the mid-1960's has tended to moderate reces-sionary declines even though the series shows strong cyclical movements.
Although the ratio for teenagers peaked after the start of the 1974-75 recession, it had wavered or actu-ally declined before the start of some other downturns.
Differences by geographic area Just as employment-population ratios vary by sex
and age, and between points in time, they also reflect differences in the employment situation among geo-graphic areas. The following discussion focuses on these geographic differences, with special attention to inter-area variations among men, women, and teenagers, in 1979.8 Of the four major regions of the Nation-Northeast,
South, North Central, and West-the latter two have the highest overall employment-population ratios, as well as the highest ratios for each of the three demo-graphic groups in 1979 :
Overall Men Women Teenagers
North Central . . . 61 .7 78 .1 48 .1 54.6 West . . . . . . . . . 61 .5 77 .2 49 .4 51 .4 South . . . . . . . . . 59.1 75.9 47.3 44.0 Northeast . . . . . . 58 .0 74.9 46.3 44.0
However, a somewhat different picture is presented when these regions are subdivided into nine smaller di-visions. Below are these divisions, ranked from highest to lowest overall employment-population ratio:
Employment-Division and region population ratio
West North Central (North Central) 63 .8 New England (Northeast) . . . . . . . . . 62 .3 Mountain (West) . . . . . . . . . . . . . . . 62 .1 Pacific (West) . . . . . . . . . . . . . . . . . 61 .3 East North Central (North Central) . . 60 .9 West South Central (South) . . . . . . . 60 .4 South Atlantic (South) . . . . . . . . . . . 59 .4 East South Central (South) . . . . . . . . 56 .7 Middle Atlantic (Northeast) . . . . . . . 56 .6
41
MONTHLY LABOR REVIEW February 1981 . The Employment-Population Ratio
Chart 4 . Unemployment rates and employment-population ratios of women, 20 and over, 1968 through third quarter 1980
Employment-population ratio Unemployment rate 49 ~ 1 .0
a
48
Employment-PoPulaton ratio ~ ` 2.0
i
47
3.0
46
Unemployment rate
: 4.0 45 i
I0 "
44 5 .0 i i
43 ~ +
6.0 .: ; .
42 i i
i 7 .0 ~ ..u
41
8.0 40
v
39 9 .0 1968 1969 1970 1971 1972 1973 1974 1975 1976 1977 1978 1979 1980
P T P T P
NOTE Data are quarterly averages . seasonally adjusted Darker areas indicate recessionary periods . P is the initial peak, T Is the trough 1 he NE3ER has not yet designated a trough for the recession which began January 1980
Divisional rankings change when employment-popu-lation ratios for men, women, or teenagers are examined separately . For example, although the West North Cen-tral division would be at the top of all three lists, New England is next on the women's list but takes only mid-dle place on the men's. The following brief overview of employment-population ratios in each of the four major regions points out differences among the three demo-graphic groups in more detailed geographic areas.
North Central. Although persons in the East North Central division account for more than two-thirds of this region's population, especially high employment-
population ratios for men, women, and teenagers in nearly all of the West North Central States are respon-sible for the high ranking of the North Central region as a whole. (See table 1 .) Ratios for men were 80 per-cent or higher in Minnesota, Iowa, Kansas, and South Dakota, while those for women were above 52 percent in Minnesota, Kansas, and South Dakota . Among teen-agers, ratios topped 60 percent in all but one of the West North Central States . In the East North Central division, employment-population ratios were generally in line with national averages, although men, women, and teenagers all posted higher than average ratios in Wisconsin.
42
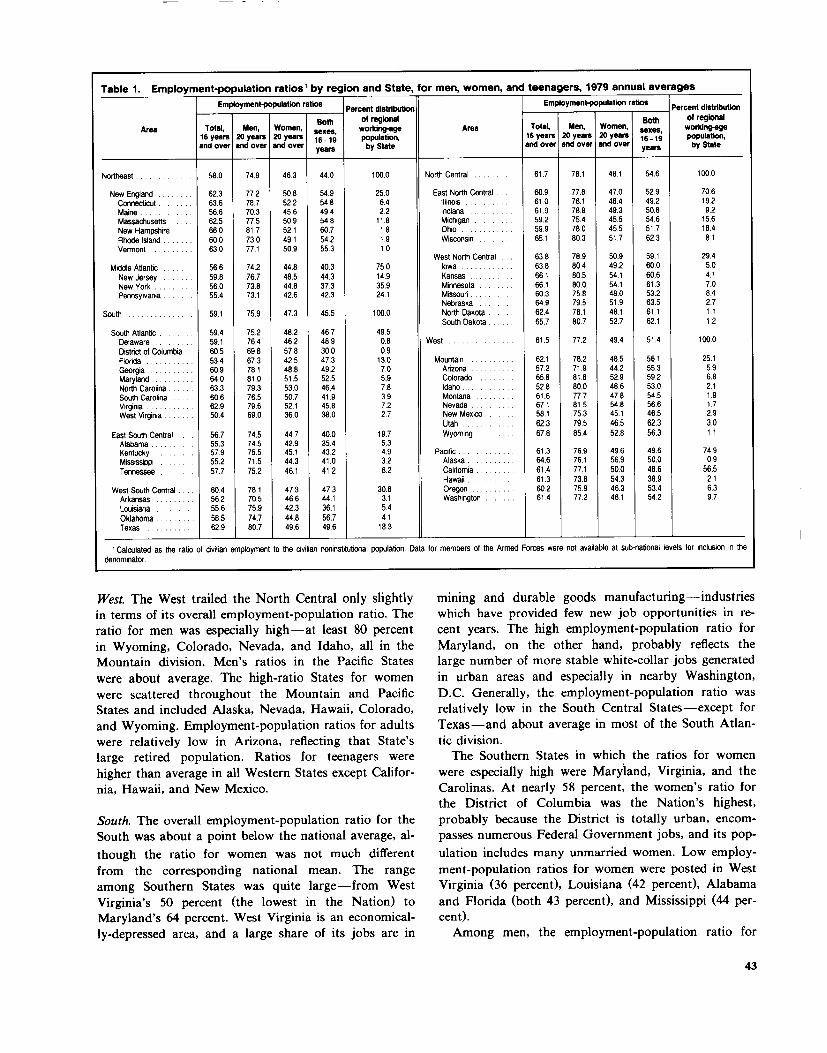
Table 1 . Employment-population ratios' by region and State, for men, women, and teenagers, 1979 annual averages Employment-population ratios
Percent distribution Employment-population ratios
Percent distribution gosh of regional Both of regional
Area Total, Men, Women, sexes working-age Area Total, Men, Women, sexes,
16 years 20 yeah 20 years ,
16-79 population, 16 yeah 20 years ZO years 16-19 population, and over and over and over years by State end over and over and over years by State
Northeast . . . . . . . . . . . . . 58 .0 74 .9 46 .3 44.0 100.0 North Central . . . . . . . . . 61 .7 78 .1 48.1 54 .6 100.0
New England . . . . . . . . 62 .3 77 .2 50 .8 54.9 25.0 East North Central . . . . 60 .9 77 .8 47 .0 52 .9 70.6 Connecticut . . . . . . . . 63 .6 78 .7 52 .2 54 .8 6.4 Illinois . . . . . . . . . . . 61 .0 76 .1 48 .4 492 19.2 Maine . . . . . . . . . . . . 56 .6 70 .3 45 .6 49 .4 22 Indiana . . . . . . . . . . 61 .9 78 .8 49 .3 50 .8 92 Massachusetts . . . . . 62 .5 77 .5 50 .9 54 .8 71 .8 Michigan . . . . . . . . . 592 75 .4 45 .5 54 .6 15 .6 New Hampshire . . . . 66 .0 81 .7 52 .1 60 .7 1 .8 Ohio . . . . . . . . . . . . 59 .9 78 .0 45 .5 51 .7 18 .4
Rhode Island . . . . . . . 60.0 73 .0 49 .1 54 .2 1 .9 Wisconsin . . . . . . . . 65.1 80.3 51 .7 62 .3 8 .1 Vermont . . . . . . . . . . 63 .0 77 .1 50 .9 55 .3 1 .0
West North Central . . . 63.8 78 .9 50 .9 59 .1 29 .4 Middle Atlantic . . . . . . . 56.6 74.2 44 .8 40 .3 75 .0 Iowa . . . . . . . . . . . . 63.8 80.4 49 .2 60 .0 5 .0 New Jersey . . . . . . . 59.8 76.7 48 .5 44 .3 14 .9 Kansas . . . . . . . . . . 66.1 80.5 54 .1 60 .6 4 .1 New York . . . . . . . . . 56.0 73.8 44 .8 37 .3 35 .9 Minnesota . . . . . . . . 66.1 80.0 54 .1 61 .3 7 .0 Pennsylvania . . . . . . . 55.4 73.1 42.6 42 .3 24 .1 Missouri . . . . . . . . . . 60.3 75.8 48 .0 532 8 .4
Nebraska . . . . . . . . 64.9 79.5 51 .9 63.5 2 .7 South . . . . . . . . . . . . . . . 59 .1 75.9 47.3 45 .5 100 .0 North Dakota . . . . . . 62.4 78.1 48.1 61 .1 1 .1
South Dakota . . . . . . 65 .7 80 .7 52.7 62.1 12 South Atlantic . . . . . . . . 59 .4 752 482 46.7 49 .5
Delaware . . . . . . . . . 59 .1 76 .4 46.2 48.9 0.8 West . . . . . . . . . . . . . . . 61 .5 772 49.4 51 .4 100.0 District of Columbia . . 60 .5 69 .8 57 .8 30.0 0.9 Florida . . . . . . . . . . . 53 .4 67 .3 42 .5 47.3 13.0 Mountain . . . . . . . . . . . 62 .1 78 .2 48.5 56.1 25.1 Georgia . . . . . . . . . . 60 .9 78 .1 48 .8 492 7.0 Arizona . . . . . . . . . . 57 .2 71 .9 44 .2 55.3 5.9 Maryland . . . . . . . . . 64 .0 81 .0 51 .5 52.5 5.9 Colorado . . . . . . . . . 65 .8 87 .8 52 .9 59.2 6.8 North Carolina . . . . . . 63 .3 79 .3 53 .0 46 .4 7.8 Idaho . . . . . . . . . . . . 52 .8 80 .0 48 .6 53.0 2.1 South Carolina . . . . . 60 .6 76 .5 50 .7 41 .9 3 .9 Montana . . . . . . . . . 61 .6 77 .7 47 .8 54.5 1 .9 Virginia . . . . . . . . . . . 62 .9 79 .6 52 .1 45 .8 72 Nevada . . . . . . . . . . 67 .7 81 .5 54 .8 56 .6 1 .7 West Virginia . . . . . . . 50.4 69 .0 36 .0 38 .0 2 .7 New Mexico . . . . . . . 58 .1 75 .3 45 .1 46 .5 2.9
Utah . . . . . . . . . . . . 62 .3 79 .5 46 .5 62 .3 3.0 East South Central . . . . 56.7 74.5 44 .7 40 .0 19 .7 Wyoming . . . . . . . . . 67 .8 85 .4 52 .8 56 .3 1 .1 Alabama . . . . . . . . . . 55.3 74.5 42 .9 35 .4 5 .3 Kentucky . . . . . . . . . 57.9 75.5 45 .1 432 4 .9 Pacific . . . . . . . . . . . . . 61 .3 76.9 49 .6 49 .6 74 .9 Mississippi . . . . . . . . 552 71 .5 44 .3 41 .0 32 Alaska . . . . . . . . . . . 64.6 76.1 56.9 50 .0 0 .9
Tennessee . . . . . . . . 57.7 752 46.1 41 .2 62 California . . . . . . . . . 61 .4 77.1 50.0 48 .6 56 .5 Hawaii . . . . . . . . . . . 61 .3 73.8 54 .3 38 .9 2 .1
West South Central . . . . 60.4 78.1 47.3 47 .3 30 .8 Oregon . . . . . . . . . . 602 75.9 46.3 53 .4 6 .3 Arkansas . . . . . . . . . 56 .2 70.5 46.6 44 .1 3 .1 Washington . . . . . . . 61 .4 77.2 48.1 54 .2 9 .7 Louisiana . . . . . . . . . 55 .6 75.9 42.3 36.1 5 .4 Oklahoma . . . . . . . . . 58 .5 74.7 44.8 56.7 4 .1 Texas . . . . . . . . . . . . 62 .9 80.7 49 .6 49.6 18 .3
' Calculated as the ratio of civilian employment to the civilian naninstitutional population . Data for members of the Armed Forces were not available at sub-national levels for inclusion in the denominator.
West. The West trailed the North Central only slightly in terms of its overall employment-population ratio. The ratio for men was especially high-at least 80 percent in Wyoming, Colorado, Nevada, and Idaho, all in the Mountain division . Men's ratios in the Pacific States were about average. The high-ratio States for women were scattered throughout the Mountain and Pacific States and included Alaska, Nevada, Hawaii, Colorado, and Wyoming. Employment-population ratios for adults were relatively low in Arizona, reflecting that State's large retired population . Ratios for teenagers were higher than average in all Western States except Califor-nia, Hawaii, and New Mexico .
South. The overall employment-population ratio for the South was about a point below the national average, al-
though the ratio for women was not much different from the corresponding national mean . The range among Southern States was quite large-from West Virginia's 50 percent (the lowest in the Nation) to Maryland's 64 percent. West Virginia is an economical-ly-depressed area, and a large share of its jobs are in
mining and durable goods manufacturing-industries which have provided few new job opportunities in re-cent years. The high employment-population ratio for Maryland, on the other hand, probably reflects the large number of more stable white-collar jobs generated in urban areas and especially in nearby Washington, D.C . Generally, the employment-population ratio was relatively low in the South Central States-except for Texas-and about average in most of the South Atlan-tic division . The Southern States in which the ratios for women
were especially high were Maryland, Virginia, and the Carolinas. At nearly 58 percent, the women's ratio for the District of Columbia was the Nation's highest, probably because the District is totally urban, encom-passes numerous Federal Government jobs, and its pop-ulation includes many unmarried women . Low employ-ment-population ratios for women were posted in West Virginia (36 percent), Louisiana (42 percent), Alabama and Florida (both 43 percent), and Mississippi (44 per-cent). Among men, the employment-population ratio for
43

MONTHLY LABOR REVIEW February 1981 . The Employment-Population Ratio
Chart 5 . Unemployment rates and employment-population ratios of persons of both sexes, age 16-19, 1968 to third quarter 1980
Employment-population ratio 49
48
47
46
13
14
15
45
16
44
17
43
42
41
40
Cunpivyrnenrpupuiauvn iduu
Unemployment rate
12
39 1968 1969 1970 1971 1972 1973 1974 1975 1976 1977 1978 1979 1980
P T P T p NOTE Data are quarterly averages . seasonally adjusted- Darker areas indicate recessionary periods P is the initial peak T is the trough
The NBER has not yet designated a trough for the recession which began January 1980
18
19
20
21
those who live in the District of Columbia was one of the lowest in the Nation . The ratio was even lower, however, in West Virginia and lowest of all in Florida, where a relatively large segment of the population is re-tired. Other Southern States with low employment-pop-ulation ratios for men were Arkansas and Mississippi . On the other hand, the ratio was especially high in Maryland, Virginia, and Texas. The average employment-population ratio for teenag-
ers in the South was about 3 points below the national mean . Three of the four States with low employment-population ratios for women-Alabama, Louisiana, and West Virginia-also had low ratios for teenagers . The lowest ratio, however, was registered in the District of Columbia (30 percent), which, as we have seen, is an 44
area with unusual ratios for adults as well .
Northeast. Although most States in the Northeast had employment-population ratios which were at least as high as the national average, relatively low ratios for the two most populous-New York and Pennsylvania -placed the Northeast, and in particular the Middle Atlantic division, at the bottom of the rankings . Ratios were low for all three major demographic groups in these two States, and particularly so for teenagers.
Other Northeast States with low employment-popula-tion ratios for men were Maine and Rhode Island ; only New Hampshire had high employment among men. Women's ratios were high in Connecticut, Massachu-setts, and Vermont, as well as in New Hampshire. And,
New Hampshire was the only Northeastern State with a particularly high employment-population ratio for teen-agers, although teens in almost every New England State had somewhat higher than average ratios .
Why these differences? Several factors contribute to geo-graphic differences in employment-population ratios . Labor force participation rates, unemployment rates, age and sex distributions, degree of urbanization, and type and amount of industry differ among States and regions. The following discussion provides a partial ex-planation of the differences between the employment-population ratios of two selected States, based on some quantifiable dissimilarities . The two test States each have a working-age popula-
tion of slightly less than 10 million-Pennsylvania, with a 1979 employment-population ratio of about 55 percent, and Texas, with a ratio of nearly 63 percent. To begin with, the populations of the two States are distributed differently by age and sex. If the population of Pennsylvania had the same age and sex distributions as Texas, and the participation rates for those groups and the Statewide unemployment rate were held con-stant, the overall employment-population ratio in Penn-sylvania would be almost 2Yz points higher .9
Secondly, participation rates of most of the age and
sex groups were higher in Texas. Given Pennsylvania's age and sex population distribution and unemployment rate, and combining them with the participation rates that prevailed in Texas, Pennsylvania's overall employ-ment-population ratio would be more than 3'/z points higher than reported .
Thirdly, the incidence of unemployment in Pennsyl-vania is higher than it is in Texas. Other things equal, if Pennsylvania had Texas' rate of joblessness, its employ-ment-population ratio would be about a point and a
half higher. Reasons behind the interstate differences in popula-
tion, labor force participation, and unemployment are
not readily explicable . They may be due to differences in industry composition-for example, a larger share of jobs in Pennsylvania are in manufacturing . And they
may also arise from differing long-term trends in popu-lation growth and employment-rapid population growth, for example, results in a relatively youthful
population .
PERSONS EVALUATING the Nation's labor force situation will generally cite the unemployment rate, or perhaps the level of employment, but the ratio of employment-to-population also provides an excellent measure of economic performance . Because it relates the employ-ment level to population size, the ratio is less strongly dominated by the economy's long-term growth trend
than is the simple count of jobholders . The employ-ment-population ratio often is statistically more reliable than the unemployment rate-employment being a more clear-cut condition than unemployment-and is subject to fewer sampling errors and seasonal adjust-
ment problems . And, compared with labor force partic-ipation rates, the ratio has a more easily observable cyclical pattern with generally less month-to-month
fluctuation . Although the employment-population ratio does not
have quite the same consistency in terms of cyclical tim-ing as the jobless rate, it does move in a fairly predict-able manner over the course of a business cycle and can be used to measure the effect of an economic downturn on longer-term employment trends . The ratio is also a useful tool for identifying substantial labor force varia-tions, including those among demographic groups and among various States or regions of the Nation . 0
FOOTNOTES
The Current Population Survey is a sample survey of about 65,000 households conducted monthly by the Bureau of the Census for the Bureau of Labor Statistics. Persons counted as employed are noninstitutionalized civilians age 16 or older.
The use of the employment-population ratio in labor market stud-ies is generally believed to have originated with Alfred Tella. See Al-fred Tella, "The Relations of Labor Force to Employment," Industrial and Labor Relations Review, April 1964, pp. 454-69> and "Labor Force Sensitivity to Employment by Age, Sex," Industrial Re-lations, February 1965, pp . 69-83. See also Julius Shiskin, "Employ-ment and unemployment : the doughnut or the hole?" Monthly Labor Review, February 1976 ; and Edward I. Steinberg, "The Employment Ratio," Survey of Current Business, December 1976, pp. 13-16 and p. 50 .
'For a discussion of how "the ratio is much more ambiguous than the unemployment rate as an indicator . . . of performance" and of the difficulty of interpreting the employment-population ratio due to "the heterogeneity of the underlying trends," see Glen C. Cain, "La-bor Force Concepts and Definitions in View of Their Purposes," in Concepts and Data Needs-Appendix Volume I (Washington, National Commission on Employment and Unemployment Statistics, 1979).
Geoffrey H. Moore, "Employment: The Neglected Indicator," The Wall Street Journal, Feb. 3, 1972, p. 10 .
As used in this paper, the term "teenagers" refers to persons age 16 to 19, while "men" and "women" refer to persons age 20 and over.
For more on employment and labor force trends among men and women, see Robert W. Bednarzik and Deborah P. Klein, "Labor force trends : a synthesis and analysis," Monthly Labor Review, Octo-ber 1977, pp . 3-I5 ; Beverly L. Johnson, "Marital and family charac-teristics of workers, 1970-78," Monthly Labor Review, April 1979, pp . 49-52; Philip L. Rones, "Older men-the choice between work and retirement," Monthly Labor Review, November 1978, pp. 3-10; and Elizabeth Waldman and others, "Working mothers in the 1970's : a look at the statistics," Monthly Labor Review. October 1979, pp. 39-49.
'See Christopher Green, "The employment ratio as an indicator of aggregate demand pressure," Monthly Labor Review, April 1977, pp. 25-32.
All employment-population ratios presented in this article for States and regions are the ratio of civilian employment to civilian noninstitutional population, as data are not available for Armed Forces members below the national level. 'The standardization of population and labor force participation
was achieved by using data disaggregated by sex for the age groups 16 and 17, 18 and 19, 20 to 24, 25 to 44, 45 to 64, and 65 and over.
45