the enabling environment and finance of resource …
TRANSCRIPT
CHAPTER 19. THE ENABLING ENVIRONMENT AND FINANCE
SE
CT
ION
V:
EN
AB
LIN
G E
NV
IRO
NM
EN
T A
ND
FIN
AN
CIN
G778
THE ENABLING ENVIRONMENT AND FINANCE OF RESOURCE RECOVERY AND REUSEBusinesses are influenced by policies, plans and regulations, trade agreements, institutional setups and strength, access to finance and subsidies, technology, matching partners and availability of land, and local infrastructure, which all may facilitate or hinder business sustainability and scalability, also in view of resource recovery and reuse (RRR) (IFC, 2013; Otoo et al., 2016). In addition to these more formal factors, social norms, business culture, as well as local preferences, expectations, environmental awareness, knowledge and perceptions can be powerful aspects of the business enabling environment. The creation of an enabling environment by central, provincial, state and local governments, the private sector, and civil society organizations thus provides the necessary basis for a business to grow. As this goes beyond what the business model canvas does address, it deserves its own chapter.
Common drivers of success for investments in RRR are (i) market demand, driven by resource scarcity, like declining water reserves or soil fertility, and (ii) environmental legislations demanding safer and more environmentally sound waste management. Examples are waste disposal limitations, recycling obligations, and carbon emission reduction targets. Both drivers are important but seldom sufficient conditions for RRR success. The first usually creates a market space for the sale of RRR products, while the second pushes for waste prevention, less dumping on landfills, and investments in alternative practices to safeguard environmental and human health. These elements can be seen as ‘push-and-pull’ forces for RRR and their relative importance may vary according to the context or the business model. However, compared to resources like glass, metal or plastic, the organic waste recycling sector is less driven by (in/formal) market mechanisms. Competition from (subsidized) chemical fertilizers and fossil fuels is fierce and hinders the development of market opportunities for compost and renewable energy (Matter et al., 2015). In the case of water reuse, the commonly subsidized freshwater tariffs strongly limit revenue expectations from wastewater sales. All this puts additional weight on the role of policy incentives to support the valorization of nutrients, water and biomass for a circular economy.
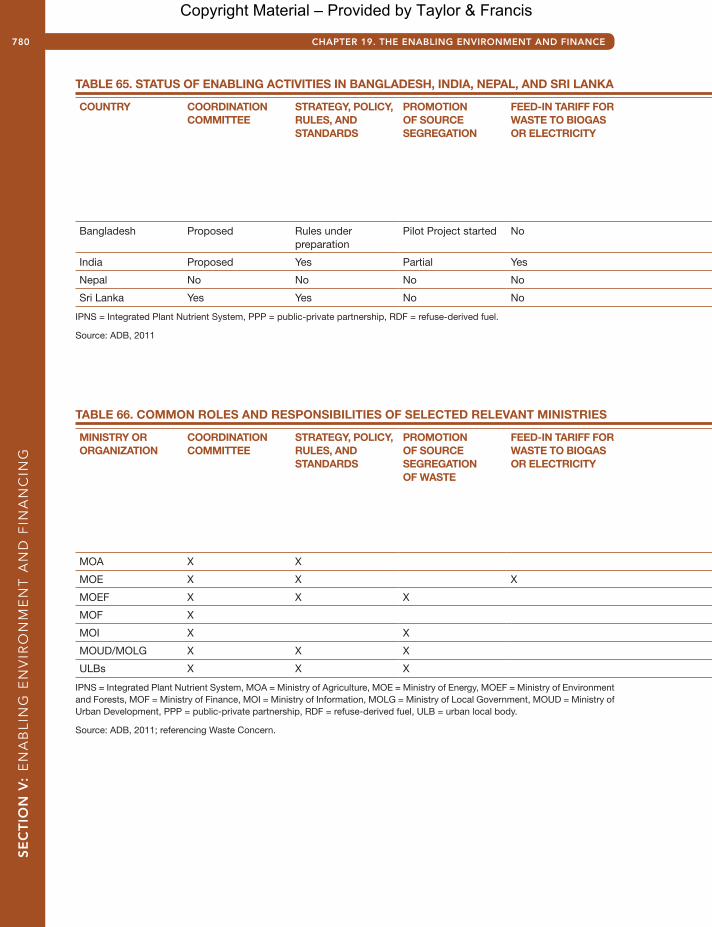
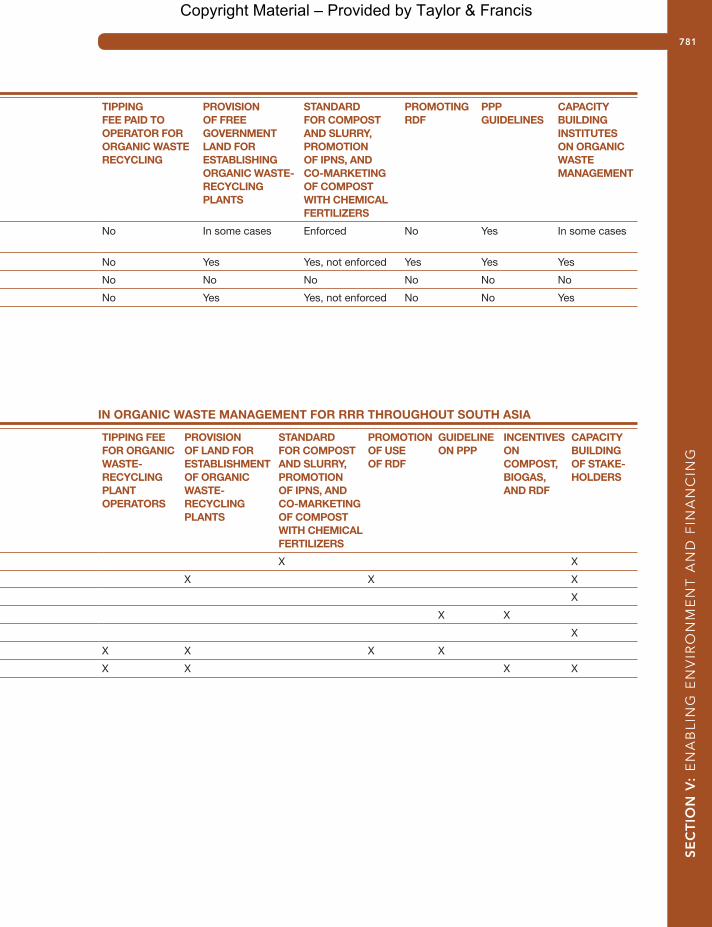
Table 65 shows how selected enabling conditions for municipal solid waste (MSW) composting can differ among countries in South Asia. While data will have changed, the comparison shows the importance of country specific information.
Another important factor is that the RRR value chain cuts across various sectors, which include sanitation/solid waste management, environmental protection, health, renewable energy, food security, and private sector development involving different ministries and levels of governance. Table 66 shows examples of governmental responsibilities in the domain of organic waste management, which however, are seldom organized under a dedicated framework.
In the following sections, four groups of key factors of the enabling environment for RRR will be addressed in more detail:
Policies, regulations, and guidelines.Finance and financial incentives.Technologies matching resource constraints.Local capacities and stakeholder acceptance.
19.1 Policies, regulations and guidelinesOver the last few years, Europe is spearheading policies and regulations in direct support for the circular economy (Box 17). Although in most low- and middle-income countries the value of water reuse is equally recognized in national water policies, for example, they often fail to define related standards, guidelines, or national targets. Also, international support is limited, with the exception of the World Health Organization’s guidelines (WHO, 2006a, b) and the related Sanitation Safety Planning
Copyright Material – Provided by Taylor & Francis
SE
CT
ION
V:
EN
AB
LIN
G E
NV
IRO
NM
EN
T A
ND
FIN
AN
CIN
G
779
Manual (WHO, 2015) for the safe reuse of wastewater, greywater and excreta in agriculture and aquaculture. This situation is likely to change under the peer pressure of the Sustainable Development Goals; in particular targets 6.3 and 12.5 demand more attention to waste reduction, recycling and reuse, in support of a circular economy.
As the WHO example shows, policies and regulations are not only important to support the business side of RRR but also to maintain operational safety for workers, customers and the environment wherever resources are extracted from potentially harmful waste. As many waste-related policies were originally designed to protect the public and the environment, they can be very cumbersome in their support of RRR. A 2016 report for the European Commission3, identified such regulatory barriers within EU directives, legislations, and regulations, such as the lack of (clear) definitions and an overemphasis on safety than resource recovery.
When biosolids are, for example, defined as solid waste rather than as a renewable fuel, it will be difficult for biosolids-to-energy projects to benefit from renewable energy incentives. In a similar way, the European Waste Framework Directive does not recognize the potential fertilizer value of the digestate of anaerobic biogas production, while the EU Fertilizer Regulations are so far missing to recognize organic fertilizers (a gap which is under revision).
Another example is the encouragement of phosphorus (P) recovery but the slow pace of acceptance of recovered P (in the form of struvite) as fertilizer. In fact, what is needed in all RRR cases are clear criteria to determine the “End of Waste status” of the recovered resource (see Chapter 13 and Model 16) that for example, struvite can also be traded across borders as a (new) raw material without the need to comply every time again with sanitary regulations.
The International Solid Waste Association (ISWA, 2015) call in this context for a new ‘regulatory construct,’ moving from waste as a harmful substance for disposal to the management of ‘materials
Box 17. Netherlands approves Circular Economy 2050 strategy
On 5th October 2016, the Netherlands national Circular Economy program till 2050 was presented to Parliament. The program fixes an interim objective of 50% reduction in raw materials use (minerals, metals, fossil fuels) by 2030, and an objective of 100% sustainable, non-polluting use of raw materials by 2050. ‘Biomass and food’ is one of the five priority areas identified in the program. Actions specified to address this priority area include reducing food waste, sustainable agri-food- and biomass value chains, development of alternative protein sources, recycling of food industry residues, soil quality and increasing soil carbon, precision farming, and closing the loop for nutrients.
But also, other European countries are getting active: Switzerland was in 2016 the first European country to make phosphorus recovery and recycling from sewage sludge and slaughterhouse waste obligatory. Germany is expected from 2018 on to make phosphorus recovery obligatory for larger sewage works, and Austria drafted in 2017 a new legislation on P recovery from municipal wastewater (see Chapter 13).
Source: https://www.government.nl/documents/policy-notes/2016/09/14/a-circular-economy-in-the-netherlands-by-2050 (accessed 4 Nov. 2017)
Copyright Material – Provided by Taylor & Francis
CHAPTER 19. THE ENABLING ENVIRONMENT AND FINANCE
SE
CT
ION
V:
EN
AB
LIN
G E
NV
IRO
NM
EN
T A
ND
FIN
AN
CIN
G780
TABLE 66. COMMON ROLES AND RESPONSIBILITIES OF SELECTED RELEVANT MINISTRIES
MINISTRY OR ORGANIZATION
COORDINATION COMMITTEE
STRATEGY, POLICY, RULES, AND STANDARDS
PROMOTION OF SOURCE SEGREGATION OF WASTE
FEED-IN TARIFF FOR WASTE TO BIOGAS OR ELECTRICITY
MOA X X
MOE X X X
MOEF X X X
MOF X
MOI X X
MOUD/MOLG X X X
ULBs X X X
IPNS = Integrated Plant Nutrient System, MOA = Ministry of Agriculture, MOE = Ministry of Energy, MOEF = Ministry of Environment and Forests, MOF = Ministry of Finance, MOI = Ministry of Information, MOLG = Ministry of Local Government, MOUD = Ministry of Urban Development, PPP = public-private partnership, RDF = refuse-derived fuel, ULB = urban local body.
Source: ADB, 2011; referencing Waste Concern.
TABLE 65. STATUS OF ENABLING ACTIVITIES IN BANGLADESH, INDIA, NEPAL, AND SRI LANKA
COUNTRY COORDINATION COMMITTEE
STRATEGY, POLICY, RULES, AND STANDARDS
PROMOTION OF SOURCE SEGREGATION
FEED-IN TARIFF FOR WASTE TO BIOGAS OR ELECTRICITY
Bangladesh Proposed Rules under preparation
Pilot Project started No
India Proposed Yes Partial Yes
Nepal No No No No
Sri Lanka Yes Yes No No
IPNS = Integrated Plant Nutrient System, PPP = public-private partnership, RDF = refuse-derived fuel.
Source: ADB, 2011
Copyright Material – Provided by Taylor & Francis
SE
CT
ION
V:
EN
AB
LIN
G E
NV
IRO
NM
EN
T A
ND
FIN
AN
CIN
G
781
IN ORGANIC WASTE MANAGEMENT FOR RRR THROUGHOUT SOUTH ASIA
TIPPING FEE FOR ORGANIC WASTE-RECYCLING PLANT OPERATORS
PROVISION OF LAND FOR ESTABLISHMENT OF ORGANIC WASTE-RECYCLING PLANTS
STANDARD FOR COMPOST AND SLURRY, PROMOTION OF IPNS, AND CO-MARKETING OF COMPOST WITH CHEMICAL FERTILIZERS
PROMOTION OF USE OF RDF
GUIDELINE ON PPP
INCENTIVES ON COMPOST, BIOGAS, AND RDF
CAPACITY BUILDING OF STAKE-HOLDERS
X X
X X X
X
X X
X
X X X X
X X X X
TIPPING FEE PAID TO OPERATOR FOR ORGANIC WASTE RECYCLING
PROVISION OF FREE GOVERNMENT LAND FOR ESTABLISHING ORGANIC WASTE-RECYCLING PLANTS
STANDARD FOR COMPOST AND SLURRY, PROMOTION OF IPNS, AND CO-MARKETING OF COMPOST WITH CHEMICAL FERTILIZERS
PROMOTING RDF
PPP GUIDELINES
CAPACITY BUILDING INSTITUTES ON ORGANIC WASTE MANAGEMENT
No In some cases Enforced No Yes In some cases
No Yes Yes, not enforced Yes Yes Yes
No No No No No No
No Yes Yes, not enforced No No Yes
Copyright Material – Provided by Taylor & Francis

CHAPTER 19. THE ENABLING ENVIRONMENT AND FINANCE
SE
CT
ION
V:
EN
AB
LIN
G E
NV
IRO
NM
EN
T A
ND
FIN
AN
CIN
G782
in transition,’ including ‘End-of-Waste’ criteria for recovered raw materials. For these secondary products, quality standards and specifications are needed to ensure market confidence, and not only standards assessing their potential harm.
While there are also an increasing number of examples of supporting regulations and mechanisms, experiences from the RRR private sector on their actual accessibility and performance in low- and middle-income countries are largely missing. One of the indicator in the 2017 report of the World Bank on ‘Enabling the Business of Agriculture’ is the time, cost, and regulation for fertilizer registration. This concerns the import of new fertilizers but is also a key indicator for any enterprise engaged in the creation of new fertilizers or composts from resources embedded in waste. As stated by Muspratt (2016b) there is a significant gap between the speed successful startups bring to markets and which can give them a competitive edge, and the way administrations in many low- and middle-income countries work. While, for example, according to the World Bank (2017), the global average to register a new fertilizer is below one year, significant variation was found across countries with respect to the efficiency and complexity in registering fertilizer products. The time and cost to register a new fertilizer product are lowest on average in OECD high-income and upper-middle-income countries, and highest in low-income countries (Figure 2774). This harsh difference in time is driven principally by lengthy field testing.
Many countries in particular in Sub-Saharan Africa, only have rudimentary regulatory frameworks for registering fertilizer. And even where legal frameworks are strong and elaborate, the registration process can be very time-consuming and discouraging, or only allows the public sector to register new fertilizer products (Figure 278). In the case of Ghana, where the International Water Management Institute (IWMI) registered its fortified waste compost with the Ministry of Food and Agriculture, the process, which is similar to the one, described for other countries (Box 18) took 36 months (Nikiema, personal communication), i.e., two years longer than one would expect in Ghana (World Bank, 2017). Where the public sector is partner of the compost production, ADB (2011) recommends that the public
588
284324
184
717%
115%15%
10%
FIGURE 277. FERTILIZER REGISTRATION TAKES MORE TIME AND MONEY IN LOW INCOME COUNTRIES
Source: EBA Database; World Bank 2017.
Copyright Material – Provided by Taylor & Francis

SE
CT
ION
V:
EN
AB
LIN
G E
NV
IRO
NM
EN
T A
ND
FIN
AN
CIN
G
783
Weaker fertilizer
registration regulations but efficient
process
Equally strong fertilizer
registration regulations
and efficient process
Stronger fertilizer
registration regulations
but inefficient process
FIGURE 278. FEW COUNTRIES HAVE BOTH STRONG FERTILIZER REGISTRATION REGULATIONS AND
EFFICIENT REGISTRATION PROCESS
Source: EBA Database; World Bank 2017.
Box 18. Waste compost registration in Bangladesh
To market a new compost commercially in Bangladesh, the compost manufacturer must obtain licenses for the product and its brand name. Approval for licensing is a two-stage process. First, the compost produced by the manufacturer is tested in government laboratories. Subsequent to compliance with the national standards, the compost is sent for a field trial on crops for two agricultural seasons. If field trial results demonstrate that use of the compost lowers the need for chemical fertilizer and increases yields, the compost and its brand name will be approved. After this stage, the Department of Agricultural Extension issues a license to the compost manufacturer. In Bangladesh, the process for product and manufacturer registration takes approximately 1–2 years. Although the entire process is lengthy, the final government approval of the product indirectly assists in marketing the compost. The Government of Bangladesh is promoting the use of compost as part of its Integrated Plant Nutrient System program through field-level agricultural extension officers who are encouraging farmers to use registered, government-approved compost. As a regulatory requirement, the compost producer has to send monthly production data and compost quality data to the Department of Agricultural Extension. Moreover, the department also randomly undertakes quality control tests on the compost for laboratory analysis to ensure compliance. If major deviations from the approved standard are detected, then the government may cancel the license to market compost. The Ministry of Agriculture instructs fertilizer shops all over the county to market only government-approved compost.
Source: Waste Concern (ADB, 2011)
Copyright Material – Provided by Taylor & Francis
CHAPTER 19. THE ENABLING ENVIRONMENT AND FINANCE
SE
CT
ION
V:
EN
AB
LIN
G E
NV
IRO
NM
EN
T A
ND
FIN
AN
CIN
G784
sector starts buying the compost for city greening programs in parks, landscaping, and roads, where quality requirements are low, while the registration process continues. Without income from the sale of compost, the plant’s cash flow will be affected, and the private partner/investor might not even engage or jump off.
Particularly helpful can be regulations that combine disincentives, e.g. for environmental pollution with policies that encourage RRR. In Rwanda, for example, the government has regulations to reduce deforestation while at the same time it provides policies for promoting renewable energy (like waste to briquetting enterprises). An often-cited example from Europe is described in Box 19.
Without regulatory support, enterprises might find it easier to grow in the informal sector, which can become a significant challenge for society. In urban Ghana, for example, up to 800,000 city dwellers eat every day exotic vegetables produced with raw or diluted wastewater (Drechsel and Keraita, 2014). Although the informal sector had been acknowledged in Ghana’s latest national irrigation policy, capacity development, e.g. in safer irrigation methods, remains an exception. Such support, however, would eventually help in reducing the size of the informal sector while promoting growth. A strong lead Ministry with a clearly defined role for promoting private sector development would be helpful in this regard.
19.2 Finance and financial incentivesResource Recovery and Reuse infrastructure financing varies to some extent between the water, energy, and nutrient/biomass sectors. Many waste to energy projects are commercially driven, with venture financing and bank loans, supported by governmental programs (green growth, renewable energy, rural electrification, etc.) and the carbon market. Financing wastewater reuse, on the other hand, refers mostly to the provision of treatment infrastructure, which is commonly relying on public finance, supported in low-income countries by foreign aid, and with increasing size of the project by multiple partners for risk sharing, including the private sector. Nutrient and biomass recovery from
Box 19. Disincentives as driver
One of the most influential legal drivers of RRR in Europe was the establishment of the Landfill Directive (1999/31/EC), which defines landfills as the last option for waste treatment and disposal. The directive imposes, for example, staged landfill reduction targets for the biodegradable fraction of municipal solid waste. Member states are obliged to devise national strategies to meet the targets. Examples of a national strategy are Sweden’s 2002 ban on landfilling of separated combustible waste and the 2005 ban on landfilling of organic waste. Because the Landfill Directive limits the landfill capacity, it has pushed the market to find alternative waste/material management options. To comply with the Landfill Directive, countries have introduced various measures to disincentivize landfilling, e.g. by increasing the gate fee, making landfilling not the cheaper but the more expensive option. Other regulatory factors that can steer the financial viability of RRR are: emissions caps, carbon taxes or carbon trading schemes; incentives related to the share of alternative (green) energy (see also Box 22).
California’s policy prohibiting landfilling of untreated sewage sludge drove its beneficial reuse as ‘Class A biosolids.’ In Quebec, Canada, plans are under way to stop landfilling of all organic wastes, including sewage sludges, sorted municipal food waste, green wastes, paper industry sludges, etc. (Hasanbeigi et al., 2012; MDDEP, 2012).
Copyright Material – Provided by Taylor & Francis
SE
CT
ION
V:
EN
AB
LIN
G E
NV
IRO
NM
EN
T A
ND
FIN
AN
CIN
G
785
municipal solid waste, like in composting projects, shows components of both often relying on 2–4 finance sources (Kaza et al., 2016).
The following text will first address common challenges and options for RRR infrastructure financing, looking separately at nutrient, water, and energy recovery, followed by a cross-cutting section on financing operations and maintenance.
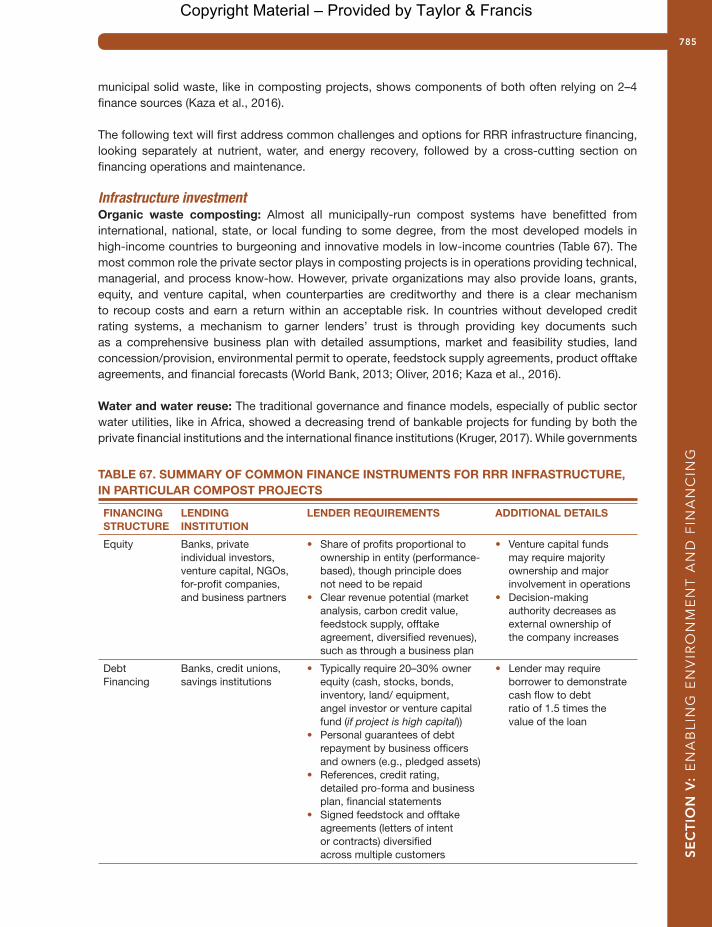
Infrastructure investmentOrganic waste composting: Almost all municipally-run compost systems have benefitted from international, national, state, or local funding to some degree, from the most developed models in high-income countries to burgeoning and innovative models in low-income countries (Table 67). The most common role the private sector plays in composting projects is in operations providing technical, managerial, and process know-how. However, private organizations may also provide loans, grants, equity, and venture capital, when counterparties are creditworthy and there is a clear mechanism to recoup costs and earn a return within an acceptable risk. In countries without developed credit rating systems, a mechanism to garner lenders’ trust is through providing key documents such as a comprehensive business plan with detailed assumptions, market and feasibility studies, land concession/provision, environmental permit to operate, feedstock supply agreements, product offtake agreements, and financial forecasts (World Bank, 2013; Oliver, 2016; Kaza et al., 2016).
Water and water reuse: The traditional governance and finance models, especially of public sector water utilities, like in Africa, showed a decreasing trend of bankable projects for funding by both the private financial institutions and the international finance institutions (Kruger, 2017). While governments
TABLE 67. SUMMARY OF COMMON FINANCE INSTRUMENTS FOR RRR INFRASTRUCTURE, IN PARTICULAR COMPOST PROJECTS
FINANCING STRUCTURE
LENDING INSTITUTION
LENDER REQUIREMENTS ADDITIONAL DETAILS
Equity Banks, private individual investors, venture capital, NGOs, for-profit companies, and business partners
Share of profits proportional to ownership in entity (performance- based), though principle does not need to be repaidClear revenue potential (market analysis, carbon credit value, feedstock supply, offtake agreement, diversified revenues), such as through a business plan
Venture capital funds may require majority ownership and major involvement in operationsDecision-making authority decreases as external ownership of the company increases
Debt Financing
Banks, credit unions, savings institutions
Typically require 20–30% owner equity (cash, stocks, bonds, inventory, land/ equipment, angel investor or venture capital fund (if project is high capital))Personal guarantees of debt repayment by business officers and owners (e.g., pledged assets)References, credit rating, detailed pro-forma and business plan, financial statementsSigned feedstock and offtake agreements (letters of intent or contracts) diversified across multiple customers
Lender may require borrower to demonstrate cash flow to debt ratio of 1.5 times the value of the loan
Copyright Material – Provided by Taylor & Francis
CHAPTER 19. THE ENABLING ENVIRONMENT AND FINANCE
SE
CT
ION
V:
EN
AB
LIN
G E
NV
IRO
NM
EN
T A
ND
FIN
AN
CIN
G786
often do not have the financial means required for large scale investments, they also struggle to provide the guarantees to mitigate investment risk. Based on low water pricing and inadequate fiscal transfers from the central government, their creditworthiness is low, making reforms and credit enhancements a high priority. This is a common water sector challenge and not RRR specific. Finance mechanisms used today by cities, states, provinces, and countries can range from commercial or non-commercial bank lending, to green bonds, taxes, or pooled financing arrangements. Some countries, such as Mexico, Brazil, South Africa, India and the Philippines, have used municipal bonds (Platz, 2009; ADB, 2014). In the example of the Philippines, the Local Government Unit Guarantee Corporation provides credit guarantees for municipalities that seek to finance infrastructure projects through debt issuances. In Dakar, Senegal, on the other hand, the failed setup of a city-level bond without a central government guarantee resulted in important lessons for other African cities (Gorelick, 2017). Innovative models of capital cost co-financing through pension funds (see below) or by the benefiting households (Box 20) have been reported from South Africa, Latin America and India.
One stimulus to encourage private investments in water infrastructure has come from low-carbon and climate-resilient (green) bonds where verifiable standards can guide investors. The process can be supported through the setup of Water Financing Facilities or Urban/Municipal National or State Financial Intermediaries, which are assisting utilities in preparing bankable project plans (Oliver et al., 2016). The concept has been proven to be successful also in countries like the Philippines, India, and Colombia. The contribution of RRR in view of energy recovery, water reuse, and carbon cycling offers options to ensure that, in particular, wastewater treatment plants can show green bond features in support of climate change adaptation and mitigation.
The trend towards public-private partnerships (PPPs) in the wastewater sector goes beyond operational support but targets private financing initiatives (Mandri-Perrot and Stiggers, 2013). Many middle-income countries are committed to the promotion of private sector participation and particularly interested in the financial schemes that use public funding to leverage private investment. Typically, the private companies involved in delivering the project provide the initial equity, although
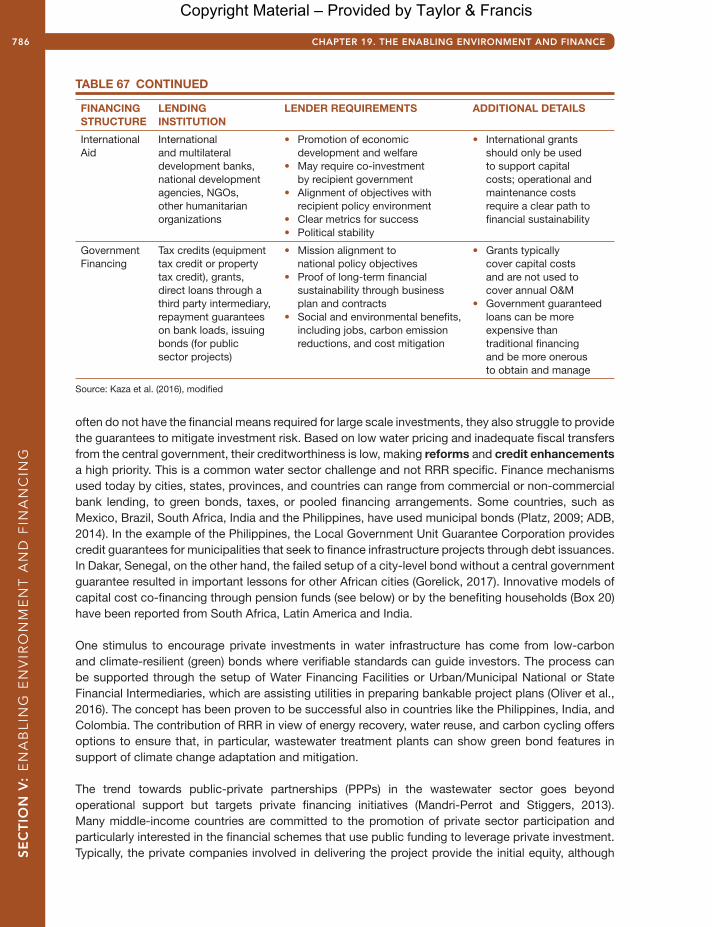
FINANCING STRUCTURE
LENDING INSTITUTION
LENDER REQUIREMENTS ADDITIONAL DETAILS
International Aid
International and multilateral development banks, national development agencies, NGOs, other humanitarian organizations
Promotion of economic development and welfareMay require co-investment by recipient governmentAlignment of objectives with recipient policy environmentClear metrics for successPolitical stability
International grants should only be used to support capital costs; operational and maintenance costs require a clear path to financial sustainability
Government Financing
Tax credits (equipment tax credit or property tax credit), grants, direct loans through a third party intermediary, repayment guarantees on bank loads, issuing bonds (for publicsector projects)
Mission alignment to national policy objectivesProof of long-term financial sustainability through business plan and contractsSocial and environmental benefits, including jobs, carbon emission reductions, and cost mitigation
Grants typically cover capital costs and are not used to cover annual O&MGovernment guaranteed loans can be more expensive than traditional financing and be more onerous to obtain and manage
Source: Kaza et al. (2016), modified
TABLE 67 CONTINUED
Copyright Material – Provided by Taylor & Francis
SE
CT
ION
V:
EN
AB
LIN
G E
NV
IRO
NM
EN
T A
ND
FIN
AN
CIN
G
787
they may invite financial investors to participate either in the initial fund raising or subsequently when the construction risk has passed and it is possible to sell on the project equity at a higher price (GWI, 2010).
Official development assistance (ODA) from international development agencies remains particularly strong for solid waste and wastewater management in low-income countries, although for more costly wastewater infrastructure, finance can be significantly more complex with multi-partner cost sharing, investment guarantees, and related risk management arrangements. For wastewater treatment, public financed and owned facilities established by the private partner under a design-build-operate (DBO) or build-operate-transfer (BOT) model are often preferred. The operator is taking no or minimal financing risk on the capital but remains responsible for smooth operations. Also, other types of arrangements are common, including build-own-operate-transfer (BOOT) or build-own-operate (BOO) models where the private project development company has or even continues ownership of the facility after the contractual period (GWI 2010). In this catalogue, the BOT case of As Samra (Business Model 19) has been elaborated in more detail given its importance for many RRR projects which share high socioeconomic and environmental benefits, but carry significant political/macro-economic, sector specific, or project related risks, in particular uncertain cost recovery. There are many examples, especially in the purview of financing, which can add risks and encourage or discourage both the public and private sector to invest in RRR (ADB, 2011; Bjornali and Ellingsen, 2014; World Bank, 2016). The same applies to the operational site and the only slowly emerging support of cost recovery through different forms of direct or indirect (green growth) subsidies in low- and middle-income countries.
International project finance for the water sector is generally available subject to its (minimum) size. According to Winpenny (2003) a typical minimum project size is USD 50–100 million. Below that level, returns to scale generally tend to make project financing uneconomic, and projects will have to be addressed by the corporate or municipal sectors. For project finance to be a viable option, project revenues and returns to equity must be acceptable, though this does not preclude the use of aid to reduce the debt or equity burden of the project. However, there is a project size (USD 10,000 to USD 100,000) which is often too small for the corporate sector and too large for micro loans (Winpenny, 2003).
From the RRR perspective, a common bottleneck in many developing countries is the lack of local capital markets that provide long-term financing for small- and middle-scale infrastructure projects
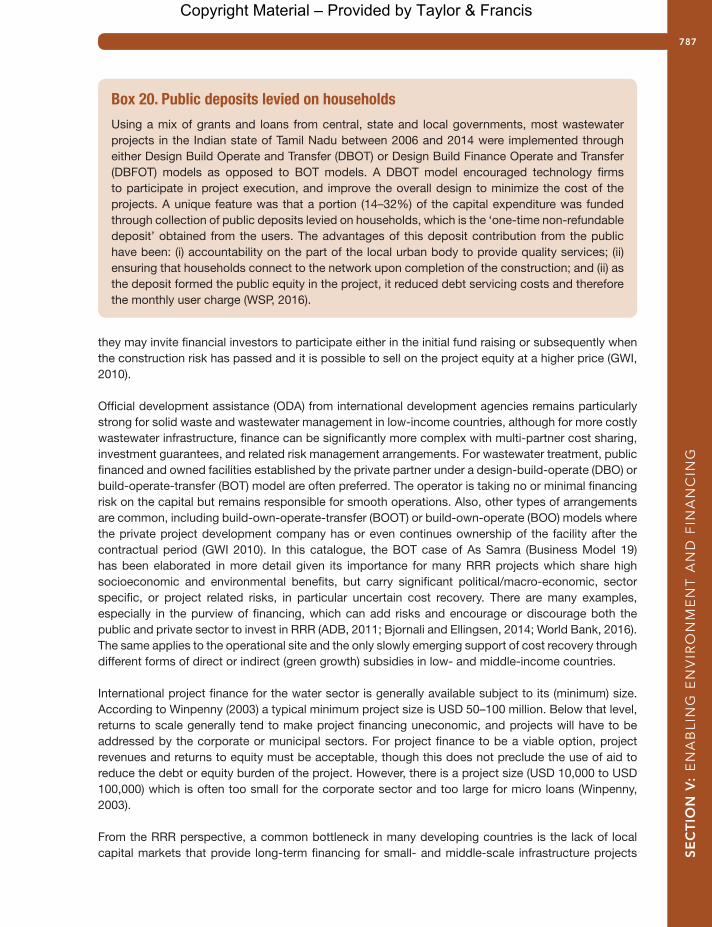
Box 20. Public deposits levied on households
Using a mix of grants and loans from central, state and local governments, most wastewater projects in the Indian state of Tamil Nadu between 2006 and 2014 were implemented through either Design Build Operate and Transfer (DBOT) or Design Build Finance Operate and Transfer (DBFOT) models as opposed to BOT models. A DBOT model encouraged technology firms to participate in project execution, and improve the overall design to minimize the cost of the projects. A unique feature was that a portion (14–32%) of the capital expenditure was funded through collection of public deposits levied on households, which is the ‘one-time non-refundable deposit’ obtained from the users. The advantages of this deposit contribution from the public have been: (i) accountability on the part of the local urban body to provide quality services; (ii) ensuring that households connect to the network upon completion of the construction; and (ii) as the deposit formed the public equity in the project, it reduced debt servicing costs and therefore the monthly user charge (WSP, 2016).
Copyright Material – Provided by Taylor & Francis

CHAPTER 19. THE ENABLING ENVIRONMENT AND FINANCE
SE
CT
ION
V:
EN
AB
LIN
G E
NV
IRO
NM
EN
T A
ND
FIN
AN
CIN
G788
(Muspratt, 2016ab), although there are encouraging example of financial instruments in support of local enterprises and business start-ups. In Singapore, for example, the government has initiated 35+ funding and incentive schemes related to clean energy, green buildings and construction, water and environmental technologies, waste minimization and recycling, environmental initiatives, and so forth. This also includes the Clean Development Mechanism (CDM), funding for water recycling, and use of alternative sources of water.5 Other finance examples of case studies across the waste and sanitation sector are described, e.g. by Ali (2004), ADB (2011, 2014, 2016), Beltramello et al. (2013) and the World Bank (2016).
Energy recovery: Aside from wind and solar energy, the recovery of energy from biomass and waste constitutes important components of total renewable energy investments, which have been shifting towards developing countries for several years (IRENA, 2012). The sector struggled with the failure of energy pricing to account for externalities or the environmental and social costs of production, which has made renewable energy technologies to look more expensive than they really are, compared to fossil fuels. To assess project eligibility with an eye on externalities, the European Investment Bank (EIB), like also other larger banks, provides an interesting example of accounting via the net carbon footprint. The absolute carbon footprint of a project is compared with the carbon emissions in absence of the project. Then a net carbon impact of projects is calculated, using advanced models including industry-specific ones (Griffith-Jones et al., 2012). There are many other examples of trust funds, etc. which can support projects on renewable energy addressing climate change (see e.g. www.adb.org/site/funds/funds).
In general, there is no “one size fits all” finance formula for renewable energy (IRENA, 2012). Every national market is unique, and effective finance strategy requires a holistic approach that is tailored to the local context. That said, governments should generally seek to perform two broad functions: first, create overarching regulatory frameworks that shift incentives onto a macro level; and second, use targeted public financing to fill or overcome niche gaps and barriers. Regulatory frameworks can employ both energy policy (e.g. feed-in tariffs, energy auctions, and self-supply regulation) and finance policy (e.g. banking regulation and other measures that incorporate sustainability into financial decision-making). The most effective public finance programs will employ a flexible package of financing mechanisms rather than relying on any single mechanism or fixed set of mechanisms. These packages may employ credit lines to local finance institutions; project debt financing; loan softening programs; guarantees to mitigate lending risk; grants and contingent grants for project development costs; equity, quasi-equity, and venture capital; or carbon finance facilities (IRENA, 2012). Even more than in the water sector, green bonds designed for climate resilient cities are in high demand for the production of environmentally friendly energy as well as reduced methane emissions from better waste management. Green bonds which had in 2015 a total value of around USD 44 billion are commonly issued by larger development banks, but increasingly also by real estate companies, municipalities (Johannesburg), international corporations, and commercial banks (Oliver, 2016). Institutional investors also include pension funds. While smaller pension funds require pooled investment vehicles, larger pension funds have the capacity to invest directly in infrastructure projects (Box 21).
As investment in renewable energy (but also wastewater reuse and composting) can take years, or even decades, to yield good returns, ‘patient capital’ is needed. Unfortunately, however, this is the type of investment that is most difficult to attract in most developing countries, given typical short-term horizons of private capital markets. Exceptions can be funds that have long-term liabilities such as sovereign wealth funds (SWFs) and pension funds (Griffith-Jones et al., 2012) or e.g., pooled local currency bonds with a 15 to 23 years tenor as reported from the water sector (Oliver et al., 2016), aside from support from multilateral development banks.
Copyright Material – Provided by Taylor & Francis
SE
CT
ION
V:
EN
AB
LIN
G E
NV
IRO
NM
EN
T A
ND
FIN
AN
CIN
G
789
Facilitating operational cost recoveryAmong the different RRR sub-sectors, it is mostly the compost sector’s image that suffered from a large array of failed or underperforming projects, which began with high amounts of grant funding but ultimately collapsed due to inability to support their operational costs (Kaza et al., 2016). Common reasons are the selection of a too complex technology for which repairs and maintenance costs become unmanageable, and limited understanding of the compost market. Public-private partnerships can offer in this regard not only private capital, but also market know-how and the private sector’s technical and managerial expertise. This is crucial as experience shows that compost as well as wastewater treatment plants owned or operated by private sector companies are usually functioning better than municipally-operated ones (e.g. ADB, 2011; Murray and Drechsel, 2011). A key criterion are incentives, and operational cost recovery is a strong one, which can be supported by different forms of direct or indirect subsidies. There are many options for RRR related financial instruments to keep the private sector engaged (ADB 2011; ADB, 2016; Eyraud et al., 2011):
Tax holidays. Entrepreneurs setting up a compost plant as part of a joint venture or within the private sector could be considered for a tax holiday for a number of years, like an exemption on customs duty, excise duty, value-added tax, sales tax, or other local taxes on equipment, machinery, etc. Tax exemptions could also include the waste derived products, to support sales, while, e.g. tax penalties could be used to prevent resource wastage or tax credits to support, e.g. renewable energy (Box 22).
Capital subsidies. Entrepreneurs could be considered for example, for a capital subsidy (or Viability Gap Funding) provided to support infrastructure projects that are economically justified but fall short of financial viability. In the same way, different types of PPPs could be supported with different shares of grant subsidy, equity, and debt from the government or a financial intermediary. Moreover, for any project financed by banks, lower interest rates could be supported by the government, along with a long loan term.
Tipping fees. A private sector entity operating organic waste-recycling facilities such as compost or waste-to-energy plants should not be asked to pay royalties to the city. Alternatively, tipping fees should be paid by the city for each ton of waste processed by the entrepreneur because waste recycling reduces the landfilling cost. To promote RRR, legislation should however enable the private sector to be paid for every ton of quality waste recycled and sold, not only for every ton collected.
Box 21. Pension funds for green infrastructure investments
The South African Government Employees Pension Fund (GEPF) is Africa’s largest pension fund, with over USD 138 billion in assets under management. The GEPF is also the single largest investor in the Johannesburg Stock Exchange-listed companies. The fund has set aside 5 percent of its portfolio for investing in developmental projects – mostly infrastructure projects supporting positive economic, social, and environmental outcomes for South Africa over the long term. During 2010/11, the fund accelerated investments in developmental projects in different areas including water infrastructure, alternative energy, and environmental projects. In each area, the aim is to maintain a balance between social impact and financial returns. Interesting vehicles to assist smaller pension funds to invest in the infrastructure sector have been developed in some Latin American countries, such as in Chile via infrastructure bonds with insurance guarantees, in Mexico and Peru via investment trusts, and in Brazil via a joint-owed infrastructure company. Common investments are in housing, roads, or renewable energy (OECD, 2012).
Copyright Material – Provided by Taylor & Francis
CHAPTER 19. THE ENABLING ENVIRONMENT AND FINANCE
SE
CT
ION
V:
EN
AB
LIN
G E
NV
IRO
NM
EN
T A
ND
FIN
AN
CIN
G790
Concessionary rates for utilities. RRR companies should be considered like other utilities, and be able to access similar concessionary/commercial rates for electricity, fuel, and water supply, if available.
Creating parity with chemical fertilizers. Although governments might promote compost use, they are usually providing direct or indirect subsidies to chemical fertilizer companies to the detriment of organic fertilizer and compost manufacturers. Given the environmental benefits of compost, including greenhouse gas emission (GHG) reduction, it is either recommended to include waste compost at par into the governmental fertilizer subsidy program, as it was introduced in 2016 for example in Ghana, or reduce subsidies to the chemical fertilizer companies, or of fossil fuels which in turn can support green investments, also in renewable energy.
Co-marketing compost with chemical fertilizers. Fertilizer companies can be asked to adopt a ‘basket approach,’ entailing the co-marketing of compost with chemical fertilizers as is now the law in India, supported by a governmental subsidy. The regulation helps, in particular, compost stations that fail to penetrate existing marketing chains. For larger-scale compost plants, the use of fertilizer marketing companies for distribution and sale of compost provides a great advantage. A possible marketing ratio of chemical fertilizer bags versus bags of certified registered compost was also discussed in India (Box 23) and has also been implemented in parts of Sri Lanka.
Power purchasing agreements. In most developing countries electricity is regulated by the government and utilities are typically owned by the government especially infrastructure for transmission and
Box 22. Green taxations for a Circular Economy
Green taxation is being increasingly used to push the circular economy. KPMG identified in a 21-country survey 200 green tax incentives and penalties of which 30 appeared just in the last two years before the survey in 2013. These include landfill taxes, incineration gate fees, accelerated asset depreciation, tax credits, VAT refunds linked to secondary materials purchase, reduced VAT, or VAT refunds on recycled goods (e.g. in China and South Korea).
Taxation can be applied at different levels: resource recovery, first industrial use (e.g. fertilizer production) or final consumption (e.g. fertilizer use). A possible taxation package in support of phosphorus recovery and reuse could have different entry points for tax support or penalties:
To secure long-term availability and reduce import dependency.To reduce phosphorus losses/disposal into surface waters and ultimately the oceans.To close the phosphorus cycle as far as possible, reducing inputs and outputs and developing recycling.
An example of a penalty taxation is the one on nutrient surpluses (over-fertilization) in the Netherlands. Tax penalties to support renewable energy concern, e.g. the use of conventional fossil fuels. Such taxes only exist so far in developed countries. Developing or emerging economies appear to avoid taxing conventional fuel, presumably on the basis that such penalties could damage development and growth prospects. Other options are disposal taxes which are typically imposed per ton of waste resource landfilled or incinerated to catalyze firms’ investments in waste reduction and recycling.
Sources: KPMG, 2013, Dubois et al., 2015
Copyright Material – Provided by Taylor & Francis
SE
CT
ION
V:
EN
AB
LIN
G E
NV
IRO
NM
EN
T A
ND
FIN
AN
CIN
G
791
distribution of electricity. However, in many countries, such as Vietnam, Sri Lanka, and Uganda, the private sector is encouraged to generate (non-conventional) renewable electricity, including municipal waste energy by providing an attractive feed-in-tariff (FIT) and a long-term power purchasing agreement. Supportive agreements accept alternative energy throughout the year and not only in times of peak demand. According to KPMG6, the total number of countries with feed-in tariffs globally is over 50. While the goals of FITs are the same in developed and developing countries, there are particular features of the latter that require consideration. For example, FITs in developed countries are generally funded by a premium placed on all energy bills, while in low-income countries external finance might be needed (Griffith-Jones et al., 2012).
Carbon market. Energy recovery from MSW or wastewater opens options for earning carbon credits through the CDM, while nutrient-rich wastewater can help to sequester carbon in fast-growing trees. However, the process of CDM registration and certification can take time and have significant transaction costs (Michaelowa and Jotzo, 2005). Examples of additional revenues from carbon credits are the Kinoya Sewerage Treatment Plant in Fiji and the National Biodigester Program in Cambodia (ADB, 2016). Due to the weakening of the carbon market, new initiatives for carbon finance were established (Box 24). Other alternatives could be watershed protection schemes or payments for ecosystem services.
Government promotion and awareness raising. Within the market purview, a campaign is needed to generate awareness of the new products and encourage the use of compost and organic fertilizer on its own and as a supplement to chemical fertilizers. This can also be incorporated in the extension activity of the ministry of agriculture and agricultural departments. Where applicable, a media campaign has to be undertaken to encourage source segregation of waste, as a key activity for successful organic waste management. Moreover, the ministry of energy can encourage the use of briquettes, for example, for certain types of industries, promote generation of electricity from biogas, and provide special rates for such electricity.
Results-based financing (RBF). Performance-based subsidies are disbursed based on the delivery of pre-agreed outputs and after independent verification (Trémolet, 2011). This ensures that facilities are constructed according to specifications and based on the desired quality. An application for carbon finance is presented in Box 24. Output-based Aid (OBA) is a form of RBF designed to enhance access to and delivery of infrastructure and social services for the poor through the use of performance-
Box 23. Co-marketing directive
To promote the acceptance of city compost, in early 2016 the Indian Cabinet approved a policy on Promotion of City Compost. The Ministry of Urban Development in consultation with the Ministry of Chemicals and Fertilizers agreed to subsidize compost sale at Indian Rupee (INR) 1,500 (USD 22.5) per ton of city compost. This market development assistance will be paid to fertilizer companies with the expectation of co-marketing city compost with chemical fertilizers. The co-marketing details will be decided by the Department of Fertilizers depending on supply and demand (Government of India, 2016). Earlier suggestions for co-marketing were, for example, to sell one bag of municipal compost with every two bags of chemical fertilizer, or that only a co-marketing arrangement gives access to the subsidy on chemical fertilizer. Such a directive would urge fertilizer companies to seek compost from compost stations; turning the common situation around where compost plants have to seek customers.
Copyright Material – Provided by Taylor & Francis
CHAPTER 19. THE ENABLING ENVIRONMENT AND FINANCE
SE
CT
ION
V:
EN
AB
LIN
G E
NV
IRO
NM
EN
T A
ND
FIN
AN
CIN
G792
based incentives, rewards or subsidies. OBA was applied for sanitation investments in Nepal and in increasing household access to domestic sanitation in Sri Lanka (ADB, 2016).
Relevant information and statistics provide the foundation for monitoring returns on investments. Measuring progress towards green growth in low- and middle-income countries requires some special considerations as these countries face different challenges than other countries, such as a much lower statistical capacity. The OECD has therefore developed a measurement framework for green growth that provides countries around the globe with a robust tool that can be adapted to different national circumstances and priorities. The measurement framework combines the main features of green growth with the basic principles of accounting and the pressure-state-response model. It gives countries the flexibility to focus on the indicators that reflect their own green growth objectives, such as building economic and environmental resilience and ensuring that growth is inclusive (OECD, 2011).
Box 24. New carbon financing initiatives (Kaza et al., 2016)
Since the 1990s and early 2000s, carbon markets have been a supplementary source of income for those RRR projects that reduce greenhouse gas emissions. Carbon markets generate funding through sales of carbon offsets or credits (e.g. tons of CO2 reductions) in open markets. However, obtaining carbon credits is time and resource intensive, with a registration process taking between 200 and 800 days. Not only is it costly to register within the carbon market, but the process of calculating and validating greenhouse gas emissions reductions requires consultation and validation with a third party. Therefore, using the carbon markets to fund, for example composting projects, may only be feasible when done on a large scale and may generally be more appropriate for middle- than low-income countries.
As of 2017, more than 700 CDM projects converting biomass to energy were listed by UNEP, compared to 281 engaged in wastewater treatment and 46 in composting, both reducing methane production (UNEP, 2017). A challenge, aside from the registration process, is that carbon markets fluctuate over time, with prices peaking at €30 per ton in 2006 and 2008, but dramatically lowering to about €5 per ton between 2012–2016, although there can be significant differences between countries and carbon pricing initiatives (World Bank et al., 2016). Composting projects that have received funding through the CDM include Waste Concern in Bangladesh, earning USD 1.5 million in carbon credits, and the Temesi integrated resource recovery center in Bali. For the latter, while a USD 1.5 million revenue in credit sales was expected, USD 70,000 was required upfront for financing quantification, certification, and registration in the CDM program which makes the CDM not well suited for small scale, community-based composting (Mitchell and Kusumowati, 2013).
In response to the weakening carbon credit market, a range of new results-based climate finance (RBCF) initiatives emerged including the World Bank’s Pilot Auction Facility (World Bank et al., 2016). RBCF is particularly adept at helping to build an international carbon market. It is an approach where funding is conditional upon the verified achievement of, e.g. predefined emission reductions. This provides assurance to the funder and a continued financing flow for the recipient. The auction facility is a payment mechanism that sets a floor price on the future price of carbon through a public auction. The agreement is facilitated through a tradeable put option,
Copyright Material – Provided by Taylor & Francis
SE
CT
ION
V:
EN
AB
LIN
G E
NV
IRO
NM
EN
T A
ND
FIN
AN
CIN
G
793
19.3 Technologies matching resource constraintsInfrastructure and technologies which acknowledge local opportunities and constraints are very important for any investments in low and middle-income countries if an innovation is to survive and succeed. One of the major drawbacks of composting but also wastewater treatment, as mentioned above, was reliance on technology not matching local capacities. Another typical barrier for the implementation of, e.g. organic waste processing is the lack of available land in urban vicinity, ideally free of cost given the social and environmental services RRR provides. Peri-urban land is a precious asset, also for the public sector, and not easily available for various reasons including negative public perceptions of waste management facilities. A secured long-term lease is however important as most RRR investments have a long payback period of, for example, at least seven years for organic waste recycling (ADB, 2011), and for wastewater treatment even longer. Only investments in energy efficiency, like in wastewater treatment facilities, can have much shorter payback periods of less than one to a maximal three years (Barry, 2007). The required land area for a RRR facility will depend on the size of the urban community to be served (i.e. the quantity of possibly available waste), the type of the waste volume matching technology (i.e. gravity thickening or drying beds for liquid fecal sludge), as well as the required peri-urban farm area to ‘absorb’ the recovered resources, based on a carefully stratified demand analysis (Otoo et al., 2016).
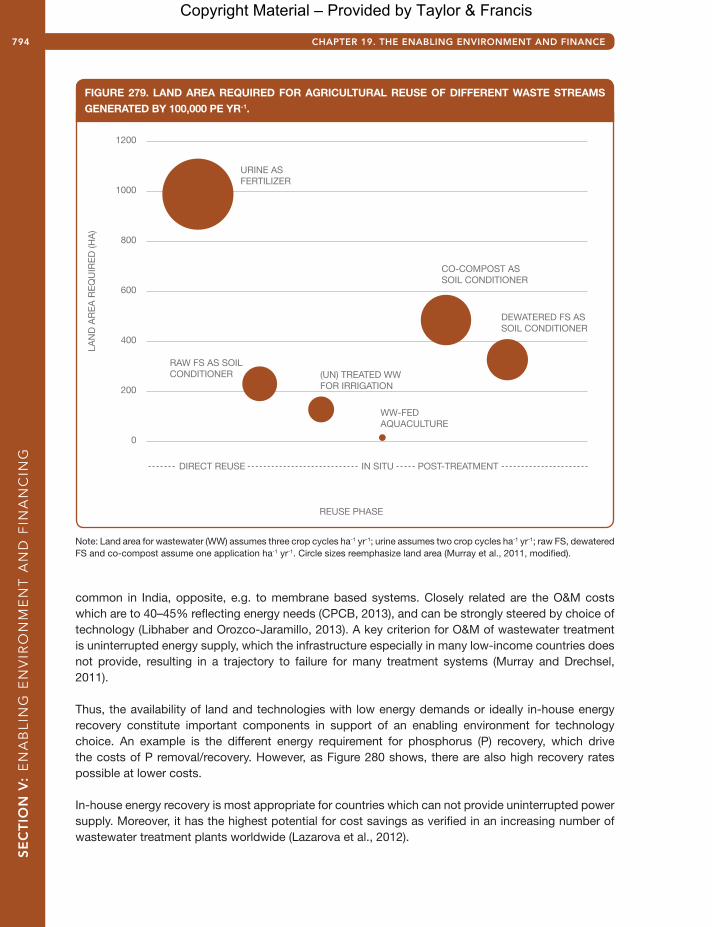
Different recovered resources have in this regard very different requirements, even if derived from the same number of households. Figure 279 shows, as an example, a two order of magnitude difference in the basic land requirement for the reuse of wastewater, urine, and fecal sludge (FS) for food production. Urine application requires the most land area given its high nitrogen concentration and alkalinity, which can easily be harmful to plants and limits the application rates. To support for example 100 ha of urban agriculture city-wide, the amounts generated daily in some public toilets might already be sufficient. On the other hand, wastewater-fed aquaculture and wastewater irrigation require the least land for making use of the volume of waste generated by 100,000 person equivalents (pe) of waste producers (Murray et al., 2011).
As compost is first of all a soil ameliorant with an impact on the soil lasting longer than any inorganic fertilizer, its application is often limited to once per year. In a comparative analysis, the low frequency makes compost reuse land-intensive with 400–500 ha required, assuming one application of 14 tonnes ha-1 yr-1. Biogas production, for comparison, might require for the same waste input 200–300 ha, with less than 1 ha for the gas generation and storage, and the majority for farm land if the digestate is returned as soil conditioner. Similar to biogas itself, the reuse ‘area’ of briquettes is decentralized over many households and comparatively insignificant (Murray et al., 2011).
Land and energy demands can be negatively correlated as known from wastewater treatment where, e.g. Waste Stabilization Ponds (WSP) take in India about ten times the area than other treatment systems, while only using about 1–2 percent of their energy needs for the same amount of wastewater. Apart from the land-demanding WSP systems, Upflow Anaerobic Sludge Blanket (UASB) treatment requires relatively more land but the least amount of energy compared with other treatment systems
which provides buyers the right, but not obligation, to sell carbon at the agreed-upon price at a future date. The auction encourages private sector investment in particular in methane reduction projects while efficiently disbursing limited public funds. Three successful auctions took place between 2015 and early 2017 (www.pilotauctionfacility.org; World Bank, 2015).
Copyright Material – Provided by Taylor & Francis
CHAPTER 19. THE ENABLING ENVIRONMENT AND FINANCE
SE
CT
ION
V:
EN
AB
LIN
G E
NV
IRO
NM
EN
T A
ND
FIN
AN
CIN
G794
common in India, opposite, e.g. to membrane based systems. Closely related are the O&M costs which are to 40–45% reflecting energy needs (CPCB, 2013), and can be strongly steered by choice of technology (Libhaber and Orozco-Jaramillo, 2013). A key criterion for O&M of wastewater treatment is uninterrupted energy supply, which the infrastructure especially in many low-income countries does not provide, resulting in a trajectory to failure for many treatment systems (Murray and Drechsel, 2011).
Thus, the availability of land and technologies with low energy demands or ideally in-house energy recovery constitute important components in support of an enabling environment for technology choice. An example is the different energy requirement for phosphorus (P) recovery, which drive the costs of P removal/recovery. However, as Figure 280 shows, there are also high recovery rates possible at lower costs.
In-house energy recovery is most appropriate for countries which can not provide uninterrupted power supply. Moreover, it has the highest potential for cost savings as verified in an increasing number of wastewater treatment plants worldwide (Lazarova et al., 2012).
URINE AS FERTILIZER
RAW FS AS SOIL CONDITIONER (UN) TREATED WW
FOR IRRIGATION
CO-COMPOST AS SOIL CONDITIONER
DEWATERED FS AS SOIL CONDITIONER
WW-FED AQUACULTURE
LAN
D AR
EA R
EQU
IRED
(HA)
REUSE PHASE
DIRECT REUSE IN SITU POST-TREATMENT
1200
1000
800
600
400
200
0
FIGURE 279. LAND AREA REQUIRED FOR AGRICULTURAL REUSE OF DIFFERENT WASTE STREAMS
GENERATED BY 100,000 PE YR-1.
Note: Land area for wastewater (WW) assumes three crop cycles ha-1 yr-1; urine assumes two crop cycles ha-1 yr-1; raw FS, dewatered FS and co-compost assume one application ha-1 yr-1. Circle sizes reemphasize land area (Murray et al., 2011, modified).
Copyright Material – Provided by Taylor & Francis

SE
CT
ION
V:
EN
AB
LIN
G E
NV
IRO
NM
EN
T A
ND
FIN
AN
CIN
G
795
19.4 Local capacities and stakeholder acceptanceDepending on the nature and size of the RRR project, private partners can range from local enterprises to international companies. Smaller enterprises are more common in the bio-energy and waste-to-compost sectors than in wastewater treatment and often struggle with low credit history, limited capacity to present a bankable project and to realize the right mix of debt and equity investment. In fact, in many low- and middle-income countries, private partners with innovation experience in green technology and knowledge about business development, finance access, and reuse markets are still an exception, in particular at the local government level. The reason for the generally underdeveloped business capacity is that, especially in the municipal waste and sanitation sectors, only one business model determines so far, the game: the public partner pays. As a result, innovation capacity remains low and many tenders only attract the usual sanitation- or waste management-based enterprises with very limited experience, e.g. with the agricultural reuse market, carbon financing, etc. PPP
2. EXTRACTION FROM SLUDGE ASH
1. EXTRACTION FROM LIQUID PHASE
3. EXTRACTION FROM DEWATERED SLUDGE
FIGURE 280. PHOSPHORUS RECOVERY OPTIONS DURING WASTEWATER TREATMENT AND RELATED
ENERGY REQUIREMENT CALCULATED FOR SWITZERLAND.
Note: The energy requirements consider also the energy needed to produce the required raw materials (graphic adapted from Morf and Koch (2009); USD 1 = CHF 1.1).
Copyright Material – Provided by Taylor & Francis
CHAPTER 19. THE ENABLING ENVIRONMENT AND FINANCE
SE
CT
ION
V:
EN
AB
LIN
G E
NV
IRO
NM
EN
T A
ND
FIN
AN
CIN
G796
matchmaking remains a significant challenge and private sector participation is not a guarantee for a viable business, in particular in Africa but also large parts of Asia.
Capacity related limitations do not only concern possible business partners, or their capacity to maintain more advanced technology, but also other stakeholders along the value chain, especially where the business requires environmental awareness as the adoption of eco-innovations is heavily dependent on consumers’ education and attitudes (Beltramello et al., 2013). Source separation, for example, remains a significant challenge for supplying compost station with quality waste, and where recycled waste products enter the market, social perceptions can function both as a promoter and as a barrier for resource recovery and market access, for example where customers have a non-waste derived alternative. Results-based-financing can support in this respect RRR by catalyzing the design of projects that go beyond resource recovery but provide incentives to households for behavior change, for example, towards waste separation and recycling (Banna et al., 2014). Comparing common experience with the acceptance of waste-derived resources across the presented case studies in sections II to IV, biogas and electricity have the best reception, followed by dry fuel, waste compost, and finally treated wastewater which is often facing the largest acceptance challenges. These challenges might not only relate to possible health risks but also the basic reuse suitability, for example in farming. In the case of Pakistan, treated wastewater got rejected due to its higher salinity than raw wastewater. In the case of compost, farmers might expect more a fertilizer than a soil ameliorant, and struvite crystals are (only) a slow-release fertilizer. Therefore, it is important to understand market expectations, adjust as far as possible the recovered resource to users’ preferences, and accompany the introduction of recovered resources with information and training in their use.
In view of reclaimed water, public acceptance depends on the kind of reuse, with more distant uses, such as landscape irrigation, being the most preferred option, while potable reuse receives most hesitation (Drechsel et al., 2015). Different factors come into play when promoting social acceptance and behavior change, such as household and gender specific knowledge, trust, attitudes toward the environment, as well as the availability of (perceived safer) alternatives. These social aspects can include religious, cultural, and aesthetic values. As any waste-related facility can generate public questions and opposition, a high level of transparency and public disclosure of information is required. Stakeholder participation in re-use planning, awareness and capacity development programs including market surveys are therefore crucial to address any possible adoption challenges (ADB, 2011; Dolnicar and Saunders, 2006; Holmgren et al., 2015).
References and further readingsAli, M. (ed.). 2004. Sustainable composting: Case studies and guidelines for developing countries.
Leicestershire, UK: WEDC and SANDEC/EAWAG.
Asian Development Bank (ADB). 2014. From toilets to rivers: Experiences, new opportunities, and innovative solutions. Manila, Philippines: Asian Development Bank.
Asian Development Bank (ADB). 2016. Financing mechanisms for wastewater and sanitation. Manila, Philippines: Asian Development Bank.
Asian Development Bank (ADB). 2011. Toward sustainable municipal organic waste management in South Asia: A guidebook for policy makers and practitioners. Manila, Philippines: Asian Development Bank.
Banna, F.M., Bhada-Tata, P., Ho, R. Y-Y., Kaza, S. and Lee, M. 2014. Results-based financing for municipal solid waste (Vol. 2): Main report (Urban development series knowledge papers vol. 20). Washington, DC: World Bank Group. http://documents.worldbank.org/curated/en/ 237191468330923040/Main-report (accessed 5 Nov. 2017).
Copyright Material – Provided by Taylor & Francis
SE
CT
ION
V:
EN
AB
LIN
G E
NV
IRO
NM
EN
T A
ND
FIN
AN
CIN
G
797
Barry, J.A. 2007. WATERGY: Energy and water efficiency in municipal water supply and wastewater treatment. Washington, D.C.: The Alliance to Save Energy.
Beltramello, A., Haie-Fayle, L. and Pilat, D. 2013. Why new business models matter for green growth (OECD Green Growth Papers, 2013-01). Paris: OECD Publishing.
Bjornali, E.S. and Ellingsen, A. 2014. Factors affecting the development of clean-tech start-ups: A literature review. Energy Procedia 58: 43–50.
Central Pollution Control Board (CPCB). 2013. Performance evaluation of sewage treatment plans in India funded under NRCD. Delhi: Central Pollution Control Board.
Dolnicar, S. and Saunders, C. 2006. Recycled water for consumer markets: A marketing research review and agenda. Desalination 187(1–3): 203–214.
Drechsel, P. and Keraita, B. (eds.). 2014. Irrigated urban vegetable production in Ghana: Characteristics, benefits and risk mitigation (2nd ed.). Colombo, Sri Lanka: International Water Management Institute (IWMI).
Drechsel, P., Mahjoub, O. and Keraita, B. 2015. Social and cultural dimensions in wastewater use. In Drechsel, P., Qadir, M., Wichelns, D. (eds.). Wastewater: Economic asset in an urbanizing world. Dordrecht, Netherlands: Springer. pp. 75–92.
Dubois, M., Hoogmartens, R., Van Passel, S., Van Acker, K. and Vanderreydt, I. 2015. Innovative market-based policy instruments for waste management: A case study on shredder residues in Belgium. Waste Management & Research 33(10): 886–893.
Eyraud, L., Zhang, C., Wane, A.A. and Clements, B.J. 2011. Who’s going green and why? Trends and determinants of green investment (IMF Working Paper WP/11/296). Washington D.C.: International Monetary Fund. www.imf.org/en/Publications/WP/Issues/2016/12/31/Who-s-Going-Green-and-Why-Trends-and-Determinants-of-Green-Investment-25440 (or https://goo.gl/d4ApCK; accessed 6 Nov. 2017).
Global Water Intelligence (GWI). 2010. Municipal water reuse markets 2010. Media Analytics, Ltd., Oxford.
Gorelick, J. 2017. Financing Africa’s cities. Bonds and Loans. 9 March 2017. www.bondsloans.com/news/article/1282/financing-africas-cities (accessed 6 Nov. 2017).
Government of India. 2016. Office memorandum: Policy on promotion of city compost (F. No. 11026/14/2015-M&E). 10 February 2016. New Delhi: Ministry of Chemicals and Fertilizer.
Griffith-Jones, S., Antonio Ocampo, J. and Spratt, S. 2012. Financing renewable energy in developing countries: Mechanisms and responsibilities. Report by the Overseas Development Institute (ODI) in partnership with the Deutsches Institut für Entwicklungspolitik (DIE) and the European Centre for Development Policy Management (ECDPM). www.stephanygj.net/papers/Financing_Renewable_Energy_in_Developing_Countries.pdf (accessed 6 Nov. 2017).
Hasanbeigi, A., Lu, H., Williams, C. and Price, L. 2012. International best practices for pre-processing and co-processing municipal solid waste and sewage sludge in the cement industry. Ernest Orlando Lawrence Berkeley National Laboratory. http://eetd.lbl.gov/sites/all/files/publications/co-processing.pdf (accessed 6 Nov. 2017).
Holmgren, K.E., Li, H., Verstraete, W. and Cornel, P. 2015. Sate of the art compendium report on resource recovery from water. London, UK: IWA resource recovery cluster.
International Finance Corporation (IFC). 2013. Mobilizing public and private funds for inclusive green growth investment in developing countries. Washington D.C.: International Finance Corporation.
International Renewable Energy Agency (IRENA). 2012. Financial mechanisms and investment frameworks for renewables in developing countries. Abu Dhabi, UAE.
Copyright Material – Provided by Taylor & Francis
CHAPTER 19. THE ENABLING ENVIRONMENT AND FINANCE
SE
CT
ION
V:
EN
AB
LIN
G E
NV
IRO
NM
EN
T A
ND
FIN
AN
CIN
G798
International Solid Waste Association (ISWA). 2015. Six reports on the circular economy and waste management. www.iswa.org/resourcemanagement (accessed 6 Nov. 2017).
Kaza, S., Yao, L. and Stowell, A. 2016. Sustainable financing and policy: Models for municipal composting (Urban development series, Knowledge Papers 24). Washington, D.C.: World Bank Group.
KPMG. 2013. The KPMG Green Tax Index 2013: An exploration of green tax incentives and penalties. https://assets.kpmg.com/content/dam/kpmg/pdf/2013/08/kpmg-green-tax-index-2013.pdf (accessed 6 Nov. 2017).
Kruger, A. 2017. How to make a water project bankable: Strengthen the financial capital planning. Waterfront 1 (May): 14.
Lazarova, V., Choo, K.H. and Cornel, P. (eds.). 2012. Water-Energy interactions in water reuse. London: IWA Publishing.
Libhaber, M. and Orozco-Jaramillo, A. 2013. Sustainable treatment of municipal wastewater. IWA’s Water 21 (October 2013): 25–28.
Mandri-Perrot, C. and Stiggers, D. 2013. Public private partnerships in the water sector. London: IWA Publishing.
Matter, A., Ahsan, M., Marbach, M. and Zurbrügg, C. 2015. Impacts of policy and market incentives for solid waste recycling in Dhaka, Bangladesh. Waste Management 39: 321–328.
Michaelowa, A. and Jotzo, F. 2005. Transaction costs, institutional rigidities and the size of the clean development mechanism. Energy Policy 33(4): 511–523.
Ministère du Développement Durable, de l’Environnement et des Parcs (MDDEP). 2012. Bannissement des matières organiques de l’élimination au Québec: état des lieux et prospectives. Direction des matières résiduelles et des lieux contaminés, Service des matières résiduelles www.mddelcc.gouv.qc.ca/matieres/organique/bannissement-mat-organ-etatdeslieux.pdf (accessed 6 Nov. 2017).
Mitchell, C. and Kusumowati, J. 2013. Is carbon financing trashing integrated waste management? Experience from Indonesia. Climate and Development 5: 268–276.
Morf, L. and Koch, M. 2009. Synthesebericht für interessierte Fachpersonen, Zürcher Klärschlammentsorgung unter besonderer Berücksichtigung der Ressourcenaspekte. Baudirection Kanton Zuerich.
Murray, A. and Drechsel, P. 2011. Why do some wastewater treatment facilities work when the majority fail? Case study from the sanitation sector in Ghana. Waterlines 30(2), 135–149.
Murray, A., Cofie, O. and Drechsel, P. 2011. Efficiency indicators for waste-based business models: Fostering private sector participation in wastewater and faecal-sludge management. Water International 36(4): 505–521.
Muspratt, A. 2016a. Make room for the disruptors: While desperate for innovation, the sanitation sector poses unique structural challenges to startup companies. www.linkedin.com/pulse/make-room-disruptors-while-desperate-innovation-sector-muspratt (accessed 6 Nov. 2017).
Muspratt, A. 2016b. How do we leverage the speed and innovation of small companies in the inherently slow and bureaucratic sanitation sector? www.linkedin.com/pulse/how-do-we-leverage-speed-innovation-small-companies-slow-muspratt? (accessed 6 Nov. 2017).
Organisation for Economic Co-operation and Development (OECD). 2011. Towards green growth: Monitoring progress. Paris: OECD. www.oecd.org/greengrowth/48224574.pdf (accessed 6 Nov. 2017).
Organisation for Economic Co-operation and Development (OECD). 2012. G20/OECD policy note on pension fund financing for green infrastructure and initiatives. Paris: OECD. www.oecd.org/g20/
Copyright Material – Provided by Taylor & Francis
SE
CT
ION
V:
EN
AB
LIN
G E
NV
IRO
NM
EN
T A
ND
FIN
AN
CIN
G
799
topics/energy-environment-green-growth/S3%20G20%20OECD%20Pension%20funds%20for%20green%20infrastructure%20-%20June%202012.pdf (accessed 6 Nov. 2017).
Oliver, P. 2016. Green bonds for cities: A strategic guide for city-level policymakers in developing countries. Climate Policy Initiative. https://climatepolicyinitiative.org/wp-content/uploads/2016/ 12/Green-Bonds-for-Cities-A-Strategic-Guide-for-City-level-Policymakers-in-Developing-Countries.pdf (or https://goo.gl/WwsdYL; accessed 6 Nov. 2017).
Oliver, P., Mazza, F. and Wang, D. 2016. Water financing facility. Global Innovation Lab for Climate Finance. http://climatefinancelab.org/wp-content/uploads/2016/01/160623-Lab-WFF-Report.pdf (accessed 6 Nov. 2017).
Otoo, M., Drechsel, P., Danso, G., Gebrezgabher, S., Rao, K. and Madurangi, G. 2016. Testing the implementation potential of resource recovery and reuse business models: From baseline surveys to feasibility studies and business plans (Resource Recovery and Reuse Series 10). Colombo, Sri Lanka: International Water Management Institute (IWMI); CGIAR Research Program on Water, Land and Ecosystems (WLE).
Platz, D. (2009), Infrastructure finance in developing countries: The potential of sub-sovereign bonds (DESA Working Paper 76). New York: United Nations Organization. www.un.org/esa/desa/papers/2009/wp76_2009.pdf (accessed 6 Nov. 2017).
Trémolet, S. 2011. Identifying the potential for results-based financing for sanitation (WSP Working Paper). World Bank, Water and Sanitation Program (WSP) Scaling Up Rural Sanitation Initiative. Washington, DC: The World Bank.
United Nations Environment Programme (UNEP). 2017. CDM projects by type. www.cdmpipeline.org/cdm-projects-type.htm (accessed 6 Nov. 2017).
Water and Sanitation Program (WSP). 2016. Approaches to capital financing and cost recovery in sewerage schemes implemented in India: Lessons learned and approaches for future schemes. New Delhi: Water and Sanitation Program Guidance Note.
Winpenny, J. 2003. Financing water for all: Report of the World Panel on Financing Water Infrastructure. World Water Council; Global Water Partnership. www.oecd.org/greengrowth/21556665.pdf (accessed 6 Nov. 2017).
World Bank, Ecofys, and Vivid Economics. 2016. State and trends of carbon pricing 2016 (October). Washington, DC: World Bank.
World Bank. 2013. Financing sustainable cities: How we’re helping Africa’s cities raise their credit ratings. Washington, D.C.: World Bank Group. www.worldbank.org/en/news/feature/2013/10/24/financing-sustainable-cities-africa-creditworthy (accessed 6 Nov. 2017).
World Bank. 2015. First pilot auction to capture methane a success. http://www.worldbank.org/en/news/press-release/2015/07/17/first-pilot-auction-to-capture-methane-a-success (accessed 6 Nov. 2017).
World Bank. 2016. Sustainable financing and policy models for municipal composting (Urban Development Series Knowledge Papers 24). Washington, DC: World Bank.
World Bank. 2017. Enabling the business of agriculture 2017. Washington, DC: World Bank. doi:10.1596/ 978-1-4648-1021-3. License: Creative Commons Attribution CC BY 3.0 IGO.
World Health Organization (WHO). 2006a. WHO guidelines for the safe use of wastewater, excreta and greywater (Vol II: Wastewater use in agriculture). Geneva: WHO.
World Health Organization (WHO). 2006b. WHO guidelines for the safe use of wastewater, excreta and greywater (Vol III: Wastewater and excreta use in aquaculture). Geneva: WHO.
World Health Organization (WHO). 2015. Sanitation safety planning manual for safe use and disposal of wastewater, greywater and excreta. Geneva: WHO.
Copyright Material – Provided by Taylor & Francis

SE
CT
ION
V:
EN
AB
LIN
G E
NV
IRO
NM
EN
T A
ND
FIN
AN
CIN
GCHAPTER 19. THE ENABLING ENVIRONMENT AND FINANCE800
Notes1 The authors acknowledge the input of Chris Zurbrügg (SANDEC/EAWAG) and Ashley (Murray) Muspratt (Pivot
Ltd.) in an earlier version of the chapter.2 The views expressed in this document are those of the author, and do not necessarily reflect the views and
policies of the Asian Development Bank (ADB), its Board of Directors, or the Governments they represent.3 http://ec.europa.eu/DocsRoom/documents/19742 (accessed Nov. 4, 2017).4 Figure 277 and 278 are adaptations of an original work by the World Bank. Views and opinions expressed in the
adaptation are the sole responsibility of the authors of the adaptation and are not endorsed by the World Bank.5 www.greenfuture.sg/2015/02/16/2015-guide-to-singapore-government-funding-and-incentives-for-the-
environment (accessed Nov. 4, 2017).6 https://assets.kpmg.com/content/dam/kpmg/pdf/2013/08/kpmg-green-tax-index-2013.pdf (accessed Nov. 4,
2017).
SE
CT
ION
V:
EN
AB
LIN
G E
NV
IRO
NM
EN
T A
ND
FIN
AN
CIN
GCopyright Material – Provided by Taylor & Francis