the energy beneï¬t of stainless steel recycling
TRANSCRIPT
ARTICLE IN PRESS
0301-4215/$ - se
doi:10.1016/j.en
�CorrespondTel.: +144 203
E-mail addr
Please cite thi
Energy Policy ] (]]]]) ]]]–]]]
www.elsevier.com/locate/enpol
The energy benefit of stainless steel recycling
Jeremiah Johnsona,b,�, B.K. Reckb, T. Wangb, T.E. Graedelb
aProgram in Environmental Engineering, Yale University, New Haven, CT, USAbCenter for Industrial Ecology, School of Forestry and Environmental Studies, Yale University, 205 Prospect Street, New Haven, CT 02140, USA
Received 5 December 2006; accepted 21 August 2007
Abstract
The energy used to produce austenitic stainless steel was quantified throughout its entire life cycle for three scenarios: (1) current global
operations, (2) 100% recycling, and (3) use of only virgin materials. Data are representative of global average operations in the early
2000s. The primary energy requirements to produce 1 metric ton of austenitic stainless steel (with assumed metals concentrations of 18%
Cr, 8%Ni, and 74% Fe) is (1) 53GJ, (2) 26GJ, and (3) 79GJ for each scenario, with CO2 releases totaling (1) 3.6 metric tons CO2, (2) 1.6
metric tons CO2, and (3) 5.3 metric tons CO2. Thus, the production of 17 million metric tons of austenitic stainless steel in 2004 used
approximately 9.0� 1017 J of primary energy and released 61 million metric tons of CO2. Current recycling operations reduce energy use
by 33% (4.4� 1017 J) and CO2 emissions by 32% (29 million tons). If austenitic stainless steel were to be produced solely from scrap,
which is currently not possible on a global level due to limited availability, energy use would be 67% less than virgin-based production
and CO2 emissions would be cut by 70%. The calculation of the total energy is most sensitive to the amount and type of scrap fed into the
electric arc furnace, the unit energy of the electric arc furnace, the unit energy of ferrochromium production, and the form of primary
nickel.
r 2007 Elsevier Ltd. All rights reserved.
Keywords: Stainless steel; Energy intensity; Recycling
1. Introduction
Stainless steel, which contains iron, chromium, and oftennickel, molybdenum, and other elements, is an alloy withapplications ranging from household cutlery to reactortanks for the chemical industry. Its anti-corrosion proper-ties are among the main driving forces for the 25 millionmetric tons of production in 2004 (International Chro-mium Development Association, 2006). Ferroalloy pro-duction and the fabrication of stainless steel in electric arcfurnaces are energy-intensive processes. By examining theenergy requirements to produce stainless steel throughoutthe entire life cycle, and isolating the effect of scraprecycling on energy use, one can understand the true energyneeds and opportunities for conservation. The WorldCommission on Environment and Development (1987)
e front matter r 2007 Elsevier Ltd. All rights reserved.
pol.2007.08.028
ing author. 20 Mead Street, Cambridge, MA 02140, USA.
506 9439; fax: +1 44 203 413 6362.
ess: [email protected] (J. Johnson).
s article as: Johnson, J., et al., The energy benefit of stainless
found that a ‘‘low energy path is the best way toward asustainable future’’. Determining the energy intensities ofmaterials (i.e., the energy required per unit mass) underdifferent scenarios aides in understanding and identifyingthis low-energy path.The goals of this study are to quantify the use of energy in
the production of 1 ton of austenitic (i.e., nickel-containing)stainless-steel slab under three scenarios: (1) the base casescenario, ‘‘Current Operations,’’ examines the global averageoperations of the stainless steel and ferroalloy industries inthe early 2000s, (2) the ‘‘Maximum Recycling’’ scenariocalculates the energy used if demand is completely met fromrecycled material, and (3) the ‘‘Virgin Production’’ scenarioexamines stainless-steel production in the absence of scrap. Asystems approach will be employed; the entire life cycle of thematerial (and the associated energy demands of its transfor-mations) from mining and/or scrap recycling throughproduction will be examined. By comparing the results ofthese scenarios, one can quantify the energy that is saved bycurrent recycling practices and the energy that could be saved
steel recycling. Energy Policy (2007), doi:10.1016/j.enpol.2007.08.028
ARTICLE IN PRESSJ. Johnson et al. / Energy Policy ] (]]]]) ]]]–]]]2
if ample scrap were available and recycling rates reached100%. The unit energy demands are also linked to CO2
emission factors, which provide a carbon intensity per unit ofstainless steel produced.
Energy analyses can track use from numerous points ofreference, such as a facility, a process, or a substance. Theutility of energy analyses that focus on substances (such asthis study) includes gaining knowledge of a material’scomprehensive energy requirements, the releases of pollu-tants associated with such energy use, and the energy-related consequences of altering material use patterns.Norgate (2004) reviews the effect of metal recycling on life-cycle performance for a suite of metals and pays particularattention to energy requirements. He finds the gross energyrequirements for the production of stainless steel fromprimary sources to be 75GJ/ton (note: 1GJ ¼ 109 J) whenferronickel is used as the primary nickel feed source and49GJ/ton when nickel metal is used, with ferronickel using59% of the total energy in the former case (Norgate et al.,2004). This latter study also isolated the effects of differentfuel sources for electricity generation.
In an extensive information circular entitled ‘‘EnergyUse Patterns for Metal Recycling’’ released in 1978, Kusikand Kenahan at the US Bureau of Mines, collected data onthe energy requirements for recycling a variety of metals,including aluminum, copper, iron and steel, lead, nickel,stainless steel, tin, titanium, and zinc. Worrell et al. (2001)examined historical trends in iron and steel energy use, andquantified the energy and carbon dioxide benefit ofimplementing 47 energy-efficient technologies to the USenergy sector.
In 2000, Michaelis and Jackson (2000a, b) detailed theenergy flows associated with the iron and steel industries inthe United Kingdom. Mining, iron and steel production,steel good manufacture, steel good use, trade, recycling andscrap, and transportation were considered. Much like thestudy presented here, their study was grounded in amaterial flow analysis approach that determined the massflows of their target substances.
The International Institute for Applied Systems Analysis(IIASA) has created a model called CO2DB, based onenergy chain analysis, which is comparable to life-cycleassessment (Strubegger, 2003). This model contains datafor over 3000 technologies in order to enable the user tolink and assess their technical, economic, and environ-mental characteristics.
Other related research projects include energy require-ments of the Indian steel industry (Bhaktavatsalam andChoudhury, 1995) and its ability for energy conservation(Choudhury and Bhaktavatsalam, 1997), and the energyrequirements and carbon dioxide emissions of the Indianaluminum industry (Das and Kandpal, 2000). On abroader scale, a report for the United Nations Divisionfor Sustainable Development examined the potential forimproved energy and material efficiencies for severalsectors, and identified barriers to implementation andpotential policy instruments (Worrell et al., 1996).
Please cite this article as: Johnson, J., et al., The energy benefit of stainless
2. Methodology
A simplified system boundary diagram, which guidesand bounds this study, was created for the stainless-steelcycle and is shown in Fig. 1a. It includes the majorprocesses associated with the production of primarychromium, nickel, and iron, the preparation of scrap, thesmelting of stainless steel, and the transportation of nineintermediate products. Within each of these major pro-cesses, there are numerous unit operations that utilizeenergy in various forms. Fig. 1b illustrates an example ofenergy use for one of these processes: ferrochromiumproduction. This figure is representative of Outokumpuprocesses and differs from the traditional, Premus, and DCarc technologies, which are also included in this study. Asshown in Fig. 1b, the primary energy requirements ofelectricity generation and the energy used to produceprimary fuels (e.g., coal, petroleum, and natural gas) areincluded in this study’s scope. The functional unit usedherein is the production of 1 metric ton of 304 gradeaustenitic stainless steel, assumed to contain 74% iron,18% chromium, and 8% nickel.To quantify the energy requirements of the entire life
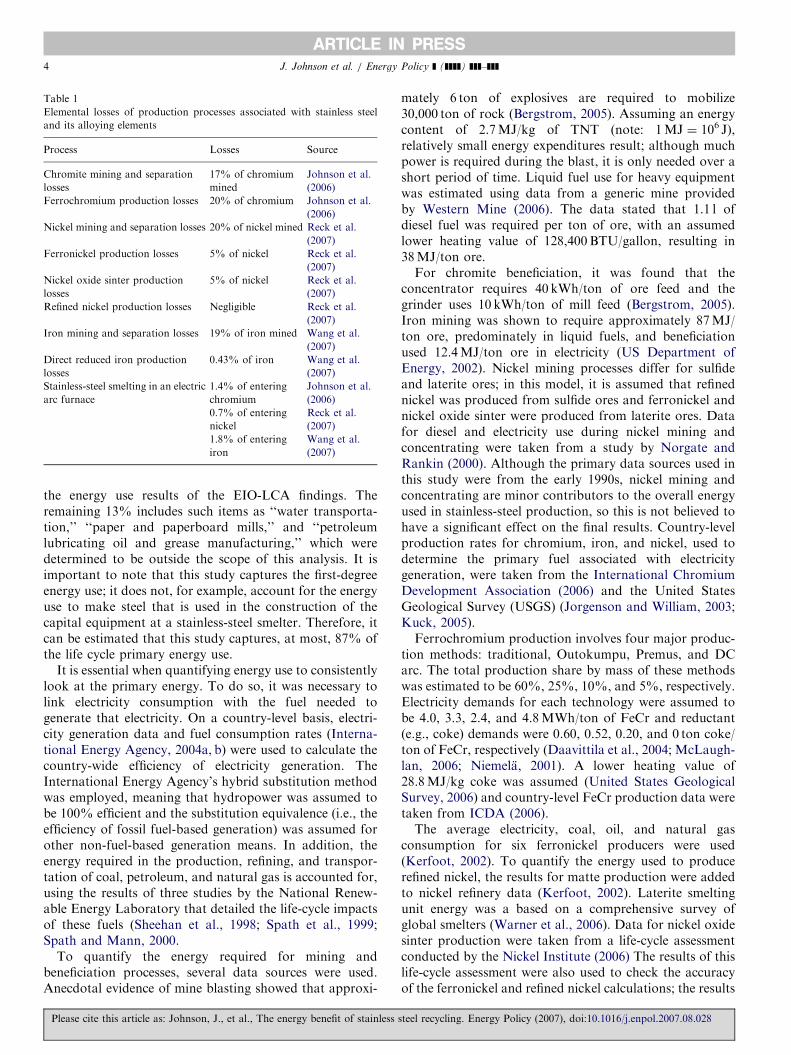
cycle in stainless-steel production, one must thoroughlyunderstand material flows and losses. This project relies onthe findings on three material flow analysis projects,conducted by the Yale Stocks and Flows research staff,for iron (Wang et al., 2007), chromium (Johnson et al.,2006), and nickel (Reck et al., 2007), in which allanthropogenic flows for each element were quantified forapproximately 60 countries. The global elemental loss ratesassociated with each production process are given in Table1. Material flow data are representative of the year 2000and unit energy use data are those that are most recentlyavailable, generally from the early 2000s.Three scenarios were examined: (1) ‘‘Current Opera-
tions’’ assumes a weighted global average of scrap recyclingrates; (2) ‘‘Maximum Recycling’’ assumes that all metalused in stainless-steel production comes from scrap; and(3) ‘‘Virgin Production’’ assumes that all metal used instainless-steel production comes from virgin sources. Thesescenarios differ only in the proportions of primary andsecondary metals used; unit energy for such things astransportation and mining, as well as material loss rates,are held constant and varied only by the amount of massthat passes through each subprocess. Because of limitedscrap availability, Maximum Recycling could not beachieved on a global level. Virgin Production is alsounlikely, due to the preponderance of scrap use in thestainless-steel industry. These two scenarios are intended toshow the outer bounds of material and energy use, servingas a basis for comparing current global performance.For the Current Operations scenario, the average share
of secondary material (i.e., scrap) added to the stainless-steel melt was 42% for chromium, 43% for nickel, and67% for iron. The Maximum Recycling scenario assumestotal recycling (a hypothetical situation on a global level,
steel recycling. Energy Policy (2007), doi:10.1016/j.enpol.2007.08.028

ARTICLE IN PRESS
Fig. 1. (a) System boundary diagram for the stainless-steel life cycle; (b) energy used for the production of ferrochromium, representative of Outokumpu
processes.
J. Johnson et al. / Energy Policy ] (]]]]) ]]]–]]] 3
requiring adequate scrap availability), while the VirginProduction scenario assumes no scrap recycling. The scrapthat is utilized in Current Operations and MaximumRecycling can be prompt scrap (internal to the process),new scrap from industrial processes, or old scrap for post-consumer discards. Any and all of these forms are used tomeet scrap requirements. Although the primary units ofchromium are predominately in the form of ferrochromiumand primary iron is assumed to come from direct reducediron (DRI), primary nickel may come from ferronickel,refined nickel, or nickel oxide sinter. The share of primarynickel used for stainless-steel production was assumedto be 30%, 65%, and 5%, respectively, for each ofthese forms.
Please cite this article as: Johnson, J., et al., The energy benefit of stainless
The indirect (or ‘‘hidden’’) energy use throughout the lifecycle makes a significant contribution to total energy use.To capture as much of this indirect energy use as possible,the following factors were included in the system bound-ary: (1) the energy used in electricity production; (2) theenergy used in the acquisition and production of fuels; and(3) intermediate good transportation by ship, rail, andtruck. There are other indirect energy use factors that, fortractability, were not included in this study. To assess themagnitude of these other factors, economic input–outputlife-cycle assessment (EIO-LCA) was employed. (CarnegieMellon University Green Design Institute, 2007) Thecategories that are included in this study (e.g., ‘‘ferroalloyand related product manufacturing’’) account for 87% of
steel recycling. Energy Policy (2007), doi:10.1016/j.enpol.2007.08.028
ARTICLE IN PRESS
Table 1
Elemental losses of production processes associated with stainless steel
and its alloying elements
Process Losses Source
Chromite mining and separation
losses
17% of chromium
mined
Johnson et al.
(2006)
Ferrochromium production losses 20% of chromium Johnson et al.
(2006)
Nickel mining and separation losses 20% of nickel mined Reck et al.
(2007)
Ferronickel production losses 5% of nickel Reck et al.
(2007)
Nickel oxide sinter production
losses
5% of nickel Reck et al.
(2007)
Refined nickel production losses Negligible Reck et al.
(2007)
Iron mining and separation losses 19% of iron mined Wang et al.
(2007)
Direct reduced iron production
losses
0.43% of iron Wang et al.
(2007)
Stainless-steel smelting in an electric
arc furnace
1.4% of entering
chromium
Johnson et al.
(2006)
0.7% of entering
nickel
Reck et al.
(2007)
1.8% of entering
iron
Wang et al.
(2007)
J. Johnson et al. / Energy Policy ] (]]]]) ]]]–]]]4
the energy use results of the EIO-LCA findings. Theremaining 13% includes such items as ‘‘water transporta-tion,’’ ‘‘paper and paperboard mills,’’ and ‘‘petroleumlubricating oil and grease manufacturing,’’ which weredetermined to be outside the scope of this analysis. It isimportant to note that this study captures the first-degreeenergy use; it does not, for example, account for the energyuse to make steel that is used in the construction of thecapital equipment at a stainless-steel smelter. Therefore, itcan be estimated that this study captures, at most, 87% ofthe life cycle primary energy use.
It is essential when quantifying energy use to consistentlylook at the primary energy. To do so, it was necessary tolink electricity consumption with the fuel needed togenerate that electricity. On a country-level basis, electri-city generation data and fuel consumption rates (Interna-tional Energy Agency, 2004a, b) were used to calculate thecountry-wide efficiency of electricity generation. TheInternational Energy Agency’s hybrid substitution methodwas employed, meaning that hydropower was assumed tobe 100% efficient and the substitution equivalence (i.e., theefficiency of fossil fuel-based generation) was assumed forother non-fuel-based generation means. In addition, theenergy required in the production, refining, and transpor-tation of coal, petroleum, and natural gas is accounted for,using the results of three studies by the National Renew-able Energy Laboratory that detailed the life-cycle impactsof these fuels (Sheehan et al., 1998; Spath et al., 1999;Spath and Mann, 2000.
To quantify the energy required for mining andbeneficiation processes, several data sources were used.Anecdotal evidence of mine blasting showed that approxi-
Please cite this article as: Johnson, J., et al., The energy benefit of stainless
mately 6 ton of explosives are required to mobilize30,000 ton of rock (Bergstrom, 2005). Assuming an energycontent of 2.7MJ/kg of TNT (note: 1MJ ¼ 106 J),relatively small energy expenditures result; although muchpower is required during the blast, it is only needed over ashort period of time. Liquid fuel use for heavy equipmentwas estimated using data from a generic mine providedby Western Mine (2006). The data stated that 1.1 l ofdiesel fuel was required per ton of ore, with an assumedlower heating value of 128,400BTU/gallon, resulting in38MJ/ton ore.For chromite beneficiation, it was found that the
concentrator requires 40 kWh/ton of ore feed and thegrinder uses 10 kWh/ton of mill feed (Bergstrom, 2005).Iron mining was shown to require approximately 87MJ/ton ore, predominately in liquid fuels, and beneficiationused 12.4MJ/ton ore in electricity (US Department ofEnergy, 2002). Nickel mining processes differ for sulfideand laterite ores; in this model, it is assumed that refinednickel was produced from sulfide ores and ferronickel andnickel oxide sinter were produced from laterite ores. Datafor diesel and electricity use during nickel mining andconcentrating were taken from a study by Norgate andRankin (2000). Although the primary data sources used inthis study were from the early 1990s, nickel mining andconcentrating are minor contributors to the overall energyused in stainless-steel production, so this is not believed tohave a significant effect on the final results. Country-levelproduction rates for chromium, iron, and nickel, used todetermine the primary fuel associated with electricitygeneration, were taken from the International ChromiumDevelopment Association (2006) and the United StatesGeological Survey (USGS) (Jorgenson and William, 2003;Kuck, 2005).Ferrochromium production involves four major produc-
tion methods: traditional, Outokumpu, Premus, and DCarc. The total production share by mass of these methodswas estimated to be 60%, 25%, 10%, and 5%, respectively.Electricity demands for each technology were assumed tobe 4.0, 3.3, 2.4, and 4.8MWh/ton of FeCr and reductant(e.g., coke) demands were 0.60, 0.52, 0.20, and 0 ton coke/ton of FeCr, respectively (Daavittila et al., 2004; McLaugh-lan, 2006; Niemela, 2001). A lower heating value of28.8MJ/kg coke was assumed (United States GeologicalSurvey, 2006) and country-level FeCr production data weretaken from ICDA (2006).The average electricity, coal, oil, and natural gas
consumption for six ferronickel producers were used(Kerfoot, 2002). To quantify the energy used to producerefined nickel, the results for matte production were addedto nickel refinery data (Kerfoot, 2002). Laterite smeltingunit energy was a based on a comprehensive survey ofglobal smelters (Warner et al., 2006). Data for nickel oxidesinter production were taken from a life-cycle assessmentconducted by the Nickel Institute (2006) The results of thislife-cycle assessment were also used to check the accuracyof the ferronickel and refined nickel calculations; the results
steel recycling. Energy Policy (2007), doi:10.1016/j.enpol.2007.08.028
ARTICLE IN PRESSJ. Johnson et al. / Energy Policy ] (]]]]) ]]]–]]] 5
of this study were close for ferronickel and significantlylower for refined nickel. Country-level production datawere obtained from the International Nickel Study Group(2004).
The energy required to produce DRI was estimated fromseven production methods. Based on a weighted average ofeach method’s global plant capacity, the average reductantand electricity use were determined to be 11.3GJ of naturalgas/ton DRI and 99 kWh/ton DRI, respectively (Oeterset al., 2006). Country-level production was taken from theInternational Iron and Steel Institute (2005).
Data for stainless-steel electric arc furnaces were takenfrom Outokumpu (2006), who detailed use of electricitypropane, carbon monoxide, natural gas, and fuel oil.Country-level stainless-steel production was taken fromICDA (2006). Scrap is processed and prepared usingpresses, shears, bundlers, cutting, and crushing, with mostof the energy being used in the form of electricity. Ananalysis of six scrap-processing facilities yielded an averageelectricity consumption of 6.8 kWh/ton scrap.
The energy requirements for transportation of allintermediate goods were also quantified. Matrices werecreated that detailed the mass of each intermediate good bythe exporting country and the importing country, includingchromite ore and concentrate (International ChromiumDevelopment Association, 2006), ferrochromium (Interna-tional Chromium Development Association, 2006),blended and concentrated nickel ore (International NickelStudy Group, 2004), ferronickel (Kuck, 2005), refinednickel (International Nickel Study Group, 2004), nickeloxide sinter (International Nickel Study Group, 2004), ironore and concentrate (United Nations Comtrade Database,2006) and DRI (United Nations Comtrade Database,2006). While there is certainly the potential for hundreds ofcountry-to-country exchanges, it was found that 95% ofthe traded mass could be accounted for by less than 50exchanges per material. By assuming trade routes andmeans of transfer, the distances between the exporters andthe importers were used to create an average distancetraveled by each transport method. The collection andtransportation of scrap is difficult to estimate with highcertainty due to the high variability of transportationdistances and the lack of detailed trade data. Discussionswith experts in the scrap industry and internal calculationsbased on the distances between major scrap-generatingareas, collection areas, and stainless-steel smelters havelead to travel estimates of approximately 180 miles bytruck, 160 miles by rail, and 2100 miles by ship. Using EIAenergy intensities (US Department of Energy, 2006), theenergy consumed per ton-mile was applied and the energyuse was calculated. (Note: the transportation of fabricatedstainless steel is not included in this study; the end goal ofthis study is to calculate the energy requirements toproduce 1 ton of stainless-steel slab and that is where thesystem boundary ends.)
The results of mining, alloy production, scrap prepara-tion, stainless-steel smelting, and transportation of inter-
Please cite this article as: Johnson, J., et al., The energy benefit of stainless
mediates were aggregated to determine the total primaryenergy used to produce 1 ton of austenitic stainless steel.These results were then coupled with CO2 emission factors(Energy Information Administration, 2006), which includelinking country-level electricity generation data to emis-sions by source.There are many inputs to this model and all values
contain a degree of uncertainty. In order to assess thisuncertainty and variability, a Monte Carlo analysis wasperformed. A probabilistic method, such as a Monte Carloanalysis, provides more information than deterministicmodels, giving a range of results linked to their likelihood(McCleese and LaPuma, 2002). For each of the variables,including energy demands, material losses, transportationdistances, scrap concentrations, and metal sourcing, anestimate was made of the uncertainty of the data. Theseestimates were based on data variability and assumedconfidence in their accuracy, with normal distributionsaround the weighted mean applied. Dependant variableswere linked and 400 simulations were then run for eachscenario to determine the range and distribution of theresults.The model’s sensitivity to changes in each of these
variables is also important. Forty-three of the variablesincluded in the analysis were increased by 25% to examinethe effect on the total primary energy of the CurrentOperations scenario.
3. Results
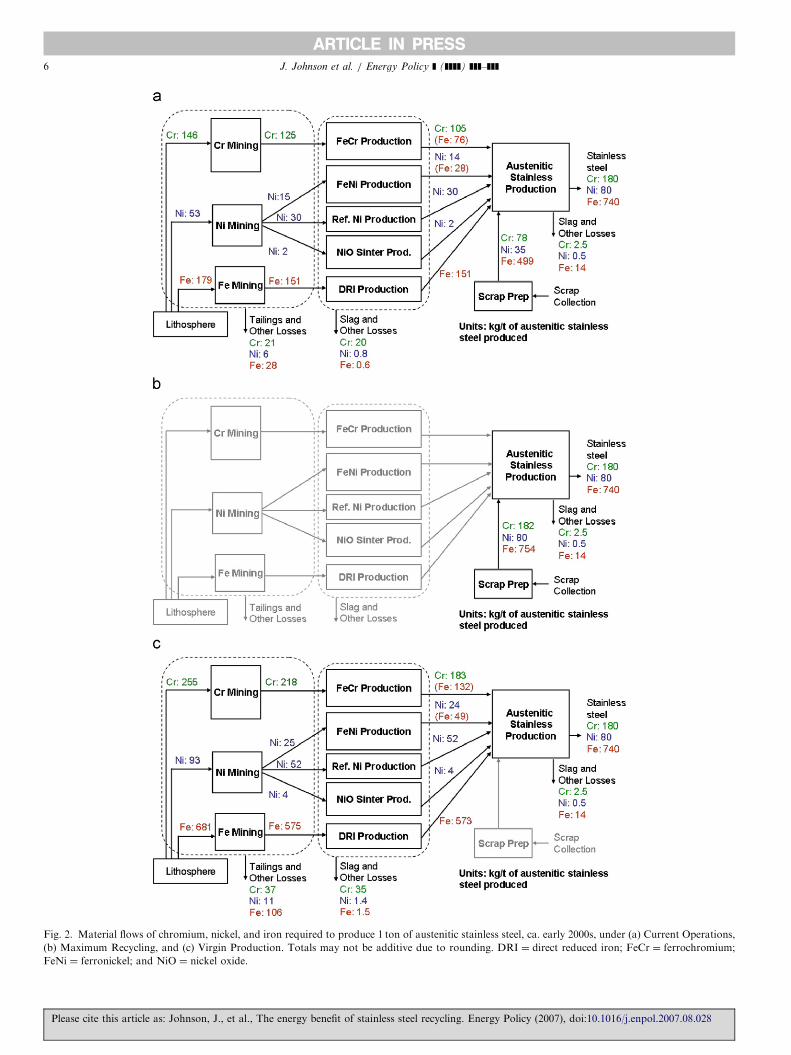
The energy used at each production process is under-pinned by the amount of material that is required. Fig. 2details the material flows of chromium, nickel, and iron inthe production of 1 ton of austenitic stainless steel undereach of the three scenarios. The material flows shown in thefigures represent the contained mass of the elements in eachflow. For example, the flow into chromium mining forCurrent Operations (Fig. 2a) is 146 kg of containedchromium in ore; the total mass of the chromite ore isestimated to be 490 kg, a value that is not shown in thisfigure. It should also be noted that the iron contained inferrochromium and ferronickel was not quantified forstages prior to alloy production (i.e., during the miningprocesses for chromium and nickel) and, therefore, is notshown in the figure.In order to achieve material balance for each of
the elements, the amount of austenitic, ferritic, andcarbon steel scrap that is recycled has to correspond withrecycling rates and material loss flows. In Fig. 2a, thisconstraint meant that only austenitic stainless-steel scrapand carbon steel scrap were included, so as to not have anoverabundance of secondary chromium units that wouldhave come with ferritic stainless-steel scrap recycling.Because it is known that ferritic scrap is included in actualproduction, this is a limitation of the material flow dataand could be updated to improve the accuracy of thisstudy.
steel recycling. Energy Policy (2007), doi:10.1016/j.enpol.2007.08.028
ARTICLE IN PRESS
Fig. 2. Material flows of chromium, nickel, and iron required to produce 1 ton of austenitic stainless steel, ca. early 2000s, under (a) Current Operations,
(b) Maximum Recycling, and (c) Virgin Production. Totals may not be additive due to rounding. DRI ¼ direct reduced iron; FeCr ¼ ferrochromium;
FeNi ¼ ferronickel; and NiO ¼ nickel oxide.
J. Johnson et al. / Energy Policy ] (]]]]) ]]]–]]]6
Please cite this article as: Johnson, J., et al., The energy benefit of stainless steel recycling. Energy Policy (2007), doi:10.1016/j.enpol.2007.08.028
ARTICLE IN PRESSJ. Johnson et al. / Energy Policy ] (]]]]) ]]]–]]] 7
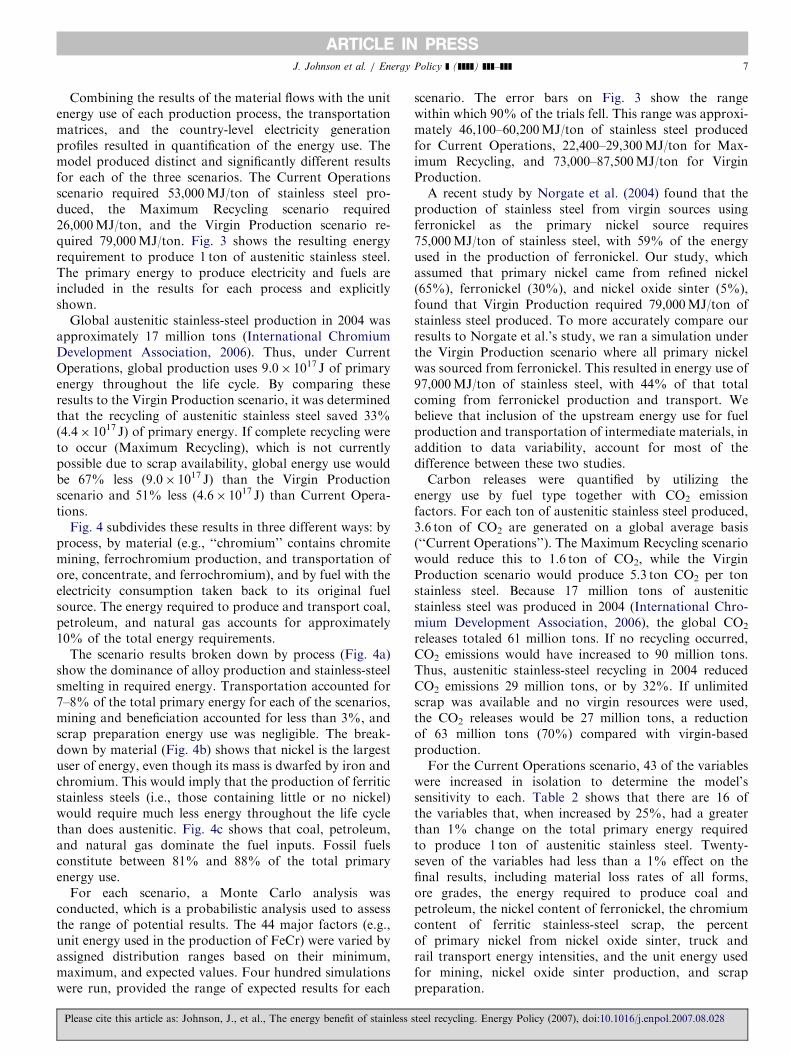
Combining the results of the material flows with the unitenergy use of each production process, the transportationmatrices, and the country-level electricity generationprofiles resulted in quantification of the energy use. Themodel produced distinct and significantly different resultsfor each of the three scenarios. The Current Operationsscenario required 53,000MJ/ton of stainless steel pro-duced, the Maximum Recycling scenario required26,000MJ/ton, and the Virgin Production scenario re-quired 79,000MJ/ton. Fig. 3 shows the resulting energyrequirement to produce 1 ton of austenitic stainless steel.The primary energy to produce electricity and fuels areincluded in the results for each process and explicitlyshown.
Global austenitic stainless-steel production in 2004 wasapproximately 17 million tons (International ChromiumDevelopment Association, 2006). Thus, under CurrentOperations, global production uses 9.0� 1017 J of primaryenergy throughout the life cycle. By comparing theseresults to the Virgin Production scenario, it was determinedthat the recycling of austenitic stainless steel saved 33%(4.4� 1017 J) of primary energy. If complete recycling wereto occur (Maximum Recycling), which is not currentlypossible due to scrap availability, global energy use wouldbe 67% less (9.0� 1017 J) than the Virgin Productionscenario and 51% less (4.6� 1017 J) than Current Opera-tions.
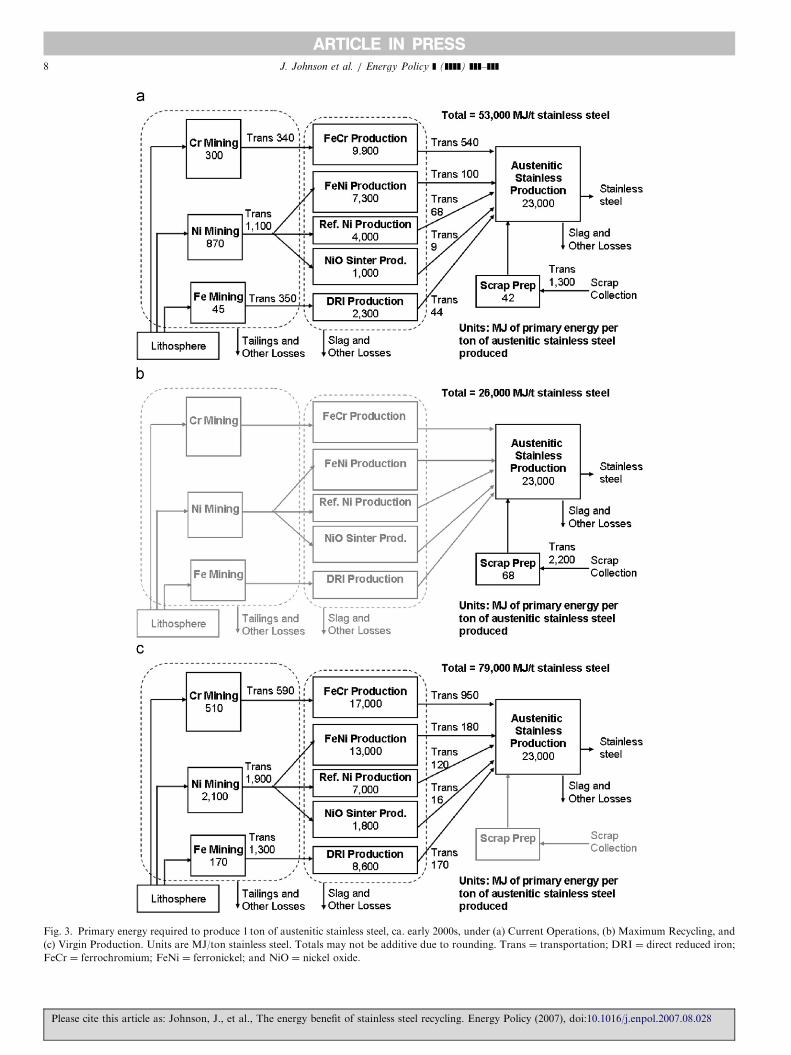
Fig. 4 subdivides these results in three different ways: byprocess, by material (e.g., ‘‘chromium’’ contains chromitemining, ferrochromium production, and transportation ofore, concentrate, and ferrochromium), and by fuel with theelectricity consumption taken back to its original fuelsource. The energy required to produce and transport coal,petroleum, and natural gas accounts for approximately10% of the total energy requirements.
The scenario results broken down by process (Fig. 4a)show the dominance of alloy production and stainless-steelsmelting in required energy. Transportation accounted for7–8% of the total primary energy for each of the scenarios,mining and beneficiation accounted for less than 3%, andscrap preparation energy use was negligible. The break-down by material (Fig. 4b) shows that nickel is the largestuser of energy, even though its mass is dwarfed by iron andchromium. This would imply that the production of ferriticstainless steels (i.e., those containing little or no nickel)would require much less energy throughout the life cyclethan does austenitic. Fig. 4c shows that coal, petroleum,and natural gas dominate the fuel inputs. Fossil fuelsconstitute between 81% and 88% of the total primaryenergy use.
For each scenario, a Monte Carlo analysis wasconducted, which is a probabilistic analysis used to assessthe range of potential results. The 44 major factors (e.g.,unit energy used in the production of FeCr) were varied byassigned distribution ranges based on their minimum,maximum, and expected values. Four hundred simulationswere run, provided the range of expected results for each
Please cite this article as: Johnson, J., et al., The energy benefit of stainless
scenario. The error bars on Fig. 3 show the rangewithin which 90% of the trials fell. This range was approxi-mately 46,100–60,200MJ/ton of stainless steel producedfor Current Operations, 22,400–29,300MJ/ton for Max-imum Recycling, and 73,000–87,500MJ/ton for VirginProduction.A recent study by Norgate et al. (2004) found that the
production of stainless steel from virgin sources usingferronickel as the primary nickel source requires75,000MJ/ton of stainless steel, with 59% of the energyused in the production of ferronickel. Our study, whichassumed that primary nickel came from refined nickel(65%), ferronickel (30%), and nickel oxide sinter (5%),found that Virgin Production required 79,000MJ/ton ofstainless steel produced. To more accurately compare ourresults to Norgate et al.’s study, we ran a simulation underthe Virgin Production scenario where all primary nickelwas sourced from ferronickel. This resulted in energy use of97,000MJ/ton of stainless steel, with 44% of that totalcoming from ferronickel production and transport. Webelieve that inclusion of the upstream energy use for fuelproduction and transportation of intermediate materials, inaddition to data variability, account for most of thedifference between these two studies.Carbon releases were quantified by utilizing the
energy use by fuel type together with CO2 emissionfactors. For each ton of austenitic stainless steel produced,3.6 ton of CO2 are generated on a global average basis(‘‘Current Operations’’). The Maximum Recycling scenariowould reduce this to 1.6 ton of CO2, while the VirginProduction scenario would produce 5.3 ton CO2 per tonstainless steel. Because 17 million tons of austeniticstainless steel was produced in 2004 (International Chro-mium Development Association, 2006), the global CO2
releases totaled 61 million tons. If no recycling occurred,CO2 emissions would have increased to 90 million tons.Thus, austenitic stainless-steel recycling in 2004 reducedCO2 emissions 29 million tons, or by 32%. If unlimitedscrap was available and no virgin resources were used,the CO2 releases would be 27 million tons, a reductionof 63 million tons (70%) compared with virgin-basedproduction.For the Current Operations scenario, 43 of the variables
were increased in isolation to determine the model’ssensitivity to each. Table 2 shows that there are 16 ofthe variables that, when increased by 25%, had a greaterthan 1% change on the total primary energy requiredto produce 1 ton of austenitic stainless steel. Twenty-seven of the variables had less than a 1% effect on thefinal results, including material loss rates of all forms,ore grades, the energy required to produce coal andpetroleum, the nickel content of ferronickel, the chromiumcontent of ferritic stainless-steel scrap, the percentof primary nickel from nickel oxide sinter, truck andrail transport energy intensities, and the unit energy usedfor mining, nickel oxide sinter production, and scrappreparation.
steel recycling. Energy Policy (2007), doi:10.1016/j.enpol.2007.08.028
ARTICLE IN PRESS
Fig. 3. Primary energy required to produce 1 ton of austenitic stainless steel, ca. early 2000s, under (a) Current Operations, (b) Maximum Recycling, and
(c) Virgin Production. Units are MJ/ton stainless steel. Totals may not be additive due to rounding. Trans ¼ transportation; DRI ¼ direct reduced iron;
FeCr ¼ ferrochromium; FeNi ¼ ferronickel; and NiO ¼ nickel oxide.
J. Johnson et al. / Energy Policy ] (]]]]) ]]]–]]]8
Please cite this article as: Johnson, J., et al., The energy benefit of stainless steel recycling. Energy Policy (2007), doi:10.1016/j.enpol.2007.08.028
ARTICLE IN PRESS
Fig. 4. Energy required to produce 1 ton of austenitic stainless steel throughout its entire life cycle for three scenarios, subdivided by (a) process, (b)
material, and (c) fuel. The error bars represent the range in which 90% of the trials in the Monte Carlo analysis fell.
J. Johnson et al. / Energy Policy ] (]]]]) ]]]–]]] 9
The most sensitive variables include those related to theamount and type of scrap fed into the electric arc furnace,the unit energy of the electric arc furnace, ferrochromiumand ferronickel production, the form of primary nickel,and the nickel and chromium contents of austeniticstainless-steel scrap.
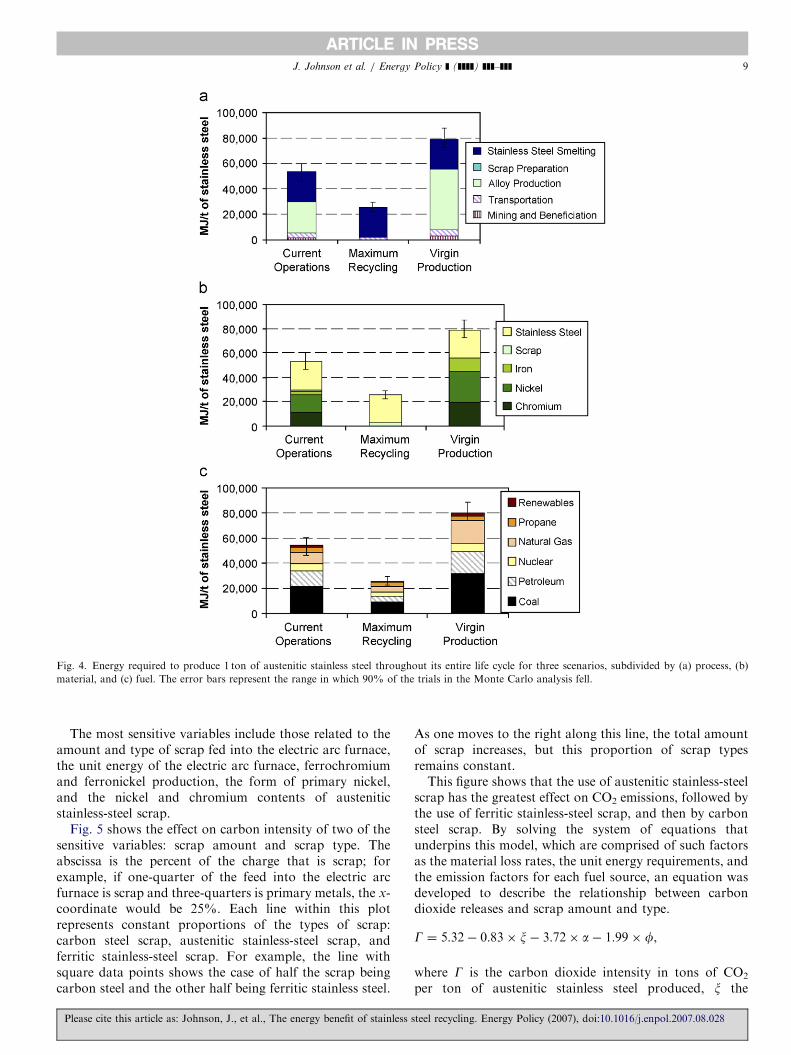
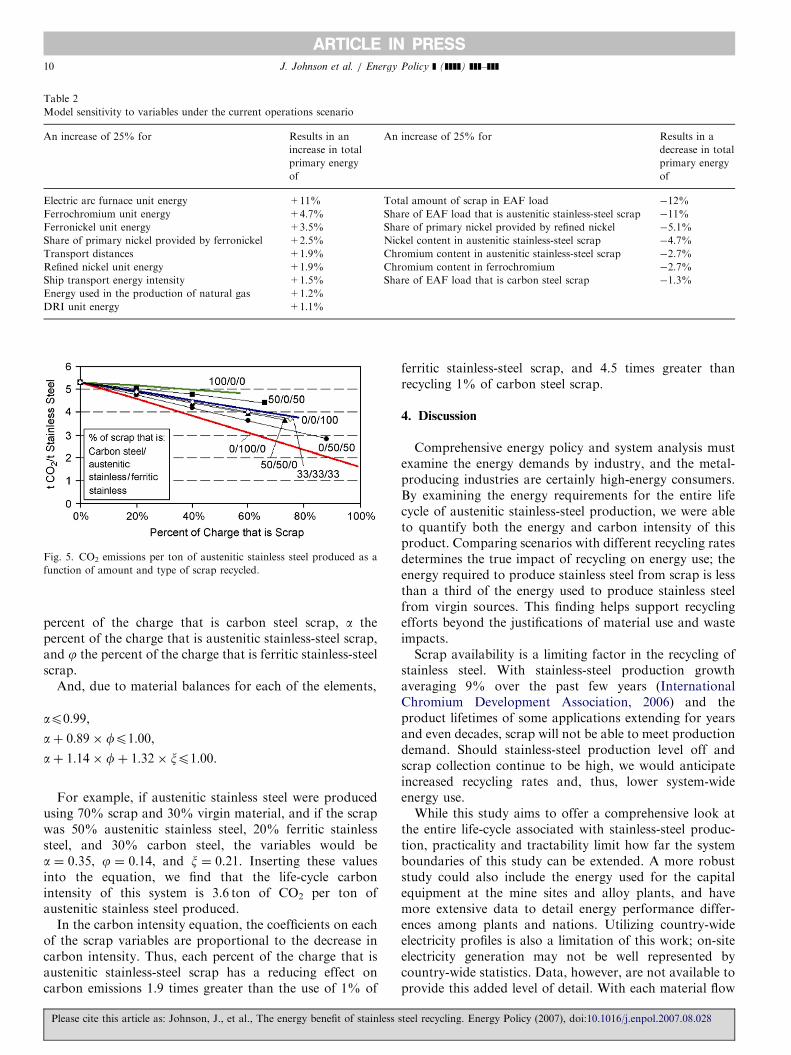
Fig. 5 shows the effect on carbon intensity of two of thesensitive variables: scrap amount and scrap type. Theabscissa is the percent of the charge that is scrap; forexample, if one-quarter of the feed into the electric arcfurnace is scrap and three-quarters is primary metals, the x-coordinate would be 25%. Each line within this plotrepresents constant proportions of the types of scrap:carbon steel scrap, austenitic stainless-steel scrap, andferritic stainless-steel scrap. For example, the line withsquare data points shows the case of half the scrap beingcarbon steel and the other half being ferritic stainless steel.
Please cite this article as: Johnson, J., et al., The energy benefit of stainless
As one moves to the right along this line, the total amountof scrap increases, but this proportion of scrap typesremains constant.This figure shows that the use of austenitic stainless-steel
scrap has the greatest effect on CO2 emissions, followed bythe use of ferritic stainless-steel scrap, and then by carbonsteel scrap. By solving the system of equations thatunderpins this model, which are comprised of such factorsas the material loss rates, the unit energy requirements, andthe emission factors for each fuel source, an equation wasdeveloped to describe the relationship between carbondioxide releases and scrap amount and type.
G ¼ 5:32� 0:83� x� 3:72� a� 1:99� f,
where G is the carbon dioxide intensity in tons of CO2
per ton of austenitic stainless steel produced, x the
steel recycling. Energy Policy (2007), doi:10.1016/j.enpol.2007.08.028
ARTICLE IN PRESS
Fig. 5. CO2 emissions per ton of austenitic stainless steel produced as a
function of amount and type of scrap recycled.
Table 2
Model sensitivity to variables under the current operations scenario
An increase of 25% for Results in an
increase in total
primary energy
of
An increase of 25% for Results in a
decrease in total
primary energy
of
Electric arc furnace unit energy +11% Total amount of scrap in EAF load �12%
Ferrochromium unit energy +4.7% Share of EAF load that is austenitic stainless-steel scrap �11%
Ferronickel unit energy +3.5% Share of primary nickel provided by refined nickel �5.1%
Share of primary nickel provided by ferronickel +2.5% Nickel content in austenitic stainless-steel scrap �4.7%
Transport distances +1.9% Chromium content in austenitic stainless-steel scrap �2.7%
Refined nickel unit energy +1.9% Chromium content in ferrochromium �2.7%
Ship transport energy intensity +1.5% Share of EAF load that is carbon steel scrap �1.3%
Energy used in the production of natural gas +1.2%
DRI unit energy +1.1%
J. Johnson et al. / Energy Policy ] (]]]]) ]]]–]]]10
percent of the charge that is carbon steel scrap, a thepercent of the charge that is austenitic stainless-steel scrap,and j the percent of the charge that is ferritic stainless-steelscrap.
And, due to material balances for each of the elements,
ap0:99,
aþ 0:89� fp1:00,
aþ 1:14� fþ 1:32� xp1:00.
For example, if austenitic stainless steel were producedusing 70% scrap and 30% virgin material, and if the scrapwas 50% austenitic stainless steel, 20% ferritic stainlesssteel, and 30% carbon steel, the variables would bea ¼ 0.35, j ¼ 0.14, and x ¼ 0.21. Inserting these valuesinto the equation, we find that the life-cycle carbonintensity of this system is 3.6 ton of CO2 per ton ofaustenitic stainless steel produced.
In the carbon intensity equation, the coefficients on eachof the scrap variables are proportional to the decrease incarbon intensity. Thus, each percent of the charge that isaustenitic stainless-steel scrap has a reducing effect oncarbon emissions 1.9 times greater than the use of 1% of
Please cite this article as: Johnson, J., et al., The energy benefit of stainless
ferritic stainless-steel scrap, and 4.5 times greater thanrecycling 1% of carbon steel scrap.
4. Discussion
Comprehensive energy policy and system analysis mustexamine the energy demands by industry, and the metal-producing industries are certainly high-energy consumers.By examining the energy requirements for the entire lifecycle of austenitic stainless-steel production, we were ableto quantify both the energy and carbon intensity of thisproduct. Comparing scenarios with different recycling ratesdetermines the true impact of recycling on energy use; theenergy required to produce stainless steel from scrap is lessthan a third of the energy used to produce stainless steelfrom virgin sources. This finding helps support recyclingefforts beyond the justifications of material use and wasteimpacts.Scrap availability is a limiting factor in the recycling of
stainless steel. With stainless-steel production growthaveraging 9% over the past few years (InternationalChromium Development Association, 2006) and theproduct lifetimes of some applications extending for yearsand even decades, scrap will not be able to meet productiondemand. Should stainless-steel production level off andscrap collection continue to be high, we would anticipateincreased recycling rates and, thus, lower system-wideenergy use.While this study aims to offer a comprehensive look at
the entire life-cycle associated with stainless-steel produc-tion, practicality and tractability limit how far the systemboundaries of this study can be extended. A more robuststudy could also include the energy used for the capitalequipment at the mine sites and alloy plants, and havemore extensive data to detail energy performance differ-ences among plants and nations. Utilizing country-wideelectricity profiles is also a limitation of this work; on-siteelectricity generation may not be well represented bycountry-wide statistics. Data, however, are not available toprovide this added level of detail. With each material flow
steel recycling. Energy Policy (2007), doi:10.1016/j.enpol.2007.08.028
ARTICLE IN PRESSJ. Johnson et al. / Energy Policy ] (]]]]) ]]]–]]] 11
and unit energy factor, there is a degree of uncertainty.Through the Monte Carlo analysis and the uncertaintyanalysis, we determined the factors that had the mostinfluence on the final results (e.g., the amount and type ofscrap, the form of primary nickel) and those that had theleast influence on the final results (e.g., material loss rates,ore grades).
The methodology employed in this study is readilytransferable to other metals. Generating such results for awide suite of metals would allow broader analysis of theenergy impacts of the mining and metallurgy industries, aswell as allowing for cross-metal comparisons; the energyeffect of metals substitution could then be assessed. Inaddition, countries that import a significant share of theirrefined metals could analyze the effect of outsourcing suchproduction based on energy and carbon impact, allowingfor such factors to inform greenhouse gas mitigationpolicies.
Acknowledgements
This material is based upon work supported by theNickel Institute and the US National Science Foundationunder Grant nos. BES-9818788 and BES-0329470. Theauthors would also like to acknowledge Friedrich Teroerdeof ELG Haniel Metals Ltd. and the members of theInternational Stainless Steel Forum’s TEAM STAINLESSfor continued insight and assistance.
References
Bergstrom, R., 2005. Personal communication, Outokumpu Oy.
Bhaktavatsalam, A.K., Choudhury, R., 1995. Specific energy consump-
tion in the steel industry. Energy 20, 1247–1250.
Carnegie Mellon Green Design Institute, 2007 /www.eiolca.netS,
accessed March 2007.
Choudhury, R., Bhaktavatsalam, A.K., 1997. Energy inefficiency of
Indian steel industry—scope for energy conservation. Energy Conver-
sion and Management 38, 167–171.
Daavittila, J., Honkaniemi, M., Jokinen, P., 2004. The transformations of
ferrochromium smelting technologies during the last decades. In:
Proceedings of the 10th International Ferro Alloys Congress.
Das, A., Kandpal, T.C., 2000. Analysis of energy demand and CO2
emissions for the Indian aluminum industry using a dynamic
programming model. International Journal of Energy Research 24,
51–59.
Energy Information Administration, 2006. Fuel and Energy Source Codes
and Emission Coefficients /http://www.eia.doe.gov/oiaf/1605/factors.
htmlS, last accessed June 2006.
International Chromium Development Association, 2006. Statistical
Bulletin. Paris, France.
International Energy Agency, 2004a. Energy Balances of Non-OECD
Countries: 2001–2002. Paris, France.
International Energy Agency, 2004b. Energy Balances of OECD
Countries, 2001–2002. Paris, France.
International Iron and Steel Institute, 2005. Steel Statistical Yearbook.
Brussels, Belgium.
International Nickel Study Group, 2004. World Nickel Statistics, The
Hague, The Netherlands.
Johnson, J., Schewel, L., Graedel, T.E., 2006. The contemporary
anthropogenic chromium cycle. Environmental Science & Technology
40, 7060–7069.
Please cite this article as: Johnson, J., et al., The energy benefit of stainless
Jorgenson, J.D., William, S.K., 2003. Iron ore. In: USGS Minerals
Yearbook 2003. United States Geological Survey (USGS), Reston,
VA.
Kerfoot, D.G.E., 2002. Nickel. In: Ullmann’s Encyclopedia of Industrial
Chemistry. Wiley-VCH Verlag GmbH & Co., KGaA, Weinheim.
Kuck, P., 2005. United States Geological Survey Minerals Yearbook—
Nickel. Reston, VA.
Kusik, C., Kenahan, C., 1978. Information Circular 8781: Energy Use
Patterns for Metal Recycling. United States Bureau of Mines,
Washington, DC.
McCleese, D.L., LaPuma, P.T., 2002. Using Monte Carlo simulation in
life cycle assessment for electric and internal combustion vehicles.
International Journal of Life Cycle Assessment 7, 230–236.
McLaughlan, J., 2006. Challenges Facing the South African Ferrochrome
Industry, CHROMIUM 2006, Cape Town, South Africa.
Michaelis, P., Jackson, T., 2000a. Material and energy flow through the
UK Iron and Steel Sector—Part 2: 1994–2019. Resources Conserva-
tion and Recycling 29, 209–230.
Michaelis, P., Jackson, T., 2000b. Material and energy flow through the
UK Iron and Steel Sector. Part 1: 1954–1994. Resources Conservation
and Recycling 29, 131–156.
Nickel Institute, 2006. Life Cycle Assessment /http://www.nickelinstitute.
org/index.cfm/ci_id/114/la_id/1.htmS, last accessed September 20,
2006.
Niemela, P., 2001. CO2 Emissions in Production of Ferrochromium.
Outokumpu Oy, Tornio, Finland.
Norgate, T.E., 2004. Metal Recycling: An Assessment Using Life Cycle
Energy Consumption as a Sustainability Indicator. CSIRO Minerals,
DMR-2616, Victoria, Australia.
Norgate, T.E., Rankin, W.J., 2000. Life cycle assessment of copper and
nickel production. In: Minprex 2000, International Conference on
Minerals Processing and Extractive Metallurgy.
Norgate, T.E., Jahanshahi, S., Rankin, W.J., 2004. Alternative routes to
stainless steel a life cycle approach. In: Tenth International Ferroalloys
Congress, Cape Town, South Africa.
Oeters, F., Ottow, M., Meiler, H., Lungen, H.B., Koltermann, M., Buhr,
A., Yagi, J.-I., Formanek, L., Rose, F., Flickenschild, J., Hauk, R.,
Steffen, R., Skroch, R., Mayer-Schwinning, G., Bunnagel, H.-L., Hoff,
H.-G., 2006. Iron. In: Ullmann’s Encyclopedia of Industrial Chem-
istry. Wiley-VCH Verlag GmbH & Co., KGaA, Weinheim.
Outokumpu, 2006. Outokumpu and the Environment /http://www.
outokumpu.com/33954.epibrwS, last accessed September 5, 2006.
Reck, B., Muller, D.B., Rostkowski, K., Graedel, T.E., 2007. The
anthropogenic nickel cycle: insights into use, trade, and recycling.
Environmental Science & Technology, in review.
Sheehan, J., Camobreco, V., Duffield, J., Graboski, M., Shapouri, H.,
1998. Life Cycle Inventory of Biodiesel and Petroleum Diesel for Use
in an Urban Bus. National Renewable Energy Laboratory.
Spath, P.L., Mann, M.K., 2000. Life Cycle Assessment of a Natural Gas
Combined-Cycle Power Generating System. National Renewable
Energy Laboratory.
Spath, P.L., Mann, M.K., Kerr, D.R., 1999. Life Cycle Assessment of
Coal-Fired Power Production. National Renewable Energy Labora-
tory.
Strubegger, M., 2003. Co2db Software: Carbon Dioxide (Technology)
Database. Version 3.0. International Institute for Applied Systems
Analysis, Laxenburg, Austria.
US Department of Energy, 2002. Energy and Environmental Profile of the
US Mining Industry. Office of Energy Efficiency and Renewable
Energy, Washington, DC.
United Nations Comtrade Database, 2006 /http://unstats.un.org/unsd/
comtrade/S, last accessed June 2006.
United States Department of Energy, 2006. Indicators of Energy Intensity
in the United States /http://intensityindicators.pnl.gov/total_
transportation.stmS, last accessed June 2006.
United States Geological Survey, 2006. Energy Resources Program
/http://energy.usgs.gov/glossary.htmlS, last accessed September 5,
2006.
steel recycling. Energy Policy (2007), doi:10.1016/j.enpol.2007.08.028

ARTICLE IN PRESSJ. Johnson et al. / Energy Policy ] (]]]]) ]]]–]]]12
Wang, T., Muller, D., Graedel, T.E., 2007. Forging the anthro-
pogenic iron cycle. Environmental Science & Technology 41,
5120–5129.
Warner, A.E.M., Diaz, C.M., Dalvi, A.D., Mackey, P.J., Tarasov, A.V.,
2006. JOM World Nonferrous Smelter Survey, Part III: Nickel:
Laterite. JOM, April 2006, pp. 11–20.
Western Mine, 2006 /http://www.westernmine.comS, last accessed June
10, 2006.
Please cite this article as: Johnson, J., et al., The energy benefit of stainless
World Commission on Environment and Development, 1987. Our
Common Future. Oxford University Press, Oxford, UK.
Worrell, E., Levine, M., Price, L., Martin, N., 1996. Potentials and policy
implications of energy and material efficiency improvement. A Report
to the United Nations, Division for Sustainable Development.
Worrell, E., Price, L., Martin, N., 2001. Energy efficiency and carbon
dioxide emissions reduction opportunities in the US Iron and Steel
Sector. Energy 26, 513–536.
steel recycling. Energy Policy (2007), doi:10.1016/j.enpol.2007.08.028